Cohort, age and business cycle effects in entrepreneurship ...
24
Cohort, age and business cycle effects in entrepreneurship in Latin America Bukstein, Daniel Universidad ORT Uruguay Gandelman, Néstor Universidad ORT Uruguay * Mayo 2016 Abstract This paper estimates age, time and cohort effects in entrepreneurship in five Latin American countries. We find that the time effects are highly correlated with GDP growth. In most countries age effects show and inverse U shaped with maximum rates of entrepreneurship between 40 and 50 years. Finally, we find for Brazil, Mexico and Uruguay a clear pattern of lower entrepreneurship of the younger cohorts. We find almost no change in Peru and Chile over the last generations with a slight decrease for Peru and a slight increase for Chile. Keywords: entrepreneurship, cohort effects, age effects, business cycle, Latin America JEL Classification: L26, J11 Documento de Investigación, Nro. 106, Mayo de 2016. Universidad ORT Uruguay. Facultad de Administración y Ciencias Sociales. ISSN 1688-6275 * The authors wish to thank Henry Willebald, Reto Bertoni, Marcel Mordezki, Luis Silva and Enrique Kramer for usefull discussions and Eyal Brenner for help with the databases. All errors are the authors only responsibility.
Transcript of Cohort, age and business cycle effects in entrepreneurship ...
Cohort, age and business cycle
effects in entrepreneurship in Latin
AmericaBukstein, Daniel
Universidad ORT Uruguay
Gandelman, Néstor Universidad ORT Uruguay
*
Mayo 2016
Abstract
This paper estimates age, time and cohort effects in entrepreneurship in five Latin American countries. We find that the time effects are highly correlated with GDP growth. In most countries age effects show and inverse U shaped with maximum rates of entrepreneurship between 40 and 50 years. Finally, we find for Brazil, Mexico and Uruguay a clear pattern of lower entrepreneurship of the younger cohorts. We find almost no change in Peru and Chile over the last generations with a slight decrease for Peru and a slight increase for Chile.
Keywords: entrepreneurship, cohort effects, age effects, business cycle, Latin America
JEL Classification: L26, J11
Documento de Investigación, Nro. 106, Mayo de 2016. Universidad ORT Uruguay. Facultad de Administración y Ciencias Sociales. ISSN 1688-6275
* The authors wish to thank Henry Willebald, Reto Bertoni, Marcel Mordezki, Luis Silva and EnriqueKramer for usefull discussions and Eyal Brenner for help with the databases. All errors are the authors only responsibility.

I. Introduction
Are younger generations more or less entrepreneurial than older generations? Are there
differences in the occupational choices of cohorts that are fixed over time? The goal of
this paper is to obtain separate estimates of age, time and cohort effects in
entrepreneurship in five Latin American countries.
National statistics on entrepreneurial activity are the result of aggregates of
entrepreneurial activity of different generations. In this sense, the national
entrepreneurial rate is a measure of the stock of entrepreneurship in a certain period of
time. The entrepreneurship of the generation entering the labor market is a measure of
flow of entrepreneurship and suggests marginal changes in aggregate entrepreneurship.
Besides a pure academic point of view, obtaining adequate measures of generation flow
of entrepreneurship is important for two reasons. First, the dynamics of the national
entrepreneurship rate respond to the evolution of the entrepreneurship of entering
cohorts. A country with a tendency of increasing entrepreneurship in younger
generations will in the medium term show an increase in national entrepreneurial
activity. Second, it is easier to generate policies to affect the generation entering the
labor market than to affect all of it. Examples of these policies are business oriented
educational programs, programs that highlight the values of entrepreneurship and the
generation of economic opportunities, programs triggered to remove obstacles that are
likely to be tighter in young potential entrepreneurs like credit access, programs of firm
incubation where monitoring and coaching can be provided, etc.
Becoming a businessman as any individual occupational choice is a personal
decision affected by multiple considerations many of which evolve over time. Some of
these considerations refer to the individual himself (e.g. skills, experience, attitudes
towards risk) and some to the social and economic environment (e.g. business
opportunities, growth perspectives, social prestige of different occupations). Age and
the business cycle are correlated with many of them. In this paper, we argue that besides
age and business cycle there are effects that are inherent to each generation of
individuals that follows them over the life-cycle and over economic conditions.
The relation of entrepreneurship with age and the business cycle has been
considered by the literature but the cohort effects are almost absent. However, there are
Universidad ORT Uruguay 2

two literatures that have developed methodologies to address the separate estimation of
effects of age, time and cohort. MaCurdy and Mroz (1995) develop one such approach
that has been mostly used in the study of income inequality (see for instance: Antoncyk,
DeLeire and Fitzenberger 2010, Albuquerque and Menezes-Filho 2011, Gosling,
Machin and Meghir 1999). MaCurdy and Mroz (1995) methodology is based on an
estimation that includes polynomial interactions of cohorts and age. Although
interesting, this methodology can only report one effect leaving the other fixed. We
have therefore relied on an approach proposed by Deaton (1997) based on Deaton and
Paxson (1994) that have been mostly used within the literature of consumption-saving
life cycle decisions. This approach has been also used by Bukstein and Sapelli (2011)
for the analysis of human capital investment decisions. Our paper is the first application
of the methodology within the context of entrepreneurial research.
The empirical definition of entrepreneurship is in itself a debatable issue. The
literature has used two basic approaches: self employment and business ownership with
employees. In this paper, we follow the second approach since the self employed in
Latin America are for the most part necessity entrepreneurs (see Bukstein and
Gandelman 2014 for Uruguay). Necessity entrepreneurs tend to have less human capital
and less financial capital (Ardagna and Lusardi 2008, Caliendo and Kritikos 2009), their
business are less likely to growth (Shane 2009) and have lower investment rates (Evans
and Jovanovic 1989, Santarelli and Vivarelli 2007). With our definition we also follow
EUROSTAT-OECD definition of entrepreneurs as “those persons (business owners)
who seek to generate value through the creation or expansion of economic activity, by
identifying and exploiting new products, process or markets”. In our operational
definition the added restriction of employing at least one person drops the self
employed.
The data comes from repeated cross section of household surveys for five Latin
American countries: Brazil (2001-2013), Chile (1983-2014), Mexico (2005-2013), Peru
(2004-2013) and Uruguay (1982-2013).
Our paper contributes at least to two literatures. First, this is the first paper to
separate the age, time and cohort effects within entrepreneurial research. The difference
between average entrepreneurship and the entrepreneurship of generations entering the
labor market is important as predictors of future average entrepreneurship and for the
development of policies to foster economic development. Second, it contributes to the
Universidad ORT Uruguay 3
Documento de Investigación - ISSN 1688-6275 - Nº 106 - 2016 - Bukstein, D.; Gandelman, N.
literature on regional development with the focus on five Latin American countries. The
Latin American region economic performance has lagged with respect to other regions.
Understanding the patterns of entrepreneurial activity can help address this puzzle.
From a methodological point of view the approach adopted can be easily applied to
other countries were microdata from household surveys is available.
We find that the time effect on entrepreneurship is highly correlated with GDP
growth. We also find that the age effect shows an inverse U shape pattern with a
maximum between 40 and 50 years old in line with the international literature. We
believe our most interesting result refer to cohort effects. In Chile, we find a decline in
cohort’s entrepreneurship from the generation entering the labor market in 1942 until
the generation entering the labor market in 1990 and a reversal after this point. For
Brazil and Mexico we find a pervasive decline in cohorts’ entrepreneurship from the
first cohorts that we can observe (those entering the labor market in late fifties early
sixties). Cohort’s entrepreneurship in Peru, starting from those entering the labor
market in the early sixties, has been roughly constant with a slight decline in the latest
generations. Finally, Uruguayan cohort tended to be increasingly entrepreneurial until
the early sixties where it stagnated. Starting in the cohort that entered the labor market
in 2002 the cohort effect started to decrease.
The paper follows with section II literature review to put our research into the
broader perspective and section III where we present the methodology and data. In
section IV we present our results that are discussed in its interpretation and limitations
in section V. Section VI concludes.
II. Literature review
While salaried work offers immediate returns it may take time for a new
enterprise to start generating profits. Lévesque and Minniti (2006) construct a
theoretical model of time allocation where the timing of income-generating of different
occupational choices makes entrepreneurial behavior less desirable as people grow
older. Mondragón-Velez (2009) focus on wealth and education and Bönte, Falck and
Heblich (2009) focusing on regional characteristics report a non linear relation between
age and entrepreneurship. The literature has found that the maximum potential for
entrepreneurship is around 40 years old (Parker 2004).
Universidad ORT Uruguay 4

Real business cycle models have been able to reproduce co-movement of several
key macroeconomic variables within the economy. In this spirit, Thompson (2011)
develops a model of occupational choice were the fraction and skills of the population
entering into entrepreneurship depends on the phase of the cycle. In recessions there is a
larger fraction of low ability individuals becoming necessity entrepreneurs due to lack
of opportunities as salaried workers. In this paper it is shown that a short-lived recession
may have long-term consequences for the quality of cohort of firms. On the other hand,
Yu, Orazem and Jolly (2009) studying two cohorts of graduates from Iowa State
University found that recessions delay business start ups plans for about two years but
do not have enduring effects. According to the authors, the business cycle has
temporary effects that do not permanently translate to the cohort entering the labor
market.
The effect of the business cycle can be channeled into entrepreneurship in a
variety of ways. Gromb and Scharfstein (2002) and Hamilton (2000) study the relation
between entrepreneurship behavior and the conditions of the labor market. Evans and
Jovanovic (1989), Evans and Leighton (1989) and Kihlstrom and Laffont (1979) argue
the importance of availability of financial sources and financial restrictions on new
enterprises. Cagetti and De Nardi (2006) calibrate a model of occupational choice in the
presence of borrowing constraints showing that constraints retard entrepreneurial
activity. The model replicates the distribution of wealth among entrepreneurs and
workers reasonably well. Financial constraints have been argued to be the main
constraints to start ups. According to Blanchflower and Oswald (1998) there is a
positive impact of receiving an inheritance or gift on the probability of becoming and
entrepreneur. This has been interpreted as evidence of financial constraints to become a
businessman. Holtz-Eakin, Joulfaian and Rosen (1994) also report evidence consistent
with inherited wealth relaxing liquidity constraints. On the other hand, Hurst and
Lusardi (2004) report a flat relation between business ownership and wealth for most of
the wealth distribution. Only for the richest (top 10th percentile) there is positive
correlation with wealth. Mondragón-Velez (2009) challenge this finding arguing that
education and age, that are used as explanatory variables of the transition probability to
entrepreneurship, are correlated with wealth. According to them the probability of
transition of entrepreneurship is hump-shaped in wealth across cohorts defined by age
and education.
Universidad ORT Uruguay 5
Documento de Investigación - ISSN 1688-6275 - Nº 106 - 2016 - Bukstein, D.; Gandelman, N.

Besides contextual conditions reviewed in the last paragraph there are some
intrinsic characteristics of individuals that can also be affected by the business cycle and
by age. Entrepreneurial activity is a risk venture; therefore everything that affects risk
attitudes affects the propensity of entrepreneurship. Risk taking was considered a
predetermined personality attribute by the early psychology literature (see Bromiley and
Curley, 1992 for a literature review). This vision has evolved into considering risk
taking an individual feature that depends on a combination of genetic and environmental
influences. Vaan Praag and Booij (2003) find that risk aversion decreases with age.
Sepúlveda and Bonilla (2014) report that the relation of risk aversion with age is hump
shaped. Moreover, recessions tend to decrease the tolerance of risk of individuals.
Rampini (2004) present a theoretical model where wealth effects produced over the
business cycle affect risk aversion of individuals and therefore entrepreneurial activity.
Either the effects of age or the effects of the business cycle on risk aversion can
be multiplied through the effect of peers on risk aversion as reported by Balsa,
Gandelman and González (2015). Peer effects are an additional justification for the
existence of enduring cohort specific effects on entrepreneurship. They also affect
cohort entrepreneurship through social networks and informal contacts (Birley 2000).
According to Sanders and Nee (1996) there are three mechanisms by which social
networks potentiate entrepreneurship: by facilitating access to resources, helping finding
opportunities and addressing risks, and by providing psychological support.
The literature on immigrant entrepreneurship studied the reasons behind
differences in entrepreneurship rates by ethnic groups (Lunn and Steen 2000). Some
have focus on specific immigrant groups (e.g. Greene 1997, Wong and Ng 1998 and
Yoo 2000) while others have studied the characteristics of immigrant networks and its
relationship with entrepreneurship (Sequeira and Rasheed 2006). Since waves of
migrations have regional and temporal patterns it follows that differences in rates of
immigrant within cohorts produces differences in cohorts’ entrepreneurship. These
differences that can also be multiplied through peer effects.
As reported the age and time effects on entrepreneurship have been considered
by the literature but the measure of cohort effects is almost absent. Ramirez and Surfiel
(2013) use a panel of individuals to characterize differences between Hispanic and non-
Hispanic entrepreneurs motivated by the rise in the rate of entry of Hispanics into
entrepreneurial activity. In this paper individuals that ever owned a business are
Universidad ORT Uruguay 6

considered entrepreneurs. By not allowing the possibility of entry and exit over time
into entrepreneurship the authors cannot study the effect of age and separate it from
cohort effects. Egri and Ralston (2004) study the value orientation of three generations
of Chinese and US managers and professionals. Their data comes from a one point in
time cross section of individuals. Different cohorts are observed at different phases of
their life-cycle. Therefore they cannot formally asses what differences are produced by
aging and what are inherent cohort effects.
Our paper is part of a growing body of research on entrepreneurship in Latin
America. Notable examples of this agenda include Lora and Castellani (20014) book on
the interaction between entrepreneurship and social mobility. Also in 2014 the Latin
American Journal of Economics devoted a special issue to entrepreneurship and social
mobility that included case studies of Colombia (Meléndez and Mejia 2014), Ecuador
(Ordeñana and Villa 2014), Mexico (Velez-Grajales and Velez Grajales 2014) and
Uruguay (Bukstein and Gandelman 2014, Gandelman and Robano 2014). The 2013
CAF flagship report also focused on entrepreneurship in Latin America with the
subjective subtitle “from subsistence to productive choice”. Using data gathered during
the CAF study, Aboal and Veneri (2014) analyze task-related personality traits relation
with entrepreneurial behavior in nine Latin American countries.
III. Data and methodology
i. Data
In this paper we use data on five Latin American countries: Brazil (2001-2013), Chile
(1983-2014), Mexico (2005-2013), Peru (2004-2013) and Uruguay (1982-2013). We
use the micro-data available from repeated cross section surveys. The surveys for Peru,
Brazil and Mexico have urban and rural coverage while data for Chile and Uruguay is
only urban.1
The samples used to build the cohorts contain individuals from ages 21 to 65.
The idea behind the determination of this age range is to analyze individuals in their
1 We also perform the same estimation using only urban data for all countries. The results are very similar to those here reported.
Universidad ORT Uruguay 7
Documento de Investigación - ISSN 1688-6275 - Nº 106 - 2016 - Bukstein, D.; Gandelman, N.
economically active stage and that are not facing labor-schooling or labor-retirement
decisions. See the Appendix for details on the sources.
ii. Building synthetic cohorts
In order to study the differences in the rates of entrepreneurship across generations the
researcher would ideally be interested in having a panel dataset, that is, having
information on the entrepreneurial behavior of a given sample of individuals over time.
Unfortunately, such kind of information is very difficult to find in Latin American
countries. Nevertheless, repeated cross-sectional data can be used to build synthetic
observations named "cohorts". In this case, the researcher follows over time not the
same group of individuals but a sample that shares some time-invariant characteristics
like birth date and gender. In this paper we define cohorts by birth year. The crucial
assumption is that each year the consecutive random cross section surveys allow the
correct representation of the set of persons born in a given year. This allows following
of behavior of the cohort over time even if the group of surveyed people change from
period to period.
The final product of this method is a pseudo-panel comprised of the percentage
of entrepreneurs in each cohort over time. One advantage of using this methodology to
measure entrepreneurial rates across cohorts is that pseudo-panels do not suffer from
regular panel data problems like panel mortality or attrition, allowing the researcher to
focus in the subject at hand instead of dealing with these kinds of shortcomings.
The above methodology allows us to study the evolution of a variable of interest
over time for different cohorts. The traditional definition of a cohort as a set of
individuals born in a specific year exploits the relationship between their birth year, the
survey year the individual is observed and their age, given by the following identity:
APC −= (1)
where C is the birth year, P the year when the cross section survey takes place and A is
age. In this paper, however, we have taken a slight different definition. First, we define
the difference given by (1) as the "birth date". Then, a cohort is built including
individuals born in different years. Specifically, we build the cohorts including people
born in five different years. At the same time, when we move from one cohort to a
Universidad ORT Uruguay 8

younger one, we put aside the older members of the cohort and include individuals born
in a more recent year. That is, we build "rolling" cohorts. The reason behind this is
maximizing the amount of individuals used to compute the synthetic observation for
each generation in every cross-section survey. The larger the birth year-span used to
build the cohorts the more individuals will be included in the calculations and therefore
the more precise will be the resulting synthetic observation computed.
For simplicity, we start by referring to each cohort using the birth year of the
older generation that integrates it (in the results section we present them by the year in
which they entered the labor market assuming entry is at 21 years old). For example, the
oldest cohort is the 1920 one, and is composed of individuals born from 1920 to 1924,
the following cohort is the cohort of 1921, integrated by people born from 1921 to 1925,
the 1922 cohort includes those born between 1922 and 1926 and so on to the 1986
cohort. It is important to note that working with this definition of cohorts the identity
given by (1) remains valid, only that it should be applied to the birth year of the
generation that “names” the cohort, i.e. the oldest birth year. Then, every age computed
for each cohort refers to the age of the older generation, for example, the age of cohort
1984 in 2009 is 25 even though the cohort includes people aged 21 to 25.
Once defined the cohorts in this fashion, it is possible to examine the same
generations at different ages and different generations at the same age, allowing to
obtain information on how the circumstances have changed for each cohort. For
example, the cohort of 1920 (that includes people born in the period 1920-1924) is
observed in 1982 at the ages ranging from 58 to 62, in 1983 at ages 59 to 63 and so on
until 1985 when they are last observed because the older individuals composing the
cohort reach the age of 65. The cohort of 1920 is then observed in four different years.
In a similar vein, the cohort of 1950 (which includes those born between 1950-1954)
will be observed in 1982 at the ages 28-32. In this case, as this cohort is not close to the
age of 65, it will be observed until the last available survey, for example, 2014, at ages
60-64. The younger a cohort is first observed, the longer we can follow it over time. We
only include in the analysis cohorts that can be followed at least four times because a
smaller number of observations per cohort increases largely the variance in the
estimations and does not allow for a correct identification of the cohort effect.
Table 1 presents the information available for each country in the sample. We
identify each cohort by the birth year and the year it entered the labor market. It can be
Universidad ORT Uruguay 9
Documento de Investigación - ISSN 1688-6275 - Nº 106 - 2016 - Bukstein, D.; Gandelman, N.
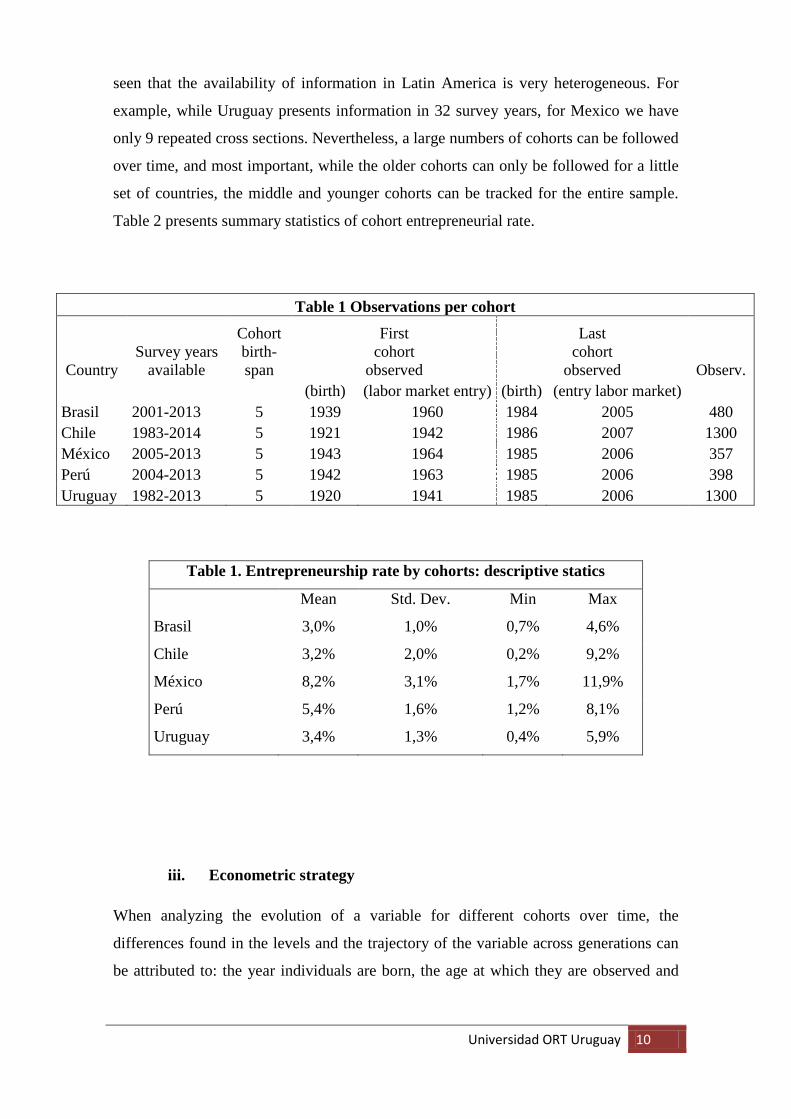
seen that the availability of information in Latin America is very heterogeneous. For
example, while Uruguay presents information in 32 survey years, for Mexico we have
only 9 repeated cross sections. Nevertheless, a large numbers of cohorts can be followed
over time, and most important, while the older cohorts can only be followed for a little
set of countries, the middle and younger cohorts can be tracked for the entire sample.
Table 2 presents summary statistics of cohort entrepreneurial rate.
Table 1 Observations per cohort
Country Survey years
available
Cohort birth-span
First cohort
observed
Last cohort
observed Observ.
(birth) (labor market entry) (birth) (entry labor market)
Brasil 2001-2013 5 1939 1960 1984 2005 480 Chile 1983-2014 5 1921 1942 1986 2007 1300 México 2005-2013 5 1943 1964 1985 2006 357 Perú 2004-2013 5 1942 1963 1985 2006 398 Uruguay 1982-2013 5 1920 1941 1985 2006 1300
Table 1. Entrepreneurship rate by cohorts: descriptive statics
Mean Std. Dev. Min Max
Brasil 3,0% 1,0% 0,7% 4,6%
Chile 3,2% 2,0% 0,2% 9,2%
México 8,2% 3,1% 1,7% 11,9%
Perú 5,4% 1,6% 1,2% 8,1%
Uruguay 3,4% 1,3% 0,4% 5,9%
iii. Econometric strategy
When analyzing the evolution of a variable for different cohorts over time, the
differences found in the levels and the trajectory of the variable across generations can
be attributed to: the year individuals are born, the age at which they are observed and
Universidad ORT Uruguay 10

the survey year from which the information is obtained, resulting in the "cohort effect",
"age effect" and "time effect", respectively.
The cohort effect is the one that poses greater interest for the researcher, as it
reflexes the part of the evolution of the variable that is driven by the intrinsic
characteristics of the cohort. The age effect represents the part of the evolution related
to the life cycle of the individuals. Finally, the time or period effect refers to those
factors that are variable over time but affect the different cohorts in the same way, most
relevant for this paper are the business cycle fluctuations.
In order to identify if there exists a cohort effect in the rate of entrepreneurship, a model
can be estimated in the following way:
ctct pacfENT ε+= ),,( (2)
where ENT is the rate of entrepreneurship of cohort c at time t. a is the age, p the year of
the survey and ε the error term. Note that the subscript “ct” mimics the real panel-data
“it” referring to the cohort (individual) time varying variables respectively.
In the relevant literature there can be found several ways of specifying the function
),,( pacf . One possible approach is to estimate (2) as:
(3)
where C, A and P are matrices containing only zeros and ones representing dummy
variables for the cohort, age and period effects, with the data ordered in cohort-year
pairs. If there are m cohort-year pairs then each matrix will have m rows, and the
number of columns will be equal to the number of cohorts, ages and periods considered.
Note that in order to avoid the dummy variable trap, one dummy variable per effect
must be dropped. However, even so this model would be impossible to estimate because
of the perfect colinearity between the age, period and cohort effects given by (1). This
can be seen as an identification problem: without further information it is impossible to
separate one effect from the other.
In order to deal with this difficulty, the literature offers two sets of solutions.
One set proposes estimating (3) by imposing some kind of restriction on the coefficients
(equality or exclusion). The second set tries to replace the dummy variables with other
that contain more information about the cohort, ages or survey years. In this paper, we
ctct PACENT εββββ ++++= 3210
Universidad ORT Uruguay 11
Documento de Investigación - ISSN 1688-6275 - Nº 106 - 2016 - Bukstein, D.; Gandelman, N.

choose to apply a solution that belongs to the first group because it allows us to estimate
the parameter of interest, i.e., the cohort effect.
The identification normalizations used to estimate (3) are proposed by Deaton
(1997) based on Deaton and Paxson (1994). In the latter paper the authors establish that
a normalization that solves the perfect colinearity problem implies that: 1) the period
effects are orthogonal to a linear trend and 2) they add-up to zero, cancelling each other
out. The first restriction removes the trend component in the rate of entrepreneurship
from the period effect, making it only possible to find in the cohort or age effects.
Therefore, the temporary business cycle fluctuations are captured by the period effect,
while the cohort and age effects capture permanent or trend based variations in the
variable of interest.
Based on these considerations, Deaton suggests to run regression (3) where
matrices C and A contain dummy variables for each cohort and age (except one) but P
contains T-2 dummy variables, from t=3 to t=T where T is the last period observed,
normalized in the following way:
])2()1[( 12* dtdtdd tt −−−−= (4)
where dt is a variable that takes the value 1 if the year is equal to t and 0 otherwise and
the variables *td are the normalized variables used in the regression.
When running the regression (3) applying the normalizations mentioned above,
the interpretation of the coefficients is straightforward: the values of each set of dummy
variables capture each effect, i.e., the values of the coefficients associated with the
cohort dummies show the pattern of the cohort effect, the values of the age dummies
capture the life-cycle effect on the entrepreneurial activity and the coefficients
associated with the period dummies outline the period effect.
IV. Results
The results are presented in Figures 1, 2 and 3. The dotted lines are the 95% confidence
intervals. In all graphs we impose the same y-scale to facilitate comparison.
The period effects reported in Figure 1 are the marginal effects of each year. The
base comparison year are the first two years that does not appear in the figures (e.g. Universidad ORT Uruguay 12
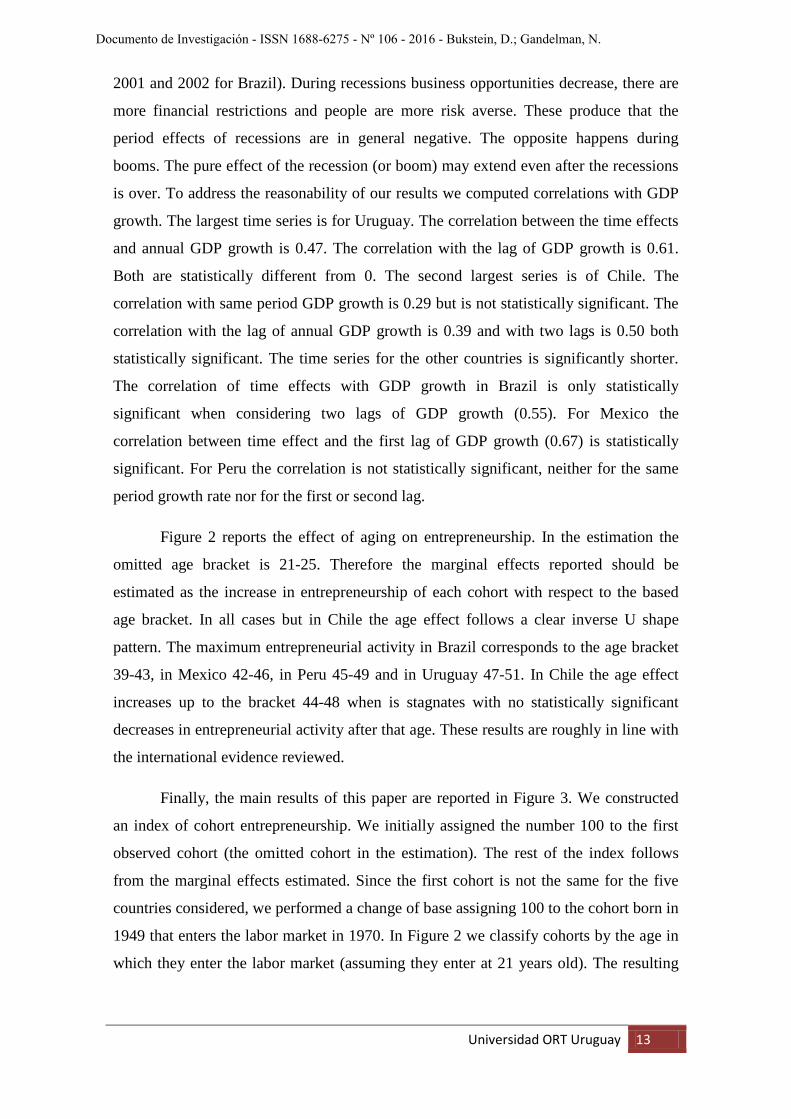
2001 and 2002 for Brazil). During recessions business opportunities decrease, there are
more financial restrictions and people are more risk averse. These produce that the
period effects of recessions are in general negative. The opposite happens during
booms. The pure effect of the recession (or boom) may extend even after the recessions
is over. To address the reasonability of our results we computed correlations with GDP
growth. The largest time series is for Uruguay. The correlation between the time effects
and annual GDP growth is 0.47. The correlation with the lag of GDP growth is 0.61.
Both are statistically different from 0. The second largest series is of Chile. The
correlation with same period GDP growth is 0.29 but is not statistically significant. The
correlation with the lag of annual GDP growth is 0.39 and with two lags is 0.50 both
statistically significant. The time series for the other countries is significantly shorter.
The correlation of time effects with GDP growth in Brazil is only statistically
significant when considering two lags of GDP growth (0.55). For Mexico the
correlation between time effect and the first lag of GDP growth (0.67) is statistically
significant. For Peru the correlation is not statistically significant, neither for the same
period growth rate nor for the first or second lag.
Figure 2 reports the effect of aging on entrepreneurship. In the estimation the
omitted age bracket is 21-25. Therefore the marginal effects reported should be
estimated as the increase in entrepreneurship of each cohort with respect to the based
age bracket. In all cases but in Chile the age effect follows a clear inverse U shape
pattern. The maximum entrepreneurial activity in Brazil corresponds to the age bracket
39-43, in Mexico 42-46, in Peru 45-49 and in Uruguay 47-51. In Chile the age effect
increases up to the bracket 44-48 when is stagnates with no statistically significant
decreases in entrepreneurial activity after that age. These results are roughly in line with
the international evidence reviewed.
Finally, the main results of this paper are reported in Figure 3. We constructed
an index of cohort entrepreneurship. We initially assigned the number 100 to the first
observed cohort (the omitted cohort in the estimation). The rest of the index follows
from the marginal effects estimated. Since the first cohort is not the same for the five
countries considered, we performed a change of base assigning 100 to the cohort born in
1949 that enters the labor market in 1970. In Figure 2 we classify cohorts by the age in
which they enter the labor market (assuming they enter at 21 years old). The resulting
Universidad ORT Uruguay 13
Documento de Investigación - ISSN 1688-6275 - Nº 106 - 2016 - Bukstein, D.; Gandelman, N.

index allows for a comparison of the evolution (but not the level) of cohort
entrepreneurial activity between countries.
Our results show a statistically significant decreasing pattern for Brazil and even
stronger from Mexico between the cohorts that entered the labor market in the sixties
and those that entered the labor market in the 2000s. Considering approximately the
same cohorts the pattern in Peru is more stable with no statistically significant changes
in cohort entrepreneurship. Uruguay and Chile are the countries where we can observe
the oldest cohorts. Their patter is exactly the opposite (hump shape for Uruguay and U
shape for Chile). In Uruguay cohort entrepreneurial activity was a raising phenomenon
for the older generations that stagnated around the cohort entering the labor market in
the early sixties. This process continued until the cohort that entered the labor market
about 1999 where it started a process of decreasing cohort entrepreneurial activity. The
entrepreneurial activity of Chile’s oldest cohort was the higher in the country series. It
was followed by a decrease in cohort entrepreneurship until the cohorts entering the
labor market in the nineties when it started a process of recovery.
Universidad ORT Uruguay 14
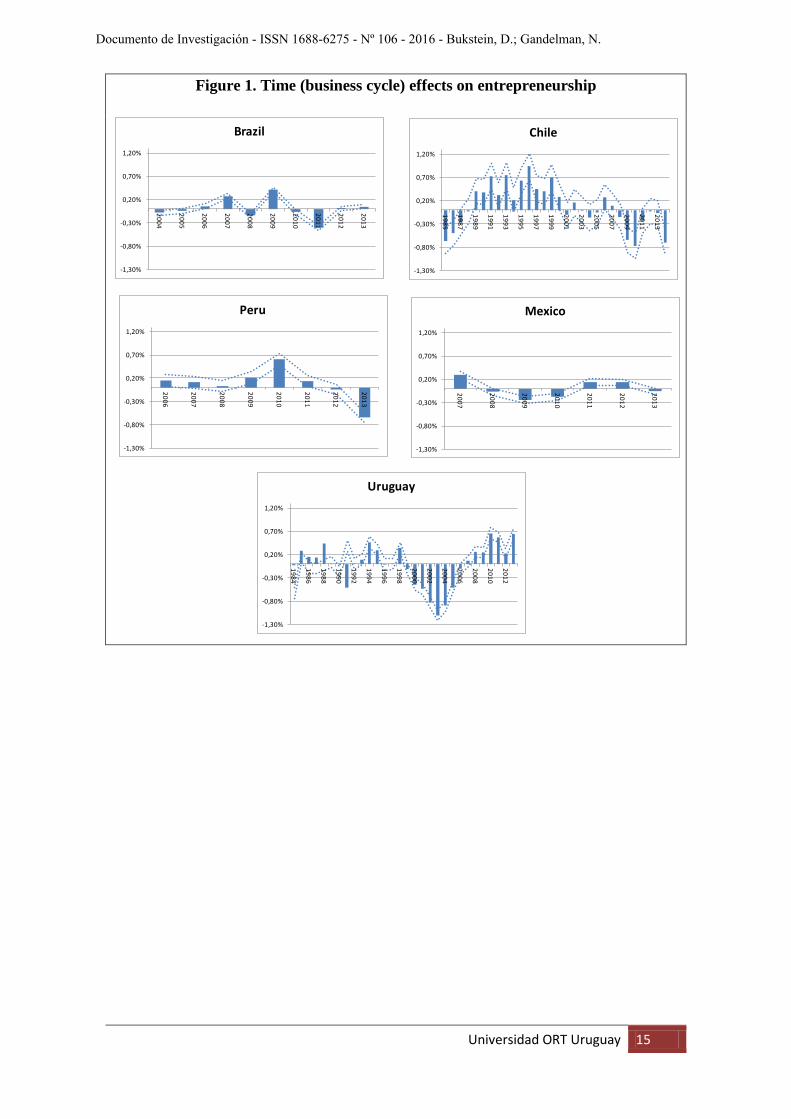
Figure 1. Time (business cycle) effects on entrepreneurship
-1,30%
-0,80%
-0,30%
0,20%
0,70%
1,20%
2004
2005
2006
2007
2008
2009
2010
2011
2012
2013
Brazil
-1,30%
-0,80%
-0,30%
0,20%
0,70%
1,20%
1985
1987
1989
1991
1993
1995
1997
1999
2001
2003
2005
2007
2009
2011
2013Chile
-1,30%
-0,80%
-0,30%
0,20%
0,70%
1,20%
2006
2007
2008
2009
2010
2011
2012
2013
Peru
-1,30%
-0,80%
-0,30%
0,20%
0,70%
1,20%2007
2008
2009
2010
2011
2012
2013
Mexico
-1,30%
-0,80%
-0,30%
0,20%
0,70%
1,20%1984
1986
1988
1990
1992
1994
1996
1998
2000
2002
2004
2006
2008
2010
2012
Uruguay
Universidad ORT Uruguay 15
Documento de Investigación - ISSN 1688-6275 - Nº 106 - 2016 - Bukstein, D.; Gandelman, N.
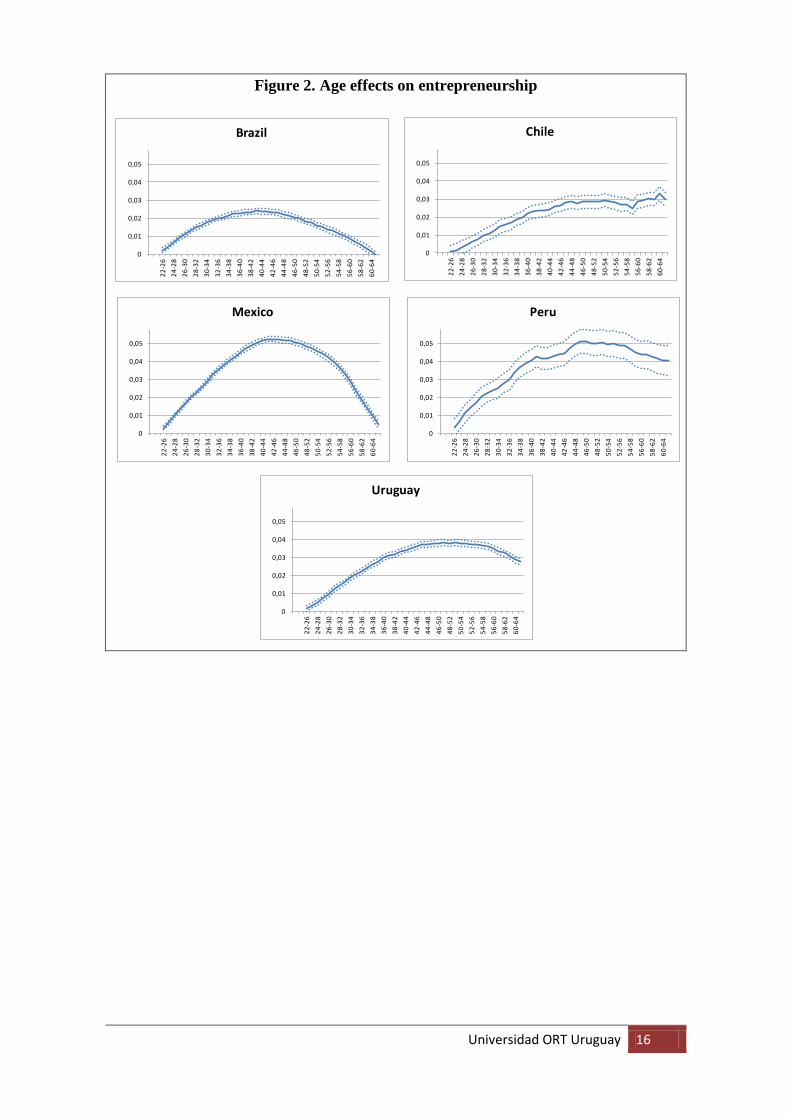
Figure 2. Age effects on entrepreneurship
0
0,01
0,02
0,03
0,04
0,0522
-26
24-2
826
-30
28-3
230
-34
32-3
634
-38
36-4
038
-42
40-4
442
-46
44-4
846
-50
48-5
250
-54
52-5
654
-58
56-6
058
-62
60-6
4
Brazil
0
0,01
0,02
0,03
0,04
0,05
22-2
624
-28
26-3
028
-32
30-3
432
-36
34-3
836
-40
38-4
240
-44
42-4
644
-48
46-5
048
-52
50-5
452
-56
54-5
856
-60
58-6
260
-64
Chile
0
0,01
0,02
0,03
0,04
0,05
22-2
624
-28
26-3
028
-32
30-3
432
-36
34-3
836
-40
38-4
240
-44
42-4
644
-48
46-5
048
-52
50-5
452
-56
54-5
856
-60
58-6
260
-64
Mexico
0
0,01
0,02
0,03
0,04
0,05
22-2
624
-28
26-3
028
-32
30-3
432
-36
34-3
836
-40
38-4
240
-44
42-4
644
-48
46-5
048
-52
50-5
452
-56
54-5
856
-60
58-6
260
-64
Peru
0
0,01
0,02
0,03
0,04
0,05
22-2
624
-28
26-3
028
-32
30-3
432
-36
34-3
836
-40
38-4
240
-44
42-4
644
-48
46-5
048
-52
50-5
452
-56
54-5
856
-60
58-6
260
-64
Uruguay
Universidad ORT Uruguay 16
Figure 3. Cohort effects on entrepreneurship
V. Discussion
The results of age and time period presented are within what can be expected. We had a
priori not a clear hypothesis of how cohort entrepreneurial activity evolved in Latin
America. Our results show that the pattern is not unique. The cohort’s effects are likely
determined by a variety of factors and their importance most likely varies between
countries. Taking Uruguay as an example we can conjecture some of them.
Migration in Uruguay changed over time. Until the late fifties Uruguay had a net
influx of migrants. In the seventies, emigration surpassed immigration with a pick
during the 2002 economic crisis. Economically motivated migrants are by definition
individuals that are willing to take the risk of changing their living environment and
93,594,595,596,597,598,599,5
100,5101,5102,5103,5
1960
1962
1964
1966
1968
1970
1972
1974
1976
1978
1980
1982
1984
1986
1988
1990
1992
1994
1996
1998
2000
2002
2004
Brazil
93,594,595,596,597,598,599,5
100,5101,5102,5103,5
1943
1946
1949
1952
1955
1958
1961
1964
1967
1970
1973
1976
1979
1982
1985
1988
1991
1994
1997
2000
2003
2006
Chile
93,594,595,596,597,598,599,5
100,5101,5102,5103,5
1964
1966
1968
1970
1972
1974
1976
1978
1980
1982
1984
1986
1988
1990
1992
1994
1996
1998
2000
2002
2004
2006
Mexico
93,594,595,596,597,598,599,5
100,5101,5102,5103,5
1964
1966
1968
1970
1972
1974
1976
1978
1980
1982
1984
1986
1988
1990
1992
1994
1996
1998
2000
2002
2004
2006
Peru
93,594,595,596,597,598,599,5
100,5101,5102,5103,5
1942
1945
1948
1951
1954
1957
1960
1963
1966
1969
1972
1975
1978
1981
1984
1987
1990
1993
1996
1999
2002
2005
Uruguay
Universidad ORT Uruguay 17
Documento de Investigación - ISSN 1688-6275 - Nº 106 - 2016 - Bukstein, D.; Gandelman, N.
venturing into a new country in the hope of improving their life standards. Probably,
migrant are more entrepreneurial oriented than others as reported in the literature. This
could explain the inverse U shaped reported.
Thompson (2011) argued that even a short lived recession may have enduring
cohort impact. During 1943 and 1958 Uruguay grew at annual average 4% with no
recession years. During this period Uruguay received favorable external conditions on
their commodities due to international war conflicts. This is also the period of import
substitution when the country had high tariff and non tariff barriers to protect the
national industry. In Uruguay, the model of import substitution is considered to have
exhausted its possibilities in the sixties (annual growth rate of 0% between 1958 and
1968). During the nineties Uruguay started a process of trade liberalization that ended
up with the conformation of the Mercosur. As a result of the decrease in trade barriers
many non efficient firms had to exit. The increased international competition likely
made more difficult the entry and survival of small entrepreneurs, especially in some
industries (e.g. clothing). These effects can produce the decrease in cohort
entrepreneurship reported for the latter Uruguayan generations.
There are other possible hypotheses to be considered. A change in the average
firm size can, in equilibrium, produce a change in the entrepreneurial rate. With the size
of cohorts relatively constant, an increase in the average employment of firms implies a
decrease in the number of firms and entrepreneurs. The productive structure of Latin
American countries changed over the last half century in a way likely to alter the
average size of firms. Trade liberalization implied rises and decreases of sectors.
Changes in the price of commodities implied productive changes within the agriculture
sector. The commercial blocks (Mercosur, Nafta) allowed access to wider markets
facilitating the generation of economies of scale.
Socio-political factors can also be part of the story. Changes in the business
environment, the rule of law, the transparency of governments can affect the generation
of business opportunities. The entering cohorts are likely to be more affected than those
already in the labor markets. The acquisition of human capital is not only a matter of
years of study. There are different forms of human capital investment (e.g. different
University majors) and not all of them have the same entrepreneurial potential.
Education is not only the accumulation of knowledge and the development of skills. It
also affects the values of individuals. Values such a economic independency, openness
Universidad ORT Uruguay 18
to change, self-enhancement, self-transcendence can affect the occupational choice. The
social status of entrepreneurs can vary over time making less or more desirable
compared to other alternatives like a private or public sector salaried job or professional
self employment.
Finally, we would like to emphasis that our results should not be interpreted in
terms of welfare. The disappearance of inefficient firms supported by government
subsidies or trade protections produces increases in social welfare. Increases or
decreases in entrepreneurial activities are not per se good or bad. The type of new firms
created, their productive dynamics, they survival opportunities, the externalities they
generate are key factors not addressed in our measures of entrepreneurial activity.
VI. Conclusions
This paper uses a normalization proposed in the literature of determinants of savings to
separate age, time and cohort effects in entrepreneurship in five Latin American
countries. We find that the time effects are highly correlated with same year GDP
growth although in some cases is even more correlated with lags of GDP growth. This
suggests that the effect of the business cycle in the emergence of entrepreneurship is not
immediate and time is need for the transformation of good business environments into
new firms. In most countries age effects show and inverse U shaped with maximum
rates of entrepreneurship between 40 and 50 years. This can be seen as evidence that it
takes time to learn how to be entrepreneur. It takes time to develop the ability to identify
business opportunities and to mobilize the human capital and financial resources
needed.
Finally, we find for Brazil, Mexico and Uruguay a clear pattern of lower
entrepreneurship of the younger cohorts. We find almost no change in Peru and Chile
over the last generations with a slight decrease in the former and a slight increase in the
latter. Understanding the reasons behind the different evolution of cohort
entrepreneurship is a task that should be assumed country by country. We conjecture
various possible explanations but live their assessment for future work.
Universidad ORT Uruguay 19
Documento de Investigación - ISSN 1688-6275 - Nº 106 - 2016 - Bukstein, D.; Gandelman, N.

VII. References
ABOAL, D. & VENERI, F. (2016). Entrepreneurs in Latin America, Small Business
Economics, vol. 46, pp. 503-525
ALBUQUERQUE, P. & MENEZES-FILHO, N. A. (2011). Human capital and the
recent decline of earnings inequality in Brazil, Brazilian Review of Econometrics, vol.
31(2), pp. 231-257.
ANTONCZYK, D.; DELEIRE, T. & FITZENBERGER, B. (2010). Polarization and
rising wage inequality: comparing the U.S. and Germany. (IZA Discussion Paper nº
4842). Germany: Institute for the Study of Labor.
ARDAGNA, S. & LUSARDI, A. (2008). Explaining international differences in
entrepreneurship: the role of individual characteristics and regulatory constraints,
(NBER Working Paper nº 14012). Cambridge, Massachusetts: National Bureau of
Economical Research.
BALSA, A., GANDELMAN, N. & GONZÁLEZ, N. (2015). Peer effects in risk
aversion, Risk Analysis: An International Journal, vol. 35 (1), pp. 27-43.
BIRLEY, S. (2000). The role of networks in the entrepreneurial process. In D. J. Storey,
Ed. Small business: Critical perspectives on business and management. (1495-1508).
London: Routledge.
BLANCHFLOWER, D. G. & OSWALD, A. J. (1998). What makes and entrepreneur?
Journal of Labor Economics, vol. 16 (1), pp. 26-60.
BÖNTE, W., FALCK, O. & HEBLICH, S. (2009). The impact of regional age structure
on entrepreneurship, Economic Geography, vol. 85 (3), pp. 269-287.
BROMILEY, P. & CURLEY, S. (1992). Individual differences in risk taking. In F.
Yates, Ed. Risk taking behaviour. (p. 87-132). New York: Wiley
BUKSTEIN, D. & GANDELMAN, N. (2014), Intra-generational social mobility and
entrepreneurship in Uruguay, Latin American Journal of Economics, vol. 51(2), pp.
227-245.
Universidad ORT Uruguay 20
BUKSTEIN, D. & SAPELLI, C. (2011), El estancamiento de la inversión en capital
humano en Uruguay: un análisis de cohortes, Revista de Economía, vol. 18 (1), pp. 111-
152.
CAGETTI, M. & DE NARDI, M. C. (2006), Entrepreneurship, frictions, and wealth,
Journal of Political Economy, vol. 114 (5), pp. 835-870.
CALIENDO, M. & KRITIKOS, A. S. (2009). ‘I want to, but I also need to': Start-ups
resulting from opportunity and necessity. (IZA Discussion Paper nº 4661). Germany:
Institute for the Study of Labor.
DEATON, A. (1997). The analysis of household surveys: a microeconometric approach
to development policy. Washington, Baltimore: World Bank; Johns Hopkins University
Press: 479.
DEATON, A. S. & PAXSON, C. H. (1994). Saving, growth and aging in Taiwan. In
David A. Wise (ed.), Studies in the economics of aging. (pp. 331-362). Chicago:
University of Chicago Press.
DEVELOPMENT BANK OF LATIN AMERICA (2013). Entrepreneurship in Latin
America: from subsistence to productive change. Caracas: CAF.
EGRI, C. P. & RALSTON, D. A. (2004). Generation cohorts and personal values: a
comparison of China and the United States, Organization Science, vol. 15, (2), pp. 210–
220.
EVANS, D. S. & JOVANOVIC, B. (1989). An estimated model of entrepreneurial
choice under liquidity constraints, Journal of Political Economy, vol. 97(4), pp. 808-
827.
EVANS, D. S. & LEIGHTON, L. S. (1989). Some empirical aspects of
entrepreneurship, American Economic Review, vol. 79(3), pp. 519-535.
GANDELMAN, N. & ROBANO, V. (2014) Intergenerational mobility and
entrepreneurship in Uruguay, Latin American Journal of Economics, vol. 51(2), pp.
195-226.
GOSLING, A., MACHIN, S. & MEGHIR, C. (1999). The changing distribution of male
wages in the UK. (CEPR Working Paper Series nº W98/9). London: CEPR.
Universidad ORT Uruguay 21
Documento de Investigación - ISSN 1688-6275 - Nº 106 - 2016 - Bukstein, D.; Gandelman, N.
HAMILTON, B. (2000). Does entrepreneurship pay? An empirical analysis of the
returns to self-employment, Journal of Political Economy, vol. 108(3), pp. 604-631.
HOLTZ-EAKIN, D., JOULFAIAN, D. & Harvey S. Rosen (1994). Sticking it out:
entrepreneurial survival and liquidity constraints, Journal of Political Economy, vol.
102(1), pp 53-75.
HURST, E. & LUSARDI, A. (2004). Liquidity constraints, household wealth and
entrepreneurship, Journal of Political Economy, vol. 112 (2), pp. 319-347.
KIHLSTROM, R. E. & LAFFONT, J. J (1979). A general equilibrium entrepreneurial
theory of firm formation based on risk aversion, Journal of Political Economy, vol. 87,
pp. 719-48.
LÉVESQUEA, M. & MINNITI, M. (2006). The effect of aging on entrepreneurial
behavior, Journal of Business Venturing, vol. 21, pp. 177–194.
LORA, E. & CASTELLANI, F. (2014). Entrepreneurship in Latin America: a step up
the social ladder. Latin American Development Forum; Washington, DC: BID, World
Bank.
MACURDY, T. & MROZ, T. (1995). Estimating macro effects from repeated cross
sections, (Unpublished Discussion paper). Palo Alto, California: Stanford University.
MELÉNDEZ, M. & MEJÍA, P. (2014). Middle-class entrepreneurs and inadequate
prospects for social mobility through entrepreneurship in Colombia, Latin American
Journal of Economics, vol. 51(2), pp. 279-306.
MONDRAGÓN-VÉLEZ, C. (2009). The probability of transition to entrepreneurship
revisited: wealth, education and age, Ann Finance, vol. 5, pp. 421–441.
PARKER, S. C. (2004). The economics of self-employment and entrepreneurship.
Cambridge, U.K.: Cambridge University Press.
RAMIREZ, D. & SURFIELD, J. C. (2013). Hispanic entrepreneurs: moving forward by
looking back, Journal of Marketing and Management, vol. 4 (2), pp. 1-34.
RAMPINI, A. (2004). Entrepreneurial activity, risk, and the business cycle, Journal of
Monetary Economics, vol. 51, pp. 555–573.
Universidad ORT Uruguay 22

SANDERS, J. M. & NEE, V. (1996). Immigrant self-employment: the family as social
capital and the value of human capital, American Sociological Review, vol. 61, pp. 231-
249.
SANTARELLI, E. & VIVARELLI, M. (2007). Entrepreneurship and the process of
firms’ entry, survival and growth. Industrial and Corporate Change, vol. 16(3), pp.455–
488.
SEPÚLVEDA, J. P. & BONILLA, C. (2014). The factors affecting the risk attitude in
entrepreneurship: evidence from Latin America, Applied Economics Letters, vol. 21 (8),
pp. 573-581.
SEQUEIRA, J.; MUELLER, S. L. & MCGEE, J. (2007). The influence of social ties
and self-efficacy in forming entrepreneurial intentions and motivating nascent behavior,
Journal of Developmental Entrepreneurship, vol. 12 (3), pp. 275–293.
SEQUEIRA, J. M. & RASHEED, A. A. (2006). Start-up and growth of immigrant small
businesses: the impact of social and human capital, Journal of Developmental
Entrepreneurship, vol. 11, pp. 357-375.
ORDEÑANA, X. & VILLA, R. (2014). Mobility and entrepreneurship in Ecuador: a
dynamic pseudo-panel approach, Latin American Journal of Economics, vol. 51(2), pp.
307-341.
THOMPSON, P. (2011). Necessity and opportunity entrepreneurs through the business
cycle, (DOE Working Paper nº 1102). Miami, Florida: Department of Economics,
Florida International University.
VAN PRAAG, B. M. S. & BOOIJ, A. S. (2003). Risk aversion and the subjective time
discount rate: a joint approach, (CESIFO Working Paper nº 923). Munich, Germany:
Center for Economic Studies and Institute for Economic Research.
VELEZ-GRAJALES, V. & VELEZ-GRAJALES, R. (2014). Is entrepreneurship
inherited? A study on intergenerational social mobility in Mexico, Latin American
Journal of Economics, vol. 51(2), pp. 247-278.
YU, L.; ORAZEM, P. & JOLLY, R. (2009). Stopping start‐ups: how the business cycle
affects entrepreneurship, (DOE Working paper nº 09014). Ames, Iowa: Department of
Economics, Iowa State University.
Universidad ORT Uruguay 23
Documento de Investigación - ISSN 1688-6275 - Nº 106 - 2016 - Bukstein, D.; Gandelman, N.

Appendix
Country Survey Source
Brazil Pesquisa Nacional por Amostra de Domicilios
Instituto Brasileiro de Geografia e Estatística
Chile Encuesta de Ocupación y Desocupación Universidad de Chile
Mexico Instituto Nacional de Geografía y Estadística
Encuesta Nacional de Ocupación y Empleo
Peru Encuesta Nacional de Hogares Instituto Nacional de Estadística e Informática
Uruguay Instituto Nacional de Estadística Encuesta Continua de Hogares
Universidad ORT Uruguay 24