COHESIVE LAWS FOR ANALYZING THROUGH-CRACK …
12
20 th International Conference on Composite Materials Copenhagen, 19-24 th July 2015 COHESIVE LAWS FOR ANALYZING THROUGH-CRACK PROPAGATION IN CROSS PLY LAMINATES Andrew C. Bergan 1 and Carlos G. Dávila 2 1 Structural Mechanics and Concepts Branch, National Aeronautics and Space Administration Hampton, VA, USA Email: [email protected] 2 Structural Mechanics and Concepts Branch, National Aeronautics and Space Administration Hampton, VA, USA Email: [email protected] Keywords: Fracture Toughness, R-curve, Cohesive Law, Damage ABSTRACT The laminate cohesive approach (LCA) is a methodology for the experimental characterization of cohesive through-the-thickness damage propagation in fiber-reinforced polymer matrix composites. LCA has several advantages over other existing approaches for cohesive law characterization, including: visual measurements of crack length are not required, structural effects are accounted for, and LCA can be applied when the specimen is too small to achieve steady-state fracture. In this work, the applicability of this method is investigated for two material systems: IM7/8552, a conventional prepreg, and AS4/VRM34, a non-crimp fabric cured using an out-of-autoclave process. The compact tension specimen configuration is used to propagate stable Mode I damage. Trilinear cohesive laws are characterized using the fracture toughness and the notch tip opening displacement. Test results are compared for the IM7/8552 specimens with notches machined by waterjet and by wire slurry saw. It is shown that the test results are nearly identical for both notch tip preparations methods, indicating that significant specimen preparation time and cost savings can be realized by using the waterjet to notch the specimen instead of the wire slurry saw. The accuracy of the cohesive laws characterized herein are assessed by reproducing the structural response of the test specimens using computational methods. The applicability of the characterization procedure for inferring lamina fracture toughness is also discussed. 1 INTRODUCTION Quick and accurate prediction of the tensile notched strength of fiber-reinforced polymer (FRP) laminates is challenging. It is more difficult still to predict the damage propagation from a notch in an FRP structure and the resulting stress redistributions that lead to ultimate failure. In practice, semi- empirical methods that require extensive test data are used to predict notched strength [1] and it is rare for the progression of damage from a notch to be considered. Yet, a quick and accurate method for prediction of damage progression in notched structures could yield several benefits, including: 1) a reduction in the number of tests required for qualification, 2) an improved understanding of the severity of damage that can occur during service, and 3) an opportunity for optimization of damage tolerance through structural design. Many researchers have proposed a wide variety of methods to address this challenge, e.g. material property degradation schemes [2], strain softening methods [3], progressive failure analysis [4], continuum damage mechanics [5], and finite fracture mechanics [6]. However, no methods are sufficiently fast, simple, and accurate to replace the empirical methods used most commonly [7]. Recently, a progressive damage analysis (PDA) methodology was proposed by the authors for cases of Mode I through-the-thickness damage propagation from a notch in an FRP laminate [8–10], referred to herein as the laminate cohesive approach (LCA). By representing damage propagation in a laminate as the opening of an interface governed by a cohesive law (i.e. traction-separation law), the LCA enables computationally efficient and accurate predictions of damage initiation and propagation
Transcript of COHESIVE LAWS FOR ANALYZING THROUGH-CRACK …

20th International Conference on Composite Materials
Copenhagen, 19-24th July 2015
COHESIVE LAWS FOR ANALYZING THROUGH-CRACK
PROPAGATION IN CROSS PLY LAMINATES
Andrew C. Bergan1 and Carlos G. Dávila2
1Structural Mechanics and Concepts Branch, National Aeronautics and Space Administration
Hampton, VA, USA
Email: [email protected]
2Structural Mechanics and Concepts Branch, National Aeronautics and Space Administration
Hampton, VA, USA
Email: [email protected]
Keywords: Fracture Toughness, R-curve, Cohesive Law, Damage
ABSTRACT
The laminate cohesive approach (LCA) is a methodology for the experimental characterization of
cohesive through-the-thickness damage propagation in fiber-reinforced polymer matrix composites.
LCA has several advantages over other existing approaches for cohesive law characterization,
including: visual measurements of crack length are not required, structural effects are accounted for,
and LCA can be applied when the specimen is too small to achieve steady-state fracture. In this work,
the applicability of this method is investigated for two material systems: IM7/8552, a conventional
prepreg, and AS4/VRM34, a non-crimp fabric cured using an out-of-autoclave process. The compact
tension specimen configuration is used to propagate stable Mode I damage. Trilinear cohesive laws are
characterized using the fracture toughness and the notch tip opening displacement. Test results are
compared for the IM7/8552 specimens with notches machined by waterjet and by wire slurry saw. It is
shown that the test results are nearly identical for both notch tip preparations methods, indicating that
significant specimen preparation time and cost savings can be realized by using the waterjet to notch
the specimen instead of the wire slurry saw. The accuracy of the cohesive laws characterized herein
are assessed by reproducing the structural response of the test specimens using computational
methods. The applicability of the characterization procedure for inferring lamina fracture toughness is
also discussed.
1 INTRODUCTION
Quick and accurate prediction of the tensile notched strength of fiber-reinforced polymer (FRP)
laminates is challenging. It is more difficult still to predict the damage propagation from a notch in an
FRP structure and the resulting stress redistributions that lead to ultimate failure. In practice, semi-
empirical methods that require extensive test data are used to predict notched strength [1] and it is rare
for the progression of damage from a notch to be considered. Yet, a quick and accurate method for
prediction of damage progression in notched structures could yield several benefits, including: 1) a
reduction in the number of tests required for qualification, 2) an improved understanding of the
severity of damage that can occur during service, and 3) an opportunity for optimization of damage
tolerance through structural design. Many researchers have proposed a wide variety of methods to
address this challenge, e.g. material property degradation schemes [2], strain softening methods [3],
progressive failure analysis [4], continuum damage mechanics [5], and finite fracture mechanics [6].
However, no methods are sufficiently fast, simple, and accurate to replace the empirical methods used
most commonly [7].
Recently, a progressive damage analysis (PDA) methodology was proposed by the authors for
cases of Mode I through-the-thickness damage propagation from a notch in an FRP laminate [8–10],
referred to herein as the laminate cohesive approach (LCA). By representing damage propagation in a
laminate as the opening of an interface governed by a cohesive law (i.e. traction-separation law), the
LCA enables computationally efficient and accurate predictions of damage initiation and propagation

Andrew C. Bergan and Carlos G. Dávila
from a notch subjected to Mode I loading [8–10]. The LCA builds upon the strain softening approach
[3], but instead of smearing the damage through a continuum, the approach uses cohesive elements.
The LCA uses cohesive elements available in commercial finite element (FE) codes for simplicity. In
order to apply the LCA, it is necessary to characterize the damage propagation at the laminate level as
a cohesive law.
A variety of experimental methods have been proposed to characterize cohesive laws for through-
the-thickness fracture propagation in FRP laminates, including iterative trial-and-error approaches [3],
R-curve methods [11], and inverse constitutive law methodologies [12]. Trial-and-error methods
determine the parameters that define an assumed cohesive law form by iterating to minimize the error
in load-displacement response between test and analysis. Dopker et al. [3] introduced this approach
and demonstrated that an a priori assumption for the cohesive law as a trilinear form is sufficiently
general to capture the fracture behaviour of through-the-thickness cracks. However, iterative methods
are time consuming to apply, which precludes widespread adoption.
Another class of methods are based on measurement of the fracture toughness as a function of
crack extension (known as the R-curve). Several researchers have attempted to measure R-curves for
through-the-thickness fracture in carbon/epoxy laminates (e.g., [13–15]). The R-curve methods
approximate the cohesive law by introducing a relationship between the fracture process zone length, a
measured R-curve, and the shape of the cohesive law. These methods require experimental
measurement of crack extension or identification of the steady-state fracture process zone length [11],
which are difficult quantities to measure accurately. Furthermore, while a cohesive law is a material
property (independent of the structural response), an R-curve can be affected by the configuration of
the structure [16]. Therefore, cohesive laws derived from R-curves can inherit the same structural
dependence.
In contrast to the aforementioned methods that assume the mathematical form of the cohesive law a
priori, inverse constitutive approaches use digital image correlation (DIC) and an assumed stress state
to determine a material softening law without any a priori assumptions for the form of the softening
law [12]. Material softening laws obtained from this approach can be related to a cohesive law [17].
Interestingly, using the inverse constitutive approach, Zobeiry et al. confirmed that through-the-
thickness fracture behaviour is approximated well by a trilinear form [12]. This conclusion validates
the suggestion made in earlier works [3, 11] that a trilinear cohesive law is sufficiently general for
capturing through-the-thickness fracture behaviour. However, the inverse constitutive methods are
limited to cases where delamination is negligible because these methods assume that surface strains
measured via DIC in the vicinity of the damaged region are constant through-the-thickness of the
laminate. Thus, the trial-and-error, R-curve, and inverse constitutive methods each have limitations
that preclude widespread adoption and standardization for determination of cohesive laws representing
through-the-thickness fracture propagation.
The recently proposed LCA [8] alleviates many of the limitations of the trial-and-error, R-curve,
and inverse constitutive methods. The LCA builds upon the theoretical foundation of the relationship
between the J-integral and the cohesive law proposed by Rice [18] and further investigated by Bao and
Suo [19]. Li et al. pioneered the experimental application for cementitious composites using this
relationship [20] and, later on, Sørensen and Jacobsen applied this approach to determine cohesive
laws for delamination [21]. In both of these early experimental applications, unconventional and
cumbersome test setups were employed, which has limited more widespread use. In previous work [8],
the authors proposed using compact tension (CT) specimens together with DIC for the characterization
of a cohesive law for through-the-thickness fracture. The CT specimen configuration, shown
schematically in Fig. 1, was used because this configuration is a convenient experimental setup for
propagating through-the-thickness damage slowly and stably. Thus far, the LCA has only been applied
to one laminate with a specific stacking sequence and a single carbon/epoxy material system.
Furthermore, the CT specimen preparation procedure was laborious because a wire slurry saw with a
typical cutting speed of 10 mm/hour was used to machine the notch.
The objective of this paper is to further develop the LCA proposed in reference [8] by
investigating: 1) the applicability to cross-ply laminates for characterizing the fiber-direction
toughness of a lamina, 2) the applicability to different material systems, and 3) the effects of notches
machined by waterjet, which is much less time consuming than using a wire slurry saw. The

20th International Conference on Composite Materials
Copenhagen, 19-24th July 2015
extensibility of the LCA to determine lamina fracture toughness for fiber-direction tensile failure is
investigated since many methods for PDA require lamina-level properties. The remainder of the paper
is organized by first reviewing LCA, including the procedure used to determine cohesive laws from
CT tests. Next, the experimental procedure is described. Then, the test results are presented and
discussed, followed by concluding remarks.
x
y
1.1
8W
P
0
P
a0= 0.5W
W
δΔ
Figure 1: Compact tension specimen configuration. The locations for measurement of
displacements Δ and δ are shown with open and closed circles, respectively.
2 DETERMINATION OF COHESIVE LAWS
The characterization procedure used to obtain cohesive laws herein follows the J-integral based
approach proposed in reference [8]. This method relies on the relationship between the fracture
toughness and the cohesive law, σ = σ(δ), derived by integrating Rice’s J-integral for a contour that
encloses a cohesive crack [18]
d
dJ)( (1)
where J is the fracture toughness and σ(δ) is the cohesive law. Since the fracture toughness and notch
tip opening displacement can be determined from experimental measurements, the cohesive law can
be obtained from equation (1).
The fracture toughness is approximated using the modified compliance calibration (MCC) method.
The MCC method computes the fracture toughness using the Irwin-Kies equation
a
C
t
PG
2
2
(2)
where P is the applied load, t is the thickness, C = Δ/P is the specimen compliance where Δ is the
opening displacement measured along the load line, and a is the crack length. In order to evaluate
equation (2), an expression for C = C(a) is required. Following reference [11], it is assumed that
Andrew C. Bergan and Carlos G. Dávila
/1)(
aP
C (3)
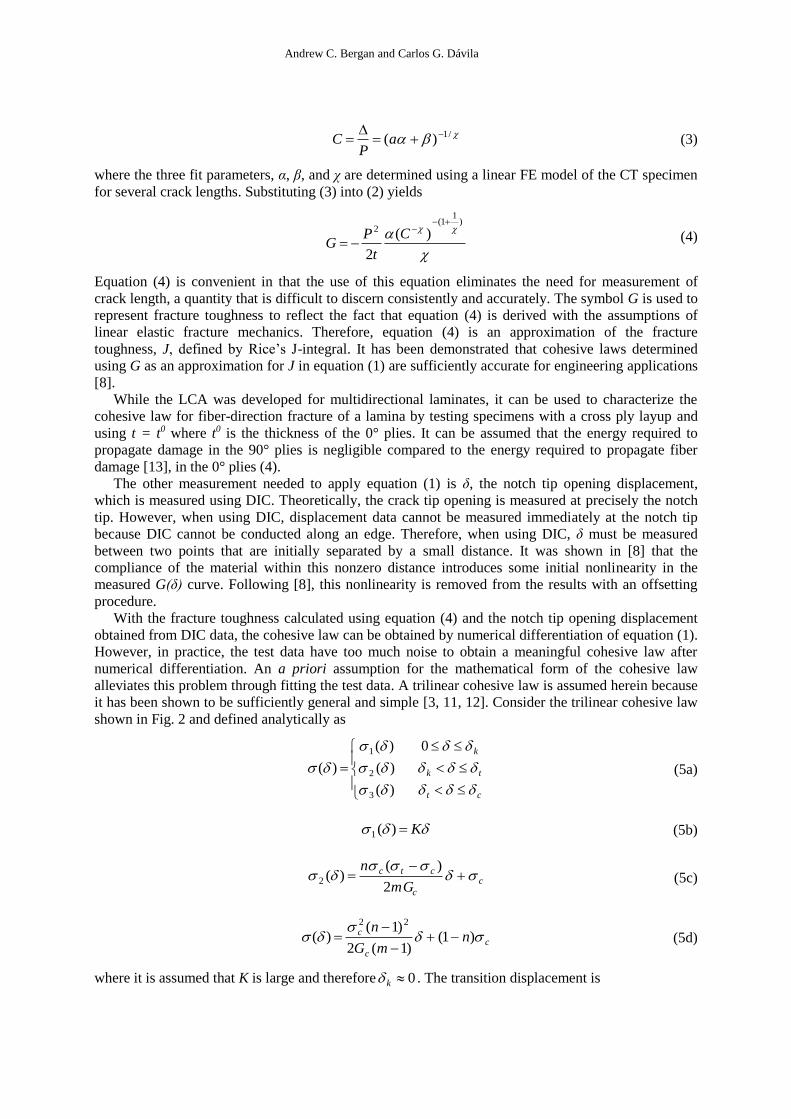
where the three fit parameters, α, β, and χ are determined using a linear FE model of the CT specimen
for several crack lengths. Substituting (3) into (2) yields
)
11(
2 )(
2
C
t
PG (4)
Equation (4) is convenient in that the use of this equation eliminates the need for measurement of
crack length, a quantity that is difficult to discern consistently and accurately. The symbol G is used to
represent fracture toughness to reflect the fact that equation (4) is derived with the assumptions of
linear elastic fracture mechanics. Therefore, equation (4) is an approximation of the fracture
toughness, J, defined by Rice’s J-integral. It has been demonstrated that cohesive laws determined
using G as an approximation for J in equation (1) are sufficiently accurate for engineering applications
[8].
While the LCA was developed for multidirectional laminates, it can be used to characterize the
cohesive law for fiber-direction fracture of a lamina by testing specimens with a cross ply layup and
using t = t0 where t0 is the thickness of the 0° plies. It can be assumed that the energy required to
propagate damage in the 90° plies is negligible compared to the energy required to propagate fiber
damage [13], in the 0° plies (4).
The other measurement needed to apply equation (1) is δ, the notch tip opening displacement,
which is measured using DIC. Theoretically, the crack tip opening is measured at precisely the notch
tip. However, when using DIC, displacement data cannot be measured immediately at the notch tip
because DIC cannot be conducted along an edge. Therefore, when using DIC, δ must be measured
between two points that are initially separated by a small distance. It was shown in [8] that the
compliance of the material within this nonzero distance introduces some initial nonlinearity in the
measured G(δ) curve. Following [8], this nonlinearity is removed from the results with an offsetting
procedure.
With the fracture toughness calculated using equation (4) and the notch tip opening displacement
obtained from DIC data, the cohesive law can be obtained by numerical differentiation of equation (1).
However, in practice, the test data have too much noise to obtain a meaningful cohesive law after
numerical differentiation. An a priori assumption for the mathematical form of the cohesive law
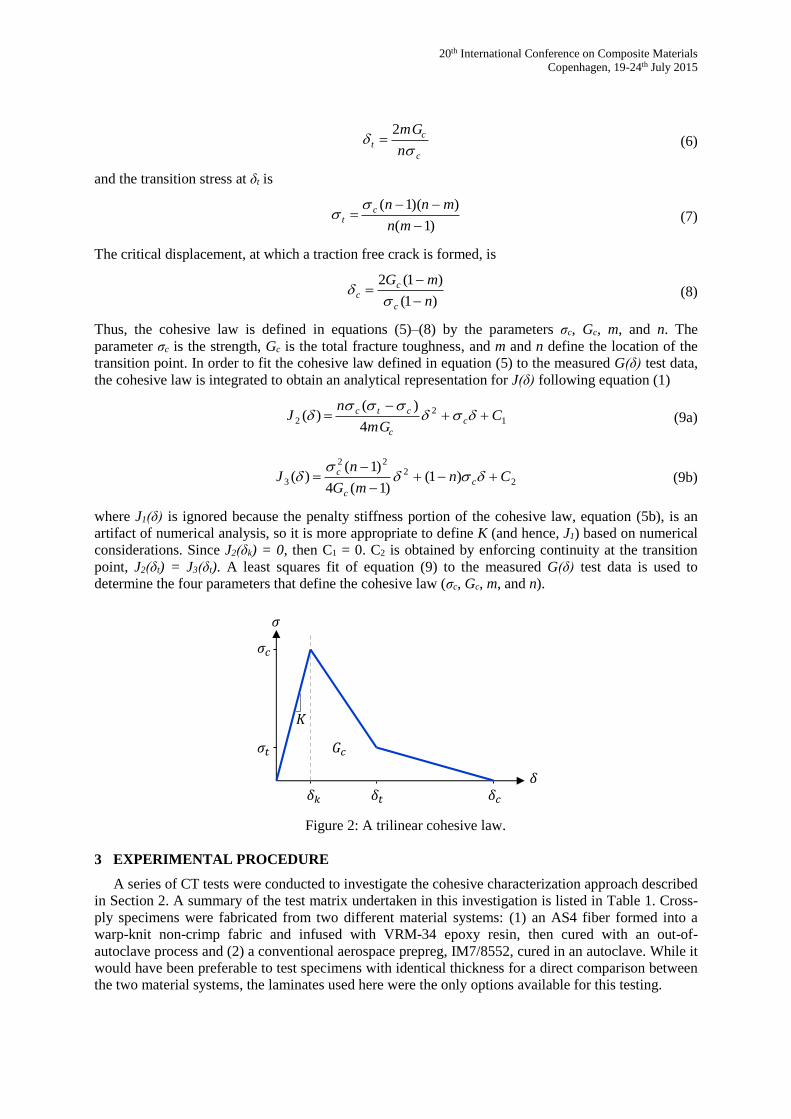
alleviates this problem through fitting the test data. A trilinear cohesive law is assumed herein because
it has been shown to be sufficiently general and simple [3, 11, 12]. Consider the trilinear cohesive law
shown in Fig. 2 and defined analytically as
)(
)(
)(
)(
3
2
1
ct
tk
k
0
(5a)
K)(1 (5b)
c
c
ctc
mG
n
2
)()(2 (5c)
c
c
c nmG
n
)1(
)1(2
)1()(
22
(5d)
where it is assumed that K is large and therefore 0k . The transition displacement is
20th International Conference on Composite Materials
Copenhagen, 19-24th July 2015
c
ct
n
mG
2 (6)
and the transition stress at δt is
)1(
))(1(
mn
mnnct
(7)
The critical displacement, at which a traction free crack is formed, is
)1(
)1(2
n
mG
c
cc
(8)
Thus, the cohesive law is defined in equations (5)–(8) by the parameters σc, Gc, m, and n. The
parameter σc is the strength, Gc is the total fracture toughness, and m and n define the location of the
transition point. In order to fit the cohesive law defined in equation (5) to the measured G(δ) test data,
the cohesive law is integrated to obtain an analytical representation for J(δ) following equation (1)
12
24
)()( C
mG
nJ c
c
ctc
(9a)
22
22
3 )1()1(4
)1()( Cn
mG
nJ c
c
c
(9b)
where J1(δ) is ignored because the penalty stiffness portion of the cohesive law, equation (5b), is an
artifact of numerical analysis, so it is more appropriate to define K (and hence, J1) based on numerical
considerations. Since J2(δk) = 0, then C1 = 0. C2 is obtained by enforcing continuity at the transition
point, J2(δt) = J3(δt). A least squares fit of equation (9) to the measured G(δ) test data is used to
determine the four parameters that define the cohesive law (σc, Gc, m, and n).
Figure 2: A trilinear cohesive law.
3 EXPERIMENTAL PROCEDURE
A series of CT tests were conducted to investigate the cohesive characterization approach described
in Section 2. A summary of the test matrix undertaken in this investigation is listed in Table 1. Cross-
ply specimens were fabricated from two different material systems: (1) an AS4 fiber formed into a
warp-knit non-crimp fabric and infused with VRM-34 epoxy resin, then cured with an out-of-
autoclave process and (2) a conventional aerospace prepreg, IM7/8552, cured in an autoclave. While it
would have been preferable to test specimens with identical thickness for a direct comparison between
the two material systems, the laminates used here were the only options available for this testing.
Andrew C. Bergan and Carlos G. Dávila
Designation Material Layup
Thickness
[mm] Notch machining
AS-WS AS/VRM-34 [90/0]3s 2.5 Wire slurry saw
IM-WS IM7/8552 [90/0]8s 5.7 Wire slurry saw
IM-WJ IM7/8552 [90/0]8s 5.7 Waterjet
Table 1: Summary of test matrix.
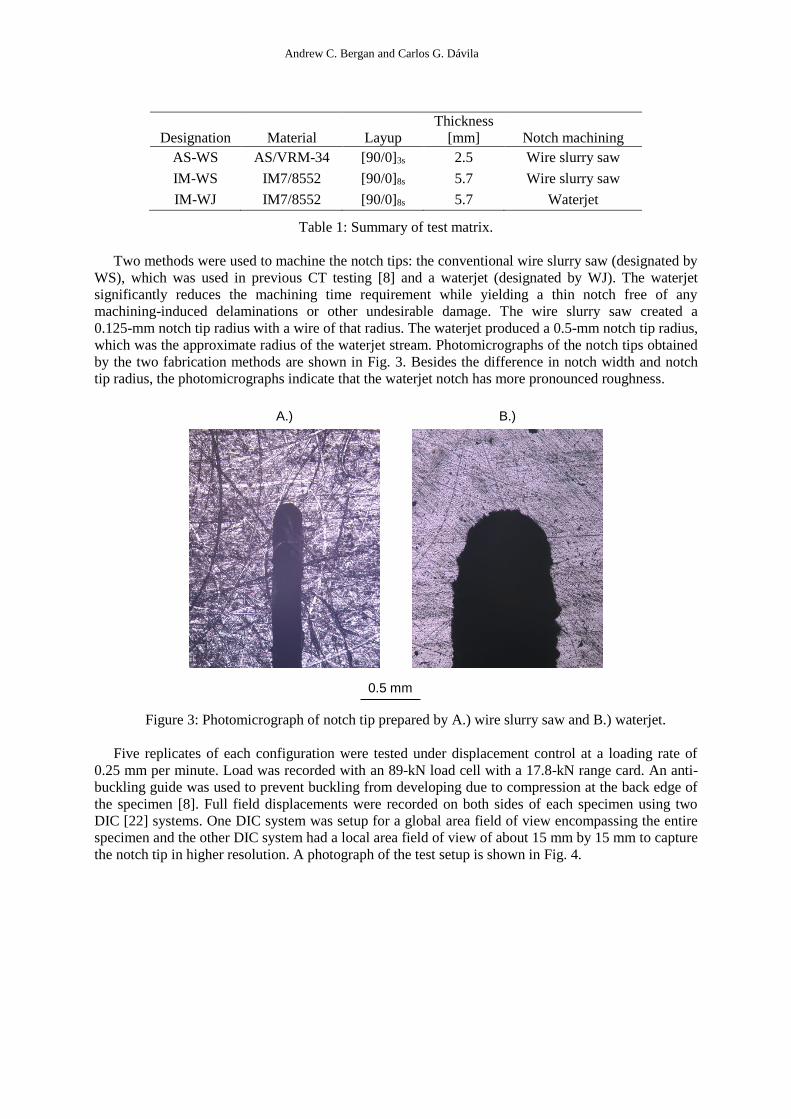
Two methods were used to machine the notch tips: the conventional wire slurry saw (designated by
WS), which was used in previous CT testing [8] and a waterjet (designated by WJ). The waterjet
significantly reduces the machining time requirement while yielding a thin notch free of any
machining-induced delaminations or other undesirable damage. The wire slurry saw created a
0.125-mm notch tip radius with a wire of that radius. The waterjet produced a 0.5-mm notch tip radius,
which was the approximate radius of the waterjet stream. Photomicrographs of the notch tips obtained
by the two fabrication methods are shown in Fig. 3. Besides the difference in notch width and notch
tip radius, the photomicrographs indicate that the waterjet notch has more pronounced roughness.
A.) B.)
0.5 mm
Figure 3: Photomicrograph of notch tip prepared by A.) wire slurry saw and B.) waterjet.
Five replicates of each configuration were tested under displacement control at a loading rate of
0.25 mm per minute. Load was recorded with an 89-kN load cell with a 17.8-kN range card. An anti-
buckling guide was used to prevent buckling from developing due to compression at the back edge of
the specimen [8]. Full field displacements were recorded on both sides of each specimen using two
DIC [22] systems. One DIC system was setup for a global area field of view encompassing the entire
specimen and the other DIC system had a local area field of view of about 15 mm by 15 mm to capture
the notch tip in higher resolution. A photograph of the test setup is shown in Fig. 4.

20th International Conference on Composite Materials
Copenhagen, 19-24th July 2015
Specimen
Global
DIC
Local
DIC
Anti-buckling
guide
Upper clevis
Lower clevis
Figure 4: Test setup showing the test specimen, two DIC systems, and anti-buckling guide.
4 TEST RESULTS AND DISCUSSION
The load-displacement results are shown in Fig. 5. All specimens exhibited three phases in the
load-displacement response. The initial linear phase was followed by a smooth, nonlinear phase.
Visible indications of cracks in the surface ply and evolution of the strain field observed in the local
DIC data suggest that matrix cracking contributes to the measured nonlinearity. The third phase is the
stick-slip damage propagation behavior often observed in composite materials, where the load-
displacement response is jagged. The test data were truncated before compression failure at the back
edge of the specimen occurred because the objective was to characterize tensile failure only.
0
1
2
3
4
0 1 2 3 4 5
P[kN]
Δ [mm]
0
2
4
6
8
10
0 1 2 3 4 5
P[kN]
Δ [mm]
0
2
4
6
8
10
0 1 2 3 4 5
P[kN]
Δ [mm]
A.) B.) C.)
Figure 5: Measured load displacement responses for the A.) AS-WS, B.) IM-WS, and C.) IM-WJ
specimens.
The load-displacement response of the WS and WJ specimens were nearly identical. A minute, but
observable, difference was at the location of the transition from the smooth nonlinear phase to the
stick-slip phase. The first load drop occurred at Δ = 2.1 mm in the WS specimens and Δ = 2.3 mm in
the WJ specimens. This small difference in response could be a result of either the machining process
or the notch tip radius. Laffan et al. [23] studied the effect of the notch tip radius and suggested that a
large notch radius (such as in the WJ) specimens may increase the initiation fracture toughness. Laffan
et al. also reported that the notch tip radius did not affect the propagation fracture toughness, which is
consistent with the results found here.

Andrew C. Bergan and Carlos G. Dávila
The load-displacement results for the IM specimens are compared with test data available in the
literature for the same material system (references [15, 23]), as shown in Fig. 6. Since the specimens
tested in the literature had different ply thicknesses and layups, the load is scaled linearly so that the
total thickness of the 0° plies is identical. The test data from the IM specimens and the data reported
by Catalanotti both show a relatively constant load from the first load drop through the fourth or fifth
load drop. This behavior suggests that the fracture toughness increases as damage develops. In
contrast, the data reported by Laffan indicates that the failure was more brittle, as indicated by a
reduction in the load attained after each subsequent load drop.
Curves of constant fracture toughness, obtained by rearranging equation (4), are also shown for
three values of toughness. One curve of constant fracture toughness is shown in Fig. 6 for the
propagation value of G = 147 N/mm reported by Laffan et al. [23] (Catalanotti et al. [15] found a
similar value for propagation of 133 N/mm). A second curve of constant fracture toughness, G = 300
N/mm, corresponds to the peak load in the Catalanotti test data. The third constant fracture toughness
curve corresponds to the largest toughness found in the IM test data, G = 580 N/mm. If the test data
were characterized by a constant fracture toughness, the highest load recorded at each load drop would
lie on the line of constant toughness. The peak load at the second load drop (Δ = 1.6 mm) and third
load drop (Δ = 1.9 mm) in the Laffan data agree well with a constant fracture toughness of G = 147
N/mm. At subsequent load drops, the test data lie below and to the left of the constant toughness
curve, which suggests that the fracture toughness has reduced. Similarly, the Catalanotti data show that
for Δ > 2.6 mm the test data correspond to a reduced toughness. One reason why the test data may
show a reduction in toughness is the initiation of additional damage modes. In the IM tests,
catastrophic failure occurred due to compression at the back edge of the specimen and the load-
displacement data dropped well below the G = 580 N/mm curve. The data shown in Fig. 6 for the IM
tests are truncated before this load drop due to compression failure because the objective here is to
characterize the behavior of Mode I fiber-direction tensile fracture. The compression failure is an
undesirable experimental reality of the CT configuration.
0.0
2.0
4.0
6.0
8.0
10.0
0.0 0.5 1.0 1.5 2.0 2.5 3.0 3.5 4.0 4.5 5.0
P[kN]
Δ [mm]
G = 147 N/mm
G = 580 N/mm
IM
G = 300 N/mm
Catalanotti
Laffan
Figure 6: Load-displacement data for IM7/8552 specimens with curves of constant fracture
toughness.
There is a large range in the propagation fracture toughness exhibited by each set of test data,
despite all specimens having the same material and cross-ply layups. One explanation for the
difference in propagation toughness is the blunting effect of matrix splits [24]. This argument is
corroborated by the difference in layup and ply thicknesses in the three sets of test data. Laffan et al.
used a [(90/0)890]s layup with a ply thickness of 0.125 mm. Catalanotti et al. used a [90/0]8s such that
the central ply was twice the nominal ply thickness of 0.131 mm. In the IM specimens, the layup was

20th International Conference on Composite Materials
Copenhagen, 19-24th July 2015
the same as Catalanotti with a ply thickness of 0.178 mm. Thus, larger ply thickness correlates with a
higher propagation fracture toughness, which can be attributed to more matrix splits developing in
thicker plies as a result of the in-situ effect as noted in [14, 25]. Furthermore, the specimens with the
double thick central 0° ply had a significant increase in toughness as damage propagated, in contrast to
specimens with a central 90° ply. These observations suggest that the measured toughness for damage
propagation in cross-ply CT specimens depends strongly on the ply thickness and layup.
The fracture toughness computed from equation (4) is plotted as grey lines in Fig. 7 as a function of
the notch tip opening displacement, δ. The black line shows the fit of equation (9) to the test data. It is
observed that a very good curve fit is obtained for both material systems. The corresponding values of
σc, Gc, m, and n for both material systems are shown in Table 2.
Designation
σc
[MPa]
Gc
[N/mm] m n
AS 1508.0 349.3 0.1361 0.5529
IM 1812.2 564.0 0.2941 0.6464
Table 2: Cohesive law parameters obtained from fitting experimental G(δ) curve.
0
100
200
300
400
500
600
700
0.0 0.2 0.4 0.6 0.8 1.0 1.2
G[N/mm]
δ [mm]
A.) B.)
0
100
200
300
400
500
600
700
0.0 0.2 0.4 0.6 0.8 1.0 1.2
G[N/mm]
δ [mm]
Figure 7: Measured fracture toughness fitted using equation (9) for the A.) AS4/VRM-34 and B.)
IM7/8552 specimens.
A FE model was developed for the CT specimen to assess the accuracy of the cohesive laws
characterized herein. The model was developed in Abaqus [26] using four node, two-dimensional,
plane strain elements and a row of cohesive elements ahead of the notch tip. The elastic properties
used in the model are summarized in Table 3. The models used the trilinear cohesive laws defined
by the parameters in Table 2. Since the thickness of the 0° plies was used to compute the fracture
toughness, the cohesive elements were modeled as having the thickness of the 0° plies.
Material Reference
E1
[GPa]
E2
[GPa]
G12
[GPa] ν12
AS4/VRM-34 [9] 122 14.9 5.52 0.25
IM7/8552 [27] 162 8.96 4.69 0.31
Table 3: Elastic properties for each material system.

Andrew C. Bergan and Carlos G. Dávila
The FE results are compared with the test data in Fig. 8. The agreement between the FE results and
test results for the AS4/VRM-34 specimens is very good. The agreement between the FE results and
test results for the IM7/8552 specimens is acceptable, but not as good as for the AS4/VRM-34
specimens. The analysis peak load overestimates the test data by 13%. One source for the discrepancy
between test and analysis could be a result of more widespread matrix cracking in the 90° plies of the
IM7/8552 specimens than in the AS4/VRM-34 specimens. Post-test X-ray computed tomography
scans shown in Fig. 9 indicate that a series of parallel matrix cracks occurred in the IM7/8552
specimens, above and below the notch tip. It is possible that these matrix cracks changed the
compliance of the specimens and thus affected the calculated fracture toughness. Further investigation
is needed to understand the role of the parallel matrix cracks.
0
1
2
3
4
0 1 2 3 4 5
P[kN]
Δ [mm]
0
2
4
6
8
10
0 1 2 3 4 5
P[kN]
Δ [mm]
FE
FE
Test data
Test data
A.) B.)
Figure 8: Comparison between test results and FE analysis results for the A.) AS4/VRM-34 and B.)
IM7/8552 specimens.
A.) B.)
Figure 9: The characteristic damage state in a 90° ply for one specimen of each type:
A.) AS4/VRM-34 and B.) IM7/8552.
20th International Conference on Composite Materials
Copenhagen, 19-24th July 2015
5 CONCLUDING REMARKS
The applicability of the laminate cohesive approach (LCA) was investigated and assessed for two
material systems, AS4/VRM-34 and IM7/8552. Cross-ply compact tension (CT) specimens were
fabricated and tested. Half of the IM7/8552 specimens were notched using a wire slurry and the
remainder were notched using a waterjet, which was several times faster than using the wire slurry saw
reducing fabrication costs. The load-displacement and fracture toughness results were nearly identical
for both notch fabrication methods. Test results for the IM7/8552 specimens were compared to test
data available in the literature, and the effects of ply thickness and layup were shown to have a strong
effect on the measured fracture toughness. Based on this comparative study, the fracture toughness
determined in the cross-ply CT tests depends on the laminate configuration and care should be
exercised when interpreting fracture toughness as a lamina property. Cohesive laws were characterized
using LCA with the test data from the AS4/VRM-34 and IM7/8552 specimens. FE models with these
cohesive laws characterized herein were generally well correlated with test data. However, the
correlation for the AS4/VRM-34 specimens was notably better than for the IM7/8552 specimens.
Further investigation is needed to understand the reasons for the overestimate of peak load for the
IM7/8552 specimens.
REFERENCES
[1] “CMH-17, Materials Usage, Design and Analysis,” in Composite Materials Handbook, vol. 2,
Rev G, Philadelphia, PA: SAE, 2011.
[2] F.-K. Chang and K.-Y. Chang, A progressive damage model for laminated composites
containing stress concentrations, Journal of Composite Materials, 21, Sep. 1987, pp. 834–855
(doi: 10.1177/002199838702100904).
[3] B. Dopker, D. P. Murphy, L. B. Ilcewicz, and T. Walker, Damage tolerance analysis of
composite transport fuselage structure, presented at the AIAA/ASME/ASCE/AHS/ASC
Structures, Structural Dynamics and Materials Conference, 1994, vol. 2, pp. 803–810.
[4] C. G. Dávila, D. R. Ambur, and D. M. McGowan, Analytical prediction of damage growth in
notched composite panels loaded in compression, Journal of Aircraft, 37, 2000 (doi:
10.2514/2.2688).
[5] S. T. Pinho, L. Iannucci, and P. Robinson, Physically-based failure models and criteria for
laminated fibre-reinforced composites with emphasis on fibre kinking: Part I: Development,
Composites Part A: Applied Science and Manufacturing, 37, 2006, pp. 63–73, (doi:
10.1016/j.compositesa.2005.04.016)
[6] A. Arteiro, G. Catalanotti, J. Xavier, and P. P. Camanho, Notched response of non-crimp fabric
thin-ply laminates, Composite Science and Technology, 79, 2013, pp. 97–114, (doi:
10.1016/j.compscitech.2013.02.001).
[7] C. A. Rose, C. G. Dávila, and F. A. Leone, Analysis methods for progressive damage of
composite structures, Hampton, VA, NASA/TM–2013-218024, 2013.
[8] A. C. Bergan, C. G. Dávila, F. A. Leone, J. Awerbuch, and T. M. Tan, Mode I cohesive law
characterization of through-crack propagation in a multidirectional laminate, presented at the
American Society for Composites 29th Technical Conference, La Jolla, CA, 2014.
[9] A. C. Bergan, Test and Analysis of Stitched Composite Structures to Assess Damage
Containment Capability, PhD Thesis, Drexel University, Philadelphia, PA, 2014.
[10] A. C. Bergan, C. G. Dávila, F. A. Leone, J. Awerbuch, and T.-M. Tan, An analysis methodology
to predict damage propagation in notched composite fuselage structures, presented at the
SAMPE Baltimore, Baltimore, MD, 2015.
[11] C. G. Dávila, C. A. Rose, and P. P. Camanho, A procedure for superposing linear cohesive laws
to represent multiple damage mechanisms in the fracture of composites, International Journal of
Fracture, 158, 2009, pp. 211–223, (doi: 10.1007/s10704-009-9366-z).
[12] N. Zobeiry, R. Vaziri, and A. Poursartip, Characterization of strain-softening behavior and
failure mechanisms of composites under tension and compression, Composites Part A: Applied
Science and Manufacturing, 68, 2015, pp. 29–41, (10.1016/j.compositesa.2014.09.009).

Andrew C. Bergan and Carlos G. Dávila
[13] S. T. Pinho, P. Robinson, and L. Iannucci, Fracture toughness of the tensile and compressive
fibre failure modes in laminated composites, Composites Science and Technology, 66, 2006, pp.
2069–2079, (doi: 10.1016/j.compscitech.2005.12.023).
[14] M. J. Laffan, S. T. Pinho, P. Robinson, and A. J. McMillan, Translaminar fracture toughness
testing of composites: A review, Polymer Testing, 31, 2012, pp. 481–489, (doi:
10.1016/j.polymertesting.2012.01.002).
[15] G. Catalanotti, P. P. Camanho, J. Xavier, C. G. Dávila, and A. T. Marques, Measurement of
resistance curves in the longitudinal failure of composites using digital image correlation,
Composites Science and Technology, 70, 2010, pp. 1986–1993, (doi:
10.1016/j.compscitech.2010.07.022).
[16] R. Gutkin, M. L. Laffan, S. T. Pinho, P. Robinson, and P. T. Curtis, Modelling the R-curve effect
and its specimen-dependence, International Journal of Solids and Structures, 48, 2011, pp.
1767–1777, (doi: 10.1016/j.ijsolstr.2011.02.025).
[17] J. Oliver, A. E. Huespe, M. D. G. Pulido, and E. Chaves, From continuum mechanics to fracture
mechanics: the strong discontinuity approach, Engineering Fracture Mechanics, 69, 2002, pp.
113–136, (doi: 10.1016/S0013-7944(01)00060-1).
[18] J. R. Rice, A path independent integral and the approximate analysis of strain concentration by
notches and cracks, Journal of Applied Mechanics, 35, 1968, pp. 379–386.
[19] G. Bao and Z. Suo, Remarks on crack-bridging concepts, Applied Mechanics Reviews, 45, 1992,
pp. 355–366, (doi: 10.1115/1.3119764).
[20] V. C. Li, C.-M. Chan, and C. K. Y. Leung, Experimental determination of the tension-softening
relations for cementitious composites, Cement and Concrete Research, 17, 1987, pp. 441–452,
(doi: 10.1016/0008-8846(87)90008-1).
[21] B. F. Sørensen and T. K. Jacobsen, Large-scale bridging in composites: R-curves and bridging
laws, Composites Part A: Applied Science and Manufacturing, 29, 1998, pp. 1443–1451, (doi:
10.1016/S1359-835X(98)00025-6).
[22] VIC-3D, Software package. Columbia, SC: Correlated Solutions Inc., 2010.
[23] M. J. Laffan, S. T. Pinho, P. Robinson, and A. J. McMillan, Translaminar fracture toughness:
The critical notch tip radius of 0° plies in CFRP, Composite Science and Technology, 72, 2011,
pp. 97–102, (doi: 10.1016/j.compscitech.2011.10.006).
[24] C. G. Dávila, Advances and new applications for softening laws in composites, presented at the
MatComp, Algeciras, 2013.
[25] S. T. Pinho, C. G. Dávila, P. P. Camanho, L. Iannucci, and P. Robinson, Failure models and
criteria for FRP under in-plane or three-dimensional stress states including shear non-linearity,
NASA/TM-2005-213530, 2005.
[26] ABAQUS Online Documentation: Version 6.14. Providence, RI: Dassault Systèmes Simulia
Corporation, 2014.
[27] E. Clarkson, “Hexcel 8552 IM7 Unidirectional Prepreg 190 gsm & 35% RC Qualification
Statistical Analysis,” NCP-RP-2009-028, Jun. 2011.