Coherent pan–Asian climatic and isotopic responsepolissar/OrgGeochem/battisti-et-al-2014... ·...
66
JOURNAL OF GEOPHYSICAL RESEARCH, VOL. ???, XXXX, DOI:10.1029/, Coherent pan–Asian climatic and isotopic response 1 to orbital forcing of tropical insolation 2 D.S. Battisti, 1 Qinghua Ding, 1 and G.H. Roe 2 Corresponding author: David S. Battisti, Dept. of Atmospheric Sciences,University of Wash- ington, Seattle WA 98195-1640. ([email protected]) 1 Dept. of Atmospheric Sciences,University of Washington, Seattle WA 98195-1640 2 Dept. of Earth and Planetary Science,University of Washington, Seattle WA 98195-1310 DRAFT August 6, 2014, 4:44pm DRAFT
Transcript of Coherent pan–Asian climatic and isotopic responsepolissar/OrgGeochem/battisti-et-al-2014... ·...
JOURNAL OF GEOPHYSICAL RESEARCH, VOL. ???, XXXX, DOI:10.1029/,
Coherent pan–Asian climatic and isotopic response1
to orbital forcing of tropical insolation2
D.S. Battisti,1
Qinghua Ding,1
and G.H. Roe2
Corresponding author: David S. Battisti, Dept. of Atmospheric Sciences,University of Wash-
ington, Seattle WA 98195-1640. ([email protected])
1Dept. of Atmospheric Sciences,University
of Washington, Seattle WA 98195-1640
2Dept. of Earth and Planetary
Science,University of Washington, Seattle
WA 98195-1310
D R A F T August 6, 2014, 4:44pm D R A F T

X - 2 BATTISTI ET AL.: THE PAN-ASIAN MONSOON
Abstract. The oxygen-18 isotope composition of calcite in stalagmites3
across southern and eastern Asia are highly correlated to one another on or-4
bital time scales: large negative excursions are coincident with maxima in5
summer insolation in the subtropics of the northern hemisphere (NH). These6
isotopic excursions reflect changes in the precipitation-weighted isotopic com-7
position of precipitation, δ18Op. We present results from two core experiments8
using an isotope-enabled climate model – the“high insolation” and “low in-9
solation” experiments – in which the model is forced by extrema in NH sum-10
mer insolation. Compared to the low-insolation experiment, the high-insolation11
climate features profound, large-scale changes in the pattern of monsoon pre-12
cipitation spanning from Africa to Southeast Asia that are due to changes13
in the relative contributions of temperature and moisture to the near-surface14
equivalent potential temperature θe. Under high insolation, a more rapid in-15
crease in land surface temperature in early summer causes the greatest θe16
(and hence precipitation) to shift from the oceans in low insolation (such as17
today) to be over land in high insolation (such as the early Holocene). The18
model captures the general pattern of isotopic excursions seen in caves span-19
ning from Israel to western China, including large drops in δ18Op over east-20
ern Tibet (-7‰), the Arabian Peninsula and northeast Africa (-4‰). Al-21
though there are large changes in precipitation over Tibet, the change in δ18Op is22
due to changes in the δ18O of water vapor that is delivered and subsequently23
precipitated; it does not inform on local precipitation amount or intensity.24
D R A F T August 6, 2014, 4:44pm D R A F T
BATTISTI ET AL.: THE PAN-ASIAN MONSOON X - 3
1. Introduction
There have been remarkable improvements in the proxy records of climate from25
speleothems – in particular, the oxygen isotope composition of calcite in stalagmites, here-26
after δ18Oc. The development of techniques for accurate, high-resolution dating based on27
the radioactive decay of uranium to its daughter products affords exceptional chronolog-28
ical control approaching an accuracy of 500 years per 100,000 years [e.g., Cheng et al.,29
2012]. By patching together records from numerous samples from a single cave that are30
well-dated, numerous proxy records of the δ18Oc have been constructed that span hun-31
dreds of thousands of years, albeit with gaps. The exceptionally accurate chronology,32
combined with the length of these speleothem records allow an unprecedented window of33
how the climate has changed on millennial and longer time scales.34
Here we focus on the climate response to insolation forcing for several reasons. First,35
numerous long records are available across Asia and South America to reasonably define36
the amplitude of insolation-forced response in the speleothems. Second, these records37
show a coherent pan-Asian signal in δ18Oc on orbital time scales, and have an amplitude38
(2 to 7 ‰) that is two or three times that associated with millennial scale changes in39
δ18Oc (1 to 2 ‰), and two to seven times that associated with the interannual variability40
of the (precipitation weighted) isotopic composition of precipitation (1 ‰) [Dayem et al.,41
2010].42
The δ18Oc in stalagmites from caves that meet certain criteria [Schwarcz , 2007] reflects
the isotopic composition of water from which the calcite forms. Since the source of this
water is ultimately precipitation that slowly percolates through the soil to the cave site,
D R A F T August 6, 2014, 4:44pm D R A F T
X - 4 BATTISTI ET AL.: THE PAN-ASIAN MONSOON
the δ18Oc in speleothems can be directly related to the climatological oxygen isotopic
composition of precipitation:
δ18O ≡{
Cs−1
18O16O
− 1
}× 1000, (1)
where 18O and 16O are the amount of isotopes of oxygen delivered by precipitation over a
time interval that is equal to or greater than the time it takes for the water to percolate
from the surface to the cave site and the calcite to form. Cs is value of the Vienna
Standard Mean Ocean Water (SMOW): 2.00520 × 10⁻³. We can approximate Equation
1 by
δ18O ∼=∑
m δ18Om · Pm∑m Pm
≡ δ18Op, (2)
where δ18Om is the δ18O for the month m (i.e., Equation 1 applied to month m) and Pm43
is the total precipitation for month m. δ18Op is defined as the precipitation-weighted44
δ18O of precipitation; to within O(Cs) ≈ 0.2%, δ18Op is an accurate approximation to45
the climatological δ18O, equation 1 (see Appendix A). δ18Op will prove to be useful for46
illuminating the relative importance of changes in the seasonality of precipitation and47
changes in the isotopic composition of precipitation to the changes in the climatological48
δ18O and in the speleothem δ18Oc.49
We show in Figure 1 the time history of δ18Oc from speleothems available from Asia50
that are sufficiently long to resolve orbital time scales. These records are (from top to51
bottom) from Hulu and Sanbao caves in eastern and central China, Tianmen Cave in52
Tibet, Kesang Cave in northwestern China, and Soreq and Peqiin Caves in Israel1; details53
on the location and source for each cave record are provided in Section 2.1 and Table54
1. Superposed on each record is the June-August (JJA) insolation at 30◦N. It is evident55
in Figure 1 that the δ18Oc in these stalagmites is strongly forced by insolation – lighter56
D R A F T August 6, 2014, 4:44pm D R A F T
BATTISTI ET AL.: THE PAN-ASIAN MONSOON X - 5
(more negative) values of δ18Oc are associated with greater insolation in the northern57
hemisphere (NH) summer. Evident in Figure 1 is a ∼20 kyr pacing of the cycles; this58
implicates a strong seasonal control on δ18Oc, predominately associated with climatic59
precession.60
One measure of the fit is the correlation between insolation and the δ18Oc, the latter61
being interpolated to a regular (1000 year) increment. The correlations range from -0.3762
at Soreq/Peqiin to -0.75 at Kesang; taking into account the auto correlation in the inter-63
polated data, correlations are statistically different from zero at p < 0.05 for all records64
except Sofular in Turkey. Finally, the δ18Oc from stalagmites in Hoti cave in Oman65
and Mukalla Cave in Yemen is also strongly paced by insolation forcing; in these cases,66
however, there is sufficient precipitation to grow stalagmites only during high NH sum-67
mer insolation. Hence a correlation coefficient between the δ18Oc from these caves and68
insolation is not informative.69
Equally remarkable is the amplitude of this orbitally-driven signal. To make a rough70
estimate, we linearly regressed δ18Oc against insolation. Since not all of the cave records71
are continuous, to make a direct comparison, we then multiplied the regression coefficient72
for each record by the difference in JJA insolation, 218 kbp minus 207 kbp: the high and73
low extrema in JJA insolation over the past 950,000 years. The results are summarized in74
Table 1. The peak-to-peak amplitude ranges from 1.6 ‰ in Israel to 7 ‰ in Tianmen.75
At Hoti and Mukalla, the δ18Oc in the stalagmites that form during high NH summer76
insolation is at least 4 ‰ lighter than the δ18Op measured in precipitation today. The full77
range in amplitude at Tianmen, Hoti and Mukalla is uncertain because the speleothems do78
not grow during periods of low (Tianmen) or even moderate (Hoti and Mukalla) summer79
D R A F T August 6, 2014, 4:44pm D R A F T
X - 6 BATTISTI ET AL.: THE PAN-ASIAN MONSOON
insolation. The δ18Oc in Sofular cave in Turkey [Fleitmann et al., 2009] is uncorrelated80
with insolation and tracks ice volume over the past 50 kyr; we will revisit this record and81
the Hoti and Mukalla records in Section 5.2.82
In summary, the speleothem records paint a picture of orbitally paced changes in83
δ18Oc that in turn suggest changes in the hydrologic cycle that are remarkable in both ex-84
tent (> 8000km) and amplitude (> 7 ‰). As a reference point, the typical de-correlation85
length scale associated with interannual precipitation anomalies in the modern climate is86
typically < 500km, and the amplitude of the δ18Op anomalies is typically < 1‰ (see,87
e.g. Dayem et al. [2010]).88
Although speleothem δ18Oc is a direct measure of δ18Op, δ18Op by itself cannot be89
directly or uniquely used to infer changes in precipitation. For example, changes in the90
seasonal cycle of precipitation, even without changes in the annual mean precipitation,91
often lead to changes in δ18Op because in many places there is a large seasonal cycle92
in the δ18O of precipitation; similarly changes in the pathways and/or the condensa-93
tion/evaporation cycling of water vapor enroute to a site where the precipitation occurs94
will also change δ18Op without necessarily changing the seasonal cycle of precipitation.95
Hence, interpretation of the δ18Oc data from the speleothems requires the use of a climate96
model that explicitly simulates the time history of the water isotopes H216O and H2
18O.97
In this study, we employ an atmospheric general circulation model (AGCM) with an em-98
bedded scheme for water isotopes and couple it to a 50m slab ocean to examine the impact99
of the insolation forcing on the tropical climate. We perform two core simulations that100
represent the extremes in the insolation over the past 950,000 years. We first document101
the simulated differences in the δ18Op and climate, and compare them to the differences102
D R A F T August 6, 2014, 4:44pm D R A F T
BATTISTI ET AL.: THE PAN-ASIAN MONSOON X - 7
in the δ18Oc from the speleothems (section 3). We then analyze the model isotope data103
to discern the reasons for the changes in the δ18Oc, and examine the dynamics associated104
with the simulated climate changes (section 4). We will show that the model captures105
the gross pattern and amplitude of the orbital signal seen in the caves across Asia. These106
isotopic changes reflect a fundamental change in the balance of processes that combine to107
set the maximum near-surface equivalent potential temperature θe (which determines the108
location of monsoon precipitation) during times of high summertime insolation compared109
to low insolation (such as in today’s climate). In section 5.1 we compare and discuss our110
model precipitation and isotopic results to those previously published. In sections 5.2, 5.3111
and 5.4, we further discuss the observed speleothem records and compare our model re-112
sults with other proxy data that inform on the climate changes associated with insolation113
forcing. Section 6 contains a summary.114
2. The Data, the Climate Model and the Core Experiments
2.1. The Data
The speleothem data are taken from the NOAA National Climate Data Center (NCDC)115
for Paleoclimatology (www.ncdc.noaa.gov/paleo/paleo.html). The original references for116
the data are indicated in Table 1. The NCDC data contribution numbers are as follows:117
Soreq and Peqiin #2003-061; Hulu #2004-023; Sanbao #2009-127; Kesang #2012-006;118
Tianmen #2010-110; and Sofular #2009-132. The Hoti and Mukalla records show punc-119
tuated periods of growth, and age uncertainties in these records preclude using these data120
past 82 kbp and 129 kbp, respectively. Data for Hoti were not available in digital form.121
The insolation calculations are from Huybers [2006].122
D R A F T August 6, 2014, 4:44pm D R A F T
X - 8 BATTISTI ET AL.: THE PAN-ASIAN MONSOON
2.2. The Climate Model
We employ the ECHAM4.6 AGCM [Roeckner et al., 1996] with a module for water123
isotopes [Hoffmann and Heinmann, 1997; Hoffmann et al., 1998; Werner et al., 2001]. The124
model is run at T42 (about 250km) resolution and is coupled to a slab ocean. The model125
is first run with modern-day insolation and modern-day boundary conditions: 360ppm126
CO2, and modern-day continental geometry, orography and ice sheets. A cyclo-stationary127
climatological heat flux (“q-flux”) is added to the slab ocean to take into account the128
heat flux convergence due to unresolved ocean dynamics and errors in the model’s surface129
energy balance. All of the experiments are run for at least 40 years, with output from the130
last 30 years used to construct climatologies and climatological differences. All differences131
discussed in this paper are statistically significant at p = 0.05 or better.132
The model, when forced by modern-day insolation (the Modern-Day experiment), pro-133
duces seasonal cycles in temperature, precipitation and circulation that agree well with134
observations. We compare the precipitation simulated by the coupled model with modern-135
day boundary conditions with that observed (for northeastern Africa and Tibet, see also136
Figure 9). Figure 2 shows the JJA climatological precipitation from (a) the ECHAM4.6137
model forced by modern-day geometry and insolation and (b) from observations. Figure 3138
is the same as Figure 2, but for DJF. Overall, the model does quite well at simulating the139
modern-day seasonal cycle of precipitation – particularly over tropical South America, all140
of Africa and over land and ocean in the northern half of the Indian Ocean sector. Model141
biases include too much (little) precipitation in the Atlantic Intertropical Convergence142
Zone (ITCZ) in JJA (DJF), too much precipitation in the southern Indian Ocean, and143
too much precipitation just north of the equator in the western Pacific.144
D R A F T August 6, 2014, 4:44pm D R A F T
BATTISTI ET AL.: THE PAN-ASIAN MONSOON X - 9
2.3. The Core Experiments
Two core experiments are performed that represent the extremes in the northern hemi-145
sphere summertime insolation over the past 950,000 years; i.e., they represent NH summers146
at perihelion and aphelion when eccentricity is large (within < 0.1%, the obliquity pa-147
rameter is unchanged in the two core experiments). We will refer to these experiments148
with the interchangeable labels “high-insolation”,“high phase”, or ”218 kbp” for the first149
experiment, and “low-insolation”, “low phase” or ”207 kbp” for the second experiment.150
In the high-insolation experiment, we force the model with insolation from 218 kbp, which151
features an extreme maximum NH JJA insolation. In the low-insolation experiment, we152
forced the model with insolation from 207 kbp, the time of extreme minimum in NH153
JJA insolation (see, e.g., Figure 1). In both experiments we used modern-day bound-154
ary conditions. The difference in the insolation incident at the top of the atmosphere is155
shown in Figure 4: differences in the NH summer are in excess of +70 W/m2. Additional156
experiments were also performed, and will be discussed when appropriate.157
It is useful to point out that in the NH, the JJA difference maps “high- minus low-158
insolation” (i.e., “218 minus 207 kbp insolation”) shown in Figures 5, 8, and 12 can also159
be roughly interpreted as the difference between times of high insolation compared to160
the modern climate. This is because in the NH the JJA insolation at 207 kbp is similar161
to today (see Figure 4). Hence, it is not surprising that the NH summertime climate162
simulated by the model forced by low-insolation (207 kbp experiment) is very similar163
to that from the modern experiment. This is illustrated by the difference map for JJA164
precipitation in the low-insolation and Modern-Day experiments, shown in Figure A1(a).165
D R A F T August 6, 2014, 4:44pm D R A F T

X - 10 BATTISTI ET AL.: THE PAN-ASIAN MONSOON
3. Results from the Core Experiments
Figure 5 shows the difference in JJA surface temperature and precipitation due to the166
difference in insolation, “218 kbp minus 207 kbp”. As expected, temperatures in the167
midlatitude continental regions of the NH are up to 9◦C greater in the high insolation168
experiment. There are remarkable and fundamental changes in the location of wet regions169
in the tropics that signal a shift in the balance of processes that contribute to the near-170
surface equivalent potential temperature (discussed in Section 4.2) that underpins the171
location of monsoonal precipitation. Precipitation increases by more than 5 mm/day in a172
band extending from central sub-Sahara Africa, to across the Arabian Peninsula and into173
northern India; decreases of more than 5 mm/day extend across southeast Asia and over174
the Bay of Bengal (see also Figure 8(a)). In effect, the heavy monsoon precipitation has175
shifted from over southeast Asia in the low-insolation experiment (and from where it is176
today; see Figures 2 and A2) to be over the land regions in northern India and northeastern177
Africa. Precipitation across the tropical northern Atlantic Ocean has decreased from 12178
mm/day in the low-insolation/modern experiments, to 6 mm/day in the high-insolation179
experiment (see also Figure A2). The enhanced precipitation center in northeast Africa180
is associated with a strengthening of the easterly winds along the equator in the Indian181
Ocean and into the northwest Indian Ocean (Figure 8(a)), while the northward extension182
and the enhancement of precipitation over the Sahel causes a switch from weak easterly183
winds to westerly winds along in the Sahel and a collapse of the equatorial Trade Winds184
across the Atlantic (Figures 5(b), 8(a) and A2).185
Figure 6 shows the difference in DJF temperature and precipitation. Cooling in the186
subtropical NH is a direct response to low-insolation (see Figure 4). Despite the similar187
D R A F T August 6, 2014, 4:44pm D R A F T
BATTISTI ET AL.: THE PAN-ASIAN MONSOON X - 11
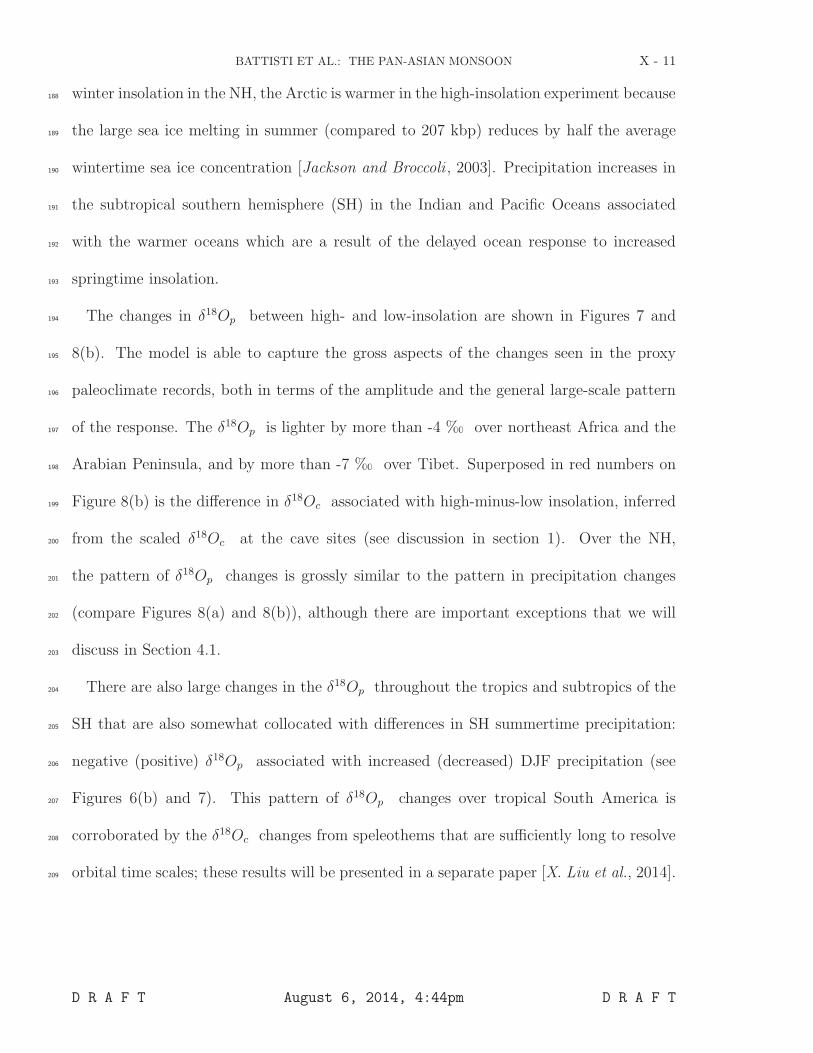
winter insolation in the NH, the Arctic is warmer in the high-insolation experiment because188
the large sea ice melting in summer (compared to 207 kbp) reduces by half the average189
wintertime sea ice concentration [Jackson and Broccoli , 2003]. Precipitation increases in190
the subtropical southern hemisphere (SH) in the Indian and Pacific Oceans associated191
with the warmer oceans which are a result of the delayed ocean response to increased192
springtime insolation.193
The changes in δ18Op between high- and low-insolation are shown in Figures 7 and194
8(b). The model is able to capture the gross aspects of the changes seen in the proxy195
paleoclimate records, both in terms of the amplitude and the general large-scale pattern196
of the response. The δ18Op is lighter by more than -4 ‰ over northeast Africa and the197
Arabian Peninsula, and by more than -7 ‰ over Tibet. Superposed in red numbers on198
Figure 8(b) is the difference in δ18Oc associated with high-minus-low insolation, inferred199
from the scaled δ18Oc at the cave sites (see discussion in section 1). Over the NH,200
the pattern of δ18Op changes is grossly similar to the pattern in precipitation changes201
(compare Figures 8(a) and 8(b)), although there are important exceptions that we will202
discuss in Section 4.1.203
There are also large changes in the δ18Op throughout the tropics and subtropics of the204
SH that are also somewhat collocated with differences in SH summertime precipitation:205
negative (positive) δ18Op associated with increased (decreased) DJF precipitation (see206
Figures 6(b) and 7). This pattern of δ18Op changes over tropical South America is207
corroborated by the δ18Oc changes from speleothems that are sufficiently long to resolve208
orbital time scales; these results will be presented in a separate paper [X. Liu et al., 2014].209
D R A F T August 6, 2014, 4:44pm D R A F T

X - 12 BATTISTI ET AL.: THE PAN-ASIAN MONSOON
4. Analysis
In this section, we present analyses to illuminate the causes of the δ18Oc changes in the210
speleothems, and of the changes in the patterns of precipitation and monsoon dynamics.211
4.1. Isotopes and Precipitation
The two ‘centers of action’ in the simulated pattern of the δ18Op changes over Tibet
and northeast Africa are corroborated by the δ18Oc from the stalagmites (see Figure
8(b)). Figure 9 verifies that the model reproduces the modern observed annual cycle
in precipitation (see also section 4.3), and hence we can use its output to explore the
causes of the simulated 218 kbp minus 207 kbp (or high- minus low-insolation) changes
in δ18Op in both these regions. We do this by modifying the calculation of δ18Op for the
218 kbp case by selectively including or removing the changes in P and δ18O from specific
seasons. For example, to isolate the impact of changes in δ18Op due to just the changes
in precipitation during the monsoon months (June to September, or JJAS) precipitation,
we calculate:δ18Op(218 JJAS precip) − δ18Op(207) =∑
m δ18Om,207 · Pm∑m Pm
−∑
m δ18Om,207 · Pm,207∑m Pm,207
(3)
where Pm contains the non-monsoon months (Oct - May) precipitation from the low-212
insolation experiment and the monthly precipitation from the monsoon months of the213
high-insolation experiment. Results are summarized in Table 2.214
Averaged over Tibet (26-32.5◦N, 85-95◦E) and northeast Africa (12-21◦N, 25-45◦E), the215
difference in δ18Op due to high-minus-low-insolation is -6.28 ‰ and -3.73 ‰, respectively.216
For both regions, the differences are mainly due to monsoon-season differences (compare217
values in the middle column of Table 2). And of the two variables that contribute to the218
D R A F T August 6, 2014, 4:44pm D R A F T
BATTISTI ET AL.: THE PAN-ASIAN MONSOON X - 13
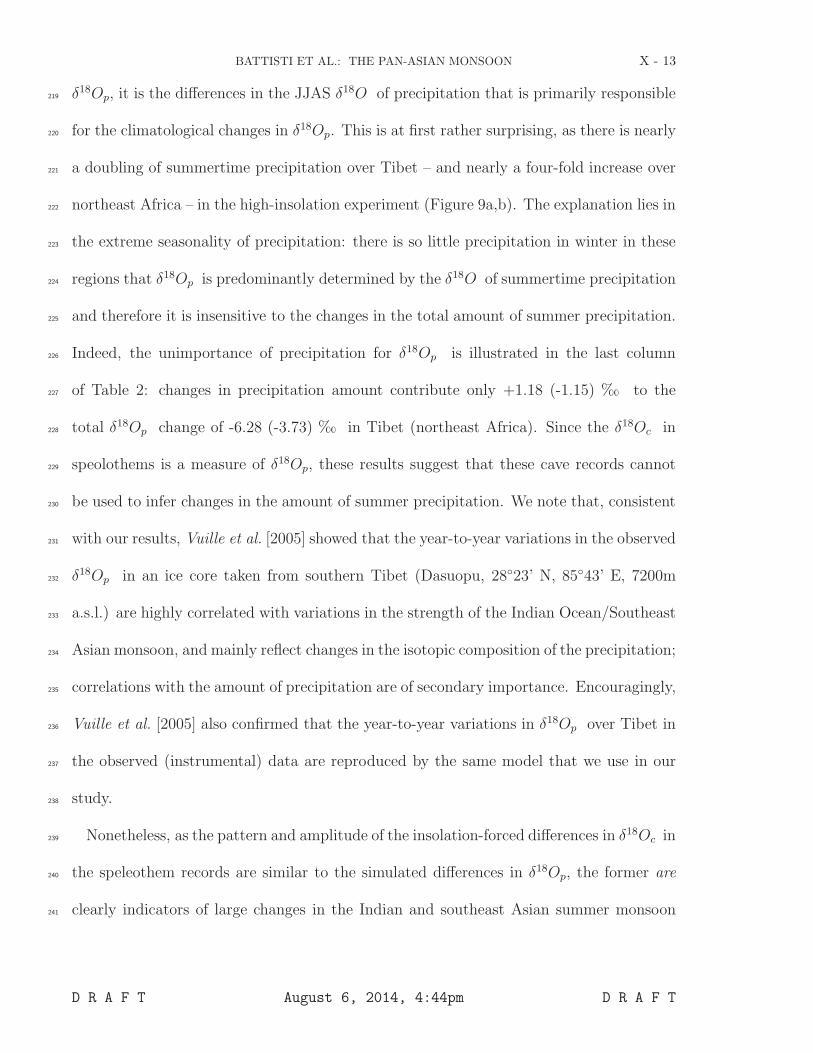
δ18Op, it is the differences in the JJAS δ18O of precipitation that is primarily responsible219
for the climatological changes in δ18Op. This is at first rather surprising, as there is nearly220
a doubling of summertime precipitation over Tibet – and nearly a four-fold increase over221
northeast Africa – in the high-insolation experiment (Figure 9a,b). The explanation lies in222
the extreme seasonality of precipitation: there is so little precipitation in winter in these223
regions that δ18Op is predominantly determined by the δ18O of summertime precipitation224
and therefore it is insensitive to the changes in the total amount of summer precipitation.225
Indeed, the unimportance of precipitation for δ18Op is illustrated in the last column226
of Table 2: changes in precipitation amount contribute only +1.18 (-1.15) ‰ to the227
total δ18Op change of -6.28 (-3.73) ‰ in Tibet (northeast Africa). Since the δ18Oc in228
speolothems is a measure of δ18Op, these results suggest that these cave records cannot229
be used to infer changes in the amount of summer precipitation. We note that, consistent230
with our results, Vuille et al. [2005] showed that the year-to-year variations in the observed231
δ18Op in an ice core taken from southern Tibet (Dasuopu, 28◦23’ N, 85◦43’ E, 7200m232
a.s.l.) are highly correlated with variations in the strength of the Indian Ocean/Southeast233
Asian monsoon, and mainly reflect changes in the isotopic composition of the precipitation;234
correlations with the amount of precipitation are of secondary importance. Encouragingly,235
Vuille et al. [2005] also confirmed that the year-to-year variations in δ18Op over Tibet in236
the observed (instrumental) data are reproduced by the same model that we use in our237
study.238
Nonetheless, as the pattern and amplitude of the insolation-forced differences in δ18Oc in239
the speleothem records are similar to the simulated differences in δ18Op, the former are240
clearly indicators of large changes in the Indian and southeast Asian summer monsoon241
D R A F T August 6, 2014, 4:44pm D R A F T
X - 14 BATTISTI ET AL.: THE PAN-ASIAN MONSOON
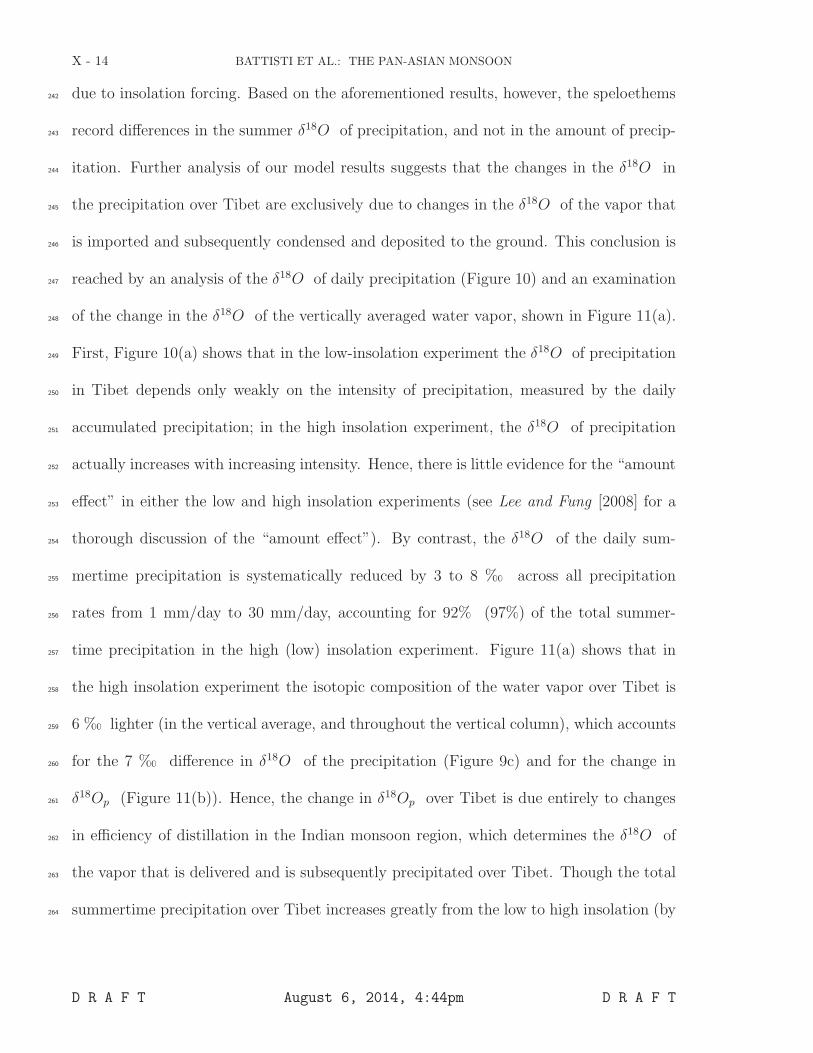
due to insolation forcing. Based on the aforementioned results, however, the speloethems242
record differences in the summer δ18O of precipitation, and not in the amount of precip-243
itation. Further analysis of our model results suggests that the changes in the δ18O in244
the precipitation over Tibet are exclusively due to changes in the δ18O of the vapor that245
is imported and subsequently condensed and deposited to the ground. This conclusion is246
reached by an analysis of the δ18O of daily precipitation (Figure 10) and an examination247
of the change in the δ18O of the vertically averaged water vapor, shown in Figure 11(a).248
First, Figure 10(a) shows that in the low-insolation experiment the δ18O of precipitation249
in Tibet depends only weakly on the intensity of precipitation, measured by the daily250
accumulated precipitation; in the high insolation experiment, the δ18O of precipitation251
actually increases with increasing intensity. Hence, there is little evidence for the “amount252
effect” in either the low and high insolation experiments (see Lee and Fung [2008] for a253
thorough discussion of the “amount effect”). By contrast, the δ18O of the daily sum-254
mertime precipitation is systematically reduced by 3 to 8 ‰ across all precipitation255
rates from 1 mm/day to 30 mm/day, accounting for 92% (97%) of the total summer-256
time precipitation in the high (low) insolation experiment. Figure 11(a) shows that in257
the high insolation experiment the isotopic composition of the water vapor over Tibet is258
6 ‰ lighter (in the vertical average, and throughout the vertical column), which accounts259
for the 7 ‰ difference in δ18O of the precipitation (Figure 9c) and for the change in260
δ18Op (Figure 11(b)). Hence, the change in δ18Op over Tibet is due entirely to changes261
in efficiency of distillation in the Indian monsoon region, which determines the δ18O of262
the vapor that is delivered and is subsequently precipitated over Tibet. Though the total263
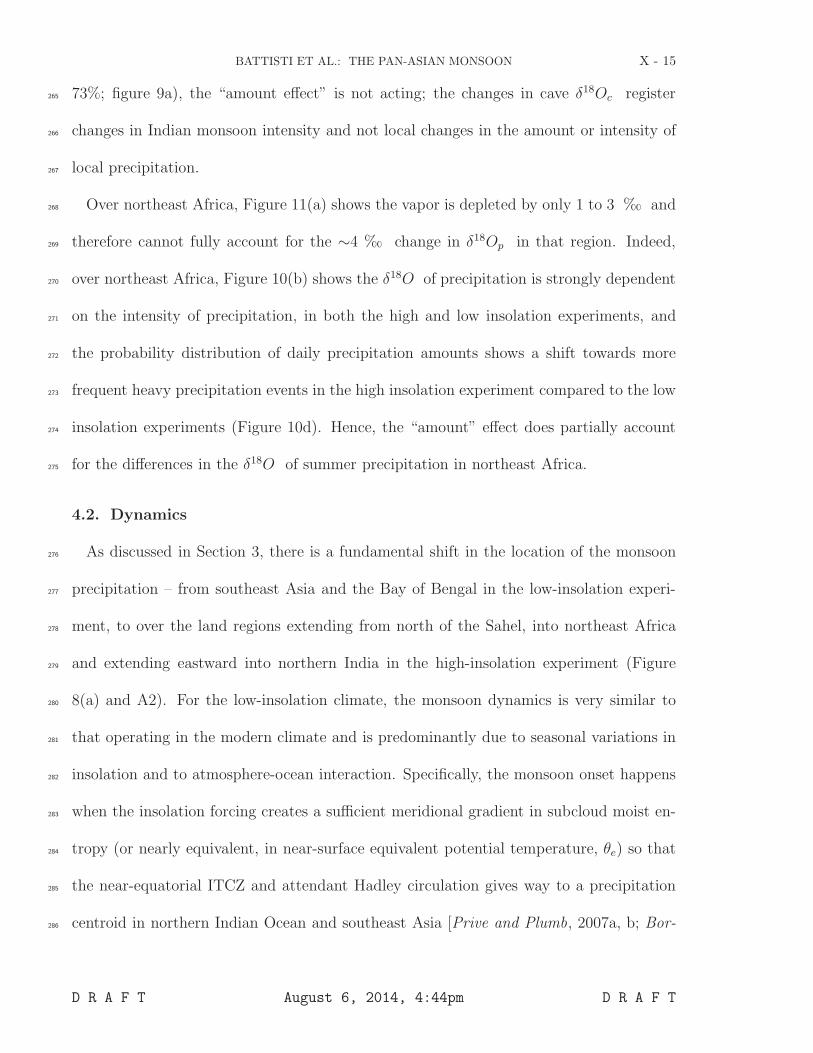
summertime precipitation over Tibet increases greatly from the low to high insolation (by264
D R A F T August 6, 2014, 4:44pm D R A F T
BATTISTI ET AL.: THE PAN-ASIAN MONSOON X - 15
73%; figure 9a), the “amount effect” is not acting; the changes in cave δ18Oc register265
changes in Indian monsoon intensity and not local changes in the amount or intensity of266
local precipitation.267
Over northeast Africa, Figure 11(a) shows the vapor is depleted by only 1 to 3 ‰ and268
therefore cannot fully account for the ∼4 ‰ change in δ18Op in that region. Indeed,269
over northeast Africa, Figure 10(b) shows the δ18O of precipitation is strongly dependent270
on the intensity of precipitation, in both the high and low insolation experiments, and271
the probability distribution of daily precipitation amounts shows a shift towards more272
frequent heavy precipitation events in the high insolation experiment compared to the low273
insolation experiments (Figure 10d). Hence, the “amount” effect does partially account274
for the differences in the δ18O of summer precipitation in northeast Africa.275
4.2. Dynamics
As discussed in Section 3, there is a fundamental shift in the location of the monsoon276
precipitation – from southeast Asia and the Bay of Bengal in the low-insolation experi-277
ment, to over the land regions extending from north of the Sahel, into northeast Africa278
and extending eastward into northern India in the high-insolation experiment (Figure279
8(a) and A2). For the low-insolation climate, the monsoon dynamics is very similar to280
that operating in the modern climate and is predominantly due to seasonal variations in281
insolation and to atmosphere-ocean interaction. Specifically, the monsoon onset happens282
when the insolation forcing creates a sufficient meridional gradient in subcloud moist en-283
tropy (or nearly equivalent, in near-surface equivalent potential temperature, θe) so that284
the near-equatorial ITCZ and attendant Hadley circulation gives way to a precipitation285
centroid in northern Indian Ocean and southeast Asia [Prive and Plumb, 2007a, b; Bor-286
D R A F T August 6, 2014, 4:44pm D R A F T

X - 16 BATTISTI ET AL.: THE PAN-ASIAN MONSOON
doni and Schneider , 2008; Boos and Kuang , 2010]. Once off the equator, the location287
of precipitation is predominantly set by the location of the maximum near-surface θe288
[Prive and Plumb, 2007a, b]. In observations (Figure 12(a)) and in our model forced by289
modern-day and 207 kbp insolation (not shown) these maxima are in the Bay of Bengal290
and throughout southeast Asia. For an overview of the modern thermodynamical view of291
the monsoon system, see Molnar et al. [2010] and references therein.292
The same physics operates in the high phase of the insolation cycle. An important293
difference, however, is that in the high phase the rate of change of the insolation forcing is294
much greater than in the low phase (see e.g., Figure 4). As such, the early summer near-295
surface temperature increases over land much faster than over ocean due to the greatly296
different thermal inertia of land and ocean. Hence, the land-ocean temperature difference297
is amplified – so much so that the maximum in near-surface θe immediately preceding the298
onset of the summer monsoon is shifts from over the ocean to over the land. Specifically,299
it is shifted from the ocean regions in the Bay of Bengal and the NW Indian Ocean in the300
low-insolation and Modern-Day experiments (and in the observations), to be over the land301
regions of northern India and northeast Africa in the high-insolation experiment where it302
remains throughout the monsoon season (cf, Figures 12(b) and 12(c)).303
4.3. Additional Experiments
Although the basic physics responsible for the land-centric monsoon precipitation in304
the high-insolation case are similar to those acting to set the ocean-centric monsoon pre-305
cipitation in the low-insolation case and in the modern climate, there is at least one306
notable difference. In the modern climate, convective heating over the northern Bay of307
Bengal gives rise to a westward propagating Rossby disturbance that causes cold air ad-308
D R A F T August 6, 2014, 4:44pm D R A F T

BATTISTI ET AL.: THE PAN-ASIAN MONSOON X - 17
vection aloft and to the west of the convection that is balanced by subsidence, which309
helps to suppress summer precipitation [Rodwell and Hoskins , 1996] and renders the east-310
ern Mediterranean a desert where the atmosphere looses net energy to space in summer;311
this same physics is operating in the low-insolation experiment (see Figure 13).312
We performed an additional experiment with ECHAM4.6 AGCM whereby the model313
was forced by the low-insolation and an external, localized convective heat source added314
over northern India to mimic the heating in the high-insolation experiment: otherwise,315
the experiment was identical to the low-insolation experiment. The results showed that316
precipitation was reduced by about half over southeast Asia (consistent with that in the317
218 kbp experiment, Figure 8(b)), but the subsidence over the eastern Mediterranean was318
a very small fraction of that observed; Liu and Hoskins obtained a similar results using319
a different AGCM (B.J. Hoskins, pers. comm., 2011). Thus, although the insolation320
forcing in the high-insolation experiment appears to be sufficient to cause the maximum321
in θe to be over land, the displacement of the precipitation center from the Bay of Bengal322
to be over northern India greatly attenuates the desertification mechanism of Rodwell323
and Hoskins [1996]. The movement of heavy precipitation from ocean to land and the324
accompanying high cloud cover turn northeast Africa and the Arabian Peninsula from a325
net sink of energy in the low-insolation and Modern-Day experiments, to a net source326
of energy in the high-insolation experiment (see Figure 13); a similar result was found327
by Braconnot et al. [2008] in their 126 kbp experiment (which features an increase of328
62.2 Wm−2 in net absorbed summer insolation compared to present day).329
The only major difference between the simulated δ18Op and observed δ18Oc that is330
difficult to reconcile is in east central China, where the simulated orbital signal is ∼ 1 ‰331
D R A F T August 6, 2014, 4:44pm D R A F T

X - 18 BATTISTI ET AL.: THE PAN-ASIAN MONSOON
but the observed change is ∼ 3.8 ‰. We ruled out model resolution as an explanation for332
the weak model response, by repeating the two core experiments (207 kbp and 218 kbp)333
at higher resolution (T106, ∼ 120 km). All of the insolation forced changes in climate334
and isotopic composition discussed in our paper are reproduced using the high-resolution335
experiments. We revisit the discrepancy between simulated and observed δ18Op in eastern336
China in Section 5.4.337
The dominant local insolation signal in the tropical records we have focused on sug-338
gest δ18Op in these regions is relatively insensitive to the presence of the ice sheets or339
to glacial – interglacial swings in the concentration of atmospheric carbon dioxide. To340
evaluate this in the model, we re-ran the core experiments with high- (218 kbp) and low-341
(207 kbp) insolation, only replacing the modern-day boundary conditions with (i) the342
LGM continental geometry and orography, including the ice sheets (ICE5G reconstruc-343
tion, [Peltier , 2004]), (ii) 200 ppm CO2, and (iii) with both LGM orography and 200 ppm344
CO2. In all three cases, the response to insolation forcing extremes in the tropics and sub-345
tropics was virtually identical to results presented in this paper, which used modern-day346
geometry and 360 ppm CO2. These results will be presented elsewhere [Roe et al., 2014],347
as they are useful for interpreting the climatological significance of isotopic records from348
the tropics and extratropics during the Pleistocene.349
5. Discussion
5.1. Comparison with other model results
5.1.1. Precipitation350
The pattern of changes in δ18Op and precipitation in our experiments differs from those351
seen in the pioneering experiments of the impact of the insolation forcing on the monsoons352
D R A F T August 6, 2014, 4:44pm D R A F T

BATTISTI ET AL.: THE PAN-ASIAN MONSOON X - 19
by Prell and Kutzbach [1987], Prell and Kutzbach [1992] and Jouzel et al. [2000], partic-353
ularly throughout southeastern and eastern Asia and over the Indian Ocean. Prell and354
Kutzbach [1987] and Prell and Kutzbach [1992] used early variants of the NCAR Commu-355
nity Climate Model to examine the difference in climate for two periods of high minus low356
summer insolation: mid-Holocene (6 kbp) minus modern, and 126 kbp minus 115 kbp.357
They find that compared to today, times of high insolation feature centers of increased358
precipitation (+2mm/day) over SE Asia and Sahel, whereas our model features centers of359
increased precipitation (> 5 mm/day) in NE Africa and northern India, and a center of360
decreased precipitation (< -5 mm/day) over SE Asia. Jouzel et al. [2000] examined the361
changes in annual δ18Op associated with the mid-Holocene (6 kbp) and modern climate362
simulated by the NASA/GISS AGCM and in the same version of the ECHAM AGCM363
that we used in this study. Unlike our results, the GISS model simulated an incoherent364
pattern of δ18Op change associated with the mid-Holocene to present insolation change,365
with no change in the vicinity of the Indian Ocean basin, while ECHAM model simulated366
depletion in the mid-Holocene over central Africa and along the equator in the Indian367
Ocean (over Tibet and eastern China, the change in δ18Op in the ECHAM model is368
similar to our results). Although the choices for times of high and low insolation that369
are contrasted in those studies differ from the ones we examine, the most likely explana-370
tion for the discrepancies in the results presented in these early studies and our results371
is that the earlier studies used uncoupled AGCMs forced by prescribed, modern-day sea372
surface temperatures, so precipitation is strongly constrained and precludes the coupled373
atmosphere-ocean thermodynamics that is now understood to underlie the modern-day374
Indian monsoon (see discussion and references in section 4.2). In addition, the AGCMs375
D R A F T August 6, 2014, 4:44pm D R A F T
X - 20 BATTISTI ET AL.: THE PAN-ASIAN MONSOON
used in the pioneering studies by Prell and Kutzbach [1987] and Prell and Kutzbach [1992]376
have low horizontal resolution that does not adequately isolate the Indian Ocean from the377
continental regions to the north (see Boos and Kuang [2010] for how the Himalaya act as378
a wall that helps to intensify the Indian monsoon by keeping dry continental air out of379
the Indian Ocean basin).380
There have been two model intercomparison projects whereby the impact of changes381
in insolation between the present day and mid-Holocene (6 kbp) have been examined:382
Paleoclimate Modeling Intercomparison Project phase 1 and 2 (PMIP-1 and PMIP-2).383
The experimental setup in PMIP-1 also used fixed modern-day sea surface temperature384
(SST) for the mid-Holocene experiments [Joussaume et al., 1999]. Nonetheless, most385
models showed an increase in precipitation over northern India and, not surprising, an386
increase in precipitation in the Sahel [Braconnot et al., 2002; Zhao and Harrison, 2012]387
although the increase in northern Africa was not sufficient to explain the reconstructed388
vegetation [Kohfeld and Harrison, 2000]. Grossly similar results are obtained over the389
Sahel by Prell and Kutzbach [1987] in their fixed SST AGCM experiments force by high390
and low insolation (126 and 115 kbp insolation, respectively), although due to the low391
resolution used in their experiments, a comparison between their results and those from392
PIMP-1 or our results is not meaningful.393
The second phase of the Paleoclimate Modeling Intercomparison Project (PMIP-2)394
performed the same mid-Holocene experiment as in PMIP-1, but used a different set of395
AGCMs and included coupling to ocean models. In general, the pattern of precipitation396
changes in the mid-Holocene compared to modern-day (high-minus-low insolation phases)397
found in the PMIP-2 experiments is similar to that from our high and low insolation398
D R A F T August 6, 2014, 4:44pm D R A F T

BATTISTI ET AL.: THE PAN-ASIAN MONSOON X - 21
experiments. A notable difference between the PMIP-2 and PMIP-1 simulations is an399
amplification in the increase in the precipitation across the Sahel and in northeast Africa400
in the mid-Holocene that is attributed to interactions between the atmosphere and ocean401
[Braconnot et al., 2007; Zhao and Harrison, 2012] (see also Liu et al. [2003] and Hewitt and402
Mitchell [1998]). From the figures in Braconnot et al. [2007] and Zhao and Harrison [2012],403
it appears that the amplitude of the precipitation changes over the Sahel, northeast Africa404
and in the Indian Ocean in the PMIP-2 experiments is roughly one-quarter of that seen405
in our high- minus low-insolation experiments – which implies a roughly linear response406
to the amplitude in the insolation forcing (the difference in 30◦N JJA insolation 218 kbp407
minus 207 kbp is 72.5 Wm−2, while the difference between 6 kyr and today is 22.2 Wm−2).408
Analysis of experiments we performed using insolation every 1 kyr between 195 kbp and409
218 kbp also suggest a nearly linear response in monsoon precipitation to changes in JJA410
insolation (see section 5.4).411
Liu et al. [2003] performed time slice experiments for various times during the Holocene412
using FOAM, a low resolution coupled climate model, while Braconnot et al. [2008] per-413
formed simulations for various times during the Holocene and the Eemian (the last inter-414
glacial period) using the ISPL−CM4 coupled atmosphere-ocean model. In both of these415
models, precipitation over equatorial Africa and India scales roughly linearly with summer416
NH insolation, with an amplitude that compares favorably to what is found in our model.417
The pattern of summer precipitation changes in these two models is somewhat similar418
to that from our model: precipitation increases (decreases) in northern India (southeast419
Asia) when summer insolation is increased. However, in both the FOAM and ISPL−CM4420
models, the changes in precipitation over Africa are confined to the Sahel and equatorial421
D R A F T August 6, 2014, 4:44pm D R A F T
X - 22 BATTISTI ET AL.: THE PAN-ASIAN MONSOON
east Africa; they do not extend farther northward or into the central Arabian Peninsula422
(c.f. Figure 3 in Braconnot et al. [2008] and Figure 5c in Liu et al. [2003] with our Figure423
5). For a further discussion of how coupling affects the response of the monsoon to inso-424
lation forcing in FOAM and the ISPL−CM4 model, see Liu et al. [2003] and Marzin and425
Braconnot [2009a, b].426
Finally, we note that Merlis et al. [2013] performed experiments to evaluate the impact427
of insolation forcing on the Hadley circulation and zonally averaged precipitation using a428
simplified atmosphere model coupled to a slab ocean with a prescribed q-flux and with a429
zonally uniform continent in the subtropics of one hemisphere (say, the NH). Their results430
are at odds with our model results, vis-a-vis changes in the zonally averaged precipitation431
and the strength of the Hadley circulation – both in the seasonal and annual average.432
Two likely reasons for the differences are (i) cloud radiative feedbacks which are included433
in the ECHAM model, and (ii) east-west asymmetries in land the distribution in the NH;434
both are fundamental to the changes in the monsoon circulation in our experiments, but435
are excluded in the idealized model/ experiments.436
5.1.2. Isotopic composition of precipitation437
Schmidt et al. [2007] perform simulations of the modern-day and the mid-Holocene438
climate with the GISS Model E-R coupled climate model and show patterns of summer439
precipitation and δ18Op change that are roughly similar to those found in our model,440
although precipitation changes in their simulations are greatest in western equatorial441
Africa and the anomalies in δ18Op extend throughout the bulk of northern Africa whereas442
our model shows changes mainly in northeastern Africa2. Similarly, LeGrande and Schmidt443
[2009] perform time-slice experiments spanning the Holocene with same coupled model444
D R A F T August 6, 2014, 4:44pm D R A F T
BATTISTI ET AL.: THE PAN-ASIAN MONSOON X - 23
(GISS Model E-R) and show that the increase in δ18Oc in speleothems in India and China445
throughout the Holocene is consistent with the simulated increases in δ18Op. Their results446
compare favorably to ours: a ∼ 1‰ in δ18Op associated with a 27 Wm−2 decrease in447
summer insolation over the Holocene; over India, the δ18Op reflects the intensity of local448
monsoon precipitation; and poleward of the Indian Ocean, the δ18Op mainly reflects the449
δ18O of precipitation and is not correlated with local precipitation amount.450
Liu et al. [2014] performed time-slice experiments (snapshots) every 1kyr from 21 kbp451
to present using a low-resolution (T31) version of the isotope-enabled NCAR Community452
Atmosphere Model, version 3 (CAM3). Each snapshot was forced by 50 years of SST and453
sea ice taken from a continuous integration of the fully coupled CCSM, forced by the his-454
tory of atmospheric CO2, orbital changes in insolation, prescribed ice sheet evolution, and455
prescribed fresh water fluxes into the ocean. In eastern China, the simulated δ18Op closely456
follows summer insolation and the effect of changing ice volume on ocean δ18O. In eastern457
China, their central result is similar to ours: local precipitation is maximum during high458
insolation (the early Holocene) and a minimum during low insolation (21 kbp and late459
Holocene), and although the local δ18Op is out of phase with precipitation in southeastern460
China, they too find that δ18Op in eastern China predominately registers changes in the461
strength of the Indian Ocean monsoon.462
Finally, Herold and Lohmann [2009] used the same AGCM model as we do and com-463
pared the climate and isotopic composition of precipitation over Africa and central Asia464
during a time of high summer insolation (124 kbp, during the Eemian) with a time of465
relatively low insolation (the modern climate). This represents a difference in summer in-466
solation of ∼ 44.4 Wm−2 – twice that of the difference between mid-Holocene and today,467
D R A F T August 6, 2014, 4:44pm D R A F T
X - 24 BATTISTI ET AL.: THE PAN-ASIAN MONSOON
and about two-thirds the difference between 218 kbp and 207 kbp. Although their exper-468
iments are uncoupled, they prescribe SST boundary conditions that are taken from the469
output of a coupled model (though without an isotope module) forced by the 124 kbp and470
modern-day insolation forcing, respectively. Encouragingly, the pattern of the changes in471
δ18Op and summer precipitation they report are very similar to those we have found, and472
the amplitude of the response scales roughly linearly with the change in summer insola-473
tion (compare their Figures 3a and 9b with our Figure 7). Consistent with our findings,474
they also find that precipitation in northeast Africa increases when summer insolation is475
high mainly due to eastward advection of vapor originating from the tropical Atlantic (see476
their Figures 2a and 3a).477
5.2. Comparison of our model results with the speleothem data
In this section, we compare the changes in δ18Op simulated by our model to the am-478
plitude of δ18Oc changes recorded in the long spelothems listed in Table 1 and shown in479
Figure 8(b); a discussion of the results for the Hulu/Sanbao site is deferred to section 5.4.480
The amplitude of the orbital signal in δ18Op simulated by our model is in good agree-481
ment with the speleothem δ18Oc records from Israel (Peqiin/Soreq), Oman (Hoti), Yemen482
(Mukulla), Turkey (Solufar), and from Tibet (Tianmen). Bar-Matthews [2003] and Bar-483
Matthews et al. [1997, 2000] present the Peqiin and Soreq cave records, respectively, and484
note that the negative excursions of δ18Op are coincident with the high summertime485
insolation, and indicate enhanced annual mean precipitation. Our model simulates a486
84% increase in the annual average precipitation at 218 kbp compared with 207 kbp,487
while Bar-Matthews [2003] estimate a maximum insolation increase of 70% above modern488
precipitation during marine isotope stage 5, based on the observed relationship between489
D R A F T August 6, 2014, 4:44pm D R A F T
BATTISTI ET AL.: THE PAN-ASIAN MONSOON X - 25
δ18Op and precipitation, and inferred changes in vegetation from the δ13C excursions in490
the speleothems.491
Burns et al. [1998] found stalagmites in Hoti Cave in Oman that grew in the early492
Holocene and during the last interglacial. They argued that the lighter δ18Oc in these493
stalagmites (compared to modern-day δ18Op) indicates increased wetness in the Arabian494
Peninsula during interglacial conditions. We note, however, that both periods of stalag-495
mite growth are also coincident with periods of high summertime insolation. That they did496
not find stalagmites that formed during the last glacial period could be due to a threshold497
effect (hypothesized drying during the ice age created too dry conditions for stalagmite498
formation, even during times of high summertime insolation), or perhaps it is an example499
of the adage “absence of evidence is not evidence of absence.” Indeed, Burns et al. [2001]500
and Fleitmann [2003] later found stalagmites in Hoti Cave that dated to 80 kbp – also501
coincident with the high phase of the summer insolation cycle – as well as speleothems502
that grew during the penultimate glacial period. The difference between the δ18Oc in the503
Hoti Cave stalagmites that grew in times of high insolation and the δ18Oc in modern-day504
stalagmites is ∼ 3 - 4 ‰, which compares favorably to δ18Op change simulated by the505
model (∼ 4 ‰). Finally, Fleitmann [2003] conclude that the source of the water during506
these wet periods must be distal to the cave site, based on the stalagmite deuterium,507
and suggest a tropical Indian Ocean source. Although our model also indicates a distal508
source for the moisture, the predominant source of moisture in eastern Africa and Arabian509
Peninsula in our high-insolation simulation is the tropical Atlantic via northeast Africa,510
which is in agreement with the source of moisture in the 6 kbp simulation of Patricola and511
Cook [2007]. Fleitmann et al. [2011] reported the history of stalagmite growth in Mukalla512
D R A F T August 6, 2014, 4:44pm D R A F T

X - 26 BATTISTI ET AL.: THE PAN-ASIAN MONSOON
Cave in Southern Yemen is similar to that seen in Hoti Cave farther north in Oman:513
speleothems grew during the current and last interstadial, as well at 80 kbp (in Makalla514
Cave, dating uncertainties are too large to determine the phasing of earlier stalagmite515
growth relative to the orbital cycles).516
Consistent with the interpretation of Pausata et al. [2011] and Cai et al. [2010], we517
find that the insolation driven in δ18Op measured on the Tibetan plateau are solely due518
to changes in the summer monsoon intensity over the Indian Ocean sector, which affects519
the isotopic composition of the vapor imported to Tibet. There is a large change in the520
net summer precipitation over Tibet, but this cannot be directly inferred from the cave521
isotopes (see discussion in section 4.1). Although the amplitude of the insolation induced522
δ18Op changes at Tianmen in Tibet in the model agree well with those observed (∼7 ‰),523
we note that the speleothems in Tianmen stop growing during the low summer insolation,524
perhaps due to lack of water. Hence, the amplitude of the orbital signal in δ18Oc in525
Tianmen may be a lower limit on the actual swings in δ18Op (see Cai et al. [2010] for526
further discussion).527
As mentioned in section 1, the δ18Oc in speleothems from Sofular Cave in Turkey is528
not correlated with insolation over the duration of the record, 50 kyr; this is in agreement529
with our model results (see Figure 8(b)). Fleitmann et al. [2009] show that the Sufular530
record clearly tracks δ18O in the Greenland ice core (including the abrupt millennial scale531
changes). We can’t rule out, however, that a longer record from Turkey would show an532
orbital signature: over the last 50 kyr, the Sofular and Hulu/Sanbao records are very533
similar and yet when the whole of the Hulu/Dongee record examined, there is a clear534
orbital signal in the latter record (see Figure 1 and Table 1).535
D R A F T August 6, 2014, 4:44pm D R A F T
BATTISTI ET AL.: THE PAN-ASIAN MONSOON X - 27
Finally, the observed changes in δ18Oc at Kesang in northwestern China are comparable536
to those at Tianmen. The large response in δ18Op simulated by our model are confined537
to the high Tibetan Plateau, whereas the Kesang site is far to the north – poleward of538
the Tarim Basin. Although Cheng et al. [2012] ascribe the large Kesang signals to be a539
measure of the strength of the incursion of the Asian summer monsoon into this region,540
it could be that it could be that the Kesang site is recording changes in the wintertime541
storm track that influences this region. In that case, the failure of our model to capture542
the orbital signal at Kesang could be due to an erroneously southward displacement of543
the wintertime storm track simulated by the model in the high-insolation experiment, or544
due to model errors in the fractionation efficiency under very low temperatures (below545
-20◦C) due to the joint presence of ice crystals and supercooled water.546
5.3. Comparison with other proxy data and their interpretations
In this section, we compare our model results to all other proxy data that we are aware547
of for which the records are sufficiently long and the chronology sufficiently constrained548
so that the orbital signal (or lack thereof) can be assessed.549
Rossignol-Strick [1983] and Rossignol-Strick [1985] suggest the sapropel formations in550
the eastern Mediterranean Sea are due to unusually high inputs of freshwater into the551
eastern Mediterranean associated with enhanced summer precipitation over the Ethiopian552
highlands during the high phase of the summer insolation cycle that is subsequently553
brought to the sea via the Nile River. This is remarkably consistent with our model554
results (see Figure 8(a)). Bar-Matthews et al. [2000] and Bar-Matthews [2003] note that555
eight of the nine sapropel formations observed in the past 240 kyr are coincident with times556
of wet conditions in the Israeli caves and all occur during high summertime insolation.557
D R A F T August 6, 2014, 4:44pm D R A F T

X - 28 BATTISTI ET AL.: THE PAN-ASIAN MONSOON
Kroon et al. [1998] argue that sapropel formation in the eastern Mediterranean has been558
orbitally paced for at least the past 3.2 million years.559
In addition to the sapropel data and the orbital pacing of the times of speleothem560
growth discussed in section 5.2, a myriad of proxy indicators consistently show wetter561
conditions in the Middle East in the early Holocene (a time of high summer insolation)562
compared to the late Holocene (a time of low summer insolation); these include proxy563
records of vegetation [Jolly et al., 1998a], lake levels [Jolly et al., 1998b] and of Red Sea564
salinity [Arz et al., 2003]. There is some discussion in the literature of whether the wetter565
mean conditions in times of high summer insolation reflect changes in summer, winter or566
annual mean precipitation; see Kutzbach et al. [2014] for a comprehensive discussion. In567
our model, there is nearly a two-fold increase in annual precipitation in the far eastern568
Mediterranean and in the Middle East, and almost all of this increase is in summertime569
(as in the simulations of Kutzbach et al. [2014], the ECHAM model shows an increase in570
winter precipitation but it is much smaller than the increase in summer precipitation). The571
increase in summer precipitation is sufficiently large that the maximum precipitation shifts572
from wintertime in the low insolation experiment (and in today’s climate), to summertime573
in the high insolation experiment. Further support for a summertime precipitation change574
is found in the agreement between the amplitude of the orbital δ18Oc signal in the Middle575
Eastern caves and the insolation-forced changes in δ18Op simulated by the model. In576
the model, δ18Op in the Middle East is depleted in the high insolation case due to the577
“amount effect” (see Figure 11(b)): summertime precipitation is isotopically lighter than578
in winter because the precipitation is associated with more intense precipitation than in579
winter.580
D R A F T August 6, 2014, 4:44pm D R A F T
BATTISTI ET AL.: THE PAN-ASIAN MONSOON X - 29
Schulz et al. [1998] presented one sediment core record from the northwest Arabian581
Sea that was sufficiently long (∼ 110 kyr) that the insolation signal could clearly be582
identified in the δ18Oc in the shells of the formaminifer Globigerinoides ruber (although583
an insolation signal is not obvious in two shorter records (∼ 60 kyr) farther to the east,584
which appear to be more similar to the Greenland ice cores). They interpret this record585
as an indictor of sea surface temperature regulated by the the strength of the upwelling586
(southwesterly) monsoon winds in the Arabian Sea – stronger winds associated with the587
greater summertime insolation, which is consistent with our results (see Figure 8(a)).588
Reichart et al. [1998] and Clemens et al. [2010] report that total organic carbon produc-589
tion in the northern Arabian Sea is also orbitally paced, with maximum production lagging590
the maximum summertime insolation by ∼3 kyr and ∼5 kyr respectively3. Bassinot et al.591
[2011] forced an offline biogeochemical-ecophysiological model with the output from sim-592
ulations performed by Marzin and Braconnot [2009a] of the 9kr (high summer insolation)593
and 6 kbp climate using the ISPL−CM4 coupled atmosphere-ocean model. They repro-594
duced the observed phasing of primary production in the western and eastern Arabian sea595
relative to the insolation forcing throughout the Holocene and showed that the changes596
in both regions are consistent with the changes in the monsoonal winds. Reichart et al.597
[1998] note that the total organic carbon production in the northern Arabian Sea today is598
sensitive to the duration of the upwelling favorable winds in the monsoon (rather than the599
strength of the winds). Our results indicate the onset time of the monsoon is relatively600
insensitive to the phase of the insolation (not shown). Since the orbital modulation of the601
end-of-summer insolation lags that of the mid-summer insolation by ∼3 kyr, this would602
D R A F T August 6, 2014, 4:44pm D R A F T

X - 30 BATTISTI ET AL.: THE PAN-ASIAN MONSOON
explain the high correlation between summer-averaged insolation and the 3 kyr lagged603
productivity records.604
Molfino and McIntyre [1990] examine a 200 kyr sediment core (RC24-7) from the equa-605
torial Atlantic (1◦20.5’S, 11◦53.3’W). They report a strong orbital signal, with greater606
SST and lower productivity associated with June perihelion (high JJA insolation); in607
turn, this implies reduced upwelling along the equator in the Atlantic in JJA (the high608
productivity season). Our modelling results are consistent with this. Figures 5(b) and609
A2 show that the equatorial Atlantic Trade Winds collapse in JJA due to the enhanced610
monsoonal circulation over central equatorial Africa.611
Finally, we note that the pattern and amplitude of the δ18Op response to insolation612
forcing over South America agrees remarkably well with the δ18Oc in speleothems in the613
Andes (Huagapo Cave, Kanner [2012]), northeast Brazil (Rio Grande du Norde Cave,614
Cruz et al. [2009]) and southeast Brazil (Botuvera Cave, Wang et al. [2004, 2007]). Or-615
bitally paced differences in δ18Oc are reported to be +3 ‰ (Andes), -4 ‰ (northeast616
Brazil) and +2 ‰ (southeast Brazil) – very similar to that simulated by our model (see617
Figure 7). The dynamics responsible for these isotope variations and their climatological618
significance are discussed in Liu et al. [2014].619
5.4. What’s with the central China speleothems?
Perhaps the only major discrepancy between the speleothem data and the model results620
is in the lowlands of east central China, where the observed amplitude of the insolation-621
driven response in δ18Oc in the speleothems in Hulu/Sanbao (Figure 1) is ∼ 4 ‰ while622
the model simulates only 1 ‰. In addition, the central China δ18Oc records are unique623
in suggesting that the response to insolation forcing in this region may not be smooth:624
D R A F T August 6, 2014, 4:44pm D R A F T
BATTISTI ET AL.: THE PAN-ASIAN MONSOON X - 31
the transitions between the extremes are sometimes abrupt (e.g., at 120, 128, 189, 192,625
200 kbp). Taken at face value, this suggests some missing physics in the model.626
First, we note that the disagreement between observed δ18Oc and simulated δ18Op is627
not resolved by enhancing the horizontal resolution of the simulations (see section 4.3).628
We also performed 22 additional experiments, running the model with observed insolation629
every 1 kyr, from 195 kbp to 218 kbp (each model run was for 40 years, and we analyzed630
the last 30 years of integration). The climate and isotope changes associated with the631
insolation forcing vary smoothly and nearly linearly with insolation – everywhere on the632
planet. Indeed, the first empirical orthogonal function of δ18Op (the first eigenvector of633
the δ18Op covariance matrix) from all 24 experiments captures 78% of the total variance634
in δ18Op and reproduces the pattern of isotope change as is seen in Figure 7; the first635
principle component is almost identical in shape to JJA insolation at 30◦N). We note636
that Kutzbach et al. [2008] also found that the changes in climate vary smoothly with637
insolation forcing in a 280 kyr continuous integration of a low-resolution coupled climate638
model. Hence, a possible explanation for the model-observation discrepancy in central639
China is that insolation forcing produces smooth swings in δ18Op in eastern China with640
a peak-to-peak amplitude of ∼ 1 ‰ (consistent with our model results), but the lions’641
share of the 4 ‰ total orbital signal is accomplished by abrupt threshold physics that642
is not captured by our model. Below we offer two suggestions, but reject one of them643
outright.644
One possibility is that insolation forcing causes slow changes in the mean state of the645
global ocean in such a way that the ocean undergoes a stability threshold, causing sea ice646
extent to change greatly and abruptly in the North Atlantic, thereby changing the climate647
D R A F T August 6, 2014, 4:44pm D R A F T
X - 32 BATTISTI ET AL.: THE PAN-ASIAN MONSOON
and δ18Op abruptly throughout the northern hemisphere (see Pausata et al. [2011]).648
We reject this idea, however, because the only known phenomena that are purportedly649
associated with abrupt sea ice extent are the Dansgaard-Oscheger oscillations and Heinrich650
events that are clearly evident in proxy records in Israel and in the Arabian Sea – locations651
where the proxy data show a clear insolation signal and yet no such abrupt changes652
coincident with the insolation-paced abrupt changes seen in the speleothems in central653
China.654
Absent any plausible idea or evidence for a global abrupt change, a more likely scenario655
is that the abrupt insolation-coordinated changes in China are due to local processes656
that are missing in our model. One suggestion is that insolation forcing causes smooth657
changes in climate in eastern China: our model suggests a ∼50% increase in precipitation658
and 2◦C increase in temperature in summer in the high-insolation experiment compared659
to the low-insolation experiment. In turn, the smooth changes in climate cause threshold660
changes in vegetation and/or soil properties that affect evaporation and/or the flow of661
water through the soil that cause abrupt changes in the fractionation of soil water as it662
percolates to the cave. For example, one might envision the warmer, wetter climate at663
high summer insolation would support forest vegetation, whereas a colder, drier climate664
would support grasslands. Similarly, a smooth change in the amount of precipitation may665
cause an abrupt change in the flow rate through the soils and thus evaporation (even666
without vegetation changes) which could affect the fractionation of water as it makes the667
journey from the surface to the cave. In these scenarios, the lion’s share of the insolation668
signal in cave δ18Oc is recording abrupt changes in evaporation via abrupt changes in669
vegetation/soil water holding capacity while a lesser and smoother contribution is due670
D R A F T August 6, 2014, 4:44pm D R A F T

BATTISTI ET AL.: THE PAN-ASIAN MONSOON X - 33
directly to the climate changes (i.e., to the changes in the δ18O of precipitation). Some671
support for this hypothesis is found in relationship between the δ18Oc and δ13C in the672
stalagmites in Hulu cave: δ18Oc and δ13C are negatively correlated and abrupt changes in673
δ18Oc and coincident with abrupt changes in δ13C [Kong et al., 2005]. We note, however,674
that the Kong et al. [2005] record does not extend back far enough in time to determine675
whether the abrupt transitions in δ18Oc evident in Figure 1 are also seen in δ13C.676
6. Summary
We have performed modelling experiments with the ECHAM4.6 AGCM coupled to a677
slab ocean to examine the impact of insolation forcing on the climate and the isotopic678
composition of precipitation. The amplitude and pattern of the insolation-forced changes679
in the precipitation-weighted δ18O of precipitation (δ18Op) compares favorably to the pan-680
Asian signature in the oxygen isotopic composition of the calcite (δ18Oc) in speleothems681
spanning from Israel eastward to the Saudi Arabian Peninsula and Tibet. Compared to682
times of low summer insolation in the NH, high insolation forcing features δ18Op over683
northeast Africa/Saudi Arabia and Tibet that is depleted by 4 ‰ and 7 ‰, respectively.684
In these regions, the model results suggest that stalagmites are records of the changes in685
the isotopic composition of the summertime precipitation. Summertime precipitation over686
Tibet is depleted in times of high northern hemisphere summer insolation because of the687
vapor that is arriving is depleted due to changes in the intensity of the Indian Monsoon (see688
also Pausata et al. [2011]). Over northeastern Africa, monsoon precipitation is depleted689
because the vapor that is arriving from the west is depleted and because of changes in the690
probability distribution of the intensity of precipitation (the so-called amount effect). A691
robust conclusion of our analyses is that the strong seasonal cycle in precipitation in these692
D R A F T August 6, 2014, 4:44pm D R A F T

X - 34 BATTISTI ET AL.: THE PAN-ASIAN MONSOON
regions renders δ18Op, and hence δ18Oc, quite insensitive to changes in the total amount693
of summer precipitation (Table 2).694
Theory and observations indicate that the large-scale monsoonal precipitation will be695
located over the maximum in near-surface θe [Prive and Plumb, 2007a, b; Bordoni and696
Schneider , 2008; Boos and Kuang , 2010]. Our model results suggest that in the northern697
hemisphere, times of low summer insolation (near June aphelion) – such as in the modern698
climate – feature an Indian and southeast Asian monsoon that are largely a result of the699
heating of southeast Asia and the atmospheric response to increasing θe over the ocean in700
the northern Indian Ocean; the heating of the land is not sufficiently competitive to shift701
the maximum θe from ocean to land.702
In times of high summer insolation in the northern hemisphere (i.e, June perihelion), the703
monsoon circulation is fundamentally different. Insolation increases sufficiently quickly704
from late winter to early summer that the land - ocean temperature difference becomes705
very large and the location of the maximum θe shifts toward land along the northwest and706
northern Indian Ocean basin. Hence the maximum in summer precipitation shifts from707
southeast Asia and the Bay of Bengal (where it is in today’s climate; see Figure 2) to land708
regions extending from northeast Africa eastward to Pakistan and over northern India.709
This shift is aided by a reduction in the subsidence over the Middle East that is driven710
when the precipitation center is over the Bay of Bengal [Rodwell and Hoskins , 1996].711
Times of high summer insolation feature a greater summer maximum in near-surface θe712
and therefore a more intense Indian monsoon, which accounts for the depleted vapor that713
is advected northward to Tibet and thus the depleted δ18Oc at Tianmen.714
D R A F T August 6, 2014, 4:44pm D R A F T

BATTISTI ET AL.: THE PAN-ASIAN MONSOON X - 35
There is a notable discrepancy between our model results and the speleothem records in715
eastern central China (Hulu and Sanbao caves), where observations show a 4 ‰ depletion716
in δ18Oc during the high summer insolation and the model shows only a 1 ‰ depletion.717
In this region, the speleothems are unique among the world’s cave records in that most718
of the 4 ‰ change in δ18Oc between orbitally-paced extremes is often accomplished719
abruptly; if these abrupt changes are excised from the records, then the model results and720
observations are in agreement. Thus, we raise the possibility that the δ18Oc records in721
east-central China represent the smooth modest (∼ 1 ‰) change in δ18Op and in climate722
that we see in our model, and these climate changes give rise to an abrupt change in723
vegetation that are signaled by an abrupt 3 ‰ change in δ18Op that is subsequently724
recorded in the stalagmite δ18Oc.725
We note that our model also reproduces the amplitude and pattern of the insolation-726
driven cycles in δ18Oc in the speleothems across tropical South America. The climatologi-727
cal interpretation of these records and the dynamics responsible for the changes in climate728
and isotopic composition of precipitation across tropical South America are presented in729
[X. Liu et al., 2014].730
D R A F T August 6, 2014, 4:44pm D R A F T
X - 36 BATTISTI ET AL.: THE PAN-ASIAN MONSOON
Appendix A: Approximating δ18O by δ18Op
The climatological δ18O of a sample is (see equation 1):
δ18O ≡{
Cs−1
18O16O
− 1
}× 1000, (A1)
where 18O and 16O are the moles of the oxygen isotope in a sample (in our case, precipi-
tation), and Cs is the ratio of 18O to 16O in the standard (in our case, Cs = 2.0052×10⁻³
for Standard Mean Ocean Water). To better understand the relative contributions of
changes in precipitation and changes in the δ18O of precipitation to the changes in the
δ18O recorded in the speleothems, in the paper we approximate equation A1 as
δ18O ∼=∑
m δ18Om · Pm∑m Pm
≡ δ18Op, (A2)
where δ18Om is the δ18O for the month m (i.e., Equation A1 applied to month m) and731
Pm is the total precipitation for month m.732
Let 18Om be the moles of 18O that are delivered in the precipitation in month m;
similarly 16Om be the moles of 16O. The mass of precipitation for the month (in grams)
is then
Pm = 20 × 18Om + 18 × 16Om. (A3)
Now we can rewrite equation A1 as follows:
Cs
{δ18O × 10−3 + 1
}≡
18O16O
=
∑m
18Om∑m
16Om. (A4)
We note that 18Om/16Om is of O(Cs).733
Now consider our approximate equation A2, which we can rewrite using equations A1
and A3 as
δ18Op =
∑m (Cs
−1 18Om16Om
− 1) × 1000 × Pm∑m Pm
, (A5)
D R A F T August 6, 2014, 4:44pm D R A F T
BATTISTI ET AL.: THE PAN-ASIAN MONSOON X - 37
or
Cs
{δ18Op × 10−3 + 1
}=
∑m
18Om16Om
Pm∑m Pm
. (A6)
Substituting equation A3 into the right hand side of equation A6 we obtain∑m
18Om16Om
Pm∑m Pm
=
∑m
18Om
(1 + O
(18Om16Om
))∑
m16Om
(1 + O
(18Om16Om
)) =18O16O
(1 + O(
18Om
16Om)
), (A7)
and so equation A6 becomes
Cs
{δ18Op × 10−3 + 1
}=
18O16O
(1 + O (Cs)). (A8)
Comparing equation A8 to equation A4, we see that the error in approximating the734
climatological δ18O (equation A1) with the precipitation weighted δ18O (equation A2) is735
of order of O (Cs), or about 0.2%.736
Appendix B: Seasonal Results from the 207 kbp and 218 kbp experiments
Figure A1 shows the difference in the climatological precipitation from the low-insolation737
(207 kbp) experiment and the modern-day insolation experiment, for the northern hemi-738
sphere summer (JJA) and winter (DJF) seasons. Figure A1(a) shows that low-insolation739
experiment features summertime precipitation that is very similar to that in the modern-740
day climate: differences in precipitation are typically less than 20% of the modern-day741
precipitation. In comparison, Figure 5(b) shows there are large differences in precipita-742
tion in the high-insolation experiment compared to the low-insolation experiment (and743
to the Modern-Day experiment; not shown), including fundamental shifts in all of the744
centers of action for the monsoonal precipitation. These results are expected because745
the NH insolation at 207 kbp is very similar to the modern-day NH insolation, wheres746
the 218 kbp insolation differs greatly from modern-day insolation (see Figure 4). Similar747
results are obtained for temperature: there are minor differences in the JJA temperature748
D R A F T August 6, 2014, 4:44pm D R A F T

X - 38 BATTISTI ET AL.: THE PAN-ASIAN MONSOON
in the low-insolation and Modern-Day experiments (not shown), while the differences in749
JJA temperature between the high- and low-insolation experiments are large (see Figure750
5(a)). This is consistent with the small differences in insolation in the low and Modern-751
Day experiments compared to that in the high- and low-insolation experiments. Hence,752
for JJA one can think of the differences between the high- and low-insolation climates as753
being very similar to the difference between high-insolation and the modern-day climate.754
Unlike for NH precipitation in JJA, one cannot use the modern-day precipitation as755
a reference point for envisioning the difference in precipitation in the high- and low-756
insolation experiments in the SH summer (DJF): compare Figure A1(b) to 6(b). This is757
because the DJF insolation at 207 kbp is notably different from modern-day insolation758
(see Figure 4).759
Figure A2 shows the climatological JJA precipitation and 850 hPa winds for the 207 kbp760
experiment, which features maxima in precipitation over southeast Asia, the equatorial761
central Indian Ocean and the familiar convergence zone features over the Atlantic and762
Pacific Oceans. For completeness the climatological JJA precipitation and 850 hPa winds763
from the 218 kbp experiments is also shown.764
Acknowledgments. We thank G. Hoffman for providing the code for ECHAM4.6.765
DSB is grateful for stimulating discussions with Drs. Xianfeng Wang, Peter Molnar,766
Gavin Schmidt, John Kutzbach, and Larry Edwards over the course of this work. We767
also appreciate the official and unofficial reviews of the manuscript by Peter Molnar, Xi-768
anfeng Wang, Zhengyu Liu, Vathias Vuille, David McGee and an anonymous reviewer;769
their thoughtful comments helped us to greatly improve the manuscript. The CERES770
data were obtained from the NASA Langley Research Center Atmospheric Science Data771
D R A F T August 6, 2014, 4:44pm D R A F T

BATTISTI ET AL.: THE PAN-ASIAN MONSOON X - 39
Center (https://eosweb.larc.nasa.gov/). This work was supported by the National Sci-772
ence Foundation Division of Earth Sciences Continental Dynamics Programs, award Nos.773
0908558 and 1210920. Any model output that has been archived will be made freely774
available upon request to DSB.775
Notes
1. Frumkin et al. [1999] show a δ18Oc record from a cave in Israel that is very similar to the Soreq/Peqiin record, only
with more gaps; hence, it is not reproduced here.776
2. Unfortunately, it is not possible to compare the relative the amplitude of the changes over Africa and India in the Schmidt
et al. [2007] simulations because in these regions the anomalies saturate the color bar that is used in their figures.
3. We use JJA insolation, whereas Clemens et al. [2010] use June 1 insolation; these insolation curves are offset by ∼3 kyr.
Using JJA insolation, the phase lag in productivity reported by the Clemens et al. [2010] becomes ∼ 8 - 3 = 5 kyr.
References
Arz, H., F. Lamy, J. Patzold, P. Muller, and M. Prins (2003), Mediterranean moisture777
source for an early-Holocene humid period in the northern Red Sea, Science, 300 (5616),778
118–121, doi:10.1126/science.1080325.779
Bar-Matthews, M. (2003), Sea-land oxygen isotopic relationships from planktonic780
foraminifera and speleothems in the Eastern Mediterranean region and their impli-781
cation for paleorainfall during interglacial intervals, Geochimica et Cosmochimica Acta,782
67 (17), 3181–3199, doi:10.1016/S0016-7037(02)01031-1.783
Bar-Matthews, M., A. Ayalon, and A. Kaufman (1997), Late quaternary paleoclimate in784
the eastern Mediterranean region from stable isotope analysis of speleothems at Soreq785
Cave, Israel, Quaternary Research, 47, 155–168, doi:10.1006/qres.1997.1883.786
Bar-Matthews, M., A. Ayalon, and A. Kaufman (2000), Timing and hydrolog-787
ical conditions of Sapropel events in the Eastern Mediterranean, as evident788
D R A F T August 6, 2014, 4:44pm D R A F T
X - 40 BATTISTI ET AL.: THE PAN-ASIAN MONSOON
from speleothems, Soreq cave, Israel, Chemical Geology, 169 (1-2), 145–156, doi:789
10.1016/S0009-2541(99)00232-6.790
Bassinot, F. C., C. Marzin, P. Braconnot, O. Marti, E. Mathien-Blard, F. Lombard, and791
L. Bopp (2011), Holocene evolution of summer winds and marine productivity in the792
tropical Indian Ocean in response to insolation forcing: data-model comparison, Climate793
of the Past, 7 (3), 815–829, doi:10.5194/cp-7-815-2011.794
Boos, W. R., and Z. Kuang (2010), Mechanisms of Poleward Propagating, Intraseasonal795
Convective Anomalies in Cloud System-Resolving Models, Journal of Atmospheric Sci-796
ences, 67 (11), 3673–3691, doi:10.1175/2010JAS3515.1.797
Bordoni, S., and T. Schneider (2008), Monsoons as eddy-mediated regime transi-798
tions of the tropical overturning circulation, Nature Geoscience, 1 (8), 515–519, doi:799
10.1038/ngeo248.800
Braconnot, P., B. L. Otto-Bliesner, S. P. Harrison, S. Joussaume, J.-Y. Peterchmitt,801
a. Abe-Ouchi, M. Crucifix, E. Driesschaert, T. Fichefet, C. D. Hewitt, M. Kageyama,802
A. Kitoh, a. Laıne, M.-F. Loutre, O. Marti, U. Merkel, G. Ramstein, P. J. Valdes,803
S. L. Weber, Y. Yu, and Y. Zhao (2007), Results of PMIP2 coupled simulations of the804
Mid-Holocene and Last Glacial Maximum Part 1: experiments and large-scale features,805
Climate of the Past, 3 (2), 261–277, doi:10.5194/cp-3-261-2007.806
Braconnot, P., C. Marzin, L. Gregoire, E. Mosquet, and O. Marti (2008), Monsoon re-807
sponse to changes in Earth’s orbital parameters : comparisons between simulations of808
the Eemian and of the Holocene, Climate Of The Past, 4, 281–294.809
Braconnot, P., M. Loutre, B. Dong, S. Joussaume, P. Valdes, and and PMIP Participating810
Groups (2002), How the simulated change in monsoon at 6 ka BP is related to the sim-811
D R A F T August 6, 2014, 4:44pm D R A F T

BATTISTI ET AL.: THE PAN-ASIAN MONSOON X - 41
ulation of the modern climate: results from the Paleoclimate Modeling Intercomparison812
Project, Climate Dynamcis, 19 (2), 107–121, doi:10.1007/s00382-001-0217-5.813
Burns, S. J., A. Matter, N. Frank, and A. Mangini (1998), Speleothem-based paleoclimate814
record from northern Oman, Geology, 26 (6), 499, doi:10.1130/0091-7613(1998)026¡0499.815
Burns, S. J., D. Fleitmann, A. Matter, U. Neff, and A. Mangini (2001), Speleothem816
evidence from Oman for continental pluvial events during interglacial periods, Geology,817
29 (7), 623, doi:10.1130/0091-7613(2001)029¡0623.818
Cai, Y., H. Cheng, Z. An, R. L. Edwards, X. Wang, L. Tan, and J. Wang (2010), Large819
variations of oxygen isotopes in precipitation over south-central Tibet during Marine820
Isotope Stage 5, Geology, 38 (3), 243–246, doi:10.1130/G30306.1.821
Cheng, H., R. L. Edwards, W. S. Broecker, G. H. Denton, X. Kong, Y. Wang, R. Zhang,822
and X. Wang (2009), Ice age terminations, Science (New York, N.Y.), 326 (5950), 248–823
52, doi:10.1126/science.1177840.824
Cheng, H., P. Z. Zhang, C. Spotl, R. L. Edwards, Y. J. Cai, D. Z. Zhang, W. C.825
Sang, M. Tan, and Z. S. An (2012), The climatic cyclicity in semiarid-arid cen-826
tral Asia over the past 500,000 years, Geophysical Research Letters, 39 (1), 1–5, doi:827
10.1029/2011GL050202.828
Clemens, S. C., W. L. Prell, and Y. Sun (2010), Orbital-scale timing and mechanisms829
driving Late Pleistocene Indo-Asian summer monsoons: Reinterpreting cave speleothem830
delta O-18, Paleoceanography, 25, doi:10.1029/2010PA001926.831
Cruz, F. W., M. Vuille, S. J. Burns, X. Wang, H. Cheng, M. Werner, R. Lawrence Edwards,832
I. Karmann, A. S. Auler, and H. Nguyen (2009), Orbitally driven eastwest antiphasing of833
SouthAmerican precipitation, Nature Geoscience, 2 (3), 210–214, doi:10.1038/ngeo444.834
D R A F T August 6, 2014, 4:44pm D R A F T

X - 42 BATTISTI ET AL.: THE PAN-ASIAN MONSOON
Dayem, K. E., P. Molnar, D. S. Battisti, and G. H. Roe (2010), Lessons learned from835
oxygen isotopes in modern precipitation applied to interpretation of speleothem records836
of paleoclimate from eastern Asia, Earth and Planetary Science Letters, 295, 219–230.837
Fleitmann, D. (2003), Changing moisture sources over the last 330,000 years in Northern838
Oman from fluid-inclusion evidence in speleothems, Quaternary Research, 60 (2), 223–839
232, doi:10.1016/S0033-5894(03)00086-3.840
Fleitmann, D., H. Cheng, S. Badertscher, R. L. Edwards, M. Mudelsee, O. M.841
Gokturk, a. Fankhauser, R. Pickering, C. C. Raible, A. Matter, J. Kramers, and842
O. Tuysuz (2009), Timing and climatic impact of Greenland interstadials recorded843
in stalagmites from northern Turkey, Geophysical Research Letters, 36 (19), 1–5, doi:844
10.1029/2009GL040050.845
Fleitmann, D., S. J. Burns, M. Pekala, A. Mangini, A. Al-Subbary, M. Al-Aowah,846
J. Kramers, and A. Matter (2011), Holocene and Pleistocene pluvial periods847
in Yemen, southern Arabia, Quaternary Science Reviews, 30 (7-8), 783–787, doi:848
10.1016/j.quascirev.2011.01.004.849
Frumkin, A., D. C. Ford, and H. P. Schwarcz (1999), Continental Oxygen Isotopic Record850
of the Last 170,000 Years in Jerusalem, Quaternary Research, 51 (3), 317–327, doi:851
10.1006/qres.1998.2031.852
Herold, M., and G. Lohmann (2009), Eemian tropical and subtropical African moisture853
transport: an isotope modelling study, Climate Dynamics, 33 (7-8), 1075–1088, doi:854
10.1007/s00382-008-0515-2.855
Hewitt, C., and J. Mitchell (1998), A fully coupled GCM simulation of the climate of the856
mid-Holocene, Geophysical Research Letters, 25 (3), 361–364, doi:10.1029/97GL03721.857
D R A F T August 6, 2014, 4:44pm D R A F T
BATTISTI ET AL.: THE PAN-ASIAN MONSOON X - 43
Hoffmann, G., and M. Heinmann (1997), Water Isotope Modeling in the Asian Monsoon858
Region, Quaternary International, 37 (96), 115–128.859
Hoffmann, G., M. Werner, and M. Heimann (1998), Water isotope module of the ECHAM860
atmospheric general circulation model: A study on timescales from days to several years,861
Journal of Geophysical Research, 103 (D14), 16,871–16.862
Huybers, P. (2006), Early Pleistocene glacial cycles and the integrated summer insolation863
forcing, Science, 313, 508–511, doi:10.1126/science.1125249.864
Jackson, C., and A. Broccoli (2003), Orbital forcing of Arctic climate: mechanisms of865
climate response and implications for continental glaciation, Climate Dynamics, 21 (7-866
8), 539–557, doi:10.1007/s00382-003-0351-3.867
Jolly, D., I. Prentice, R. Bonnefille, A. Ballouche, M. Bengo, P. Brenac, G. Buchet,868
D. Burney, J. Cazet, R. Cheddadi, T. Edorh, H. Elenga, S. Elmoutaki, J. Guiot,869
F. Laarif, H. Lamb, A. Lezine, J. Maley, M. Mbenza, O. Peyron, M. Reille, I. Reynaud-870
Farrera, G. Riollet, J. Ritchie, E. Roche, L. Scott, I. Ssemmanda, H. Straka, M. Umer,871
E. Van Campo, S. Vilimumbalo, A. Vincens, and M. Waller (1998a), Biome recon-872
struction from pollen and plant macrofossil data for Africa and the Arabian peninsula873
at 0 and 6000 years, Journal of Biogeography, 25 (6), 1007–1027, doi:10.1046/j.1365-874
2699.1998.00238.x.875
Jolly, D., S. Harrison, B. Damnati, and R. Bonnefille (1998b), Simulated climate and876
biomes of Africa during the late quaternary: Comparison with pollen and lake status877
data, Quaternary Science Reviews, 17 (6-7), 629–657, doi:10.1016/S0277-3791(98)00015-878
8.879
D R A F T August 6, 2014, 4:44pm D R A F T
X - 44 BATTISTI ET AL.: THE PAN-ASIAN MONSOON
Joussaume, S., K. Taylor, P. Braconnot, J. Mitchell, J. Kutzbach, S. Harrison, I. Prentice,880
A. Broccoli, A. Abe-Ouchi, P. Bartlein, C. Bonfils, B. Dong, J. Guiot, K. Herterich,881
C. Hewitt, D. Jolly, J. Kim, A. Kislov, A. Kitoh, M. Loutre, V. Masson, B. McAvaney,882
N. McFarlane, N. de Noblet, W. Peltier, J. Peterschmitt, D. Pollard, D. Rind, J. Royer,883
M. Schlesinger, J. Syktus, S. Thompson, P. Valdes, G. Vettoretti, R. Webb, and U. Wy-884
putta (1999), Monsoon changes for 6000 years ago: Results of 18 simulations from the885
Paleoclimate Modeling Intercomparison Project (PMIP), Geophysical Research Letters,886
26 (7), 859–862, doi:10.1029/1999GL900126.887
Jouzel, J., G. Ho, R. D. Koster, and V. Masson (2000), Water isotopes in precipita-888
tion: data / model comparison for present-day and past climates, Quaternary Science889
Reviews, 19 (1572).890
Kanner, L. C. (2012), An isotopic perspective on climatic change in tropical South Amer-891
ica from the modern through the Last Glacial period, Ph.D. thesis, University of Mas-892
sachusetts, 201 pp.893
Kohfeld, K., and S. P. Harrison (2000), How well can we simulate past climates? Evaluat-894
ing the models using global palaeoenvironmental datasets, Quaternary Science Reviews,895
19 (1-5), 321–346, doi:10.1016/S0277-3791(99)00068-2.896
Kong, X., Y. Wang, J. Wu, H. Cheng, R. Edwards, and X. Wang (2005), Complicated897
responses of stalagmite delta C-13 to climate change during the last glaciation from Hulu898
Cave, Nanjing, China, Science in China Series D-Earth Sciences, 48 (12), 2174–2181,899
doi:10.1360/04yd0140.900
Kroon, D., I. Alexander, M. Little, L. J. Lourens, A. Matthewson, A. H. F. Robert-901
son, and T. Sakamoto (1998), Oxygen isotope and sapropel stratigraphy in the eastern902
D R A F T August 6, 2014, 4:44pm D R A F T
BATTISTI ET AL.: THE PAN-ASIAN MONSOON X - 45
Mediterranean during the last 3.2 million years, Arctic, 160 (1938), 181–189.903
Kutzbach, J. E., X. Liu, Z. Liu, and G. Chen (2008), Simulation of the evolutionary904
response of global summer monsoons to orbital forcing over the past 280,000 years,905
Climate Dynamics, 30 (6), 567–579, doi:10.1007/s00382-007-0308-z.906
Kutzbach, J. E., G. Chen, H. Cheng, R. L. Edwards, and Z. Liu (2014), Potential role of907
winter rainfall in explaining increased moisture in the Mediterranean and Middle East908
during periods of maximum orbitally-forced insolation seasonality, Climate Dynamics,909
42 (3-4), 1079–1095, doi:10.1007/s00382-013-1692-1.910
Lee, J.-E., and I. Fung (2008), “amount effect” of water isotopes and quantita-911
tive analysis of post-condensation processes, Hydrological Processes, 22 (1), 1–8, doi:912
10.1002/hyp.6637.913
LeGrande, A. N., and G. A. Schmidt (2009), Sources of holocene variability of oxygen914
isotopes in paleoclimate archives, Climate of the Past Discussions, 5 (2), 1133–1162,915
doi:10.5194/cpd-5-1133-2009.916
Liu, X., D. S. Battisti, and G. H. Roe (2014), The Influence of Precession on the Climate917
and Isotopic Composition of Precipitation in Tropical South America, In preparation.918
Liu, Z., B. L. Otto-Bliesner, J. E. Kutzbach, L. Li, and C. Shields (2003), Coupled Climate919
Simulation of the Evolution of Global Monsoons in the Holocene, Journal of Climate,920
16 (15), 2472–2490, doi:10.1175/1520-0442.921
Liu, Z., X. Wen, E. C. Brady, B. Otto-Bliesner, G. Yu, H. Lu, H. Cheng, Y. Wang,922
W. Zheng, Y. Ding, R. L. Edwards, J. Cheng, W. Liu, and H. Yang (2014), Chinese923
cave records and the East Asia Summer Monsoon, Quaternary Science Reviews, 83,924
115–128, doi:10.1016/j.quascirev.2013.10.021.925
D R A F T August 6, 2014, 4:44pm D R A F T

X - 46 BATTISTI ET AL.: THE PAN-ASIAN MONSOON
Marzin, C., and P. Braconnot (2009a), The role of the ocean feedback on Asian and African926
monsoon variations at 6kyr and 9.5kyr BP, Comptes Rendus Geosciences, 341 (8-9),927
643–655, doi:10.1016/j.crte.2009.09.001.928
Marzin, C., and P. Braconnot (2009b), Variations of Indian and African monsoons induced929
by insolation changes at 6 and 9.5 kyr BP, Climate Dynamics, 33 (2-3), 215–231, doi:930
10.1007/s00382-009-0538-3.931
Merlis, T. M., T. Schneider, S. Bordoni, and I. Eisenman (2013), Hadley Circulation932
Response to Orbital Precession. Part II: Subtropical Continent, Journal of Climate,933
26 (3), 754–771, doi:10.1175/JCLI-D-12-00149.1.934
Molfino, B., and A. McIntyre (1990), Precessional forcing of nutricline dynamics in the935
equatorial Atlantic, Science, 249, 766–69.936
Molnar, P., W. R. Boos, and D. S. Battisti (2010), Orographic Controls on Climate937
and Paleoclimate of Asia: Thermal and Mechanical Roles for the Tibetan Plateau,938
in Annual Review of Earth and Planetary Sciences, Vol 38, Annual Review of Earth939
and Planetary Sciences, vol. 38, edited by Jeanloz, R and Freeman, KH, pp. 77–102,940
doi:10.1146/annurev-earth-040809-152456.941
Patricola, C. M., and K. H. Cook (2007), Dynamics of the West African monsoon un-942
der mid-Holocene precessional forcing: Regional climate model simulations, Journal of943
Climate, 20 (4), 694–716, doi:10.1175/JCLI4013.1.944
Pausata, F. S. R., D. S. Battisti, K. H. Nisancioglu, and C. M. Bitz (2011), Chinese sta-945
lagmite δ18O controlled by changes in the Indian monsoon during a simulated Heinrich946
event, Nature Geoscience, 4 (7), 474–480, doi:10.1038/ngeo1169.947
D R A F T August 6, 2014, 4:44pm D R A F T
BATTISTI ET AL.: THE PAN-ASIAN MONSOON X - 47
Peltier, W. (2004), Global glacial isostasy and the surface of the ice-age Earth: The ice-948
5G (VM2) model and GRACE, Annual Review of Earth and Planetary Sciences, 32,949
111–149, doi:10.1146/annurev.earth.32.082503.144359.950
Prell, W., and J. Kutzbach (1992), Sensitivity of the Indian monsoon to forcing parameters951
and implications for its evolution, Nature, (360), 647–52.952
Prell, W. L., and J. E. Kutzbach (1987), Monsoon Variability Over the Past 150,000 Years,953
Journal of Geophysical Research, 92 (D7), 8411–8425, doi:10.1029/JD092iD07p08411.954
Prive, N. C., and R. A. Plumb (2007a), Monsoon dynamics with interactive forcing.955
Part I: Axisymmetric studies, Journal of Atmospheric Sciences, 64 (5), 1417–1430, doi:956
10.1175/JAS3916.1.957
Prive, N. C., and R. A. Plumb (2007b), Monsoon dynamics with interactive forcing.958
Part II: Impact of eddies and asymmetric geometries, Journal of Atmospheric Sciences,959
64 (5), 1431–1442, doi:10.1175/JAS3917.1.960
Reichart, G., L. Lourens, and W. Zachariasse (1998), Temporal variability in the northern961
Arabian Sea Oxygen Minimum Zone (OMZ) during the last 225,000 years, Paleoceanog-962
raphy, 13 (6), 607–621, doi:10.1029/98PA02203.963
Rodwell, M., and B. Hoskins (1996), Monsoons and the dynamics of deserts, Quar-964
terly Journal of the Royal Meteorological Society, 122 (534, Part b), 1385–1404, doi:965
10.1002/qj.49712253408.966
Roe, G. H., Q. Ding, and D. S. Battisti (2014), The response of Asian summertime climate967
to the largest geologic forcing of the past 50 Ma, In preparation.968
Roeckner, E., K. Arpe, L. Bengtsson, M. Christoph, M. Claussen, L. Dmenil, M. Esch,969
M. Giorgetta, U. Schlese, and U. Schulzweida (1996), The atmospheric general circula-970
D R A F T August 6, 2014, 4:44pm D R A F T

X - 48 BATTISTI ET AL.: THE PAN-ASIAN MONSOON
tion model ECHAM-4: Model description and simulation of present-day climate, Max971
Planck Institut fur Meteorologie Report 218, (218), 90.972
Rossignol-Strick, M. (1983), African monsoons, as immediate climate response to orbital973
insolation, Nature, 304, 46–48.974
Rossignol-Strick, M. (1985), Mediterranean Quaternary sapropels, an immediate response975
of the African Monsoons to variation of insolation, Palaeogeogr., Palaeoclim., Palaeoecol,976
49, 237–253.977
Schmidt, G. a., A. N. LeGrande, and G. Hoffmann (2007), Water isotope expressions978
of intrinsic and forced variability in a coupled ocean-atmosphere model, Journal of979
Geophysical Research, 112 (D10), 1–18, doi:10.1029/2006JD007781.980
Schulz, H., U. von Rad, and H. Erlenkeuser (1998), Correlation between Arabian Sea and981
Greenland climate oscillations of the past 110,000 years, Nature, 393 (6680), 54–57.982
Schwarcz, H. (2007), Carbonate stable isotopes: Speleothems, in Encyclopedia of Quater-983
nary Science, edited by S. A. Elias, pp. 290 – 300, Elsevier, Oxford, doi:10.1016/B0-44-984
452747-8/00352-5.985
Vuille, M., M. Werner, R. S. Bradley, and F. Keimig (2005), Stable isotopes in precipi-986
tation in the Asian monsoon region, Journal of Geophysical Research, 110 (D23), 1–15,987
doi:10.1029/2005JD006022.988
Wang, X., A. S. Auler, R. L. Edwards, H. Cheng, P. S. Cristalli, P. L. Smart,989
D. a. Richards, and C.-C. Shen (2004), Wet periods in northeastern Brazil over the990
past 210 kyr linked to distant climate anomalies., Nature, 432 (7018), 740–3, doi:991
10.1038/nature03067.992
D R A F T August 6, 2014, 4:44pm D R A F T
BATTISTI ET AL.: THE PAN-ASIAN MONSOON X - 49
Wang, X., A. S. Auler, R. L. Edwards, H. Cheng, E. Ito, Y. Wang, X. Kong, and M. Solheid993
(2007), Millennial-scale precipitation changes in southern Brazil over the past 90,000994
years, Geophysical Research Letters, 34 (23), 1–5, doi:10.1029/2007GL031149.995
Wang, Y. J., H. Cheng, R. L. Edwards, Z. S. An, J. Y. Wu, C. C. Shen, and996
J. a. Dorale (2001), A high-resolution absolute-dated late Pleistocene Monsoon997
record from Hulu Cave, China, Science (New York, N.Y.), 294 (5550), 2345–8, doi:998
10.1126/science.1064618.999
Werner, M., M. Heimann, and G. Hoffmann (2001), Isotopic composition and origin of1000
polar precipitation in present and glacial climate simulations, Tellus Series B-Chemical1001
and Physical Meteorology, 53 (1), 53–71, doi:10.1034/j.1600-0889.2001.01154.x.1002
Xie, P., and P. Arkin (1997), Global precipitation: A 17-year monthly analysis based on1003
gauge observations, satellite estimates, and numerical model outputs, Bulletin of the1004
American Meteorological Society, 78, 2539–2558.1005
Zhao, Y., and S. P. Harrison (2012), Mid-Holocene monsoons: a multi-model analysis of1006
the inter-hemispheric differences in the responses to orbital forcing and ocean feedbacks,1007
Climate Dynamics, 39 (6), 1457–1487, doi:10.1007/s00382-011-1193-z.1008
D R A F T August 6, 2014, 4:44pm D R A F T
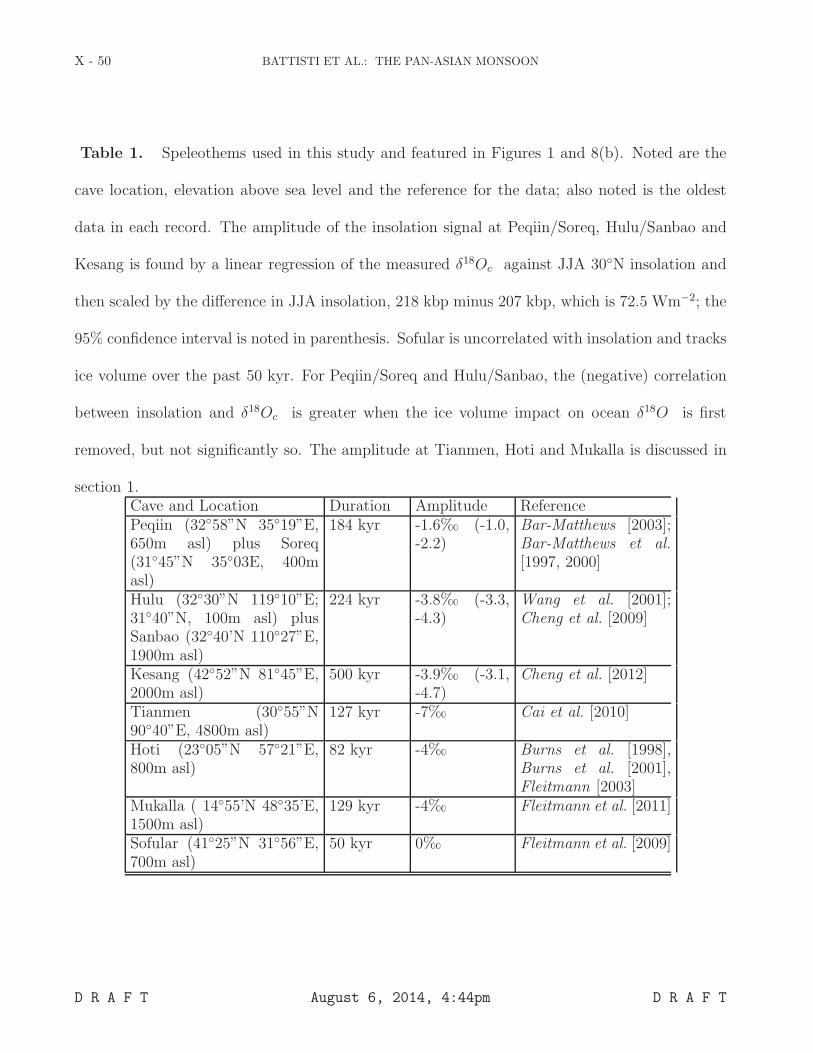
X - 50 BATTISTI ET AL.: THE PAN-ASIAN MONSOON
Table 1. Speleothems used in this study and featured in Figures 1 and 8(b). Noted are the
cave location, elevation above sea level and the reference for the data; also noted is the oldest
data in each record. The amplitude of the insolation signal at Peqiin/Soreq, Hulu/Sanbao and
Kesang is found by a linear regression of the measured δ18Oc against JJA 30◦N insolation and
then scaled by the difference in JJA insolation, 218 kbp minus 207 kbp, which is 72.5 Wm−2; the
95% confidence interval is noted in parenthesis. Sofular is uncorrelated with insolation and tracks
ice volume over the past 50 kyr. For Peqiin/Soreq and Hulu/Sanbao, the (negative) correlation
between insolation and δ18Oc is greater when the ice volume impact on ocean δ18O is first
removed, but not significantly so. The amplitude at Tianmen, Hoti and Mukalla is discussed in
section 1.Cave and Location Duration Amplitude ReferencePeqiin (32◦58”N 35◦19”E,650m asl) plus Soreq(31◦45”N 35◦03E, 400masl)
184 kyr -1.6‰ (-1.0,-2.2)
Bar-Matthews [2003];Bar-Matthews et al.[1997, 2000]
Hulu (32◦30”N 119◦10”E;31◦40”N, 100m asl) plusSanbao (32◦40’N 110◦27”E,1900m asl)
224 kyr -3.8‰ (-3.3,-4.3)
Wang et al. [2001];Cheng et al. [2009]
Kesang (42◦52”N 81◦45”E,2000m asl)
500 kyr -3.9‰ (-3.1,-4.7)
Cheng et al. [2012]
Tianmen (30◦55”N90◦40”E, 4800m asl)
127 kyr -7‰ Cai et al. [2010]
Hoti (23◦05”N 57◦21”E,800m asl)
82 kyr -4‰ Burns et al. [1998],Burns et al. [2001],Fleitmann [2003]
Mukalla ( 14◦55’N 48◦35’E,1500m asl)
129 kyr -4‰ Fleitmann et al. [2011]
Sofular (41◦25”N 31◦56”E,700m asl)
50 kyr 0‰ Fleitmann et al. [2009]
D R A F T August 6, 2014, 4:44pm D R A F T

BATTISTI ET AL.: THE PAN-ASIAN MONSOON X - 51
Table 2. Sources of the difference in precipitation-weighted δ18O (δ18Op) averaged over Tibet
(26-32.5◦N, 85-95◦E) and northeast Africa (12-21◦N, 25-45◦E). The net difference in δ18Op due
to both the precipitation and δ18O changes (218 kbp minus 207 kbp) is highlighted in bold.
The importance of summer changes is illuminated in the “Summer Only” rows, whereby the
δ18Op at 218 kbp is calculated using a hybrid time series of precipitation and/or δ18O: summer
(June - September) precipitation and/or δ18O is taken from the 218 kbp simulation, while winter
(October - May) precipitation and δ18O are taken from the 207 kbp simulation. Similarly, the
“Winter Only” row illuminates the importance of changes in precipitation and/or δ18O in the
winter months October - May. Column four shows the importance of the change in δ18O to
the change in δ18Op; it is found by substituting the 207 kbp precipitation into Equation 2 when
calculating the 218 kbp δ18Op. Similarly, column five shows the importance of the change in
precipitation to the change in δ18Op.
Location Months Used ∆(precip)and ∆(δ18O)
∆(δ18O)only
∆(precip)only
Tibet All -6.28 ‰ -7.07 ‰ +1.18 ‰Tibet Summer Only -5.45 ‰ -5.21 ‰ +0.86 ‰Tibet Winter Only -0.86 ‰ -1.86 ‰ +0.47 ‰NE Africa All -3.73 ‰ -3.11 ‰ -1.15 ‰NE Africa Summer Only -3.56 ‰ -2.46 ‰ -1.16 ‰NE Africa Winter Only -0.63 ‰ -0.66 ‰ -0.75 ‰
D R A F T August 6, 2014, 4:44pm D R A F T

X - 52 BATTISTI ET AL.: THE PAN-ASIAN MONSOON
050100150200250
−101
−101
−101
−101
Time (kyr BP)
Sanbao/Hulu −9.1
Tianmen −20.6
Kesang −9.7
Soreq/Peqiin −5.1
Figure 1. Time series of the oxygen isotopic composition of calcite δ18Oc (in ‰) in stalagmites
across Asia that are sufficiently long to resolve orbital time scales. For each speleothem, the time
average δ18Oc is noted (e.g., Tianmen = -20.6‰) and removed before plotting. Superposed on
each speleothem record is the summer (JJA) insolation at 30◦N (in green). For ease of viewing,
the insolation has been scaled so that the standard deviation of insolation is identical to the
standard deviation of the δ18Op (in ‰) for the respective cave record. Within a single cave, the
records are constructed from several stalagmites, each of which is indicated by a separate color.
The cave locations and references for the speleothem data are provided in Table 1.
D R A F T August 6, 2014, 4:44pm D R A F T
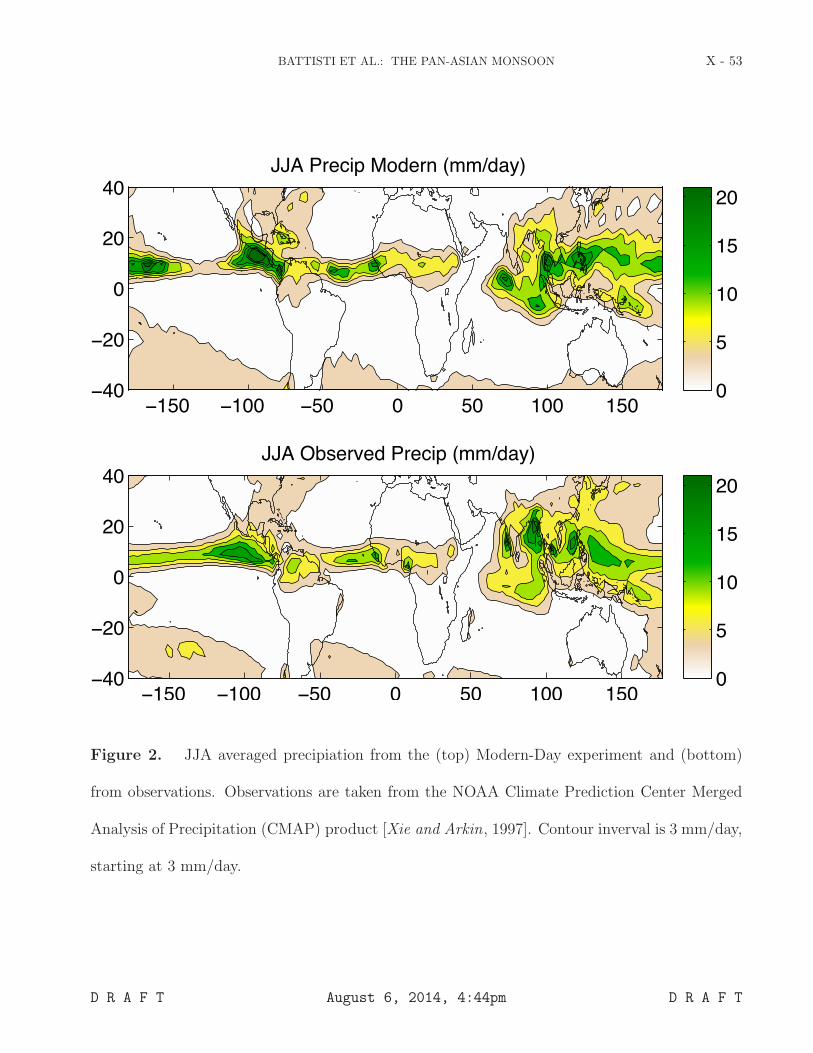
BATTISTI ET AL.: THE PAN-ASIAN MONSOON X - 53
JJA Precip Modern (mm/day)
−150 −100 −50 0 50 100 150−40
−20
0
20
40
0
5
10
15
20
JJA Observed Precip (mm/day)
−150 −100 −50 0 50 100 150−40
−20
0
20
40
0
5
10
15
20
Figure 2. JJA averaged precipiation from the (top) Modern-Day experiment and (bottom)
from observations. Observations are taken from the NOAA Climate Prediction Center Merged
Analysis of Precipitation (CMAP) product [Xie and Arkin, 1997]. Contour inverval is 3 mm/day,
starting at 3 mm/day.
D R A F T August 6, 2014, 4:44pm D R A F T

X - 54 BATTISTI ET AL.: THE PAN-ASIAN MONSOON
DJF Precip Modern (mm/day)
−150 −100 −50 0 50 100 150−40
−20
0
20
40
0
5
10
15
20
DJF Observed Precip (mm/day)
−150 −100 −50 0 50 100 150−40
−20
0
20
40
0
5
10
15
20
Figure 3. As in Figure 2, but for DJF.
D R A F T August 6, 2014, 4:44pm D R A F T
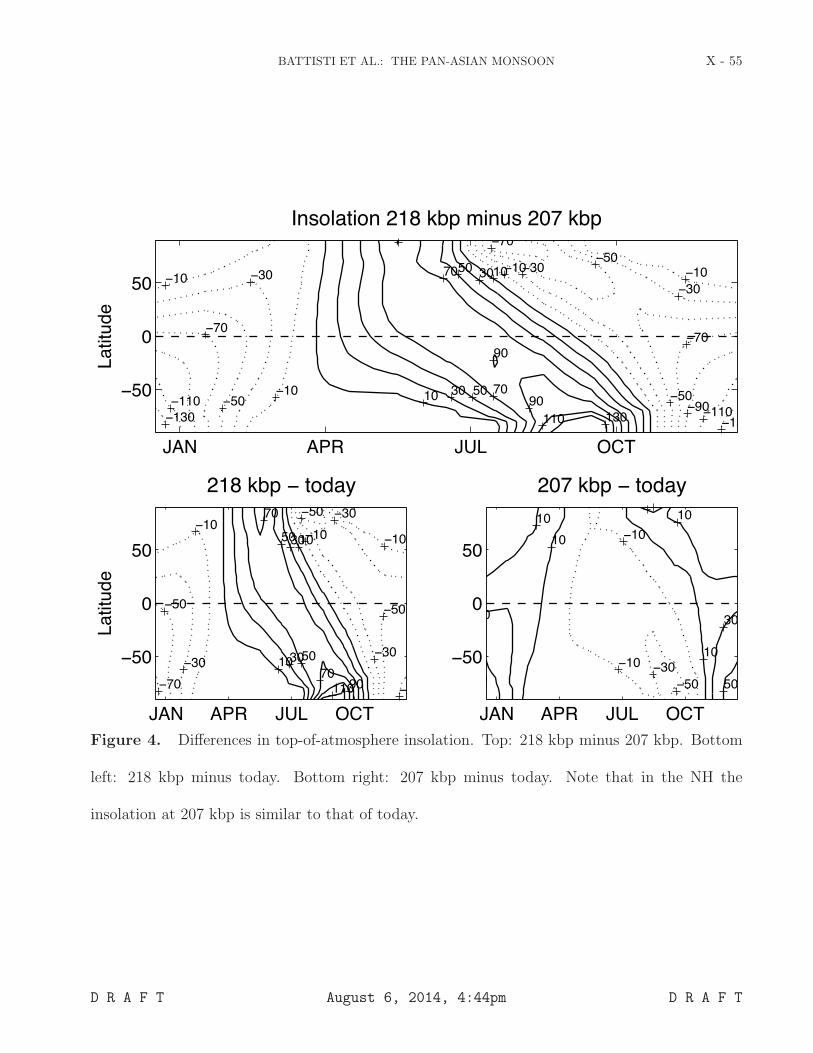
BATTISTI ET AL.: THE PAN-ASIAN MONSOON X - 55
−130 −13
−110−110−90
−70
−70
−70
−50
−50
−50
−30 −30
−30
−10
−10−10 −10
10
10
30
30
50
50
70
70
90
90
110 130
Insolation 218 kbp minus 207 kbp
Latit
ude
JAN APR JUL OCT
−50
0
50
−70 −
−50
−50
−50
−30−30
−30−10
−10 −10
10
10
30
30
50
50
70
7090110
Latit
ude
218 kbp − today
JAN APR JUL OCT
−50
0
50
−50−30−10
−1010
10
10
10
0 30
0 50
207 kbp − today
JAN APR JUL OCT
−50
0
50
Figure 4. Differences in top-of-atmosphere insolation. Top: 218 kbp minus 207 kbp. Bottom
left: 218 kbp minus today. Bottom right: 207 kbp minus today. Note that in the NH the
insolation at 207 kbp is similar to that of today.
D R A F T August 6, 2014, 4:44pm D R A F T
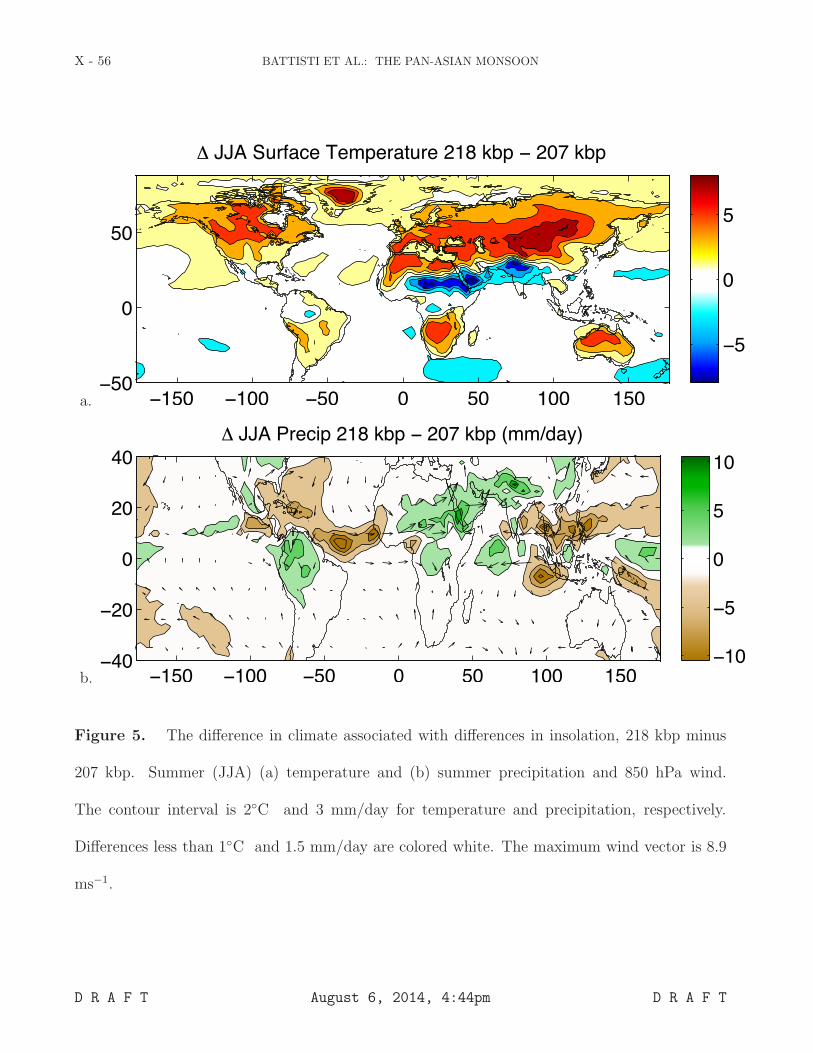
X - 56 BATTISTI ET AL.: THE PAN-ASIAN MONSOON
a.
∆ JJA Surface Temperature 218 kbp − 207 kbp
−150 −100 −50 0 50 100 150−50
0
50
−5
0
5
b.
∆ JJA Precip 218 kbp − 207 kbp (mm/day)
−150 −100 −50 0 50 100 150−40
−20
0
20
40
−10
−5
0
5
10
Figure 5. The difference in climate associated with differences in insolation, 218 kbp minus
207 kbp. Summer (JJA) (a) temperature and (b) summer precipitation and 850 hPa wind.
The contour interval is 2◦C and 3 mm/day for temperature and precipitation, respectively.
Differences less than 1◦C and 1.5 mm/day are colored white. The maximum wind vector is 8.9
ms−1.
D R A F T August 6, 2014, 4:44pm D R A F T

BATTISTI ET AL.: THE PAN-ASIAN MONSOON X - 57
a.
∆ DJF Surface Temperature 218 kbp − 207 kbp
−150 −100 −50 0 50 100 150−50
0
50
−5
0
5
b.
∆ DJF Precip 218 kbp − 207 kbp (mm/day)
−150 −100 −50 0 50 100 150−40
−20
0
20
40
−10
−5
0
5
10
Figure 6. As in Figure 5, but for winter (DJF). The maximum wind vector is 5.9 m/s.
D R A F T August 6, 2014, 4:44pm D R A F T

X - 58 BATTISTI ET AL.: THE PAN-ASIAN MONSOON
∆ Pecip Weighted δ18O 218 kbp − 207 kbp
−150 −100 −50 0 50 100 150−40
−20
0
20
40
−6
−4
−2
0
2
Figure 7. The difference the precipitation-weighted δ18O (δ18Op) associated with differences in
insolation, 218 kbp minus 207 kbp. The contour interval is 1‰. Differences of less than 1 ‰ are
colored white.
D R A F T August 6, 2014, 4:44pm D R A F T

BATTISTI ET AL.: THE PAN-ASIAN MONSOON X - 59
a.
∆ JJA Precip 218 kbp − 207 kbp (mm/day)
20 40 60 80 100 120 140−20
0
20
40
−10
−5
0
5
10
b.
∆ Pecip Weighted δ18O 218 kbp − 207 kbp
−3.8
−3.9
−7? −1.6 −4
0?
−4
20 40 60 80 100 120 140−20
0
20
40
−6
−4
−2
0
2
Figure 8. Regional excerpts of the differences in summer (JJA) (a) precipitation and (b)
δ18Op associated with extremes in the insolation forcing, shown in Figures 5 and 7. Superposed
on the JJA precipitation are the changes in the 850 hPa wind velocity; numbers in red in panel
(b) indicate the scaled difference in δ18Oc recorded in the stalagmites listed in Table 1, high-
minus low- JJA insolation. The maximum vector length is 11.5 m/s. Contouring and coloring
as in Figures 5(b) and 7. The red/white boxes indicate the regions used in the calculations of
section 4.1 and shown in Table 2 and Figures 9 and 10.
D R A F T August 6, 2014, 4:44pm D R A F T

X - 60 BATTISTI ET AL.: THE PAN-ASIAN MONSOON
JAN APR JUL OCT JAN0
2
4
6
8
prec
ip (
mm
/day
)Tibet (26−32°N, 85−95°E)(b)
JAN APR JUL OCT JAN−25
−20
−15
−10
−5
0
δ18O
(d)
JAN APR JUL OCT JAN0
2
4
6
8
prec
ip (
mm
/day
)
NE Africa (12−21°N, 25−45°E)
(a)
207218
JAN APR JUL OCT JAN−20
−15
−10
−5
0
δ18O
(c)
Figure 9. The climatological annual cycle of precipitation and the monthly δ18O of precipi-
tation averaged over Tibet and northeast Africa, the regions of maximum differences in summer
precipitation and δ18Op associated with the extremes in the insolation forcing. Values in green
(blue) are for 218 kbp (207 kbp) insolation, a time of maximum (minimum) summer insolation
in the Northern Hemisphere. Also for reference is the annual cycle of precipitation from the
control (Modern-Day) simulation of the climate model using modern-day insolation (solid black)
and from observations (blacked dashed); the latter is from the NOAA Climate Prediction Center
Merged Analysis of Precipitation (CMAP) product [Xie and Arkin, 1997]. Averages are taken
over the boxed regions in Figure 8. The units on δ18O are ‰.
D R A F T August 6, 2014, 4:44pm D R A F T

BATTISTI ET AL.: THE PAN-ASIAN MONSOON X - 61
0 10 20 30 40−15
−10
−5
0Tibet
δ18
O (
per
mil)
(a)
0 10 20 30 400
0.2
0.4
0.6
0.8
1
Daily precip (mm)
Cum
. PD
F
(c)
207218
0 10 20 30 40−10
−5
0
5NE Africa
δ18
O (
per
mil)
(b)
0 10 20 30 400
0.2
0.4
0.6
0.8
1
Daily precip (mm)
Cum
. PD
F
(d)
207218
Figure 10. Top panels: the average δ18O of the daily average precipitation in summer,
binned as a function of the daily precipitation amount for (a) Tibet and (b) NE Africa. Bottom
panels: the cumulative precipitation in summer for (c) Tibet and (d) NE Africa, binned by daily
precipitation amount. For these calculations, we use 30 years of daily data from all of grid points
within the regions indicated in Figure 8.
D R A F T August 6, 2014, 4:44pm D R A F T

X - 62 BATTISTI ET AL.: THE PAN-ASIAN MONSOON
a.
∆ δ18O of column integrated water vapor 218 kbp − 207 kbp
20 40 60 80 100 120 140−20
0
20
40
−6
−4
−2
0
2
b.
∆ δ18Op minus ∆ δ18O of water vapor
20 40 60 80 100 120 140−20
0
20
40
−6
−4
−2
0
2
Figure 11. (a) The change in the δ18O of the column integrated water vapor δ18Ov,
high-insolation experiment minus low-insolation experiment. (b) The change in δ18Op that
is not explained by the change in the δ18O of the water vapor in the local environment:
(δ18Op(218) − δ18Op(207)) − (δ18Ov(218) − δ18Ov(207)). Units are per mille; contour interval
as in Figure 7.
D R A F T August 6, 2014, 4:44pm D R A F T

BATTISTI ET AL.: THE PAN-ASIAN MONSOON X - 63
a.
Observed Θe June
0 20 40 60 80 100 120 140−20
0
20
40
310
320
330
340
350
360
b.
Θe JJA 207 kbp
0 20 40 60 80 100 120 140−20
0
20
40
310
320
330
340
350
c.
Θe JJA 218 kbp
0 20 40 60 80 100 120 140−20
0
20
40
310
320
330
340
350
d.
3
15 15
3
21
9
9
27
9
3
27
15
3
3
3
33
3
279
Change in Θe JJA 218 kbp − 207 kbp
0 20 40 60 80 100 120 140−20
0
20
40
−20
0
20
Figure 12. Near-surface equivalent potential temperature θe in (a) June at the onset of the
monsoon from observations, and for summertime (JJA) in the (b) low-insolation experiment,
and (c) high-insolation experiment. Panel (d) shows the difference between the high- and low-
insolation experiments. Units are Kelvin. The observed θe is calculated from NCEP Reanalysis
data provided by the NOAA/OAR/ESRL PSD, Boulder, Colorado, USA, from their Web site at
http://www.esrl.noaa.gov/psd.
D R A F T August 6, 2014, 4:44pm D R A F T

X - 64 BATTISTI ET AL.: THE PAN-ASIAN MONSOON
5050
100100100
100 5050
50
50
50
75
75
75
75
75
100100
100
100100
125 125
218 kbp
20 40 600
10
20
30
40
50
50
50
0
0
50500
0
50
50
50
50
5050
75
207 kbp
20 40 600
10
20
30
40
50
0
100 0 0
50
100
0
100
100
100100
00
50
100
0
100
50
0
50
100 50
100
100
50
500
50
50
0
0
50
50
100
0
0
100
100
50
Observed (2001−2012)
20 40 600
10
20
30
40
50
Figure 13. The net radiation at the top of the atmosphere for June-August from the (left)
218 kyr and (right) 207 kbp simulations; also shown is the observed net radiation from CERES
(2001-2012). Contour interval is 25 Wm−2; the bold (dashed) line is the zero (-25 Wm−2) contour.
Positive values indicate an energy gain by the atmosphere.
D R A F T August 6, 2014, 4:44pm D R A F T

BATTISTI ET AL.: THE PAN-ASIAN MONSOON X - 65
a.
JJA Precip 207 kbp − Modern (mm/day)
−150 −100 −50 0 50 100 150−40
−20
0
20
40
−10
−5
0
5
10
b.
DJF Precip 207 kbp − Modern (mm/day)
−150 −100 −50 0 50 100 150−40
−20
0
20
40
−10
−5
0
5
10
Figure A1. The difference between the climatological precipitation in the low-insolation
(207 kbp) experiment minus the Modern-Day (i.e., with today’s insolation) experiment: JJA
(top) and DJF (bottom). The contour interval is 3 mm/day. Differences less than 1.5 mm/d are
white.
D R A F T August 6, 2014, 4:44pm D R A F T

X - 66 BATTISTI ET AL.: THE PAN-ASIAN MONSOON
JJA Precip 218 kbp (mm/day)
−150 −100 −50 0 50 100 150−40
−20
0
20
40
0
5
10
15
20
JJA Precip 207 kbp (mm/day)
−150 −100 −50 0 50 100 150−40
−20
0
20
40
0
5
10
15
20
Figure A2. The climatological JJA precipitation and 850 hPa wind velocity from the (top)
high-insolation (218 kbp) and (bottom) low-insolation (207 kbp) experiment. Contour interval
is 3 mm/day. The maximum wind vector is 14.4 m/s.
D R A F T August 6, 2014, 4:44pm D R A F T