Cognos 8 Best Practices Vol 2
13
Northwestern University Northwestern University Business Intelligence Solutions Cognos 8 Best Practices Volume 2 Dimensional vs Relational Reporting
-
Upload
phanishbajjuri -
Category
Documents
-
view
215 -
download
4
Transcript of Cognos 8 Best Practices Vol 2

Northwestern UniversityNorthwestern UniversityBusiness Intelligence Solutions
Cognos 8 Best PracticesgVolume 2
Dimensional vs Relational Reporting

Reporting StylesReporting Styles
Relational Reports are composed primarily of list reports, query items, detail and summary filters p , q y , yfrom a relational data source.
Dimensional Reports are composed of cross-tab e s o a epo ts a e co posed o c oss tabstyle reports using members, set expressions, and allowing for ragged and unbalanced hierarchies, drill-up/drill-down and summaries.

Model StylesModel Styles
Relational Models are the direct model representedRelational Models are the direct model represented in the database. They allow for detail reporting and use SQL queries to retrieve the data.
Dimensional Models are either DMR models added onto a Relational model or more frequently an OLAP data source. They allow for summary
i i h hi hi d ill d dreporting with hierarchies, drill-down and unbalanced hierarchies. They use MDX queries to retrieve the dataretrieve the data.

Relational vs Dimensional StylesRelational vs Dimensional Styles
Relational DimensionalRelated subjects from tables/folders HierarchyIdentifier query item/dimension item LevelFact query item/value MeasureFact query item/value MeasureAttribute query item/descriptor Attribute itemNested grouping of dimension items Nested children or descendantsDetail filter on dimension items Member sets, on edge or in slicerDetail filter on attribute Filter function using attribute on edge or
slicerFilter on fact summary Filter function using measure
Arbitrary set functionsFilter on fact detail>1 of the above Tuple (cube intersection)Header/footer Parent member set or summary

Relational vs Dimensional StylesRelational vs Dimensional Styles
Relational DimensionalList report Cross-tab reportDetailed list reportSummary FOR Summary WITHIN SETy yDrill-through by value(s) Drill-through by member
Drill up/downFilter on single identifier value + auto Single memberFilter on single identifier value + auto-summarize
Single member
Use Relational reports for most detail and list style reports Relational reports
Use Dimensional reports for most cross-tab summary reports Dimensionaland list style reports. Relational reports
are also the standard when reporting against data marts, even dimensionally modeled star schema designs. Avoid
l t b i R l ti l t
tab, summary reports. Dimensional reports are the standard when reporting against OLAP data sources and DMR models in Framework Packages. Do not t t d d t il li t i Di i lcomplex cross-tabs in Relational reports. try to do detail lists in Dimensional reports.
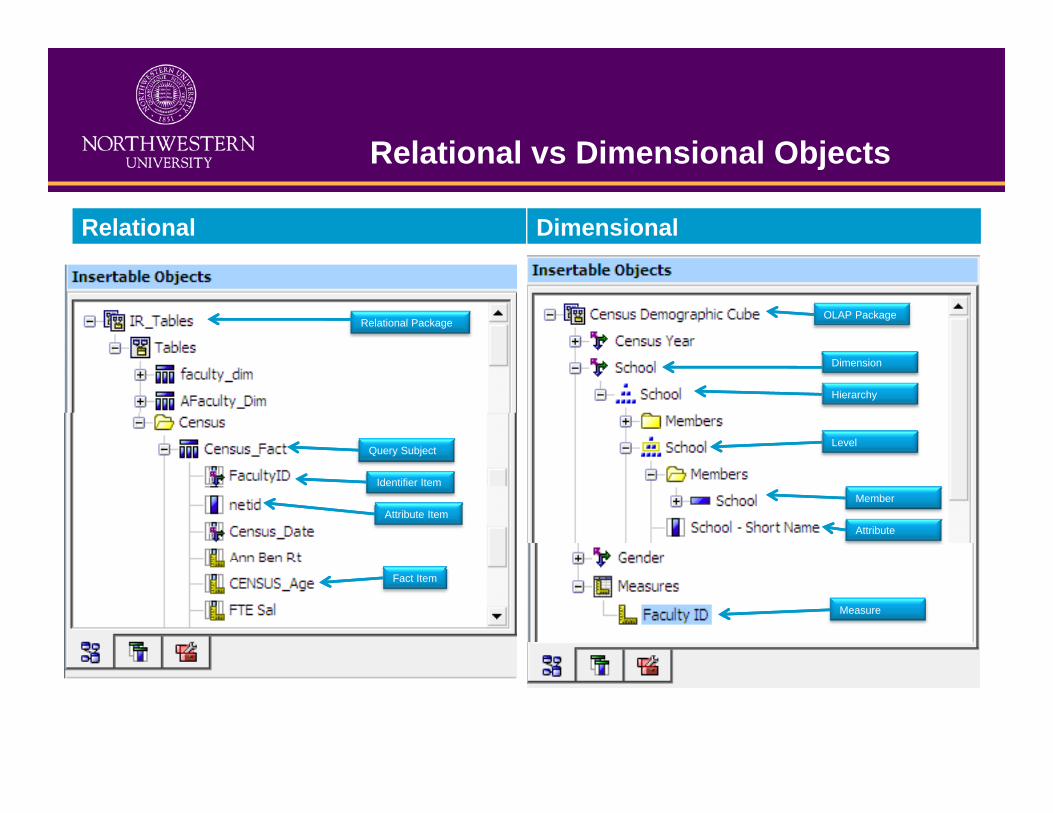
Relational vs Dimensional ObjectsRelational vs Dimensional Objects
Relational Dimensional
Relational PackageOLAP Package
Query Subject
Dimension
Hierarchy
Level
Identifier Item
Attribute ItemMember
Attribute
Fact Item
Measure
Detail Filter vs SlicerDetail Filter vs Slicer
Relational Dimensional
Drag the member to slice by into the Slicer pane in the Query work area
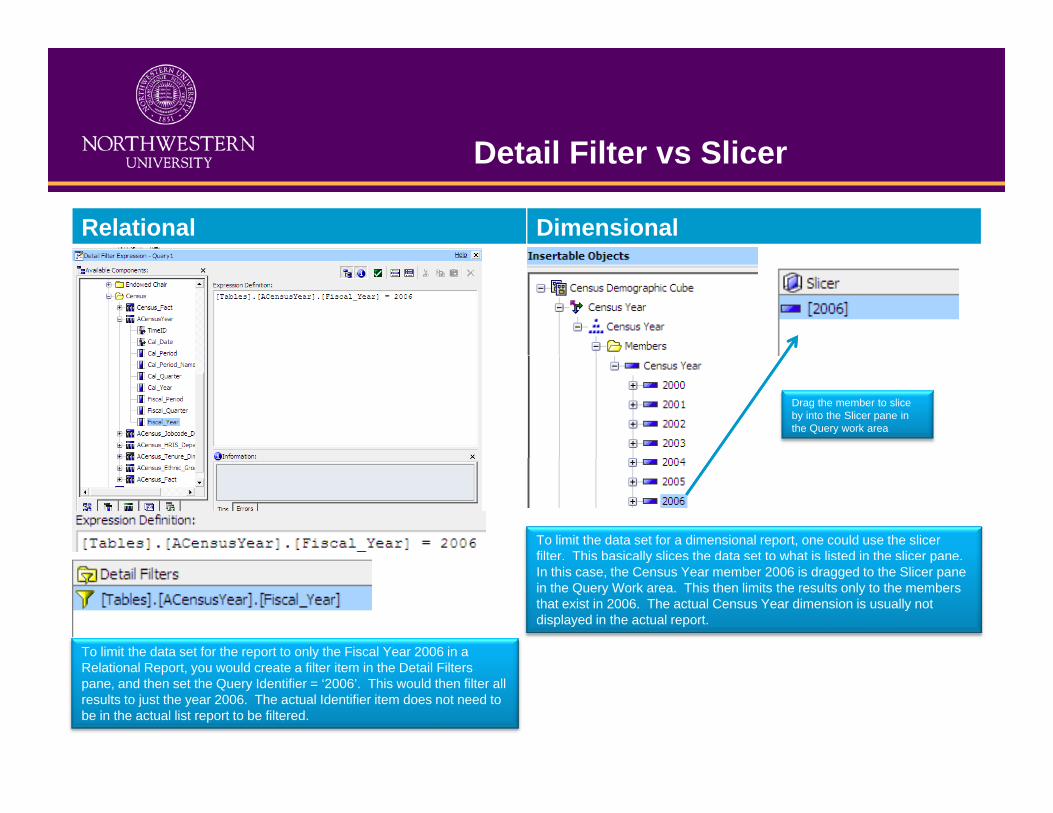
To limit the data set for a dimensional report, one could use the slicer filter. This basically slices the data set to what is listed in the slicer pane.
To limit the data set for the report to only the Fiscal Year 2006 in a R l ti l R t ld t filt it i th D t il Filt
y pIn this case, the Census Year member 2006 is dragged to the Slicer pane in the Query Work area. This then limits the results only to the members that exist in 2006. The actual Census Year dimension is usually not displayed in the actual report.
Relational Report, you would create a filter item in the Detail Filters pane, and then set the Query Identifier = ‘2006’. This would then filter all results to just the year 2006. The actual Identifier item does not need to be in the actual list report to be filtered.

Dimensional Filter FunctionDimensional Filter Function
First we run a simple dimensional report of Faculty Count for Schools by Census Year.
We then decide we only want to see schools with a large number of faculty so we decide to filter rows that only have more than 1,000 members. If you notice, this means that it filters out rows th t d ’t h ll ith th > 1000 Y l filtthat don’t have a cell with the measure > 1000. You apply a filter function to a reference row and then the actual filter value. For school name, only show rows that have a count of Faculty ID > 1000.
To do this in a relational report, you would create a summary filter where Faculty ID > 1000.

Dimensional SetsDimensional Sets
To select a specific group of members from a dimension, you would use the set function in a p g p yDimensional report. This would then only retrieve the members you wish to see. In a relational report you would create a filter on the Dimension Identifier and make an inclusive or exclusive filter.
Add the Set function to the rows, and then in the function, add the members that you would like to have in the set. When you run the report you will only see the members you selected.
You can also uses sets to define rollups. If you added a summary of Schools to the rows, you would see the count for all the schools. However, if you added an aggregate function for the set, you would only see those values summed.
Relational vs Dimensional Cross JoinsRelational vs Dimensional Cross Joins
Relational Dimensional
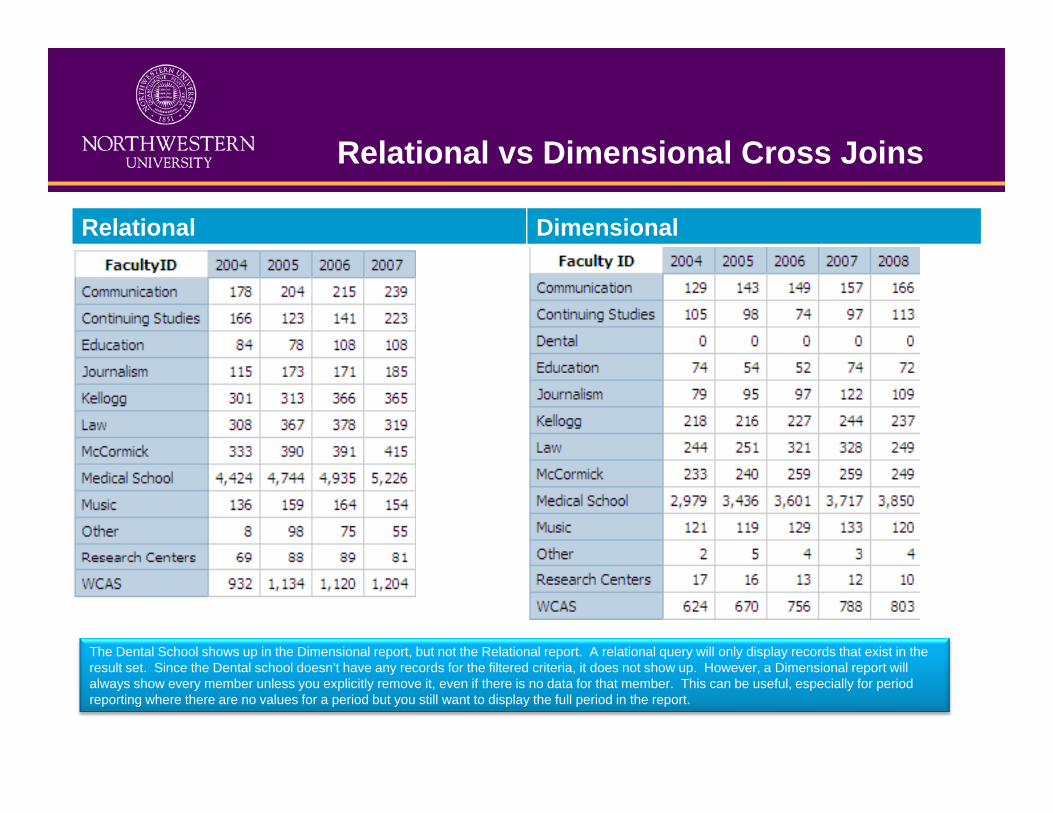
The Dental School shows up in the Dimensional report, but not the Relational report. A relational query will only display records that exist in the lt t Si th D t l h l d ’t h d f th filt d it i it d t h H Di i l t illresult set. Since the Dental school doesn’t have any records for the filtered criteria, it does not show up. However, a Dimensional report will
always show every member unless you explicitly remove it, even if there is no data for that member. This can be useful, especially for period reporting where there are no values for a period but you still want to display the full period in the report.
Dimensional Cross Join IssueDimensional Cross Join Issue
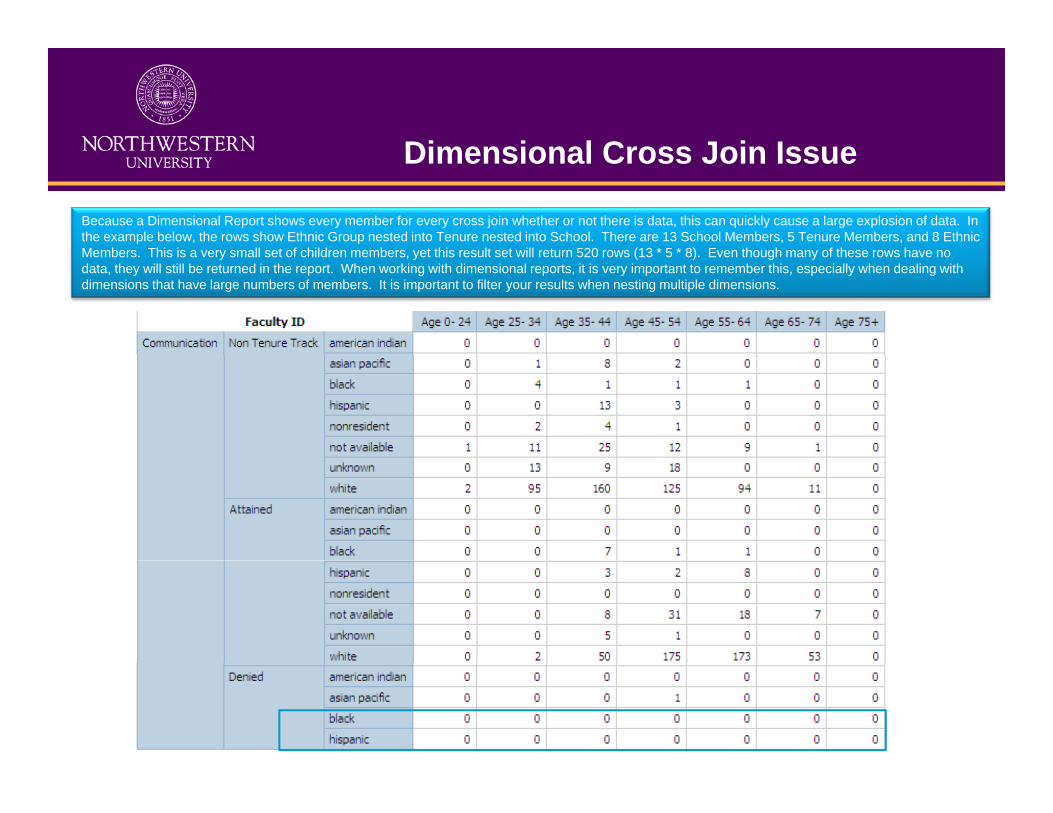
Because a Dimensional Report shows every member for every cross join whether or not there is data, this can quickly cause a large explosion of data. In the example below, the rows show Ethnic Group nested into Tenure nested into School. There are 13 School Members, 5 Tenure Members, and 8 Ethnic Members This is a very small set of children members yet this result set will return 520 rows (13 * 5 * 8) Even though many of these rows have noMembers. This is a very small set of children members, yet this result set will return 520 rows (13 5 8). Even though many of these rows have no data, they will still be returned in the report. When working with dimensional reports, it is very important to remember this, especially when dealing with dimensions that have large numbers of members. It is important to filter your results when nesting multiple dimensions.

Keeping SafeKeeping Safe
When writing reports in Report Studio, Validate early and Validate often.When a warning shows up, deal with it. Warning will allow a report to run, but you may get unexpected results, especially if you are mixing , y y g p , p y y gdimensional and relational functions.Remember which functions are for Relational reports and which are for Dimensional reports and don’t use the wrong function set. Again, you p g g , ymay get results, but they can be unexpected. It is always better to not return data than to return incorrect data.If you aren’t comfortable with writing Dimensional Reports, then use y g p ,Analysis Studio against Dimensional data sources. Analysis Studio, like Query Studio for Relational, only allows for dimensional reporting.

Further InformationFurther Information
IBM Cognos 8 Business Intelligence: The Official Guide by Dan Volitich, Chapter 12: Advanced Reporting IIIApplying Filters to Dimensional Reports http://support.cognos.com/supported/docs/en/html/cognos8_bi/8.3/rdm_cr_id1229ApplyingFilterstoDimensionalReports htmlnsionalReports.html
Understanding an Analysis in Report Studio http://support.cognos.com/supported/tti/public/docs/cognos_pp_reporting_understanding_an_analysis_in_report_studio.pdf
Advanced Multidimensional Reporting http://support.cognos.com/supported/tti/partner/docs/cognos_pp_reporting_advanced_multidimensional_reporting.pdf?lid=cognos_pp_reporting_advanced_multidimensional_reporting
Writing Efficient OLAP QueriesWriting Efficient OLAP Queries http://support.cognos.com/supported/tti/public/docs/cognos_pp_reporting_writing_efficient_olap_queries.pdf