

Cognitive, personality and behavioural predictors of academic success in a large undergraduate...
44
Cognitive, personality and behavioural predictors of academic success in a large undergraduate program. Dr Matthew Dry University of Adelaide, School of Psychology
-
Upload
blackboard-apac -
Category
Education
-
view
535 -
download
0
Transcript of Cognitive, personality and behavioural predictors of academic success in a large undergraduate...

Cognitive, personality and behavioural predictors of academic success in a large undergraduate program. Dr Matthew Dry
University of Adelaide, School of Psychology
Acknowledgements … and a disclaimer ….
• My co-authors are Clemence Due, Anna Chur-Hansen, and Nicholas Burns (all from Adelaide Uni School of Psychology)
• This research has been partly funded by an Office of Learning and Teaching Seed grant
• We have received technical support from McGraw-Hill, but none of the authors are affiliated with the company, and they have not provided any financial support for this research!
2

I am a psychologist ….. and an academic …
3
• I am interested in human behaviour in general
• As a teacher I’m particularly interested in why some students do well, (and others not so well) and the factors that play a role in this.
Online learning tools
• Come in all sorts of colours and flavours – quizzes, videos, interactive experiments, puzzles, etc
• It is generally claimed (or assumed?) that they aid student learning
• But assessing their actual utility is hard
4
Talk Outline
1. The Context
2. The Tool – How LearnSmart works – Initial Findings
3. The Research – The psychological factors influencing academic success – The current study – Results
4. Blackboard data
5. General Discussion, etc
5
The Context – Large Undergraduate Psychology Course
• Psychology 1A (Semester 1) N = 700
• Psychology 1B (Semester 2) N = 600
• Each semester covers six core concept areas, e.g. in 1B: – Developmental psychology
– Statistics
– Personality
– Motivation & Emotion
– Learning
– Intelligence
6

The Context – Large Undergraduate Psychology Course
• Most of the assessment, and all of the course content is hosted on or accessed via BlackBoard
• Assessment tasks: – Online quizzes assessing the six topic areas (MAEs – Module
Assessment Exercises) = 20%
– A research report = 15%
– Research Participation = 10%
– End-of-semester exam = 55%
7
The Context – Large Undergraduate Psychology Course
• The textbook we use is Passer, M. W. & Smith, R. E. (2013). Psychology – The Science of Mind and Behaviour (Australian Edition). McGraw-Hill: North Ryde, NSW – Most introductory psychology texts cover exactly the same material
– Even the chapters tend to be in the same order
– Like most textbooks it comes with a range of online supplementary materials
– The reason I adopted this textbook was because of the LearnSmart tool
8

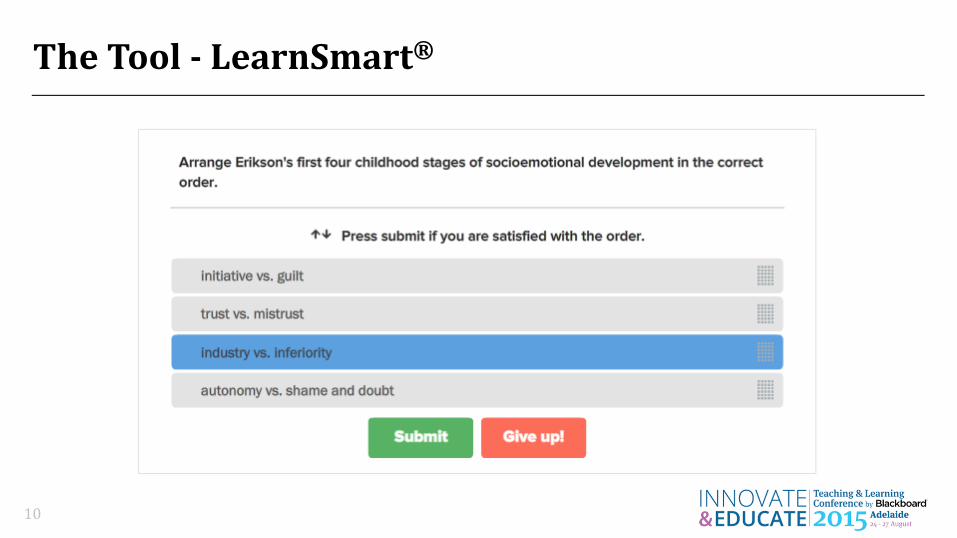
The Tool - LearnSmart®
• Online quiz covering the textbook chapter content
9
The Tool - LearnSmart®
10

The Tool - LearnSmart®
11

The Tool - LearnSmart®
• LearnSmart is adapts to the student’s ability level based on – Correct versus incorrect answers – The metacognitive data (I know it/I think so/Unsure/ No idea)
• If students get questions right and are well calibrated the questions get harder
• If students get questions wrong or are poorly calibrated the questions get easier
• It seemed to me that students would be more motivated to perform this task because the degree of challenge would be matched to the student … so I set it as an extension task for students to complete if they wanted or to ignore if they chose…
12
The Tool - LearnSmart®
• Each of the six course topics is assessed via an online quiz (MAE)
• Students that had completed the LearnSmart task associated with each of these topics prior to the MAE did better than the other students: – This was a statistically significant difference
– It was consistent across topic areas and cohorts
– It amounted to a difference of around 5-15%
13

Why would this happen?
• Is it the tool? And what aspects of the tool in particular? – Adaptation?
– Metacognitive aspect (calibration)?
– Immediacy of feedback?
• Is it something to do with the type of student that chose to use the tool? – We know that there are certain psychological variables that affect
academic success …
14
The Psychology of Academic Success
• There is a large body of literature investigating the affect of individual differences in psychological variables on academic success: – IQ affects success. Smart students tend to do better than not-so-smart
students.
– Personality affects success:
• Two of the Big 5 personality trait (conscientiousness & openness)
• Epistemic curiosity, need for cognition
• Learning Style
15
The chicken or the egg?
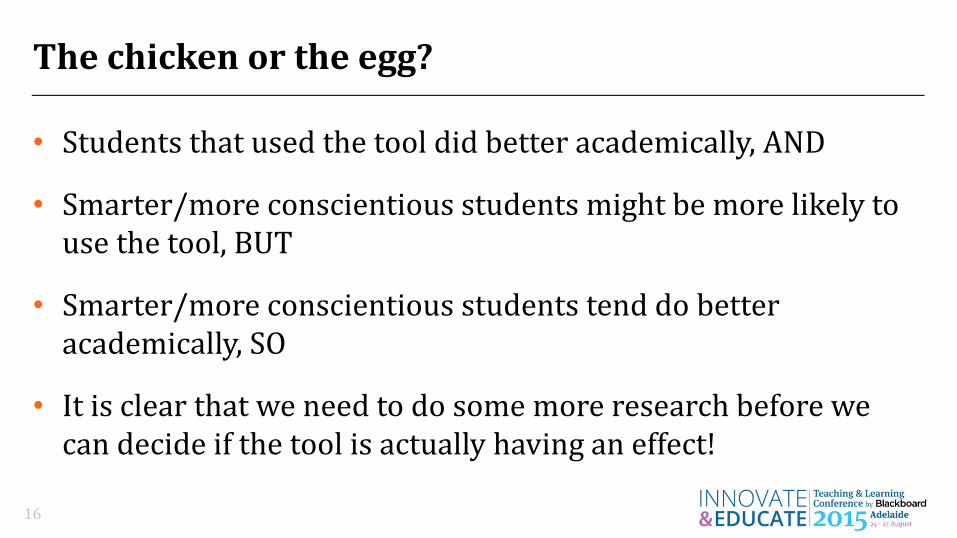
• Students that used the tool did better academically, AND
• Smarter/more conscientious students might be more likely to use the tool, BUT
• Smarter/more conscientious students tend do better academically, SO
• It is clear that we need to do some more research before we can decide if the tool is actually having an effect!
16
The Current Study
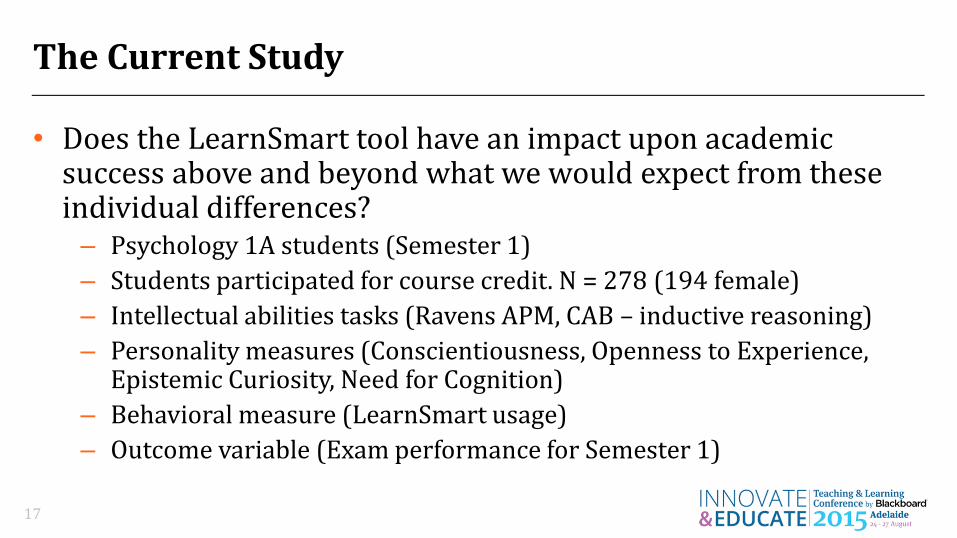
• Does the LearnSmart tool have an impact upon academic success above and beyond what we would expect from these individual differences? – Psychology 1A students (Semester 1)
– Students participated for course credit. N = 278 (194 female)
– Intellectual abilities tasks (Ravens APM, CAB – inductive reasoning)
– Personality measures (Conscientiousness, Openness to Experience, Epistemic Curiosity, Need for Cognition)
– Behavioral measure (LearnSmart usage)
– Outcome variable (Exam performance for Semester 1)
17

The Current Study
• Does the LearnSmart tool have an impact upon academic success above and beyond what we would expect from these individual differences? – Psychology 1A students (Semester 1)
– Students participated for course credit. N = 278 (194 female)
– Intellectual abilities tasks (Ravens APM, CAB – inductive reasoning)
– Personality measures (Conscientiousness, Openness to Experience, Epistemic Curiosity, Need for Cognition)
– Behavioral measure (LearnSmart usage)
– Outcome variable (Exam performance for Semester 1)
18

Measuring intellectual ability – Ravens APM
19
This one is relatively easy ….
But this one is quite hard!

Measuring Personality Trait – Need For Cognition
20

Comparing LearnSmart Users (n = 159) and Non-Users (n = 119)
Measure Cohen’s d p-value
Intellectual Abilities CAB-I 0.07 .54
Ravens APM 0.01 .94
Personality Traits Conscientiousness 0.45 <.001
Epistemic Curiosity 0.42 <.001
Need for Cognition 0.41 <.001
Openness to Experience 0.32 .009
21
Users did not differ from Non-users on the intellectual abilities measures: Being clever does not make you more or less likely to use the tool

Comparing LearnSmart Users (n = 159) and Non-Users (n = 119)
Measure Cohen’s d p-value
Intellectual Abilities CAB-I 0.07 .54
Ravens APM 0.01 .94
Personality Traits Conscientiousness 0.45 <.001
Epistemic Curiosity 0.42 <.001
Need for Cognition 0.41 <.001
Openness to Experience 0.32 .009
22
Users were more significantly more conscientious and open to experience, and had a higher degree of epistemic curiosity and need for cognition.
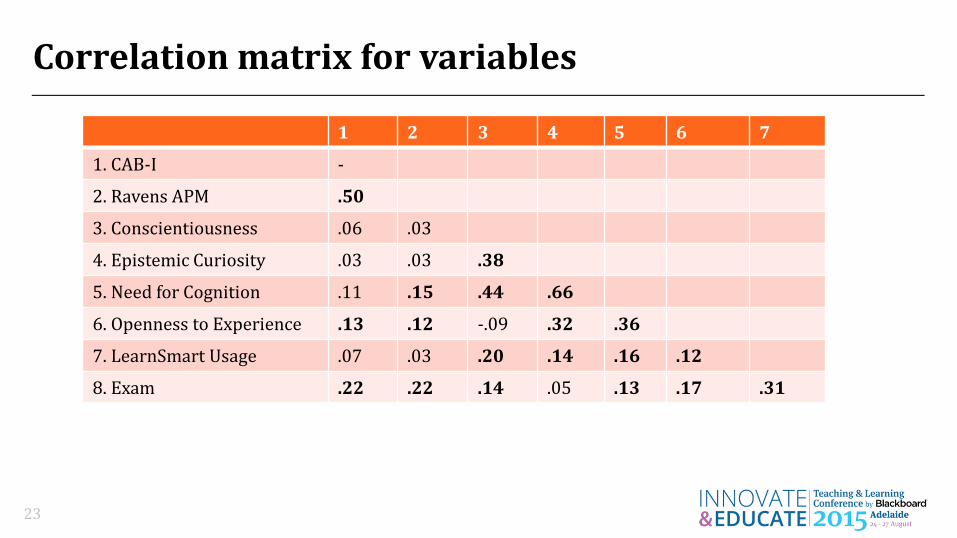
Correlation matrix for variables
1 2 3 4 5 6 7
1. CAB-I -
2. Ravens APM .50
3. Conscientiousness .06 .03
4. Epistemic Curiosity .03 .03 .38
5. Need for Cognition .11 .15 .44 .66
6. Openness to Experience .13 .12 -.09 .32 .36
7. LearnSmart Usage .07 .03 .20 .14 .16 .12
8. Exam .22 .22 .14 .05 .13 .17 .31
23

Correlation matrix for variables
1 2 3 4 5 6 7
1. CAB-I -
2. Ravens APM .50
3. Conscientiousness .06 .03
4. Epistemic Curiosity .03 .03 .38
5. Need for Cognition .11 .15 .44 .66
6. Openness to Experience .13 .12 -.09 .32 .36
7. LearnSmart Usage .07 .03 .20 .14 .16 .12
8. Exam .22 .22 .14 .05 .13 .17 .31
24
Intellectual ability predicts exam performance
Correlation matrix for variables
1 2 3 4 5 6 7
1. CAB-I -
2. Ravens APM .50
3. Conscientiousness .06 .03
4. Epistemic Curiosity .03 .03 .38
5. Need for Cognition .11 .15 .44 .66
6. Openness to Experience .13 .12 -.09 .32 .36
7. LearnSmart Usage .07 .03 .20 .14 .16 .12
8. Exam .22 .22 .14 .05 .13 .17 .31
25
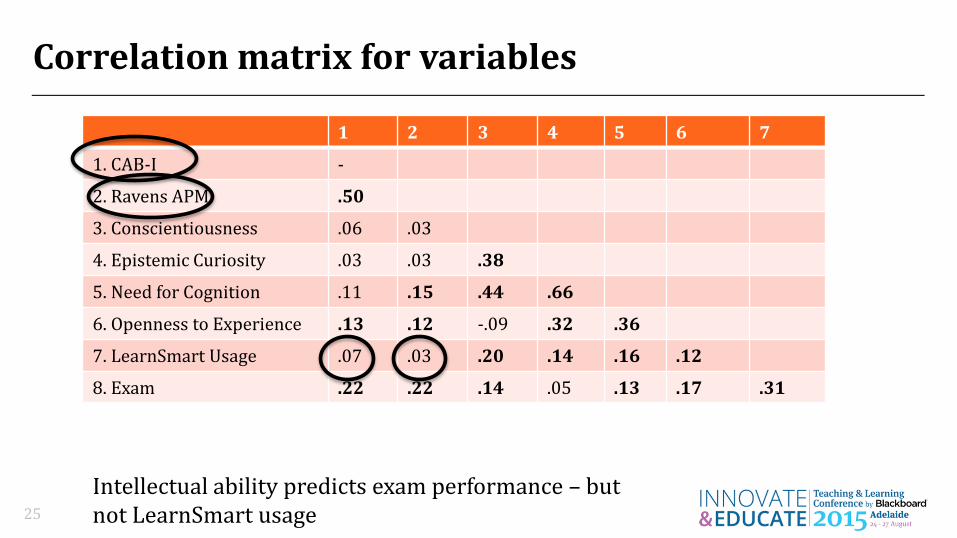
Intellectual ability predicts exam performance – but not LearnSmart usage
Correlation matrix for variables
1 2 3 4 5 6 7
1. CAB-I -
2. Ravens APM .50
3. Conscientiousness .06 .03
4. Epistemic Curiosity .03 .03 .38
5. Need for Cognition .11 .15 .44 .66
6. Openness to Experience .13 .12 -.09 .32 .36
7. LearnSmart Usage .07 .03 .20 .14 .16 .12
8. Exam .22 .22 .14 .05 .13 .17 .31
26
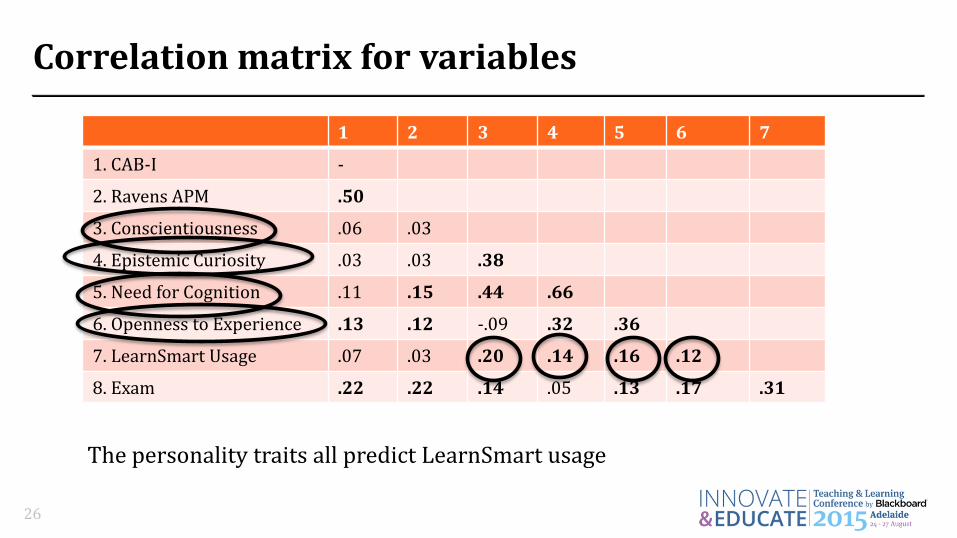
The personality traits all predict LearnSmart usage

Correlation matrix for variables
1 2 3 4 5 6 7
1. CAB-I -
2. Ravens APM .50
3. Conscientiousness .06 .03
4. Epistemic Curiosity .03 .03 .38
5. Need for Cognition .11 .15 .44 .66
6. Openness to Experience .13 .12 -.09 .32 .36
7. LearnSmart Usage .07 .03 .20 .14 .16 .12
8. Exam .22 .22 .14 .05 .13 .17 .31
27
The personality traits predict exam performance (except epistemic curiosity)

Correlation matrix for variables
1 2 3 4 5 6 7
1. CAB-I -
2. Ravens APM .50
3. Conscientiousness .06 .03
4. Epistemic Curiosity .03 .03 .38
5. Need for Cognition .11 .15 .44 .66
6. Openness to Experience .13 .12 -.09 .32 .36
7. LearnSmart Usage .07 .03 .20 .14 .16 .12
8. Exam .22 .22 .14 .05 .13 .17 .31
28
Importantly – LearnSmart usage predicts exam performance
Predicting Exam Performance - Regression
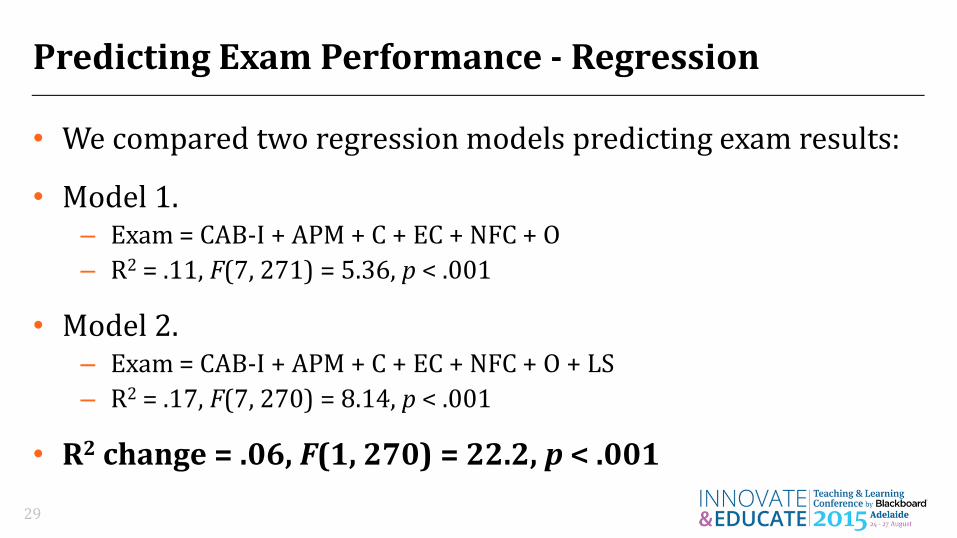
• We compared two regression models predicting exam results:
• Model 1. – Exam = CAB-I + APM + C + EC + NFC + O
– R2 = .11, F(7, 271) = 5.36, p < .001
• Model 2. – Exam = CAB-I + APM + C + EC + NFC + O + LS
– R2 = .17, F(7, 270) = 8.14, p < .001
• R2 change = .06, F(1, 270) = 22.2, p < .001
29
Predicting Exam Performance - Regression
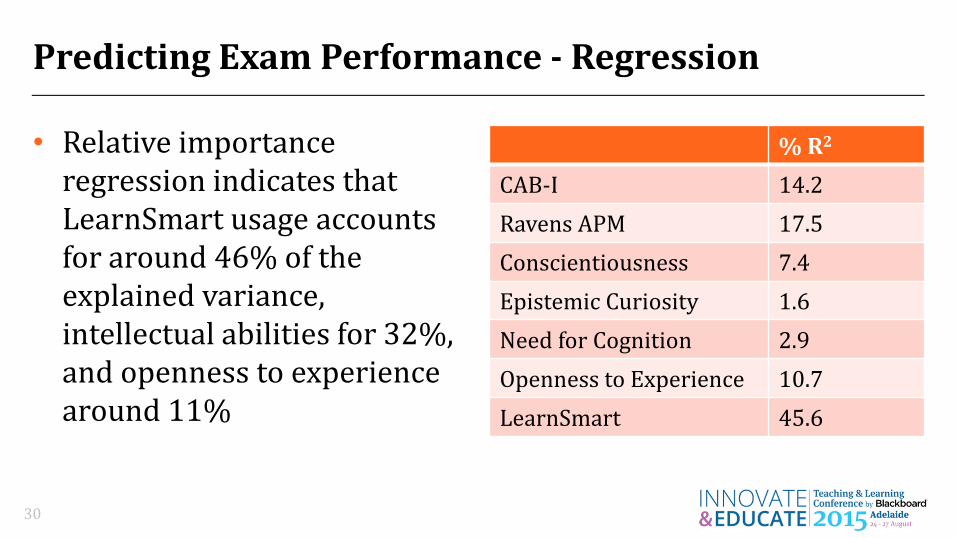
• Relative importance regression indicates that LearnSmart usage accounts for around 46% of the explained variance, intellectual abilities for 32%, and openness to experience around 11%
30
% R2
CAB-I 14.2
Ravens APM 17.5
Conscientiousness 7.4
Epistemic Curiosity 1.6
Need for Cognition 2.9
Openness to Experience 10.7
LearnSmart 45.6
Summary – Semester 1 study
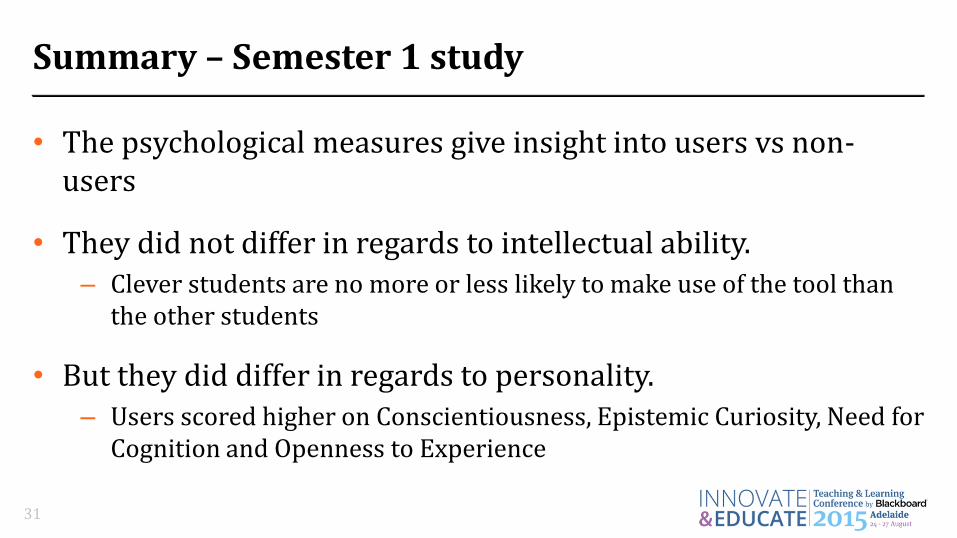
• The psychological measures give insight into users vs non-users
• They did not differ in regards to intellectual ability. – Clever students are no more or less likely to make use of the tool than
the other students
• But they did differ in regards to personality. – Users scored higher on Conscientiousness, Epistemic Curiosity, Need for
Cognition and Openness to Experience
31
Summary – Semester 1 study
• The psychological measures and LearnSmart usage predicted exam performance
• But LearnSmart usage was the strongest predictor – LearnSmart usage predicted exam performance even when controlling
for individual differences in personality and intellectual ability
32
Summary – Semester 1 study
• Does the LearnSmart tool have an impact upon academic success above and beyond what we would expect from these individual differences?
• YES!
• This tool appears to actually have a positive impact upon academic performance!
33

Looking Ahead – Semester 2 study
• In Semester 2 we have mandated a minimum usage of the tool for course credit (5%)
• All students are required to complete the tests of cognitive abilities and personality measures as part of the major assignment – They can choose not to give consent for their data to be used for research
purposes (good research is ethical research!)
• We are also collecting a range of other variables that may be informative – Attitudes to learning, predictions of achievement, metacognitive data, etc
34
What about Blackboard?
• Psych 1A/B students interface with Blackboard for the majority of the content and assessment
• This is potentially a rich data-source – One of the reasons I’m here is that I want to know more about the type
of data that can be extracted from Blackboard
• To date I have run some simple analyses using data from Blackboard …
35
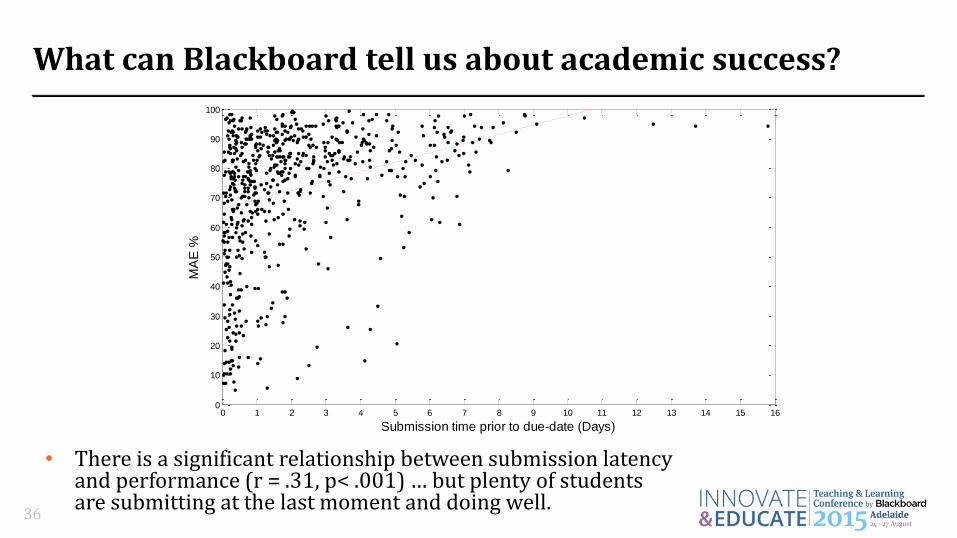
What can Blackboard tell us about academic success?
• There is a significant relationship between submission latency and performance (r = .31, p< .001) … but plenty of students are submitting at the last moment and doing well.
36
0 1 2 3 4 5 6 7 8 9 10 11 12 13 14 15 160
10
20
30
40
50
60
70
80
90
100
Submission time prior to due-date (Days)
MA
E %

What can Blackboard tell us about academic success?
• The same pattern holds for the subset of students that we have the psychological data for (r = .28, p< .001).
37
0 1 2 3 4 5 6 7 8 9 10 11 12 13 14 15 160
10
20
30
40
50
60
70
80
90
100
Submission time prior to due-date (Days)
MA
E %
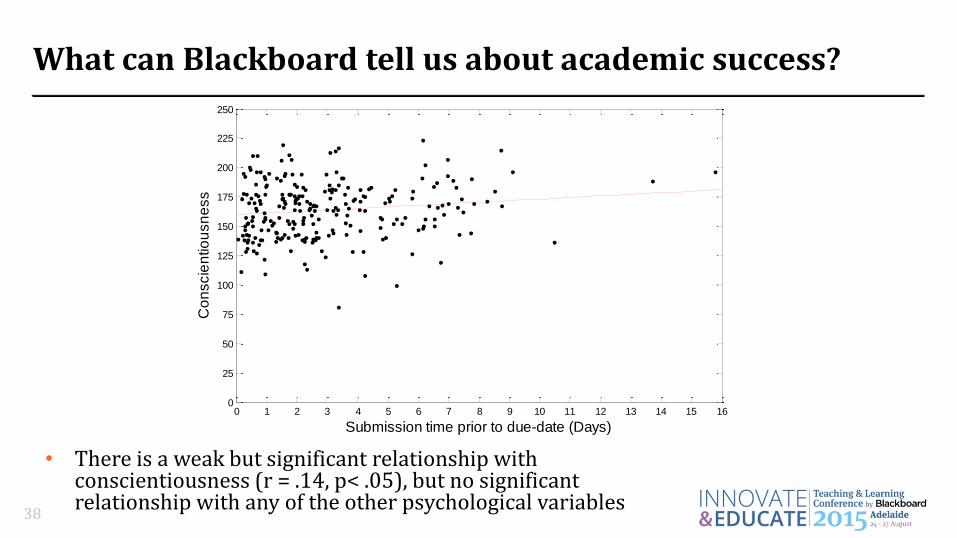
What can Blackboard tell us about academic success?
• There is a weak but significant relationship with conscientiousness (r = .14, p< .05), but no significant relationship with any of the other psychological variables
38
0 1 2 3 4 5 6 7 8 9 10 11 12 13 14 15 160
25
50
75
100
125
150
175
200
225
250
Submission time prior to due-date (Days)
Co
nscie
ntio
usn
ess

What can Blackboard tell us about academic success?
• Students are submitting their assignments at all hours … and this doesn’t seem to affect how well they do.
39
0 2 4 6 8 10 12 14 16 18 20 22 240
10
20
30
40
50
60
70
80
90
100
Time of day submitted
MA
E %
What can Blackboard tell us about academic success?
• When we have the full data-set of psychological measures and LearnSmart usage for the entire cohort we will be able to match this up with other behavioural data from BlackBoard – Course Access
– Missed submissions
– Usage of other supplementary materials
40

Final thoughts … future questions …
• Data from Semester 1 indicates that LearnSmart usage has an impact on academic success above and beyond what we would expect given individual differences in intellectual ability and personality traits
• This suggests the tool is actually working – What is it about the tool that causes this?
– What other sorts of tools might lead to similar improvements?
41

Take-Home Message!
• The psychological variables predict academic success and behavioural patterns – There are interesting and meaningful relationships between these
variables
– You should consider including psychological measures in your investigations
– Without controlling for these psychological variables you cannot make any strong conclusions about learning analytics/behavioural data and academic outcomes
42

Questions?
43


![Neural predictors of treatment response to brain ... predict… · 3 Introduction Cognitive behavioural therapy (CBT) is a common, effective treatment for depression[1]. Nevertheless,](https://static.fdocuments.in/doc/165x107/603619f449521376da1086b4/neural-predictors-of-treatment-response-to-brain-predict-3-introduction-cognitive.jpg)

