Trial evacuation of an industrial premises and evacuation ...

Cognitive Evaluation of Method for Providing Evacuation Information and Instruction
Chapman University Research Team
Dr. Steven Schandler, Ph.D. Senior Professor and Director, Cognitive Psychophysiology Laboratories
Claudine Jaenichen, MA.UK FCRI, Associate Professor Graphic Design
Tavish Ryan, Graphic Design Research StudentMarissa Bredice, Psychology Research Student

Funding by the Chapman University Honors Program Interdisciplinary/Collabortive GrantsChapman University, 2012
Section 1: ResearchThe Taxonomy of Urgent Wayfinding
Design for Evacuation
Section 2: Design
Section 3: InvestigationCognitive Evaluation of Method for Providing Evacuation Information and Instruction
57
21
37
4547
Contents

Section 1: Research
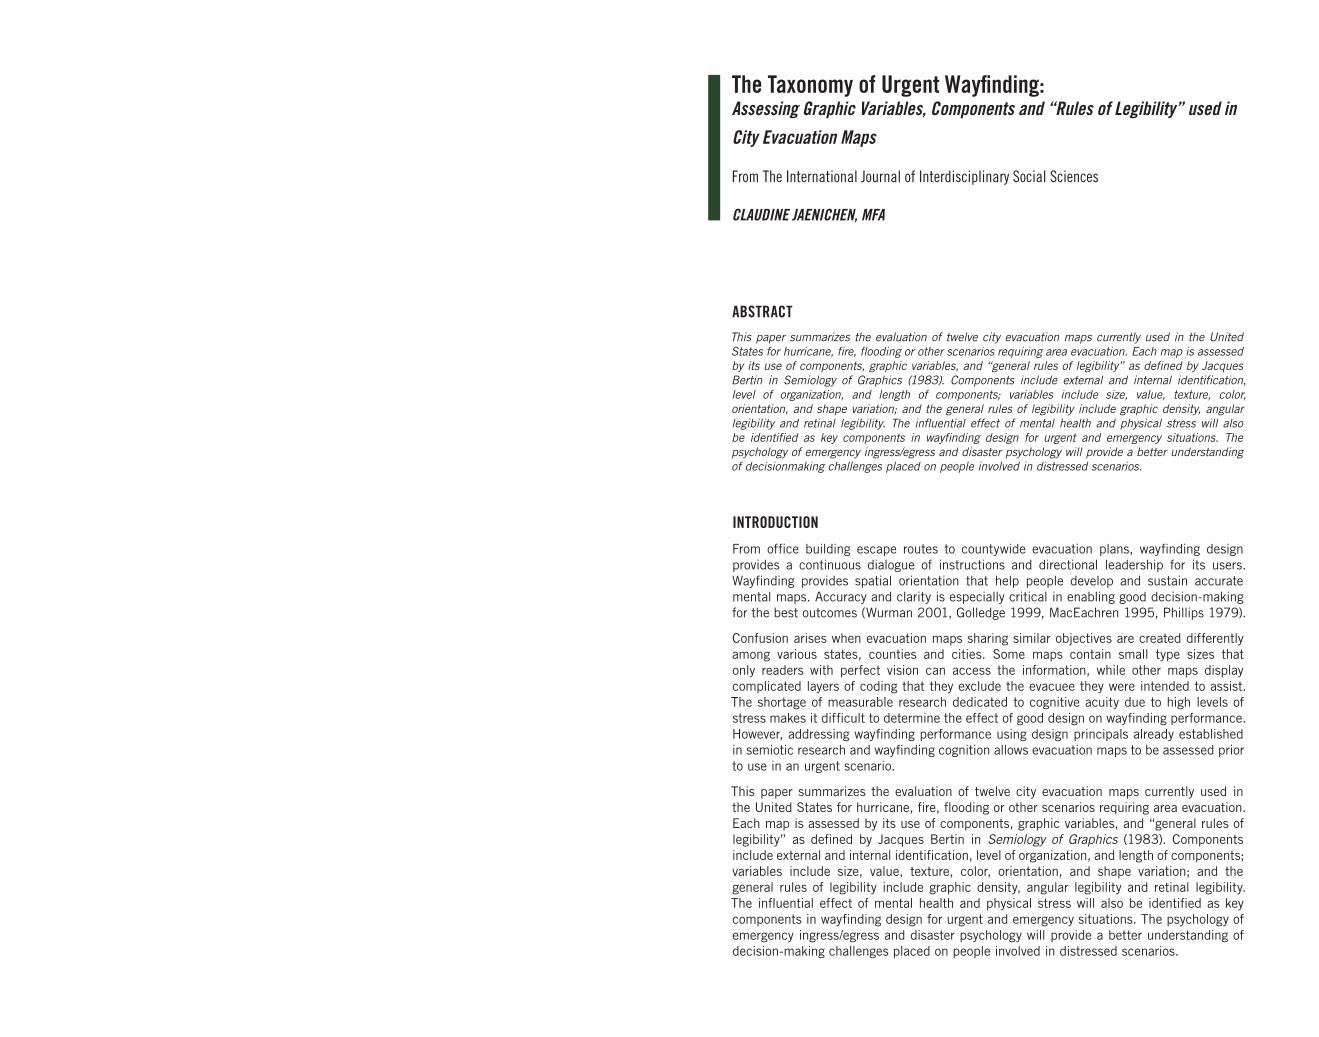
ABSTRACT This paper summarizes the evaluation of twelve city evacuation maps currently used in the United States for hurricane, fire, flooding or other scenarios requiring area evacuation. Each map is assessed by its use of components, graphic variables, and “general rules of legibility” as defined by Jacques Bertin in Semiology of Graphics (1983). Components include external and internal identification, level of organization, and length of components; variables include size, value, texture, color, orientation, and shape variation; and the general rules of legibility include graphic density, angular legibility and retinal legibility. The influential effect of mental health and physical stress will also be identified as key components in wayfinding design for urgent and emergency situations. The psychology of emergency ingress/egress and disaster psychology will provide a better understanding of decisionmaking challenges placed on people involved in distressed scenarios.
INTRODUCTION
From office building escape routes to countywide evacuation plans, wayfinding design provides a continuous dialogue of instructions and directional leadership for its users. Wayfinding provides spatial orientation that help people develop and sustain accurate mental maps. Accuracy and clarity is especially critical in enabling good decision-making for the best outcomes (Wurman 2001, Golledge 1999, MacEachren 1995, Phillips 1979).
Confusion arises when evacuation maps sharing similar objectives are created differently among various states, counties and cities. Some maps contain small type sizes that only readers with perfect vision can access the information, while other maps display complicated layers of coding that they exclude the evacuee they were intended to assist. The shortage of measurable research dedicated to cognitive acuity due to high levels of stress makes it difficult to determine the effect of good design on wayfinding performance. However, addressing wayfinding performance using design principals already established in semiotic research and wayfinding cognition allows evacuation maps to be assessed prior to use in an urgent scenario.
This paper summarizes the evaluation of twelve city evacuation maps currently used in the United States for hurricane, fire, flooding or other scenarios requiring area evacuation. Each map is assessed by its use of components, graphic variables, and “general rules of legibility” as defined by Jacques Bertin in Semiology of Graphics (1983). Components include external and internal identification, level of organization, and length of components; variables include size, value, texture, color, orientation, and shape variation; and the general rules of legibility include graphic density, angular legibility and retinal legibility. The influential effect of mental health and physical stress will also be identified as key components in wayfinding design for urgent and emergency situations. The psychology of emergency ingress/egress and disaster psychology will provide a better understanding of decision-making challenges placed on people involved in distressed scenarios.
The Taxonomy of Urgent Wayfinding: Assessing Graphic Variables, Components and “Rules of Legibility” used in City Evacuation Maps
From The International Journal of Interdisciplinary Social Sciences
CLAUDINE JAENICHEN, MFA
98 The Taxonomy of Urgent WayfindingThe Taxonomy of Urgent Wayfinding
PSYCHOLOGY OF EMERGENCY
The psychology of emergency must be examined before a visual assessment of wayfinding design can be addressed. Current research is not substantial enough to establish a comprehensive relationship between wayfinding design and emergency performance, but the commonality between wayfinding and the psychology of emergency is that they both require the process and activity of decision-making. Wayfinding is a decision-making process (Golledge 1999, Miller and Lewis 1999, Passini and Arthur 1992), therefore the psychology of emergency ingress/egress can offer insight from crowd psychology and panic theories that influence decision-making for those experiencing reading situations under distress.
In 1999, Jerome Chertkoff and Russell Kushigian published Don’t Panic: the Psychology of Emergency Egress and Ingress, documenting seven case studies of pedestrian traffic flow in emergency evacuation scenarios from 1903 to 1993. Five case studies were examples of failures and two were examples of success. An inventory of panic theories were summarized, including Gustave Le Bon’s theory of the unconscious personality in his book titled The Crowd (1895). Le Bon states:
The unconscious personality is that people in crowds act irrationally—and emotionally—exhibiting irritability and the exaggeration of sentiments. In a crowd, intellectual functioning sinks to the lowest common denominator existing in all members of a race by inheritance, and emotionally is reduced to the most basic instinctive displays of emotion (Chertkoff and
Kushigian, 1999).
This statement convincingly suggests that reading comprehension in urgent and emergency situations can dramatically deteriorate, seriously affecting decision-making ability. Individuals with adequate comprehension of their environment, mental stability and intellectual rationale can be influenced by an unconscious personality when that same environment transforms into an emergency situation. Decision-making that is predictable and premeditative can become chaotic when decisions make the difference between life, loss and death. Reading, navigation and movement can become impulsive and devoid of critical judgment. A fire evacuation map next to an elevator once read with casual ease is now a puzzle to the unconscious personality of a reader in distress.
Le Bon prescribes leader influence as a way of avoiding the reactions of the unconscious personality. Leader influence on a crowd advocates affirmation, repetition and word of mouth. Once some [people in a crowd] are influenced by repeated affirmations, their feelings, beliefs, and acts will spread to others (Chertkoff and Kushigian 1999).
In 2007, when California fires burned close enough to necessitate community evacuations, homeowners were affirmed by authoritative figures such as firefighters, police officers and other city officials. Some homeowners did not want to leave their properties not yet affected by the immediate dangers of the fire (urgent, but not yet an emergency), but mandates from city authorities not only eliminated the need for decision-making, but also bestowed leadership influence upon neighbors. In 2006, Graham Tobin, Heather Bell, Linda Whiteford and Burrell Montz published Vulnerability of Displaced Persons: Relocation Park Residents in the Wake of Hurricane Charley, a study on decision-making and behavior in response to evacuation mandates in Florida.
Evacuation results reinforce the role of experience in decision-making and behavior. Previous negative hurricane experience combined with the anticipated force of the wind was the most common reason given for evacuation (27 percent). A few cited Hurricane Andrew experience specifically. Official orders also appeared to influence decision- making, as was previously shown by the difference in evacuation rates for those told to evacuate and those who were not. The top reason given by 29 percent for non-evacuation, “thought location was safe,” reflects an unwarranted faith in the protective qualities of homes or inland locations. The second most common reason, the thought that the hurricane would miss (23 percent), illustrates a
misconception of the uncertainty associated with landfall maps as well as potential problems
with hurricane coverage by the media (Tobin, Bell, Whiteford and Montz 2006).
A similar incident of slow evacuation also occurred in New Orleans during Hurricane Katrina when 100,000 people admitted they did not evacuate after receiving mandatory notice. People did not think the hurricane would be so devastating. State and local emergency managers were told to address this issue of ineffective evacuation responses (Kapucu 2006).
Authoritative affirmation is also evident throughout different levels in daily activities. We look to leader influence not only in emergency situations, but also in less urgent situations of need. If I am lost in an airport, I am inclined to find a person in uniform—an authority—to ask for directions. When rushing a child to the emergency room, we are inclined to look for the person in a clinician’s uniform for help. Leader influence exists from leisure levels of reading—where is the nearest coffee shop—to emergency levels of reading—which way out. If an authoritative figure is not available, we look to other means of affirmation such as directional signage at an airport or a red illuminated emergency sign seen from the road—environmental leader influences.
Path knowledge and emergency planning/training are two of four factors that focus on environmental leader influence (the other two factors are spatial/architectural constraints and the number of people present). Chertkoff and Kushigian present these factors as mitigating elements in an emergency situation. Path knowledge is the widespread knowledge of available paths and exterior exits. Emergency planning/training includes an adequate emergency plan and training in its implementation (Chertkoff and Kushigian, 1999). These planning strategies are committed to activities in wayfinding design. No one is expected to pull out an airline safety card and read instructions during a dramatic descent at 12,000 feet, but it is expected that passengers learn the routine well enough to react with second-nature response.
Richard La Piere also emphasized regimental leadership in his theory of panic behavior published in 1938, Collective Behavior:
All believed that in a situation of perceived danger, people in crowds are quite likely to be highly emotional and engaged in uncoordinated flight, leading to trampling of others and jams. Training in coordinated behavior or fearless, resolute leadership are ways to combat the likelihood of panic (Chertkoff and Kushigian 1999).
In an event of a true emergency, are wayfinding materials intended for use during the actual event or are they only expected to perform at a “training” level? With hope that most people receive prior training, collective behavior will have a better outcome of including informed leaders that can influence a group with more rational decision-making. Chertkoff and Kushigian conclude:
Decisions may lead to actions that turn out badly, but if so, that is because of incomplete or faulty information, errors in evaluating the information, or a poor decision-making process
(Chertkoff and Kushigian 1999).
Wayfinding materials perform a primary or secondary role as an environmental leader, therefore should involve a critical design process; one that considers people who are dramatically affected by mental, physical and environmental instability.
LEISURE, DIRECT, URGENT AND EMERGENCY READING AND COMPREHENSION
Leisure, direct, urgent and emergency scenarios require reading and comprehension levels that can impact a person’s ability to follow instructions. Within each of these scenarios, individual performance is limited to the reader’s mental health and physical abilities, intensity and length of the event, loss of property or loved ones, pre-or-current stressors,

1110 The Taxonomy of Urgent WayfindingThe Taxonomy of Urgent Wayfinding
age, demographic, literacy skill, level of familiarity and pre-existing visual, mental and/or physical impairment (Alexander 1993). The measure of time is also a continuous factor affecting reading and comprehension. The more unpredictable and spontaneous the change in pace and environment, the less time a person has to think about their response.
Defining these scenarios is important in establishing context in urgent and emergency reading situations. These situations are not always sequential; they can overlap and spontaneously skip from one scenario to another.
Leisure —a person is in a comfortable state of mind, absent of high or low environmental stress. Time is not a priority and wayfinding is usually not sought after. A possible scenario may be a routine walk through the park or a weekend shopping trip to the mall.
Direct—a person’s objective is to move from point A to point B either with or without time pressure. They may have a heightened sense of awareness in the immediate environment, such as navigating a building directory to get to an appointment on time or making sure he/she find the correct bus stop. Time becomes part of the decision-making process, but it is not an overly critical factor.
Urgent—a person is overcome by the urgency of time within a specific activity. They may be a rescue worker digging through rubble to find survivors or a parent rushing a sick or injured child to urgent care. Their objective is focused and can be affected by rapid decision-making, but decisions will not always be affected by negative responses such as panic or irrational thought (Dynes 2006, Tierney 2001, Alexander 1993).
Emergency—a person can be dominated by their unconscious personality, “fight or flight” reactions (Chertkoff and Kushigian 1999). Their environment, emotional and physical status has dramatically changed and can be affected by survivor’s competition, tunnel vision, panic and irrational decision-making. They may be caught in a multi-story building in a hallway filled with smoke or on an aircraft during a sudden decent with oxygen masks dangling from the overhead compartments (Alexander 1993).
READING AND COMPREHENSION
These scenarios do not have to be sequential or predictable and can also happen in reverse. For example, it is a possibility to begin with a direct scenario, skip urgent, and be confronted with an emergency.
In all four scenarios, reading and comprehension place different demands on individual skill sets. Individual personalities become more transparent as the stress levels increase. Consider three people undergoing the same emergency scenario: the first person may become panic-stricken, the second person is consumed by denial and makes no response at all, while the third person is completely collected and takes the role of the influential leader. Categorizing the four scenarios of reading and comprehension may provide understanding into how wayfinding material is read and utilized. As scenarios accelerate from leisure to emergency, wayfinding may increasingly require a primary and authoritative role as an environmental leader, providing only elementary levels of critical information.
ASSESSMENT OF TWELVE EVACUATION MAPS IN THE UNITED STATES
This paper refers to Jacques Bertin’s Semiology of Graphics published in 1983 as an authority in assessing semiotics. Twelve evacuation maps sponsored and created from official city, county or Department of Emergency Management websites were collected. Each map was assessed by the following criteria: components—external identification, internal identification, level of organization and length of components; graphic variables—size, value, texture, color, orientation, and shape; rules of legibility—graphic density, angular separation, retinal separation and combination of variables.
COMPONENTS
Components are layers of variables communicating various levels of information to create a macro image and message. Evacuation maps consist of one image of spatial instructions and the message to leave place of danger. Components support the image and message with external and internal identification, level of organization, and length of components—the number of visual steps separated into parts such as icons, typography and color-coding (Bertin 1983).
Bertin suggests two levels of identification: external and internal (1983). External identification includes elements outside the image such as legends, headlines, sponsorship, instructions, orientation devices, scale and date. Internal identification includes elements relating to the map itself such as pictograms, street names, icons and highway identification (see Figure 1).
Figure 1: External and Internal Identification
This evacuation map for South Pinellas County in Florida exemplifies good placement and clarity between external and internal identification. External identification is shown in the center map identifying the legend, evacuation levels and list of shelters. Internal identification is indicated in the map to the right, which includes street names, highway and shelter labels. Map source: Pinellas County Emergency Management
Bertin also advises “maximum visibility” for maps that are of the same kind (1983). For evacuation maps, the image of the map may change depending upon the disaster type and city it represents, but the message does not change. If the message and objective are the same, why do variables used in evacuation maps differ so drastically? The collection of evacuation maps shown in figure 2 confirms the lack of consistency in variable usage, variants in hierarchy of external and internal identification, and a divergence of length and level of components.
Figure 2: Twelve Evacuation Maps used in the United States

1312 The Taxonomy of Urgent WayfindingThe Taxonomy of Urgent Wayfinding
Although these maps are similar in function, there is no evidence that these twelve evacuation maps achieve “maximum visibility”. Map sources: 1 Pinellas County Emergency Management, Florida; 2 Town of Waterford, Connecticut; 3 Citrus County Board of County Commissioners, Florida; 4 Louisiana Homeland Security & Emergency Preparedness; 5 State of Rhode Island Emergency Management Agency; 6 South Carolina Department of Transportation; 7 Lee County Division of Safety Emergency Management, Florida; 8 Orange County Governor’s Office of Emergency Services, California; 9 Texas Division of Emergency Management, Houston; 10 City and county of Honolulu Dept of Emergency Management; 11 City of Newport, Oregon; and 12 The New York City Office of Emergency Management Hurricane Evacuation.
If the Federal Emergency Management Agency (FEMA) establishes emergency protocol for disaster planning in the United States, then wayfinding design should also be included in planning to facilitate “maximum visibility” for effective evacuations.
Bertin addresses the level of organization and length of components as perceptible steps that can either present obstacles or help the reader understand the message (1983). The psychology of egress/ingress should influence the level of detail of instructions as distress increases or decreases for the reader. People under extreme distress will retain even less detailed information due to at-risk environmental factors and survivors’ prioritization of immediate basic necessities. Bertin also suggests that if the visual elements out-weigh the level of components, processing becomes “inefficient and necessitates the burdensome reading of several successive images” (1983). Figure 3 compares three maps with different approaches to the length of components and level of organization.
Figure 3: Length of Components and Level of Organization
These three maps contain different approaches to the level of organization and length of components. The map on the left, Town of Waterford in Connecticut, contains less length of components and more level of organization. The map in the center, Charleston in South Carolina, contains more length of components and less level of organization. The visual elements on the map to the right, Houston in Texas, out-weigh the level of components causing overwhelming reading activity even in a leisure scenario. Map sources: Town of Waterford, Connecticut; South Carolina Department of Transportation; and Texas Division of Emergency Management, Houston
GRAPHIC VARIABLES
Bertin identifies four categories of perception: associative (non linear variables—pictorial symbols, color-coding and geographic representation), selective (answering a question with a variable—which is the correct route to evacuate), ordered (comparative variables—which route is the most effective), and quantitative (numerical value—distance and level of urgency). Graphic variables function within specific perceptions as size, value, texture, color, orientation, shape, composition and the relationships variables have to one another (Bertin 1983, Monmonier 1991). These variables influence the productivity of each
component, and therefore affect the overall image and message. If there is a weakness or error in these variables, the map, message and individual categories of perception will also be in error. Figures 4.1–4.4 provide visual examples of these variables.
Size variation will be overpowered by other variables. The smaller the mark the less noticeable other variables, such as color or texture, will be (Bertin 1983). Pictograms, arrows and icons are all considered shape variation. Shapes can be abstract or literal, but meaning should never be taken for granted. Using shape variables initiates associative perception that relies on other variables for selectivity, such as size or value. Symbolism and meanings of shape variables can compete with other shapes if too many are used (Bertin 1983).
Figure 4.1: Size and Shape Variation
The three maps above are examples of various strategies using shape and size to help, or not help, reader selectivity. Note the effect of quantitative usage. Map source: State of Rhode Island Emergency Management Agency; City of Newport, Oregon; and South Carolina Department of Transportation
Figure 4.2: Value and Texture Variation
Value variation is perceived as ordered and is most effective on a white background. Value can include pixels, shading and texture. Bertin suggests caution when using a value variable in conjunction with other variables due to ineffective competition (Bertin 1983). Texture can cause a “vibration” effect causing confusion between foreground and background (Bertin 1983). The map to the left of Waikiki is devoid of color and relies on texture to communicate value. It becomes problematic when the strength of the texture overlaps typography and subtle line weights depicting evacuation destinations. In the center map of Orange County in California uses texture effectively. The texture provides a sense of altitude and spatial orientation. The map to the right of Manhattan in New York uses texture ineffectively since there are no labels to help navigate the numerous streets. Map source: City and county of Honolulu Dept of Emergency Management; Orange County California; Governor’s Office of Emergency Services; and The New York City Office of Emergency Management Hurricane Evacuation
1514 The Taxonomy of Urgent WayfindingThe Taxonomy of Urgent Wayfinding
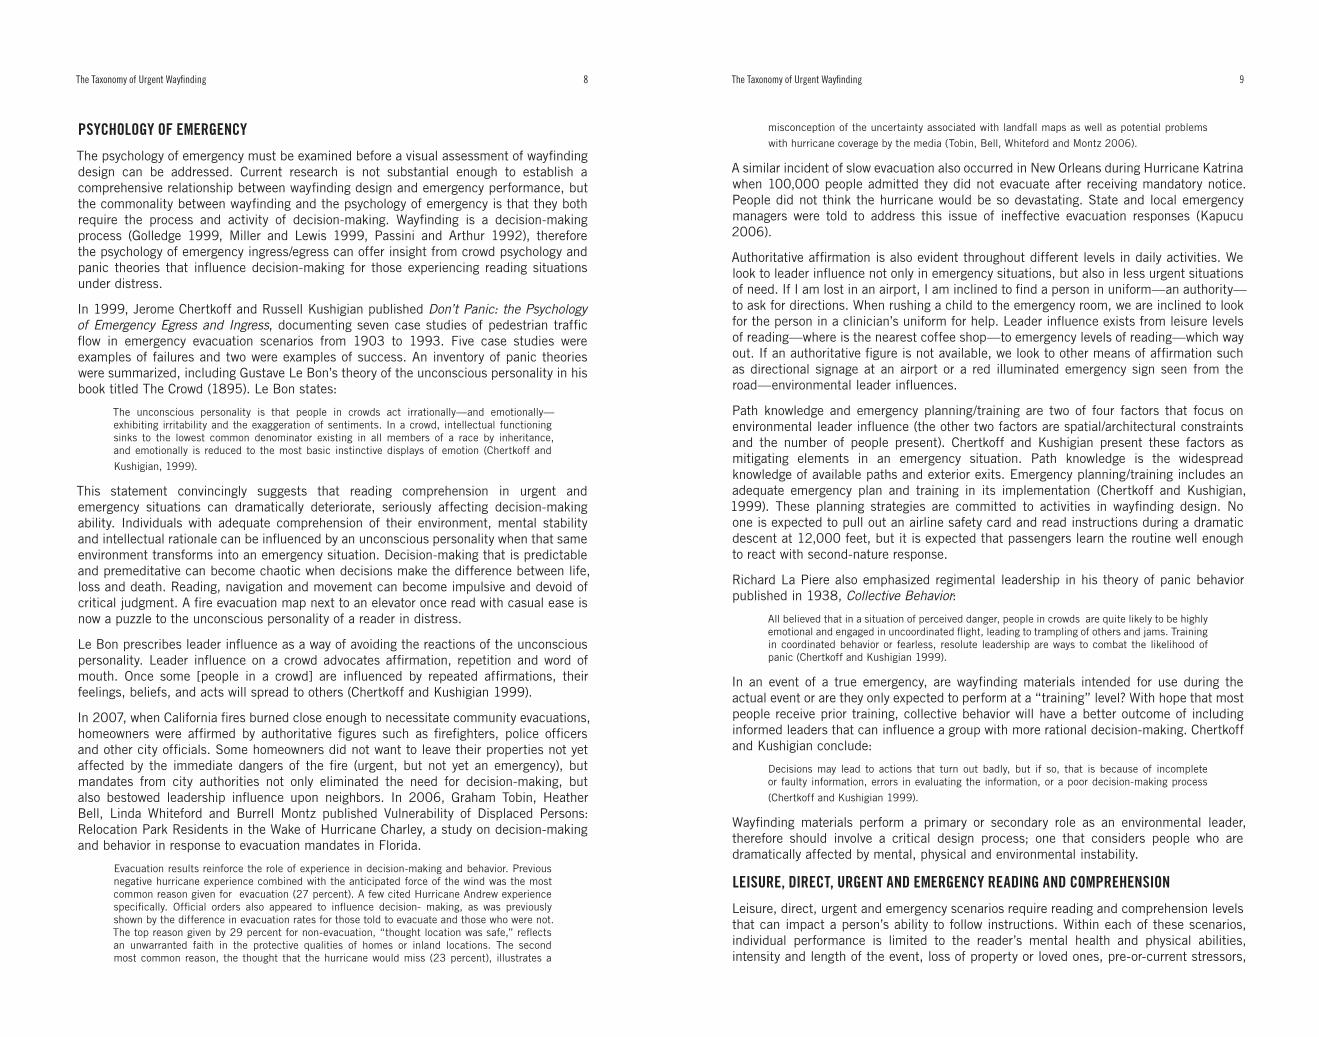
Figure 4.3: Color Variation
Color saturation is affected by its surrounding color(s), whether the color is in the foreground or background. Color also contributes to value, from darker to lighter colors or visa versa, and order of color should be considered to avoid ambiguity (Bertin 1988). The symbolism and aesthetic qualities of color variation should not ignore associations with universal meanings. For example, blue is for water as green is for vegetation (Bertin 1983). This is also accurate for color symbolism such as red is for emergency as blue is for disability access. Color assures better retention and range of the message, but can exclude people with visual impairments such as color blindness and reduced contrast. The map to the left of Citrus County in Florida poorly chooses color in relationship to type legibility. There is not enough contrast to support reading of type or various line weights. The map in the center of Pinellas County in Florida uses color to depict evacuation areas, although some areas where color change are so subtle that it seems unusable to an evacuee. The final map to the right of the Town of Waterford in Connecticut uses color effectively. The second color, be- sides black, is used to indicate the evacuation area. Map source: Citrus County Board of County Commissioners, Florida; Pinellas County Emergency Management, Florida; and Town of Waterford, Connecticut
Except for a perfect circle, triangle or square, a mark can change angles on its center axis. Bertin suggests that no more than four orientation variables be used before selectivity becomes problematic (Bertin 1983).
Figure 4.4: Orientation Variation
In the left map of New Orleans the arrows demonstrate clear change in orientation. In the second and third map the arrows become disorienting. The second map of Lee County in Florida uses perfect triangles that can indicate any direction and become “indecisiveness” when they are gathered close together. In the third map of Providence County in Rhode Island the inconsistent spacing and multiple use of arrows communicates confusing directional instruction, for example, the intersection on Public Street and Potters Ave. Map source: Louisiana Homeland Security & Emergency Preparedness and Lee County, Florida, Division of Public Safety Emergency Management and State of Rhode Island Emergency Management Agency
RULES OF LEGIBILITY
Maps can be aesthetically pleasing but perform poorly, as well as perform well but be visually unattractive. Bertin provides the rules of legibility as an assurance to the reader that selectivity of variables should be “predictable” and the message clear (1983). These rules include graphic density, angular and retinal separation.
Graphic density affects the “speed” of the message by how much or how little visual variables occupy the space. The denser the visual variables occupy the space the less a reader can separate those variables (Bertin 1983). Contrast must also be sufficient enough to distinguish between foreground meaning and background noise, which Bertin would categorize as retinal legibility (1983). He advocates “predictable information,” which can provide elementary reading activity placed on a person in an urgent or emergency scenario. One of the most common errors of legibility is that background ‘noise’ is either more visible than, or competes with, the subject matter (Bertin 1983). Retinal legibility is also affected by the quality of variable combinations. Bertin states: “when two variables are each associated with a different component, the combination is no longer redundant, it is ‘meaningful’” (1983). For maps with a specific function, e.g. evacuation instructions, a reader must be able to select and separate variables on an elementary level.
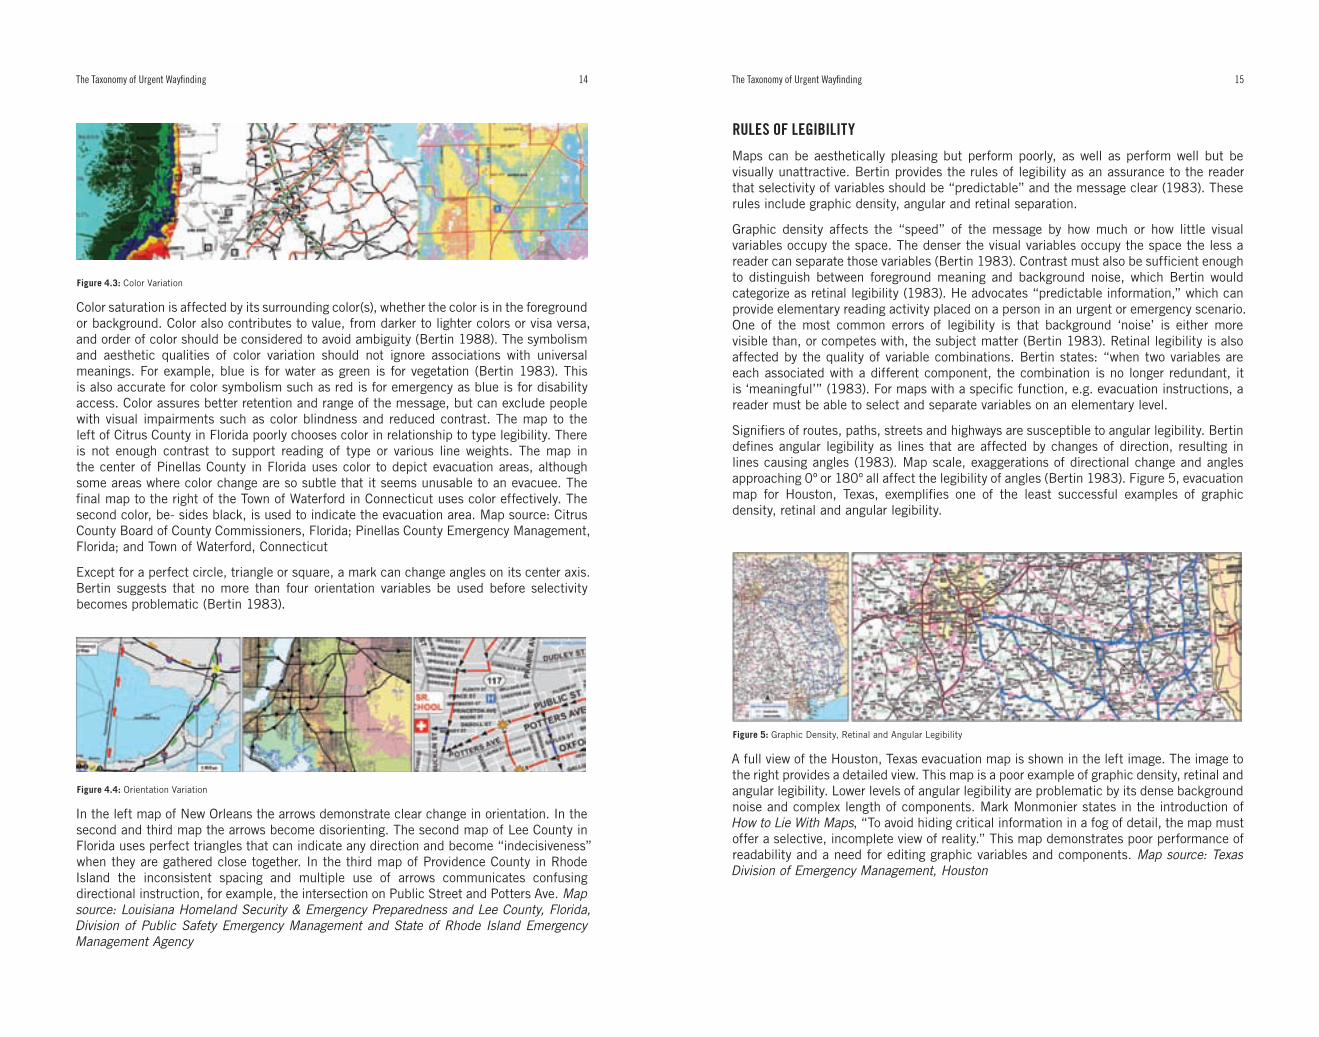
Signifiers of routes, paths, streets and highways are susceptible to angular legibility. Bertin defines angular legibility as lines that are affected by changes of direction, resulting in lines causing angles (1983). Map scale, exaggerations of directional change and angles approaching 0º or 180º all affect the legibility of angles (Bertin 1983). Figure 5, evacuation map for Houston, Texas, exemplifies one of the least successful examples of graphic density, retinal and angular legibility.
Figure 5: Graphic Density, Retinal and Angular Legibility
A full view of the Houston, Texas evacuation map is shown in the left image. The image to the right provides a detailed view. This map is a poor example of graphic density, retinal and angular legibility. Lower levels of angular legibility are problematic by its dense background noise and complex length of components. Mark Monmonier states in the introduction of How to Lie With Maps, “To avoid hiding critical information in a fog of detail, the map must offer a selective, incomplete view of reality.” This map demonstrates poor performance of readability and a need for editing graphic variables and components. Map source: Texas Division of Emergency Management, Houston

1716 The Taxonomy of Urgent WayfindingThe Taxonomy of Urgent Wayfinding
CONCLUSION
The taxonomy of evacuation maps according to semiotics, rather than performance, serves as the starting point for a meaningful diagnostic process. Important factors not considered in this paper include map objectivity, how it is used in a situation, a survey for printed as well as on-screen maps, and how resolution variation affects map legibility. This taxonomy is also affected from the internal bias of the author’s personal point of reference as well as observation during leisurely situations, as opposed to emergency ones.
A certain level of rudimentary, disparate design is to be expected in these critical wayshowing devices. In an article written for the Information Design Journal titled Designing Public Documents, David Sless states that documents should be easy to use, efficient and productive—three attributes for sustainable reading (Sless 2004), as well as credible, respectful and physically appropriate as definitive attributes that encourage reading. I raise the question: who are the creators of evacuation maps and how are design decisions made? Wayshowing strategies need to consider mental and physical distress as well as theories from disaster psychology and the psychology of emergency egress/ingress. This taxonomy provides insight to current graphic usage in evacuation maps to facilitate the assessment of visual variables, consistency and methodology, as well as aid in potential development for a benchmarking process toward a national standard, and maybe a semiology of its own.
REFERENCES
Aguirre B (2005). Emergency Evacuation, Panic and Social Psychology. Psychiatry, 68 (2), 121-29. Alexander D (1993). Natural Disasters (Reprinted 1998). London: UCL Press Limited Baddeley A (1979). Working Memory and Reading. In Kolers P, Wrolstad M and Bouma H (Eds), Processing of Visible Language, 1, 355–370. New York: Plenum Press Bergen County Police Emergency Management, New Jersey. Disaster Psychology and Preparedness Handout. Retrieved on March 20, 2008 from www.bcoem.org Bertin J (1980). Working Memory and Reading In Kolers P, Wrolstad M and Bouma H (Eds), Processing of Visible Language, 2, 585–604. New York: Plenum Press Bertin J (1993). Semiology of Graphics: Diagrams, Networks, Maps (Translated by William J Berg). Wisconsin: The University of Wisconsin Press Bertin J (2000). Matrix Theory of Graphics. Information Design Journal, 10(1), 5–18 Chertkoff J and Kushigian R (1999). Don’t Panic: the Psychology of Emergency Egress and Ingress. Connecticut: Praeger Publishers Daru M (2000). Jacques Bertin and the Graphic Essence of Data. Information Design Journal, 10(1), 20–25 Dobson M (1980). The Acquisition and Processing of Cartographic Information: Some Preliminary Experimentation. In Kolers P, Wrolstad M and Bouma H (Eds), Processing of Visible Language, 2, 291–304. New York: Plenum Press Dynes R (2006 November). Panic and the Vision of Collective Incompetence. Natural Hazards Observer, 2, 5–6. Retrieved April 3, 2008 from Chapman University Electronic Periodicals Golledge R ed. (1999). Wayfinding Behavior: Cognitive Mapping and Other Spatial Processes. Maryland: The John Hopkins University Press Kapucu N (2006 August). Examining the National Response Plan in Response to a Catastrophic Disaster: Hurricane Katrina in 2005. International Journal of Mass Emergencies and Disasters, 24(2), 271– 299 Lonsdale M (2007). Does Typographic Design of Examination Materials Affect Performance? Information Design Journal, 15(2), 114–138 MacEachren A (1995). How Maps Work: Representation, Visualization and Design. New York: The Guildford Press Miller D and Lewis D (1998). Key Findings and Guidelines: NHS Estates Wayfinding Research Project. Newport Pagnell, England: Information Design Unite Ltd. Monmonier M (1996). How to Lie with Maps (2nd ed). Chicago: The University of Chicago Press Passini R, Arthur P (1992). Wayfinding: People, Signs, and Architecture. McGraw-Hill Phillips R (1979). Making Maps Easy to Read—a Summary of Research. In Kolers P, Wrolstad M and Bouma H (Eds), Processing of Visible Language, 1, 165–174. New York: Plenum Press Sholl J and Egeth E (1980). Interpreting Direction from Graphic Displays: Spatial Frames of Reference. In Kolers P, Wrolstad M and Bouma H (Eds), Processing of Visible Language, 2, 315–330. New York: Plenum Press Sless D (2004). Designing Public Documents? Information Design Journal, 12(1), 24–35 Tierney K (2001 September). Trends in Research and Disaster Management in the United States. Natural Hazards Observer, 1. Retrieved April 3, 2008 from Chapman University Electronic Periodicals Tobin G, Bell H, Whiteford L and Montz B (2006 March). Vulnerability of Displaced Persons: Relocation Park Residents in the Wake of Hurricane Charley. International Journal of Mass Emergencies and Disasters, 24(1), 77–109 Ware C (2004). Information Visualization: Perception for Design. San Francisco: Morgan Kaufmann Publishers Wurman R (2001). Information Anxiety 2. Indiana: Que

18The Taxonomy of Urgent Wayfinding
MAP SOURCES
Charleston, South Carolina. South Carolina Department of Transportation. Viewed March 22, 2008. http://www.scdot.org/getting/evacuation.shtml Citrus County, Florida. Board of County Commissioners. Viewed March 22, 2008 http://www. bocc.citrus.fl.us/disaster/images/evacuation_map_land.jpg City of Newport, Oregon. Viewed March 22, 2008. http://www.thecityofnewport.net/ NewportEvac.pdf Honolulu, Hawaii. City and county of Honolulu Dept of Emergency Management. Viewed March 31, 2008. http://www.co.honolulu.hi.us/ocda/maps.htm. http://www.co. honolulu.hi.us/ocda/maps1.htm Houston, Texas. Texas Division of Emergency Management. Viewed March 22, 2008. http://www.state.tx.us/emergencyimages/maps/hurricaneEvacuation/Hurricane%20 Evac-Travel%20Map-Houston.jpg Lee County, Florida. Lee County Division of Safety Emergency Management. Viewed April 4, 2008. www.leeeoc.com/EOC_Elevation&EvacRoutes_b.jpg Manhattan, New York. The New York City Office of Emergency Management Hurricane Evacuation. Viewed March 22, 2008. http://home2.nyc.gov/html/oem/htmlhazards/ storms_finder.shtml New Orleans, Louisiana. Louisiana Homeland Security and Emergency Preparedness. Viewed March 22, 2008. New Orleans area counter flow maps, hurricane and evacuation related information Orange County, California. Governor ’s Office of Emergency Services. Viewed March 22, 2008. http://www.oes.ca.gov/Operational/OESHome.nsf/PDF/Fire%20Maps%20 2007/$file/OrangeEvac.jpg Pinellas County, Florida. Pinellas County Emergency Management. Viewed March 31, 2008. http://www.pinellascounty.org/emergency/Local.htm Providence, Rhode Island. State of Rhode Island Emergency Management Agency. Viewed March 22, 2008. http://www.riema.ri.gov/hazards/hurricane_evac.php Town of Waterford, Connecticut. Viewed March 22, 2008. http://www.waterfordct.org/ evacuationmap.jpg

ABSTRACT A recent benchmark concluded that only 9% felt confident in knowing how to respond to a city evacuation order. The benchmark also indicated that 80% would not know how they would be notified, and 86% would not know what to do should they be notified. This paper links the taxonomy of semiotics and visualization currently used in two approaches of evacuation information—city and aircraft scenarios—and provides juxtapositional perspectives in visual representation, as well as addressing issues of effectiveness of communication, planning, and training. Evacuation materials look and perform differently, not only due to spatial and logistical constraints (such as between city and aircraft scenarios), but also in evacuees’ communicative relationships (receiving, reading, and comprehending instructional information). Cognitive variables in the psychology of emergency ingress and egress, collective behavior, tunnel vision, and issues in temporary cognitive paralysis are applied to the assessment and evaluation of evacuation documents. The assessment and conclusion in addressing current evacuation material will be presented as a proposal for a city public pre-evacuation campaign improving resident education, training, and “path knowledge.”
INTRODUCTION
“Evacuation” is not an entirely abstract concept, especially to those who attended grade school in the United States and performed the countless required evacuation drills conducted there. During World War II the United States government introduced a systemic public awareness campaign in anticipation of a nuclear attack. Duck and Cover was a social guidance film demonstrating instructions and reenactments of emergency procedures in the event of a nuclear attack. A live-action version of the film was aired on television while an animated version was created for grade schools starring Bert the Turtle as an anthropomorphic character for safety (Duck and Cover was written by Raymond Mauer and directed by Anthony Rizzo, produced by Archer Films, under contract of the United States Civil Defense Branch, 1951/1952).
Institutions in the United States continue to use the catchphrase “duck and cover” as part of emergency preparedness protocol, allied with other catchphrases such as: “drop, cover, and hold on” (for earthquakes), “stop, drop, and roll” (for fires), and “tuck and hold” (for tornadoes). I remember, as a child, hearing these kinds of phrases; the repetition of safety drills from my youth is anchored to my learning development, and I have retained these instructions as longterm childhood memories.
Design for Evacuation: Improving City Evacuation Instructions
From the Parsons Journal for Information Mapping
CLAUDINE JAENICHEN, MFA

2322 Design for Evacuation: Improving City Evacuation Instructions Design for Evacuation: Improving City Evacuation Instructions
Repetition and consistencies in the construct of text (verbal or printed instructions), spatial recognition (constructed and complete cognitive map of an area), and image (tone and appearance of instructions), shape social conventions and expectations for both school and workplace evacuation “path knowledge.”1 Path knowledge is spatial familiarity with the physical surrounding environment and the ability to establish a mental map of various routes and detours within that space. Emergency planning and training (e.g., emergency drills) help develop a sound cognitive map toward comprehensive path knowledge.2 In the event of an actual emergency a person’s cognitive attention will be abruptly interrupted by an environmental clue, such as an earthquake, the smell of smoke, or nearby people responding to an alert. These variables can signal and initiate a response to previous path knowledge, actions, and expectations already learned in previous training experiences. For example, airline passengers are presented with required safety demonstrations and material that is similar irrespective of the airline. Therefore, “Frequent flyers” develop healthy emergency path knowledge because of mandated, repetitious, and consistent emergency safety review before every flight. This systemic campaign regulated by the FAA builds a mental map specific to the space of an aircraft, conventions, and expectations. In 1992, Trans World Airlines Flight 843, airborne for six seconds, aborted the take-off with 292 passengers. The plane had a full tank of fuel and ignited when the force of the abrupt landing fractured the right wing. With fire and smoke filling the plane, there was “almost no panic, little screaming or pushing—an almost eerie sense of order amid the glow of flames and the life-or-death evacuation.”3 Within 2–3 minutes, 292 passengers were evacuated, which was a demonstration of an extremely high level of coordination.
Residential evacuation, however, has not used the same tactics in establishing path knowledge. In 2010, a benchmark study conducted after the Southern California fires during 2007 and 2008, concluded that 80% of the people who lived in the vicinity of a major fire did not know how they would be notified if they needed to evacuate and 86% did not know what to do after they were notified. The survey demonstrated weak route knowledge concerning local shelters, emergency routes, expectations, and protocol for picking up young schoolchildren. Most participants in the survey would rely on watching the news, contact through local authorities or media-technologies, or the influence of neighbors, all of which require learning new information at the very time of evacuation. In a presentation given by John and Barbara Sorensen at the Natural Evacuation Conference4 they indicated that factors impacting warning evacuation response include: the construct of the warning message, experience of the population from past evacuation exercises, perceived risk and belief of harm, social interaction, and individual characteristics. During the 2007 San Diego wild fires it was estimated that only 59% of the threatened population actually evacuated. Reasons for those who did not evacuate included the following: 55% of residents did not feel threatened; 36% were not notified to evacuate; 8.2% stayed to protect their property; 4% stayed to protect their animals; and 2% said they just could not leave.5
The lack of a pre-existing instructional campaign for evacuation creates unacceptable amounts of new information, concerns, and protocols to be learned at the time of immediacy. Dr. John Leach is a lecturer in the Department of Psychology at the University of Lancaster, United Kingdom. His interests in cognition and human performance in extreme situations is discussed in his published works, including an article in Aviation, Space & Environmental Medicine entitled “Why people ‘freeze’ in an emergency: Temporal and cognitive constraints on survival responses.” He states, “‘Freezing causes evacuation delays which increase the danger, establishing a closed loop process and further extending evacuation delays. This behavior can be accounted for by considering the temporal constraints on cognitive information processing in a rapidly unfolding, real-time environment.”6 In 2008, Catharine Skipp, of Newsweek, interviewed Dr. Irwin Redlener about why some people
ignore evacuation orders.7 Redlener is the director of the National Center for Disaster Preparedness and associate dean for public-health advocacy and disaster preparedness at the Mailman School of Public Health at Columbia University. When asked by Skipp “What kind of person stays,” Redlener shares current information:
We just did a study on evacuations under scenarios of disasters without warnings. We are very concerned about disasters that occur without warning when we have to do evacuations in real-time—in essence, immediate—for example, an earthquake or a terrorist nuclear attack. We found about two thirds of people with children would not comply with official orders to evacuate until and unless they were able to retrieve their children from school or day care. If we have two thirds of the population with children that would not comply, what we would have is evacuation chaos and an absolute breakdown of disaster response in circumstances that provided no warning. Under those circumstances, unless we get much better at having well-developed disaster plans that parents were comfortable with, we can anticipate extreme chaos
as public officials would be unable to stop parents determined to get their kids.
This paper describes the process toward developing a public information campaign that can improve situational cognitive path knowledge in evacuation preparedness. Semiotics, textual, and visualization factors currently used in evacuation information will be assessed and a proposed campaign will be presented. Cognitive variables, including considerations in the psychology of emergency ingress and egress, collective behavior, phenomenon of tunnel vision, and issues in temporary cognitive paralysis will be applied in addressing current evacuation material.
EMERGENCY BEHAVIOR
Issues of stressed cognition (including the quality of retained information, effects of timed tasks, phenomenon of tunnel vision, and information overload) have been integrated into the interdisciplinary discourse between psychology, information design, and interaction design. However, stressed cognition respecting reading and comprehension performance during dramatic shifts in cognitive demands caused by an abrupt change in the environment is not commonly considered, particularly when an event is perceived as urgent or dangerous. Artifacts that have been designed for specific situational communication—first-aid pamphlets, instructions for epinephrine injections, evacuation aids—must recognize the importance of understanding the impact of this shift in cognition.
Memory and the ability to problem-solve and assess are vulnerable when confronted by an urgent situation. This vulnerability is subject to the phenomena of tunnel vision and/or temporary cognitive paralysis. Tunnel vision has been associated with extreme stress, information overload, and exhaustion in which primitive tasks become central to cognitive processing and problem-solving capabilities are limited.8 A person with tunnel vision may be unable to respond at the appropriate level the situation requires. Temporary cognitive paralysis, such as when people “freeze” in an emergency, is also associated with people experiencing dramatic shifts in cognitive demands as a result of an abrupt change in the environment.9 Variables that affect cognitive paralysis include limited reaction time, perception of danger to themselves, and previous training or experience.10
The literature regarding human behavior, including social attachment and crowd psychology, helps initiate an understanding of these dramatic shifts in cognitive demands. Although panic does not play a major role in evacuation behavior, theories of panic provide helpful models when looking at fundamental stability when confronted with instability. When an individual is faced with an evacuation order, instincts for self-preservation supersede all other social activities or daily routines.11 Micro populations (e.g., neighborhoods) will begin to absorb feedback regarding their own actions through the verbal and non-verbal responses of others. The more pressure and immediacy individuals feel when they are in danger, the more unstable social attachment and conventions become. If an individual

2524 Design for Evacuation: Improving City Evacuation Instructions Design for Evacuation: Improving City Evacuation Instructions
Figure 1: Metropolitan New Orlean Counterflow Plan
begins to act aggressively or “speeds” his or her actions in a way that is out of sync with everyone else, this may lead into “survivor’s competition,” where panic occurs as a response to the perceived need for self-preservation.12 Panic is not usually the issue with city evacuations; rather, the issue is people’s delay in evacuating. Crowd psychology and group affiliations offer a benefit in this case. When a group agrees on certain behavior and expectations, members of that group will act accordingly.13 Thus, if a group is prepared and trained for sudden changes that require evacuation, expectations and behavior patterns will have already been defined. Social attachment will drive individual expected actions that had already been established.
Demographics, cultural experience, social conventions, and population density deploy variables that affects individual and group mental responses to visual, spatial, written, and verbal communicative triggers. It is also important to distinguish the travel patterns and travel behavior of a specific population. Whether the evacuation involves one neighborhood, or an entire city, the day-to-day travel pattern will change abruptly. For example, the evacuation map above was distributed in New Orleans. New Orleans uses a counter-flow plan that gives all roads a one-way designation during an evacuation.
This is counterintuitive to normal travel behavior and social expectations but effectively uses the city’s infrastructure to expedite an evacuation. The question then becomes an issue of training: is the public aware of this change in expected behavior before the activity of driving on the “wrong” side of the road is required of them? Will people tend to crowd onto the “normal,” expected on-ramps as they would habitually? The table below compares evacuation travel with other travel, which is useful not only to assess existing evacuation material but also to help design instructions with evacuation travel specifics.14
Other variables affecting successful residential evacuation include weather, time of day, transport modality, density and demographics of the evacuating population, geographical nature of location, and impact of the disaster to the area.15
In order to better anticipate behavior and response to an evacuation order, personas can be used from data collected by people living in a specified area. The collection of data includes information from those who have and who have not experienced evacuation in order to get an accurate representation of the population. Konrad Baumann exemplifies the use of personas in his paper, “Personas as a User-Centred Design Method for Mobility-Related Services” for Information Design Journal.16 Cooper, Reimann, and Cronin list the principal steps as: “1) identify behavioral variables; 2) map interview subjects to behavioral variables; 3) identify significant behavior patterns; 4) synthesize characteristics and relevant goals; 5) check for redundancy and completeness; 6) expand description of attributes and behaviors; and 7) designate persona types.”17 In the context of evacuations, the target group will include a certain number of people with differing needs, lifestyles, training, etc., but it is in their shared objective and imitation of travel during evacuation that personas can be constructed and helpful in understanding communication objectives.
A parallel approach of summarized data, presented at the National Evacuation Conference by Thomas, Best, and Lieberman, included the specific characteristics of an evacuation trip, characteristics of the evacuating population, and the capacity of the transportation infrastructure.18 The data “summariz[ed] the different population groups, their evacuation choices and the applicable Evacuation Time Estimates.”19 Influenced by Baumann’s concepts concerning the creation of personas,20 and Thomas et al’s concepts concerning the collection of data specific to evacuation characteristics,21 eight personas were developed that profile relevant subjects living within a potential wild fire evacuation zone in Orange County, California.
Figure 2: A comparison of evacuation travel with other types of travel.

2726 Design for Evacuation: Improving City Evacuation Instructions Design for Evacuation: Improving City Evacuation Instructions
Figure 3A: Persona Jennifer is a stay-at-home mother with two young school children.
Figure 3B: Persona Joe is retired and lives with his partner of 51 years in an active senior’s retirement home.
Figure 3C: Persona Carol just graduated from college and is a volunteer as a teacher’s assistant while she applies for work. She was born with acute hearing impairment and relies on sign language, reading lips and writing as forms of communication.
EVACUATION COMMUNICATION
In a previous paper, “The Taxonomy of Urgent Wayfinding,”22 I wrote about the effects of reading and comprehension in four proposed scenarios: leisure—being able to process information voluntarily with minimal anxiety; direct—processing an instruction or noticing a change in environment but not necessarily threatening or limited by time; urgent—processing information with alertness within various levels of anxiety and time limitations’; and emergency—immediately affected by the environment in a threatening way, resulting in less time to process information, reading and comprehension susceptible to tunnel vision, and temporary cognitive paralysis.
Reverse 911 calls are widely used by local governments and emergency services to inform the public to evacuate. For most people, this may be the first source of information and/or instructions for evacuation. A tsunami warning triggered by an earthquake in Japan on March 11, 2011, reached a resident in Newport Beach, California, as a reverse 911 call at 4 a.m. Since he was still asleep when the earthquake struck Japan and had not heard any reports from media, the 911 reverse call was the first information he had. Reverse 911 systems rely on a database of landline phone numbers collected from city-registered addresses. A pre-recorded message is able to distribute information to a large group of people at the same time. For cell phones, each individual user must register with a participating program. The issue involved with cell phones and other wireless services is that telecommunication infrastructures are prone to vulnerabilities caused by instantaneous density of users and may well overwhelm communication grids.23
In the United States, the Emergency Alert System (EAS) uses radio and television alerts that are coordinated with and activated by FEMA, the Federal Communications Commission, and the National Weather Service. The EAS system replaced the Emergency Public Broadcast System that was used in the United States from 1963 to 1997. The EAS is regulated by the Public Safety and Homeland Security Bureau, but each state has its own EAS plan. Although the information being distributed by reverse-911 calls and the EAS is consistent, the issue is that these modes of communication distribute information and instruction at the time of impact and/or immediate action is required. The model below reflects this distribution of information relating to time and the levels of reading

2928 Design for Evacuation: Improving City Evacuation Instructions Design for Evacuation: Improving City Evacuation Instructions
Figures 4 & 5: A current model showing the distribution of information as it relates to time and the levels of reading and comprehensionand a proposed model showing the role of a pre-evacuation campaign and learning new information as it relates to the levels of reading and comprehension.
and comprehension of the people receiving the information. A small percentage who have evacuated in the past may rely on previous experience and recall routes they used (i.e. path knowledge) as well as recollect evacuation procedures from memory.
A model plan would improve individuals’ familiarity with evacuation routes (i.e., path knowledge), especially for those who have no prior evacuation training or experience, and provide time to associate and develop a mental map based on the new information well in advance of the need for action. New information is repeated, incorporated as a social expectation, and developed into a retainable mental model, thereby better positioning the person at time of evacuation.
Although some cities have tried to develop and/or increase public awareness toward the importance of evacuation preparation, such as offering emergency preparedness workshops, there has not been a systemic approach to evacuation route knowledge. Materials are distributed to the public as evacuations occur. Information is available online but only if someone volunteers to access it (which is usually not until the information is needed). Where exercises and drills are mandated in the workplace or in schools, residential evacuation exercises are non-existent. Airline safety cards work because before each flight the Federal Aviation Administration requires a review of evacuation procedures and material. A frequent flyer will have had countless exposures to this information so that when an emergency oxygen mask is deployed, chances are that passenger will recognize what it is, what it is for, and how to use it. Passengers recognize the consistent narrative of visual and textual grammar regardless of the commercial airline they are using. Although the visualization and use of graphic variables are widely diverse, the consistencies of the overall narrative structures develop and sustain stable mental maps (Figure 6).
VISUALIZATION USED IN EVACUATION INSTRUCTIONS
In 2008, I conducted a national search for evacuation material distributed by local emergency agencies. The entire collection was presented in maps, as shown in Figure 2, and was only available online. As mentioned earlier, telecommunication infrastructures are not always reliable during mass evacuation, “…even in the most developed economies, catastrophic events routinely overwhelm communications grids. In fact, in these settings the sheer variety and complexity of network infrastructure and the far greater needs and expectations of victims and responders increases the likelihood that any single system may fail.”24 It is relevant to note my observation on the role of technology respecting preparedness. While living in Pasadena, California, I received a pamphlet each year from Pasadena’s Integrated Waste Management regarding trash and recycling information. This
Figure 6: Variations in showing how to apply an oxygen mask during an in-flight emergency
reminds me of the airline safety card in that information is placed in front of you, whether in the form of a pamphlet, video, or demonstration, and exerts its message without your needing to search for it. I knew more about my trash schedule than I did about evacuation preparedness.
Technology (e.g. Internet, smart phones, laptops, GPS navigation systems, etc.) is a valuable resource, but limitations must also be acknowledged. Technology relies on a power source, whether someone already “owns” a device or is registered for a service. A person must volunteer to access information; even though technology is instantaneous and has the ability to simultaneously distribute information to large populations in different locations, it would be foolish to rely on technological devices as the sole portal to emergency information. This may also be the reason we see posted ephemera as a present and consistent response when searching for missing people after a disaster. Below is a collection of images taken from major events where people developed “hardcopy” information systems in an effort to finding missing people, even though personal technology had long been integrated in these societies.
Figure 7: Thai hospital after the Indian Ocean earthquake in 2004; the streets of Mianyang after Sichuan earthquake in 2008 (Life); wall in New York after September 11, 2001; and postings after the Japanese earthquake and tsunami in 2011 (The Sacramento Bee).
The problem with using maps as a general solution for evacuation instructions is the skill level required in wayfinding and map reading. The maps are usually never seen prior to an evacuation order, and visualization of instructions ranges from diagrammatic to re-appropriated road atlases. In the past, the graphic variables of these “road maps” have been sporadic, and many were lacking fundamental principles in visual construction. Most materials relied on “the map” as the main visual infrastructure, however, beyond this layer there were major problems in lower levels of the information. Jacques Bertin is a theorist of graphic representation who developed principles of the semiology of graphics in order to thoroughly understand visual language. He suggests that if similar graphic variables for the same kind of information are used, the images should demonstrate “maximum visibility.”in order to thoroughly understand visual language. He suggests that if similar graphic variables for the same kind of information are used, the images should demonstrate
“maximum visibility.”

3130 Design for Evacuation: Improving City Evacuation Instructions Design for Evacuation: Improving City Evacuation Instructions
Figure 8: “How to prepare for and survive a tsunami” Map source: Full page views of 1 and 2, and cropped view of page 2 from
the City of Los Angeles Emergency Preparedness Department, Santa Monica Fire Department.
Closer review of these maps reveals severe misuses of graphic variables—scale, color, typography, texture, shapes, composition, line, value, and orientation—and poorly executed visual constructions, which exemplifies issues that urgent and emergency cognition were not being addressed.
[Perception and behavior] breakdown in visual-motor coordination, an increase in apparent movement phenomena, increases in color saturation, decline in size and shape constancies, loss of accuracy in tactual perception and spatial orientation, increase in persistence of auto kinetic effect, larger figural after effects, difficulty in focusing, fluctuating curvature of lines and
surfaces, and a general decrease in the efficacy of perceiving relevant stimuli.25
The day of the recent Japanese earthquake and tsunami, I was scheduled to travel to Santa Monica, California. Because of the potential tsunami arriving on the west coast of the United States, Santa Monica was on alert for an evacuation. I searched online under
“Santa Monica evacuation 2011.” Figure 8 shows the PDF file I downloaded from the Santa Monica Fire Department website. Upon review of the cropped version of the Santa Monica evacuation map and legend, red overwhelms the lower level information, including school locations, a safe refuge center, evacuation route directional arrows, and the typography for smaller street labels. Even at a leisure level of reading, the visual construction of this map is difficult and time-consuming. Considering the cognitive variables at the time of evacuation, including learning new information under time constraints, this document fails to effectively communicate its intention.
Figure 9: Maps displaying various graphic variables as it relates to length of components
Images such as the maps in Figure 9, are additional examples that contain numerous layers of graphic variables that affect length of components. A “component” is a single layer in an image that contains graphic variables. The more graphic variables are used in a single layer, and the more layers that are “stacked” on top of one another, the more complex the reading of the final image and meaning. Bertin terms this the “length of components.” Components should support the intended image and message with careful consideration when organizing and numbering the visual separations (i.e. components) including icons, typography, foreground, background, color-coding, etc.26 If graphic variables out-number
the length of components, the macro image and final meaningget lost in complexity and disorganization.
The map below, Figure 10, is also an example of how graphic variables out-weigh the length of components. The final message of this image is a mix of a very detailed road atlas and simple evacuation instructions that are superimposed on each other. When zoomed in for a detailed view, this map reveals sections of blue lines that turn into dashed lines. Referencing the legend, this graphical change signifies roads that have been transformed into same-directional highways. The density of this image makes it taxing to scan, filter, collect, memorize, and retain information that is specific to an evacuee. Bertin writes about the “rules of legibility” that include issues of graphic density, angular and retinal legibility.
“Signifiers of routes, paths, streets and highways are susceptible to angular legibility. Bertin defines angular legibility as lines that are affected by changes of direction, resulting in lines causing angles. Map scale, exaggerations of directional change and angles approaching 0º or 180º all affect the legibility of angles.”27
Figure 10: Map demonstrating poor graphic density, angular and retinal legibility
Figure 11: Arrows used in airline safety cards and city evacuation maps
Figure 12: Arrows used in navigation software

3332 Design for Evacuation: Improving City Evacuation Instructions Design for Evacuation: Improving City Evacuation Instructions
PRE-EVACUATION PUBLIC EDUCATION CAMPAIGN
Communication used at the time of evacuation, no matter how aggressive in language or how mindful the pre-planning, is susceptible to psychological and cognitive variables that shift from normal comprehension to unexpected human behavior and responses. In order for comprehension, memory, and retention to become more successful with this kind of cognitive shift, exposure to information and training must be consistent, repeated, exercised, and drilled.29
Below are some examples of the evacuation material that was distributed during the 2008 Orange County, California fire evacuations.
Figure 13: Evacuation material distributed during the 2008 Orange County, California fire evacuations
Currently, residences must volunteer to access evacuation information on the web prior and during an evacuation potential. The following pre-evacuation public education campaign addresses this concern and would rely heavily on the annual distribution of printed evacuation information that would be mailed to residences. Issues in the psychology of emergency ingress and egress, collective behavior, tunnel vision, as well as in temporary cognitive paralysis, have added significant design considerations in the creation of consistent visual and textual grammar towards maximum visibility. Graphic variables, length of components, graphic density, and angular legibility has been simplified and reduced to priority information and reading demands.
The first design draft was chosen for a city in Orange County, Brea, California. The relationship between text and pictorial renderings is borrowed from the narrative approach used in airline safety cards and utilizes a direct-conversation choice in language. The choice for size, tri-fold, and two-color format considers logistical ability to allocate resources to this campaign, including: printing, updating information, and mailing. Each city in the county would have the same template containing information that is specific to each city. A benchmark for this first design draft will be conducted in order to test for effectiveness and usability. The printed document will lead the evacuation campaign, followed by online and mobile access in order to achieve maximum visibility. The campaign will be revised and mailed annually.
The campaign revises formal visualization to an appropriate length of components at a leisurely reading level, when information can be better retained, understood and memorized. Because it is difficult to test document performance used for urgent or emergency scenarios, this design approach will be tested for performance under non-emergency conditions. By beginning with this scenario an understanding to the rationale and function of why these documents exist, how they are created, and whether they are useful for effective evacuation, can be evaluated.
Figure 14: First design draft of a public evacuation campaign that would be mailed to city residences every year. This design campaign will begin a benchmark process and will be tested for usability in Summer 2012.

3534 Design for Evacuation: Improving City Evacuation Instructions Design for Evacuation: Improving City Evacuation Instructions
NOTES 1 Charles Kostelnick and Michael Hassett, Shaping Information: The Rhetoric of Visual Conventions (Carbondale: University of Illinois Press, 2003); Golledge, 1999; Jerome M. Chertkoff and Russell Kushigian, Don’t Panic: The Psychology of Emergency Egress and Ingress (Praeger Publishers, 1999). 2 Chertkoff and Kushigian, Don’t Panic. 3 Robert D. Mcfadden, “292 Escape Burning Jetliner at Kennedy Airport” New York Times, July 31, 1992, http://www.nytimes.com/1992/07/31/nyregion/escape-from-flight-843-291-escape-burning-jetliner- at-kennedy-airport.html, as cited by Chertkoff and Kushigian, Don’t Panic. 4 John Sorensen and Barbara Sorensen, “Warning and Response in the 2007 San Diego Wildfires” (powerpoint presentation, The National Evacuation Conference, New Orleans, LA, February 3–5, 2010). 5 Ibid. 6 John Leach, “Why people ‘freeze’ in an emergency: temporal and cognitive constraints on survival responses.” Aviation, Space, and Environmental Medicine, 75, no. 6 (2004): 539–542. 7 Catharine Skipp “The Holdouts: What motivates some people to ignore evacuation orders and warnings of hurricanes and other disasters? Inside the psychology of stubborn.” Newsweek, September 12, 2008, www.newsweek.com/2008/09/11/the-holdouts.print.html (accessed August 13, 2010). 8 Donald Norman, Emotional Design: Why We Love (or Hate) Everyday Things (New York: Basic Books, 2004); Colin Ware, Information Visualization: Perception for Design (Morgan Kaufmann Publishers, 2004). 9 Leach, “Why people ‘freeze.’” 10 Leach, “Why people ‘freeze’”; John Leach, “Cognitive Paralysis in an Emergency: The Role of the Supervisory Attentional System,” Aviation, Space, and Environmental Medicine, 76, no. 2 (2005): 134–136. 11 Anthony Mawson, Mass Panic and Social Attachment: The Dynamics of Human Behavior (Ashgate Publishing Limited, 2007). 12 Mawson, Mass Panic; Chertkoff and Kushigian, Don’t Panic. 13 Mawson, Mass Panic; Stephen Reicher, “The psychology of crowd dynamics,” Blackwell Handbook of Social Psychology: Group Processes, eds. M. A. Hogg and R. S. Tindale (Oxford, UK: Blackwell, 2001), 182–208; Chertkoff and Kushigian, Don’t Panic. 14 Susan Thomas, Natalie Jones Best, and Ed Lieberman, “Addressing Uncertainty in Travel Modalities for an Emergency Evacuation” (proceedings of the National Evacuation Conference, New Orleans, LA, February 3–5, New Orleans, 2010). 15 Ibid. 16 Konrad Baumann, “Personas as a usercentred design method for mobility-related services,” Information Design Journal 18, no. 2 (2010): 157–167. 17 Alan Cooper, Robert Reimann, and Dave Cronin, About Face 3. The Essentials of Interaction Design (Indianapolis: John Wiley & Sons, 2007) as quotes in Baumann, Personas.” 18 Thomas et al., “Addressing Uncertainty.” 19 Ibid. 20 Baumann, “Personas.” 21 Thomas et al., “Addressing Uncertainty.” 22 Claudine Jaenichen, “The Taxonomy of Urgent Wayfinding,” 2008.
23 Anthony M. Townsend and Mitchell L. Moss, “Telecommunciation Infrastructure in Disasters: Preparing Cities for Crisis Communications,” (2005), www.nyu.edu/ccpr/pubs/NYU-DisasterCommunications1- Final.pdf 24 Ibid., 4. 25 Kubzansky quoted in Mawson, Mass Panic.26 Jaenichen, “Taxonomy of Urgent Wayfinding.” 27 Jacques Bertin, Semiology of Graphics: Diagrams, Networks, Maps, trans. William J. Berg (Wisconsin: The University of Wisconsin Press, 1993). 28 Robert Krull and Michael Sharp, “Visual Verbs: Using Arrows to Depict the Direction of Actions in Procedural Illustrations,” Information Design Journal 14, no. 3 (2006): 189–198. 29 Norman, Emotional Design.
IMAGES SOURCES
Figure 1: New Orleans, Louisiana. Louisiana Homeland Security and Emergency Preparedness. Viewed March 22, 2008. New Orleans area counter flow maps, hurricane and evacuation related information (Adobe Acrobat). Figure 2: Thomas et al., “Addressing Uncertainty.” Figure 3: Jaenichen, “Taxonomy of Urgent Wayfinding.” Figure 6: From top left column, Continental 757; British Airways 737; American Airlines 757; Cathay 747; Iberia 321; Alaska 737; RyanAir 737; and U.S. Airways A320. Figure 7: Thai hospital after the Indian Ocean earthquake in 2004; the streets of Mianyang after Sichuan earthquake in 2008 (Life); wall in New York after September 11, 2001; and postings after the Japanese earthquake and tsunami in 2011 (The Sacramento Bee). Figure 8: Full page views of 1 and 2, and cropped view of page 2 from the Santa Monica/Venice, California. City of Los Angeles Emergency Preparedness Department. Viewed March 13, 2011. Tsunami Brochure-(RED Santa Monica - Venice).pdf http://santamonicafire.org/WorkArea/linkit.aspx ?LinkIdentifier=id&ItemID=22085&libID=22800Figure 9: 1) Citrus County Board of County Commissioners, Florida; 2) South Carolina Department of Transportation; 3) The New York City Office of Emergency Management Hurricane Evacuation; and 4) Pinellas County Emergency Management, Florida. Figure 10: Texas Division of Emergency Management, Houston. Figure 11: Continental 757; British Airways 737; Alaska 737; British Airways 747; Virgin Atlantic A340; and Delta 767; Louisiana Homeland Security & Emergency Preparedness; Lee County, Florida Division of Public Safety Emergency Management; and State of Rhode Island Emergency Management Agency Figure 12: Image sources: Sygic GPS navigation software, Garmin StreetPilot and TomTom Navigation Screen Figure 13: Map sources: Orange County Governor’s Office of Emergency Services, California (2008); OCRegister.com (October 18, 2008); and Orange County Fire Authority (November 16, 2008).

Section 2: Design

3938Design Design
WHAT WAS THE CHALLENGE?
After reviewing evacuation wayshowing material distributed to residents by emergency management departments in the United States, it became clear that wayshowing and wayfinding methodologies were absent. The challenge was defining criteria and performance tasks, if any, developed by stakeholders, and how decisions were being made in creating and distributing these materials.
Figure 1: A model of reading situations that do not always act or respond in a sequence. Change in demands trigger changes in cognitve processing.

4140Design Design
Figure 2: Current Model depicting distribution of information that is given at the time of evacuation
WHAT WAS THE SOLUTION?
The wayshowing redesign heavily relied on distribution prior to an evacuation in achieving better cognitive recall. Fundamentals in wayshowing practice and theory guided decisions of visual variables and were constructed towards an instructional approach rather than a geographical one. Lengths of components were reduced achieving better levels of organization. Cognitive variables in the psychology of emergency ingress and egress, collective behavior, tunnel vision, and issues in temporary cognitive paralysis were also considered and applied to the redesign.
Figure 3: A New Model proposal for an information campaign that is given prior to the time of evacuation.

4342Design Design
Figure 4: Map previously given to residents for evacuation wayfinding in Santa Barbara County, California.
SURF
OCEANO
NIPOMO
ORCUTT
CUYAMA
CASMALIA
LOMPOC
FOX MTN
SISQUOC
G
BALDMTN
PEAKMTN
POINT SAL
MARICOPA
ZACA LAKE
LOS OLIVOS
EZ
GUADALUPE
ZACA CREEK
LOS ALAMOS
SANTAMARIA
BIGPIN
E MTN
NEWCUYAMA
HUASNA PEAK
CUYAMA PEAK
WELLS RANCH
CALIENTE MTN
LLS
FIGUEROA MTN
BATES CANYON
MADULCE PEAK
UMA
ELKHORNHILLS
PEAK
FOXENCANYON
MANZANITAMTN
TWITCHELL DAM
TAYLOR CANYON
SAN RAFAEL MTN
ELLO
HURRICANE DECK
CHIMNEY CANYON
HILLSPASS
MIRANDA PINE MTN
UNTAIN
BALLINGER CANYON
TEPUSQUET CANYON
SALISBURY POTRERO
NTAIN
RANCHONUEVO
CREEK
UNTAIN
WHAT WAS THE EFFECT?
The City of Santa Barbara incorporated the proposed research and design methodology for a tsunami evacuation campaign in 2011. They have incorporated information design standards when creating wayshowing material for the public. Currently, with Dr. Steve Schandler (Director, Cognitive Psychophysiology Laboratories at Chapman University) and Santa Barbara Emergency Management, a quantitative study on measuring the cognitive recall of the design (including visual, audio and written formats) is in progress. The data will continue to influence design and logistical revisions in conjunction with a continuous cyclical distribution plan.

4544Design Design
Figure 5: Revised wayshowing instructions based on research and study in cognitive recall, semiotics, length of components and level of organization.

Section 3: Investigation

INTRODUCTION
This is an ongoing interdisciplinary project being conducted in collaboration with the city of Santa Barbara, California. The objective of this project is to systematically evaluate the utility of an evacuation map that has been constructed, using principles of graphic design, to present information in a way that both maximizes comprehension and retention. Systematic evaluation will incorporate a standard research design and measures of information processing used in the probe of cognitive operations in humans. Utility will be evaluated by testing the public who will be directly affected by evacuation information. Map information and information provided by written and verbal modalities are presented and assessed both immediately (information recall) and after a 24-hour period (information retention).
BACKGROUND
Departments of Emergency Management in the United States deploy informational and instructional messaging prior, and during, an evacuation order. However, a recent national survey of city U.S. dwellers concluded that only 9% felt confident in knowing how to respond to a city evacuation order. The survey also indicated that 80% would not know how they would be notified, and 86% would not know what to do should they be notified. Evacuation materials look and perform differently, not only due to spatial and logistical constraints (such as between city and aircraft scenarios), but also in evacuees’ communicative relationships (receiving, reading, and comprehending instructional information).
Further, memory and the ability to problem-solve and assess are vulnerable when confronted by an urgent situation. This vulnerability is subject to the phenomena of tunnel vision and/or temporary cognitive paralysis. Tunnel vision has been associated with extreme stress, information overload, and exhaustion in which primitive tasks become central to cognitive processing and problem-solving capabilities are limited. Temporary cognitive paralysis, such as when people “freeze” in an emergency, is also associated with people experiencing dramatic shifts in cognitive demands as a result of an abrupt change in the environment. Variables that affect cognitive paralysis include limited reaction time, perception of danger to self, and previous training or experience.
The majority of the materials distributed by emergency managers are repurposed maps originally intended for emergency planning and local authorities. However, evacuation maps have of widely varied graphic designs lacking evaluative data relative to the map’s purpose; informing the public about evacuation during an emergency. Evacuation maps rarely if ever receive an evaluation by the target population. In fact, it is the rule rather
Cognitive Evaluation of Methods for Providing Evacuation Information and Instruction Presented at Chapman University, MAY 2012
CLAUDINE JAENICHEN, MFASTEVEN SCHANDLER, Ph.D.
TAVISH RYAN, RESEARCH ASSISTANTMARISSA BREDICE, RESEARCH ASSISTANT
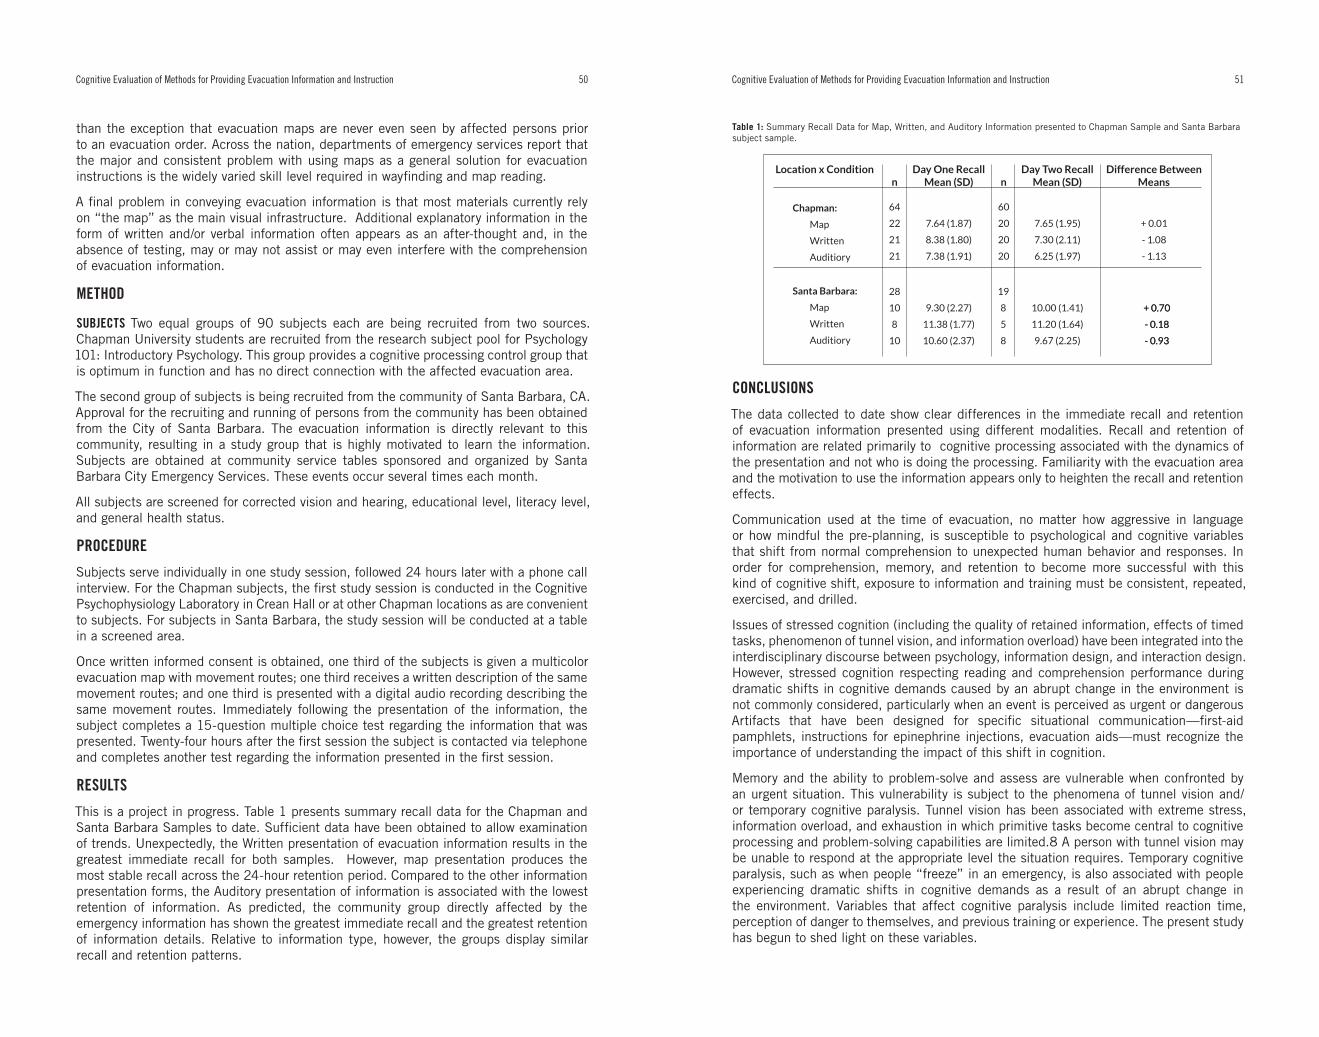
5150 Cognitive Evaluation of Methods for Providing Evacuation Information and InstructionCognitive Evaluation of Methods for Providing Evacuation Information and Instruction
than the exception that evacuation maps are never even seen by affected persons prior to an evacuation order. Across the nation, departments of emergency services report that the major and consistent problem with using maps as a general solution for evacuation instructions is the widely varied skill level required in wayfinding and map reading.
A final problem in conveying evacuation information is that most materials currently rely on “the map” as the main visual infrastructure. Additional explanatory information in the form of written and/or verbal information often appears as an after-thought and, in the absence of testing, may or may not assist or may even interfere with the comprehension of evacuation information.
METHOD
SUBJECTS Two equal groups of 90 subjects each are being recruited from two sources. Chapman University students are recruited from the research subject pool for Psychology 101: Introductory Psychology. This group provides a cognitive processing control group that is optimum in function and has no direct connection with the affected evacuation area.
The second group of subjects is being recruited from the community of Santa Barbara, CA. Approval for the recruiting and running of persons from the community has been obtained from the City of Santa Barbara. The evacuation information is directly relevant to this community, resulting in a study group that is highly motivated to learn the information. Subjects are obtained at community service tables sponsored and organized by Santa Barbara City Emergency Services. These events occur several times each month.
All subjects are screened for corrected vision and hearing, educational level, literacy level, and general health status.
PROCEDURE
Subjects serve individually in one study session, followed 24 hours later with a phone call interview. For the Chapman subjects, the first study session is conducted in the Cognitive Psychophysiology Laboratory in Crean Hall or at other Chapman locations as are convenient to subjects. For subjects in Santa Barbara, the study session will be conducted at a table in a screened area.
Once written informed consent is obtained, one third of the subjects is given a multicolor evacuation map with movement routes; one third receives a written description of the same movement routes; and one third is presented with a digital audio recording describing the same movement routes. Immediately following the presentation of the information, the subject completes a 15-question multiple choice test regarding the information that was presented. Twenty-four hours after the first session the subject is contacted via telephone and completes another test regarding the information presented in the first session.
RESULTS
This is a project in progress. Table 1 presents summary recall data for the Chapman and Santa Barbara Samples to date. Sufficient data have been obtained to allow examination of trends. Unexpectedly, the Written presentation of evacuation information results in the greatest immediate recall for both samples. However, map presentation produces the most stable recall across the 24-hour retention period. Compared to the other information presentation forms, the Auditory presentation of information is associated with the lowest retention of information. As predicted, the community group directly affected by the emergency information has shown the greatest immediate recall and the greatest retention of information details. Relative to information type, however, the groups display similar recall and retention patterns.
Table 1: Summary Recall Data for Map, Written, and Auditory Information presented to Chapman Sample and Santa Barbara subject sample.
CONCLUSIONS
The data collected to date show clear differences in the immediate recall and retention of evacuation information presented using different modalities. Recall and retention of information are related primarily to cognitive processing associated with the dynamics of the presentation and not who is doing the processing. Familiarity with the evacuation area and the motivation to use the information appears only to heighten the recall and retention effects.
Communication used at the time of evacuation, no matter how aggressive in language or how mindful the pre-planning, is susceptible to psychological and cognitive variables that shift from normal comprehension to unexpected human behavior and responses. In order for comprehension, memory, and retention to become more successful with this kind of cognitive shift, exposure to information and training must be consistent, repeated, exercised, and drilled.
Issues of stressed cognition (including the quality of retained information, effects of timed tasks, phenomenon of tunnel vision, and information overload) have been integrated into the interdisciplinary discourse between psychology, information design, and interaction design. However, stressed cognition respecting reading and comprehension performance during dramatic shifts in cognitive demands caused by an abrupt change in the environment is not commonly considered, particularly when an event is perceived as urgent or dangerous Artifacts that have been designed for specific situational communication—first-aid pamphlets, instructions for epinephrine injections, evacuation aids—must recognize the importance of understanding the impact of this shift in cognition.
Memory and the ability to problem-solve and assess are vulnerable when confronted by an urgent situation. This vulnerability is subject to the phenomena of tunnel vision and/or temporary cognitive paralysis. Tunnel vision has been associated with extreme stress, information overload, and exhaustion in which primitive tasks become central to cognitive processing and problem-solving capabilities are limited.8 A person with tunnel vision may be unable to respond at the appropriate level the situation requires. Temporary cognitive paralysis, such as when people “freeze” in an emergency, is also associated with people experiencing dramatic shifts in cognitive demands as a result of an abrupt change in the environment. Variables that affect cognitive paralysis include limited reaction time, perception of danger to themselves, and previous training or experience. The present study has begun to shed light on these variables.

52Cognitive Evaluation of Methods for Providing Evacuation Information and Instruction
REFERENCES
Jaenichen, C. (2011). Design for evacuation: Improving city evacuation instructions. Parsons Journal For Information Mapping, 3(2), 1-16.
ACKNOWLEDGEMENTS
Special thanks to the Chapman University Department of Undergraduate Research, as well as Yolanda
McGlinchey and the Santa Barbara Fire Department for their continued support throughout this project.

Chapman University, 2012