
Cognitive Development Trajectories of Very Preterm and ...
17
Cognitive Development Trajectories of Very Preterm and Typically Developing Children Kathryn S. Mangin Washington University and Brigham and Women’s Hospital L. J. Horwood University of Otago Lianne J. Woodward Brigham and Women’s Hospital Cognitive impairment is common among children born very preterm (VPT), yet little is known about how this risk changes over time. To examine this issue, a regional cohort of 110 VPT (≤ 32 weeks gestation) and 113 full-term (FT) born children was prospectively assessed at ages 4, 6, 9, and 12 years using the Wechsler Pre- school and Primary Scale of Intelligence–Revised and then Wechsler Intelligence Scale for Children, 4th ed. At all ages, VPT children obtained lower scores than their FT born peers (p < .001). Growth curve modeling revealed stable cognitive trajectories across both groups. Neonatal white matter abnormalities and family socioeconomic adversity additively predicted cognitive risk. Despite some intraindividual variability, cognitive functioning of typically developing and high-risk VPT children was stable and influenced by early neurologi- cal development and family rearing context. Although survival rates for infants born very pre- term (VPT) have improved dramatically in recent decades, neurodevelopmental outcomes have not and are of major concern. Approximately 10%–15% will develop severe neurosensory impairments including cerebral palsy, blindness, and deafness, and a further 30%–60% will experience clinically significant cognitive, language, executive, atten- tional, and emotional difficulties (Woodward et al., 2009). The most prevalent of these adverse out- comes is cognitive delay, which is a source of con- siderable anxiety for parents, particularly during the school-age years. Relative to their full-term (FT) born peers, chil- dren born VPT perform less well on both standard- ized tests of cognitive functioning such as the Bayley Scales of Infant Development (Vohr et al., 2000; Woodward, Anderson, Austin, Howard, & Inder, 2006) and tests of general intelligence (Anderson & Doyle, 2008; Bhutta, Cleves, Casey, Cradock, & Anand, 2002; Johnson, 2007; Kerr-Wil- son, Mackay, Smith, & Pell, 2012; Marlow, 2004; Woodward, Clark, Bora, & Inder, 2012). For exam- ple, Bhutta et al.’s (2002) meta-analysis of 15 case– control studies showed that school-age children born VPT obtained average IQ scores that were 10.9 points below their FT born peers. This IQ dif- ference is very similar to the 11.9-point estimate obtained in a more recent meta-analysis by Kerr- Wilson et al. (2012), which included an additional 12 studies, suggesting that this gap is not reducing in size. Not surprisingly, rates of both mild and severe delay for VPT children are also high at 49% and 16%, respectively, compared to 17% and 4% in the general population (Woodward et al., 2012). Mild and severe delay were defined as a score > 1 SD below the mean and more than 2 SD’s below the Funding for this study was provided by the Neurological Foundation of New Zealand, the Health Research Council of New Zealand, and the Canterbury Medical Research Foundation. We thank the members of the Canterbury Child Development Research Group for longitudinal data collection, especially Marie Goulden and Karelia Levin. We also wish to thank the children and families involved in the study. Kathryn S. Mangin assisted with data analysis and data interpretation, and drafted the initial manuscript; L. John Horwood carried out the data analysis, inter- preted the data, and critically reviewed and revised the initial manuscript; Dr. Lianne J. Woodward conceptualized and designed the study, coordinated and supervised data collection and analysis, interpreted the data, and critically reviewed and revised the initial manuscript; and all authors approved the final manuscript as submitted. Correspondence concerning this article should be addressed to Lianne J. Woodward, Department of Pediatric Newborn Medi- cine, Harvard Medical School, Brigham and Women’s Hospital, Boston, MA. Electronic mail may be sent to ljwoodward@bwh. harvard.edu. © 2016 The Authors Child Development © 2016 Society for Research in Child Development, Inc. All rights reserved. 0009-3920/2017/8801-0021 DOI: 10.1111/cdev.12585 Child Development, January/February 2017, Volume 88, Number 1, Pages 282–298
Transcript of Cognitive Development Trajectories of Very Preterm and ...

Cognitive Development Trajectories of Very Preterm and TypicallyDeveloping Children
Kathryn S. ManginWashington University and Brigham and Women’s Hospital
L. J. HorwoodUniversity of Otago
Lianne J. WoodwardBrigham and Women’s Hospital
Cognitive impairment is common among children born very preterm (VPT), yet little is known about how thisrisk changes over time. To examine this issue, a regional cohort of 110 VPT (≤ 32 weeks gestation) and 113full-term (FT) born children was prospectively assessed at ages 4, 6, 9, and 12 years using the Wechsler Pre-school and Primary Scale of Intelligence–Revised and then Wechsler Intelligence Scale for Children, 4th ed. Atall ages, VPT children obtained lower scores than their FT born peers (p < .001). Growth curve modelingrevealed stable cognitive trajectories across both groups. Neonatal white matter abnormalities and familysocioeconomic adversity additively predicted cognitive risk. Despite some intraindividual variability, cognitivefunctioning of typically developing and high-risk VPT children was stable and influenced by early neurologi-cal development and family rearing context.
Although survival rates for infants born very pre-term (VPT) have improved dramatically in recentdecades, neurodevelopmental outcomes have notand are of major concern. Approximately 10%–15%will develop severe neurosensory impairmentsincluding cerebral palsy, blindness, and deafness,and a further 30%–60% will experience clinicallysignificant cognitive, language, executive, atten-tional, and emotional difficulties (Woodward et al.,2009). The most prevalent of these adverse out-comes is cognitive delay, which is a source of con-siderable anxiety for parents, particularly duringthe school-age years.
Relative to their full-term (FT) born peers, chil-dren born VPT perform less well on both standard-ized tests of cognitive functioning such as theBayley Scales of Infant Development (Vohr et al.,2000; Woodward, Anderson, Austin, Howard, &Inder, 2006) and tests of general intelligence(Anderson & Doyle, 2008; Bhutta, Cleves, Casey,Cradock, & Anand, 2002; Johnson, 2007; Kerr-Wil-son, Mackay, Smith, & Pell, 2012; Marlow, 2004;Woodward, Clark, Bora, & Inder, 2012). For exam-ple, Bhutta et al.’s (2002) meta-analysis of 15 case–control studies showed that school-age childrenborn VPT obtained average IQ scores that were10.9 points below their FT born peers. This IQ dif-ference is very similar to the 11.9-point estimateobtained in a more recent meta-analysis by Kerr-Wilson et al. (2012), which included an additional12 studies, suggesting that this gap is not reducingin size.
Not surprisingly, rates of both mild and severedelay for VPT children are also high at 49% and16%, respectively, compared to 17% and 4% in thegeneral population (Woodward et al., 2012). Mildand severe delay were defined as a score > 1 SDbelow the mean and more than 2 SD’s below the
Funding for this study was provided by the NeurologicalFoundation of New Zealand, the Health Research Council ofNew Zealand, and the Canterbury Medical Research Foundation.We thank the members of the Canterbury Child DevelopmentResearch Group for longitudinal data collection, especially MarieGoulden and Karelia Levin. We also wish to thank the childrenand families involved in the study. Kathryn S. Mangin assistedwith data analysis and data interpretation, and drafted the initialmanuscript; L. John Horwood carried out the data analysis, inter-preted the data, and critically reviewed and revised the initialmanuscript; Dr. Lianne J. Woodward conceptualized anddesigned the study, coordinated and supervised data collectionand analysis, interpreted the data, and critically reviewed andrevised the initial manuscript; and all authors approved the finalmanuscript as submitted.
Correspondence concerning this article should be addressed toLianne J. Woodward, Department of Pediatric Newborn Medi-cine, Harvard Medical School, Brigham and Women’s Hospital,Boston, MA. Electronic mail may be sent to [email protected].
© 2016 The AuthorsChild Development © 2016 Society for Research in Child Development, Inc.All rights reserved. 0009-3920/2017/8801-0021DOI: 10.1111/cdev.12585
Child Development, January/February 2017, Volume 88, Number 1, Pages 282–298

mean of a normative or FT comparison group. Suchgeneral cognitive impairments have been shown tohave significant impacts on school achievement,with a large proportion of VPT children laggingbehind their FT peers (Aarnoudse-Moens, Weisglas-Kuperus, van Goudoever, & Oosterlaan, 2009; Littet al., 2012; Pritchard, Bora, Austin, Levin, &Woodward, 2014; Taylor, 2010). Specifically, VPTchildren score between 0.48 and 0.76 SDs belowtheir classmates in mathematics, reading, and spel-ling (Aarnoudse-Moens et al., 2009) and are 3.4–4.4times more likely to experience significant delays inliteracy and numeracy (Pritchard et al., 2014). Fur-thermore, these cognitive difficulties are not con-fined to childhood, with VPT born adolescentsrequiring increased educational support and beingless likely to graduate from high school (Aylward,2002; Hack et al., 2002; Litt et al., 2012; O’Brienet al., 2004).
Despite the extensive body of research concernedwith the cognitive outcomes of children born VPT,longitudinal analyses describing their cognitivedevelopment over time are extremely rare (Ayl-ward, 2003, 2010). Most studies to date have beencross-sectional, describing the nature and extent ofcognitive impairments at a single time point. Thus,little is currently known about whether these cogni-tive impairments (a) improve, (b) worsen, or (c)remain stable across childhood. This information isimportant for parents and intervention service pro-viders as knowledge of likely trajectories can helpinform the timing of developmental screening andassessments, as well as the implementation of inter-vention services and developmental support.
Given the importance of this issue, a detailedsearch of PubMed, PsycINFO, and Google Scholarwas undertaken to identify studies. For inclusion,studies were required to meet four criteria. Theseincluded (a) peer reviewed, (b) sample of VPT chil-dren consisted of those born ≤ 32 weeks gestationand/or a birth weight ≤ 1,500 g, (c) cognitive func-tioning was assessed using a standardized measureadministered at 2 or more age points, and (d) cogni-tive assessment extended beyond the early child-hood years. Ten studies were identified. Findingswere mixed, suggesting considerable uncertaintyand debate as to whether VPT children grow into orout of their cognitive problems. These studies aresummarized in Table S1 and briefly reviewed below.
Improvement in Cognitive Functioning Over Time
Three studies, based on the same cohort, suggestthat cognitive outcomes of children born VPT
improve with age. The first by Ment et al. (2003)assessed 296 very low birth weight (VLBW) infants(600–1,250 g) at corrected ages 3, 4.5, 6, and 8 yearswith the normed Peabody Picture Vocabulary Test–Revised (PPVT–R; Dunn & Dunn, 1981). VPT chil-dren’s performance on the PPVT–R improved overtime, with median scores increasing from 88 at age3 years to 99 at age 8 years. VLBW children weretested on the Stanford Binet Intelligence test at age3, the Wechsler Preschool and Primary Scale ofIntelligence–Revised (WPPSI–R) at ages 4.5 and6 years, and the Wechsler Intelligence Scale forChildren, 3rd ed. (WISC–III) at age 8 years. Basedon these measures of general cognitive functioning,VLBW children’s average full scale IQ (FSIQ) scoresincreased from 90 to 95 and their verbal and perfor-mance IQ scores increased from 91 to 98 and 89 to92. Over the study, however, it is important to notethat most VLBW children were in the low averagerange and those subject to early onset intraventricu-lar hemorrhage (IVH), followed by significant cen-tral nervous system injury neonatally, showedevidence of declines in cognitive functioning overtime. These findings suggest that the outlook forchildren born VPT who are free of neurologicalabnormalities is promising, whereas for those withearlier brain injury the outcome may be less opti-mistic. A subsequent follow-up of this cohort at age12 years suggested additional catch-up gains on thePPVT–R, with hierarchical growth curve analysisindicating a 1.2-point increase per year between 3and 12 years (Luu et al., 2009). A commentary onMent et al.’s (2003) article highlighted that althoughthe PPVT–R is a useful measure of receptive vocab-ulary development, improvements in performanceover time may not generalize to more globalaspects of cognitive development and functioning(Aylward, 2003). Furthermore, the lack of a concur-rent FT control group makes changes in IQ difficultto interpret as scores on standardized intelligencetests tend to increase several points every few years(Flynn, 1999). Thus, how these VLBW children werefunctioning in comparison to other FT born childrenin their community is not easy to discern (Aylward,2003, 2010). Despite these difficulties, the large sam-ple size and multiple follow-up assessments weremajor strengths of this study.
Building on this work, a subsequent analysis ofthe same cohort examined VLBW children’s cogni-tive and language trajectories across the schoolyears using the PPVT–R and subtests of the WISC–III at 8, 12, and 16 years (Luu, Vohr, Allan, Schnei-der, & Ment, 2011). Consistent with findings at ear-lier ages, VLBW adolescents demonstrated
Cognitive Development Trajectories in Childhood 283
significant impairments in general cognition andhigher order language skills compared to their FTborn peers at age 16. Catch-up gains in receptivevocabulary were again evident in the VLBW group.However, deficits in cognitive scores appearedstable from 8 to 16 years. Subgroups of VLBW chil-dren of low biological and social risk had similarcognitive trajectories to FT born children. Althoughit could be argued that this implies a potentialcatch-up gain in IQ, the IQ difference between thetwo groups was constant between 8 and 16 yearssuggesting the persistence of cognitive impairmentsover time.
Stable Cognitive Problems Over Time
The persistence or stability of cognitive impair-ments in children born VPT is of major concern. Astudy by Saigal, Hoult, Streiner, Stoskopf, andRosenbaum’s (2000) assessed the cognitive abilitiesof 150 extremely low birth weight (ELBW; 501–1,000 g, M = 27 weeks gestation) children alongside124 FT comparison children using an abridged ver-sion of the WISC–Revised (WISC–R) and found thataverage IQ scores of the ELBW children were 15and 12 points lower than FT children at age 8 andduring adolescence (12–16 years). Within-groupanalyses showed that the average estimated FSIQof these children remained stable and low at 90.Major strengths of this study were the inclusion ofa FT born comparison group and the use of consis-tent measures of IQ over time. However, as FT chil-dren also demonstrated a slight but significantdecline in WISC–R performance from childhood toadolescence, this finding is difficult to interpret. Inaccordance with Saigal et al. (2000), Allin et al.(2008) study of 94 VPT (< 33 weeks gestation) and44 FT adolescents also indicated that general cogni-tive impairments persist into adulthood rather thanchange with maturation. Specifically, VPT individu-als scored significantly lower on an eight-itemWISC–R at 15 years and on the Wechsler Abbrevi-ated Scale of Intelligence at 19 years, with IQ scores11 and 9 points below the FT group, respectively.Although the average difference between thegroups was slightly reduced, no detectable interac-tion between birth group and age of assessmentwas observed, suggesting stability in cognitive per-formance across the two time points.
Although these results imply that cognitivedelays or impairments are unlikely to improve overtime, it is important to consider that the cohortsdescribed in Saigal et al. (2000) and Allin et al.(2008) were born in the early 1980s, prior to
significant improvements in neonatal care, thus lim-iting generalizability to more recent cohorts. Also,as only two time points were analyzed, few conclu-sions can be drawn regarding patterns of cognitivedevelopment. Nonetheless, findings do highlightthe challenges that VPT children face as they movethrough childhood and as they encounter theincreasing cognitive demands of adolescence.
Decline in Cognitive Functioning Over Time
Consistent with evidence that individuals bornVPT continue to struggle throughout adolescence,are troubling reports of cognitive decline. Botting,Powls, Cooke, and Marlow’s (1998) study of 138VLBW (≤ 30 weeks gestation and/or < 1,500 g birthweight) children and 163 FT control childrenexamined performance on the WISC–III short format age 12 in relation to their earlier scores from theWPPSI at age 6. At age 12, VLBW children obtainedlower IQ scores (M = 89.7, SD = 17.2) than FT chil-dren (M = 97.8, SD = 17.4, p < .0001), with scoresdeclining significantly from 108 at age 6 to 90 atage 12 years. Comparable declines were, however,also evident in the FT group, suggesting that IQdifferences were unlikely to reflect cognitivedeterioration. Rather, Botting et al. (1998) attributedthe IQ differences to the recent standardizationof the WISC. This study demonstrates the impor-tance of a FT born comparison group when investi-gating cognitive functioning in VPT children overtime.
Other studies have also documented a decline ordeterioration in cognitive functioning with age inchildren born VPT (Isaacs et al., 2004; Koller, Law-son, Rose, Wallace, & McCarton, 1997; O’Brienet al., 2004; St�alnacke, Lundequist, B€ohm, Forss-berg, & Smedler, 2015). Koller et al.’s (1997)prospective longitudinal study of a cohort of 203VLBW (≤ 1,500 g) children was one of the first toassess cognitive trajectories in VLBW children. Chil-dren were tested on the Bayley Scales of InfantDevelopment at ages 1 and 2 years, the Stanford–Binet Intelligence scale at age 4, and the WISC–R atage 6. Cluster analysis revealed five different cogni-tive trajectories, with most children (67%) showingsome degree of decline in function. Other trajecto-ries showed evidence of both stability and improve-ment, while levels of functioning appeared tostabilize for most children after 3–4 years, demon-strating the poor predictive validity of cognitiveassessments in early childhood.
In a more recent cluster analysis study, St�alnackeet al. (2015) found that cognitive trajectories become
284 Mangin, Horwood, and Woodward

reasonably well established in late preschool. In thisstudy, the cognitive performance of 118 preterm(< 37 weeks gestation, < 1,500 g birth weight) chil-dren at 5.5 years was highly predictive of perfor-mance at age 18 years. Those who performed atinitially low levels were unlikely to catch up overtime, whereas those who performed at or above thenormal range were unlikely to deteriorate belowthis level. Again, however, some children showedimprovements in relative performance over time,whereas others became more impaired, signifyingthe heterogeneous nature of cognitive outcomesand emphasizing the importance of long-term fol-low-up and monitoring of individuals born VPT.Individual variability in cognitive development isimportant to acknowledge as different patterns ortrajectories may be difficult to detect in group anal-yses (St�alnacke et al., 2015). Koller et al. (1997) andSt�alnacke et al. (2015) considered this importantissue yet were limited by several factors. First, chil-dren of gestational ages up to 37 weeks wereincluded in both studies, limiting generalizability toVPT (< 33 weeks gestation) populations. Second,although Koller et al. (1997) conducted multipleassessments, they were concentrated in early child-hood precluding conclusions about children’slonger term cognitive trajectories. In contrast,St�alnacke et al. (2015) conducted two assessmentsspanning from late preschool age to late adoles-cence, yet the nature of patterns of cognitive func-tioning across middle to later childhood was notclear. Nevertheless, the variability in cognitive out-comes, including the potential for some children toshow cognitive deterioration over time, is importantto consider.
O’Brien et al. (2004) later administered theWISC–R to 151 VPT children (< 33 weeks gestation)at age 8 years and again at ages 14–15 years andfound evidence for both significant cognitivedecline and increases in special education need withage. Children’s IQ scores decreased from 104 to 95,and the proportion of children requiring remedialeducational assistance increased from 15% to 24%between the ages of 8 and 15 years. This study wasstrengthened by the use of the same cognitive mea-sure at each assessment. However, with only twoassessment points, little could be inferred about thepatterns of cognitive development. There was alsono FT comparison group. It is also possible that thecognitive deterioration evident in O’Brien et al.’s(2004) study was attributable to neurologicallyimpaired children. There has been suggestion thatdeclines in cognitive functioning over time may berestricted to studies that include VPT children
subject to neurological injury in their analyses(Isaacs et al., 2004). However, there is also someevidence to suggest otherwise. Isaacs et al. (2004)restricted their sample to 82 VPT children(≤ 30 weeks gestation) who were classed as neuro-logically normal at 7.5–8 years of age and adminis-tered the WISC–R in childhood (Mage = 7 years)and the WISC–III in adolescence (Mage = 15 years).They found that even these children exhibited decli-nes in cognitive performance over time, with aver-age verbal and performance IQ scores declining by9 and 12 points across the two assessments. Unfor-tunately, again, there was no FT control group.Despite this, these findings suggest that VPT chil-dren may show declines in cognitive functioningand that this decline was not only confined to high-risk infants with neurological injury but was alsoevident in lower risk VPT born children.
Mechanisms of Cognitive Impairment
Vital to reducing the long-term risks associatedwith VPT birth is an improved understanding ofthe mechanisms placing these children at risk ofcognitive delay. VPT infants are biologically imma-ture and commonly experience medical problemssuch as respiratory distress, IVH, infection, andcerebral white matter abnormalities (WMA) orinjury (Fanaroff et al., 2007; Stoll et al., 2010). Inspite of efforts to identify early perinatal markers ofneurodevelopmental outcomes, few factors are asstrongly associated with long-term cognitive func-tion as cerebral WMA on term magnetic resonanceimaging (MRI). These abnormalities are an espe-cially robust predictor of cognitive delay indepen-dent of other perinatal risk factors such asgestational age or birth weight (Iwata et al., 2012;Woodward et al., 2012). Diffuse WMA affect themajority of VPT born infants (50%–70%) andinclude loss of white matter volume, ventricu-lomegaly, white matter signal abnormalities, corpuscallosum thinning, and delayed myelination (Inder,Anderson, Spencer, Wells, & Volpe, 2003; Inder,Wells, Mogridge, Spencer, & Volpe, 2003; Wood-ward et al., 2006). The presence and severity ofthese neonatal cerebral abnormalities increase riskof later cognitive impairment for VPT born infants(Iwata et al., 2012; Woodward et al., 2012). Forexample, Woodward et al. (2012) found that VPTchildren with mild and moderate to severe WMAon term MRI were at increased risk for a range ofcognitive impairments at 4 and 6 years. The cogni-tive functioning of unaffected VPT children, how-ever, was relatively intact and comparable to FT
Cognitive Development Trajectories in Childhood 285

controls, highlighting the potential significance ofearly cerebral white matter connectivity for latercognitive function and providing sufficient rationalefor focusing on this perinatal predictor in the inves-tigation of longer term cognitive outcomes.
The family environment in which cognitivedevelopment takes place must also be considered.High-risk environments characterized by socioeco-nomic disadvantage and low maternal educationare well known to be associated with lower levelsof cognitive functioning and school achievement(Bradley & Corwyn, 2002; Duncan, Brooks-Gunn, &Klebanov, 1994; Hackman & Farah, 2009; Noble,Norman, & Farah, 2005; Wong & Edwards, 2013).The co-occurrence of VPT birth and socioeconomicdisadvantage thus creates a situation in which new-born infants may be exposed to a potentially haz-ardous combination of biological and social risk(Blumenshine, Egerter, Barclay, Cubbin, & Brave-man, 2010; Kramer, Seguin, Lydon, & Goulet, 2000;Kramer et al., 2001; Wong & Edwards, 2013).Although the associations between VPT birth andcognitive outcome remain after covariate adjust-ment for family social risk (Woodward et al., 2012),aside from covarying for social risk few studieshave examined their joint impact. Consequently,how biological and social risk factors collectivelyimpact cognitive development in VPT born childrenhas not been established.
The Current Study
Against this general background, the aim of thisstudy was to use growth curve modeling to exam-ine the cognitive development of a cohort of VPTand FT born children between the ages of 4 and12 years. Data were drawn from a prospective lon-gitudinal cohort study of VPT and FT children bornin New Zealand. This study addresses many of themethodological problems that have limited existingresearch by including a FT born comparison group,conducting four assessments across childhood, andretaining consistency in measures used and con-structs assessed. The specific aims of this studywere as follows:
1. To compare the cognitive performance of chil-dren born VPT and FT at ages 4, 6, 9, and12 years.
2. To use growth curve modeling to describe pat-terns of cognitive development from 4 to12 years in both groups.
3. To identify predictors of children’s cognitivedevelopment over time. Predictors examined
included family social risk, sex, and the sever-ity of cerebral WMA on MRI at term equiva-lent age.
Method
Participants
Study participants consisted of two groups ofchildren. The first group was a regional cohort of110 children born VPT (≤ 32 weeks gestation) whowere consecutively admitted to the level III Neona-tal Intensive Care Unit at Christchurch Women’sHospital (New Zealand) over a 2-year period(November 1998–December 2000). Excluding deaths(n = 3), 99% (n = 106) were followed up at 4 years,97% (n = 104) at 6 years, 96% (n = 103) at 9 years,and 97% (n = 104) at 12 years.
The second group, recruited at age 2 years, com-prised a sample of 113 FT born (37–41 weeks gesta-tion) children. These children were identified fromhospital birth records for the same period by alter-nately selecting, in a forward and backward fash-ion, the second child listed in the delivery schedule.As a group, they were matched to the VPT cohortfor gender, delivery hospital, and date of birth. Ofthose identified, 62% were recruited at age 2 years.Reasons for nonparticipation included untraced(n = 32), moved overseas (n = 9), refusal (n = 9),and agreed but unable to attend clinic appoint-ments within the 2-week assessment window dueto illness or family circumstances (n = 19). No sig-nificant differences were found between recruitedand nonrecruited term born infants on measures ofgestational age, birth weight, socioeconomic status(SES), or race (p > .05). In addition, comparison ofthe socioeconomic profile of families recruited aspart of the FT comparison group with regional cen-sus data showed that they were highly representa-tive of the Canterbury region from which they wererecruited (Statistics New Zealand, 2001). Retentionat the 4- and 6-year follow-up was high at 96%(n = 108) and remained extremely high at the 9-and 12-year follow-up, 97% (n = 110) and 96%(n = 109), respectively. Table 1 describes the clinicalcharacteristics of the two study groups.
Procedure
All children underwent a comprehensive neu-rodevelopmental assessment within 2–4 weekseither side of their 4th, 6th, 9th, and 12th birthdays(corrected for gestational age at birth). Proceduresand measures were approved by the Canterbury
286 Mangin, Horwood, and Woodward
Regional Ethics Committee, and written informedconsent was obtained from all parents or guardians.Assessments at each follow-up were completed bya clinical psychologist and supervised postgraduatelevel research assistants, blind to birth group andperinatal history.
General Cognitive Functioning
At ages 4 and 6 years (corrected), general cogni-tive functioning was assessed with a short form ofthe WPPSI–R. This consisted of two verbal subtests(comprehension and arithmetic) and two perfor-mance subtests (picture completion and blockdesign). This short form is reliable and valid, with asplit half reliability coefficient of .93 and a validitycoefficient of .92, indicating a strong linear relation-ship between short form IQ scores and thoseobtained from the full WPPSI–R (LoBello, 1991).Composite scores calculated from subtest scoresprovided an estimate of FSIQ and thus the generalintellectual ability of each child. One VPT child atage 4 and two at age 6 were assigned a minimumpossible estimated FSIQ score of 40 due to severedisability or inability to complete the assessment.Additionally, one FT child was excluded at age 4due to an incomplete assessment, and one VPTchild’s IQ score was excluded at age 6 due to anadministration error.
At ages 9 and 12 years (corrected) a short formof the WISC–IV was administered to all children(Wechsler, 2003). Although correcting for gesta-tional age to age 12 is conservative in nature, thismethod helps ensure that rates of cognitive impart-ment among VPT children are underestimated as
opposed to overestimated. This short form con-sisted of the following five subtests: block design,similarities, coding, vocabulary, and arithmetic,thus encompassing each of the four indices of theWISC–IV full form: verbal comprehension, percep-tual reasoning, working memory, and processingspeed. Composite scores were calculated to providean estimate of FSIQ. Short forms of the WISC–IVwith combinations of four and five subtests havebeen shown to achieve validity coefficients of .93and are commonly used for research purposes (Sat-tler & Dumont, 2004). At the 9-year follow-up, threeVPT children were assigned a lowest possible scoreof 40 due to their inability to complete the assess-ment, and one VPT child had their FSIQ estimatedfrom two subtests (vocabulary and matrix reason-ing). In addition, six VPT children were tested onthe full WISC–IV as part of a parallel study andcould not be retested by the current study. Thesechildren’s FSIQ scores were used to provide a mea-sure of cognitive functioning at age 9. In addition,one FT child was untestable. At the 12-year follow-up, two VPT children were assigned an IQ score of40 due to severe disability.
MRI Scanning (Term Equivalent Age)
All VPT infants underwent MRI at term equiva-lent age (full details reported in Woodward et al.,2006). All scans were independently assessed by apediatric neurologist and neuroradiologist unawareof infant perinatal history. WMA were scoredaccording to five scales which assessed the natureand degree of white matter signal abnormality, theloss in volume of periventricular white matter, the
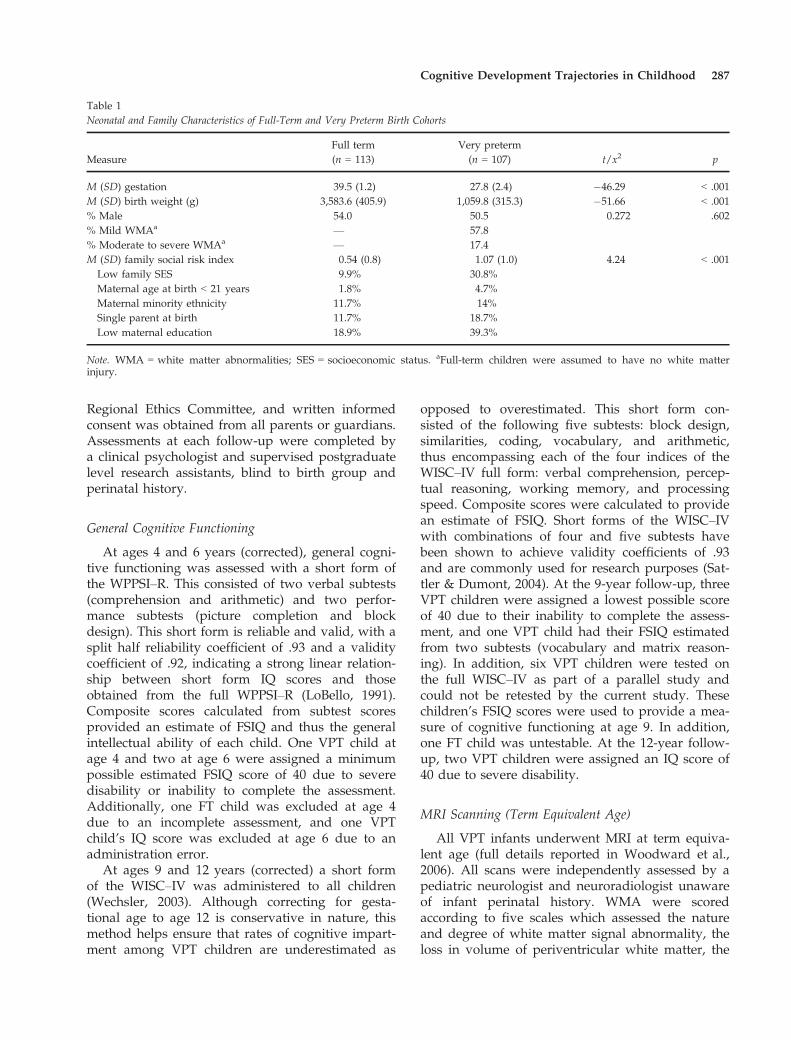
Table 1Neonatal and Family Characteristics of Full-Term and Very Preterm Birth Cohorts
MeasureFull term Very preterm
t/x2 p(n = 113) (n = 107)
M (SD) gestation 39.5 (1.2) 27.8 (2.4) �46.29 < .001M (SD) birth weight (g) 3,583.6 (405.9) 1,059.8 (315.3) �51.66 < .001% Male 54.0 50.5 0.272 .602% Mild WMAa — 57.8% Moderate to severe WMAa — 17.4M (SD) family social risk index 0.54 (0.8) 1.07 (1.0) 4.24 < .001Low family SES 9.9% 30.8%Maternal age at birth < 21 years 1.8% 4.7%Maternal minority ethnicity 11.7% 14%Single parent at birth 11.7% 18.7%Low maternal education 18.9% 39.3%
Note. WMA = white matter abnormalities; SES = socioeconomic status. aFull-term children were assumed to have no white matterinjury.
Cognitive Development Trajectories in Childhood 287

magnitude of any cystic abnormalities, ventriculardilation, or thinning of the corpus callosum. Com-posite scores were then used to categorize infantsinto four groups according to the severity ofobserved WMA. These categories were none (ascore of 5–6), mild (a score of 7–9), moderate (ascore of 10–12), and severe (a score of 13–15). Giventhe small number of children with severe WMA,children with moderate and severe WMA werecombined into one group. As only a small subsam-ple of FT children (n = 10) had a term MRI and noevidence of cerebral WMA was found, for the pur-poses of statistical analysis, all FT children wereassigned a score of 0 for WMA commonly associ-ated with VPT birth.
Family Social Risk
Five measures of family social risk were assessedfor all children during the first 2 years of life,including maternal minority ethnicity (non-NewZealand European), maternal age at child birth(< 21 years), maternal education (did not graduatefrom high school), single parent family, and familySES (professional or semiskilled, unskilled orunemployed). Each variable was coded as either1 = present or 0 = absent, and then summed to forma composite family social risk index (scaled 0–5). Asfew children were exposed to more than two ofthese risk factors, the index was scaled to representthe presence of 0, 1, or ≥ 2 family social risk fac-tors.
Statistical Analysis
Independent Samples t Test
To assess differences in IQ between the FT andVPT children at each age of assessment, indepen-dent samples t tests were conducted in SPSS 22.0(IBM Corp, 2013). Results were considered to besignificant at (p < .05).
Growth Curve Modeling
A linear mixed effects model analysis, alsoknown as multilevel growth curve modeling, wasused to examine children’s general cognitive func-tioning over time. This analysis was conducted inStata 12 (StataCorp, 2011), with model parametersestimated by restricted maximum likelihood. A ser-ies of growth curve models were fitted to the datain which trajectories of IQ scores over time weremodeled as a linear function of age, group status,
and other factors, with allowance for individual-specific variability in the intercept and slope of thetrajectories over time. The initial model fitted to thedata was of the form:
yit ¼ b0 þ b1AGEit þ b2GROUPi þ e0i þ e1iAGEit þ uit
where yit was the IQ score for the ith individual atage t, AGEit was the individual’s age in years (cor-rected for gestation) at time t scaled relative to abaseline age of 4 years, GROUPi was a dummy (0or 1) variable representing the individual’s groupstatus (FT = 1; VPT = 0), e0i and e1i were individ-ual-specific random effects representing individual-specific variations in the intercept and slope of thegrowth curve, respectively, and uit was a randomdisturbance term. In this model, the parameter b0represents the intercept of the average growth tra-jectory for the total sample, b1 represents the aver-age change in IQ scores in the total sample for eachadditional year of age, and b2 can be interpreted asthe impact of FT birth status on average cognitiveability at a given age. Thus, in effect this modelpartitions variability in individual IQ scores overtime into three components: a fixed effects compo-nent (b0 + b1AGEit + b2GROUPi) representing theaverage IQ trajectory over time in each group, arandom effects component (e0i + e1iAGEit) repre-senting individual-specific deviations around theaverage intercept and slope of the growth curveover time, and a component due to random error(uit). The random effects (e0i, e1i, uit) were eachassumed to be normally distributed with mean zeroand unknown variance, with these variance param-eters to be estimated as part of fitting the model.The individual-specific random effects (e0i, e1i) werepermitted to be correlated with each other but wereassumed to be independent of the other terms inthe model.
This model was subsequently extended toinclude main effects of sex, family social risk, mildWMA, and moderate to severe WMA, to assesstheir impact on average cognitive performance at agiven age. Interactions between all model variableswere also assessed. Specifically, differences in slopewere investigated through testing interactions ofage with birth group, sex, family social risk, andWMA, whereas the differential influence of theseadditional predictors for FT and VPT children wereassessed through interactions with birth group.Interactions between sex and family social risk, sex,and WMA, as well as family social risk and WMAwere also tested. The significance level was set atp < .05, and only significant interactions were
288 Mangin, Horwood, and Woodward

retained in the final model. A restricted log-likeli-hood test of goodness of fit was used to assess theimproved fit of each growth curve model that wasfitted to the data. All available observations wereutilized in the analysis.
Results
Characteristics of the Sample
Table 1 shows the neonatal and family character-istics of the two birth groups. The VPT group wasborn of lower gestational age (p < .001) and birthweight (p < .001), with the majority (75%) present-ing with WMA at term equivalent age, graded aseither mild (57.8%), moderate (14.7%), or severe(2.8%). VPT children were also characterized by ele-vated family social risk (p < .001). Comparable pro-portions of the VPT (29.9%) and FT (26.1%) groupwere exposed to a single family social risk factorduring the first 2 years of life, however 32.7% ofVPT children were exposed to two or more risk fac-tors, compared to only 12.6% of the FT children.The proportions of children exposed to each familysocial risk factor are shown in Table 1.
Cognitive Development in VPT and FT Children
Table 2 shows the performance of VPT and FTborn children on the standardized tests of generalintellectual functioning administered at ages 4, 6, 9,and 12 years. At each age assessment, VPT childrenobtained significantly lower IQ scores than FT chil-dren (p < .001), with a minimum average decre-ment of 9 IQ points. Cohen’s d measure of effect
size demonstrated moderately sized effects acrossall assessments, with the largest decrement at age6 years (d = .87). Group differences in IQ remainedsignificant at 4, 6, 9, and 12 years following adjust-ment for family social risk (p < .001).
Trajectories of Cognitive Development
Figure 1 displays the IQ score trajectories forVPT and FT born children. As shown, although theperformance of some VPT children was comparableto that of their FT born peers, the cognitive trajecto-ries of VPT children were generally characterizedby lower average performance and greater intra-and interindividual variability. Additionally,despite this variability, the average overall patternfor both groups appeared relatively stable, with nooverwhelming trends of improvement or decline inIQ between the ages of 4 and 12 years.
To further examine patterns of cognitive func-tioning over time, a linear mixed effects growthcurve model analysis was conducted. This analysiswas undertaken in three steps and the estimatedregression coefficients and standard errors (Est[SE]) for the fixed and random effects of each of thethree fitted models are presented in Table 3. Abaseline model (Model 1) was fitted with age andbirth group as the only predictors. The fixed effectscomponent of Model 1 shows the estimated regres-sion coefficient for the intercept of the fitted modelas well as the estimated effect of birth group andage on cognitive performance. The random effectscomponent of the fitted model shows the estimatedstandard deviation of individual-specific variabilityin the intercept (e0i), the estimated standard
Table 2Average Performance on Standardized Intelligence Tests at Ages 4, 6, 9, and 12 Years for Full-Term and Very Preterm Birth Cohorts
IQ measureFull termM (SD)
Very pretermM (SD) t p d
WPPSI–R4 years (n = 107) (n = 105)
104.70 (13.45) 94.88 (15.58) �4.91 < .001 .676 years (n = 108) (n = 102)
106.92 (11.71) 94.66 (16.24) �6.25 < .001 .87WISC–IV9 years (n = 109) (n = 102)
104.04 (12.35) 95.03 (15.89) �4.58 < .001 .6312 years (n = 109) (n = 103)
106.65 (13.77) 96.59 (17.02) �4.71 < .001 .65
Note. WPPSI–R = Wechsler Preschool and Primary Scale of Intelligence–Revised; WISC–IV = Wechsler Intelligence Scale for Children,4th ed.
Cognitive Development Trajectories in Childhood 289

deviation of individual-specific variability in slope(e1i), and the residual random error (uit). Restrictedlog-likelihood values were used as a measure ofimproved model fit to the data and are alsopresented in Table 3.
Model 1 shows a statistically significant effect ofgroup (p < .001) which suggests that at any givenage, VPT children scored an average of 10.83 IQpoints lower than FT children. The main effect ofage was not significant (p = .24) indicating the
Figure 1. Observed IQ trajectories for very preterm (< 32 weeks gestation) and full-term born children from age 4 to 12 years.
Table 3Maximum Likelihood Estimates (SE) From Mixed Effects Models Fitted to Children’s Cognitive Growth Data (IQ Score Trajectories)
Parameters and growth predictorsModel 1 Model 2 Model 3Est (SE) Est (SE) Est (SE)
Fixed effectsIntercept 94.18 (1.30)** 101.10 (2.74)** 100.71 (2.75)**Group (full term) 10.83 (1.79)** 4.19 (2.71) 4.20 (2.71)Female sex 2.62 (1.67) 3.46 (1.72)*Social risk �2.80 (1.10)* �2.81 (1.10)*Mild WMA �4.09 (2.87) �4.09 (2.87)Moderate/Severe WMA �18.06 (3.70)** �18.05 (3.70)**
Rate of changeAge 0.11 (0.10) 0.12 (0.10) 0.32 (0.13)*Age 9 Female Sex �0.41 (0.19)*
Random effectsSD (e0i) 12.60 (0.70) 11.47 (0.66) 11.47 (0.66)SD (e1i) 0.94 (0.11) 0.94 (0.11) 0.91 (0.11)Corr (e0i, e1i) �0.03 (0.11) �0.00 (0.12) �0.00 (0.12)SD (uit) 6.18 (0.21) 6.19 (0.21) 6.19 (0.21)Restricted log-likelihood �3,113.36 �3,077.86 �3,075.58
Note. WMA = white matter abnormalities. *p < .05. **p < .001.
290 Mangin, Horwood, and Woodward

average trajectory of the pooled sample of VPT andFT children was stable over time. Model 1 also indi-cated evidence of individual-specific variation inthe data, showing an estimated random-interceptstandard deviation of 12.60 IQ points and an esti-mated random-slope standard deviation of 0.94 IQpoints per year. A log-likelihood ratio chi-squaretest was used to assess the improvement in modelfit using a mixed effects model including these indi-vidual-specific components of variation comparedto a simple linear fixed effects growth curve model.This result was highly significant, v2(3) = 698.61,p < .001, demonstrating the presence of substantialrandom variability and supporting the use of themixed effects model.
To investigate the influence of additional predic-tors of cognitive performance for VPT and FT chil-dren, measures of child sex, family social risk, andneonatal WMA were introduced into the analysis.The fitted model parameters are reported in Model2. As shown in Table 3, the restricted log-likelihoodvalue for Model 2 was reduced from �3,113.36 inModel 1 to �3,077.86, suggesting that the additionof these factors improved model fit. No substantialinfluence on estimated standard deviations ofrandom-intercept or random-slope was observed.
Moderate to severe WMA were associated withsignificantly lower IQ scores (p < .001). Model 2demonstrated that at any given age, VPT childrenwith moderate to severe WMA scored on average18.06 points below VPT children with no WMA atterm equivalent age. Mild WMA were also associatedwith low IQ scores, with affected VPT children scor-ing on average 4.09 points below their VPT peerswith no WMA, at any given age. This effect, how-ever, failed to reach statistical significance (p = .15).
A significant effect of family social risk (p < .05)was also found. This suggested that, across bothbirth groups, the IQ score of any given childdecreased by an average of 2.8 points in the pres-ence of one family social risk factor and decreasedby another 2.8 points among those with two ormore family social risk factors. A marginally signifi-cant effect of birth group remained (p = .12), imply-ing residual effects of VPT birth, with VPT childrenat any given age scoring an average of 4.19 IQpoints below their FT peers, over and above decre-ments in IQ attributable to the presence of WMA.
The final model (Model 3) was extended to test forinteractions between model variables. The effects offamily social risk and WMA remained similar toModel 2, with moderate to severe WMA having thegreatest negative impact on cognitive performance. Asignificant fixed effect of sex (p < .05) was also found.
All possible interactions between age, birth group, sex,family social risk, and WMA were tested, however,the only significant interaction found was thatbetween age and sex (p < .05). These results must beinterpreted with the acknowledgment that upon fit-ting the models to the data, cognitive performance atage 4 years represented the origin, as this was the firstdata point. Thus, the Age 9 Sex interaction impliesthat across both groups, female children scored onaverage 3.46 IQ points higher than male children atthe origin (age 4 years). This sex difference, however,was not constant across childhood as a significanteffect of age suggests a positive estimated slope formales over time (b = .32, SE = .13, p < .05). Specifi-cally, this effect suggests that across birth groups,males on average showed a .32-point increase in IQwith each additional year, from 4 to 12 years. The esti-mated slope for females, although slightly negative,was small and nonsignificant (b = �.09, SE = .14,p = .50). Figure 2 illustrates the predicted mean per-formance for male and female children, in each birthgroup. Although the trajectories for VPT children areshown to be lower than that of FT children, as no evi-dence of an Age 9 Birth Group interaction wasfound, their slopes are identical.
To further illustrate the implications of the finalfitted model and to graphically demonstrate theinfluence of family social risk and WMA on VPTand FT children’s cognitive development over time,a series of predicted mean growth curve compar-isons were calculated from the estimated coeffi-cients presented in Model 3. The results of thisanalysis are summarized in Figures 3 and 4.
Influence of Family Social Risk on CognitiveDevelopment
Figure 3 illustrates predicted mean growth trajec-tories for VPT and FT children exposed to varyingdegrees of family social risk. Across both birthgroups, family social risk is shown to have a cumu-lative negative effect on children’s cognitive perfor-mance, with children born into families with two ormore identified family social risk factors found tohave a predicted mean cognitive trajectory that was5.6 IQ points lower than children born into familiesnot characterized by any such risk factors.Although family social risk is shown to negativelyimpact the cognitive trajectories of both VPT andFT children, it is clear that the combination of VPTbirth and high family social risk is particularlydetrimental, with VPT children exposed to two ormore family social risk factors having the lowesttrajectory.
Cognitive Development Trajectories in Childhood 291

Influence of WMA on Cognitive Development
Figure 4 illustrates the predicted mean growthtrajectories for VPT children with varying degreesof neonatal neurological risk relative to FT chil-dren. Neonatal WMA were associated with poorercognitive performance across childhood, with amarked decrement in cognitive performance forthose with moderate to severe WMA. The averagegrowth curve trajectory for VPT children withmild WMA was 4 IQ points lower than VPT chil-dren without WMA and 8 IQ points below that ofFT born children. The average growth curve trajec-tory for VPT children with moderate to severeWMA, at term, is shown to be 18 IQ points belowVPT children without WMA and 22 IQ pointsbelow FT born children. Although the model pre-dicts a higher trajectory for VPT children without
WMA, a 4.2-IQ point decrement remains evidentwhen compared to the FT trajectory, signifyingpotential residual effects of preterm birth on cogni-tive outcome.
Contributions of Biological and Social Risk on CognitiveDevelopment in Children Born VPT
To illustrate the joint effects of WMA and familysocial risk on the cognitive development of VPTborn children, the final model was refitted withdichotomous indicators of cerebral WMA risk (mildto severe WMA = 1, no WMA = 0) and familysocial risk (≥ 2 family social risk factors = 1, ≤ 1family social risk factor = 0). The model was fittedto the data from the full sample; however, predic-tions were based only on the VPT series. Predictedtrajectories were generated for four different
Figure 2. Predicted mean growth trajectories for very preterm and full-term born children by sex.
Figure 3. Predicted mean growth trajectories for very preterm and full-term born children by level of family social risk.
292 Mangin, Horwood, and Woodward

combinations of risk, including low risk (no WMA,low family social risk factor), medium risk (WMA-only), medium risk (high family social risk-only),and high risk (WMA + high family social risk).
Predicted mean growth trajectories in accordancewith the refitted model are displayed in Figure 5and illustrate a number of important findings. First,VPT children with no WMA and low family socialrisk had the highest average cognitive trajectory.Second, high family social risk in the absence ofWMA lowered the average cognitive growth curvetrajectory for VPT children by 4.7 IQ points in theabsence of WMA, illustrating the cognitive risksassociated with raising a VPT born child in a high-risk family environment. Third, WMA in theabsence of high family social risk further loweredthe cognitive performance of VPT children, with theaverage cognitive trajectory of VPT children withWMA on term MRI shown to be 7.4 IQ pointslower than that of low-risk VPT children. However,when these risk factors were both present, theadverse effects on cognitive function wereincreased, with the average cognitive trajectory ofhigh-risk (WMA + high family social risk) VPTborn children predicted to be 12 IQ points belowthat of low-risk (no WMA, low family social risk)VPT children. Thus, combining biological and fam-ily social risk served to increase the magnitude ofthe effect substantially, in an additive manner.
Discussion
This study extends on previous research concernedwith the long-term cognitive development of chil-dren born VPT. Of the few longitudinal studies thatextend beyond early childhood, methodological dif-ferences, and limitations made it unclear whether
VPT children’s general cognitive abilities improved,deteriorated, or remained stable over time. Thisprospective longitudinal study addressed thisimportant question by growth curve modeling toexamine trajectories of cognitive development inVPT born children (≤ 32 weeks gestation) and typi-cally developing FT children over an extended per-iod of time from age 4 to 12 years. Strengths of thestudy included the large sample size, repeated cog-nitive assessment across childhood, the consistencyof cognitive measures used, and the examination ofboth neurological and social risk processes. Themain study findings and implications are discussedbelow.
Cognitive Development in VPT and FT Born Children
Consistent with previous research, children bornVPT scored below FT children on standardizedtests of general intellectual functioning (Anderson& Doyle, 2008; Bhutta et al., 2002; Kerr-Wilsonet al., 2012; Marlow, 2004; Vohr, 2010), with theVPT cohort scoring 9–12 points below the FT cohortacross all age assessments. This range of mean dif-ferences is very similar to the figure reported inBhutta et al.’s (2002) meta-analysis of 15 studies ofschool-aged VPT and FT children, which found anoverall weighted mean IQ difference of 10.9 points.It is also consistent with Kerr-Wilson et al.’s (2012)more recent meta-analysis of 27 studies of school-age children, which reported an overall IQ differ-ence between FT and preterm children of 11.94points.
Although as a group the VPT children in thestudy appeared to perform within the lower end ofthe normal cognitive range, the consistent IQ differ-ences found between VPT and FT children raise
70
75
80
85
90
95
100
105
110
4 5 6 7 8 9 10 11 12
IQ S
core
Age in Years
Full TermVPT No WMAVPT Mild WMAVPT Mod/Sev WMA
Figure 4. Predicted mean growth trajectories for very preterm(VPT) and full-term children by degrees of white matter abnor-malities (WMA).
70
75
80
85
90
95
100
105
110
4 5 6 7 8 9 10 11 12
IQ S
core
Age in Years
Low RiskMedium Risk (Social Risk)Medium Risk (WMA)High Risk
Figure 5. Predicted mean growth trajectories for very pretermchildren by combinations of biological (white matter abnormali-ties [WMA]) and environmental (family social risk) risks.
Cognitive Development Trajectories in Childhood 293

considerable concerns for the long-term cognitiveand academic consequences of VPT birth. Addition-ally, as studies have tended to focus on meangroup differences, little acknowledgment has beengiven to the potential for individual variability, animportant consideration given the heterogeneousnature of development in both VPT and FT popula-tions (St�alnacke et al., 2015). In this study, theexamination of observed trajectories of estimatedIQ scores revealed reasonable levels of inter- andintra-individual variability, which were more pro-nounced in the VPT group. Also apparent whenexamining the observed IQ trajectories was that,while some VPT children were performing verypoorly, many were functioning at levels comparableto FT children. Additionally, although the overalltrend showed stability over time, VPT childrendemonstrated variability in their individual trajecto-ries, with some children showing improvementsand others showing declines between ages 4 and12 years. The importance of acknowledging indi-vidual patterns of cognitive development wasrecently highlighted by St�alnacke et al. (2015) whofound that, although in general preterm childrenshowed stability in cognitive functioning from 5.5to 18 years, groups of preterm individuals alsoshowed changes in function over this time. Find-ings of this nature highlight the importance of tak-ing into account change at both the individual andgroup level and understanding factors that influ-ence a particular child’s developmental path.
Informative longitudinal research and analysis isessential in understanding the true impact of pre-term birth on long-term cognitive outcomes anddetermining whether VPT children are most likelyto experience a developmental lag or a persistentpattern of cognitive impairment. The linear mixedeffects growth curve analysis carried out in thisstudy estimated the rates of change at the individ-ual and group level and indicated little evidence forchange in cognitive functioning over time, with theaverage cognitive trajectory for both FT and VPTchildren being stable from 4 to 12 years.
Stability of cognitive impairments in VPT chil-dren has been reported previously (Allin et al.,2008; Saigal et al., 2000), however several prospec-tive longitudinal studies have also found evidenceof change in cognitive functioning over time (Bot-ting et al., 1998; Isaacs et al., 2004; Koller et al.,1997; Luu, Vohr, Allan, Schneider, & Ment, 2011;Luu et al., 2009; Ment et al., 2003; O’Brien et al.,2004). For example, findings from Ment et al. (2003)suggested that VPT children with no neonatal neu-rological injury may recover from early cognitive
delays with age. This study conducted multipleassessments of a large VLBW cohort across child-hood; however, as there was no FT born compar-ison group and the main focus was receptivevocabulary, the nature of changes in general cogni-tive functioning in comparison to their FT peerswas unclear.
There has also been suggestion that cognitiveproblems for VPT children may increase over time(Botting et al., 1998; Isaacs et al., 2004; Koller et al.,1997; O’Brien et al., 2004). Botting et al.’s (1998)study of VLBW children found significant declinesin IQ scores from age 6 to 12 years; however, theirFT comparison group showed a comparable IQdecline, resulting in a similar discrepancy betweenthe two groups at each time point. O’Brien et al.(2004) later reported significant declines in IQscores alongside increased requirements for reme-dial educational support in VPT children(< 33 weeks gestation) from 8 to 15 years. More-over, Isaacs et al. (2004) found that such declineswere evident in VPT children who were neurologi-cally normal at age 8 years. Unlike the currentstudy, O’Brien et al. (2004) and Isaacs et al. (2004)both lacked a FT born comparison group. Addition-ally, as these studies only assessed children at twotime points, the full nature of changes in cognitiveproblems across childhood was unclear. Despitethese limitations and although the current studyfound no substantial evidence of cognitive declinein VPT born children from 4 to 12 years, further fol-low-up into adolescence is needed to fully evaluateVPT children’s long-term cognitive trajectories.
The stable and low trajectory demonstrated byVPT children within the current study is troublingand implies that it is not realistic to assume that aVPT child will recover from early cognitive delayswith age. These children need to be continuallymonitored across childhood, with their birth statusacknowledged throughout the school-age years.Early cognitive interventions should also be consid-ered as it would appear unlikely that many of thesechildren will reach a level of cognitive functioningthat is comparable to FT born children, withoutsome level of assistance. The earlier these interven-tions are implemented, the more likely that an opti-mal cognitive outcome will be reached.
Influence of Sex on Cognitive Development
The growth curve analysis also revealed smalldifferences in the cognitive trajectories of male andfemale children. Findings showed that at age 4,females obtained slightly higher IQ scores than
294 Mangin, Horwood, and Woodward

males, but with age this gap narrowed, with malesshowing comparable performance to females by age12. Given that a difference in slope was not foundbetween the two birth groups, as indicated by anonsignificant Age 9 Group interaction, this initialdecrement and then increase in general cognitivefunctioning for male children is difficult to interpretand cannot be solely attributed to either birthgroup.
Influence of Family Social Risk on CognitiveDevelopment
As expected, high family social risk was a signifi-cant predictor of poorer cognitive performance forboth VPT and FT born children. Numerous studieshave documented the association between familysocial risk factors such socioeconomic adversity,poverty, maternal academic underachievement, andpoor cognitive development in children raised inthese contexts (Bradley & Corwyn, 2002; Duncanet al., 1994; Hackman & Farah, 2009; Noble et al.,2005; Wong & Edwards, 2013). This study foundthat high family social risk in the first 2 years of lifehad an adverse impact on the cognitive outcomesof VPT and FT children, highlighting the impor-tance of the early home environment for optimalcognitive development. The increased prevalence ofVPT birth among lower SES families is thus prob-lematic as social risk appears to compound theearly biological risk associated with preterm birth(Blumenshine et al., 2010; Kramer et al., 2000;Wong & Edwards, 2013).
Influence of WMA on Cognitive Development
The majority of VPT born children in this studyhad WMA, with 58% subject to mild abnormalitiesand 17% with moderate to severe abnormalities onterm MRI. WMA were a strong predictor of cogni-tive impairment across childhood, with the severityof abnormalities influencing the magnitude of long-term effects. Although the nature of the associationbetween WMA and cognitive impairment is com-plex, the importance of cerebral white matter con-nectivity for adaptive cognitive development isincreasingly recognized. WMA have been shown toaffect between 50% and 70% of VPT infants, andhave been found to be one of the strongest predic-tors of cognitive and motor impairments (Inder,Anderson, et al., 2003; Inder, Wells, et al., 2003;Iwata et al., 2012; Woodward et al., 2006, 2009,2012). This study provides further support for thepotential utility of neonatal MRI in helping to
identify children who do and do not need monitor-ing and intervention support.
Contributions of Biological and Social Risk on theCognitive Development in Children Born VPT
Given the apparent influence of WMA and fam-ily social risk on cognitive development duringchildhood, along with the likelihood that such riskfactors will co-occur, this study sought to illustratetheir independent and joint effects on the cognitiveoutcomes of VPT children. Although the presenceof WMA at term and high family social risk wereshown to be independently associated with lowcognitive performance, these risk factors combinedadditively, such that the mean predicted cognitivetrajectory of VPT children with both risk factorswas 12 IQ points below that of VPT children whoexperienced neither risk factor.
Reducing the risks of brain abnormalities thatare associated with VPT birth is an obvious goal formodern neonatal medicine. However, in cases inwhich WMA are detected, this study suggests thatinterventions should also be focused at the familylevel. The family environment in which a child israised has long been acknowledged as having afundamental influence on children’s development(Bendersky & Lewis, 1994; Bradley & Corwyn,2002; Vohr, 2010; Weisglas-Kuperus, Baerts,Smrkovsky, & Sauer, 1993). This sentiment is partic-ularly applicable to VPT born children, as provid-ing additional supports to children and familiesaffected by socioeconomic adversity may help miti-gate some of the adverse neurodevelopmentalimpacts of VPT birth (Weisglas-Kuperus et al.,1993). A central concern is that high-social risk fam-ilies may lack the skills and/or resources necessaryto buffer the adverse effects of premature birth.Given their heightened vulnerability, these familiesrepresent an important target for additional educa-tion, support, and developmental interventionefforts across childhood.
Limitations and Future Research
Although this study had a number of method-ological strengths, some limitations must also beacknowledged. First, although the attrition ratesacross the length of the study were exceptionallylow, the sample size utilized was relatively smallfor the statistical analysis that was conducted. Upondividing children into different categories, the pro-portions of children representing each combinationof characteristics became relatively small,
Cognitive Development Trajectories in Childhood 295

potentially reducing the statistical power of theanalyses. Second, although consistency in the use ofcognitive measures was a strength of this study, inorder to administer age-appropriate assessmentstwo different versions of the Wechsler Intelligencescales were used to estimate IQ across childhood.This may have made it more difficult to detect sub-tle differences in the effects of preterm birth on IQ.Additionally, short forms were used to minimizetime and allow opportunities for other domainmeasures. Sattler and Dumont (2004) acknowledgedthat short forms can be used to obtain an estimateof a child’s intellectual status in instances when aprecise IQ is not required and that the attainedscore must be explicitly documented as an estimateof the child’s FSIQ. Short forms have also beenreported to amplify the effects of any administra-tive errors that may take place during the test whilegiving excessive weight to each of the subtestsincluded in the form (Sattler & Dumont, 2004).Nonetheless, short forms are a common researchpractice and the use of repeated measures over timegoes someway to mitigating the limitations of theuse of an abbreviated measure. The next stepwould be to consider these IQ trajectories alongsidemeasures of more specific cognitive skills andschool functioning.
Conclusions
Children born VPT were found to be at anincreased risk of cognitive impairment across child-hood and were consistently shown to performbelow FT comparison children on standardizedtests of general intellectual functioning. Overall,levels of cognitive function were stable from age 4to 12 years, with VPT children appearing unlikelyto recover from early delays with time. Although itis clear that on average VPT children performbelow their FT born peers, many of these childrenhad positive outcomes and were performing as wellas FT children. That being said, evidence to datewould suggest that one should not assume a VPTchild will grow out of their cognitive problems withtime or underestimate the assistance that many ofthese children will require during their schoolingcareers. The hazardous combination of neurologicaland family social risk emphasized the importanceof acknowledging not only a VPT infants medicalcondition but also their home environment. It isimperative to follow this study group further intoadolescence to fully evaluate patterns of cognitivedevelopment over time and continue to worktoward understanding whether VPT birth
commonly results in temporary cognitive delays ormore persistent impairments.
References
Aarnoudse-Moens, C. S., Weisglas-Kuperus, N., van Gou-doever, J. B., & Oosterlaan, J. (2009). Meta-analysis ofneurobehavioral outcomes in very preterm and/or verylow birth weight children. Pediatrics, 124, 717–728.doi:10.1542/peds.2008-2816
Allin, M., Walshe, M., Fern, A., Nosarti, C., Cuddy, M.,Rifkin, . . . Wyatt, J. (2008). Cognitive maturation inpreterm and term born adolescents. Journal of Neurol-ogy, Neurosurgery, and Psychiatry, 79, 381–386. doi:jnnp.2006.110858
Anderson, P. J., & Doyle, L. W. (2008). Cognitive andeducational deficits in children born extremely preterm.Seminars in Perinatology, 32, 51–58. doi:10.1053/j.semperi.2007.12.009
Aylward, G. P. (2002). Cognitive and neuropsychologicaloutcomes: More than IQ scores. Mental Retardation andDevelopmental Disabilities Research Reviews, 8, 234–240.doi: 10.1002/mrdd.10043
Aylward, G. P. (2003). Cognitive function in preterminfants: No simple answers. Journal of the American Med-ical Association, 289, 752–753. doi:10.1001/jama.289.6.752
Aylward, G. P. (2010). Methodological considerations inneurodevelopmental outcome studies of infants bornprematurely. In C. Nosarti, R. M. Murray, & M. Hack(Eds.), Neurodevelopmental outcomes of preterm birth: Fromchildhood to adult life (pp. 164–175). Cambridge, UK:Cambridge University Press.
Bendersky, M., & Lewis, M. (1994). Environmental risk,biological risk, and developmental outcome. Developmen-tal Psychology, 30, 484. doi:10.1037/0012-1649.30.4.484
Bhutta, A. T., Cleves, M. A., Casey, P. H., Cradock, M.M., & Anand, K. (2002). Cognitive and behavioral out-comes of school-aged children who were born preterm:A meta-analysis. JAMA, 288, 728–737. doi:10.1001/jama.288.6.728
Blumenshine, P., Egerter, S., Barclay, C. J., Cubbin, C., &Braveman, P. A. (2010). Socioeconomic disparities inadverse birth outcomes: A systematic review. AmericanJournal of Preventive Medicine, 39, 263–272. doi: 10.1016/j.amepre.2010.05.012
Botting, N., Powls, A., Cooke, R. W., & Marlow, N.(1998). Cognitive and educational outcome of very-low-birthweight children in early adolescence. DevelopmentalMedicine & Child Neurology, 40, 652–660. doi:10.1111/j.1469-8749.1998.tb12324.x
Bradley, R. H., & Corwyn, R. F. (2002). Socioeconomicstatus and child development. Annual Review of Psychol-ogy, 53, 371–399. doi:10.1146/annurev.psych.53.100901.135233
Duncan, G. J., Brooks-Gunn, J., & Klebanov, P. K. (1994).Economic deprivation and early childhood
296 Mangin, Horwood, and Woodward

development. Child Development, 65, 296–318.doi:10.1111/j.1467-8624.1994.tb00752.x
Dunn, L. M., & Dunn, L. M. (1981). PPVT: Peabody PictureVocabulary Test-Revised Form. Circle Pines, MN: Ameri-can Guidance Service.
Fanaroff, A. A., Stoll, B. J., Wright, L. L., Carlo, W. A.,Ehrenkranz, R. A., Stark, A. R., . . . Laptook, A. R.(2007). Trends in neonatal morbidity and mortality forvery low birthweight infants. American Journal of Obstet-rics and Gynecology, 196, 147. e1–147. e8. doi:10.1016/j.ajog.2006.09.014
Flynn, J. R. (1999). Searching for justice: The discovery ofIQ gains over time. American Psychologist, 54, 5. doi:10.1037/0003-066X.54.1.5
Hack, M., Flannery, D. J., Schluchter, M., Cartar, L., Bor-awski, E., & Klein, N. (2002). Outcomes in young adult-hood for very-low-birth-weight infants. New EnglandJournal of Medicine, 346, 149–157. doi:10.1056/NEJ-Moa010856
Hackman, D. A., & Farah, M. J. (2009). Socioeconomicstatus and the developing brain. Trends in CognitiveSciences, 13, 65–73. doi:10.1016/j.tics.2008.11.003
IBM Corp. (2013). IBM SPSS Statistics for Windows,Version 22.0. Armonk, NY: IMB Corp.
Inder, T. E., Anderson, N. J., Spencer, C., Wells, S., &Volpe, J. J. (2003a). White matter injury in the prema-ture infant: A comparison between serial cranial sono-graphic and MR findings at term. AJNR. AmericanJournal of Neuroradiology, 24, 805–809.
Inder, T. E., Wells, S. J., Mogridge, N. B., Spencer, C., &Volpe, J. J. (2003b). Defining the nature of the cerebralabnormalities in the premature infant: A qualitativemagnetic resonance imaging study. The Journal of Pedi-atrics, 143, 171–179. doi:10.1067/S0022-3476(03)00357-3
Isaacs, E. B., Edmonds, C. J., Chong, W. K., Lucas, A.,Morley, R., & Gadian, D. G. (2004). Brain morphometryand IQ measurements in preterm children. Brain: AJournal of Neurology, 127(Pt. 12), 2595–2607.doi:10.1093/brain/awh300
Iwata, S., Nakamura, T., Hizume, E., Kihara, H., Taka-shima, S., Matsuishi, T., & Iwata, O. (2012). Qualitativebrain MRI at term and cognitive outcomes at 9 yearsafter very preterm birth. Pediatrics, 129, e1138–e1147.doi:10.1542/peds.2011-1735
Johnson, S. (2007). Cognitive and behavioural outcomesfollowing very preterm birth. Seminars in Fetal andNeonatal Medicine, 12, 363–373. doi:10.1016/j.siny.2007.05.004
Kerr-Wilson, C. O., Mackay, D. F., Smith, G. C., & Pell, J.P. (2012). Meta-analysis of the association between pre-term delivery and intelligence. Journal of Public Health,34, 209–216. doi:10.1093/pubmed/fdr024
Koller, H., Lawson, K., Rose, S. A., Wallace, I., & McCar-ton, C. (1997). Patterns of cognitive development invery low birth weight children during the first six yearsof life. Pediatrics, 99, 383–389. doi:10.1542/peds.99.3.383
Kramer, M. S., Goulet, L., Lydon, J., S�eguin, L., McNa-mara, H., Dassa, C., & Genest, J. (2001). Socio-economic
disparities in preterm birth: Causal pathways andmechanisms. Paediatric and Perinatal Epidemiology, 15,104–123. doi:10.1046/j.1365-3016.2001.00012.x
Kramer, M. S., Seguin, L., Lydon, J., & Goulet, L. (2000).Socio-economic disparities in pregnancy outcome: Whydo the poor fare so poorly? Paediatric and PerinatalEpidemiology, 14, 194–210. doi:10.1046/j.1365-3016.2000.00266.x
Litt, J. S., Gerry Taylor, H., Margevicius, S., Schluchter,M., Andreias, L., & Hack, M. (2012). Academic achieve-ment of adolescents born with extremely low birthweight. Acta Paediatrica, 101, 1240–1245. doi:10.1111/j.1651-2227.2012.02790.x
LoBello, S. G. (1991). A short form of the Wechsler pre-school and primary scale of intelligence–revised. Journalof School Psychology, 29, 229–236. doi:10.1016/0022-4405-(91)90004-B
Luu, T. M., Vohr, B. R., Allan, W., Schneider, K. C., &Ment, L. R. (2011). Evidence for catch-up in cognitionand receptive vocabulary among adolescents born verypreterm. Pediatrics, 128, 313–322. doi:10.1542/peds.2010-2655
Luu, T. M., Vohr, B. R., Schneider, K. C., Katz, K. H.,Tucker, R., Allan, W. C., & Ment, L. R. (2009). Trajecto-ries of receptive language development from 3 to12 years of age for very preterm children. Pediatrics,124, 333–341. doi:10.1542/peds.2008-2587
Marlow, N. (2004). Neurocognitive outcome after verypreterm birth. Archives of Disease in Childhood-Fetal andNeonatal Edition, 89, F224–F228. doi:10.1136/adc.2002.019752
Ment, L. R., Vohr, B., Allan, W., Katz, K. H., Schneider,K. C., Westerveld, M., & Makuch, R. W. (2003). Changein cognitive function over time in very low-birth-weight infants. JAMA, 289, 705–711. doi:10.1001/jama.289.6.705.
Noble, K. G., Norman, M. F., & Farah, M. J. (2005). Neu-rocognitive correlates of socioeconomic status inkindergarten children. Developmental Science, 8, 74–87.doi:10.1111/j.1467-7687.2005.00394.x
O’Brien, F., Roth, S., Stewart, A., Rifkin, L., Rushe, T., &Wyatt, J. (2004). The neurodevelopmental progress ofinfants less than 33 weeks into adolescence. Archives ofDisease in Childhood, 89, 207–211. doi:10.1136/adc.2002.006676
Pritchard, V. E., Bora, S., Austin, N. C., Levin, K. J., &Woodward, L. J. (2014). Identifying very preterm chil-dren at educational risk using a school readiness frame-work. Pediatrics, 134, e825–e832. doi:10.1542/peds.2013-3865
Saigal, S., Hoult, L. A., Streiner, D. L., Stoskopf, B. L., &Rosenbaum, P. L. (2000). School difficulties at adoles-cence in a regional cohort of children who were extre-mely low birth weight. Pediatrics, 105, 325–331. doi:10.1542/peds.105.2.325
Sattler, J., & Dumont, R. (2004). Assessment of children:WISC–IV and WPPSI–III supplement. San Diego, CA: Jer-ome M. Sattler.
Cognitive Development Trajectories in Childhood 297

St�alnacke, J., Lundequist, A., B€ohm, B., Forssberg, H., &Smedler, A. (2015). Individual cognitive patterns anddevelopmental trajectories after preterm birth. ChildNeuropsychology, 21, 648–667. doi:10.1080/09297049.2014.958071
StataCorp. (2011). Stata Statistical Software: Release 12.College Station, TX: StataCorp LP.
Statistics New Zealand. (2001). Census: Regional summary.Retrieved from http://www.stats.govt.nz/Census/2001-census-data/2001-census-regional-summary.aspx
Stoll, B. J., Hansen, N. I., Bell, E. F., Shankaran, S., Lap-took, A. R., Walsh, M. C., . . . Eunice Kennedy ShriverNational Institute of Child Health and Human Devel-opment Neonatal Research Network. (2010). Neonataloutcomes of extremely preterm infants from theNICHD neonatal research network. Pediatrics, 126, 443–456. doi:10.1542/peds.2009-2959
Taylor, H. (2010). Academic performance and learningdisabilities. In C. Nosarti, R. M. Murray & M. Hack(Eds.), Neurodevelopmental outcomes of preterm birth: Fromchildhood to adult life (pp. 209–223). Cambridge, UK:Cambridge University Press.
Vohr, B. R. (2010). Cognitive and functional outcomes ofchildren born preterm. In C. Nosarti, R. M. Murray, &M. Hack (Eds.), Neurodevelopmental outcomes of pretermbirth: From childhood to adult life (pp. 141–163).Cambridge UK: Cambridge University Press.
Vohr, B. R., Wright, L. L., Dusick, A. M., Mele, L., Verter,J., Steichen, J. J., & Kaplan, M. D. (2000). Neurodevel-opmental and functional outcomes of extremely lowbirth weight infants in the National Institute of ChildHealth and Human Development Neonatal ResearchNetwork, 1993–1994. Pediatrics, 105, 1216–1226. doi:10.1542/peds.105.6.1216
Wechsler, D. (2003). Wechsler intelligence scale for children–fourth edition (WISC–IV). San Antonio, TX: The Psycho-logical Corporation.
Weisglas-Kuperus, N., Baerts, W., Smrkovsky, M., &Sauer, P. J. (1993). Effects of biological and social
factors on the cognitive development of very low birthweight children. Pediatrics, 92, 658–665.
Wong, H. S., & Edwards, P. (2013). Nature or nurture: Asystematic review of the effect of socio-economic statuson the developmental and cognitive outcomes of chil-dren born preterm. Maternal and Child Health Journal,17, 1689–1700. doi:10.1007/s10995-012-1183-8
Woodward, L. J., Anderson, P. J., Austin, N. C., Howard,K., & Inder, T. E. (2006). Neonatal MRI to predict neu-rodevelopmental outcomes in preterm infants. NewEngland Journal of Medicine, 355, 685–694. doi:10.1056/NEJMoa053792
Woodward, L. J., Clark, C. A., Bora, S., & Inder, T. E.(2012). Neonatal white matter abnormalities an impor-tant predictor of neurocognitive outcome for verypreterm children. PLoS ONE, 7, e51879. doi:10.1371/journal.pone.0051879
Woodward, L. J., Moor, S., Hood, K. M., Champion, P.R., Foster-Cohen, S., Inder, T. E., & Austin, N. C.(2009). Very preterm children show impairments acrossmultiple neurodevelopmental domains by age 4 years.Archives of Disease in Childhood-Fetal and Neonatal Edi-tion, 94, F339–F344. doi:10.1136/adc.2008.146282
Supporting Information
Additional supporting information may be found inthe online version of this article at the publisher’swebsite:
Table S1. Summary of Longitudinal Analyses ofthe Cognitive Development of Children Born VeryPreterm
Table S2. Maximum Likelihood Estimates (SE)From Mixed Effects Models Fitted to Children’sCognitive Growth Data (IQ Score Trajectories): Sup-plementary Analysis Including Nonlinear Effect ofAge
298 Mangin, Horwood, and Woodward