Cogeneration and Energy Savings in a Food Processing ...
71
Cogeneration and Energy Savings in a Food Processing Industry: Case of Juaben Oils Mills (Ghana)
Transcript of Cogeneration and Energy Savings in a Food Processing ...

Cogeneration and Energy Savings in a Food Processing Industry: Case of Juaben Oils Mills (Ghana)

Cogeneration and Energy Savings in a Food Processing Industry: Case of Juaben Oils Mills (Ghana)
Thesis written by Félicien D. BADOU/ 37th Promotion 2iE - June 2008
ii
• To the Omnipresent, the Almighty, the Omniscient and
the Merciful GOD, for His divine assistance,
• To my late father, Marcel Dossa BADOU whose
maxims are still fresh in my mind and make of me a
man,
• To my beloved mother Micheline TOGNON for her so
wonderful love, her affection, tenderness and daily
prayers,
• To my uncle and adoptive father Louis BADOU and his
Wife for the warmth of which they surrounded my
teenage,
• To my brothers and to my youngest sister Christèle
BADOU for their cares and moral supports,
• To the current and to the future promoters of
Cogeneration for a best future of the Humanity Cradle,
I dedicate this final project.
DEDICATION

Cogeneration and Energy Savings in a Food Processing Industry: Case of Juaben Oils Mills (Ghana)
Thesis written by Félicien D. BADOU/ 37th Promotion 2iE - June 2008
iii
ACKNOWLEDMENTS
I first of all would like to express my heartfelt thanksgiving to GOD for the vital breath
and for the health He has bestowed on me during this assignment.
Carrying out this project has been possible thanks to the multiform contribution of many persons.
From the bottom of my heart, I expressed to them my gratitude through the following lines.
To my supervisors: Professor Yezouma COULIBALY (2iE) and Mr. Emmanuel W. RAMDE
(MED, KNUST) who entrusted to me this important work on Cogeneration. Despite their busy
schedules, they found out time to guide me with insight. I am profoundly indebted to them for
their expert suggestions and for pushing me further, even when I thought I have given my best.
A big thank you to Madam Susan STRAND, whom with my supervisors allowed me to
complete my final project in Kumasi. It is an untold and invaluable present you offered to me to
edit my memoir in English.
My gratitude to Doctor ANSONG, Head of the Mechanical Engineering Department (KNUST)
for the precious advices he gave to me when I visited him and especially for the remarks done on
my work during the “Master of Science Seminar” we held.
I don’t have the appropriate words to express my thanks to Professor AWUAH, Dean of the
College of Engineering. Your motherly welcome when I met you in KNUST and your kindness
which opened to me the door of the laboratory of the Civil Engineering Department for my
experiments are ever fresh in my heart.
I am thankful to the Managing Director of Juaben Oils Mills who has accepted that I conduct my
project in his mills. Special thanks to Mr. Philip ADJEM, the Technical Manager of the mills.
Dear Sir your assistance and help have been very determinative to this project.
I also would like to thank these kind technicians who helped me for the experiments and
measurements I did during the project in particular the Sirs Opoku, Donkor, Botehway,
Kingsley, “Teacher”, Bansah, Anoutché, Yaw, Pius, Francis, Frimpong, Charles, Ben and
Maxwell.
Thanks to Mr. BAGRE who warmly supported me for my researches on Internet.
Infinitely thanks to the student family of 2iE, to my compatriots of 2iE and to the Beninese
medical student of the University of Ouagadougou, to my brothers of Rotonde, to my friends of
“Ardent Bush” and of “Eucharistic Movement of the Young”. Thanks for the brotherly love of
which you surrounded me at the time of my accident and of my surgical intervention.
I owe to all of you a priceless debt that only GOD can repay. May He bless you abundantly
Cogeneration and Energy Savings in a Food Processing Industry: Case of Juaben Oils Mills (Ghana)
Thesis written by Félicien D. BADOU/ 37th Promotion 2iE - June 2008
iv
ACRONYMS
Ag2SO4: Silver sulphate
ASEAN: Association of South East Asian Nations
BOD5: Biochemical Oxygen demand after 5 days.
CED: Civil Engineering Department (KNUST)
CHP: Combined Heat and Power
COD: Chemical Oxygen Demand
CPO: Crude Palm Oil
ECG: Electricity Company of Ghana
EDF: Electricité de France (in English Electricity of France)
EFB: Empty Fruit Bunch
FAO: Food and Agriculture Organization
Fe2(NH4)2SO4.6H2O: Di-ammonium iron II sulphate
FFB: Full Fruit Bunch/ Fresh Fruit Bunch
FHT : Francs Hors Tax (in English Exclusive of Tax)
GCV: Gross Calorific Value
GDP: Gross Domestic Product
GJ: Giga-Joule
H2SO4: Sulphuric acid
JOM : Juaben Oils Mill
K2Cr2O7: Potassium dichromate
KNUST: Kwame Nkrumah University of Science and Technology
LHV: Lower Heating Value
MED : Mechanical Engineering Department (KNUST)
MnSO4: Maganous sulphate
Mt : Metric tons
MW : Megawatt
Na2SO3: Sodium thiosulphate
PKO: Palm Kernel Oil
POME: Palm Oil Mill Effluent
SB: Shea Butter

Cogeneration and Energy Savings in a Food Processing Industry: Case of Juaben Oils Mills (Ghana)
Thesis written by Félicien D. BADOU/ 37th Promotion 2iE - June 2008
1
CONTENT
DEDICATION ................................................................................................................................ ii
ACKNOWLEDMENTS ................................................................................................................. iii
ACRONYMS ................................................................................................................................. iv
LIST OF FIGURES ......................................................................................................................... 3
LIST OF TABLES .......................................................................................................................... 4
INTRODUCTION ........................................................................................................................... 5
Chapter I: BACKGROUND ............................................................................................................ 6
I. PANORAMIC VIEW ON COGENERATION ....................................................................... 6
I.1. Definition .......................................................................................................................... 6
I.2. Types of cogeneration ....................................................................................................... 7
I.2.1. Cogeneration with engines ........................................................................................ 7
I.2.2. Cogeneration with gas turbines ................................................................................. 7
I.2.3. Cogeneration with steam turbines ............................................................................. 8
I.2.4. Cogeneration with the combined cycle ...................................................................... 9
I.2.5. Cogeneration with fuel cells ...................................................................................... 9
I.3. Impacts of Cogeneration ................................................................................................... 9
I.3.1. Energy impact ............................................................................................................ 9
I.3.2. Economical impact ................................................................................................... 10
I.3.3. Environmental impact .............................................................................................. 11
I.3.4. Impact on electricity distribution grid ..................................................................... 11
I.4. Practice of cogeneration throughout the world ............................................................... 11
II. AVAILABILITY OF BIOMASS FROM FOOD PROCESSING INDUSTRIES ............... 11
II.1. Residues from sugar mills ............................................................................................. 12
II.2. Residues from palm oil mills ......................................................................................... 12
II.3. Residues from shea butter mills ..................................................................................... 13
II.4. Utilisation of the residues from oil mills ....................................................................... 13
Chapter II: PROBLEM STATEMENT,OBJECTIVES AND METHODOLOGY ...................... 14
I. PROBLEM STATEMENT .................................................................................................... 14
II. OBJECTIVES OF THE STUDY ......................................................................................... 14
III. METHODOLOGY .............................................................................................................. 15
III.1. Preliminaries ................................................................................................................. 15
III.1.1. Bibliographical research ....................................................................................... 15
III.1.2. Elaboration of questionnaire ................................................................................ 16
Cogeneration and Energy Savings in a Food Processing Industry: Case of Juaben Oils Mills (Ghana)
Thesis written by Félicien D. BADOU/ 37th Promotion 2iE - June 2008
2
III.2. Collection of data ......................................................................................................... 16
III.2.1. Preliminary visit to the mills ................................................................................. 16
III.2.2. Collection of data itself ......................................................................................... 16
III.3.Treatment of data and analyse ....................................................................................... 16
Chapter III: LITERATURE REVIEW .......................................................................................... 17
Chapter IV: MATERIALS AND METHODS .............................................................................. 20
I. EXPERIMENTAL SITE ....................................................................................................... 20
II. THE BY-PRODUCTS STUDIED ........................................................................................ 21
III. METHODS AND EQUIPMENTS ...................................................................................... 22
I.V. DIFFICULTIES FACED ................................................................................................... 23
Chapter V: ACHIEVEMENTS AND DISCUSSION ................................................................... 24
I. PRESENT SITUATION OF JUABEN OILS MILLS (JOM) ............................................... 24
I.1. Extraction of the by-products .......................................................................................... 24
I.1.1. By-products from palm tree ..................................................................................... 24
I.1.2. By-products from shea tree ...................................................................................... 26
I.2. Mill capacity and production of by-products .................................................................. 26
I.3. Fulfilment of the mills energy requirements ................................................................... 29
II. ENERGY DIAGNOSTIC ..................................................................................................... 32
II.1. Energy required in JOM ................................................................................................ 32
II.2. Energy normally available ............................................................................................. 34
II.3. Discussion ...................................................................................................................... 36
II.3.1. Energy currently available versus energy requirements ...................................... 36
II.3.2. Taking into account the energy derived from EFB and POME ............................. 39
Chapter VI: SUGGESTIONS ........................................................................................................ 40
I. FIBRE, SHELL, CAKE AND FILTERED CAKE ............................................................... 40
II. EMPTY FRUIT BUNCH (EFB) .......................................................................................... 41
III. PALM OIL MILL EFFLUENT (POME) ............................................................................ 43
CONCLUSION AND RECOMMENDATIONS .......................................................................... 46
REFERENCES .............................................................................................................................. 48
APPENDICES ............................................................................................................................... 50
ABSTRACT .................................................................................................................................. 66
RESUME ....................................................................................................................................... 67
Cogeneration and Energy Savings in a Food Processing Industry: Case of Juaben Oils Mills (Ghana)
Thesis written by Félicien D. BADOU/ 37th Promotion 2iE - June 2008
3
LIST OF FIGURES
Figure 1 : Diagram of cogeneration ................................................................................................ 6
Figure 2: Electricity and hot water co-production .......................................................................... 7
Figure 3: Heat recovery from engine .............................................................................................. 7
Figure 4: Combustion turbine ......................................................................................................... 8
Figure 5: Steam turbine ................................................................................................................... 8
Figure 6: The Combined cycle ........................................................................................................ 9
Figure 7: Different steps of the study ............................................................................................ 15
Figure 8: Design of the different sections of JOM ........................................................................ 20
Figure 9: Panorama of JOM fittings .............................................................................................. 20
Figure 10: Spaces where samples are drawn ................................................................................. 21
Figure 11: Full Fruit Bunch (FFB) ................................................................................................ 24
Figure 12: Section and structure of a palm fruit ............................................................................ 25
Figure 13: Palm oil by-products .................................................................................................... 25
Figure 14: Fresh shea fruit and shea seed drying .......................................................................... 26
Figure 15: Shea butter by-products ............................................................................................... 26
Figure 16 : Cogeneration in Juaben Oils Mills ............................................................................. 30
Figure 17 : Section of the prefurnace and the drum ...................................................................... 31
Figure 18: Seasonal energy requirement ....................................................................................... 33
Figure 19: Diagram of current potential versus energy requirements ........................................... 37
Figure 20: Treatment of EFB for energy recovery ........................................................................ 41
Figure 21: Treatment of POME for energy recovery .................................................................... 43
Cogeneration and Energy Savings in a Food Processing Industry: Case of Juaben Oils Mills (Ghana)
Thesis written by Félicien D. BADOU/ 37th Promotion 2iE - June 2008
4
LIST OF TABLES
Table 1: Conventional system versus cogeneration plant ............................................................. 10
Table 2: Summary of the methods used for solids by-products tests ............................................ 22
Table 3: Summary of the methods used for the tests on POME ................................................... 23
Table 4: Operating hours of work per season in JOM .................................................................. 27
Table 5: JOM average capacities for each season ......................................................................... 27
Table 6: Production of by-products per season ............................................................................. 28
Table 7: Annual production of by product in Juaben Oils Mills ................................................... 28
Table 8: Electrical power and steam required to process one ton of raw material ...................... 32
Table 9: Seasonal requirements in steam, power and total energy for each section ..................... 33
Table 10: Annual requirements of energy for the whole CPO, PKO and SB sections ................. 34
Table 11: GCV, moisture content and LHV of solid fuels ............................................................ 34
Table 12 Parameters of POME ...................................................................................................... 34
Table 13: Total energy potential of Juaben Oils Mills (JOM) ...................................................... 35
Table 14: Energy available in JOM without POME and EFB ...................................................... 36
Table 15: Electricity production with the excess of energy .......................................................... 38
Table 16: Electricity production with energy from EFB and POME ............................................ 39
Table 17: Electricity production with EFB ................................................................................... 42
Table 18: Electricity production with POME ............................................................................... 44
Cogeneration and Energy Savings in a Food Processing Industry: Case of Juaben Oils Mills (Ghana)
Thesis written by Félicien D. BADOU/ 37th Promotion 2iE - June 2008
5
INTRODUCTION
Energy is the driving force of human life; without energy no activity is possible and no
development can be envisaged. Gross Domestic Product (GDP) and energy consumption are
closely linked, the more a country consumes energy, the more developed it is. That is why after
the energy crisis of 1973, the International Community undertook to find a sure response to the
energy question. Before this crisis, the energy requirements were mainly met with fossil fuels.
However, these fossil fuels are great sources of pollutions and the worldwide reserves are
depleting. Therefore nowadays, people incline in favour of renewable energy sources such as
solar energy, wind energy, geothermal energy and especially biomass. Biomass gains much
interest because of the large possibilities it offers: production of biofuels, biogas, electricity, etc.
Biomass serves people in a “way that is efficient, clean, convenient and reliable and at the same
time is economically and environmentally sound” (FAO, 1995).
Furthermore, among the technologies which can be used to confer to biomass its so great
importance, we can list Cogeneration.
A Cogeneration plant allows using any type of fuel in general and biomass such as waste from
food processing industry in particular. Using by-products, electricity and heat are generated to
meet the energy requirements of the factory, making it energy self-sufficient.
It is against this background that the current study fits; the aim was to investigate the optimal
way to co-generate electricity and heat while using the by-products from an oil mills. Juaben
Oils Mills, a Palm Oil and Shea Oil industry in Kumasi (GHANA) has been chosen for that.
The work first of all specifies the backgrounds as well as the problem statement, the objectives
and the methodology of the study. Chapter 3 deals with a bibliographic synthesis. The
description of the methods, of the experimental mechanisms and of the measurements’ protocol
is tackled in the fourth chapter. The results and analysis constitute the fifth chapter of the report.
Some optimal methods to save energy are proposed in chapter six. Conclusion and
recommendation then follow.

Cogeneration and Energy Savings in a Food Processing Industry: Case of Juaben Oils Mills (Ghana)
Thesis written by Félicien D. BADOU/ 37th Promotion 2iE - June 2008
6
Chapter I: BACKGROUND This first chapter gives some information about the concept of cogeneration and the
availability of biomass as source of energy.
I. PANORAMIC VIEW ON COGENERATION
I.1. Definition
Cogeneration also calls Combined Heat and Power (CHP), is a technique to produce
simultaneously electric and thermal energies while using a same primary energy through a single
device. The corresponding efficiencies generally range between 80% and 90% (See Figure 1).
Figure 1 : Diagram of cogeneration
(Adapted from. “Technologies Propres et Sobres”)
In this technology, electricity is obtained from the conversion of the mechanical energy of a
turbine or an engine by an alternator. As for the heat, since it is less well transported like
electricity, it is often considered as an industrial waste. With cogeneration this option is avoided:
heat is recovered through a heat exchanger and used to produce either hot air or hot water or
again steam. In fact, an engine possesses an electric efficiency of 40 to 45 %, a turbine an
electric efficiency of 35 to 40 %, and those of fuel cells from 20 to 30%. Almost all the
difference of energy consumed is transformed into heat. Cogeneration consists on recovering at
the best this energy in order to increase the overall efficiency (electric plus thermal) and reach at
least 80 % (Wikipedia.org).
Figure 2 is an illustration of the co-production of electricity and hot water.

Cogeneration and Energy Savings in a Food Processing Industry: Case of Juaben Oils Mills (Ghana)
Thesis written by Félicien D. BADOU/ 37th Promotion 2iE - June 2008
7
Figure 2: Electricity and hot water co-production
(Adapted from fnf.org)
I.2. Types of cogeneration
Dealing with the type of cogeneration, the encyclopaedia “Wikipedia” highlights that this
depends on the devices installed as it is described below:
I.2.1. Cogeneration with engines
For small plants and for domestic applications people use cogeneration’s engines (electric
efficiency ranging between 30 and 40%). Here two types of thermal energies are produced, a low
temperature energy (about 95 °C), recovered from oil and water for cooling and a high
temperature energy (about 450 °C), recovered from exhaust gases. Figure 3 gives details on how
electricity and heat are produced from an engine
Figure 3: Heat recovery from engine (Adapted from petitecogeneration.org)
I.2.2. Cogeneration with gas turbines
Cogeneration can also be done while using a combustion turbine (a gas turbine). The
thermodynamic process of combustion turbines (electric efficiency varying between 25 and
40%) is characterized by Brayton’s cycle Atmospheric air is inhaled and compressed in a

Cogeneration and Energy Savings in a Food Processing Industry: Case of Juaben Oils Mills (Ghana)
Thesis written by Félicien D. BADOU/ 37th Promotion 2iE - June 2008
8
compressor. In the combustion chamber, a fuel is injected in this compressed air and is burned.
Hot and high pressure combustion gases are sent to a turbine which produces a mechanical work.
This work is transformed into electricity through an alternator. Since exhaust gases contain lot of
heat, they are aimed towards a boiler of recuperation, where their thermal energy will be
transmitted to a coolant fluid (water generally). See Figure 4.
Figure 4: Combustion turbine (Adapted from wikipedia.org)
I.2.3. Cogeneration with steam turbines
Apart from the technology described above, there is also the technology of steam turbine.
Figure 5 shows the functioning principle.
Figure 5: Steam turbine
(Adapted from wikipedia.org) Steam turbines are installed in industries capable to supply large quantity of steam. Rankine’s
Cycle governs the thermodynamic cycle of steam turbines. With heat released from the
combustion of, steam is produced at high pressure in a boiler. Then this steam is channelled
towards a turbine, where while relaxing, it drives the turbine. At the outlet of the turbine, steam
is condensed and is brought back to the boiler where the cycle restarts. Using this steam allows
increasing considerably the electric efficiency and to reach about 55%.

Cogeneration and Energy Savings in a Food Processing Industry: Case of Juaben Oils Mills (Ghana)
Thesis written by Félicien D. BADOU/ 37th Promotion 2iE - June 2008
9
I.2.4. Cogeneration with the combined cycle
The fourth way to implement cogeneration is the combined cycle. Indeed, it is possible to
combine steam turbine and gas turbine. As we said previously, gas turbine can produce steam
throughout a boiler of recuperation. This steam can drive a steam turbine instead of be used
directly for a process. And with an alternator set on the steam turbine axis; we can produce a
complement of electricity. This kind of configuration allows getting a high electrical efficiency
but a low thermal efficiency (See Figure 6).
Figure 6: The Combined cycle (Adapted from wikipedia.org)
I.2.5. Cogeneration with fuel cells
Cogeneration by fuel cells is in addition to the list above. This technology could be used in
domestic applications (heating and electricity production for individual houses) and industrials
ones. Unfortunately fuel cells are not yet a mature technology
I.3. Impacts of Cogeneration
Cogeneration also implies Energy, Economy and Ecology and is more than ever one of the
best answers to the energy requirements of the industrialists and the local authorities
(petitecogeneration.org).
I.3.1. Energy impact
Thanks to cogeneration, the potential of a fuel is efficaciously exploited; that is to say less
fuel is required to produce the same quantities of heat and electricity as a classical system,
separated production of only power or only thermal energy.
“Technologies Propres et Sobres” of January 1996 had published a comparison between a
cogeneration plant which has an overall efficiency of 87 % and a classical system, See Table 1.

Cogeneration and Energy Savings in a Food Processing Industry: Case of Juaben Oils Mills (Ghana)
Thesis written by Félicien D. BADOU/ 37th Promotion 2iE - June 2008
10
Table 1: Conventional system versus cogeneration plant
Data Conventional system
Cogeneration
Fuel (ue) 153 100
Electricity input (ue) 92 32
Electric efficiency (%) 37 32
Electric output (ue) 30 30
Electricity loss (ue) 62 2
Heat input (ue) 61 68
Thermal efficiency (%) 90 55
Thermal output 55 55
Heat loss (ue) 6 13
Overall output (ue) 85 85
Overall loss (ue) 68 15
(Adapted from. “Technologies Propres et Sobres”)
The conventional system is constituted of a power station having an electric efficiency of 37 %
and a boiler which has a thermal efficiency of 90 %. The comparison is based on the number of
unit of energy (ue) used to produce a same given quantity of energy (electricity and/or heat) by
each system. The loss due to each system is also taken into account. In the table ue means unit of
energy for instance the kWh
The gain of primary energy is: 35100)153
1001( =×− %.
That is why in the encyclopaedia “Wikipedia” Combined Heat and Power is designated as one of
the most energetically efficient techniques for the utilization of both fossil fuels and renewable
energies.
I.3.2. Economical impact
One of the economical impacts of cogeneration is the significant reduction of the energy bill,
that is to say the diminution of electricity bought to the grid and the optimization of thermal
energy’s cost. Another economical aspect is the benefit people can get from the resale of the
excess of electricity produced to the grid (petitecogeneration.org).
By 1996, the MW price was around 320 FHT in France. Some researchers had shown that with
cogeneration, it should pass to 166 FHT, that is to say a reduction of 48 %. Besides, according to
the types of fittings the payback period of Cogeneration plant is quite short and ranges between 3
and 5 years (Technologies Propres et Sobres).
Cogeneration and Energy Savings in a Food Processing Industry: Case of Juaben Oils Mills (Ghana)
Thesis written by Félicien D. BADOU/ 37th Promotion 2iE - June 2008
11
I.3.3. Environmental impact
Cogeneration also rhymes with the sustainable development and the rational utilization of
natural resources. It permits to reduce largely the emission of pollutants and greenhouse gases;
and this especially when we use renewable energy. Indeed, some researches estimate the
reduction of carbon dioxide (CO2) between 15 and 29 % according to the classical system
substituted by cogeneration (petitecogeneration.org). While producing 1000 MW by
cogeneration, the emission of CO2 is reduced for about 1.25 millions of metric tonnes per year
(Technologies Propres et Sobres). In addition, cogeneration helps to save fossil fuels owing to its
efficient (up to 80%) and to the possibility it offers to use renewable energy.
I.3.4. Impact on electricity distribution grid
Cogeneration is also a way for diversifying the techniques of energy production and for
developing local generation of electricity. In fact, contrary to the classical power stations which
are centralized, cogeneration plants are decentralized and close to the users i.e. urban centres,
industrial zones, hospitals, etc…Therefore all the loss by Joule effect due to electricity
transportation is avoided and the needs to reinforce the grid are dwindled. Furthermore, it assures
the reliability of electricity supply while preserving the zones supplied from blackouts…
I.4. Practice of cogeneration throughout the world
In USA, as early as 1980, cogeneration fittings were spread and their total capacity was
estimated in 1988 at 660 000 MW electric.
Cogeneration took its flight in Japan around 1985 with a total capacity of about 160 000 MW by
1992, the part of industrial cogeneration being 16 000 MW (Technologies Propres et Sobres).
Twelfth percent (12%) of the electricity in Europe is produced by CHP (petitecogeneration.org).
The three quarters (3/4) of this production are realized by Germany, Holland and Italy
(Technologies Propres et Sobres). In Denmark by 2000, the production of electricity by
cogeneration was more than 50 % of the country requirements (Wikipedia.org).
After this overview on the types of Combined Heat and Power (CHP), let us tackle the aspect of
the fuels.
II. AVAILABILITY OF BIOMASS FROM FOOD PROCESSING IN DUSTRIES
The followings lines show how, in many industries by-products are available as fuel and can
act as energy feedstock. Sugar industries, shea butter mills, and especially palm oil mills are the
food processing industries where enormous quantities of wastes are extracted and can be turned
into energy.
Cogeneration and Energy Savings in a Food Processing Industry: Case of Juaben Oils Mills (Ghana)
Thesis written by Félicien D. BADOU/ 37th Promotion 2iE - June 2008
12
II.1. Residues from sugar mills
Residues from sugar mills (i.e. bagasse) can provide more energy than what is required for
the process (FAO, 1995).
II.2. Residues from palm oil mills
Basiron and Chan (2004) found that the oil palm biomass is 7 times more available than
natural timber. “The palm oil industry is one of the food industrial sectors which produce the
highest quantities of residues” (FAO, 1995). Only 30 % of Fresh Fruit Bunch (FFB) is
transformed into oil, the 70 % remaining are waste; the waste is made up of Empty Fruit Bunch
(EFB), fibre, shell and Palm Oil Mill Effluent (POME). We will give more details on the way
these residues are extracted in the fifth chapter of this study. This availability of oil palm
biomass confers to it a place of choice.
Oil palm (Elaeis guineensis) initially found in the wild groves are nowadays grown like
plantation crops. One hectare of mature palms implies the availability of 20.08 FFB, of 4.42
EFB, of 2.71 fibres, of 1.1 shells, and of 13.45 POME in terms of fresh weight in Mt/year
(Sumiani, 2004).
In 25 years the world area of oil palm fields has increased by 6.81 millions hectares. From 1.76
millions hectares in 1980, we had in 2005 8.54 millions hectares. This situation is due to the high
demand of palm oil of oils refineries and soap industries throughout the world.
The figures got by Yong et al. for the year 2007 are yet more appealing, 184.6 millions Mt of oil
palm biomass has been produced in the world. With this production of residues, oil palm tree
become the top of fruit crops.
Tropical regions are the zones favourable to the cultivation of palm tree. That is why Asia and
Africa are the continents where we can find vast fields of palm tree. In Asia, 136.39 millions Mt
of palm oil are produced over 7.1 millions hectares harvested and 15.97 millions Mt of palm oil
are processed over 4.34 millions hectares for Africa (FAO, 2007).
Malaysia and Indonesia are currently the first and second best world producers of palm oil. The
process of 25 millions tons of CPO in these countries provides 30 to 50 millions Mt of by-
products at the mills (Dam, 2004).The Malaysian example in particular shows that if the annual
quantity of oil palm by-products generated in 2000 was 73.74 millions Mt, there were only 5.05
millions Mt of municipal solid waste, 2.177 millions Mt of sawdust, 1.327 millions Mt of paddy
wastes and 0.356 millions Mt of bagasse (Pusat Tenaga Malaysia, 2006).
Africa is the cradle of oil palm; and since nineteenth century (in the context of Industrial
Revolution in Europe) to 1966, was the largest producer and exporter of Crude Palm Oil (CPO)
and palm kernel. In 1911 for instance, 87,000 Mt of CPO and 157,000 Mt of kernels were
Cogeneration and Energy Savings in a Food Processing Industry: Case of Juaben Oils Mills (Ghana)
Thesis written by Félicien D. BADOU/ 37th Promotion 2iE - June 2008
13
exported from West African Anglophones countries like Nigeria, Ghana, Liberia, and Sierra
Leone, with 75 % from Nigeria. It is by 1966 that Malaysia and Indonesia had become the top of
the list in front of Nigeria and Zaire, the two first world producers of palm oil (FAO 148).
Besides, palm can be successfully cultivated in any African country where the rainfall is around
1600 mm/year such as Cameroon, Cote d’Ivoire, Ghana, Liberia, Nigeria, Sierra Leone, Togo,
Angola and Congo. This means that African can improve their level of production generate
impressive quantity of oil palm biomass.
One of the emerging food industries sector nowadays is the one of shea butter.
II.3. Residues from shea butter mills
Like for palm oil, the demand for shea fat is more and more increasing in the world. This
reality is due to high utilization of shear butter in cosmetics and as cocoa butter substitute in the
process of chocolate. Shea butter is extracted from the dried seeds of shea tree (Vitellaria
paradoxa) (journals.cambridge.org). The production of this butter gives at least 52 % of residues
called shea cake (practicalaction.org) which can also be used as fuel. Vitellaria paradoxa is
strongly widespread in Africa (Benin, Burkina Faso, Cameroon, Central African Republic, Chad,
Ethiopia, Ghana, Guinea, Guinea Bissau, Côte d’Ivoire, Mali, Niger, Nigeria, Senegal, Sierra
Leone, Sudan, Togo, Uganda, Zaire), (Wikipedia.org) and its waste therefore constitute an
important feedstock for energy. During more than 200 years, a shea tree provides between 15
and 20 kg of fresh fruit or between 3 and 4 kg of dried seeds per year.
II.4. Utilisation of the residues from oil mills
Even if the residues from food processing industries are available, they are not always use
for energy purpose. For instance, Empty Fruit Bunch (EFB) and Palm Oil Mill Effluent (POME),
which represent more than 70% of the biomass generated in a palm oil mills are very often used
either as fertilizer or disposed of, (Dam, 2004). EFB are mainly utilized for mulch. As for
POME, it is discharged in the nature (bushes and waterways), constituting thus a danger for the
environment (FAO 148).
In Africa, by-products from food industries are wasted. For instance, shells are mainly used as
fuel by the blacksmiths or help for the maintenance of the roads of palm plantations (FAO 148).
Cogeneration and Energy Savings in a Food Processing Industry: Case of Juaben Oils Mills (Ghana)
Thesis written by Félicien D. BADOU/ 37th Promotion 2iE - June 2008
14
Chapter II : PROBLEM STATEMENT,OBJECTIVES AND METHODOLOGY
The problem statement, the objectives and methodology of the study are specified in this
chapter.
I. PROBLEM STATEMENT
The aforementioned lines (like many others illustrations in literature) not only underlined
that biomass are largely available but raised the question of their valorisation and their optimal
utilization in the mills. Although some efforts have been done to use certain by-products (fibre,
shell, bagasse…) to meet the energy demand of the mills, the sector still continues to suffer from
wasting and inefficient utilization of the residues extracted.
The rapid growth of the number of oil palm plantations and the increasing attention paid to shea
butter, bring up concerns about the destination of the impressive quantity of residues which will
be extracted. The huge amount of waste from food processing industries can come up against our
endeavour to assure sustainable development if nothing is done to manage them efficiently.
How can we successfully convert all this abundant biomass into energy? Is there no scope for
cogeneration? Is cogeneration not a “windfall” for the conversion of waste from food industries
into energy? Is cogeneration not the best answer mainly for African food industries?
Most particularly how can cogeneration help to valorise and optimize the residues extracted in
Juaben Oils Mills for energy purpose?
This study wants to be a quite response to that latter question.
II. OBJECTIVES OF THE STUDY
Through this study, we aim to find out the best ways for energy savings in Juaben Oils Mills
(JOM). Determine how with cogeneration we can assure an optimal utilization of the industrial
waste of JOM for energy production constitutes our main objective.
The corresponding specifics objectives are:
Do an overall energy flow balance that is to say thermal and electric flow balances of
the cogeneration fitting.
Determine very clearly the utilization rate of by-products currently used as fuels and
identify those which are not yet used for energy production.
Suggest how to optimize the utilization of by-products. Here we would like to see if the
excess of fuels (if it is so) can be converted into electricity that will be sold to the Electricity
Company of Ghana (ECG) for Kumasi supply. In fact, Kumasi is a town where blackouts are
strident.

Cogeneration and Energy Savings in a Food Processing Industry: Case of Juaben Oils Mills (Ghana)
Thesis written by Félicien D. BADOU/ 37th Promotion 2iE - June 2008
15
III. METHODOLOGY
To reach the objectives of the study, the following methodology has been defined. Figure 7
sums up the different stages carried out.
Figure 7: Different steps of the study
III.1. Preliminaries
This stage has consisted in doing a bibliographical research that helped us to know on what
items we should focus on for our study and elaborate a befitting questionnaire.
III.1.1. Bibliographical research
Here it has been question on the one hand to familiarize ourselves with the concept of
cogeneration and to know what fuels (especially biomass) can be used in a Combined Heat
Power (CHP) plant. On the other hand this step helped us to master most of the technologies for
processing by-products from palm oil mill before their utilization as fuels.
Some papers and websites found through internet have been our sources
Cogeneration and Energy Savings in a Food Processing Industry: Case of Juaben Oils Mills (Ghana)
Thesis written by Félicien D. BADOU/ 37th Promotion 2iE - June 2008
16
III.1.2. Elaboration of questionnaire
At this step we have formulated some questions to the technical staff of the mills especially
the Technical Manager and some technicians in charge of the Crude Palm Oil (CPO) section, of
the Palm Kernel Oil (PKO) section, of the Shea Butter (SB) section and of the cogeneration unit.
With whom we dealt with:
The characterization of by-products: identification, quantity extracted, current usages,
utilization rate and constraints
The check up of the cogeneration fitting : types and characteristics of the boilers and the
turbines
The guide of questionnaire is available in Appendix 1.
III.2. Collection of data
We want to clarify that our study was about the activities of Juaben Oils Mills (JOM) for the
period of June 2007 to May 2008.
III.2.1. Preliminary visit to the mills
This visit has allowed us to familiarize ourselves with the area of the study (different
sections of the mills) and to meet the technical personnel in order to organize the collection of
data.
III.2.2. Collection of data itself
This step has been punctuated with the followings actions:
Observe and understand succinctly the functioning of Crude Palm Oil (CPO), Palm
Kernel Oil (PKO) and Shea Butter (SB) sections but deeply the one of cogeneration.
Observe for a given period the amount of fuel currently consumed; the corresponding
consumption of water, the variations of the pressure of the steam generated and the variations of
the electric parameters.
Take samples of solid by-products for moisture content and calorific value experiments.
Measure temperature of Palm Oil Mill Effluent (POME) and bring some samples for
others tests in laboratory.
III.3.Treatment of data and analyse
Using the data collected we determined first of all the mill capacity befitting to the period of
the study, then from the total quantity of by-products extracted we deducted the surplus we can
save if some optimal measures are applied. We also emphasize on how to realize concretely
these measures

Cogeneration and Energy Savings in a Food Processing Industry: Case of Juaben Oils Mills (Ghana)
Thesis written by Félicien D. BADOU/ 37th Promotion 2iE - June 2008
17
Chapter III : LITERATURE REVIEW What can we learn from the literature aptness to cogeneration and to the utilization of the by
products from food processing industries for energy purpose?
An overview on some biomass from food industries (in particular palm oil mills) which can be
valorised by cogeneration is given in this chapter.
One article of the Asian programme report (Wood Energy News) lists sugar mills and
palm oil mills as good sectors to implement cogeneration.
Sugar mills are energetically self-sufficient (even if their equipments are not efficient), thanks to
the utilization of bagasse. One metric ton (Mt) of sugarcane supplies 290 kg of bagasse
(equivalent to100 kWh) whereas the process required only 25 to 30 kWh/Mt and 0.4 Mt of
steam. Improve the fittings of sugar mills will permit to obtain more excess of bagasse and sell
the surplus of power generated to the grid. For instance, the annual electric potential of the
Association of South East Asian Nations (ASEAN) from bagasse was estimated in1995at 8600
GWh with an excess of 6800 GWh.
Things are quite the same with palm oil mills. In fact, 230 kg of Empty Fruit Bunch (EFB)
(equivalent to 35 kWh), 210 kg of fibre plus shell (equivalent to 45 kWh) and 6.5 m3 of biogas
are extracted from one metric ton (Mt) of Full Fruit Bunch (FFB). The energy required for the
process of one Mt of FFB is about 20 to 25 kWh and 0.73 Mt of steam. The utilization of only
fibre is capable to meet the energy requirements of a palm oil mill, highlight the authors.
Therefore the excess of by-products shell, EFB and Palm Oil Mill Effluent (POME) can be used
to produce a surplus of electricity that will be sold to the grid.
Mahlia et al. (2000) have conducted a study on the utilization of fibre and shell
(previously considered like industrial waste) as source of alternative energy for palm oil industry
in Malaysia and Indonesia. They proved that processing 30 metric tons (Mt) of Full Fruit Bunch
(FFB) per hour provides 4200 kg/h of fibre and 1800 kg/h of shell. In terms of energy this is
worth some 72, 083, 200 kJ/kg and is equivalent to 18,925 kg/h of steam. This is more than the
18,000 kg/h of steam necessary to generate the 600 kW of electricity required for the process.
The remaining of steam will be used to sterilize FFB.
How much the by-products from palm oil mills are available for alternative use? J.V.
Dam (2004) answers to this question through his research.
In Malaysia, 90 % of the fibres and the shells extracted are used as fuel by millers to meet their
energy demand. Contrary to fibre and shell, the utilisation rate of Palm Oil Mill Effluent

Cogeneration and Energy Savings in a Food Processing Industry: Case of Juaben Oils Mills (Ghana)
Thesis written by Félicien D. BADOU/ 37th Promotion 2iE - June 2008
18
(POME) and Empty Fruit Bunch (EFB) ranges between 35 and 65 %. For palm oil millers, EFB
are less attractive as fuel for boiler and are therefore generally not used for energy but as
fertilizer. Similarly POME is also hardly used and creates a problem of accumulation in the
mills. Nevertheless, the author shows that generate electricity from EFB is 3.5 times more
profitable than use EFB as mulch in the plantations of oil palm.
Tau et al. (2007) through their research titled “Potential of hydrogen from oil palm
biomass as source of renewable energy worldwide” propose the best way for the valorisation of
palm oil waste. It is about the conversion of oil palm by-products (trunk, frond, EFB, shell and
fibre) into hydrogen thanks to the gasification in supercritical water (727 °C and 32 MPa). Using
the 184.6 millions metric tons (Mt) of oil palm waste available annually some 2.16 x 10¹⁰
kg/year of H2 (equivalent to 2.59 x 10¹⁵ GJ/year) will be generated. According to the authors, this
amount represents 50 % of the world hydrogen demand. The good news is that hydrogen can be
used as combustible in a cogeneration plant.
B.G Yeoh (2004) in one of his studies deals with the utilization of Palm Oil Mill
Effluent (POME) to generate heat and power. In Malaysia the best world producer of palm oil,
POME has been identified as one of the major sources of aquatic and atmospheric pollution. In
fact, 85% of the mills use lagoon systems to treat the 27 x 106 m3 of POME generated per year.
Therefore about 375 x.106 m3 of methane (CH4) are evolved. This amount represents 10% of
methane inventoried in Malaysia .In terms of greenhouse gas, this is worth 5.157 x 10⁶ kg of
CO2. The author also reported that 30% of the Biochemical Oxygen Demand (BOD) load of
Malaysian waters is due to POME.
Fortunately, the biomethanation (anaerobic digestion) of POME under thermophilic condition
generates methane at a very high output, especially at 55°C; and then methane can be burned to
produce either thermal or electric energy.
In the whole, the palm oil in Malaysia contributes to 2,250 x 106 KWh annually (equivalent to
4% of the country electricity demand) and to 715 x 106 L of thermal energy.
Partial summary
Cogeneration is a way to valorise any type of fuels and especially residues from food industries.
In Africa there is enormous quantity of by-products from food industries which are considered as
waste and therefore thrown away. This happens may be because people ignore the technology of
cogeneration or because of economical reasons and absence of political incentives.

Cogeneration and Energy Savings in a Food Processing Industry: Case of Juaben Oils Mills (Ghana)
Thesis written by Félicien D. BADOU/ 37th Promotion 2iE - June 2008
19
However, it is more than ever necessary for African countries to turn resolutely towards
renewable energy and mainly biomass as source of energy. Recently the price of goods in many
sub-Saharan countries has widely increased due to the rise of petrol cost.
Like in Asia may be cogeneration in food industries can increase Africa electric potential.
Nevertheless, studies dealing with the valorisation and optimization of the by-products from
African food industries thanks to cogeneration are scarce.

Cogeneration and Energy Savings in a Food Processing Industry: Case of Juaben Oils Mills (Ghana)
Thesis written by Félicien D. BADOU/ 37th Promotion 2iE - June 2008
20
Chapter IV : MATERIALS AND METHODS In food industry, residues can be available but it is very important to investigate on their
characteristics in order to know if they can easily be used as fuels or if they require specific
treatments before their utilisation. It is the aim of this part which shows how during about 6
weeks (from 16th of April to 26th of May) we manage to collect our data. I. EXPERIMENTAL SITE
Our work has entirely been conducted in the oils mills of Juaben. The Juaben Oil Mills is a
joint venture between the Juaben Traditional Council and the Juaben Oil Mills Company
Limited. Initially it was a state farm established in 1977 until the government decided to sell the
farms in 1994. The Juaben Traditional Council bought the land and expanded the farm.
This industry was mainly constituted of 3 sections in particular the Crude Palm Oil (CPO)
section, the Palm Kernel Oil (PKO) section and Shea Butter (SB) section to which a refinery has
been added recently. All these sections are supplied by the boiler house (See Figure 8 and Figure
9).
Figure 8: Design of the different sections of JOM
Figure 9: Panorama of JOM fittings
SB section
Boiler house
CPO and PKO
sections

Cogeneration and Energy Savings in a Food Processing Industry: Case of Juaben Oils Mills (Ghana)
Thesis written by Félicien D. BADOU/ 37th Promotion 2iE - June 2008
21
Our study doesn’t include the refinery but takes into account the 3 others sections and the boiler
house represented on Figure 9.
The complete process of Crude Palm Oil (CPO) and Palm Kernel Oil (PKO) production is
perceptible through the Appendix 2. Appendix 3 gives details on Shea Butter extraction.
II. THE BY-PRODUCTS STUDIED
All the by-products, used for our tests have been taken on the site Juaben Oils Mills.
Samples of fibre are drawn directly from the silo that fills mechanically fibre coming from CPO
section into the fuel conveyer. Shell, cake and filtered cake are taken from the platform where
they are stored just before their utilization. Empty Fruit Bunch (EFB) and Palm Oil Mill Effluent
(POME) samples are drawn from the stripper and at the exit of settling pond respectively (See
Figure 10).
Figure 10: Spaces where samples are drawn
FFuueellss ppllaattffoorrmm FFiibbrree ssiilloo
SSttrriippppeerr SSeettttlliinngg ppoonndd
Cogeneration and Energy Savings in a Food Processing Industry: Case of Juaben Oils Mills (Ghana)
Thesis written by Félicien D. BADOU/ 37th Promotion 2iE - June 2008
22
III. METHODS AND EQUIPMENTS
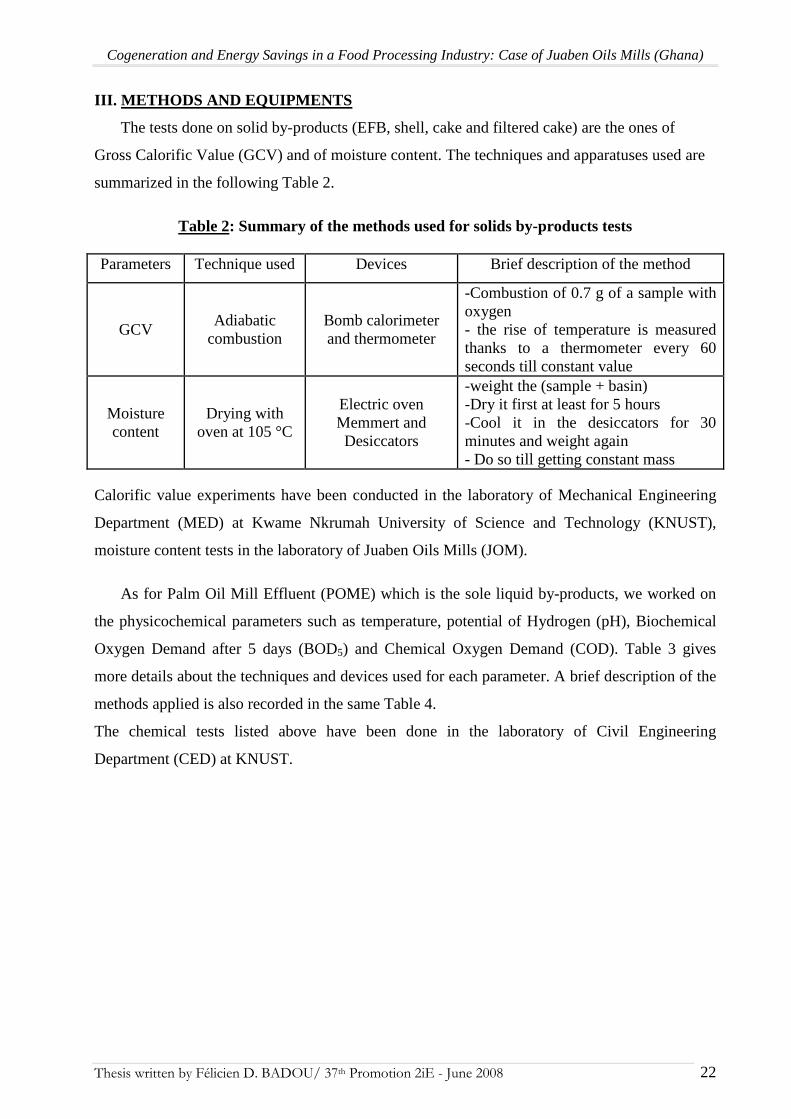
The tests done on solid by-products (EFB, shell, cake and filtered cake) are the ones of
Gross Calorific Value (GCV) and of moisture content. The techniques and apparatuses used are
summarized in the following Table 2.
Table 2: Summary of the methods used for solids by-products tests
Parameters Technique used Devices Brief description of the method
GCV Adiabatic
combustion Bomb calorimeter and thermometer
-Combustion of 0.7 g of a sample with oxygen - the rise of temperature is measured thanks to a thermometer every 60 seconds till constant value
Moisture content
Drying with oven at 105 °C
Electric oven Memmert and Desiccators
-weight the (sample + basin) -Dry it first at least for 5 hours -Cool it in the desiccators for 30 minutes and weight again - Do so till getting constant mass
Calorific value experiments have been conducted in the laboratory of Mechanical Engineering
Department (MED) at Kwame Nkrumah University of Science and Technology (KNUST),
moisture content tests in the laboratory of Juaben Oils Mills (JOM).
As for Palm Oil Mill Effluent (POME) which is the sole liquid by-products, we worked on
the physicochemical parameters such as temperature, potential of Hydrogen (pH), Biochemical
Oxygen Demand after 5 days (BOD5) and Chemical Oxygen Demand (COD). Table 3 gives
more details about the techniques and devices used for each parameter. A brief description of the
methods applied is also recorded in the same Table 4.
The chemical tests listed above have been done in the laboratory of Civil Engineering
Department (CED) at KNUST.

Cogeneration and Energy Savings in a Food Processing Industry: Case of Juaben Oils Mills (Ghana)
Thesis written by Félicien D. BADOU/ 37th Promotion 2iE - June 2008
23
Table 3: Summary of the methods used for the tests on POME Parameters Technique used Devices Brief description of the
method
Temperature Electronic
thermometer
Plunge thermometer in POME for at least 2 minutes before reading
pH Numeric method pH-meter with
combined electrodes
-Check first the pH-meter accuracy with neutral solution -Plunge it in the sample -Wait to get constant value before reading
BOD5 Winkler method
Titration with sodium thiosulphate (Na2SO3) 0.025 N
Airing water pump and incubator
-Prepare first diluted water -Dilute the sample and spill it in 2 BOD bottle - Put on bottle in incubator at 20°C for 5 days - Add 1ml of Maganous sulphate (MnSO4) follow by 1ml of alkaline iodide, invert the bottle and leave it settle. -Add 1ml of sulphuric acid (H2SO4) -Titrate 200ml of sample to have starch colour
COD
Opened reflux method Titration with di-ammonium
iron II sulphate (Fe2(NH4)2SO4.6H2O 0.0951
N
Extraction heater
-dilute the sample with distilled water -Add 10 ml of K2Cr2O7, 20 ml of H2SO4 (slowly) and cool it -Then add 1ml of Ag2SO4 plus some drops of mercury sulphate -After 2 hours of heating add 45 ml of distilled water and 3 drops of ferric indicator -titrate sample to have brown colour.
I.V. DIFFICULTIES FACED
The frequent blackouts in KNUST have strongly affected our experiments.
One other difficulty faced was the low accuracy of the thermometer of the calorimeter we used
for the experiments of Gross Calorific Value. The thermometer was 0.1 instead of 0.01.
Cogeneration and Energy Savings in a Food Processing Industry: Case of Juaben Oils Mills (Ghana)
Thesis written by Félicien D. BADOU/ 37th Promotion 2iE - June 2008
24
Chapter V: ACHIEVEMENTS AND DISCUSSION The previous chapters allow us to collect all the indispensable information for the study..
The data got have been treated and analysed in order to master the current energy practices of
Juaben Oils Mills (JOM). This chapter which is made of 2 parts deals step by step with the
present situation and the energy diagnostic of the mills.
I. PRESENT SITUATION OF JUABEN OILS MILLS (JOM)
I.1. Extraction of the by-products
Let us remind that JOM is constituted of 3 main sections namely Crude Palm Oil (CPO)
section, Palm Kernel Oil (PKO) section and Shea Butter (SB) section. A refinery has just been
added to the mills but is not covered in this study.
The Palm Kernel Oil (PKO) section produces two by-products: a cake which is sold to poultry
farmers as feed stuffs and some oily residues from which oil are recovered by traditional method.
These 2 by-products are not taken into account in this study.
From Crude Palm Oil (CPO) section, Empty Fruit Bunch (EFB), fibre, shell and Palm Oil Mill
Effluent (POME) are extracted while cake and filtered cake emanate from SB section.
The following lines described how these by-products are derived.
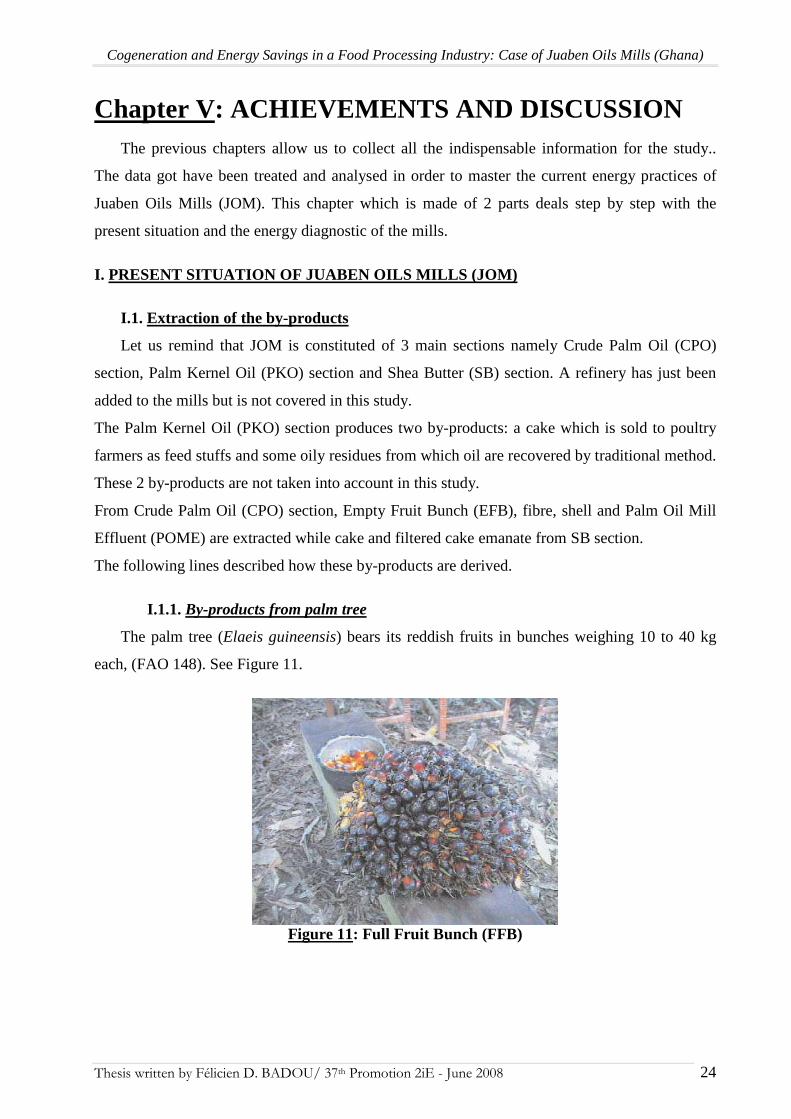
I.1.1. By-products from palm tree
The palm tree (Elaeis guineensis) bears its reddish fruits in bunches weighing 10 to 40 kg
each, (FAO 148). See Figure 11.
Figure 11: Full Fruit Bunch (FFB)
Cogeneration and Energy Savings in a Food Processing Industry: Case of Juaben Oils Mills (Ghana)
Thesis written by Félicien D. BADOU/ 37th Promotion 2iE - June 2008
25
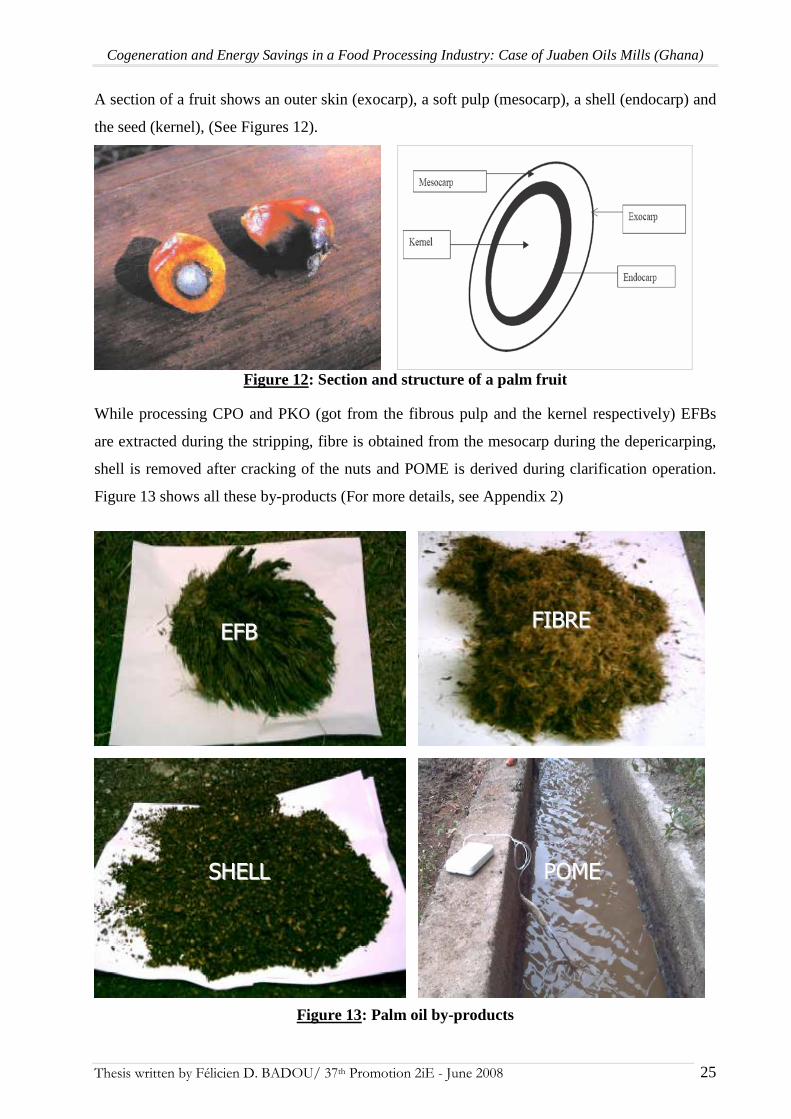
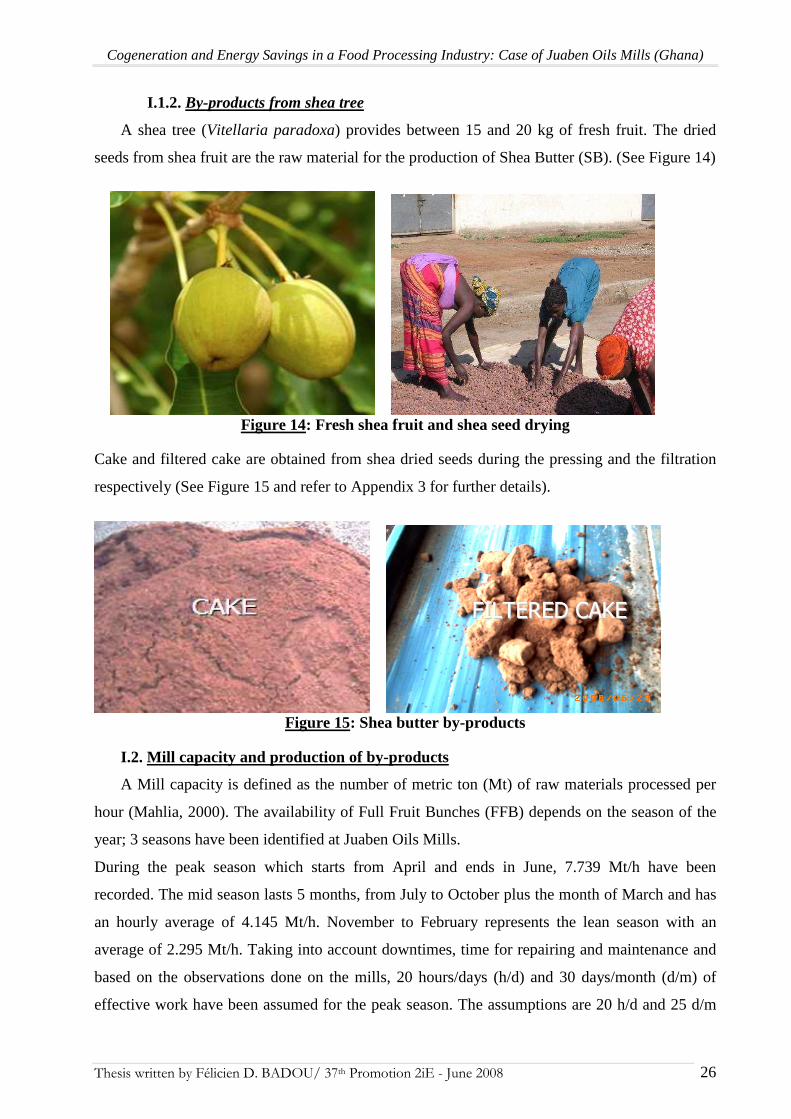
A section of a fruit shows an outer skin (exocarp), a soft pulp (mesocarp), a shell (endocarp) and
the seed (kernel), (See Figures 12).
Figure 12: Section and structure of a palm fruit
While processing CPO and PKO (got from the fibrous pulp and the kernel respectively) EFBs
are extracted during the stripping, fibre is obtained from the mesocarp during the depericarping,
shell is removed after cracking of the nuts and POME is derived during clarification operation.
Figure 13 shows all these by-products (For more details, see Appendix 2)
Figure 13: Palm oil by-products
EEFFBB FFIIBBRREE
SSHHEELLLL PPOOMMEE
Cogeneration and Energy Savings in a Food Processing Industry: Case of Juaben Oils Mills (Ghana)
Thesis written by Félicien D. BADOU/ 37th Promotion 2iE - June 2008
26
I.1.2. By-products from shea tree
A shea tree (Vitellaria paradoxa) provides between 15 and 20 kg of fresh fruit. The dried
seeds from shea fruit are the raw material for the production of Shea Butter (SB). (See Figure 14)
Figure 14: Fresh shea fruit and shea seed drying
Cake and filtered cake are obtained from shea dried seeds during the pressing and the filtration
respectively (See Figure 15 and refer to Appendix 3 for further details).
Figure 15: Shea butter by-products
I.2. Mill capacity and production of by-products
A Mill capacity is defined as the number of metric ton (Mt) of raw materials processed per
hour (Mahlia, 2000). The availability of Full Fruit Bunches (FFB) depends on the season of the
year; 3 seasons have been identified at Juaben Oils Mills.
During the peak season which starts from April and ends in June, 7.739 Mt/h have been
recorded. The mid season lasts 5 months, from July to October plus the month of March and has
an hourly average of 4.145 Mt/h. November to February represents the lean season with an
average of 2.295 Mt/h. Taking into account downtimes, time for repairing and maintenance and
based on the observations done on the mills, 20 hours/days (h/d) and 30 days/month (d/m) of
effective work have been assumed for the peak season. The assumptions are 20 h/d and 25 d/m
FFIILLTTEERREEDD CCAAKKEE

Cogeneration and Energy Savings in a Food Processing Industry: Case of Juaben Oils Mills (Ghana)
Thesis written by Félicien D. BADOU/ 37th Promotion 2iE - June 2008
27
for the mid season and 18 h/d and 20 d/m for the lean season. All these assumptions are recorded
in Table 4.
Table 4: Operating hours of work per season in JOM
Season h/d d/m Total hours
Peak season 20 30 1800
Mid season 20 25 2500
Lean season 18 20 1440
The annual capacity reaches some 20,111 Mt per year in terms of Full Fruit Bunch (FFB)
processed and some 27,601 Mt per year for the whole of the 3 sections. Details are given in the
Table 5, Appendix 4 gives further information.
Table 5: Average capacities for each season in JOM
Peak season Mid season Lean season Annual amount
CPO section (Mt/h)
6.344 2.846 1.095 -
PKO section (Mt/h)
0.257 0.161 0.062 -
SB section (Mt/h) 1.138 1.138 1.138 -
Total capacity (Mt/h)
7.740 4.146 2.295 -
Total hours 1,800 2,500 1,440 -
Capacity of CPO(Mt)
11,419 7,115 1,577 20,111
Overall capacity (Mt)
13,931 10,364 3,305 27,601
As far as the residues generated are concerned, if we assume in percentage of mass the
values got by Umilkason et al. (1997), that is to say 21% of Crude Palm Oil (CPO), 23 % of
Empty Fruit Bunch (EFB), 14.5 % fibre, 6.5 % of shell, 6.5 % of kernel per kg of Full Fruit
Bunch (FFB), we deduce 29.5 % for Palm Oil Mill Effluent (POME). In terms of volume this is
worth 0.525 m3 of POME per Mt of FFB, result got by Yeoh in 2004.
For the cake and filtered cake we have 55.8 % and 6.2 % respectively since the extraction rate in
SB section is around 38% and we assumed that filtered cake represents 10 % of the waste.
Based on these assumptions, the computations lead to the hourly production of by-products per
season. All the figures are recorded in Table 6.
Cogeneration and Energy Savings in a Food Processing Industry: Case of Juaben Oils Mills (Ghana)
Thesis written by Félicien D. BADOU/ 37th Promotion 2iE - June 2008
28
Table 6: Production of by-products per season
Residues Peak season Mid season Lean season
EFB (Mt/h) 1.459 0.655 0.252
Fibre (Mt/h) 0.920 0.413 0.159
Shell (Mt/h) 0.412 0.185 0.071
POME (m3/h) 3.331 1.494 0.575
POME (Mt/h) 0.430 0.193 0.074
Cake (Mt/h) 0.635 0.635 0.635
Filtered cake (Mt/h) 0.071 0.071 0.071
From Table 6 and base on the number of operating hours per season, the annual production of
each product is deduced. Figures are recorded in .Table 7.
Table 7: Annual production of by product in Juaben Oils Mills
Residues Peak season Mid season Lean season Annual production (Mt)
EFB (Mt) 2626.4 1636.5 362.7 4625.5
Fibre (Mt) 1655.8 1031.7 228.6 2916.1
Shell (Mt) 742.2 462.5 102.5 1307.2
POME (m3) 5995.1 3735.4 827.8 10558.3
POME (Mt) 774.8 482.8 107.0 1364.5
Cake (Mt) 1143.3 1588.0 914.7 3646.0
Filtered cake (Mt) 127.0 176.4 101.6 405.1
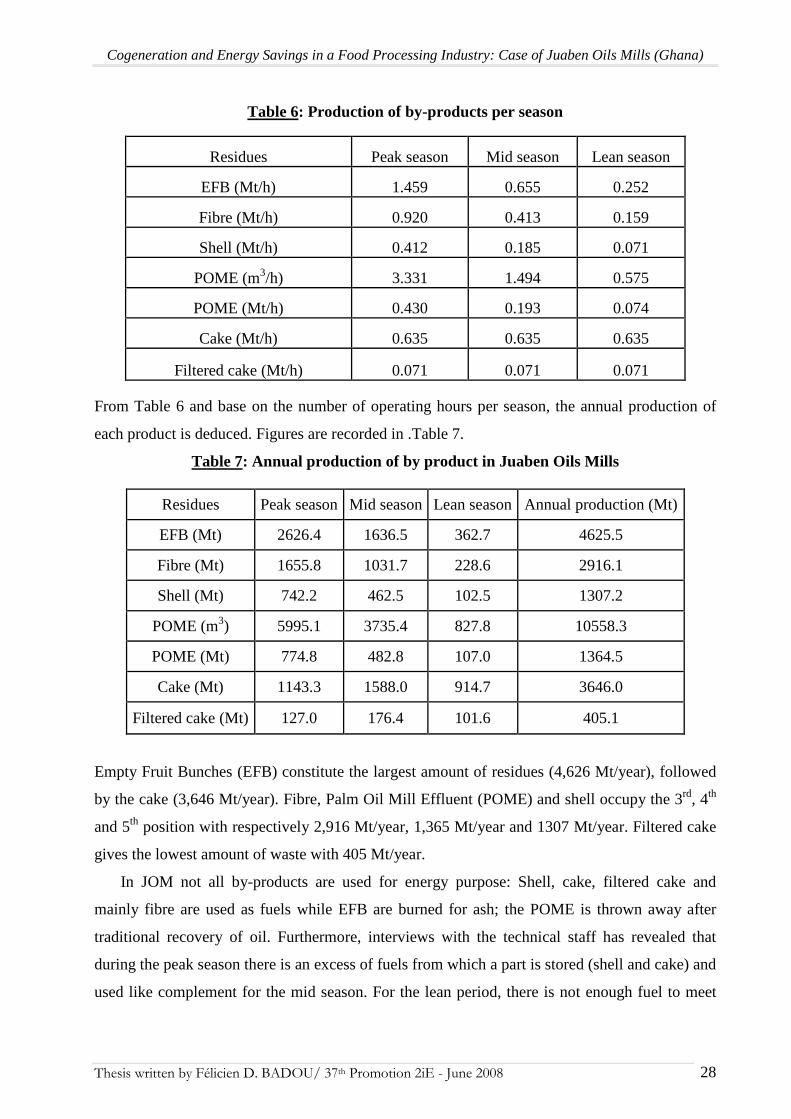
Empty Fruit Bunches (EFB) constitute the largest amount of residues (4,626 Mt/year), followed
by the cake (3,646 Mt/year). Fibre, Palm Oil Mill Effluent (POME) and shell occupy the 3rd, 4th
and 5th position with respectively 2,916 Mt/year, 1,365 Mt/year and 1307 Mt/year. Filtered cake
gives the lowest amount of waste with 405 Mt/year.
In JOM not all by-products are used for energy purpose: Shell, cake, filtered cake and
mainly fibre are used as fuels while EFB are burned for ash; the POME is thrown away after
traditional recovery of oil. Furthermore, interviews with the technical staff has revealed that
during the peak season there is an excess of fuels from which a part is stored (shell and cake) and
used like complement for the mid season. For the lean period, there is not enough fuel to meet
Cogeneration and Energy Savings in a Food Processing Industry: Case of Juaben Oils Mills (Ghana)
Thesis written by Félicien D. BADOU/ 37th Promotion 2iE - June 2008
29
the requirements. As a result, JOM is obliged to go either around the village or far from the mills
in order to buy some shells and fibres with traditional millers of palm oil
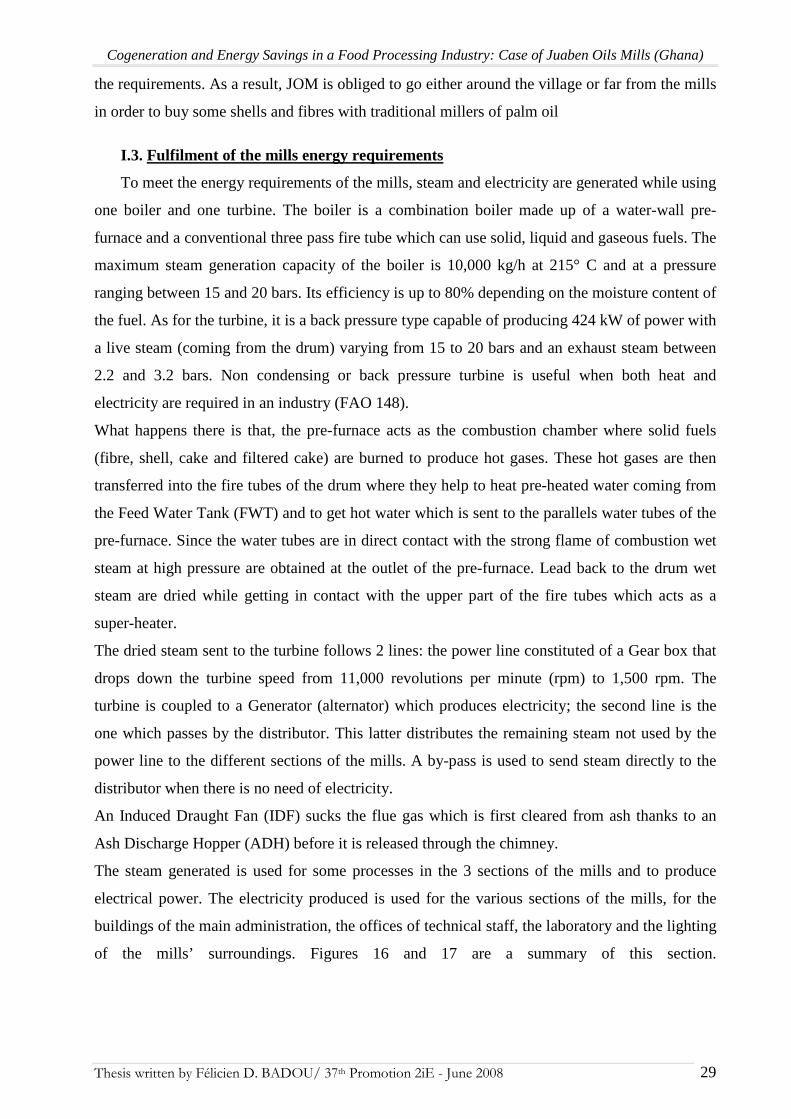
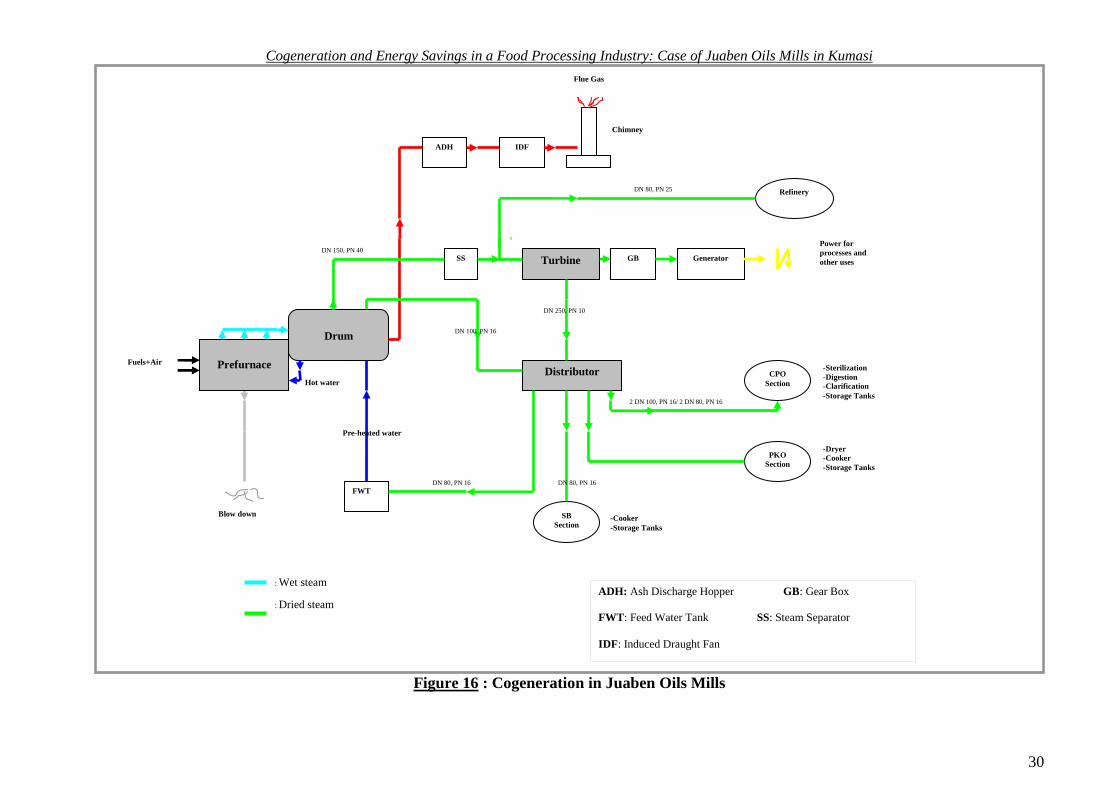
I.3. Fulfilment of the mills energy requirements
To meet the energy requirements of the mills, steam and electricity are generated while using
one boiler and one turbine. The boiler is a combination boiler made up of a water-wall pre-
furnace and a conventional three pass fire tube which can use solid, liquid and gaseous fuels. The
maximum steam generation capacity of the boiler is 10,000 kg/h at 215° C and at a pressure
ranging between 15 and 20 bars. Its efficiency is up to 80% depending on the moisture content of
the fuel. As for the turbine, it is a back pressure type capable of producing 424 kW of power with
a live steam (coming from the drum) varying from 15 to 20 bars and an exhaust steam between
2.2 and 3.2 bars. Non condensing or back pressure turbine is useful when both heat and
electricity are required in an industry (FAO 148).
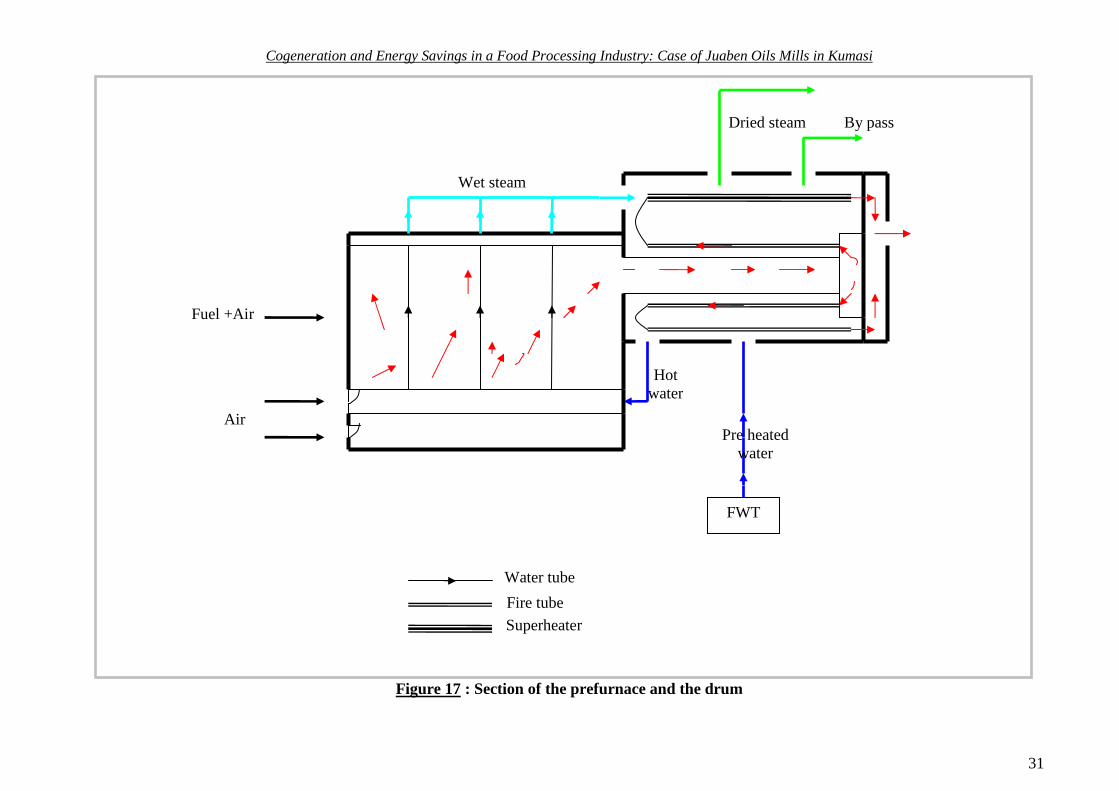
What happens there is that, the pre-furnace acts as the combustion chamber where solid fuels
(fibre, shell, cake and filtered cake) are burned to produce hot gases. These hot gases are then
transferred into the fire tubes of the drum where they help to heat pre-heated water coming from
the Feed Water Tank (FWT) and to get hot water which is sent to the parallels water tubes of the
pre-furnace. Since the water tubes are in direct contact with the strong flame of combustion wet
steam at high pressure are obtained at the outlet of the pre-furnace. Lead back to the drum wet
steam are dried while getting in contact with the upper part of the fire tubes which acts as a
super-heater.
The dried steam sent to the turbine follows 2 lines: the power line constituted of a Gear box that
drops down the turbine speed from 11,000 revolutions per minute (rpm) to 1,500 rpm. The
turbine is coupled to a Generator (alternator) which produces electricity; the second line is the
one which passes by the distributor. This latter distributes the remaining steam not used by the
power line to the different sections of the mills. A by-pass is used to send steam directly to the
distributor when there is no need of electricity.
An Induced Draught Fan (IDF) sucks the flue gas which is first cleared from ash thanks to an
Ash Discharge Hopper (ADH) before it is released through the chimney.
The steam generated is used for some processes in the 3 sections of the mills and to produce
electrical power. The electricity produced is used for the various sections of the mills, for the
buildings of the main administration, the offices of technical staff, the laboratory and the lighting
of the mills’ surroundings. Figures 16 and 17 are a summary of this section.
Cogeneration and Energy Savings in a Food Processing Industry: Case of Juaben Oils Mills in Kumasi
30
Figure 16 : Cogeneration in Juaben Oils Mills
Drum
FWT
ADH
Turbine GB Generator SS
IDF
Distributor
Refinery
CPO Section
SB Section
PKO Section
Prefurnace Fuels+Air
Blow down
Pre-heated water
Chimney
Power for processes and other uses
-Sterilization -Digestion -Clarification -Storage Tanks
-Dryer -Cooker -Storage Tanks
-Cooker -Storage Tanks
Flue Gas
DN 80, PN 25
Hot water
DN 150, PN 40
DN 100, PN 16
DN 80, PN 16 DN 80, PN 16
2 DN 100, PN 16/ 2 DN 80, PN 16
DN 250, PN 10
: Wet steam
: Dried steam
ADH: Ash Discharge Hopper GB: Gear Box FWT : Feed Water Tank SS: Steam Separator IDF : Induced Draught Fan
Cogeneration and Energy Savings in a Food Processing Industry: Case of Juaben Oils Mills in Kumasi
31
Figure 17 : Section of the prefurnace and the drum
FWT
Pre heated water
Hot water
Fuel +Air
Air
Dried steam By pass
Wet steam
Superheater
Water tube
Fire tube
Cogeneration and Energy Savings in a Food Processing Industry: Case of Juaben Oils Mills (Ghana)
Thesis written by Félicien D. BADOU/ 37th Promotion 2iE - June 2008 32
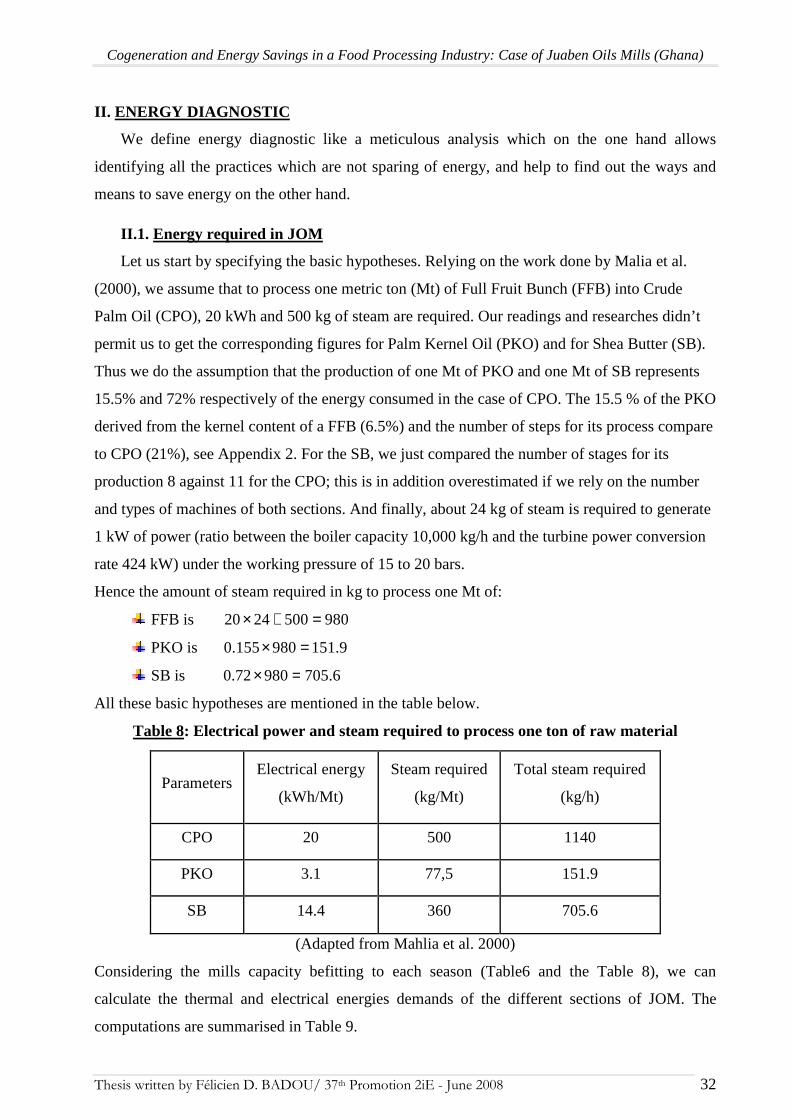
II. ENERGY DIAGNOSTIC
We define energy diagnostic like a meticulous analysis which on the one hand allows
identifying all the practices which are not sparing of energy, and help to find out the ways and
means to save energy on the other hand.
II.1. Energy required in JOM
Let us start by specifying the basic hypotheses. Relying on the work done by Malia et al.
(2000), we assume that to process one metric ton (Mt) of Full Fruit Bunch (FFB) into Crude
Palm Oil (CPO), 20 kWh and 500 kg of steam are required. Our readings and researches didn’t
permit us to get the corresponding figures for Palm Kernel Oil (PKO) and for Shea Butter (SB).
Thus we do the assumption that the production of one Mt of PKO and one Mt of SB represents
15.5% and 72% respectively of the energy consumed in the case of CPO. The 15.5 % of the PKO
derived from the kernel content of a FFB (6.5%) and the number of steps for its process compare
to CPO (21%), see Appendix 2. For the SB, we just compared the number of stages for its
production 8 against 11 for the CPO; this is in addition overestimated if we rely on the number
and types of machines of both sections. And finally, about 24 kg of steam is required to generate
1 kW of power (ratio between the boiler capacity 10,000 kg/h and the turbine power conversion
rate 424 kW) under the working pressure of 15 to 20 bars.
Hence the amount of steam required in kg to process one Mt of:
FFB is 9805002420 =+×
PKO is 151.99800.155 =×
SB is 705.69800.72 =×
All these basic hypotheses are mentioned in the table below.
Table 8: Electrical power and steam required to process one ton of raw material
Parameters Electrical energy
(kWh/Mt)
Steam required
(kg/Mt)
Total steam required
(kg/h)
CPO 20 500 1140
PKO 3.1 77,5 151.9
SB 14.4 360 705.6
(Adapted from Mahlia et al. 2000)
Considering the mills capacity befitting to each season (Table6 and the Table 8), we can
calculate the thermal and electrical energies demands of the different sections of JOM. The
computations are summarised in Table 9.

Cogeneration and Energy Savings in a Food Processing Industry: Case of Juaben Oils Mills (Ghana)
Thesis written by Félicien D. BADOU/ 37th Promotion 2iE - June 2008 33
Table 9: Seasonal requirements in steam, power and total energy for each section
Peak season Mid season Lean season
Power (kW) Steam (kg/h) Power (kW) Steam (kg/h) Power (kW) Steam (kg/h)
CPO 126.9 3,171,9 56.9 1,422,9 21.9 547.5
PKO 0.8 19.9 0.5 12.5 0.2 4.8
SB 16.4 409.8 16.4 409.8 16.4 409.8
Total 144.1 3,601,6 73.8 1,845,2 38.5 962.1
Total steam (kg/h) 7,059,2 3,616,5 1,885,7
Total energy (GJ/h) 18.3 9.4 4.9
The total energy (electrical and thermal) in Table 9 is computed with the following formula:
required steam total2,590J/h)required(kEnergy ×=
It is assumed that 2,590 kJ of energy is needed in order to generate 1 kg of steam (Mahlia, 2000).
Figure 18 shows the energy requirement per season.
02468
101214161820
En
erg
y re
qu
ired
(G
J/h
)
Peak season Mid season Lean season
Season
Seasonal energy requirement
Figure 18: Seasonal energy requirement As a result, 18.3 GJ/h are necessary for the peak season while the mid and lean seasons required
9.4 GJ/h and 4.9 GJ/h respectively.
The following table gives information about the annual requirements of energy.
Cogeneration and Energy Savings in a Food Processing Industry: Case of Juaben Oils Mills (Ghana)
Thesis written by Félicien D. BADOU/ 37th Promotion 2iE - June 2008 34
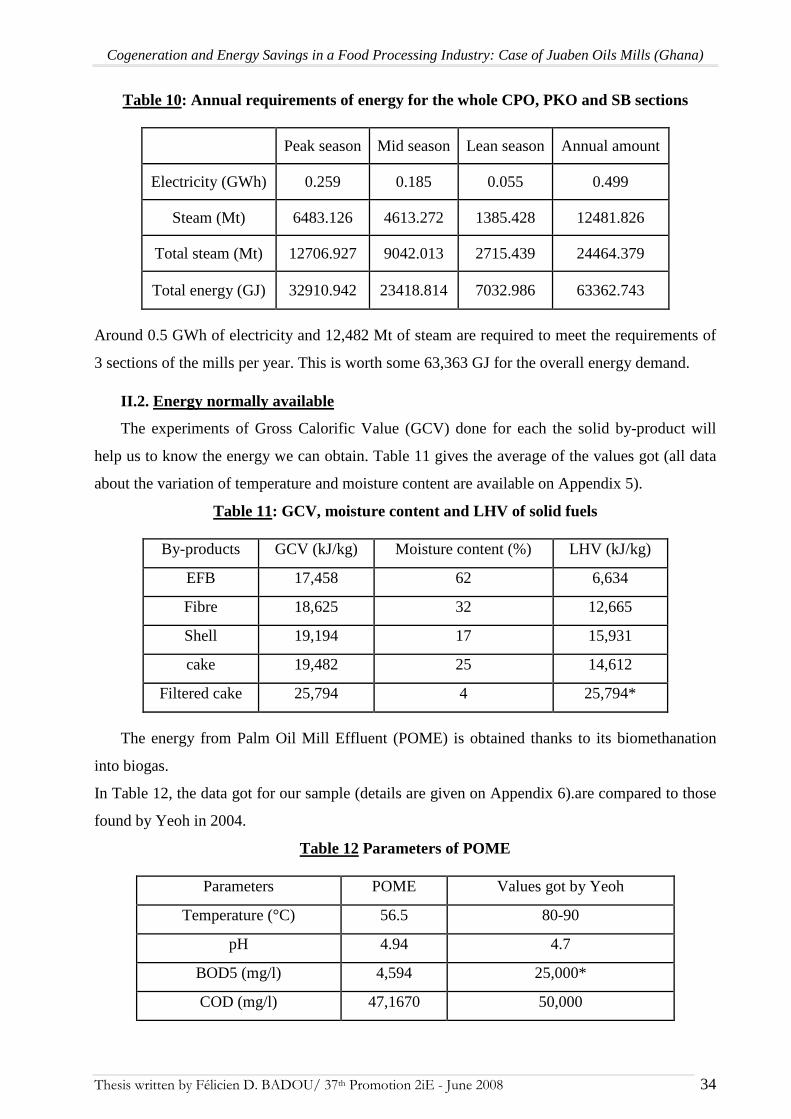
Table 10: Annual requirements of energy for the whole CPO, PKO and SB sections
Peak season Mid season Lean season Annual amount
Electricity (GWh) 0.259 0.185 0.055 0.499
Steam (Mt) 6483.126 4613.272 1385.428 12481.826
Total steam (Mt) 12706.927 9042.013 2715.439 24464.379
Total energy (GJ) 32910.942 23418.814 7032.986 63362.743
Around 0.5 GWh of electricity and 12,482 Mt of steam are required to meet the requirements of
3 sections of the mills per year. This is worth some 63,363 GJ for the overall energy demand.
II.2. Energy normally available
The experiments of Gross Calorific Value (GCV) done for each the solid by-product will
help us to know the energy we can obtain. Table 11 gives the average of the values got (all data
about the variation of temperature and moisture content are available on Appendix 5).
Table 11: GCV, moisture content and LHV of solid fuels
By-products GCV (kJ/kg) Moisture content (%) LHV (kJ/kg)
EFB 17,458 62 6,634
Fibre 18,625 32 12,665
Shell 19,194 17 15,931
cake 19,482 25 14,612
Filtered cake 25,794 4 25,794*
The energy from Palm Oil Mill Effluent (POME) is obtained thanks to its biomethanation
into biogas.
In Table 12, the data got for our sample (details are given on Appendix 6).are compared to those
found by Yeoh in 2004.
Table 12 Parameters of POME
Parameters POME Values got by Yeoh
Temperature (°C) 56.5 80-90
pH 4.94 4.7
BOD5 (mg/l) 4,594 25,000*
COD (mg/l) 47,1670 50,000
Cogeneration and Energy Savings in a Food Processing Industry: Case of Juaben Oils Mills (Ghana)
Thesis written by Félicien D. BADOU/ 37th Promotion 2iE - June 2008 35
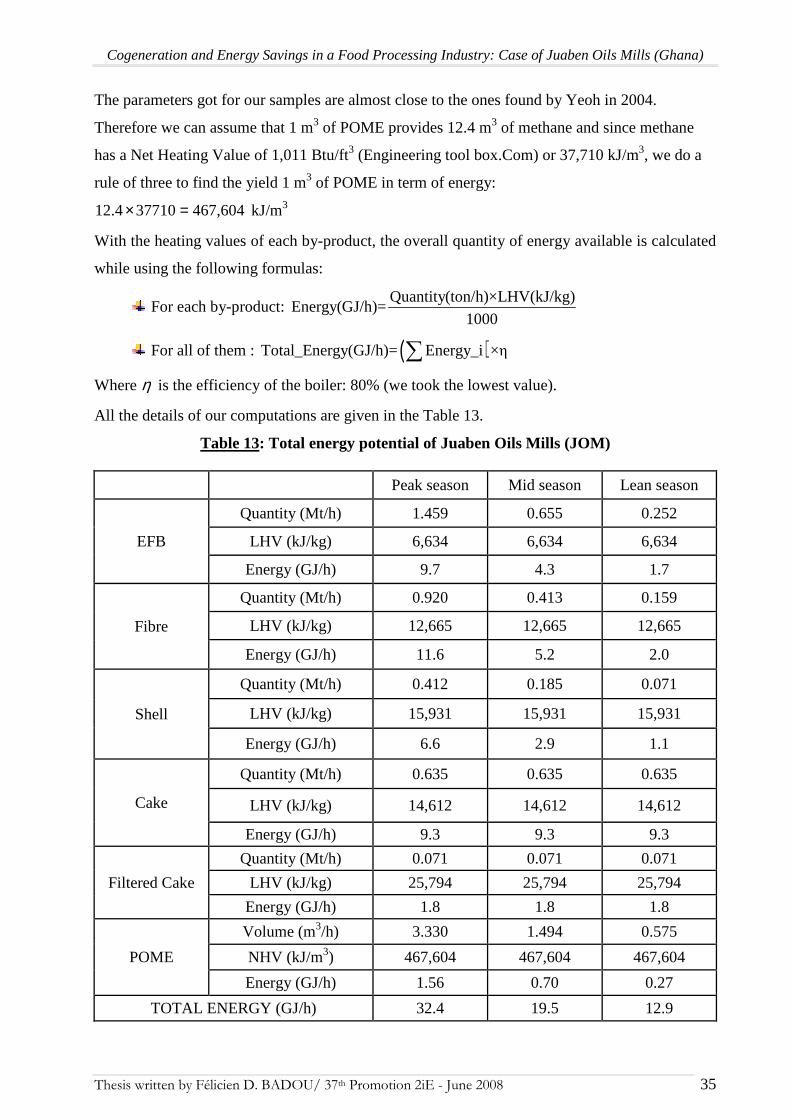
The parameters got for our samples are almost close to the ones found by Yeoh in 2004.
Therefore we can assume that 1 m3 of POME provides 12.4 m3 of methane and since methane
has a Net Heating Value of 1,011 Btu/ft3 (Engineering tool box.Com) or 37,710 kJ/m3, we do a
rule of three to find the yield 1 m3 of POME in term of energy:
467,6043771012.4 =× kJ/m3
With the heating values of each by-product, the overall quantity of energy available is calculated
while using the following formulas:
For each by-product: Quantity(ton/h)×LHV(kJ/kg)
Energy(GJ/h)=1000
For all of them : ( )Total_Energy(GJ/h)= Energy_i ×η∑
Where η is the efficiency of the boiler: 80% (we took the lowest value).
All the details of our computations are given in the Table 13.
Table 13: Total energy potential of Juaben Oils Mills (JOM)
Peak season Mid season Lean season
EFB
Quantity (Mt/h) 1.459 0.655 0.252
LHV (kJ/kg) 6,634 6,634 6,634
Energy (GJ/h) 9.7 4.3 1.7
Fibre
Quantity (Mt/h) 0.920 0.413 0.159
LHV (kJ/kg) 12,665 12,665 12,665
Energy (GJ/h) 11.6 5.2 2.0
Shell
Quantity (Mt/h) 0.412 0.185 0.071
LHV (kJ/kg) 15,931 15,931 15,931
Energy (GJ/h) 6.6 2.9 1.1
Cake
Quantity (Mt/h) 0.635 0.635 0.635
LHV (kJ/kg) 14,612 14,612 14,612
Energy (GJ/h) 9.3 9.3 9.3
Filtered Cake
Quantity (Mt/h) 0.071 0.071 0.071
LHV (kJ/kg) 25,794 25,794 25,794
Energy (GJ/h) 1.8 1.8 1.8
POME
Volume (m3/h) 3.330 1.494 0.575
NHV (kJ/m3) 467,604 467,604 467,604
Energy (GJ/h) 1.56 0.70 0.27
TOTAL ENERGY (GJ/h) 32.4 19.5 12.9
Cogeneration and Energy Savings in a Food Processing Industry: Case of Juaben Oils Mills (Ghana)
Thesis written by Félicien D. BADOU/ 37th Promotion 2iE - June 2008 36
This table clearly shows that the energy potential of JOM for the peak season is 32.4 GJ/h, 19.5
GJ/h and 12.9 GJ/h for both mid season and lean season.
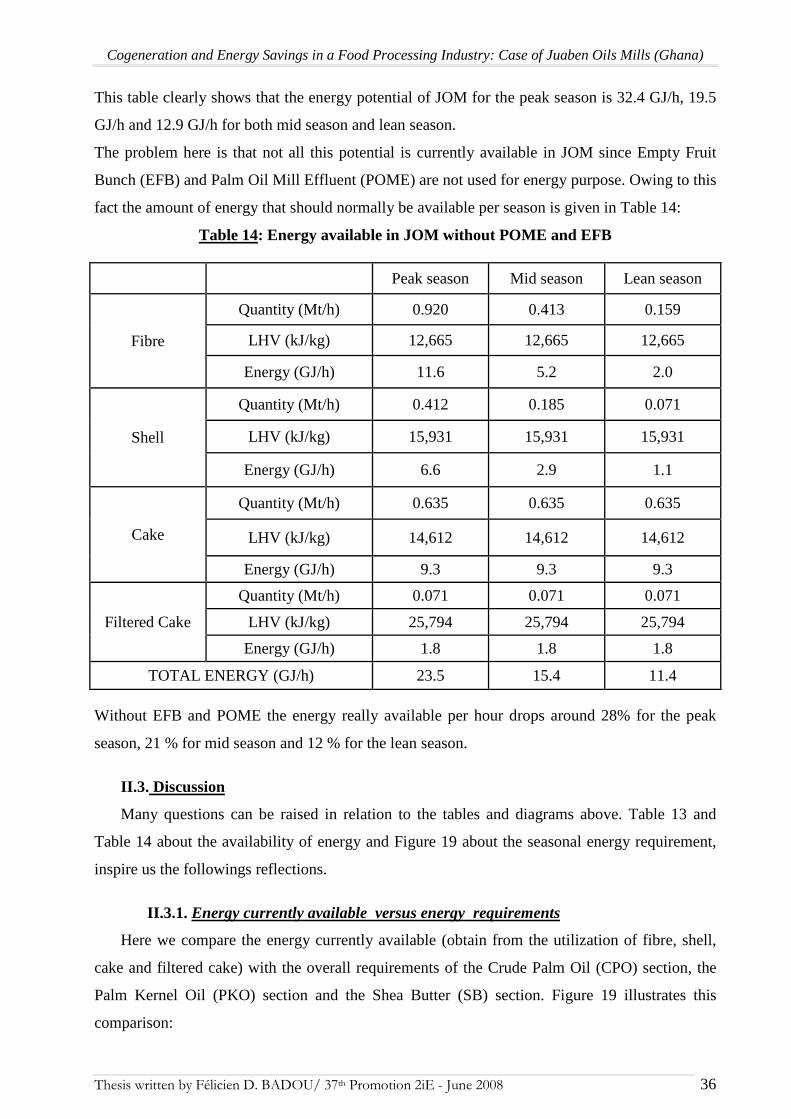
The problem here is that not all this potential is currently available in JOM since Empty Fruit
Bunch (EFB) and Palm Oil Mill Effluent (POME) are not used for energy purpose. Owing to this
fact the amount of energy that should normally be available per season is given in Table 14:
Table 14: Energy available in JOM without POME and EFB
Peak season Mid season Lean season
Fibre
Quantity (Mt/h) 0.920 0.413 0.159
LHV (kJ/kg) 12,665 12,665 12,665
Energy (GJ/h) 11.6 5.2 2.0
Shell
Quantity (Mt/h) 0.412 0.185 0.071
LHV (kJ/kg) 15,931 15,931 15,931
Energy (GJ/h) 6.6 2.9 1.1
Cake
Quantity (Mt/h) 0.635 0.635 0.635
LHV (kJ/kg) 14,612 14,612 14,612
Energy (GJ/h) 9.3 9.3 9.3
Filtered Cake
Quantity (Mt/h) 0.071 0.071 0.071
LHV (kJ/kg) 25,794 25,794 25,794
Energy (GJ/h) 1.8 1.8 1.8
TOTAL ENERGY (GJ/h) 23.5 15.4 11.4 Without EFB and POME the energy really available per hour drops around 28% for the peak
season, 21 % for mid season and 12 % for the lean season.
II.3. Discussion
Many questions can be raised in relation to the tables and diagrams above. Table 13 and
Table 14 about the availability of energy and Figure 19 about the seasonal energy requirement,
inspire us the followings reflections.
II.3.1. Energy currently available versus energy requirements
Here we compare the energy currently available (obtain from the utilization of fibre, shell,
cake and filtered cake) with the overall requirements of the Crude Palm Oil (CPO) section, the
Palm Kernel Oil (PKO) section and the Shea Butter (SB) section. Figure 19 illustrates this
comparison:
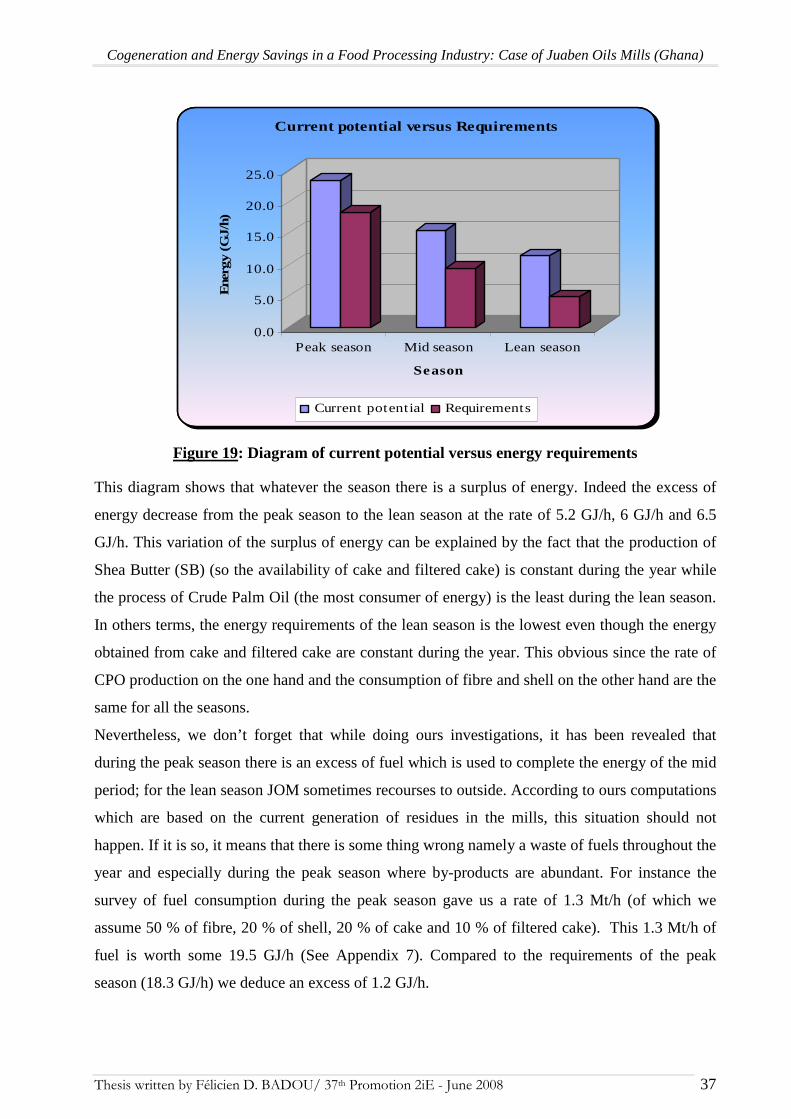
Cogeneration and Energy Savings in a Food Processing Industry: Case of Juaben Oils Mills (Ghana)
Thesis written by Félicien D. BADOU/ 37th Promotion 2iE - June 2008 37
0.0
5.0
10.0
15.0
20.0
25.0
Ene
rgy
(GJ/
h)
Peak season Mid season Lean season
Season
Current potential versus Requirements
Current potential Requirements
Figure 19: Diagram of current potential versus energy requirements
This diagram shows that whatever the season there is a surplus of energy. Indeed the excess of
energy decrease from the peak season to the lean season at the rate of 5.2 GJ/h, 6 GJ/h and 6.5
GJ/h. This variation of the surplus of energy can be explained by the fact that the production of
Shea Butter (SB) (so the availability of cake and filtered cake) is constant during the year while
the process of Crude Palm Oil (the most consumer of energy) is the least during the lean season.
In others terms, the energy requirements of the lean season is the lowest even though the energy
obtained from cake and filtered cake are constant during the year. This obvious since the rate of
CPO production on the one hand and the consumption of fibre and shell on the other hand are the
same for all the seasons.
Nevertheless, we don’t forget that while doing ours investigations, it has been revealed that
during the peak season there is an excess of fuel which is used to complete the energy of the mid
period; for the lean season JOM sometimes recourses to outside. According to ours computations
which are based on the current generation of residues in the mills, this situation should not
happen. If it is so, it means that there is some thing wrong namely a waste of fuels throughout the
year and especially during the peak season where by-products are abundant. For instance the
survey of fuel consumption during the peak season gave us a rate of 1.3 Mt/h (of which we
assume 50 % of fibre, 20 % of shell, 20 % of cake and 10 % of filtered cake). This 1.3 Mt/h of
fuel is worth some 19.5 GJ/h (See Appendix 7). Compared to the requirements of the peak
season (18.3 GJ/h) we deduce an excess of 1.2 GJ/h.

Cogeneration and Energy Savings in a Food Processing Industry: Case of Juaben Oils Mills (Ghana)
Thesis written by Félicien D. BADOU/ 37th Promotion 2iE - June 2008 38
We humbly thing that it will be interesting to apply this African proverb: “When it is raining in
your home today, reserve some rains water that you will use when the drought will occur”.
There is one difficulty, we can on the other hand recognize. It is about the non continuous
availability of by-products during the lean season due to the drop in Crude Palm Oil (CPO)
production even though the boiler needs to be fed up continuously. But this difficulty can be
overcome either if we manage very well the excess of fuel of the peak season and use a part for
the lean season or if we use a part of the energy extracted from the Empty Fruit Bunch (EFB)
and the Palm Oil Mill Effluent (POME). This latter case is elucidated in the coming paragraph.
What is important to notice here is that throughout the whole year there is an excess of energy.
The table below gives the amount of electricity that can generated solely with the surplus of
energy got after meeting the total requirements of all the processes: some 3.75 GWh.
Table 15: Electricity production with the excess of energy
Seasons Total hours Hourly excess (GJ/h) Energy per season (GJ) Electricity (GWh)
Peak season 1800 5.2 9,360 1.04
Mid season 2500 6 15,000 1.67
Lean season 1440 6.5 9,360 1.04
Total electricity production (GWh/year) 3.75
The hourly excess has been calculated while timing the boiler efficiency (80%) by the difference
of energy between the requirements and the energy available. We took an efficiency of 40 % for
the turbine that is to say for the conversion into electricity.
In all the previous calculations, we did not take into account the electric consumptions for
other purpose i.e. buildings of the main administration, offices of the technical staff, the
laboratory and the lighting of the different sections, of the mills yard and its surroundings.
During the study, we needed the electrical consumption for other purpose in order to deduce the
real amount of electricity we can save only while improving the current practices in the mills;
but we did not find it. Therefore, if we assume that 60 % of the electrical production of the mills
is consumed for the others purposes (equivalent to 2.25 GWh per year), we save some 1.5 GWh
per year. In others terms, this means that just with an optimization of the current practice of the
mills 1.5 GWh of electricity can be saved per year.
Now let’s deal with the amount of electricity we can save if we include EFB and the POME.

Cogeneration and Energy Savings in a Food Processing Industry: Case of Juaben Oils Mills (Ghana)
Thesis written by Félicien D. BADOU/ 37th Promotion 2iE - June 2008 39
II.3.2. Taking into account the energy derived from EFB and POME
As stated previously, in JOM Empty Fruit Bunch (EFB) and Palm Oil Mill Effluent (POME)
are not used for energy purpose. The following lines show how in the contrary it is beneficial to
use them to generate electricity.
From Table 13 where an overall energy balance of all the by-products has been done, we extract
the part of the EFB and the POME; this gives us: 8.9 GJ/h for the peak season, 4.1 GJ/h for the
mid season and 1.5 GJ/h for the lean season. The amount of electricity we can obtain is recorded
in Table 16.
Table 16: Electricity production with energy from EFB and POME
Periods Total hours Hourly energy (GJ/h) Energy per season (GJ) Electricity (GWh)
Peak season 1800 8.9 16,020 1.78
Mid season 2500 4.1 10,250 1.14
Lean season 1440 1.5 2,160 0.24
Total electricity production (GWh/year) 3.17
The utilization of EFB and POME for energy purpose by cogeneration will help to produce some
3.17 GWh of electricity per year. To find out the hourly energy, we time the initial energy value
of EFB plus POME befitting to each season by the boiler efficiency (80%). We assumed 40 % as
the efficiency of the turbine.
Nowadays, everywhere people claim sustainable development. We should not only reason at the
individual scale, we need to fit into our immediate environment. When we know that in Kumasi
high power demand leads to frequent blackout and that in Juaben Oils Mills at about 40
kilometres away there is a real potential for generating electricity thanks to cogeneration, we are
in hurry that this become a reality. In addition this will be economically profitable for the JOM
through the sale of the surplus of electricity generated to Electricity Company Ghana (ECG). It
will also be of social benefit to the population of Kumasi.

Cogeneration and Energy Savings in a Food Processing Industry: Case of Juaben Oils Mills (Ghana)
Thesis written by Félicien D. BADOU/ 37th Promotion 2iE - June 2008 40
Chapter VI : SUGGESTIONS What is considered useless by one person is sometimes thought as useful by another person.
This can be applied to palm oil by-products. In palm oil industry “very little attempt is made to
save energy” (Dam, 2004) because of the large amount of by-products which even used
inefficiently help to meet the requirements of the mills. Fibres and shells are wasted while Empty
Fruit Bunch (EFB) and Palm Oil Mill Effluent (POME) are not used for energy purpose.
In this part we propose some ways for the optimization and valorisation of the by-products
studied.
I. FIBRE, SHELL, CAKE AND FILTERED CAKE
In order to reach rapidly the pressure required (between 15 and 20 bars) the furnace is often
overloaded either by the fibres transferred from the Crude Palm Oil (CPO) section or the shell,
cake and filtered cake filled in the conveyor. This happens because there is no specific
instruction on the utilization rate of the fuel that is to say a .precise quantity of fuels to use per
hour according to the activity of the mills. Base only on the variations of pressure (15 to 20 bars)
for loading the furnace can lead to enormous loss of fuels.
One other thing is that the quantity of air in Juaben Oil Mills (JOM) is less than the air of
combustion required. This latter is defined like the sum of the extra air added to the theoretical
air, minimum quantity of air for a complete combustion. If we consider the air fuel ratio got by
Malia et al. (2000) i.e. 8.039, this lead to a requirement of 4.6 kg/s of air for the peak season, 2.9
for the mid season and 2.1 for the lean season. In JOM the calculations of air flow have given 1.6
kg/s for the peak and mid seasons and 1.1 kg/s for the lean seasons (see Appendix 8). These
figures are almost 2 times less than the ones necessary.
The information aforementioned but also the presence of pure combustible in the refuses, the un-
burnt matters of the products of combustion and sometimes the black dark colour of flue gas,
show that there is incomplete combustion.
A good load of furnace based on the amount of fuel really needed per period while taking into
account the air fuel ratio can help to save fuels. Instructions based on the figures found in this
study can be given for the loading of the boiler.
Another solution is to automate the loading of the boiler so that according to the season and the
activities of the mills only the exact amount of fuels required will be sent automatically to the
furnace.
.
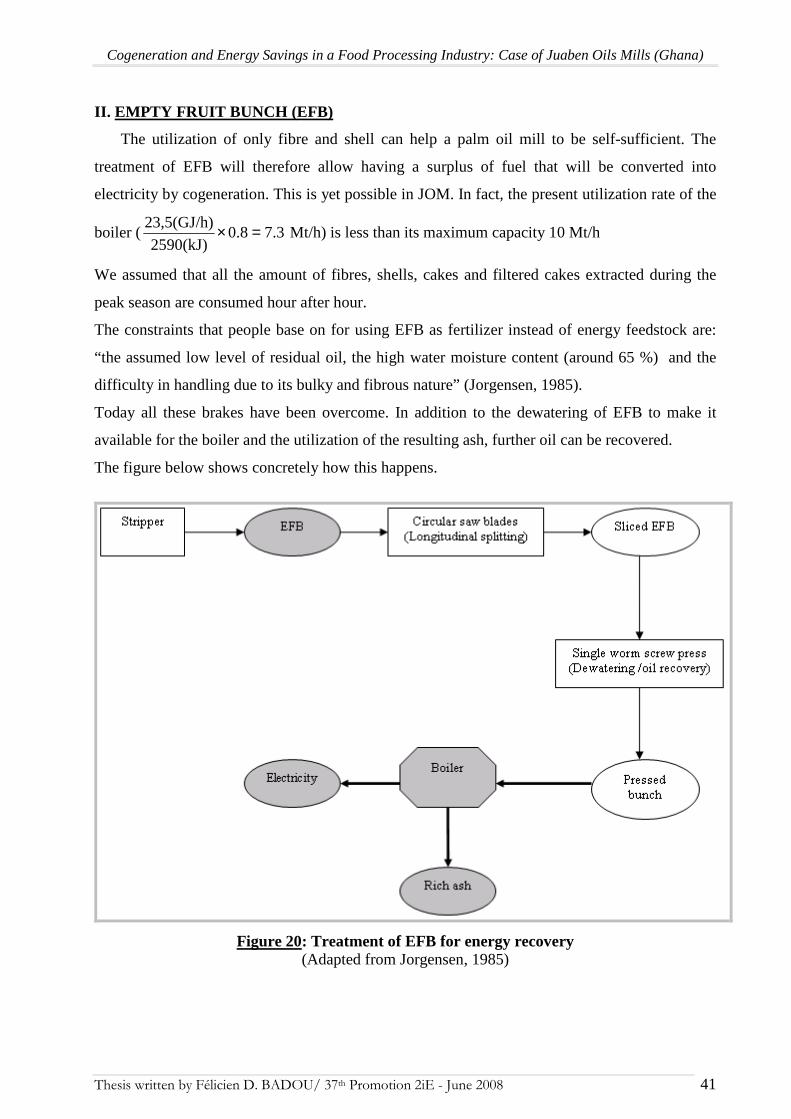
Cogeneration and Energy Savings in a Food Processing Industry: Case of Juaben Oils Mills (Ghana)
Thesis written by Félicien D. BADOU/ 37th Promotion 2iE - June 2008 41
II. EMPTY FRUIT BUNCH (EFB)
The utilization of only fibre and shell can help a palm oil mill to be self-sufficient. The
treatment of EFB will therefore allow having a surplus of fuel that will be converted into
electricity by cogeneration. This is yet possible in JOM. In fact, the present utilization rate of the
boiler ( 7.30.82590(kJ)
23,5(GJ/h) =× Mt/h) is less than its maximum capacity 10 Mt/h
We assumed that all the amount of fibres, shells, cakes and filtered cakes extracted during the
peak season are consumed hour after hour.
The constraints that people base on for using EFB as fertilizer instead of energy feedstock are:
“the assumed low level of residual oil, the high water moisture content (around 65 %) and the
difficulty in handling due to its bulky and fibrous nature” (Jorgensen, 1985).
Today all these brakes have been overcome. In addition to the dewatering of EFB to make it
available for the boiler and the utilization of the resulting ash, further oil can be recovered.
The figure below shows concretely how this happens.
Figure 20: Treatment of EFB for energy recovery (Adapted from Jorgensen, 1985)
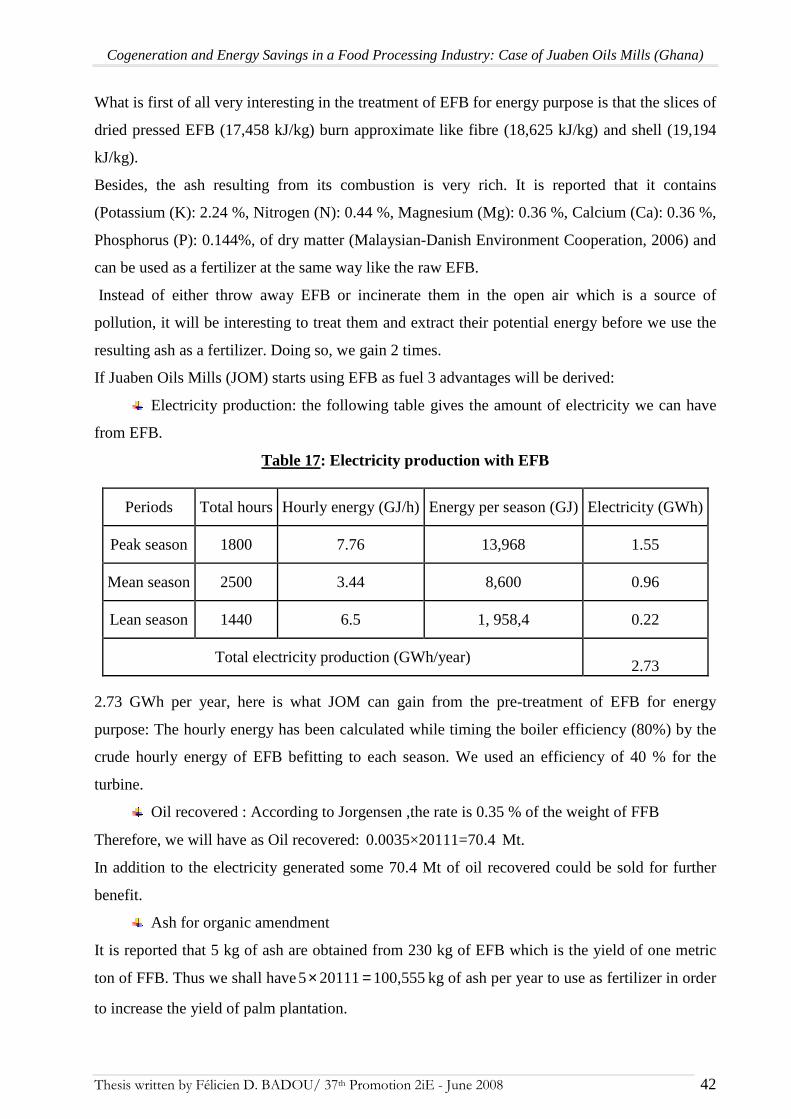
Cogeneration and Energy Savings in a Food Processing Industry: Case of Juaben Oils Mills (Ghana)
Thesis written by Félicien D. BADOU/ 37th Promotion 2iE - June 2008 42
What is first of all very interesting in the treatment of EFB for energy purpose is that the slices of
dried pressed EFB (17,458 kJ/kg) burn approximate like fibre (18,625 kJ/kg) and shell (19,194
kJ/kg).
Besides, the ash resulting from its combustion is very rich. It is reported that it contains
(Potassium (K): 2.24 %, Nitrogen (N): 0.44 %, Magnesium (Mg): 0.36 %, Calcium (Ca): 0.36 %,
Phosphorus (P): 0.144%, of dry matter (Malaysian-Danish Environment Cooperation, 2006) and
can be used as a fertilizer at the same way like the raw EFB.
Instead of either throw away EFB or incinerate them in the open air which is a source of
pollution, it will be interesting to treat them and extract their potential energy before we use the
resulting ash as a fertilizer. Doing so, we gain 2 times.
If Juaben Oils Mills (JOM) starts using EFB as fuel 3 advantages will be derived:
Electricity production: the following table gives the amount of electricity we can have
from EFB.
Table 17: Electricity production with EFB
Periods Total hours Hourly energy (GJ/h) Energy per season (GJ) Electricity (GWh)
Peak season 1800 7.76 13,968 1.55
Mean season 2500 3.44 8,600 0.96
Lean season 1440 6.5 1, 958,4 0.22
Total electricity production (GWh/year) 2.73
2.73 GWh per year, here is what JOM can gain from the pre-treatment of EFB for energy
purpose: The hourly energy has been calculated while timing the boiler efficiency (80%) by the
crude hourly energy of EFB befitting to each season. We used an efficiency of 40 % for the
turbine.
Oil recovered : According to Jorgensen ,the rate is 0.35 % of the weight of FFB
Therefore, we will have as Oil recovered: 0.0035×20111=70.4 Mt.
In addition to the electricity generated some 70.4 Mt of oil recovered could be sold for further
benefit.
Ash for organic amendment
It is reported that 5 kg of ash are obtained from 230 kg of EFB which is the yield of one metric
ton of FFB. Thus we shall have 100,555201115 =× kg of ash per year to use as fertilizer in order
to increase the yield of palm plantation.

Cogeneration and Energy Savings in a Food Processing Industry: Case of Juaben Oils Mills (Ghana)
Thesis written by Félicien D. BADOU/ 37th Promotion 2iE - June 2008 43
On an economical point of view, owing to a lack of time, we didn’t have the prices which prevail
on the Ghanaian market to do an economical analysis. Yet, Jorgensen in 1985 showed that the
total cost (investment cost to buy single screw press and bunch splitter inclusive installation cost
plus the operational cost) can be covered only in one year with the income from the sale of oil
recovered and from the money save for steam production with EFB instead of petrol.
III. PALM OIL MILL EFFLUENT (POME)
In the majority of the palm oil mills, the effluents got from the process of CPO are either
directly discharged or partially treated through lagoon system before their discharge in the
nature. Millers for economical reasons or by ignorance limit themselves to the system of pond
treatment in order to meet the environmental instructions in force (Yeoh, 2004). In either case,
this constitutes a great source of aquatic and atmospheric pollution (Yeoh, 2004) but also a
source of land deterioration (FAO 148). Fortunately thanks to biomethanation, POME can be
transformed into methane. Methane then can be used like the previous solid fuels to generate
steam and power. And the remaining liquid from POME can act as fertilizer. The extraction of
biogas has a high yield (65%) under thermophilic condition (Yeoh, 2004). This latter condition is
easily obtainable in our case since the average of temperature of POME is 56.5 °C.
There are 2 stages in biomethanation of POME: an anaerobic digestion in a closed-tank
bioreactor and the recovery of biogas. See Figure 21.
Figure 21: Treatment of POME for energy recovery (Adapted from Yeoh, 2004)

Cogeneration and Energy Savings in a Food Processing Industry: Case of Juaben Oils Mills (Ghana)
Thesis written by Félicien D. BADOU/ 37th Promotion 2iE - June 2008 44
What we can suggest to JOM is to produce the maximum of methane during the peak season
(continue also during the others seasons) which will be stored. During the lean season the
methane stored will be used to generate steam (with the same boiler since its grate is adaptable
and can use a gaseous fuel) which will be transferred to the turbine for electricity production.
For that if we rely on the work done by Yeoh in 2004, we will need the following facilities:
Size of anaerobic reactor (we took figures of peak season, the most constraining):
time(d)Retention_FFB)_(m3/Mt _ratePOMEFFB/h)_(Mt_hour/day)(Operating(m3)Reactor ×××=
466.370.5256.34420Reactor =×××= m3
Storage vessels size:
∑××= )FFB/period_(MtE)(m3/m3_POM eBiogas_ratFFB)_(m3/Mt Pome_rate(m3) Vessel
68,628,820,1116.50.525 Vessel =××= m3
For JOM an anaerobic reactor of 500 m3 and storage vessels of 69,000 m3 will be necessary.
The production of electricity that we could obtain from POME is mentioned in Table 18.
Table 18: Electricity production with POME
Periods Total hours Hourly energy (GJ/h) Energy per season (GJ) Electricity (GWh)
Peak season 1,800 1.25 2,250 0.25
Mean season 2,500 0.56 1,400 0.16
Lean season 1,440 0.22 316,8 0.04
Total electricity production (GWh/year) 0.44
With the anaerobic digestion of POME for the extraction of methane instead of discharge it in
the nature some 0.44 GWh could be generated. The computations have been done exactly like
for the EFB.
Furthermore, the liquid from the anaerobic reaction, owing to its nutrient value can help to water
the farms during the dry season and enhance very significantly the yield of palm trees from 10%
to 23 % according to Yeoh (2004).
The 10,558.30.52520,111 =× m3 of POME treated could be used to water
31.5210,0000.067
10,558.3 =××
hectares of palm trees, assuming that the watering will occurs for 6

Cogeneration and Energy Savings in a Food Processing Industry: Case of Juaben Oils Mills (Ghana)
Thesis written by Félicien D. BADOU/ 37th Promotion 2iE - June 2008 45
months per year since in Ghana there are 6 rainy months. We used an application rain equivalent
of 6.7 cm per year (Yeoh, 2004).
The time assigns to our work doesn’t allow us to do a cost benefit analysis based on current
prices of facilities in Ghana. However the study done by Yeoh in 2004 on the utilization of
POME under the temperature of 55°C for heat generation (in our case steam for the turbine) and
land application gives a pay back period of 1.5 year. This means that in less than 2 years the
money invested will be recovered and the period of maximum benefit will start.
Partial summary
From the section “Energetic Diagnostic” and the chapter “Suggestions”, it is noted that, that
only with an optimal utilization of the fibre, shell, cake and filtered cake some 1.5 GWh could be
saved. If furthermore EFB and POME are pre-treated, then used for energy purpose we could get
2.73 GWh and 0.44 GWh per year respectively. In addition to the fact that this electric
production could be sold to Electricity Company of Ghana (ECG), from EFB 100.6 Mt of ash
and 70.4 Mt of residual oil can be extracted while the digested liquor from POME can act as
fertilizer to enhance the yield of more 30 hectares of palm oil plantation.
Cogeneration and Energy Savings in a Food Processing Industry: Case of Juaben Oils Mills (Ghana)
Thesis written by Félicien D. BADOU/ 37th Promotion 2iE - June 2008 46
CONCLUSION AND RECOMMENDATIONS
This study has reviewed deeply how with cogeneration, heat and power can be produced
from the waste of Juaben Oils Mills (JOM) namely fibres, shells, cakes, filtered cake, EFB and
POME. With the energy generated, it is first possible to meet very largely the energy
requirements of the mill (some 2.75 GWh and 24,464 Mt of steam per year) and then use the
excess to produce especially electricity that will be sold to Electricity Company of Ghana (ECG).
Indeed, an efficient utilization of the 8,274 metric ton of residues currently combusted per
year in the mill (fibre, shell, cake and filtered cake) that is to say the harmonization of the
amount of fuel required per hour with the quantity of air of combustion will insure the energy
self sufficiency of the mills and help to save some 1.5 GWh per year.
In addition with the 4,626 metric ton (Mt) of Empty Fruit Bunch (EFB) extracted from the
20,111 Mt of Full Fruit Bunch (FFB) processed per year some 2.73 GWh could be generated if
the mill consents to pre-treat them by splitting and dewatering. This option will also allow
having some 100.6 Mt of ash for land application and 70.4 Mt of residual oil recovery.
Besides, the Palm Oil Mill Effluent (POME) resulting from the production of Crude Palm Oil
(CPO), reach about 10,558.3 m3 annually and should help to produce 0.44 GWh per year thanks
to biomethanation followed by Combined Heat and Power (CHP) technique. One other benefit
from doing so is the production of nutritious digested liquor for the watering of more than 30
hectares of palm oil plantation of which the yield should be enhanced around 10 to 23 %.
On the whole thanks to cogeneration from its biomass Juaben Oils Mills can meet all its steam
and power requirements and get a surplus of 4.67 GWh per year.
The good news is that all this great possibility that offers palm oil and shea butter industries
to convert biomass into energy is feasible with others food processing industries such as sugar
mills, chocolate mills, rice mills and also with sawmills.
Since Africa abounds plenty fields where the raw materials used in these industries can be
harvested, time is not up for African food industrialists to integrate cogeneration with residues in
their business?
It is important to recognize that in our computations we did not get the exact energy
requirements of Palm Kernel Oil and Shea Butter sections as well as the annual electrical
consumption of the mill for others purposes. Further works are recommended in order to find out
these values and take them into account in the calculations.
It will also be very interesting to conduct a meticulous analysis to emphasize the cost of EFB and
POME treatments and the income that we can get. Further economical studies are deeply
recommended to emphasize how far it will be beneficial to use the excess of fuel to generate

Cogeneration and Energy Savings in a Food Processing Industry: Case of Juaben Oils Mills (Ghana)
Thesis written by Félicien D. BADOU/ 37th Promotion 2iE - June 2008 47
electricity that will be sold to the grid while taking into account the requirements of the refinery
newly installed in JOM.
Thanks to cogeneration the price of electricity will likely decrease for the happiness of the
millers first but mainly for the one of the population since the price of some manufactured goods
will thus drop. To confirm or to invalidate this possibility researches and studies are necessary.

Cogeneration and Energy Savings in a Food Processing Industry: Case of Juaben Oils Mills (Ghana)
Thesis written by Félicien D. BADOU/ 37th Promotion 2iE - June 2008 48
REFERENCES
Azali A., A.B. Nasrin, C., 2005. Development of gasification system fuelled with oil palm fibres and shells. American Journal of Applied Sciences (special Issue): 72-75. Basiron, Y., Chan, K.W., 2004. The oil palm and its sustainability. Journal of Oil Palm Research 16, 1–10. Dam J.V., November 2004. Palm oil production for oil and biomass: the solution for sustainable oil production and certifiably biomass production? Food and Agriculture Organization, FAO. Regional Wood Energy Development Programme in Asia, September 1995. Cogeneration in wood and Agro Industries. Food and Agriculture Organization, FAO. Small scale palm oil processing in Africa. Bulletin 148. Not dated Food and Agriculture Organization, FAO. Statistics Division, 2007. Goldemberg, J., 2006. The promise of clean energy. Energy Policy 34, 2185-2190. Jorgensen HK, February 1985.Treatment of empty fruit bunches for recovery of residual oil and additional steam production. JAOCS 1985; 62(2):282-4. Kelly-Yong T.L., K.T. Lee, M., et al, 2007. Potential of hydrogen from oil pal biomass as a source of renewable energy worldwide. Energy Policy 35, 5692-5701. Mahlia T.M.I., M.Z. Abdulmuin, A., et al, 2000. An alternative energy source from palm wastes industry for Malaysia and Indonesia. Energy Conversion and Management 42, 2109-2118. Malaysian-Danish Environment Cooperation Programme Renewable Energy and Energy Efficiency Component, January 2006.Barrier Analysis for the Supply Chain of Palm Oil Processing Biomass (Empty Fruit Bunch) as Renewable Fuel. Pusat Tenaga Malaysia, 2006. Biomass for electricity generation in Malaysia.
Available at: /http://www.ptm.org.myS. TECHNOLOGIES PROPRES ET SOBRES, N°2 January 1996. Les enjeux économiques de la cogénération. Umikalsom, M.S., Ariff, A.B., Zulkifli, H.S., Tong, C.C., Hassan, M.A., Karim, M.I.A., 1997. The treatment of oil palm empty fruit bunch fibre for subsequent use as substrate for cellulase production by Chaetomium globosum kunze. Bioresource Technology 62, 1–9. Yeoh B.G., January 2004. A technical and economical analysis of heat and power generation from biomethanation of palm oil mill effluent. Yusoff S., September 2003. Renewable energy from palm oil-innovation on effective utilization of waste. Journal of Cleaner Production 14, 87-93.

Cogeneration and Energy Savings in a Food Processing Industry: Case of Juaben Oils Mills (Ghana)
Thesis written by Félicien D. BADOU/ 37th Promotion 2iE - June 2008 49
WEBSITES
http://fr.wikipedia.org/wiki/Cog%C%A9n%A9ration http://journals.cambridge.org/action/displayAbstract;jsessionid=607577C05AF253E904807A7E88E7EBDF.tomcat1?fromPage=online&aid=1704332 http://practicalaction.org/practicalanswers/product_info.php?products_id=265 http://www.engineeringtoolbox.com http://www.fnh.org/naturoscope/Energie/Cogeneration/Cogen1.htm http://www.petitecogeneration.org/index.php

Cogeneration and Energy Savings in a Food Processing Industry: Case of Juaben Oils Mills (Ghana)
Thesis written by Félicien D. BADOU/ 37th Promotion 2iE - June 2008 50
APPENDICES
APPENDIX 1: Questionnaire to Juaben Oils Mills ……………………………………………..52
APPENDIX 2: Overview of Crude Palm Oil (CPO) and Palm kernel Oil (PKO) sections …….56
APPENDIX 3: Overview of Shea Butter section ……………………………………………….57
APPENDIX 4: Daily overview of CPO, PKO and SB and the Mill Capacity ………………….58
APPENDIX 5: High Calorific Value (HCV) and moisture content……………………………..61
APPENDIX 6: Parameters of Palm Oil Mill Effluent (POME) ………………………………...64
APPENDIX 7: Consumption of fuel during the peak season…………………………………...65
APPENDIX 8: Air of combustion for the fuel used in Juaben Oils Mills ……………………...66

Cogeneration and Energy Savings in a Food Processing Industry: Case of Juaben Oils Mills (Ghana)
Thesis written by Félicien D. BADOU/ 37th Promotion 2iE - June 2008 51
APPENDIX 1: QUESTIONNAIRE TO JUABEN OILS MILLS
I. By-products characterization
1. What is the flow chart of the palm oil production?
2. What are the by-products of the palm oil processing? (Draw a cross in the box if yes)
Empty Fruit
Bunch Fibre Shell Cake Filtered Cakes
Palm Oil
Mills Effluent Others
3. What quantity of each by-product do you extracted?
Byproducts Quantity
Empty fruit bunches (EFB)
Fibers
Shell
Cake
Filtered Cakes
Effluent, sludge (POME)
Others
4. What are your current usages of each by-product?
Byproducts Uses
Empty fruit bunches (EFB)
Fibers
Shell
Cake
Filtered Cakes
Effluent, sludge (POME)
Others

Cogeneration and Energy Savings in a Food Processing Industry: Case of Juaben Oils Mills (Ghana)
Thesis written by Félicien D. BADOU/ 37th Promotion 2iE - June 2008 52
5. What is the utilization rate of each by-product?
Byproducts Utilization rate
Empty fruit bunches (EFB)
Fibers
Shell
Cake
Filtered Cakes
Effluent, sludge (POME)
Others
6. What by-products don’t you use for energy purpose ? (Draw a cross in the box if yes)
Byproducts No used for energy
Empty fruit bunches (EFB)
Cake
Filtered Cakes
Effluent, sludge (POME)
Others
7. What constraints do you face while wanting to use them to produce energy?
Byproducts Constraints
Empty fruit bunches (EFB)
Cake
Filtered Cakes
Effluent, sludge (POME)
Others
8. What is the flow chart of shea oil production?
9. What are the by-products of the shea oil processing? (Shells, cake, filtered cake, others)
Shell Cake
Filtered Cakes Shea Oil Mill Effluent Others
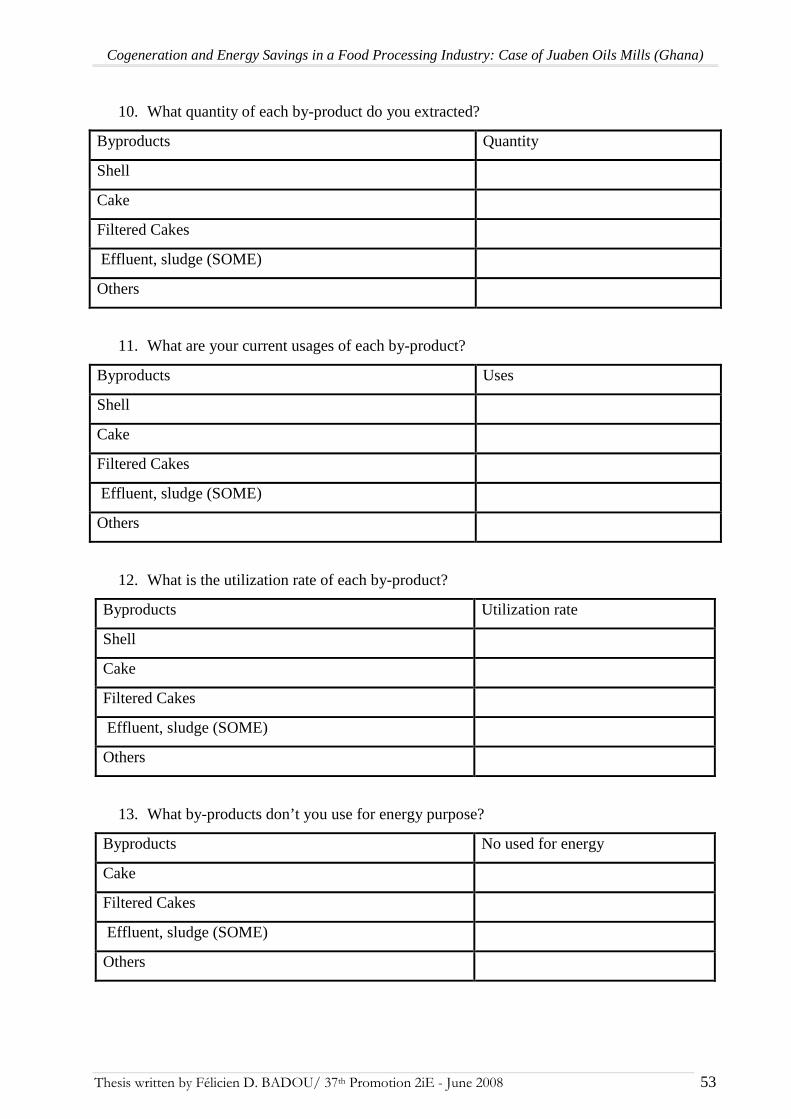
Cogeneration and Energy Savings in a Food Processing Industry: Case of Juaben Oils Mills (Ghana)
Thesis written by Félicien D. BADOU/ 37th Promotion 2iE - June 2008 53
10. What quantity of each by-product do you extracted?
Byproducts Quantity
Shell
Cake
Filtered Cakes
Effluent, sludge (SOME)
Others
11. What are your current usages of each by-product?
Byproducts Uses
Shell
Cake
Filtered Cakes
Effluent, sludge (SOME)
Others
12. What is the utilization rate of each by-product?
Byproducts Utilization rate
Shell
Cake
Filtered Cakes
Effluent, sludge (SOME)
Others
13. What by-products don’t you use for energy purpose?
Byproducts No used for energy
Cake
Filtered Cakes
Effluent, sludge (SOME)
Others

Cogeneration and Energy Savings in a Food Processing Industry: Case of Juaben Oils Mills (Ghana)
Thesis written by Félicien D. BADOU/ 37th Promotion 2iE - June 2008 54
14. What constraints do you face while wanting to use them to produce energy?
Byproducts Constraints
Cake
Filtered Cakes
Effluent, sludge (SOME)
Others
II. Energetic aspects
1. Are the combustible dried or wet when you use them for the boiler?
2. What is the moisture content of the combustibles (fuel)?
Byproducts Moisture content
Empty fruit bunches (EFB)
Fibre
Shell
Cake
Filtered Cake
Others
3. What is the calorific value of the combustibles (fuel)?
Byproducts CV(kJ/kg)
Empty fruit bunches (EFB)
Fibers
Shell
Cake
Filtered Cake
Others
4. How many boilers do you have?
5. What are their types, dimensions and characteristics?
6. How many turbines do you have
7. What are their types, dimensions and characteristic (capacity)?
8. What is the pressure at exit?

55
Boiler
FFB reception Sterilization Stripping
Storage tank
Settling tank
Clarification
Oil dryer
Digestion
Fibre + Nuts
Pressing
Separation
Nuts Cracking
Clay bath
Drying Cooking
Pressing
Cracking
Filtration Storage tank
Crude PO
Reclaimed oil
Skimmed oil
Sludge
Sludge separator
POME
Dry oil
Settling pond
Fibre
Nuts
EFB
Fruits
Shell
Burning Ash for farms
Kernel + shell
Kernel
PKO cake
Crude PKO Clean PKO
Residues
Oil traditional recovery
Discharge
Oil traditional recovery
APPENDIX 2: OVERVIEW OF CRUDE PALM OIL (CPO) AND PALM KERNEL OIL (PKO) SECTIONS

56
Boiler
Shea seeds bags reception
Cleaner Cracker
Cooker
CSO
Pressing (Expeller)
Vibro-separator
Pressure leaf filter
Filtered oil tank
Storage tank
Cake
CSO
Cracked seeds
Filtered oil
Dried oil
Foots
Filtered Cake
Vacuum dryer
APPENDIX 3: OVERVIEW OF SHEA BUTTER SECTION

Cogeneration and Energy Savings in a Food Processing Industry: Case of Juaben Oils Mills in Kumasi
Thesis written by Félicien D. BADOU/37th Promotion 2iE- June 2008 57
APPENDIX 4: DAILY OVERVIEW OF CPO, PKO AND SB AND THE MILL CAPACITY
CRUDE PALM OIL DAYLY OVERVIEW
Month Date Shift Cages milled
Nut_imput (Mt)
Downtime (Hours)
Fulltime (Hours)
Capacity (Mt/h)
Average (Mt/h)
JUNE 07 19/06/2007 A 24 31.2 3.83 4.17 7.482 5.416 B 38 49.4 8 6.175 C 40 52 8 6.500 21/06/2007 A 24 31.2 8 3.900 B 28 36.4 1.83 6.17 5.900 C 28 36.4 8 4.550 27/06/2007 B 24 31.2 8 3.900 C 26 33.8 3 5 6.760 A 22 28.6 8 3.575
JULY 07 09/07/2007 A 36 46.8 14 3.343 3.377 C 40 52 14 3.714 16/07/2007 C 28 36.4 1.54 12.46 2.921 A 38 49.4 14 3.529 23/07/2007 A 16 20.8
AUGUST 07 03/08/2007 C 8 10.4 6 8 1.300 2.177 A 0 0 5 9 0.000 13/08/2007 C 22 28.6 14 2.043 A 24 31.2 2.5 11.5 2.713 27/08/2007 C 20 26 14 1.857 A 32 41.6 14 2.971
SEPTEMBER 07
06/09/2007 A 42 54.6 14 3.900 2.897
C 34 44.2 14 3.157 11/09/2007 C 36 46.8 14 3.343 A 26 33.8 14 2.414 26/09/2007 C 18 23.4 14 1.671
OCTOBER 07
05/10/2007 B 32 41.6 14 2.971 2.043
16/10/2007 A 28 36.4 14 2.600 22/10/2007 A 6 7.8 14 0.557
NOVEMBER 07
07/11/2007 A 10 13 14 0.929 0.929
16/11/2007 A 6 7.8 14 0.557 28/11/2007 A 14 18.2 14 1.300
DECEMBER 07
06/12/2007 A 8 10.4 14 0.743 0.774
14/12/2007 A 10 13 14 0.929 20/12/2007 A 7 9.1 14 0.650
JANUARY 08
07/01/2008 A 8 10.4 14 0.743 0.867
15/01/2008 A 8 10.4 14 0.743 23/01/2008 A 12 15.6 14 1.114
FEBRUARY 08
07/02/2008 B 8 10.4 14 0.743 1.811
12/02/2008 A 24 31.2 14 2.229 27/02/2008 A 28 36.4 14 2.600 B 18 23.4 14 1.671
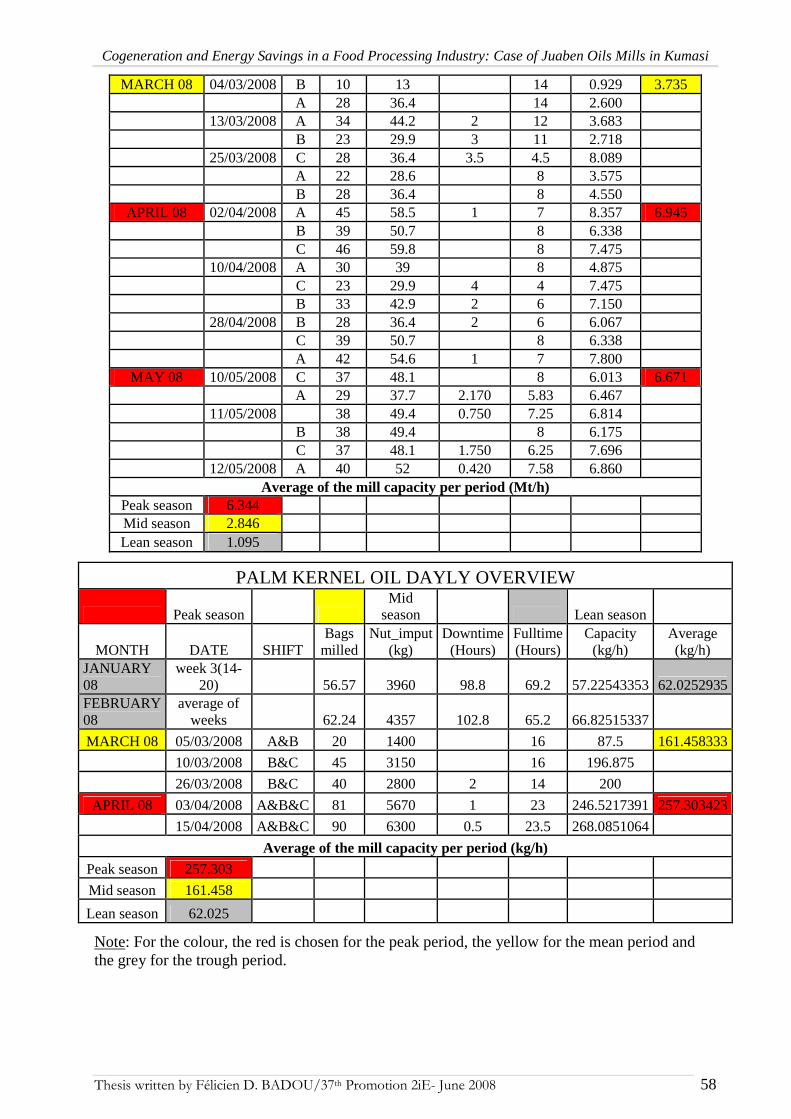
Cogeneration and Energy Savings in a Food Processing Industry: Case of Juaben Oils Mills in Kumasi
Thesis written by Félicien D. BADOU/37th Promotion 2iE- June 2008 58
MARCH 08 04/03/2008 B 10 13 14 0.929 3.735 A 28 36.4 14 2.600 13/03/2008 A 34 44.2 2 12 3.683 B 23 29.9 3 11 2.718 25/03/2008 C 28 36.4 3.5 4.5 8.089 A 22 28.6 8 3.575 B 28 36.4 8 4.550
APRIL 08 02/04/2008 A 45 58.5 1 7 8.357 6.945 B 39 50.7 8 6.338 C 46 59.8 8 7.475 10/04/2008 A 30 39 8 4.875 C 23 29.9 4 4 7.475 B 33 42.9 2 6 7.150 28/04/2008 B 28 36.4 2 6 6.067 C 39 50.7 8 6.338 A 42 54.6 1 7 7.800
MAY 08 10/05/2008 C 37 48.1 8 6.013 6.671 A 29 37.7 2.170 5.83 6.467 11/05/2008 38 49.4 0.750 7.25 6.814 B 38 49.4 8 6.175 C 37 48.1 1.750 6.25 7.696 12/05/2008 A 40 52 0.420 7.58 6.860
Average of the mill capacity per period (Mt/h) Peak season 6.344 Mid season 2.846 Lean season 1.095
PALM KERNEL OIL DAYLY OVERVIEW
Peak season Mid
season Lean season
MONTH DATE SHIFT Bags milled
Nut_imput (kg)
Downtime (Hours)
Fulltime (Hours)
Capacity (kg/h)
Average (kg/h)
JANUARY 08
week 3(14-20) 56.57 3960 98.8 69.2 57.22543353 62.0252935
FEBRUARY 08
average of weeks 62.24 4357 102.8 65.2 66.82515337
MARCH 08 05/03/2008 A&B 20 1400 16 87.5 161.458333
10/03/2008 B&C 45 3150 16 196.875
26/03/2008 B&C 40 2800 2 14 200
APRIL 08 03/04/2008 A&B&C 81 5670 1 23 246.5217391 257.303423
15/04/2008 A&B&C 90 6300 0.5 23.5 268.0851064
Average of the mill capacity per period (kg/h) Peak season 257.303
Mid season 161.458
Lean season 62.025 Note: For the colour, the red is chosen for the peak period, the yellow for the mean period and the grey for the trough period.

Cogeneration and Energy Savings in a Food Processing Industry: Case of Juaben Oils Mills in Kumasi
Thesis written by Félicien D. BADOU/37th Promotion 2iE- June 2008 59
SHEA BUTTER DAYLY OVERVIEW
MONTH DATE SHIFT Bags milled
Nut_imput (Mt)
Downtime (Hours)
Fulltime (Hours)
Capacity (Mt/h)
FEBRUARY 08
29/02/2008 A&B&C 344 26.66 24 1.110833333
MARCH 08 03/03/2008 A&B&C 285 22.0875 24 0.9203125
12/03/2008 A&B&C 154 11.935 10.5 13.5 0.884074074
25/03/2008 A&B&C 356 27.59 2 22 1.254090909
APRIL 08 01/04/2008 A&B&C 224 17.36 2 22 0.789090909
08/04/2008 A&B&C 293 22.7075 7.67 16.33 1.390538885
14/04/2008 A&B&C 318 24.645 24 1.026875
28/04/2008 A&B&C 288 22.32 7 17 1.312941176
MAY 08 01/05/2008 A&B&C 464 35.96 0 24 1.498333333
03/05/2008 A&B 265 20.5375 6.83 17.17 1.196126966
Average of the mill capacity per period (Mt/h)
Average 1.138
MILL CAPACITY
Peak season Mean season Lean season Total
CPO section (Mt/h) 6.344 2.846 1.095
PKO section (Mt/h) 0.257 0.161 0.062
SB section (Mt/h) 1.138 1.138 1.138
Total capacity (Mt/h) 7.740 4.146 2.295
Number of hours 1800 2500 1440
Periodic capacity of CPO (Mt) 11419 7115 1577 20111
Overall capacity (Mt) 13931 10364 3305 27601

Cogeneration and Energy Savings in a Food Processing Industry: Case of Juaben Oils Mills in Kumasi
Thesis written by Félicien D. BADOU/37th Promotion 2iE- June 2008 60
APPENDIX 5: HIGH CALORIFIC VALUE (HCV) AND MOISTURE CONTENT
FIBRE SHELL Sample Ti Tf HCV (kJ/kg) Sample Ti Tf HCV (kJ/kg)
F11 29.6 30.5 15562.8 S11 26.6 27.8 20750.4 F12 31 32.05 18156.6 S12 F13 27.7 28.8 19021.2 S13 33.4 34.3 15562.8 F1 18588.9 S1 20750.4 F21 29 30.15 19885.8 S21 33.45 34.55 19021.2 F22 32.2 33.3 19021.2 S22 34.1 35.15 18156.6 F23 34.55 35.65 19021.2 S23 33.1 34.15 18156.6 F2 19309.4 S2 18444.8 F31 26.6 27.7 19021.2 S31 30.2 31.3 19021.2 F32 32.3 33.3 17292 S32 31.2 32.3 19021.2 F33 35.4 36.35 16427.4 S33 32.15 33.2 18156.6 F3 18156.6 S3 18733 F41 36.3 37.3 17292 S41 33.38 34.48 19021.2 F42 30.3 31.45 19885.8 S42 34.6 35.68 18675.36 F43 34.1 35.15 18156.6 S43 36.1 37.1 17292 F4 18444.8 S4 18848.28
Average 18624.93 Average 19194.12
CAKE FILTERED CAKE Sample Ti Tf HCV (kJ/kg) Sample Ti Tf HCV (kJ/kg)
C11 28.3 29.7 24208.8 FC11 27.8 29.6 31125.6 C12 30.8 32 20750.4 FC12 32.9 34.4 25938 C13 32.8 33.5 12104.4 FC13 33.6 35.1 25938 C1 22479.6 FC1 25938 C21 31.2 32.2 17292 FC21 30.3 31.8 25938 C22 33 34 17292 FC22 29.5 31 25938 C23 32.7 33.6 15562.8 FC23 31.7 33.4 29396.4 C2 17292 FC2 27090.8 C31 31.7 32.78 18675.36 FC31 34.3 35.85 26802.6 C32 27.6 28.7 19021.2 FC32 33 34.5 25938 C33 FC33 35.8 37.1 22479.6 C3 18848.28 FC3 25073.4 C41 36.6 37.6 17292 FC41 32.6 33.7 19021.2 C42 35.05 36.1 18156.6 FC42 36.6 37.95 23344.2 C43 29.1 30.4 22479.6 FC43 31.1 32.65 26802.6 C4 19309.4 FC4 25073.4
Average 19482.32 Average 25793.9
EFB EFB EFB31 29.7 30.8 19021.2
Sample Ti Tf HCV (kJ/kg) EFB32 30.65 31.7 18156.6 EFB11 29.8 30.78 16946.16 EFB33 33.9 34.9 17292 EFB12 31.35 32.2 14698.2 EFB3 18156.6 EFB13 32.6 33.5 15562.8 EFB41 35.2 36.05 14698.2 EFB1 16254.48 EFB42 29.9 30.9 17292 EFB21 30.1 31.1 17292 EFB43 30.45 31.48 17810.76 EFB22 29 30.05 18156.6 EFB4 17551.38 EFB23 30.45 31.5 18156.6 EFB2 17868.4 Average 17457.715

Cogeneration and Energy Savings in a Food Processing Industry: Case of Juaben Oils Mills in Kumasi
Thesis written by Félicien D. BADOU/37th Promotion 2iE- June 2008 61
FIBRE
Date Basin Basin (g) (B +S)(g) Sample (DB+S)1
(g) ML1 (g)
(DB+S)2 (g)
ML 2 (g)
(DB+S)3 (g)
ML3 (g) Total ML (g) M content
(%)
16/04/2008 A 49.61 57.87 8.26 55.11 2.76 55.11 0 55.11 0 2.76 33.41 16/04/2008 B 46.09 60.96 14.87 54.82 6.14 54.82 0 54.82 0 6.14 41.29 23/04/2008 A 46.1 52.15 6.05 50.25 1.9 50.25 0 50.25 0 1.9 31.40 23/04/2008 B 49.45 56.95 7.5 54.5 2.45 54.5 0 54.5 0 2.45 32.67 07/05/2008 A 45.85 54.8 8.95 53.05 1.75 53.05 0 53.05 0 1.75 19.55 07/05/2008 B 46 58.05 12.05 55.75 2.3 55.75 0 55.75 0 2.3 19.09
AVERAGE 32
SHELL
Date Basin Basin (g) (B +S)(g) Sample (DB+S)1
(g) ML1 (g) (DB+S)2
(g) ML 2 (g)
(DB+S)3 (g) ML3 (g) Total ML (g)
M content (%)
18/04/2008 A 32.1 60.3 28.2 56.05 4.25 56.05 0 56.05 0 4.25 15.07 18/04/2008 B 33.95 65.05 31.1 60.3 4.75 60.15 0.15 60.1 0.05 4.95 15.92 23/04/2008 A 32.1 62.35 30.25 57.6 4.75 57.55 0.05 57.55 0 4.8 15.87 23/04/2008 B 45.8 83.8 38 77.85 5.95 77.8 0.05 77.8 0 6 15.79 07/05/2008 A 50.9 90.95 40.05 83.2 7.75 82.85 0.35 82.8 0.05 8.15 20.35 07/05/2008 B 49.4 87.6 38.2 79.85 7.75 79.8 0.05 79.75 0.05 7.85 20.55
AVERAGE 17
CAKE
Date Basin Basin (g) (B +S)(g) Sample (DB+S)1
(g) ML1 (g) (DB+S)2
(g) ML 2 (g)
(DB+S)3 (g) ML3 (g) Total ML (g)
M content (%)
16/04/2008 A 32.2 65.42 33.22 63.87 1.55 63.84 0.03 63.84 0 1.58 4.76 16/04/2008 B 46.25 82.23 35.98 80.77 1.46 80.77 0 80.77 0 1.46 4.06 23/04/2008 A 50.8 75.55 24.75 69.45 6.1 69.45 0 69.45 0 6.1 24.65 23/04/2008 B 49.35 75.3 25.95 69.2 6.1 69.2 0 69.2 0 6.1 23.51 07/05/2008 A 46.1 81.95 35.85 72.5 9.45 72.45 0.05 72.45 0 9.5 26.50 07/05/2008 B 49.4 88.2 38.8 79.05 9.15 78.85 0.2 78.85 0 9.35 24.10
AVERAGE 25

Cogeneration and Energy Savings in a Food Processing Industry: Case of Juaben Oils Mills in Kumasi
Thesis written by Félicien D. BADOU/37th Promotion 2iE- June 2008 62
FILTERED CAKE
Date Basin Basin (g) (B +S)(g) Sample (DB+S)1
(g) ML1 (g)
(DB+S)2 (g)
ML 2 (g)
(DB+S)3 (g)
ML3 (g) Total ML (g) M content
(%)
16/04/2008 A 45.98 88.28 42.3 86.67 1.61 86.54 0.13 86.53 0.01 1.75 4.14 16/04/2008 B 51.01 97.96 46.95 96.17 1.79 96.02 0.15 95.98 0.04 1.98 4.22 23/04/2008 A 45.9 79.15 33.25 77.75 1.4 77.7 0.05 77.7 0 1.45 4.36 23/04/2008 B 50.4 81.5 31.1 80.25 1.25 80.25 0 80.25 0 1.25 4.02 07/05/2008 A 32.15 75.6 43.45 74.35 1.25 74.25 0.1 74.25 0 1.35 3.11 07/05/2008 B 35.45 77.45 42 75.95 1.5 75.85 0.1 75.85 0 1.6 3.81
AVERAGE 4
EMPTY FRUIT BUNCH
Date Basin Basin (g) (B +S)(g) Sample (DB+S)1
(g) ML1 (g)
(DB+S)2 (g)
ML 2 (g)
(DB+S)3 (g)
ML3 (g) Total ML (g) M content
(%)
18/04/2008 A 46.1 63 16.9 52.55 10.45 52.55 0 52.55 0 10.45 61.83 18/04/2008 B 49.5 66.2 16.7 56.55 9.65 55.6 0.95 55.35 0.25 10.85 64.97 23/04/2008 A 33.95 42.15 8.2 37.45 4.7 37.4 0.05 37.4 0 4.75 57.93
AVERAGE 62
Note: In this Appendix 5, the grey colour is for the box not utilized for the computations since there are not close to the others values. Abbreviations: B: Basin/ S: Sample/ DB: Dried Basin/ ML: Moisture Loss/ M content: Moisture Content
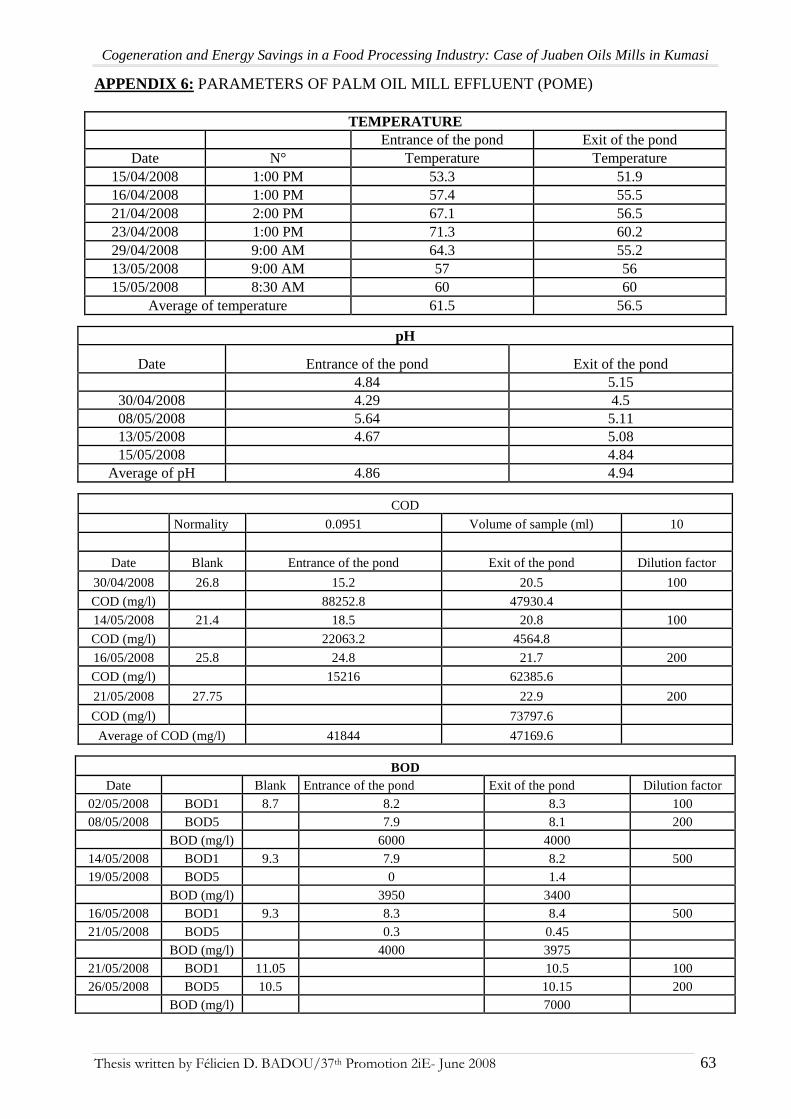
Cogeneration and Energy Savings in a Food Processing Industry: Case of Juaben Oils Mills in Kumasi
Thesis written by Félicien D. BADOU/37th Promotion 2iE- June 2008 63
APPENDIX 6: PARAMETERS OF PALM OIL MILL EFFLUENT (POME)
TEMPERATURE Entrance of the pond Exit of the pond
Date N° Temperature Temperature 15/04/2008 1:00 PM 53.3 51.9 16/04/2008 1:00 PM 57.4 55.5 21/04/2008 2:00 PM 67.1 56.5 23/04/2008 1:00 PM 71.3 60.2 29/04/2008 9:00 AM 64.3 55.2 13/05/2008 9:00 AM 57 56 15/05/2008 8:30 AM 60 60
Average of temperature 61.5 56.5
pH
Date Entrance of the pond Exit of the pond 4.84 5.15
30/04/2008 4.29 4.5 08/05/2008 5.64 5.11 13/05/2008 4.67 5.08 15/05/2008 4.84
Average of pH 4.86 4.94
COD
Normality 0.0951 Volume of sample (ml) 10
Date Blank Entrance of the pond Exit of the pond Dilution factor
30/04/2008 26.8 15.2 20.5 100
COD (mg/l) 88252.8 47930.4
14/05/2008 21.4 18.5 20.8 100
COD (mg/l) 22063.2 4564.8
16/05/2008 25.8 24.8 21.7 200
COD (mg/l) 15216 62385.6
21/05/2008 27.75 22.9 200
COD (mg/l) 73797.6
Average of COD (mg/l) 41844 47169.6
BOD Date Blank Entrance of the pond Exit of the pond Dilution factor
02/05/2008 BOD1 8.7 8.2 8.3 100 08/05/2008 BOD5 7.9 8.1 200
BOD (mg/l) 6000 4000 14/05/2008 BOD1 9.3 7.9 8.2 500 19/05/2008 BOD5 0 1.4
BOD (mg/l) 3950 3400 16/05/2008 BOD1 9.3 8.3 8.4 500 21/05/2008 BOD5 0.3 0.45
BOD (mg/l) 4000 3975 21/05/2008 BOD1 11.05 10.5 100 26/05/2008 BOD5 10.5 10.15 200
BOD (mg/l) 7000
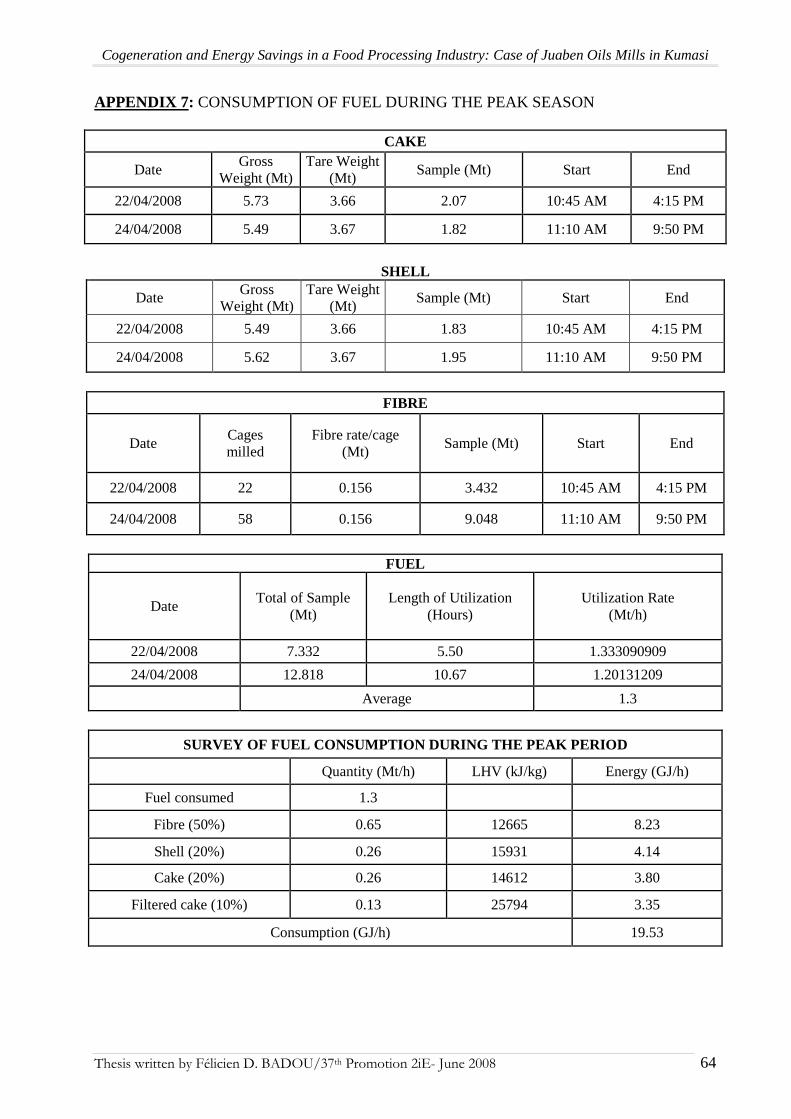
Cogeneration and Energy Savings in a Food Processing Industry: Case of Juaben Oils Mills in Kumasi
Thesis written by Félicien D. BADOU/37th Promotion 2iE- June 2008 64
APPENDIX 7: CONSUMPTION OF FUEL DURING THE PEAK SEASON
CAKE
Date Gross
Weight (Mt) Tare Weight
(Mt) Sample (Mt) Start End
22/04/2008 5.73 3.66 2.07 10:45 AM 4:15 PM
24/04/2008 5.49 3.67 1.82 11:10 AM 9:50 PM
SHELL
Date Gross
Weight (Mt) Tare Weight
(Mt) Sample (Mt) Start End
22/04/2008 5.49 3.66 1.83 10:45 AM 4:15 PM
24/04/2008 5.62 3.67 1.95 11:10 AM 9:50 PM
FIBRE
Date Cages milled
Fibre rate/cage (Mt)
Sample (Mt) Start End
22/04/2008 22 0.156 3.432 10:45 AM 4:15 PM
24/04/2008 58 0.156 9.048 11:10 AM 9:50 PM
FUEL
Date Total of Sample
(Mt) Length of Utilization
(Hours) Utilization Rate
(Mt/h)
22/04/2008 7.332 5.50 1.333090909
24/04/2008 12.818 10.67 1.20131209
Average 1.3
SURVEY OF FUEL CONSUMPTION DURING THE PEAK PERIOD
Quantity (Mt/h) LHV (kJ/kg) Energy (GJ/h)
Fuel consumed 1.3
Fibre (50%) 0.65 12665 8.23
Shell (20%) 0.26 15931 4.14
Cake (20%) 0.26 14612 3.80
Filtered cake (10%) 0.13 25794 3.35
Consumption (GJ/h) 19.53
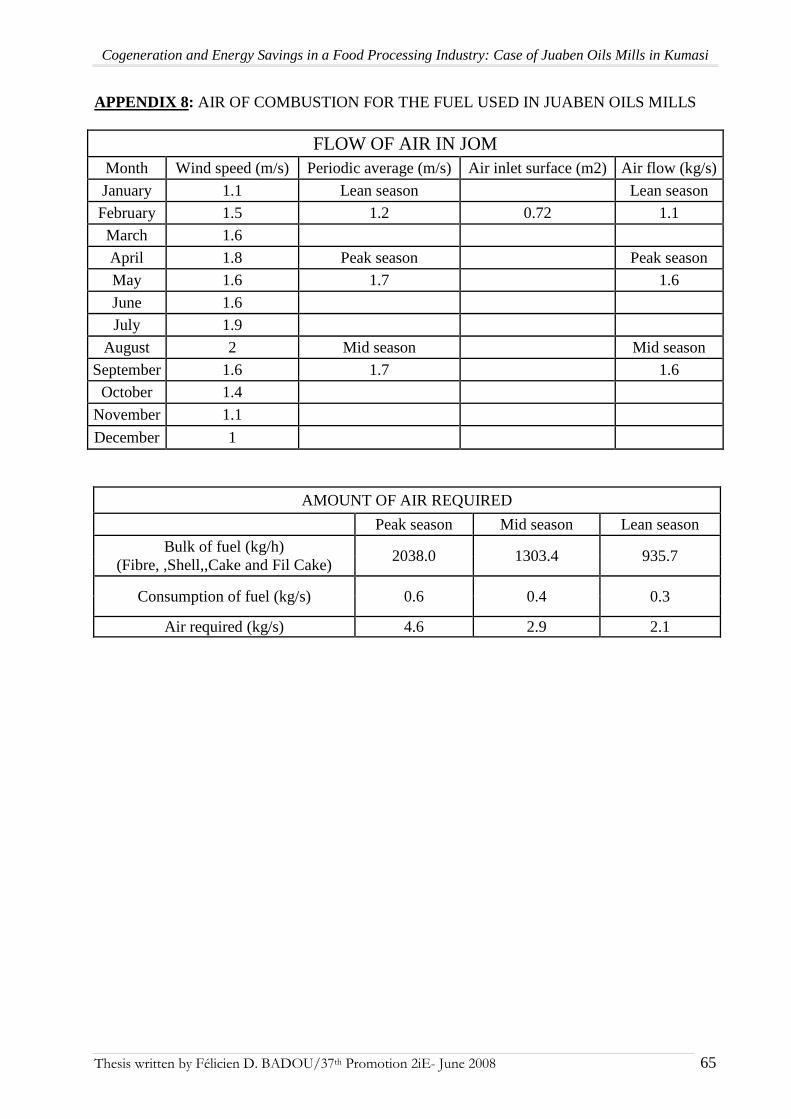
Cogeneration and Energy Savings in a Food Processing Industry: Case of Juaben Oils Mills in Kumasi
Thesis written by Félicien D. BADOU/37th Promotion 2iE- June 2008 65
APPENDIX 8: AIR OF COMBUSTION FOR THE FUEL USED IN JUABEN OILS MILLS
FLOW OF AIR IN JOM Month Wind speed (m/s) Periodic average (m/s) Air inlet surface (m2) Air flow (kg/s)
January 1.1 Lean season Lean season
February 1.5 1.2 0.72 1.1
March 1.6
April 1.8 Peak season Peak season
May 1.6 1.7 1.6
June 1.6
July 1.9
August 2 Mid season Mid season
September 1.6 1.7 1.6
October 1.4
November 1.1
December 1
AMOUNT OF AIR REQUIRED
Peak season Mid season Lean season Bulk of fuel (kg/h)
(Fibre, ,Shell,,Cake and Fil Cake) 2038.0 1303.4 935.7
Consumption of fuel (kg/s) 0.6 0.4 0.3
Air required (kg/s) 4.6 2.9 2.1
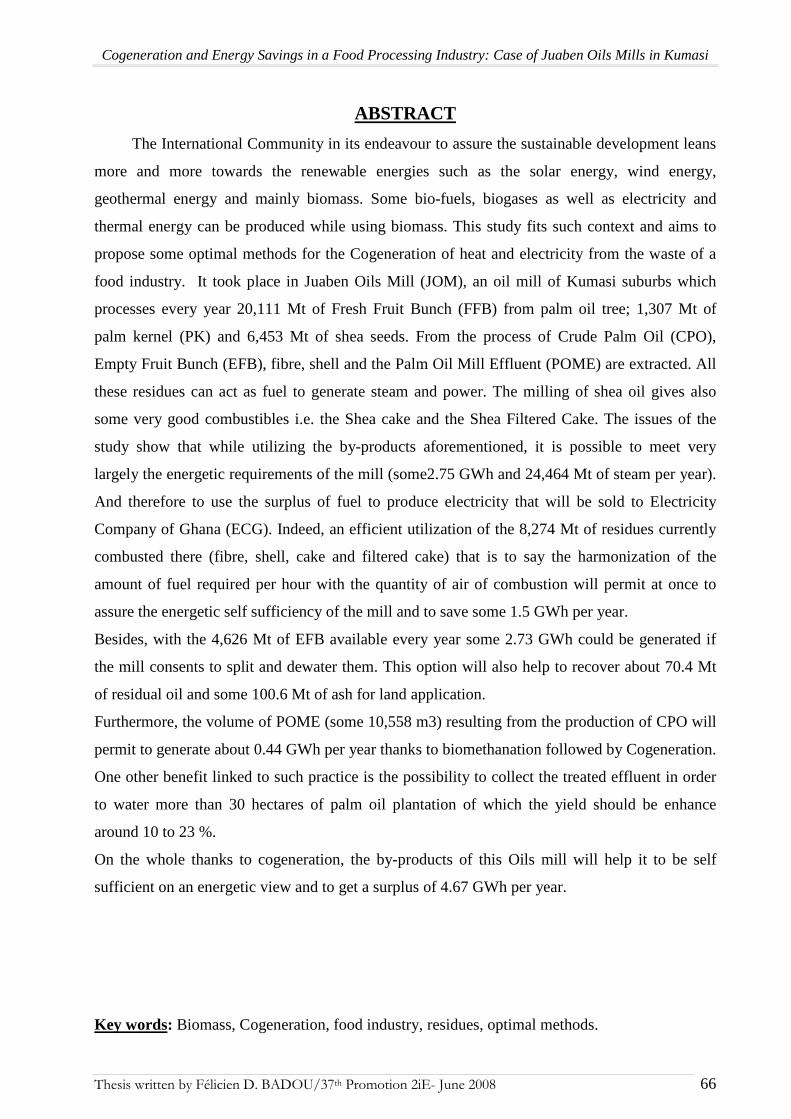
Cogeneration and Energy Savings in a Food Processing Industry: Case of Juaben Oils Mills in Kumasi
Thesis written by Félicien D. BADOU/37th Promotion 2iE- June 2008 66
ABSTRACT
The International Community in its endeavour to assure the sustainable development leans
more and more towards the renewable energies such as the solar energy, wind energy,
geothermal energy and mainly biomass. Some bio-fuels, biogases as well as electricity and
thermal energy can be produced while using biomass. This study fits such context and aims to
propose some optimal methods for the Cogeneration of heat and electricity from the waste of a
food industry. It took place in Juaben Oils Mill (JOM), an oil mill of Kumasi suburbs which
processes every year 20,111 Mt of Fresh Fruit Bunch (FFB) from palm oil tree; 1,307 Mt of
palm kernel (PK) and 6,453 Mt of shea seeds. From the process of Crude Palm Oil (CPO),
Empty Fruit Bunch (EFB), fibre, shell and the Palm Oil Mill Effluent (POME) are extracted. All
these residues can act as fuel to generate steam and power. The milling of shea oil gives also
some very good combustibles i.e. the Shea cake and the Shea Filtered Cake. The issues of the
study show that while utilizing the by-products aforementioned, it is possible to meet very
largely the energetic requirements of the mill (some2.75 GWh and 24,464 Mt of steam per year).
And therefore to use the surplus of fuel to produce electricity that will be sold to Electricity
Company of Ghana (ECG). Indeed, an efficient utilization of the 8,274 Mt of residues currently
combusted there (fibre, shell, cake and filtered cake) that is to say the harmonization of the
amount of fuel required per hour with the quantity of air of combustion will permit at once to
assure the energetic self sufficiency of the mill and to save some 1.5 GWh per year.
Besides, with the 4,626 Mt of EFB available every year some 2.73 GWh could be generated if
the mill consents to split and dewater them. This option will also help to recover about 70.4 Mt
of residual oil and some 100.6 Mt of ash for land application.
Furthermore, the volume of POME (some 10,558 m3) resulting from the production of CPO will
permit to generate about 0.44 GWh per year thanks to biomethanation followed by Cogeneration.
One other benefit linked to such practice is the possibility to collect the treated effluent in order
to water more than 30 hectares of palm oil plantation of which the yield should be enhance
around 10 to 23 %.
On the whole thanks to cogeneration, the by-products of this Oils mill will help it to be self
sufficient on an energetic view and to get a surplus of 4.67 GWh per year.
Key words: Biomass, Cogeneration, food industry, residues, optimal methods.

Cogeneration and Energy Savings in a Food Processing Industry: Case of Juaben Oils Mills in Kumasi
Thesis written by Félicien D. BADOU/37th Promotion 2iE- June 2008 67
RESUME
La Communauté Internationale dans sa tentative à assurer le développement durable
penche de plus en plus vers les énergies renouvelables dont le solaire, l’éolien, la géothermique
et surtout la biomasse. Des biocarburants, des biogaz ainsi que de l’électricité et de l’énergie
thermique peuvent être produits à partir de la biomasse. C’est dans ce canevas que s’inscrit la
présente étude dont l’enjeu est de proposer des méthodes optimales de cogénération de la chaleur
et de l’électricité à partir des déchets d’une industrie agroalimentaire. Elle s’est déroulée à
Juaben Oils Mills (JOM), une huilerie de la banlieue de Kumasi qui transforme chaque année
20111 tonnes de régimes de palmier à huile et 6453 tonnes de fruits de karité. De la production
de l’huile de palme brute, le régime vide, la fibre, la coque et les effluents de l’huilerie sont
extraits. Tous ces résidus peuvent servir de combustibles pour générer de la vapeur et de
l’électricité. La transformation de fruits de karité en huile fournit elle aussi de très bons
combustibles dont un semi-produit huileux et un résidu moins huileux. Les résultats obtenus
révèlent qu’en utilisant les résidus susmentionnés il est possible de couvrir très largement les
besoins énergétiques de cette agro-industrie (2,75 GWh et 24464 tonnes de vapeur). Et ainsi
donc d’utiliser le surplus de combustibles pour produire de l’électricité qui sera vendu à la
Compagnie Electrique du Ghana. En effet, une utilisation efficiente des 8274 tonnes de résidus
annuellement comburées dans l’huilerie (fibres, coques et les résidus de karité) c'est-à-dire
l’harmonisation de la quantité de combustible requise par heure avec celle d’air de combustion
permettra à la fois d’assurer l’autosuffisance énergétique et d’économiser 1,5 GWh par an. De
plus avec les 4626 tonnes de régimes vidés de fruits disponibles chaque année, 2,73 GWh pourra
être généré si l’industrie consent à les pré traiter. Cette option permettra aussi de récupérer
environ 70,4 tonnes d’huile résiduelle et 100,6 tonnes de cendres pour l’amendement des
plantations. En outre, le volume d’effluents (10558 m3) résultant de la production d’huile de
palme brute pourra permettre de produire environ 0.44 GWh par an grâce à la bio-méthanisation
suivie de la Cogénération. Un autre avantage lié à une telle pratique c’est la possibilité de
collecter les effluents traités pour irriguer environ 30 hectares de palmiers dont les rendements
pourront augmenter de 10 à 23 %.
Au total, avec la cogénération cette huilerie pourra de dégager un surplus de 4,67 GWh par an.
Mots clés : Biomasse, Cogénération, industrie agroalimentaire, résidus, méthodes optimales.


![Cogeneration&Combined [Autosaved]](https://static.fdocuments.in/doc/165x107/55cf94d9550346f57ba4d3d9/cogenerationcombined-autosaved.jpg)