Coffey International Limited · COFFEY INTERNATIONAL LIMITED Results for announcement to the market...
123
Coffey International Limited ABN 16 003 835 112 Appendix 4E and Annual Report Year Ended 30 June 2014
Transcript of Coffey International Limited · COFFEY INTERNATIONAL LIMITED Results for announcement to the market...
Coffey International Limited
ABN 16 003 835 112
Appendix 4E
and
Annual Report
Year Ended 30 June 2014
Page | 2
COFFEY INTERNATIONAL LIMITED Results for announcement to the market For the year ended 30 June 2014 Financial Results $A'000
Total revenue and other income
Decreased (8.8%) to 628,056
Fee revenue Decreased
(7.3%)
to 381,023
Earnings before Interest, Tax, Depreciation and Amortisation (EBITDA)
Increased 27.4% to 23,694
Earnings before interest and tax (EBIT)
Increased 57.2% to 14,495
Profit after income tax for the year
Increased 589.2% to 4,457
Profit after income tax for the year attributable to members
Increased 525.4% to 4,369
EBITDA before restructuring costs (underlying EBITDA)
Decreased (9.0%) to 26,162
Dividends
Amount
per security (cents)
Franked amount per
security (cents)
Interim dividend - Current year - Prior year
0 cents 0 cents
0 cents 0 cents
Final dividend - Current year - Prior year
0 cents 0 cents
0 cents 0 cents
NTA Backing
Jun-14 Jun-13
Net tangible asset backing per ordinary security 11.5 cents 10.2 cents Commentary on Results The commentary of the results for the year is contained in the 2014 Annual Report which should be read in conjunction with this Appendix 4E. The remainder of the information requiring disclosure to comply with listing rule 4.3A is contained in the attached Directors’ Report and audited Financial Report for the year ended 30 June 2014. Compliance Statement This report is based on audited accounts.
Page | 3
COFFEY INTERNATIONAL LIMITED Results for announcement to the market (continued) For the year ended 30 June 2014 EBITDA reconciliation
$’000 2014 2013
Profit/(Loss) for the year 4,457 (911)
Add back:
Net interest expense 8,130 10,005
Income tax expense 1,908 128
Depreciation and amortisation 9,199 9,381
EBITDA 23,694 18,603
Add back:
Restructuring costs 2,468 10,159
EBITDA before restructure costs 26,162 28,762 Underlying EBITDA has been disclosed as it is the key measure used by the Chief Executive Officer (as Chief Operating Decision Maker) and management to monitor and assess the operating performance of the business. Underlying EBITDA is calculated as profit before net financing costs, depreciation, amortisation and taxation and excludes restructuring costs. The Underlying EBITDA measure has not been subject to audit or review.
Annual Report2014
Results emergewhen local knowledge intersects withglobal expertise
Every Coffey relationship is built on trust.
Trust that’s hard-earned through our proven expertise, our depth of global experience and our commitment to stay one step ahead.
Our specialists in geoservices, international development and project management work in partnership with our clients across the globe.
We create value throughout the project lifecycle in the mining; oil and gas; transport infrastructure and property industries.
We deliver vital international aid projects for our clients.
Our united group of specialists take enormous pride in collaborating with our project partners. By digging deeper. Thinking smarter. And seeing further.
All so we can deliver the smartest solutions, every time.
Financial calendar
11 August 2014 4 November 2014 31 December 2014 9 February 2015* 13 March 2015* 27 March 2015* 30 June 2015 10 August 2015* 11 September 2015* 25 September 2015* 3 November 2015*
FY2014 full year results announcement Annual General Meeting Half year end FY2015 half year results announcement Record date FY2015 interim dividend Interim dividend for FY2015 payable Financial year end FY2015 full year results announcement Record date FY2015 final dividend Final dividend for FY2015 payable Annual General Meeting
Coffey International Limited ACN 003 835 112
* Dates subject to change
Coffey Annual Report 2014 | 1
Contents
Letter from Chairman and Managing Director
Financial performance
Our people and safety
Our operations
Our industries
Our geographies
Our behaviours
Financial report
Shareholder information
2
6
9
12
16
18
20
21
116
2 | Coffey Annual Report 2014
FY2014 saw the completion of a three year rebuilding process amidst tough trading conditions. We’ve established the fundamentals of our business and weathered a cyclical downturn to deliver considered, meaningful change. As a result, we’ve returned to profit and are now fully focused on delivering great client service to support the long term growth of our business.
Our return to profitability (with a net profit after tax of $4.4 million) was the result of concerted work in the first half to ensure the capacity of our Australian Geoservices business matched the market and improve utilisation across our operations. Our work to focus our business on three key portfolios is starting to show benefits, with Project Management returning to profitability and overall revenues stabilising. Our current structure is right for the market we’re in and provides the capacity to grow as new opportunities emerge.
While external factors continue to present challenges, we’ve done the work within the business to ensure we can now dedicate our time and energy to delivering client value and building a stronger sales culture to support long term sustainability and shareholder value.
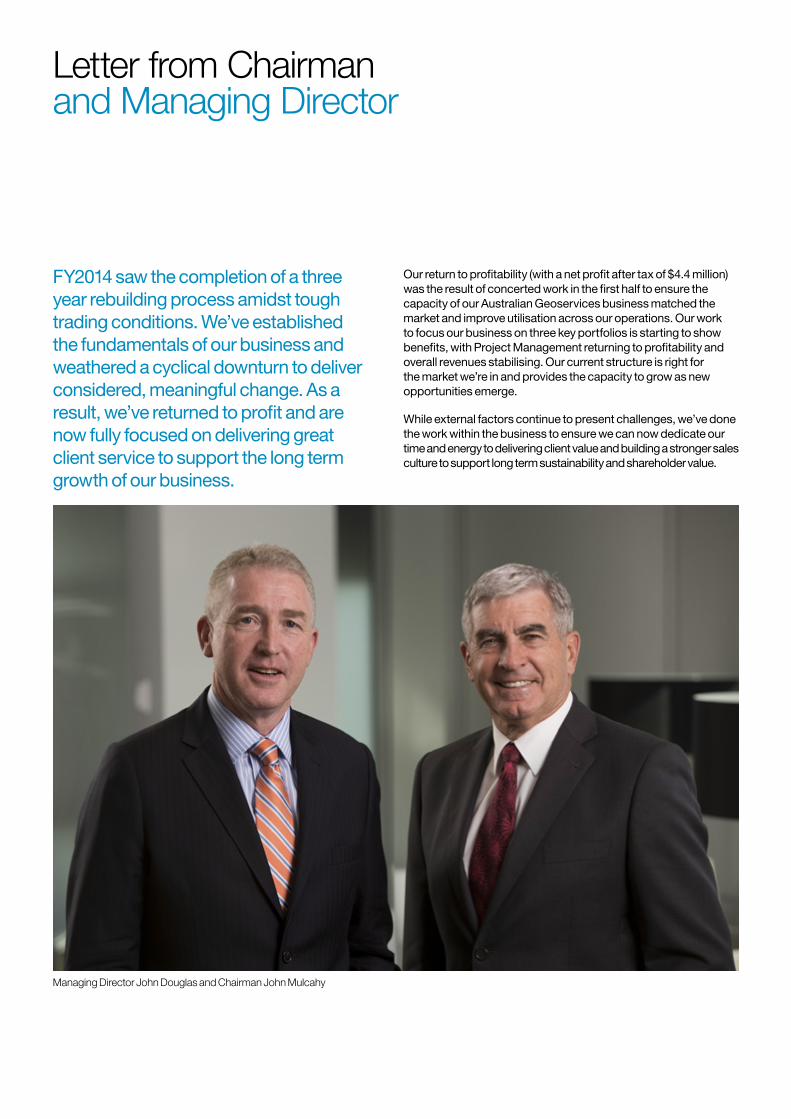
Letter from Chairman and Managing Director
Managing Director John Douglas and Chairman John Mulcahy
Coffey Annual Report 2014 | 3
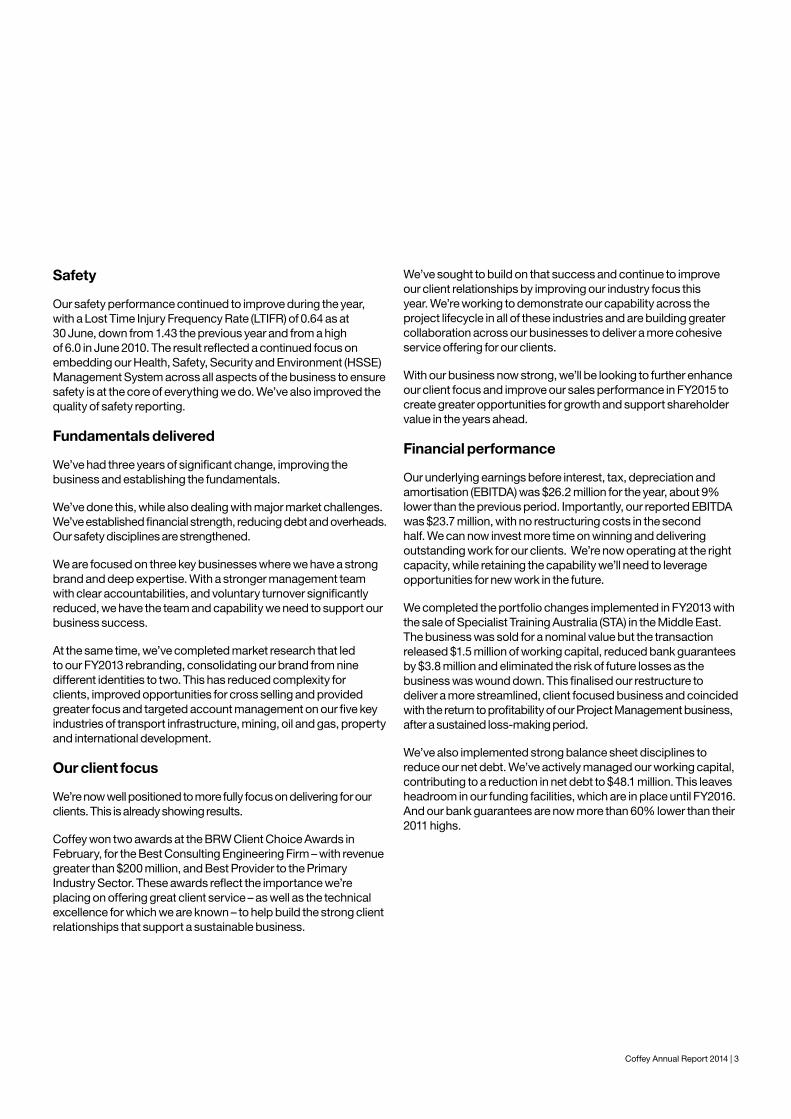
Safety
Our safety performance continued to improve during the year, with a Lost Time Injury Frequency Rate (LTIFR) of 0.64 as at 30 June, down from 1.43 the previous year and from a high of 6.0 in June 2010. The result reflected a continued focus on embedding our Health, Safety, Security and Environment (HSSE) Management System across all aspects of the business to ensure safety is at the core of everything we do. We’ve also improved the quality of safety reporting.
Fundamentals delivered
We’ve had three years of significant change, improving the business and establishing the fundamentals.
We’ve done this, while also dealing with major market challenges. We’ve established financial strength, reducing debt and overheads. Our safety disciplines are strengthened.
We are focused on three key businesses where we have a strong brand and deep expertise. With a stronger management team with clear accountabilities, and voluntary turnover significantly reduced, we have the team and capability we need to support our business success.
At the same time, we’ve completed market research that led to our FY2013 rebranding, consolidating our brand from nine different identities to two. This has reduced complexity for clients, improved opportunities for cross selling and provided greater focus and targeted account management on our five key industries of transport infrastructure, mining, oil and gas, property and international development.
Our client focus
We’re now well positioned to more fully focus on delivering for our clients. This is already showing results.
Coffey won two awards at the BRW Client Choice Awards in February, for the Best Consulting Engineering Firm – with revenue greater than $200 million, and Best Provider to the Primary Industry Sector. These awards reflect the importance we’re placing on offering great client service – as well as the technical excellence for which we are known – to help build the strong client relationships that support a sustainable business.
We’ve sought to build on that success and continue to improve our client relationships by improving our industry focus this year. We’re working to demonstrate our capability across the project lifecycle in all of these industries and are building greater collaboration across our businesses to deliver a more cohesive service offering for our clients.
With our business now strong, we’ll be looking to further enhance our client focus and improve our sales performance in FY2015 to create greater opportunities for growth and support shareholder value in the years ahead.
Financial performance
Our underlying earnings before interest, tax, depreciation and amortisation (EBITDA) was $26.2 million for the year, about 9% lower than the previous period. Importantly, our reported EBITDA was $23.7 million, with no restructuring costs in the second half. We can now invest more time on winning and delivering outstanding work for our clients. We’re now operating at the right capacity, while retaining the capability we’ll need to leverage opportunities for new work in the future.
We completed the portfolio changes implemented in FY2013 with the sale of Specialist Training Australia (STA) in the Middle East. The business was sold for a nominal value but the transaction released $1.5 million of working capital, reduced bank guarantees by $3.8 million and eliminated the risk of future losses as the business was wound down. This finalised our restructure to deliver a more streamlined, client focused business and coincided with the return to profitability of our Project Management business, after a sustained loss-making period.
We’ve also implemented strong balance sheet disciplines to reduce our net debt. We’ve actively managed our working capital, contributing to a reduction in net debt to $48.1 million. This leaves headroom in our funding facilities, which are in place until FY2016. And our bank guarantees are now more than 60% lower than their 2011 highs.
4 | Coffey Annual Report 2014
Operational performance
Geoservices revenue fell to $264.6 million, mainly due to a subdued Australian infrastructure market and uncertain global mining sector. While international Geoservices operations achieved an increase in revenue, our heavy exposure to the Australian market overshadowed these gains.
A range of external factors contributed to margin pressure, including project delays and cancellations in FY2013 and the first half of FY2014 and the poor performance of our Testing operations. Less work in the African junior mining sector, falling demand for environmental impact assessments in oil and gas and increased discounting also contributed. We’ve responded to these challenges during the year, either through changes to our business or the active management of risks associated with the end of the mining development boom. Our diversified revenue streams have partially offset the fall in demand in the mining sector, confirming the importance of building and maintaining capability across our five key industries.
Fee revenue was adversely affected by our Testing operations in the second half, with oil and gas projects coming to a close before expected new opportunities in transport infrastructure became available. However, there are early indications of growth in our consulting operations, showing some signs for optimism in Geoservices more broadly.
Our Project Management business returned to profitability, with revenue of $27.1 million. The business is now a small but effective part of our operations. Efficiencies were also achieved by improving systems and processes to manage non-recoverable costs.
Our International Development business grew strongly, with revenue climbing to $336.4 million. Now our largest part of the business, International Development’s long-term relationships with key clients and proven ability to achieve consistent results has supported our stability during the year. The business continues to develop strong relationships with the Australian Department of Foreign Affairs and Trade (DFAT), the US Agency for International Development (USAID) and the British Department for International Development (DFID).
The business has consistently delivered stable margins and has diversified its revenue streams from a heavy reliance on a few large US aid programs in previous years to a more balanced business spanning its three key clients, in addition to a number of other clients including global banks and philanthropic organisations.
The UK aid budget increased during the year, and with the restructuring of our UK operations now complete, we’re well positioned in this competitive market. In Australia, we’ve worked closely with our client as the country’s aid budget transitioned from AusAID to DFAT. In the US, we’ve continued to deliver a range of projects in our specialist area of strategic management and performance improvement, while also driving innovation through our new ‘scaling up’ service offering.
Dividend
As we continue to operate in an uncertain market, the Board has decided a dividend will not be paid this year. While our return to profit is welcomed, our debt reduction focus will deliver greater value over the long term to our shareholders. We believe this will not only support the achievement of future profits, but will create a better investment for our shareholders over time.
Remuneration
We continue to proactively manage our remuneration policy to ensure appropriate recognition and reward for our senior executives, in line with market expectations. This year saw only two service line executives achieve their short term incentives, based on the profitable performance of their businesses. However, both of these people only received 50% of their short term incentive payments due to minimum benchmarks set for overall company performance not being achieved.
Board changes
Stuart Black AM will retire from the Board at the 2014 Annual General Meeting. Stuart joined the Board in 2002 and chaired the Board Audit Committee until the formation of the combined Risk and Audit Committee in 2012. Stuart has been an important influence for the company during that time. His outstanding financial knowledge, strategic focus and business experience has been a great asset to the Board and we thank him for his commitment and support as a director.
Strategy and looking forward
There are many things to be optimistic about in FY2015, although the market continues to be very competitive in the Geoservices sector in particular. We’ve done the work to ensure the foundations of the business are strong and will actively manage the continuing uncertainty affecting the market. Effectively delivering on client expectations and understanding their concerns will be essential in this environment.
Letter from Chairman and Managing Director
Coffey Annual Report 2014 | 5
With our fixed costs reduced and organisational capability strengthened, we’ve got the right structure to support our business. However, a persistently high Australian dollar will reduce the benefit of Geoservices work overseas, limiting the positive impact of work we’re delivering in emerging markets.
There is good potential for continued growth in International Development, with changes to Australian Government aid priorities creating opportunities for private sector providers. In the UK, an increased aid budget will lead to potential new work for our European operations.
In FY2015, we’ll continue to develop our client service offering, with an emphasis on building greater collaboration across our businesses. We believe the benefits of our three years of change will allow us to put our energy where it can have the most impact in the year ahead. Our client focus and improved sales performance will be key drivers to deliver improved profitability and support a sustainable future for Coffey and our people.
Our people
We would like to thank our people for their outstanding work and dedication during the year. Coffey is built on the capability of our people and they have once again delivered outstanding work and value to our clients.
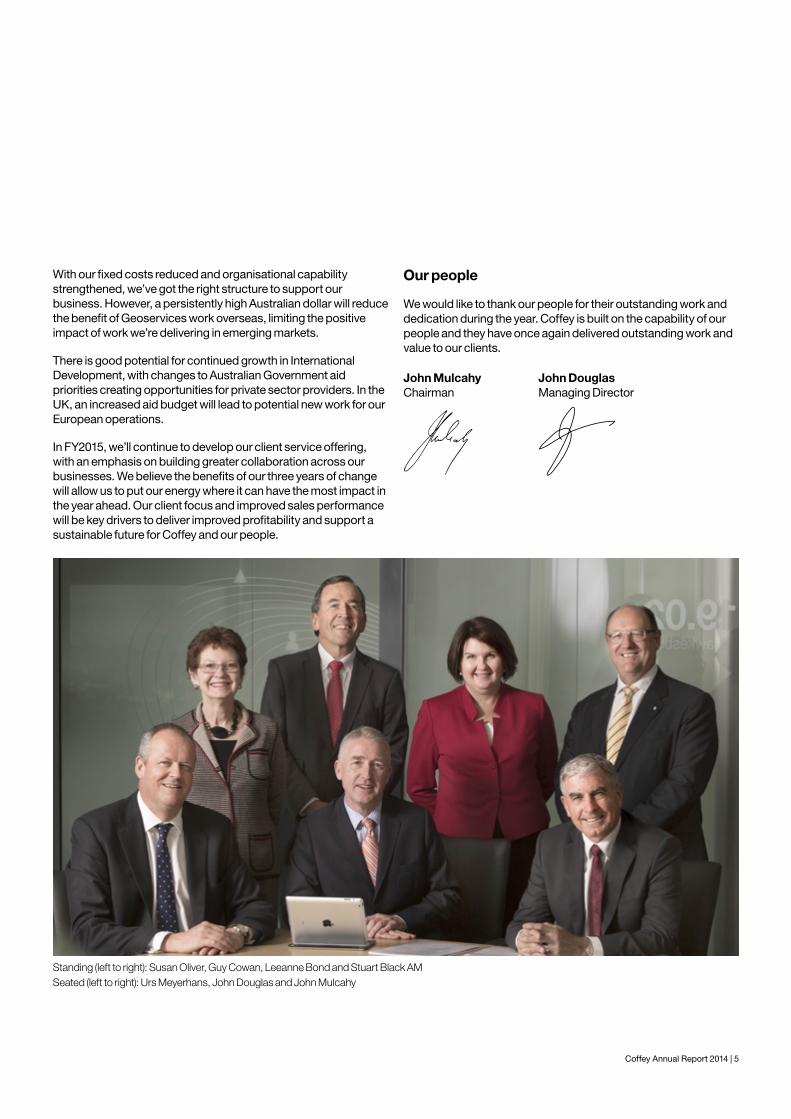
Standing (left to right): Susan Oliver, Guy Cowan, Leeanne Bond and Stuart Black AMSeated (left to right): Urs Meyerhans, John Douglas and John Mulcahy
Coffey Annual Review 2013 05
All of our businesses have schedules of contracted work for FY2014. The declining value of the Australian dollar, relative to the US dollar, is likely to work in our favour in winning new offshore work.
During the year just ended, we refreshed the Coffey brand, retiring the nine separate brands that existed earlier. Now there is one Coffey brand, with the exception of MSI, one of our International Development units, which has high recognition in the US market.
We have backed the brand refresh with six behaviours – effectively a shift in the Company’s culture – which are aimed at ensuring we deliver value for clients, and maintain safety and security as top priorities.
We anticipate this brand overhaul will be well-received by our clients in the coming months.
Undoubtedly, the global economy continues to be sluggish. The Australian economy is undergoing a substantial transition from the boom years of the early 2000s. Under such conditions, no one can provide certainty about future returns.
However, business opportunities continue to exist, particularly offshore.
We have won some of those opportunities. We are pursuing others.
We are confident the Company is on a stronger financial footing. And it is positioned for the current market, and for an upturn in the business cycle when it comes.
Recognising the contribution of staffWe recognise and acknowledge the contribution of Coffey’s staff during the year. The tough trading conditions have tested all of us.
Our performance, in these circumstances, is a credit to the commitment and effort of all our employees.
John Mulcahy John DouglasChairman Managing Director
International Development provides about 45% of total revenue, and about 30% of fee revenue. The sources of revenue are diversified, with about 70% of fee revenue earned from sources offshore (i.e. sources other than Australia).
International Development enjoyed a good year. The US-based business performed well in a tough market. The UK-based business recovered steadily. The Australian unit continued performing well.
More detail on the respective businesses is on pages 08 – 13 of this report.
Looking ahead to 2014Overall, the Company ends the year in a sound position relative to tough trading conditions.
Our fixed costs and net debt are lower. Our cost of borrowing is lower, and it will fall further in FY2014 when fixed interest debt arrangements entered into in 2008 come to an end.
Urs MeyerhansFinance Director
Rebelle MoriartyGroup Executive Human Resources
Chantalle MeijerGroup Executive Marketing & Communications
Group Management
John DouglasManaging Director
John Mulcahy Chairman
John Douglas Managing Director
6 | Coffey Annual Report 2014
Financial performance
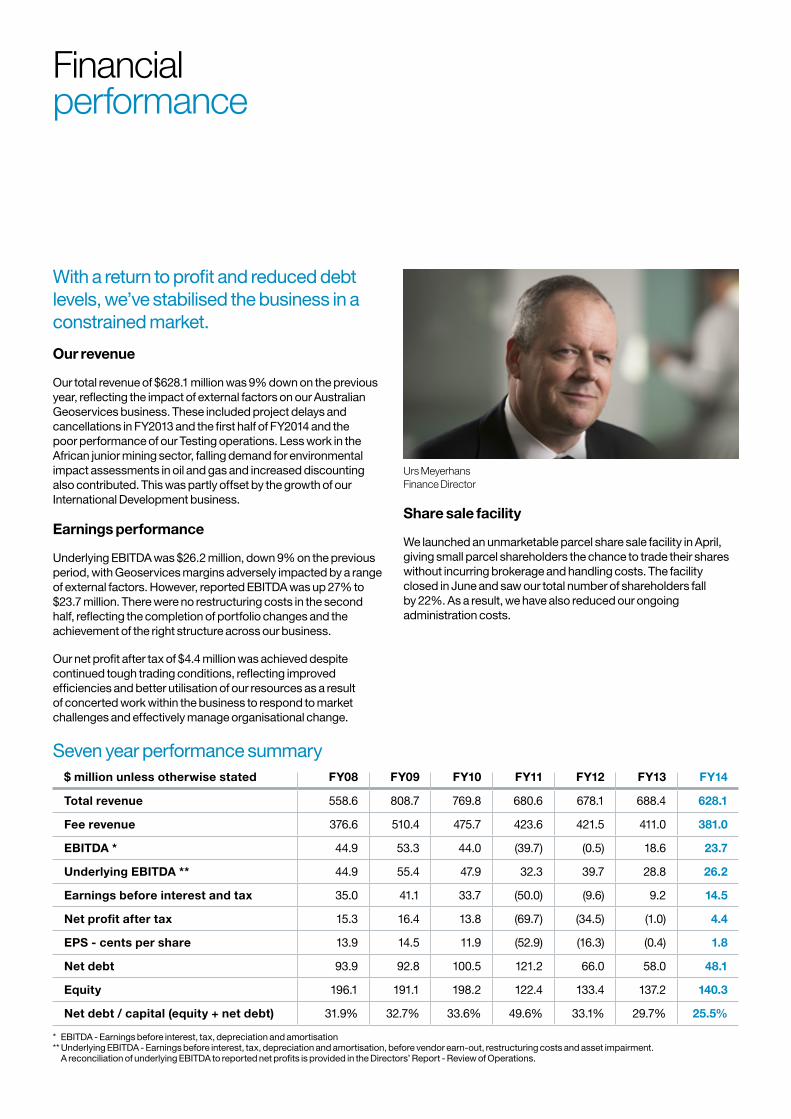
With a return to profit and reduced debt levels, we’ve stabilised the business in a constrained market.
Our revenue
Our total revenue of $628.1 million was 9% down on the previous year, reflecting the impact of external factors on our Australian Geoservices business. These included project delays and cancellations in FY2013 and the first half of FY2014 and the poor performance of our Testing operations. Less work in the African junior mining sector, falling demand for environmental impact assessments in oil and gas and increased discounting also contributed. This was partly offset by the growth of our International Development business.
Earnings performance
Underlying EBITDA was $26.2 million, down 9% on the previous period, with Geoservices margins adversely impacted by a range of external factors. However, reported EBITDA was up 27% to $23.7 million. There were no restructuring costs in the second half, reflecting the completion of portfolio changes and the achievement of the right structure across our business.
Our net profit after tax of $4.4 million was achieved despite continued tough trading conditions, reflecting improved efficiencies and better utilisation of our resources as a result of concerted work within the business to respond to market challenges and effectively manage organisational change.
Share sale facility
We launched an unmarketable parcel share sale facility in April, giving small parcel shareholders the chance to trade their shares without incurring brokerage and handling costs. The facility closed in June and saw our total number of shareholders fall by 22%. As a result, we have also reduced our ongoing administration costs.
* EBITDA - Earnings before interest, tax, depreciation and amortisation ** Underlying EBITDA - Earnings before interest, tax, depreciation and amortisation, before vendor earn-out, restructuring costs and asset impairment. A reconciliation of underlying EBITDA to reported net profits is provided in the Directors’ Report - Review of Operations.
$ million unless otherwise stated FY08 FY09 FY10 FY11 FY12 FY13 FY14
Total revenue 558.6 808.7 769.8 680.6 678.1 688.4 628.1
Fee revenue 376.6 510.4 475.7 423.6 421.5 411.0 381.0
EBITDA * 44.9 53.3 44.0 (39.7) (0.5) 18.6 23.7
Underlying EBITDA ** 44.9 55.4 47.9 32.3 39.7 28.8 26.2
Earnings before interest and tax 35.0 41.1 33.7 (50.0) (9.6) 9.2 14.5
Net profit after tax 15.3 16.4 13.8 (69.7) (34.5) (1.0) 4.4
EPS - cents per share 13.9 14.5 11.9 (52.9) (16.3) (0.4) 1.8
Net debt 93.9 92.8 100.5 121.2 66.0 58.0 48.1
Equity 196.1 191.1 198.2 122.4 133.4 137.2 140.3
Net debt / capital (equity + net debt) 31.9% 32.7% 33.6% 49.6% 33.1% 29.7% 25.5%
Seven year performance summary
Urs Meyerhans Finance Director
Coffey Annual Report 2014 | 7
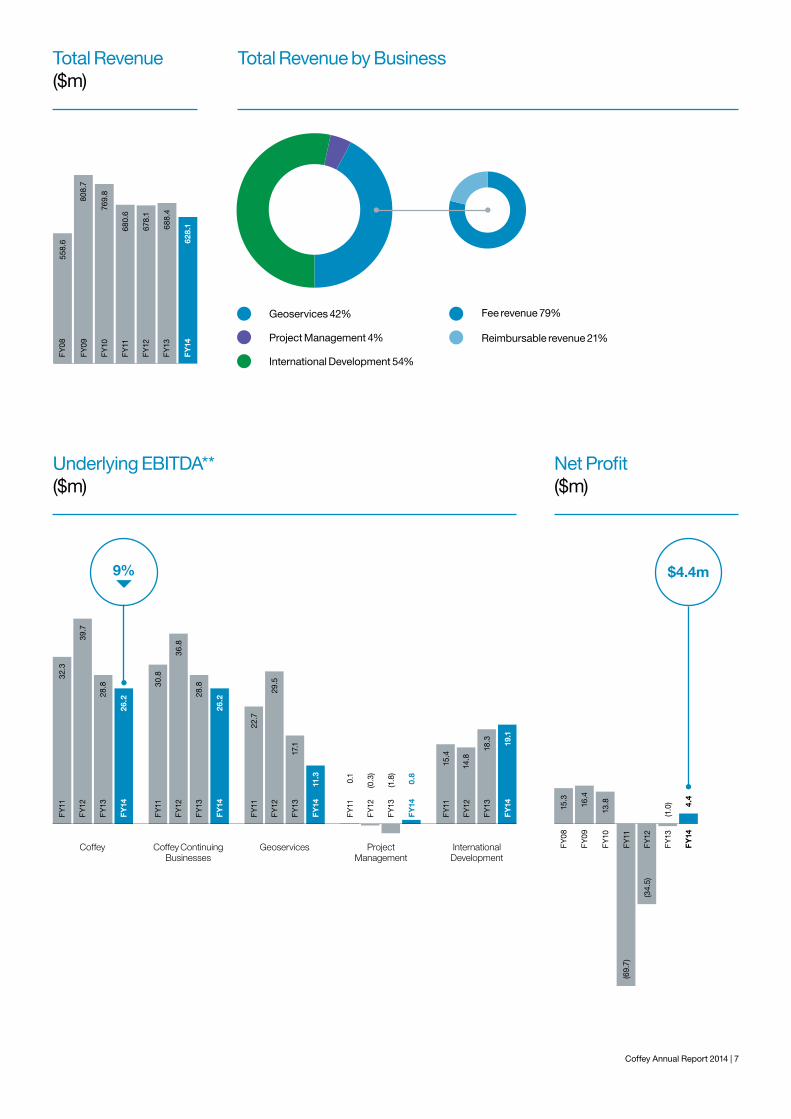
Total Revenue ($m)
FY
0855
8.6
808.
7
769.
8
680.
6
678.
1
688.
4
628.
1
FY
11
FY
12
FY
13
FY
14
FY
10
FY
09
Underlying EBITDA** ($m)
9%
32.3
39.7
28.8
26.2
30.8
36.8
28.8
26.2
22.7
29.5
17.1
11.3 0.1
(0.3
)
(1.8
)
0.8
15.4
14.8
18.3 19
.1
FY
11
FY
11
FY
11
FY
11
FY
11
FY
12
FY
12
FY
12
FY
12
FY
12
FY
13
FY
13
FY
13
FY
13
FY
13
FY
14
FY
14
FY
14
FY
14
FY
14
Coffey Coffey Continuing Businesses
Geoservices Project Management
International Development
Fee revenue 79%
Reimbursable revenue 21%
Total Revenue by Business
Geoservices 42%
Project Management 4%
International Development 54%
Net Profit ($m)
15.3
16.4
13.8 4.
4
FY
08
FY
11(6
9.7)
(34.
5)
(1.0
)
FY
12
FY
13
FY
14
FY
10
FY
09$4.4m
8 | Coffey Annual Report 2014
Net debt
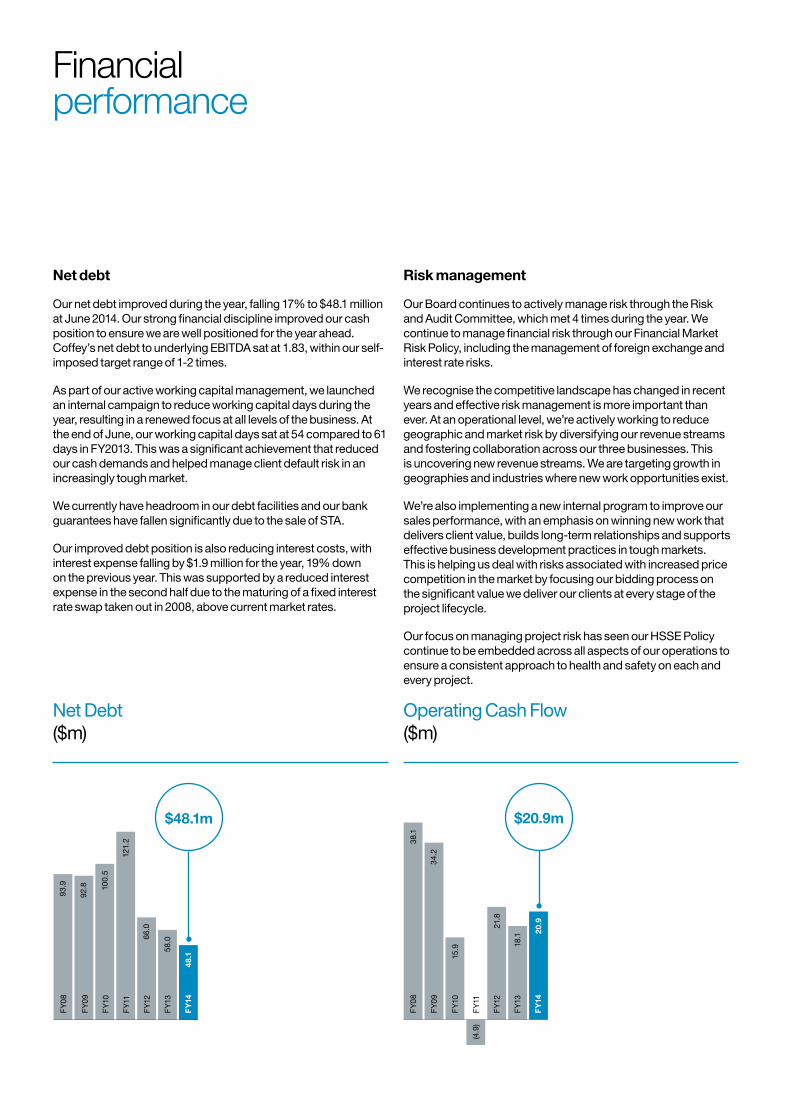
Our net debt improved during the year, falling 17% to $48.1 million at June 2014. Our strong financial discipline improved our cash position to ensure we are well positioned for the year ahead. Coffey’s net debt to underlying EBITDA sat at 1.83, within our self-imposed target range of 1-2 times.
As part of our active working capital management, we launched an internal campaign to reduce working capital days during the year, resulting in a renewed focus at all levels of the business. At the end of June, our working capital days sat at 54 compared to 61 days in FY2013. This was a significant achievement that reduced our cash demands and helped manage client default risk in an increasingly tough market.
We currently have headroom in our debt facilities and our bank guarantees have fallen significantly due to the sale of STA.
Our improved debt position is also reducing interest costs, with interest expense falling by $1.9 million for the year, 19% down on the previous year. This was supported by a reduced interest expense in the second half due to the maturing of a fixed interest rate swap taken out in 2008, above current market rates.
Risk management
Our Board continues to actively manage risk through the Risk and Audit Committee, which met 4 times during the year. We continue to manage financial risk through our Financial Market Risk Policy, including the management of foreign exchange and interest rate risks.
We recognise the competitive landscape has changed in recent years and effective risk management is more important than ever. At an operational level, we’re actively working to reduce geographic and market risk by diversifying our revenue streams and fostering collaboration across our three businesses. This is uncovering new revenue streams. We are targeting growth in geographies and industries where new work opportunities exist.
We’re also implementing a new internal program to improve our sales performance, with an emphasis on winning new work that delivers client value, builds long-term relationships and supports effective business development practices in tough markets. This is helping us deal with risks associated with increased price competition in the market by focusing our bidding process on the significant value we deliver our clients at every stage of the project lifecycle.
Our focus on managing project risk has seen our HSSE Policy continue to be embedded across all aspects of our operations to ensure a consistent approach to health and safety on each and every project.
Financial performance
Operating Cash Flow ($m)
$20.9m
38.1
34.2
15.9
21.8
18.1 20
.9
FY
08
FY
11(4
.9)
FY
12
FY
13
FY
14
FY
10
FY
09
Net Debt ($m)
$48.1m
93.9
92.8 10
0.5
121.
2
66.0
58.0
48.1
FY
08
FY
11
FY
12
FY
13
FY
14
FY
10
FY
09
Coffey Annual Report 2014 | 9
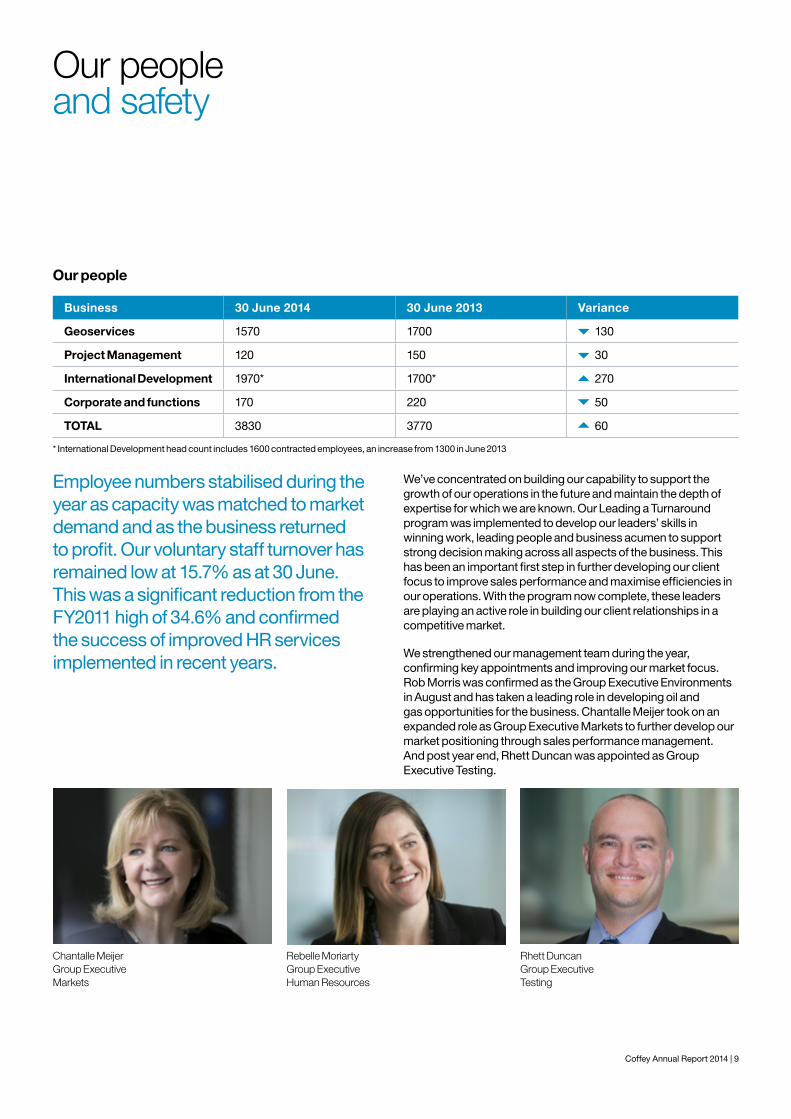
Business 30 June 2014 30 June 2013 Variance
Geoservices 1570 1700 130
Project Management 120 150 30
International Development 1970* 1700* 270
Corporate and functions 170 220 50
TOTAL 3830 3770 60
Our people and safety
Our people
Employee numbers stabilised during the year as capacity was matched to market demand and as the business returned to profit. Our voluntary staff turnover has remained low at 15.7% as at 30 June. This was a significant reduction from the FY2011 high of 34.6% and confirmed the success of improved HR services implemented in recent years.
We’ve concentrated on building our capability to support the growth of our operations in the future and maintain the depth of expertise for which we are known. Our Leading a Turnaround program was implemented to develop our leaders’ skills in winning work, leading people and business acumen to support strong decision making across all aspects of the business. This has been an important first step in further developing our client focus to improve sales performance and maximise efficiencies in our operations. With the program now complete, these leaders are playing an active role in building our client relationships in a competitive market.
We strengthened our management team during the year, confirming key appointments and improving our market focus. Rob Morris was confirmed as the Group Executive Environments in August and has taken a leading role in developing oil and gas opportunities for the business. Chantalle Meijer took on an expanded role as Group Executive Markets to further develop our market positioning through sales performance management. And post year end, Rhett Duncan was appointed as Group Executive Testing.
Chantalle Meijer Group Executive Markets
Rhett Duncan Group Executive Testing
Rebelle Moriarty Group Executive Human Resources
* International Development head count includes 1600 contracted employees, an increase from 1300 in June 2013
10 | Coffey Annual Report 2014
Our people and safety
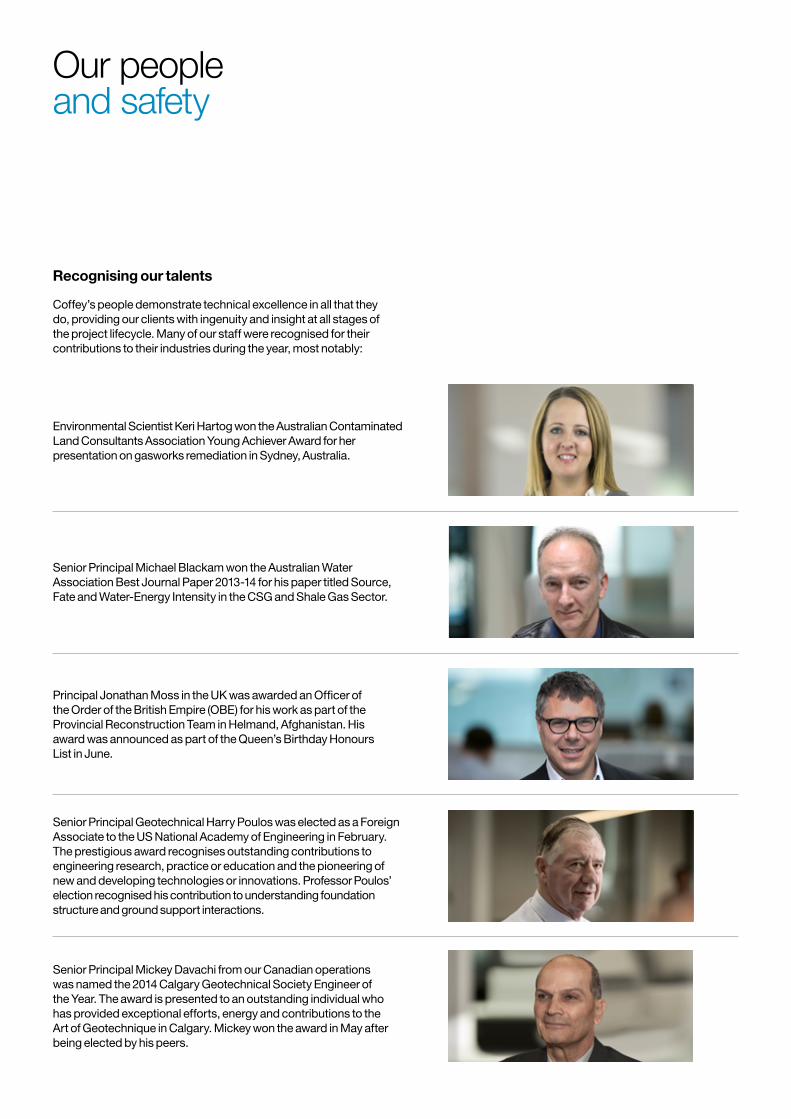
Recognising our talents
Coffey’s people demonstrate technical excellence in all that they do, providing our clients with ingenuity and insight at all stages of the project lifecycle. Many of our staff were recognised for their contributions to their industries during the year, most notably:
Principal Jonathan Moss in the UK was awarded an Officer of the Order of the British Empire (OBE) for his work as part of the Provincial Reconstruction Team in Helmand, Afghanistan. His award was announced as part of the Queen’s Birthday Honours List in June.
Senior Principal Geotechnical Harry Poulos was elected as a Foreign Associate to the US National Academy of Engineering in February. The prestigious award recognises outstanding contributions to engineering research, practice or education and the pioneering of new and developing technologies or innovations. Professor Poulos’ election recognised his contribution to understanding foundation structure and ground support interactions.
Senior Principal Mickey Davachi from our Canadian operations was named the 2014 Calgary Geotechnical Society Engineer of the Year. The award is presented to an outstanding individual who has provided exceptional efforts, energy and contributions to the Art of Geotechnique in Calgary. Mickey won the award in May after being elected by his peers.
Senior Principal Michael Blackam won the Australian Water Association Best Journal Paper 2013-14 for his paper titled Source, Fate and Water-Energy Intensity in the CSG and Shale Gas Sector.
Environmental Scientist Keri Hartog won the Australian Contaminated Land Consultants Association Young Achiever Award for her presentation on gasworks remediation in Sydney, Australia.
Coffey Annual Report 2014 | 11
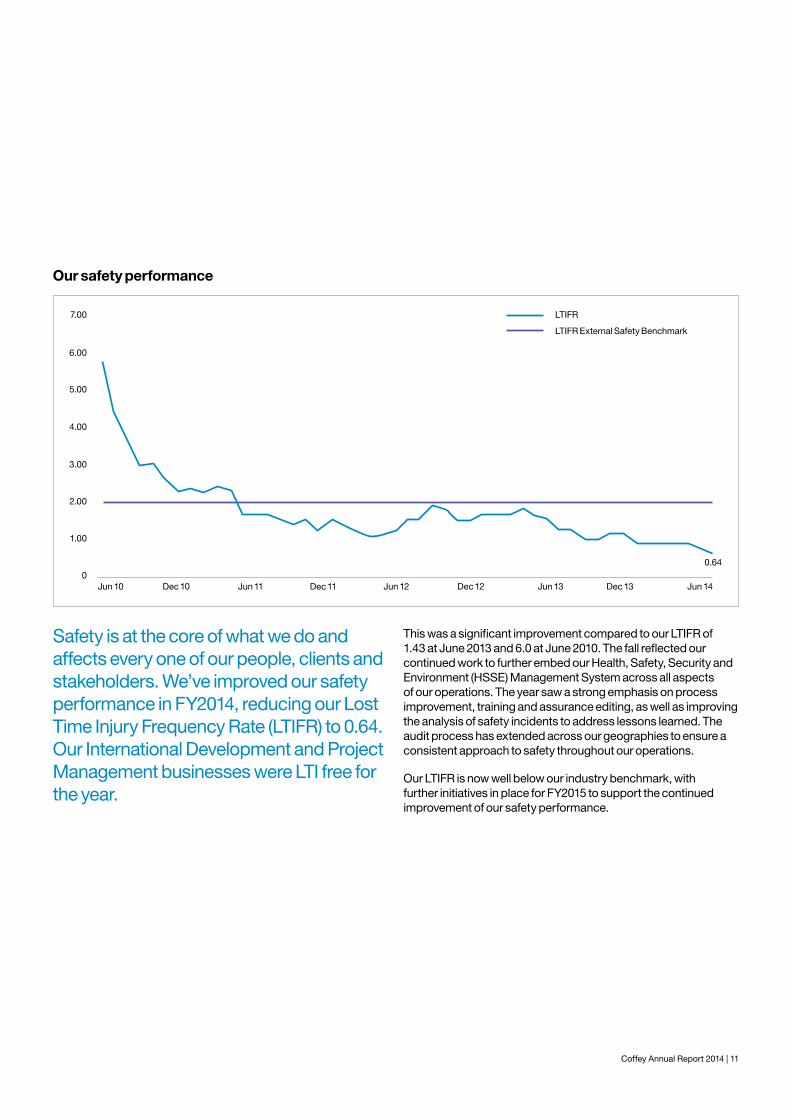
Safety is at the core of what we do and affects every one of our people, clients and stakeholders. We’ve improved our safety performance in FY2014, reducing our Lost Time Injury Frequency Rate (LTIFR) to 0.64. Our International Development and Project Management businesses were LTI free for the year.
This was a significant improvement compared to our LTIFR of 1.43 at June 2013 and 6.0 at June 2010. The fall reflected our continued work to further embed our Health, Safety, Security and Environment (HSSE) Management System across all aspects of our operations. The year saw a strong emphasis on process improvement, training and assurance editing, as well as improving the analysis of safety incidents to address lessons learned. The audit process has extended across our geographies to ensure a consistent approach to safety throughout our operations.
Our LTIFR is now well below our industry benchmark, with further initiatives in place for FY2015 to support the continued improvement of our safety performance.
Our safety performance
7.00
6.00
5.00
4.00
0.64
3.00
2.00
1.00
0Jun 10 Dec 10 Jun 11 Dec 11 Jun 12
LTIFR
LTIFR External Safety Benchmark
Dec 12 Jun 13 Dec 13 Jun 14
12 | Coffey Annual Report 2014
A sustainable business has strong foundations that allow its people to focus on the things that matter. We’ve done a lot to balance our business and build stability to support our people to deliver client value and win work.
Our client focus and understanding of the global markets we’re working in is driving growth opportunities for the future.
Our businesses
Contracted revenue
Our contracted revenue reflects a strong pipeline of work for our longer term International Development business, as well as a good foundation for our other businesses to win new work during the year. International Development has secured $230.7 million of contracted revenue, an increase from $164.9 million in June 2013.
Geoservices contracted fee revenue of $90 million reflects the short term nature of many contract awards for the business. While uncertainty remains in the Australian Geoservices market, this remains a positive start for the business as it increases its work winning focus.
Project Management’s contracted revenue of $15 million is in line with expectations and confirms its position as a small but important part of the business.
Ouroperations
Business FY2014 revenue FY2013 revenue
Geoservices $264.6 million $348.9 million
Project Management $27.1 million $32.6 million
International Development $336.4 million $306.9 million
TOTAL $628.1 million $688.4 million
Coffey Annual Report 2014 | 13
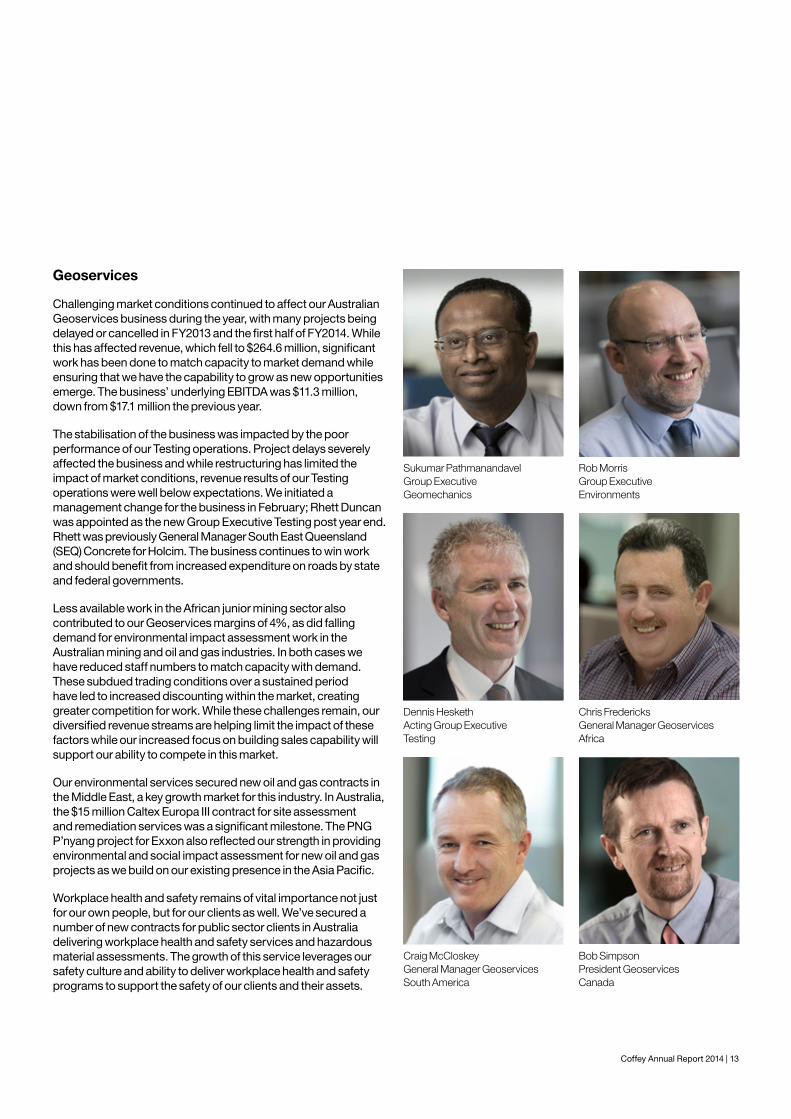
Geoservices
Challenging market conditions continued to affect our Australian Geoservices business during the year, with many projects being delayed or cancelled in FY2013 and the first half of FY2014. While this has affected revenue, which fell to $264.6 million, significant work has been done to match capacity to market demand while ensuring that we have the capability to grow as new opportunities emerge. The business’ underlying EBITDA was $11.3 million, down from $17.1 million the previous year.
The stabilisation of the business was impacted by the poor performance of our Testing operations. Project delays severely affected the business and while restructuring has limited the impact of market conditions, revenue results of our Testing operations were well below expectations. We initiated a management change for the business in February; Rhett Duncan was appointed as the new Group Executive Testing post year end. Rhett was previously General Manager South East Queensland (SEQ) Concrete for Holcim. The business continues to win work and should benefit from increased expenditure on roads by state and federal governments.
Less available work in the African junior mining sector also contributed to our Geoservices margins of 4%, as did falling demand for environmental impact assessment work in the Australian mining and oil and gas industries. In both cases we have reduced staff numbers to match capacity with demand. These subdued trading conditions over a sustained period have led to increased discounting within the market, creating greater competition for work. While these challenges remain, our diversified revenue streams are helping limit the impact of these factors while our increased focus on building sales capability will support our ability to compete in this market.
Our environmental services secured new oil and gas contracts in the Middle East, a key growth market for this industry. In Australia, the $15 million Caltex Europa III contract for site assessment and remediation services was a significant milestone. The PNG P’nyang project for Exxon also reflected our strength in providing environmental and social impact assessment for new oil and gas projects as we build on our existing presence in the Asia Pacific.
Workplace health and safety remains of vital importance not just for our own people, but for our clients as well. We’ve secured a number of new contracts for public sector clients in Australia delivering workplace health and safety services and hazardous material assessments. The growth of this service leverages our safety culture and ability to deliver workplace health and safety programs to support the safety of our clients and their assets.
Sukumar Pathmanandavel Group Executive Geomechanics
Dennis Hesketh Acting Group Executive Testing
Craig McCloskey General Manager Geoservices South America
Chris Fredericks General Manager Geoservices Africa
Bob Simpson President Geoservices Canada
Rob Morris Group Executive Environments
14 | Coffey Annual Report 2014
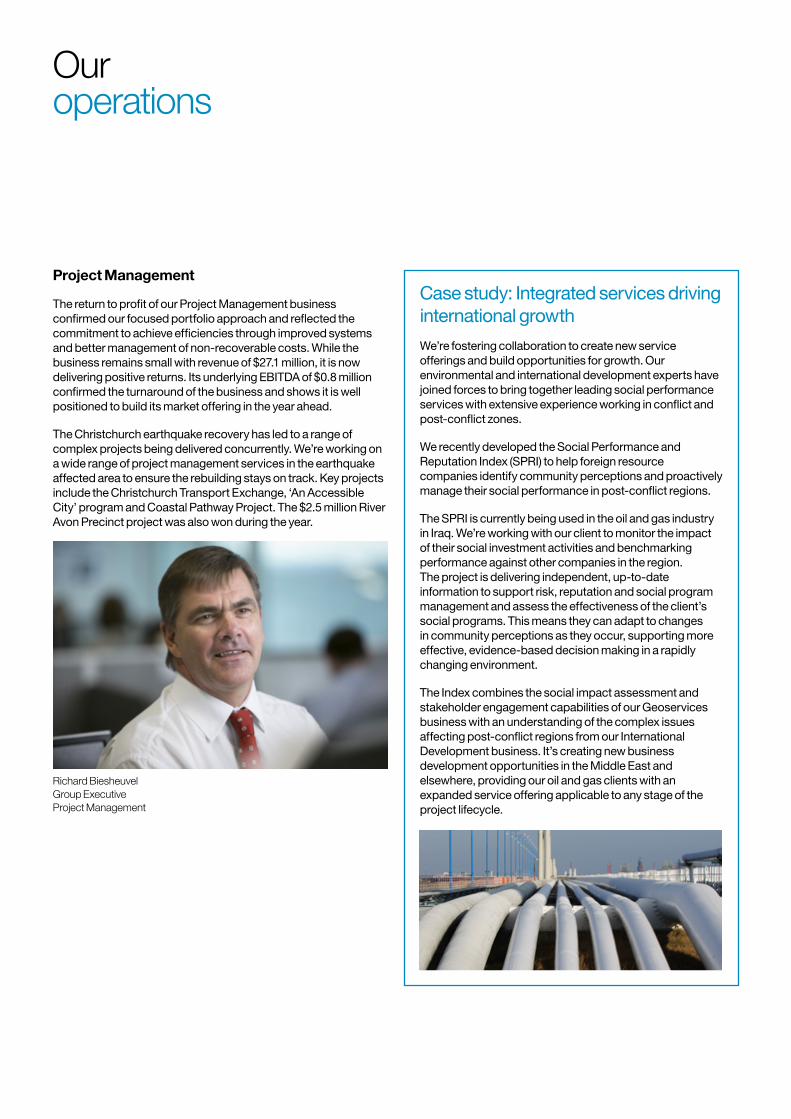
Project Management
The return to profit of our Project Management business confirmed our focused portfolio approach and reflected the commitment to achieve efficiencies through improved systems and better management of non-recoverable costs. While the business remains small with revenue of $27.1 million, it is now delivering positive returns. Its underlying EBITDA of $0.8 million confirmed the turnaround of the business and shows it is well positioned to build its market offering in the year ahead.
The Christchurch earthquake recovery has led to a range of complex projects being delivered concurrently. We’re working on a wide range of project management services in the earthquake affected area to ensure the rebuilding stays on track. Key projects include the Christchurch Transport Exchange, ‘An Accessible City’ program and Coastal Pathway Project. The $2.5 million River Avon Precinct project was also won during the year.
Ouroperations
Case study: Integrated services driving international growth
We’re fostering collaboration to create new service offerings and build opportunities for growth. Our environmental and international development experts have joined forces to bring together leading social performance services with extensive experience working in conflict and post-conflict zones.
We recently developed the Social Performance and Reputation Index (SPRI) to help foreign resource companies identify community perceptions and proactively manage their social performance in post-conflict regions.
The SPRI is currently being used in the oil and gas industry in Iraq. We’re working with our client to monitor the impact of their social investment activities and benchmarking performance against other companies in the region. The project is delivering independent, up-to-date information to support risk, reputation and social program management and assess the effectiveness of the client’s social programs. This means they can adapt to changes in community perceptions as they occur, supporting more effective, evidence-based decision making in a rapidly changing environment.
The Index combines the social impact assessment and stakeholder engagement capabilities of our Geoservices business with an understanding of the complex issues affecting post-conflict regions from our International Development business. It’s creating new business development opportunities in the Middle East and elsewhere, providing our oil and gas clients with an expanded service offering applicable to any stage of the project lifecycle.
Richard Biesheuvel Group Executive Project Management
Coffey Annual Report 2014 | 15
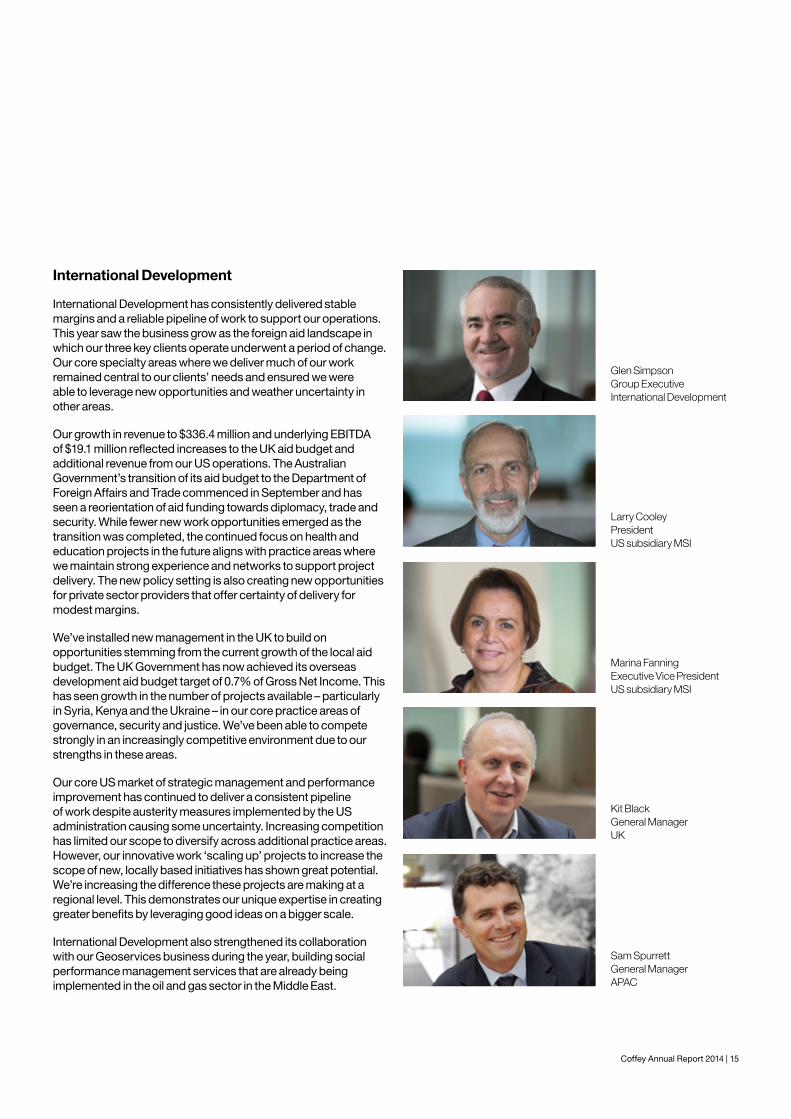
Glen Simpson Group Executive International Development
Marina Fanning Executive Vice President US subsidiary MSI
Larry Cooley President US subsidiary MSI
Kit Black General Manager UK
Sam Spurrett General Manager APAC
International Development
International Development has consistently delivered stable margins and a reliable pipeline of work to support our operations. This year saw the business grow as the foreign aid landscape in which our three key clients operate underwent a period of change. Our core specialty areas where we deliver much of our work remained central to our clients’ needs and ensured we were able to leverage new opportunities and weather uncertainty in other areas.
Our growth in revenue to $336.4 million and underlying EBITDA of $19.1 million reflected increases to the UK aid budget and additional revenue from our US operations. The Australian Government’s transition of its aid budget to the Department of Foreign Affairs and Trade commenced in September and has seen a reorientation of aid funding towards diplomacy, trade and security. While fewer new work opportunities emerged as the transition was completed, the continued focus on health and education projects in the future aligns with practice areas where we maintain strong experience and networks to support project delivery. The new policy setting is also creating new opportunities for private sector providers that offer certainty of delivery for modest margins.
We’ve installed new management in the UK to build on opportunities stemming from the current growth of the local aid budget. The UK Government has now achieved its overseas development aid budget target of 0.7% of Gross Net Income. This has seen growth in the number of projects available – particularly in Syria, Kenya and the Ukraine – in our core practice areas of governance, security and justice. We’ve been able to compete strongly in an increasingly competitive environment due to our strengths in these areas.
Our core US market of strategic management and performance improvement has continued to deliver a consistent pipeline of work despite austerity measures implemented by the US administration causing some uncertainty. Increasing competition has limited our scope to diversify across additional practice areas. However, our innovative work ‘scaling up’ projects to increase the scope of new, locally based initiatives has shown great potential. We’re increasing the difference these projects are making at a regional level. This demonstrates our unique expertise in creating greater benefits by leveraging good ideas on a bigger scale.
International Development also strengthened its collaboration with our Geoservices business during the year, building social performance management services that are already being implemented in the oil and gas sector in the Middle East.
16 | Coffey Annual Report 2014
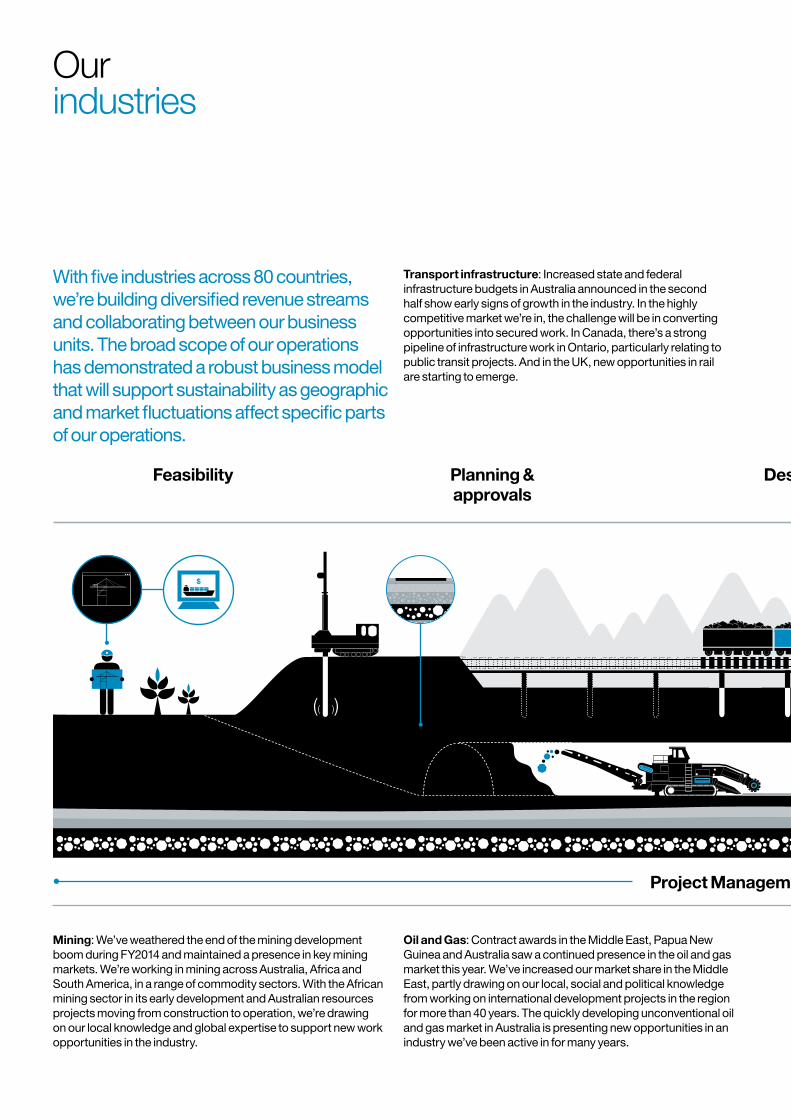
Transport infrastructure: Increased state and federal infrastructure budgets in Australia announced in the second half show early signs of growth in the industry. In the highly competitive market we’re in, the challenge will be in converting opportunities into secured work. In Canada, there’s a strong pipeline of infrastructure work in Ontario, particularly relating to public transit projects. And in the UK, new opportunities in rail are starting to emerge.
With five industries across 80 countries, we’re building diversified revenue streams and collaborating between our business units. The broad scope of our operations has demonstrated a robust business model that will support sustainability as geographic and market fluctuations affect specific parts of our operations.
Mining: We’ve weathered the end of the mining development boom during FY2014 and maintained a presence in key mining markets. We’re working in mining across Australia, Africa and South America, in a range of commodity sectors. With the African mining sector in its early development and Australian resources projects moving from construction to operation, we’re drawing on our local knowledge and global expertise to support new work opportunities in the industry.
Oil and Gas: Contract awards in the Middle East, Papua New Guinea and Australia saw a continued presence in the oil and gas market this year. We’ve increased our market share in the Middle East, partly drawing on our local, social and political knowledge from working on international development projects in the region for more than 40 years. The quickly developing unconventional oil and gas market in Australia is presenting new opportunities in an industry we’ve been active in for many years.
))))
$
Project Management & Geoservices
Feasibility Planning &approvals
Design Construction Management &maintenance
Ourindustries
Coffey Annual Report 2014 | 17
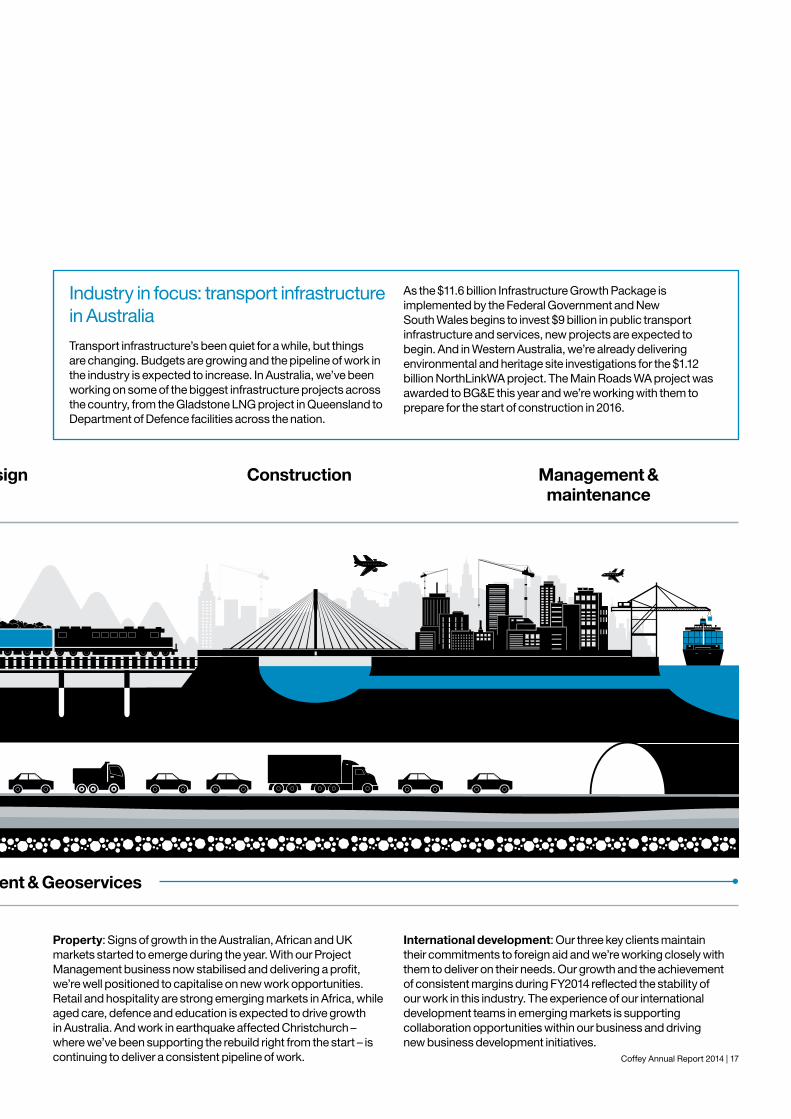
Industry in focus: transport infrastructure in Australia
Transport infrastructure’s been quiet for a while, but things are changing. Budgets are growing and the pipeline of work in the industry is expected to increase. In Australia, we’ve been working on some of the biggest infrastructure projects across the country, from the Gladstone LNG project in Queensland to Department of Defence facilities across the nation.
As the $11.6 billion Infrastructure Growth Package is implemented by the Federal Government and New South Wales begins to invest $9 billion in public transport infrastructure and services, new projects are expected to begin. And in Western Australia, we’re already delivering environmental and heritage site investigations for the $1.12 billion NorthLinkWA project. The Main Roads WA project was awarded to BG&E this year and we’re working with them to prepare for the start of construction in 2016.
))))
$
Project Management & Geoservices
Feasibility Planning &approvals
Design Construction Management &maintenance
Property: Signs of growth in the Australian, African and UK markets started to emerge during the year. With our Project Management business now stabilised and delivering a profit, we’re well positioned to capitalise on new work opportunities. Retail and hospitality are strong emerging markets in Africa, while aged care, defence and education is expected to drive growth in Australia. And work in earthquake affected Christchurch – where we’ve been supporting the rebuild right from the start – is continuing to deliver a consistent pipeline of work.
International development: Our three key clients maintain their commitments to foreign aid and we’re working closely with them to deliver on their needs. Our growth and the achievement of consistent margins during FY2014 reflected the stability of our work in this industry. The experience of our international development teams in emerging markets is supporting collaboration opportunities within our business and driving new business development initiatives.
18 | Coffey Annual Report 2014
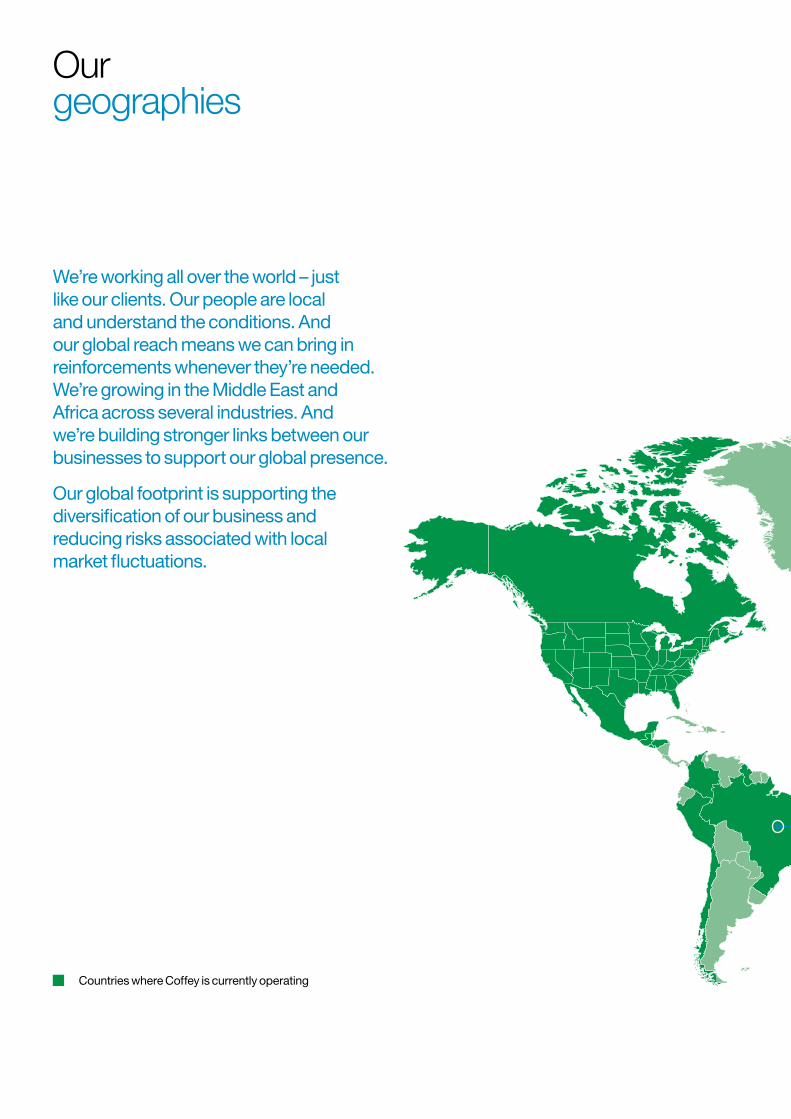
We’re working all over the world – just like our clients. Our people are local and understand the conditions. And our global reach means we can bring in reinforcements whenever they’re needed. We’re growing in the Middle East and Africa across several industries. And we’re building stronger links between our businesses to support our global presence.
Our global footprint is supporting the diversification of our business and reducing risks associated with local market fluctuations.
Ourgeographies
Countries where Coffey is currently operating
Coffey Annual Report 2014 | 19
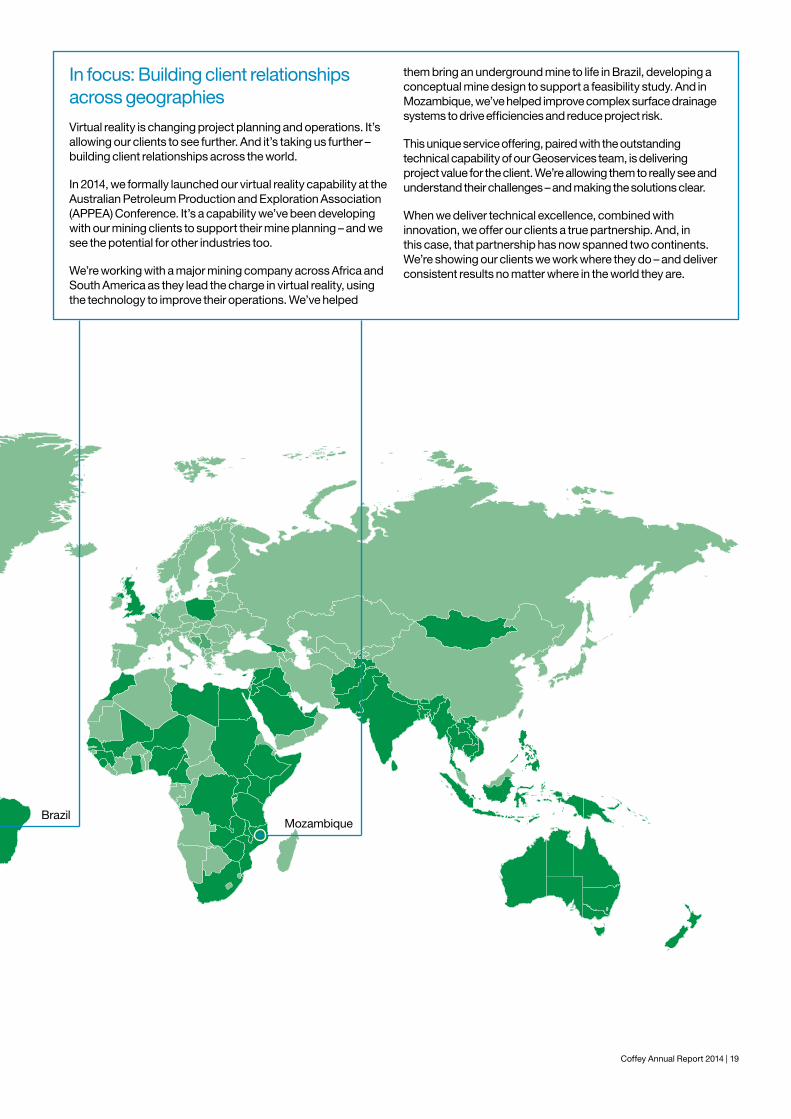
In focus: Building client relationships across geographies
Virtual reality is changing project planning and operations. It’s allowing our clients to see further. And it’s taking us further – building client relationships across the world.
In 2014, we formally launched our virtual reality capability at the Australian Petroleum Production and Exploration Association (APPEA) Conference. It’s a capability we’ve been developing with our mining clients to support their mine planning – and we see the potential for other industries too.
We’re working with a major mining company across Africa and South America as they lead the charge in virtual reality, using the technology to improve their operations. We’ve helped
them bring an underground mine to life in Brazil, developing a conceptual mine design to support a feasibility study. And in Mozambique, we’ve helped improve complex surface drainage systems to drive efficiencies and reduce project risk.
This unique service offering, paired with the outstanding technical capability of our Geoservices team, is delivering project value for the client. We’re allowing them to really see and understand their challenges – and making the solutions clear.
When we deliver technical excellence, combined with innovation, we offer our clients a true partnership. And, in this case, that partnership has now spanned two continents. We’re showing our clients we work where they do – and deliver consistent results no matter where in the world they are.
BrazilMozambique
20 | Coffey Annual Report 2014
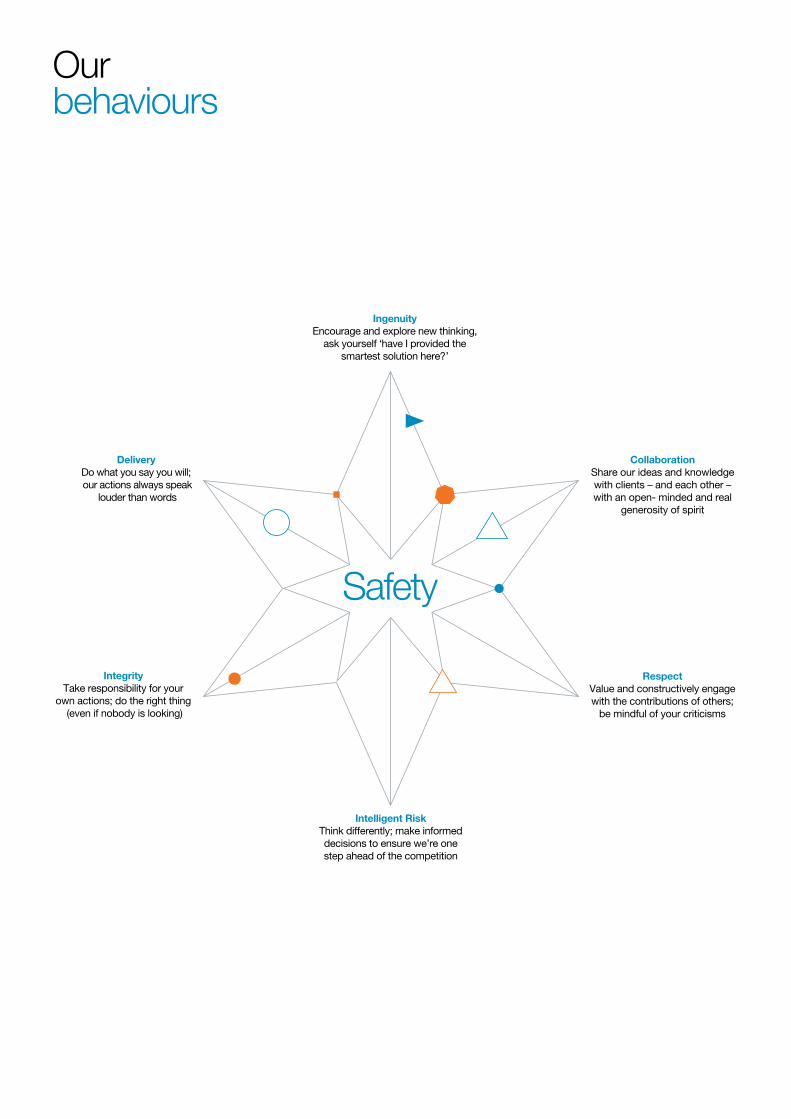
Our behaviours
IngenuityEncourage and explore new thinking,
ask yourself ‘have I provided the smartest solution here?’
DeliveryDo what you say you will; our actions always speak
louder than words
IntegrityTake responsibility for your
own actions; do the right thing (even if nobody is looking)
Intelligent RiskThink differently; make informed decisions to ensure we’re one step ahead of the competition
RespectValue and constructively engage with the contributions of others;
be mindful of your criticisms
CollaborationShare our ideas and knowledgewith clients – and each other –with an open- minded and real
generosity of spirit
Safety
Coffey Annual Report 2014 | 21
Coffey International Limited
Coffey Annual Report 2014 | 21
2014 Financial Report to Shareholders
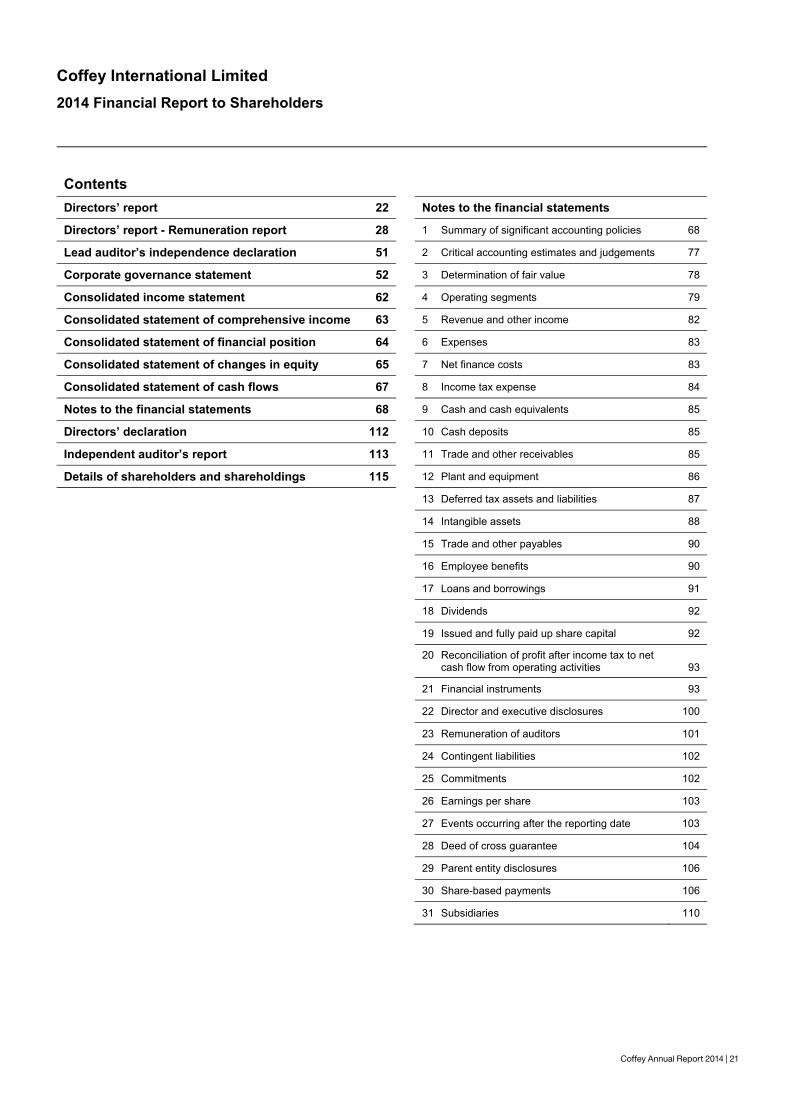
Contents
Directors’ report 22 Notes to the financial statements
Directors’ report - Remuneration report 28 1 Summary of significant accounting policies 68
Lead auditor’s independence declaration 51 2 Critical accounting estimates and judgements 77
Corporate governance statement 52 3 Determination of fair value 78
Consolidated income statement 62 4 Operating segments 79
Consolidated statement of comprehensive income 63 5 Revenue and other income 82
Consolidated statement of financial position 64 6 Expenses 83
Consolidated statement of changes in equity 65 7 Net finance costs 83
Consolidated statement of cash flows 67 8 Income tax expense 84
Notes to the financial statements 68 9 Cash and cash equivalents 85
Directors’ declaration 112 10 Cash deposits 85
Independent auditor’s report 113 11 Trade and other receivables 85
Details of shareholders and shareholdings 115 12 Plant and equipment 86
13 Deferred tax assets and liabilities 87
14 Intangible assets 88
15 Trade and other payables 90
16 Employee benefits 90
17 Loans and borrowings 91
18 Dividends 92
19 Issued and fully paid up share capital 92
20 Reconciliation of profit after income tax to net cash flow from operating activities 93
21 Financial instruments 93
22 Director and executive disclosures 100
23 Remuneration of auditors 101
24 Contingent liabilities 102
25 Commitments 102
26 Earnings per share 103
27 Events occurring after the reporting date 103
28 Deed of cross guarantee 104
29 Parent entity disclosures 106
30 Share-based payments 106
31 Subsidiaries 110
22 | Coffey Annual Report 2014
Coffey International Limited Directors’ report
22 | Coffey Annual Report 2014
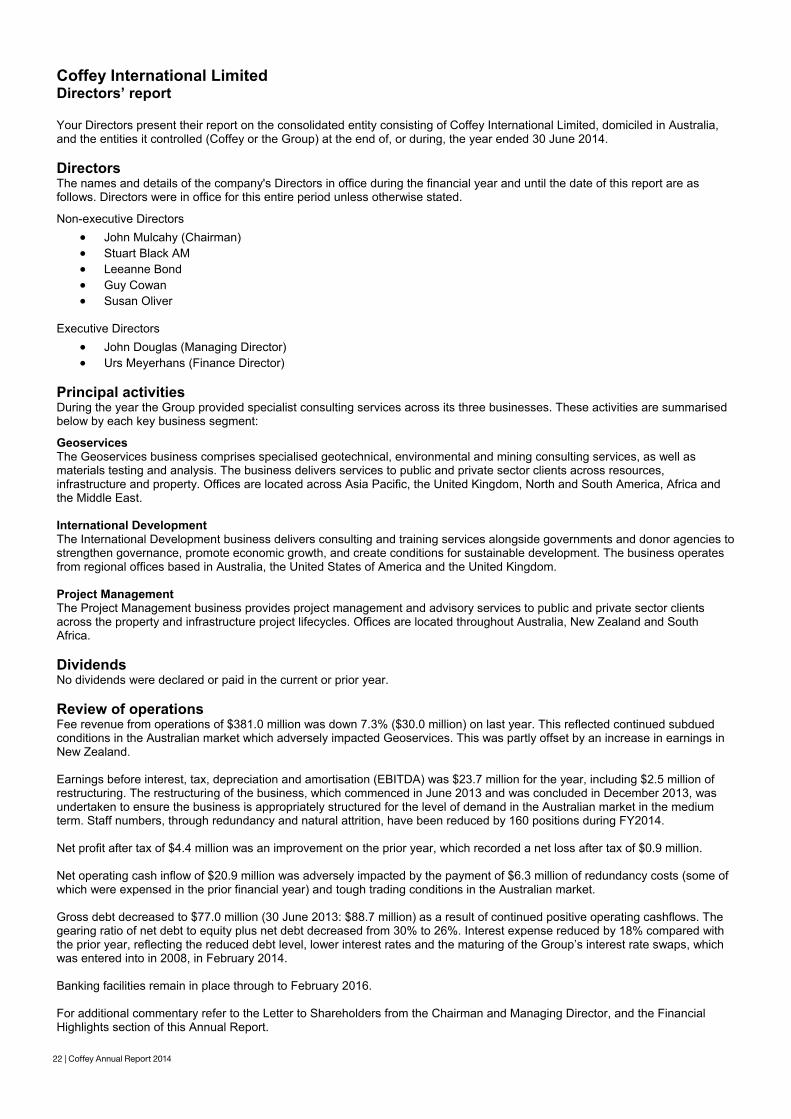
Your Directors present their report on the consolidated entity consisting of Coffey International Limited, domiciled in Australia, and the entities it controlled (Coffey or the Group) at the end of, or during, the year ended 30 June 2014. Directors The names and details of the company's Directors in office during the financial year and until the date of this report are as follows. Directors were in office for this entire period unless otherwise stated.
Non-executive Directors John Mulcahy (Chairman) Stuart Black AM Leeanne Bond Guy Cowan Susan Oliver
Executive Directors
John Douglas (Managing Director) Urs Meyerhans (Finance Director)
Principal activities During the year the Group provided specialist consulting services across its three businesses. These activities are summarised below by each key business segment:
Geoservices The Geoservices business comprises specialised geotechnical, environmental and mining consulting services, as well as materials testing and analysis. The business delivers services to public and private sector clients across resources, infrastructure and property. Offices are located across Asia Pacific, the United Kingdom, North and South America, Africa and the Middle East. International Development The International Development business delivers consulting and training services alongside governments and donor agencies to strengthen governance, promote economic growth, and create conditions for sustainable development. The business operates from regional offices based in Australia, the United States of America and the United Kingdom. Project Management The Project Management business provides project management and advisory services to public and private sector clients across the property and infrastructure project lifecycles. Offices are located throughout Australia, New Zealand and South Africa. Dividends No dividends were declared or paid in the current or prior year. Review of operations Fee revenue from operations of $381.0 million was down 7.3% ($30.0 million) on last year. This reflected continued subdued conditions in the Australian market which adversely impacted Geoservices. This was partly offset by an increase in earnings in New Zealand. Earnings before interest, tax, depreciation and amortisation (EBITDA) was $23.7 million for the year, including $2.5 million of restructuring. The restructuring of the business, which commenced in June 2013 and was concluded in December 2013, was undertaken to ensure the business is appropriately structured for the level of demand in the Australian market in the medium term. Staff numbers, through redundancy and natural attrition, have been reduced by 160 positions during FY2014. Net profit after tax of $4.4 million was an improvement on the prior year, which recorded a net loss after tax of $0.9 million. Net operating cash inflow of $20.9 million was adversely impacted by the payment of $6.3 million of redundancy costs (some of which were expensed in the prior financial year) and tough trading conditions in the Australian market. Gross debt decreased to $77.0 million (30 June 2013: $88.7 million) as a result of continued positive operating cashflows. The gearing ratio of net debt to equity plus net debt decreased from 30% to 26%. Interest expense reduced by 18% compared with the prior year, reflecting the reduced debt level, lower interest rates and the maturing of the Group’s interest rate swaps, which was entered into in 2008, in February 2014. Banking facilities remain in place through to February 2016. For additional commentary refer to the Letter to Shareholders from the Chairman and Managing Director, and the Financial Highlights section of this Annual Report.
Coffey Annual Report 2014 | 23
Coffey International Limited Directors’ report
Coffey Annual Report 2014 | 23
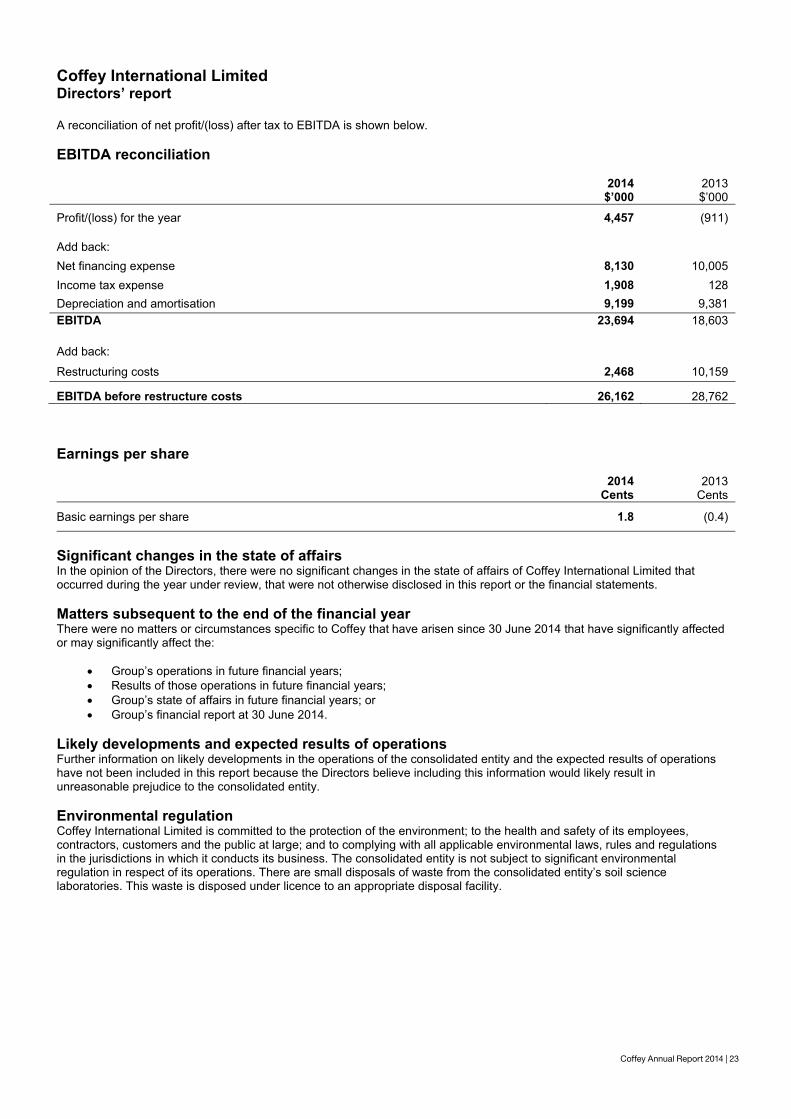
A reconciliation of net profit/(loss) after tax to EBITDA is shown below. EBITDA reconciliation
2014 2013 $’000 $’000
Profit/(loss) for the year 4,457 (911)
Add back: Net financing expense 8,130 10,005 Income tax expense 1,908 128 Depreciation and amortisation 9,199 9,381 EBITDA 23,694 18,603
Add back:
Restructuring costs 2,468 10,159
EBITDA before restructure costs 26,162 28,762 Earnings per share
2014 Cents
2013 Cents
Basic earnings per share 1.8 (0.4)
Significant changes in the state of affairs In the opinion of the Directors, there were no significant changes in the state of affairs of Coffey International Limited that occurred during the year under review, that were not otherwise disclosed in this report or the financial statements. Matters subsequent to the end of the financial year There were no matters or circumstances specific to Coffey that have arisen since 30 June 2014 that have significantly affected or may significantly affect the:
Group’s operations in future financial years; Results of those operations in future financial years; Group’s state of affairs in future financial years; or Group’s financial report at 30 June 2014.
Likely developments and expected results of operations Further information on likely developments in the operations of the consolidated entity and the expected results of operations have not been included in this report because the Directors believe including this information would likely result in unreasonable prejudice to the consolidated entity. Environmental regulation Coffey International Limited is committed to the protection of the environment; to the health and safety of its employees, contractors, customers and the public at large; and to complying with all applicable environmental laws, rules and regulations in the jurisdictions in which it conducts its business. The consolidated entity is not subject to significant environmental regulation in respect of its operations. There are small disposals of waste from the consolidated entity’s soil science laboratories. This waste is disposed under licence to an appropriate disposal facility.
24 | Coffey Annual Report 2014
Coffey International Limited Directors’ report
24 | Coffey Annual Report 2014
Directors’ qualifications, experience, other directorships and special responsibilities
John Mulcahy PhD, BE (Civil Eng) (Hons), FIEAust, MAICD Chairman, Age 64
Term: Non-executive Director since September 2009 (5 years), Chairman since November 2010
Independent: Yes
Committees: Chair Nomination Committee
Member Risk and Audit Committee Human Resources and Remuneration Committee
Directorships: Chairman of Mirvac Limited. Non-executive Director of ALS Limited, GWA Holdings Limited and Mirvac Funds Management Limited, and a Guardian of the Future Fund of Australia. Former Managing Director and Chief Executive Officer of Suncorp-Metway Limited.
Experience: John is one of Australia’s most respected corporate leaders, with almost 30 years of senior management experience having worked extensively in financial services and property investment. Before joining Coffey, he was Managing Director and Chief Executive Officer of Suncorp-Metway Limited. John has also held a range of senior executive roles at the Commonwealth Bank and Lend Lease Corporation.
John Douglas, BEng (Hons), MBA, MAICD Managing Director, Age 52
Term: Managing Director since March 2011
Independent: No
Committees: No Committee membership
Directorships: No other listed company directorships
Experience: John has over 25 years’ international experience in strategic consulting and senior management, as well as hands-on experience as a geotechnical engineer. Before joining Coffey, John was Executive General Manager of Boral Limited’s Australian Construction Materials business. In this role, he managed a business with a turnover of more than $2 billion spread across four business streams. Prior to working at Boral, John was a manager at Boston Consulting Group where he provided strategic advice to high profile companies across a wide range of industries and countries.
Urs Meyerhans CA (CH), MAICD Finance Director, Age 54
Term: Finance Director since February 2012
Independent: No
Committees: No Committee membership
Directorships: Former Finance Director of Wattyl Limited.
Experience: Urs joined Coffey as Chief Financial Officer (CFO) in early 2009 and was appointed Finance Director in early 2012. Urs has 30 years of senior finance and international general management experience in the resources, manufacturing, FMCG and professional services industries. His expertise includes capital management, strategic planning and restructuring, refinancing of debt requirements and merger and acquisitions. Urs also plays a key role in investor relationship management at Coffey as he did in his role at Wattyl Limited. Prior to joining Coffey, Urs was CFO of Swiss Aluminium Australia Limited, Group Financial Controller of WMC Resources Limited, CFO of United Group Limited and Wattyl Limited where he was appointed Finance Director in 2004.
Coffey Annual Report 2014 | 25
Coffey International Limited Directors’ report
Coffey Annual Report 2014 | 25
Stuart Black AM, FCA, FAICD Age 59
Term: Non-executive Director since March 2002 (12 years)
Independent: Yes
Committees: Member Risk and Audit Committee Human Resources and Remuneration Committee Nomination Committee
Directorships: Non-executive Director of Australian Agricultural Company Limited, NetComm Wireless Limited and the Country Education Foundation of Australia Ltd. Chair of Chartered Accountants Benevolent Foundation Ltd. Former acting Chair and current Director of the Accounting Professional and Ethical Standards Board Ltd. Past President of the Institute of Chartered Accountants in Australia.
Experience: Stuart is a prominent Chartered Accountant with extensive experience of working in professional services. His expertise includes strategic planning, governance, financial and management accounting and corporate advisory. Stuart is the former Managing Partner in the chartered accounting firm Chapman Eastway.
Leeanne Bond BEng (Chem), MBA, FIEAust, RPEQ, GAICDAge 49
Term: Non-executive Director since February 2012 (2 years)
Independent: Yes
Committees: Member Risk and Audit Committee Human Resources and Remuneration Committee
Directorships: Deputy Chair of the Territory Generation Corporation and a Non-executive Director of Liquefied Natural Gas Limited and JK Tech Pty Ltd (a wholly owned subsidiary of The University of Queensland). Former Non-executive Director of Tarong Energy Corporation Limited, Queensland Bulk Water Supply Authority (Seqwater) and subsidiaries and Australian Water Recycling Centre of Excellence Ltd. Former chair of the Brisbane Water Advisory Board, Brisbane City Council.
Experience: Leeanne is an experienced senior manager and independent company Director with particular expertise in engineering, business strategy, risk and innovation. She has Board experience in the energy, minerals and water sectors. From 1996 to 2006, Leeanne worked with Worley Parsons and played a key role in establishing and growing the business in Queensland, PNG and Northern Territory within a global context. During this period, she was responsible for negotiating project alliances, supervising projects and delivering commercial outcomes across the energy, minerals, infrastructure and water resources sectors.
Guy Cowan, BSc (Eng) (Hons), FCA, MAICD Age 63
Term: Non-executive Director since February 2012 (2 years)
Independent: Yes
Committees: Chair Risk and Audit Committee
Member Human Resources and Remuneration Committee
Directorships: Non-executive Director of UGL Limited and Queensland Sugar Limited. Former Non-executive Director of Ludowici Limited, Raisama Limited and Gold Oil PLC (UK).
Experience: Guy has worked extensively in the oil and gas industry, including more than 23 years working in senior international finance and strategy roles at Shell. This included the positions of Chief Financial Officer (CFO) of Shell Petroleum Inc. and CFO and Director of Shell Oil Company (USA). Guy joined the Fonterra Co-operative Group Limited in 2005 as CFO and was responsible for growth and investments in Latin America. He also worked as a chartered accountant with Price Waterhouse and KPMG.
26 | Coffey Annual Report 2014
Coffey International Limited Directors’ report
26 | Coffey Annual Report 2014
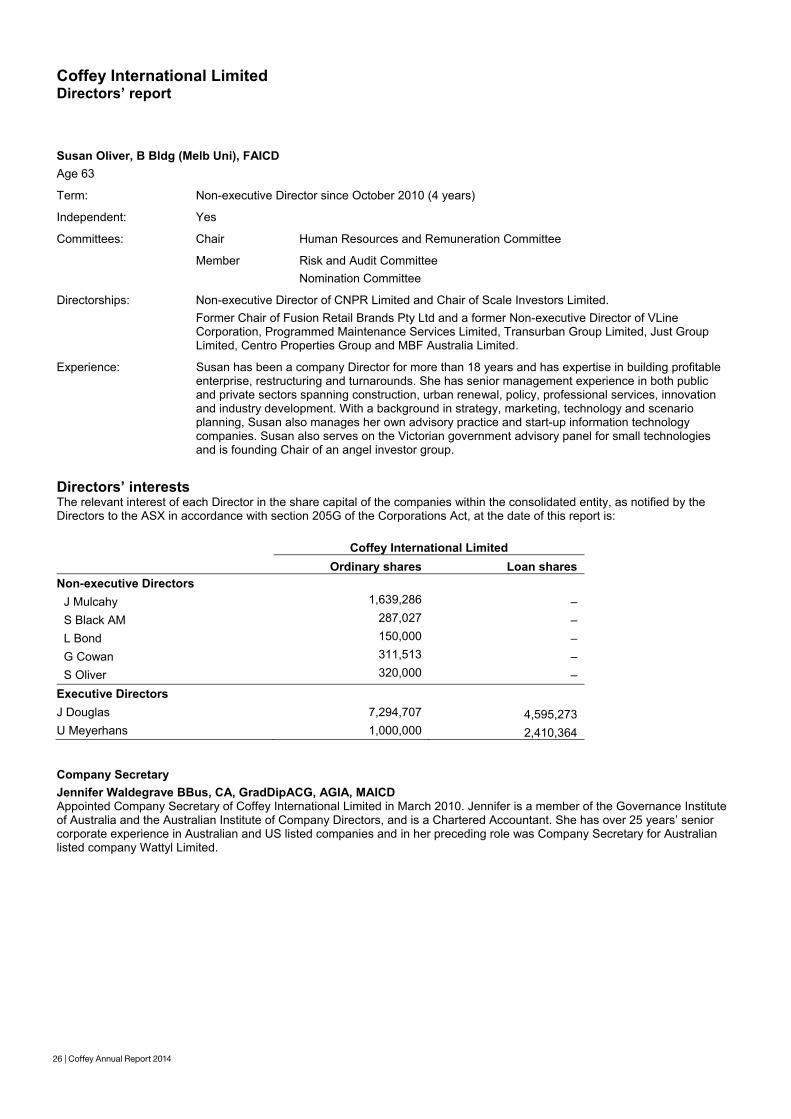
Susan Oliver, B Bldg (Melb Uni), FAICD Age 63
Term: Non-executive Director since October 2010 (4 years)
Independent: Yes
Committees: Chair Human Resources and Remuneration Committee
Member Risk and Audit Committee Nomination Committee
Directorships: Non-executive Director of CNPR Limited and Chair of Scale Investors Limited. Former Chair of Fusion Retail Brands Pty Ltd and a former Non-executive Director of VLine Corporation, Programmed Maintenance Services Limited, Transurban Group Limited, Just Group Limited, Centro Properties Group and MBF Australia Limited.
Experience: Susan has been a company Director for more than 18 years and has expertise in building profitable enterprise, restructuring and turnarounds. She has senior management experience in both public and private sectors spanning construction, urban renewal, policy, professional services, innovation and industry development. With a background in strategy, marketing, technology and scenario planning, Susan also manages her own advisory practice and start-up information technology companies. Susan also serves on the Victorian government advisory panel for small technologies and is founding Chair of an angel investor group.
Directors’ interests The relevant interest of each Director in the share capital of the companies within the consolidated entity, as notified by the Directors to the ASX in accordance with section 205G of the Corporations Act, at the date of this report is:
Coffey International Limited Ordinary shares Loan shares
Non-executive Directors
J Mulcahy 1,639,286 – S Black AM 287,027 – L Bond 150,000 – G Cowan 311,513 – S Oliver 320,000 –
Executive Directors J Douglas 7,294,707 4,595,273 U Meyerhans 1,000,000 2,410,364 Company Secretary Jennifer Waldegrave BBus, CA, GradDipACG, AGIA, MAICD Appointed Company Secretary of Coffey International Limited in March 2010. Jennifer is a member of the Governance Institute of Australia and the Australian Institute of Company Directors, and is a Chartered Accountant. She has over 25 years’ senior corporate experience in Australian and US listed companies and in her preceding role was Company Secretary for Australian listed company Wattyl Limited.
Coffey Annual Report 2014 | 27
Coffey International Limited Directors’ report
Coffey Annual Report 2014 | 27
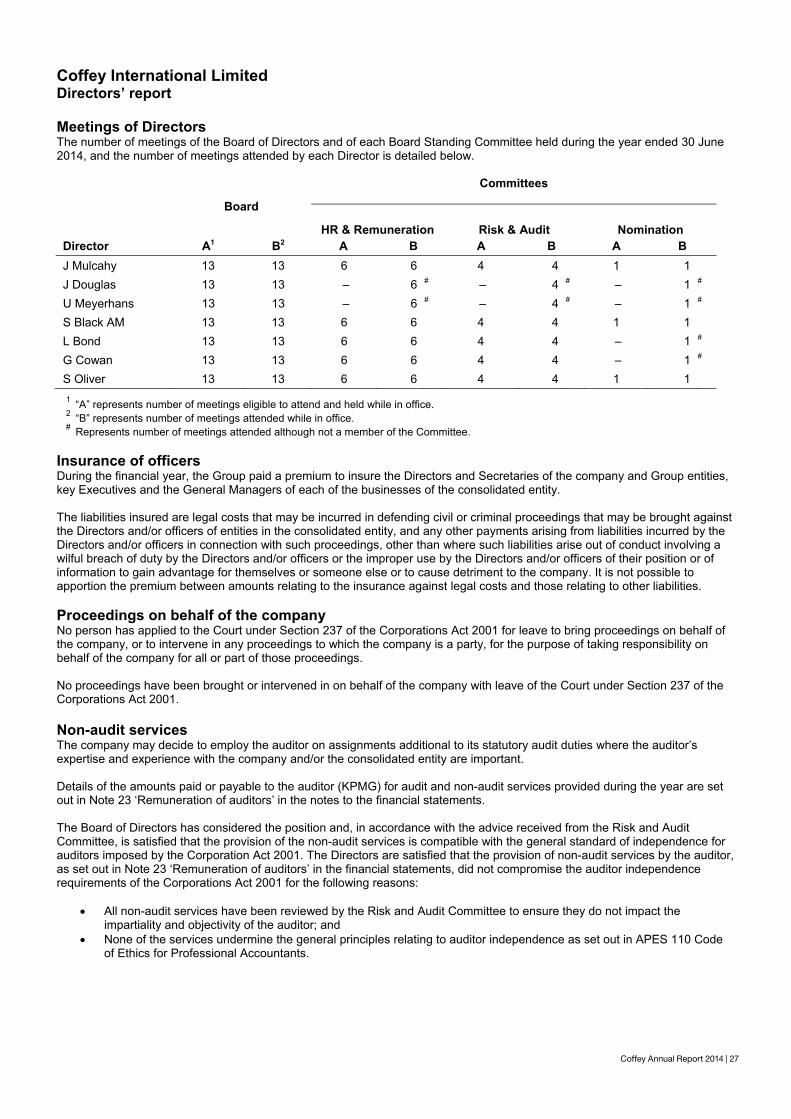
Meetings of Directors The number of meetings of the Board of Directors and of each Board Standing Committee held during the year ended 30 June 2014, and the number of meetings attended by each Director is detailed below.
Board
Committees
HR & Remuneration Risk & Audit Nomination Director A1 B2 A B A B A B J Mulcahy 13 13 6 6 4 4 1 1 J Douglas 13 13 – 6 # – 4 # – 1 #
U Meyerhans 13 13 – 6 # – 4 # – 1 #
S Black AM 13 13 6 6 4 4 1 1 L Bond 13 13 6 6 4 4 – 1 #
G Cowan 13 13 6 6 4 4 – 1 #
S Oliver 13 13 6 6 4 4 1 1 1 “A” represents number of meetings eligible to attend and held while in office. 2 “B” represents number of meetings attended while in office. # Represents number of meetings attended although not a member of the Committee.
Insurance of officers During the financial year, the Group paid a premium to insure the Directors and Secretaries of the company and Group entities, key Executives and the General Managers of each of the businesses of the consolidated entity. The liabilities insured are legal costs that may be incurred in defending civil or criminal proceedings that may be brought against the Directors and/or officers of entities in the consolidated entity, and any other payments arising from liabilities incurred by the Directors and/or officers in connection with such proceedings, other than where such liabilities arise out of conduct involving a wilful breach of duty by the Directors and/or officers or the improper use by the Directors and/or officers of their position or of information to gain advantage for themselves or someone else or to cause detriment to the company. It is not possible to apportion the premium between amounts relating to the insurance against legal costs and those relating to other liabilities. Proceedings on behalf of the company No person has applied to the Court under Section 237 of the Corporations Act 2001 for leave to bring proceedings on behalf of the company, or to intervene in any proceedings to which the company is a party, for the purpose of taking responsibility on behalf of the company for all or part of those proceedings. No proceedings have been brought or intervened in on behalf of the company with leave of the Court under Section 237 of the Corporations Act 2001. Non-audit services The company may decide to employ the auditor on assignments additional to its statutory audit duties where the auditor’s expertise and experience with the company and/or the consolidated entity are important. Details of the amounts paid or payable to the auditor (KPMG) for audit and non-audit services provided during the year are set out in Note 23 ‘Remuneration of auditors’ in the notes to the financial statements. The Board of Directors has considered the position and, in accordance with the advice received from the Risk and Audit Committee, is satisfied that the provision of the non-audit services is compatible with the general standard of independence for auditors imposed by the Corporation Act 2001. The Directors are satisfied that the provision of non-audit services by the auditor, as set out in Note 23 ‘Remuneration of auditors’ in the financial statements, did not compromise the auditor independence requirements of the Corporations Act 2001 for the following reasons:
All non-audit services have been reviewed by the Risk and Audit Committee to ensure they do not impact the impartiality and objectivity of the auditor; and
None of the services undermine the general principles relating to auditor independence as set out in APES 110 Code of Ethics for Professional Accountants.
28 | Coffey Annual Report 2014
Coffey International Limited Directors’ report – Remuneration report
28 | Coffey Annual Report 2014
Remuneration Report FY2014 (audited) Executive Summary Key personnel changes in FY2014
Robert Morris was appointed to the role of Group Executive Environments on 12 August 2013. He was previously General Manager Environments Queensland and Papua New Guinea.
Michael Renehan, Group Executive Testing, ceased employment on 28 February 2014. He has been considered a former KMP in this report. Rhett Duncan was appointed to the role on 25 August 2014. Mr Duncan joined Coffey following a successful career at Holcim Pty Ltd. The terms of his appointment are in line with the remuneration arrangements for Executives as outlined in this report. He will be appointed as a KMP in the next reporting period.
Chantalle Meijer was appointed Group Executive Markets on 31 March 2014. Ms Meijer joined Coffey in December 2011 and was previously Group Executive Marketing & Communications.
There have been no changes in Non-executive Director membership during this reporting period.
Key remuneration decisions in FY2014
Fixed remuneration for Executive Directors and Executives has remained unchanged during the year, other than a market-based adjustment for one Executive. With the exception of this Executive and new Executives, salaries have been maintained at levels set in FY2012.
The Board awarded short term reward (STR) payments for two Executives who exceeded the minimum financial thresholds. Both STR entitlements were reduced by 50% due to Company performance. The full Board determined that no other Executive would receive an STR payment due to Company performance.
Nine Executives were awarded long term reward (LTR) grants in FY2014 with vesting subject to achievement of earnings per share (EPS) and total shareholder return (TSR) performance hurdles over three years, and continued service.
There was a 100% forfeiture of loan shares granted to all LTR participants under the FY2012 performance grant as performance hurdles were not achieved.
Non-executive Director fees have remained unchanged during the year. The aggregate Non-executive Director fee pool limit has also remained unchanged since the 2008 AGM.
Introduction This report provides an overview of Coffey’s Remuneration Policy and details Coffey’s Key Management Personnel (KMP) remuneration for the year ended 30 June 2014 (FY2014). For the purposes of this report, reference will be made to:
Key Management Personnel (KMP) – Non-executive Directors, Executive Directors and Executives
Non-executive Directors (NED) – Non-executive Directors
Executive Directors (ED) – Managing Director and Finance Director
Executives – Managing Director, Finance Director, Group Executive Service Lines and Group Executive Functions
Coffey Annual Report 2014 | 29
Coffey International Limited Directors’ report – Remuneration report
Coffey Annual Report 2014 | 29
The Remuneration Report is structured as: 1 Remuneration policy, practices and outcomes 2 Relationship between remuneration policy and company performance 3 The Board’s role in remuneration 4 Description of Non-executive Director remuneration 5 Description of executive remuneration 6 Director and executive remuneration details 7 Executive employment contracts 8 Legacy equity-based remuneration 9 Transactions with Key Management Personnel
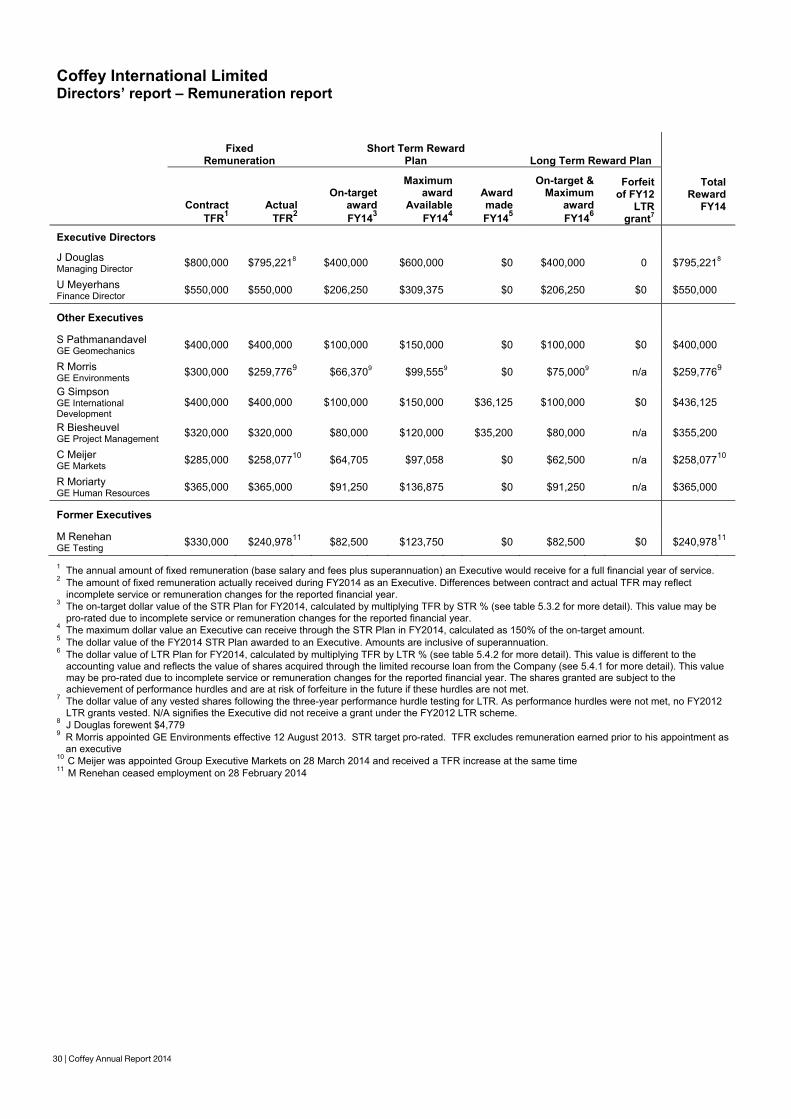
1 Remuneration policy, practices and outcomes 1.1 Remuneration policy and practices The objective of Coffey’s remuneration policy is to ensure its remuneration practices attract, motivate and retain employees from a diverse range of backgrounds with the experience, knowledge, skills and judgment to drive the company’s performance. 1.2 Remuneration Summary in FY2014 The table on the following page compares an Executive’s contracted potential remuneration for FY2014 with the actual remuneration award for the year. The Contract total fixed remuneration (TFR) shows the fixed remuneration the Executive is entitled to receive for a full year of service under their employment contract, while the Actual TFR shows the fixed remuneration earned during FY2014 in the role of an Executive. The variable remuneration disclosures show the potential on-target and maximum STR and LTR awards for FY2014, compared with the actual STR and LTR award made during the year. The LTR awards are subject to performance hurdles measured over a three-year period and at risk of forfeiture if the hurdles are not met. The LTR awards are provided through a limited recourse loan, vested shares may only be exercised after repayment of this loan. As the LTR performance hurdles are measured over three years, the performance hurdles relating to the FY2012 LTR awards were measured during the year. 100% of the FY2012 performance shares were forfeited as the hurdles were not met. This disclosure is supplementary to the statutory remuneration reporting requirements which are contained in the Remuneration Summary Tables (shown in section 6.2 and onwards). The statutory remuneration table includes additional disclosures including non-monetary benefits related to car parking, long service leave accruals and termination payments. In addition, the impact of movements in LTR grants is shown at fair value in the statutory remuneration table rather the equivalent remuneration value.
30 | Coffey Annual Report 2014
Coffey International Limited Directors’ report – Remuneration report
30 | Coffey Annual Report 2014
Fixed
Remuneration Short Term Reward
Plan Long Term Reward Plan
TotalReward
FY14
Contract TFR1
Actual TFR2
On-target awardFY143
Maximum award
AvailableFY144
Award madeFY145
On-target & Maximum
award FY146
Forfeit of FY12
LTR grant7
Executive Directors
J Douglas Managing Director $800,000 $795,2218 $400,000 $600,000 $0 $400,000 0 $795,2218
U Meyerhans Finance Director $550,000 $550,000 $206,250 $309,375 $0 $206,250 $0 $550,000
Other Executives
S Pathmanandavel GE Geomechanics $400,000 $400,000 $100,000 $150,000 $0 $100,000 $0 $400,000
R Morris GE Environments $300,000 $259,7769 $66,3709 $99,5559 $0 $75,0009 n/a $259,7769
G Simpson GE International Development
$400,000 $400,000 $100,000 $150,000 $36,125 $100,000 $0 $436,125
R Biesheuvel GE Project Management $320,000 $320,000 $80,000 $120,000 $35,200 $80,000 n/a $355,200
C Meijer GE Markets $285,000 $258,07710 $64,705 $97,058 $0 $62,500 n/a $258,07710
R Moriarty GE Human Resources $365,000 $365,000 $91,250 $136,875 $0 $91,250 n/a $365,000
Former Executives
M Renehan GE Testing $330,000 $240,97811 $82,500 $123,750 $0 $82,500 $0 $240,97811
1 The annual amount of fixed remuneration (base salary and fees plus superannuation) an Executive would receive for a full financial year of service. 2 The amount of fixed remuneration actually received during FY2014 as an Executive. Differences between contract and actual TFR may reflect incomplete service or remuneration changes for the reported financial year. 3 The on-target dollar value of the STR Plan for FY2014, calculated by multiplying TFR by STR % (see table 5.3.2 for more detail). This value may be pro-rated due to incomplete service or remuneration changes for the reported financial year. 4 The maximum dollar value an Executive can receive through the STR Plan in FY2014, calculated as 150% of the on-target amount. 5 The dollar value of the FY2014 STR Plan awarded to an Executive. Amounts are inclusive of superannuation. 6 The dollar value of LTR Plan for FY2014, calculated by multiplying TFR by LTR % (see table 5.4.2 for more detail). This value is different to the accounting value and reflects the value of shares acquired through the limited recourse loan from the Company (see 5.4.1 for more detail). This value may be pro-rated due to incomplete service or remuneration changes for the reported financial year. The shares granted are subject to the achievement of performance hurdles and are at risk of forfeiture in the future if these hurdles are not met. 7 The dollar value of any vested shares following the three-year performance hurdle testing for LTR. As performance hurdles were not met, no FY2012 LTR grants vested. N/A signifies the Executive did not receive a grant under the FY2012 LTR scheme. 8 J Douglas forewent $4,779 9 R Morris appointed GE Environments effective 12 August 2013. STR target pro-rated. TFR excludes remuneration earned prior to his appointment as
an executive 10 C Meijer was appointed Group Executive Markets on 28 March 2014 and received a TFR increase at the same time 11 M Renehan ceased employment on 28 February 2014
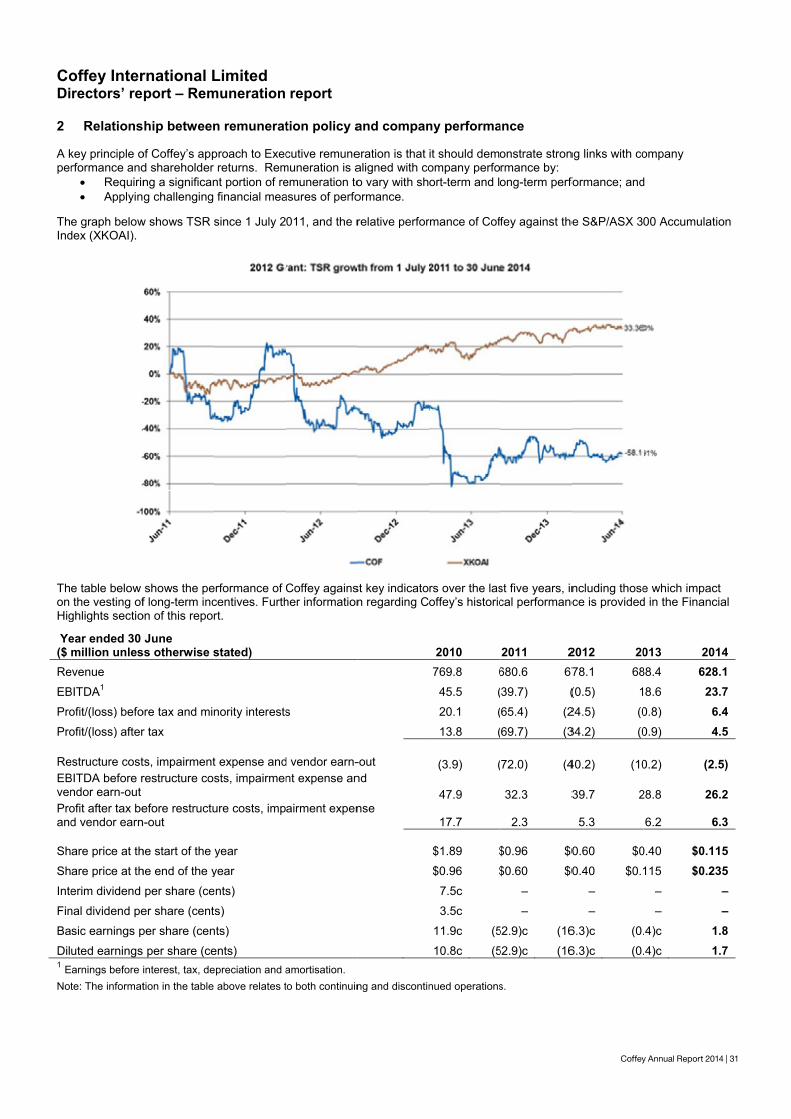
Coffey Annual Report 2014 | 31
CoDi
2 A kper
TheInd
Theon Hig Ye($ mRe
EB
Pro
Pro
ReEBvenProand
Sh
Sh
Inte
Fin
Ba
Dilu1 ENot
offey Interrectors’ re
Relations
key principle orformance and Requirin Applyin
e graph belowdex (XKOAI).
e table below the vesting of
ghlights sectio
ear ended 30 million unlesvenue
BITDA1
ofit/(loss) befo
ofit/(loss) after
structure costBITDA before rndor earn-out ofit after tax bed vendor earn
are price at th
are price at th
erim dividend
nal dividend pe
sic earnings p
uted earnings arnings before ite: The informat
rnational Lport – Rem
hip between
of Coffey’s appd shareholder ng a significang challenging
w shows TSR s
shows the pef long-term inc
on of this repor
June ss otherwise s
ore tax and min
r tax
ts, impairmentrestructure cos
efore restructun-out
he start of the
he end of the y
per share (ce
er share (cent
per share (cen
per share (ceinterest, tax, detion in the table
Limited muneration
n remunerat
proach to Execreturns. Rem
nt portion of refinancial mea
since 1 July 2
erformance of centives. Furthrt.
stated)
nority interests
t expense andsts, impairmen
ure costs, imp
year
year
nts)
s)
nts)
ents) epreciation and a
above relates t
report
tion policy a
cutive remunemuneration is aemuneration toasures of perfo
011, and the r
Coffey againsher information
s
d vendor earn-nt expense an
airment expen
amortisation. to both continuin
and compan
eration is that aligned with coo vary with shormance.
relative perfor
st key indicaton regarding C
-out nd
nse
ng and discontin
ny performa
it should demoompany perfoort-term and lo
rmance of Cof
rs over the lasoffey’s historic
2010 769.8 6
45.5 (
20.1 (
13.8 (
(3.9) (
47.9
17.7
$1.89 $
$0.96 $
7.5c
3.5c
11.9c (5
10.8c (5
nued operations
ance
onstrate stronrmance by: ong-term perfo
fey against the
st five years, incal performanc
2011 2680.6 67
39.7) (
65.4) (2
69.7) (3
72.0) (4
32.3 3
2.3
$0.96 $0
$0.60 $0
–
–
52.9)c (16
52.9)c (16
s.
Coffey An
ng links with co
formance; and
e S&P/ASX 3
ncluding thosece is provided
2012 2078.1 68
(0.5) 1
24.5) (0
34.2) (0
40.2) (10
39.7 2
5.3
0.60 $0
0.40 $0.1
–
–
6.3)c (0.
6.3)c (0.
nnual Report 2014
ompany
d
00 Accumulat
e which impacd in the Financ
013 2088.4 6288.6 23
0.8) 60.9) 4
0.2) (2
28.8 26
6.2 6
0.40 $0.1115 $0.2
–
–
.4)c 1
.4)c 1
4 | 31
tion
ct cial
14 8.1 3.7 6.4 4.5
.5)
6.2
6.3
15 35
– –
1.8 1.7
32 | Coffey Annual Report 2014
Coffey International Limited Directors’ report – Remuneration report
32 | Coffey Annual Report 2014
Both STR and LTR outcomes have reflected Coffey’s performance over the measurement periods for the respective plans. Consistent with the challenging conditions in some of the markets in which Coffey operates and disappointing financial results in recent years:
The full Board determined that no Executive would receive an STR payment due to company performance with the exception of those Executives leading the International Development and Project Management Service Lines, whose performance exceeded the minimum financial thresholds. Both these STR entitlements were reduced by 50% due to company performance;
Coffey’s performance against both performance measures has resulted in 100% forfeiture of shares awarded under the FY2012 Plan;
In addition, fixed remuneration for Executives has been held at levels set in FY2012, with the exception of one Executive who has received a market-based movement, and new Executives.
3 The Board’s role in remuneration The Board engages with shareholders, management, and other stakeholders as required to continuously refine and improve Executive and Non-executive Director remuneration policies. The Human Resources and Remuneration Committee was established by the Board to assist in discharging the Board’s responsibilities in relation to:
The remuneration of the Board within the scope of the shareholder approved cap on Non-executive Director fees; The performance and remuneration of the Executive Directors and direct reports to the Managing Director
(Management Team) of the company; Remuneration strategies, practices and disclosures generally; Employee share and option plans; Management succession, capability and talent development; Diversity (excluding Board diversity, which is a responsibility of the Nomination Committee); and Talent attraction, retention and culture.
Further details of the Committee’s responsibilities are outlined in the Corporate Governance Statement. The Committee reviews remuneration strategy and policy on an annual basis for all employees including the Executive Directors and the Management Team. The decisions of the Committee are subject to approval by the Board. The Committee has the authority to engage external professional advisers without seeking approval from the Board or management. No external professional advisers were engaged by the Committee in FY2014.
4 Description of Non-executive Director remuneration There has been no change to the basis of Non-executive Director fees, other than for the formation of the combined Risk and Audit Committee at the close of the 2012 Annual General Meeting. Fees paid to Non-executive Directors reflect the responsibilities of and the demands made on the Directors. Non-executive Director fees are determined within the aggregate Non-executive Director fee pool limit of $700,000 per annum which was approved by shareholders in November 2008. In the current financial year, fees paid to Non-executive Directors totalled $675,000 (inclusive of superannuation). Non-executive Directors are remunerated by way of fixed fees in the form of cash and superannuation in accordance with Recommendation 8.3 of the ASX Corporate Governance Council’s Principles and Recommendations.
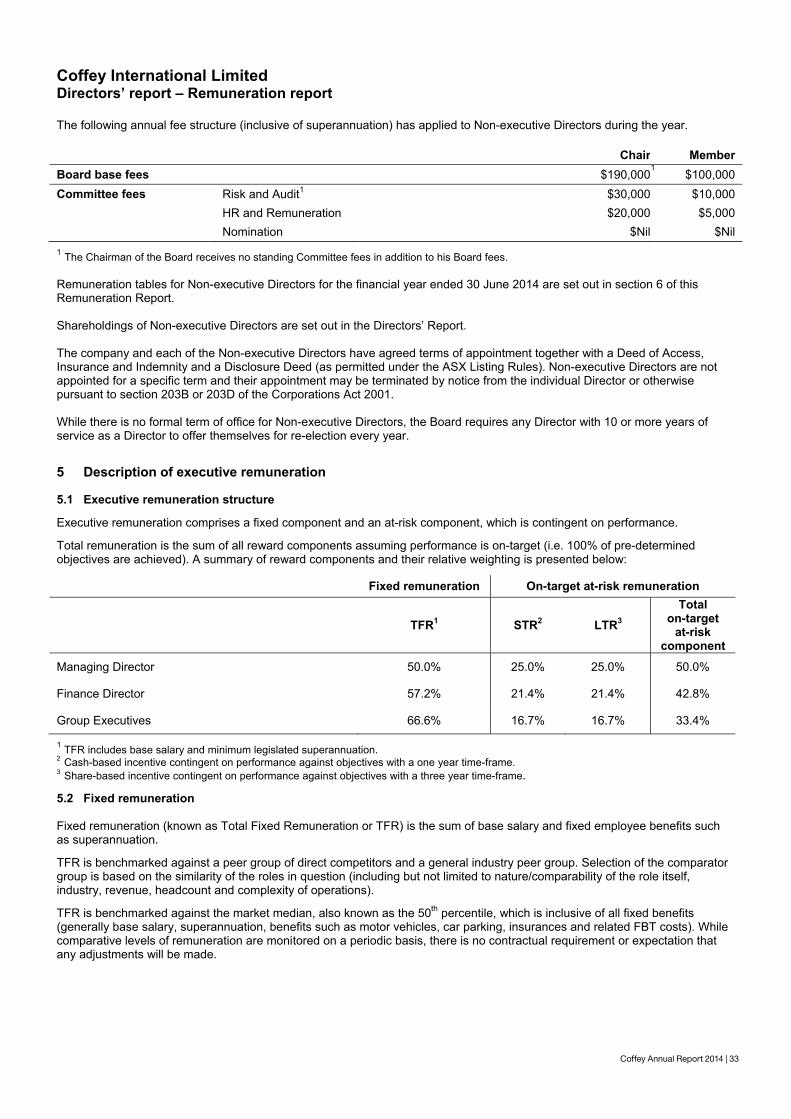
Coffey Annual Report 2014 | 33
Coffey International Limited Directors’ report – Remuneration report
32 | Coffey Annual Report 2014
Both STR and LTR outcomes have reflected Coffey’s performance over the measurement periods for the respective plans. Consistent with the challenging conditions in some of the markets in which Coffey operates and disappointing financial results in recent years:
The full Board determined that no Executive would receive an STR payment due to company performance with the exception of those Executives leading the International Development and Project Management Service Lines, whose performance exceeded the minimum financial thresholds. Both these STR entitlements were reduced by 50% due to company performance;
Coffey’s performance against both performance measures has resulted in 100% forfeiture of shares awarded under the FY2012 Plan;
In addition, fixed remuneration for Executives has been held at levels set in FY2012, with the exception of one Executive who has received a market-based movement, and new Executives.
3 The Board’s role in remuneration The Board engages with shareholders, management, and other stakeholders as required to continuously refine and improve Executive and Non-executive Director remuneration policies. The Human Resources and Remuneration Committee was established by the Board to assist in discharging the Board’s responsibilities in relation to:
The remuneration of the Board within the scope of the shareholder approved cap on Non-executive Director fees; The performance and remuneration of the Executive Directors and direct reports to the Managing Director
(Management Team) of the company; Remuneration strategies, practices and disclosures generally; Employee share and option plans; Management succession, capability and talent development; Diversity (excluding Board diversity, which is a responsibility of the Nomination Committee); and Talent attraction, retention and culture.
Further details of the Committee’s responsibilities are outlined in the Corporate Governance Statement. The Committee reviews remuneration strategy and policy on an annual basis for all employees including the Executive Directors and the Management Team. The decisions of the Committee are subject to approval by the Board. The Committee has the authority to engage external professional advisers without seeking approval from the Board or management. No external professional advisers were engaged by the Committee in FY2014.
4 Description of Non-executive Director remuneration There has been no change to the basis of Non-executive Director fees, other than for the formation of the combined Risk and Audit Committee at the close of the 2012 Annual General Meeting. Fees paid to Non-executive Directors reflect the responsibilities of and the demands made on the Directors. Non-executive Director fees are determined within the aggregate Non-executive Director fee pool limit of $700,000 per annum which was approved by shareholders in November 2008. In the current financial year, fees paid to Non-executive Directors totalled $675,000 (inclusive of superannuation). Non-executive Directors are remunerated by way of fixed fees in the form of cash and superannuation in accordance with Recommendation 8.3 of the ASX Corporate Governance Council’s Principles and Recommendations.
Coffey International Limited Directors’ report – Remuneration report
Coffey Annual Report 2014 | 33
The following annual fee structure (inclusive of superannuation) has applied to Non-executive Directors during the year. Chair Member Board base fees $190,000
1 $100,000 Committee fees Risk and Audit1 $30,000 $10,000 HR and Remuneration $20,000 $5,000 Nomination $Nil $Nil 1 The Chairman of the Board receives no standing Committee fees in addition to his Board fees. Remuneration tables for Non-executive Directors for the financial year ended 30 June 2014 are set out in section 6 of this Remuneration Report. Shareholdings of Non-executive Directors are set out in the Directors’ Report. The company and each of the Non-executive Directors have agreed terms of appointment together with a Deed of Access, Insurance and Indemnity and a Disclosure Deed (as permitted under the ASX Listing Rules). Non-executive Directors are not appointed for a specific term and their appointment may be terminated by notice from the individual Director or otherwise pursuant to section 203B or 203D of the Corporations Act 2001. While there is no formal term of office for Non-executive Directors, the Board requires any Director with 10 or more years of service as a Director to offer themselves for re-election every year.
5 Description of executive remuneration 5.1 Executive remuneration structure Executive remuneration comprises a fixed component and an at-risk component, which is contingent on performance. Total remuneration is the sum of all reward components assuming performance is on-target (i.e. 100% of pre-determined objectives are achieved). A summary of reward components and their relative weighting is presented below:
Fixed remuneration On-target at-risk remuneration
TFR1 STR2 LTR3 Total
on-target at-risk
component
Managing Director 50.0% 25.0% 25.0% 50.0%
Finance Director 57.2% 21.4% 21.4% 42.8%
Group Executives 66.6% 16.7% 16.7% 33.4%
1 TFR includes base salary and minimum legislated superannuation. 2 Cash-based incentive contingent on performance against objectives with a one year time-frame. 3 Share-based incentive contingent on performance against objectives with a three year time-frame. 5.2 Fixed remuneration Fixed remuneration (known as Total Fixed Remuneration or TFR) is the sum of base salary and fixed employee benefits such as superannuation. TFR is benchmarked against a peer group of direct competitors and a general industry peer group. Selection of the comparator group is based on the similarity of the roles in question (including but not limited to nature/comparability of the role itself, industry, revenue, headcount and complexity of operations). TFR is benchmarked against the market median, also known as the 50th percentile, which is inclusive of all fixed benefits (generally base salary, superannuation, benefits such as motor vehicles, car parking, insurances and related FBT costs). While comparative levels of remuneration are monitored on a periodic basis, there is no contractual requirement or expectation that any adjustments will be made.
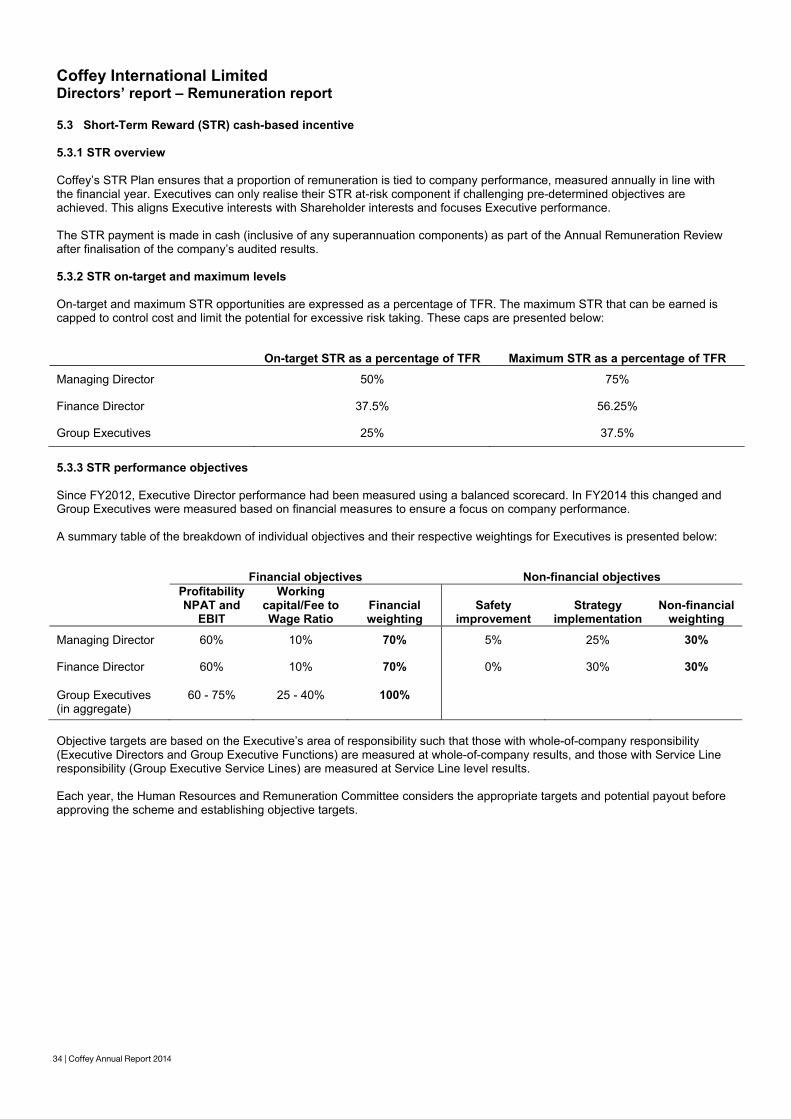
34 | Coffey Annual Report 2014
Coffey International Limited Directors’ report – Remuneration report
34 | Coffey Annual Report 2014
5.3 Short-Term Reward (STR) cash-based incentive 5.3.1 STR overview Coffey’s STR Plan ensures that a proportion of remuneration is tied to company performance, measured annually in line with the financial year. Executives can only realise their STR at-risk component if challenging pre-determined objectives are achieved. This aligns Executive interests with Shareholder interests and focuses Executive performance. The STR payment is made in cash (inclusive of any superannuation components) as part of the Annual Remuneration Review after finalisation of the company’s audited results. 5.3.2 STR on-target and maximum levels On-target and maximum STR opportunities are expressed as a percentage of TFR. The maximum STR that can be earned is capped to control cost and limit the potential for excessive risk taking. These caps are presented below:
On-target STR as a percentage of TFR Maximum STR as a percentage of TFR
Managing Director 50% 75%
Finance Director 37.5% 56.25%
Group Executives 25% 37.5%
5.3.3 STR performance objectives Since FY2012, Executive Director performance had been measured using a balanced scorecard. In FY2014 this changed and Group Executives were measured based on financial measures to ensure a focus on company performance. A summary table of the breakdown of individual objectives and their respective weightings for Executives is presented below:
Financial objectives Non-financial objectives
Profitability NPAT and
EBIT
Working capital/Fee to Wage Ratio
Financial weighting
Safety improvement
Strategy implementation
Non-financial weighting
Managing Director 60% 10% 70% 5% 25% 30%
Finance Director 60% 10% 70% 0% 30% 30%
Group Executives (in aggregate)
60 - 75% 25 - 40% 100%
Objective targets are based on the Executive’s area of responsibility such that those with whole-of-company responsibility (Executive Directors and Group Executive Functions) are measured at whole-of-company results, and those with Service Line responsibility (Group Executive Service Lines) are measured at Service Line level results. Each year, the Human Resources and Remuneration Committee considers the appropriate targets and potential payout before approving the scheme and establishing objective targets.
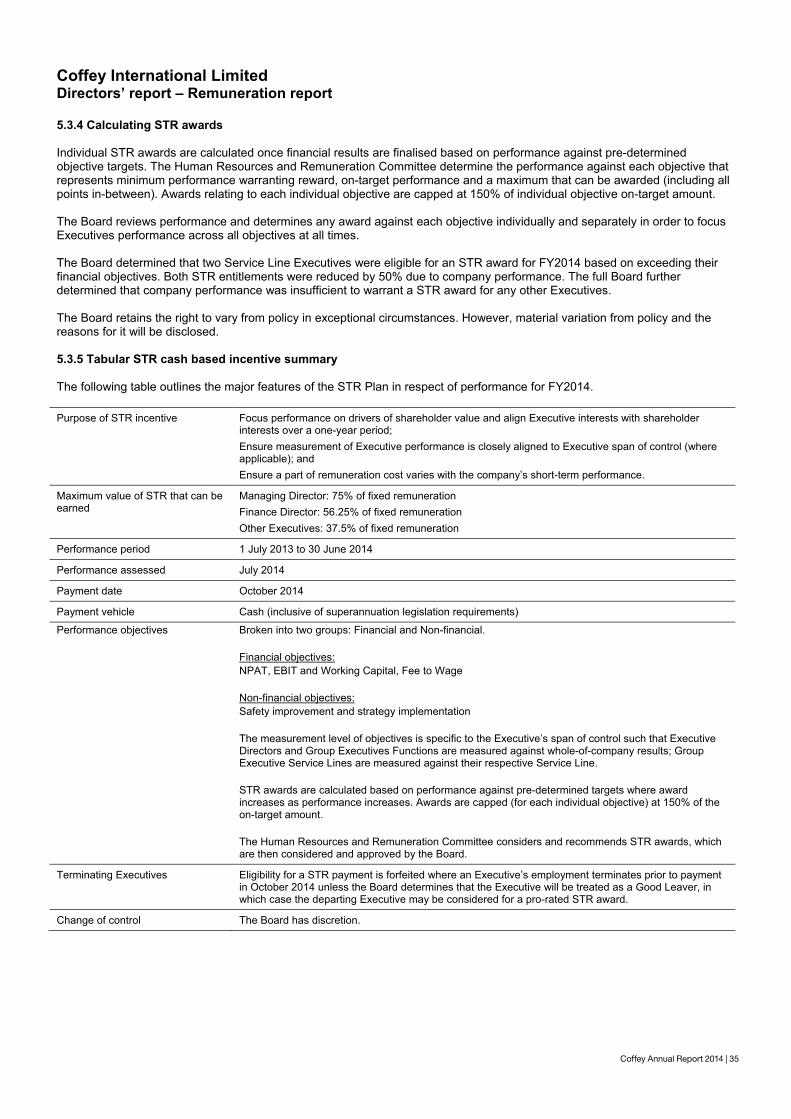
Coffey Annual Report 2014 | 35
Coffey International Limited Directors’ report – Remuneration report
Coffey Annual Report 2014 | 35
5.3.4 Calculating STR awards Individual STR awards are calculated once financial results are finalised based on performance against pre-determined objective targets. The Human Resources and Remuneration Committee determine the performance against each objective that represents minimum performance warranting reward, on-target performance and a maximum that can be awarded (including all points in-between). Awards relating to each individual objective are capped at 150% of individual objective on-target amount. The Board reviews performance and determines any award against each objective individually and separately in order to focus Executives performance across all objectives at all times. The Board determined that two Service Line Executives were eligible for an STR award for FY2014 based on exceeding their financial objectives. Both STR entitlements were reduced by 50% due to company performance. The full Board further determined that company performance was insufficient to warrant a STR award for any other Executives. The Board retains the right to vary from policy in exceptional circumstances. However, material variation from policy and the reasons for it will be disclosed. 5.3.5 Tabular STR cash based incentive summary The following table outlines the major features of the STR Plan in respect of performance for FY2014. Purpose of STR incentive Focus performance on drivers of shareholder value and align Executive interests with shareholder
interests over a one-year period; Ensure measurement of Executive performance is closely aligned to Executive span of control (where applicable); and Ensure a part of remuneration cost varies with the company’s short-term performance.
Maximum value of STR that can be earned
Managing Director: 75% of fixed remuneration Finance Director: 56.25% of fixed remuneration Other Executives: 37.5% of fixed remuneration
Performance period 1 July 2013 to 30 June 2014
Performance assessed July 2014
Payment date October 2014
Payment vehicle Cash (inclusive of superannuation legislation requirements)
Performance objectives Broken into two groups: Financial and Non-financial. Financial objectives: NPAT, EBIT and Working Capital, Fee to Wage Non-financial objectives: Safety improvement and strategy implementation The measurement level of objectives is specific to the Executive’s span of control such that Executive Directors and Group Executives Functions are measured against whole-of-company results; Group Executive Service Lines are measured against their respective Service Line. STR awards are calculated based on performance against pre-determined targets where award increases as performance increases. Awards are capped (for each individual objective) at 150% of the on-target amount. The Human Resources and Remuneration Committee considers and recommends STR awards, which are then considered and approved by the Board.
Terminating Executives Eligibility for a STR payment is forfeited where an Executive’s employment terminates prior to payment in October 2014 unless the Board determines that the Executive will be treated as a Good Leaver, in which case the departing Executive may be considered for a pro-rated STR award.
Change of control The Board has discretion.
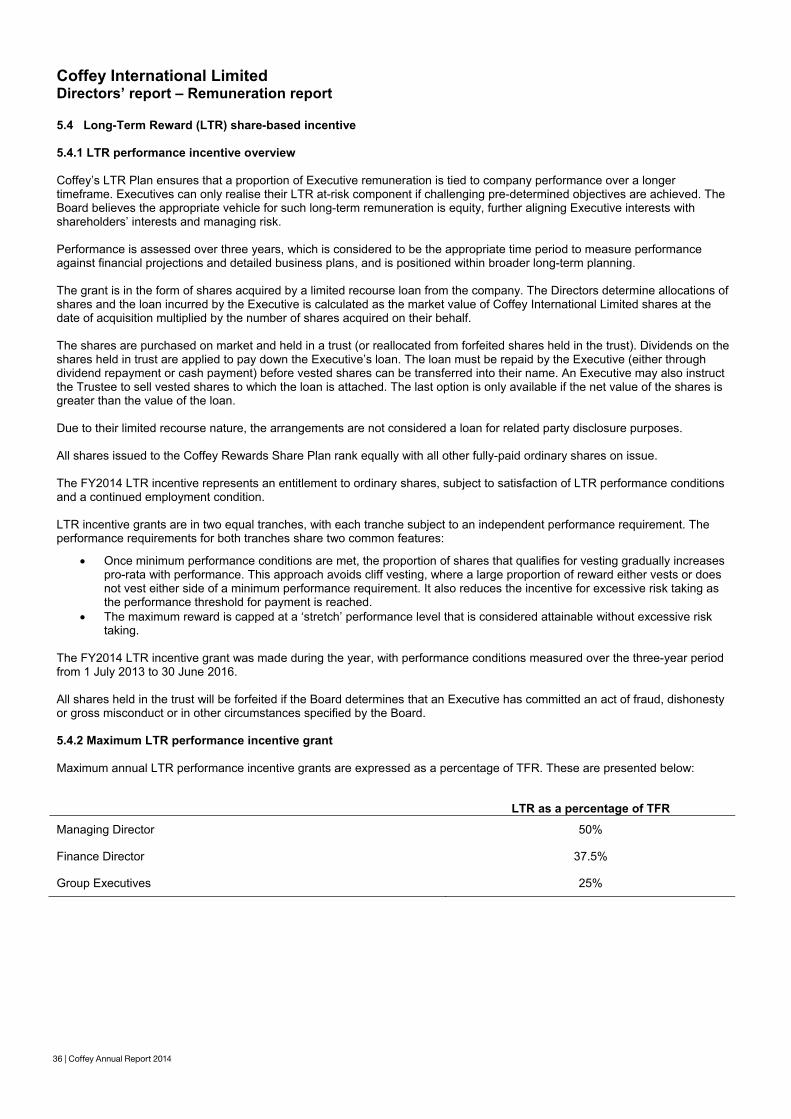
36 | Coffey Annual Report 2014
Coffey International Limited Directors’ report – Remuneration report
36 | Coffey Annual Report 2014
5.4 Long-Term Reward (LTR) share-based incentive 5.4.1 LTR performance incentive overview Coffey’s LTR Plan ensures that a proportion of Executive remuneration is tied to company performance over a longer timeframe. Executives can only realise their LTR at-risk component if challenging pre-determined objectives are achieved. The Board believes the appropriate vehicle for such long-term remuneration is equity, further aligning Executive interests with shareholders’ interests and managing risk. Performance is assessed over three years, which is considered to be the appropriate time period to measure performance against financial projections and detailed business plans, and is positioned within broader long-term planning. The grant is in the form of shares acquired by a limited recourse loan from the company. The Directors determine allocations of shares and the loan incurred by the Executive is calculated as the market value of Coffey International Limited shares at the date of acquisition multiplied by the number of shares acquired on their behalf. The shares are purchased on market and held in a trust (or reallocated from forfeited shares held in the trust). Dividends on the shares held in trust are applied to pay down the Executive’s loan. The loan must be repaid by the Executive (either through dividend repayment or cash payment) before vested shares can be transferred into their name. An Executive may also instruct the Trustee to sell vested shares to which the loan is attached. The last option is only available if the net value of the shares is greater than the value of the loan. Due to their limited recourse nature, the arrangements are not considered a loan for related party disclosure purposes. All shares issued to the Coffey Rewards Share Plan rank equally with all other fully-paid ordinary shares on issue. The FY2014 LTR incentive represents an entitlement to ordinary shares, subject to satisfaction of LTR performance conditions and a continued employment condition. LTR incentive grants are in two equal tranches, with each tranche subject to an independent performance requirement. The performance requirements for both tranches share two common features:
Once minimum performance conditions are met, the proportion of shares that qualifies for vesting gradually increases pro-rata with performance. This approach avoids cliff vesting, where a large proportion of reward either vests or does not vest either side of a minimum performance requirement. It also reduces the incentive for excessive risk taking as the performance threshold for payment is reached.
The maximum reward is capped at a ‘stretch’ performance level that is considered attainable without excessive risk taking.
The FY2014 LTR incentive grant was made during the year, with performance conditions measured over the three-year period from 1 July 2013 to 30 June 2016. All shares held in the trust will be forfeited if the Board determines that an Executive has committed an act of fraud, dishonesty or gross misconduct or in other circumstances specified by the Board. 5.4.2 Maximum LTR performance incentive grant Maximum annual LTR performance incentive grants are expressed as a percentage of TFR. These are presented below:
LTR as a percentage of TFR
Managing Director 50%
Finance Director 37.5%
Group Executives 25%
Coffey Annual Report 2014 | 37
Coffey International Limited Directors’ report – Remuneration report
Coffey Annual Report 2014 | 37
5.4.3 Performance requirements One tranche of shares in the FY2014 LTR grant qualifies for vesting subject to performance relative to other companies, while the other tranche qualifies for vesting subject to a statutory profit measure. Each tranche is of equal value. The relative performance requirement is based on total shareholder return (TSR). Coffey’s TSR is calculated as the difference in share price over the performance period, plus the value of shares earned from reinvesting dividends received over this period, expressed as a percentage of the share price at the beginning of the performance period. The percentage change of Coffey’s TSR is compared to the percentage change in the S&P/ASX 300 Accumulation Index. Shares held in trust will not vest until Coffey’s TSR is greater than 3.75% above the Index. On exceeding the Index return, performance shares will start to vest on a pro-rated basis until 100% vest when Coffey’s TSR is 15% above the Index. The graduated rate of vesting after meeting the minimum TSR performance requirement is more conservative than most companies that have a relative TSR performance requirement. Coffey’s Directors believe that this more graduated vesting provides better risk management because it reduces the tendency for excessive risk taking stemming from Executives having very significant differences in reward outcomes either side of a performance cliff. The absolute statutory performance requirement applicable to the other tranche of shares is based on Earnings Per Share (EPS) growth over the three-year performance period to 30 June 2016. As the company reported a net loss after tax for the 2013 financial year including a number of non-recurring items, the level at which vesting of this tranche of shares will commence has been determined by reference to the underlying EPS of 2.4 cents per share for the financial year 2013. The vesting of this tranche of shares will be dependent on the EPS growth performance. The shares in this tranche will start to vest on a pro-rata basis if EPS compound annual growth exceeds 30% over the period, and fully vest at 50% compound annual EPS growth. Shares will vest on a pro-rata basis for compound annual EPS growth between 30% and 50%.
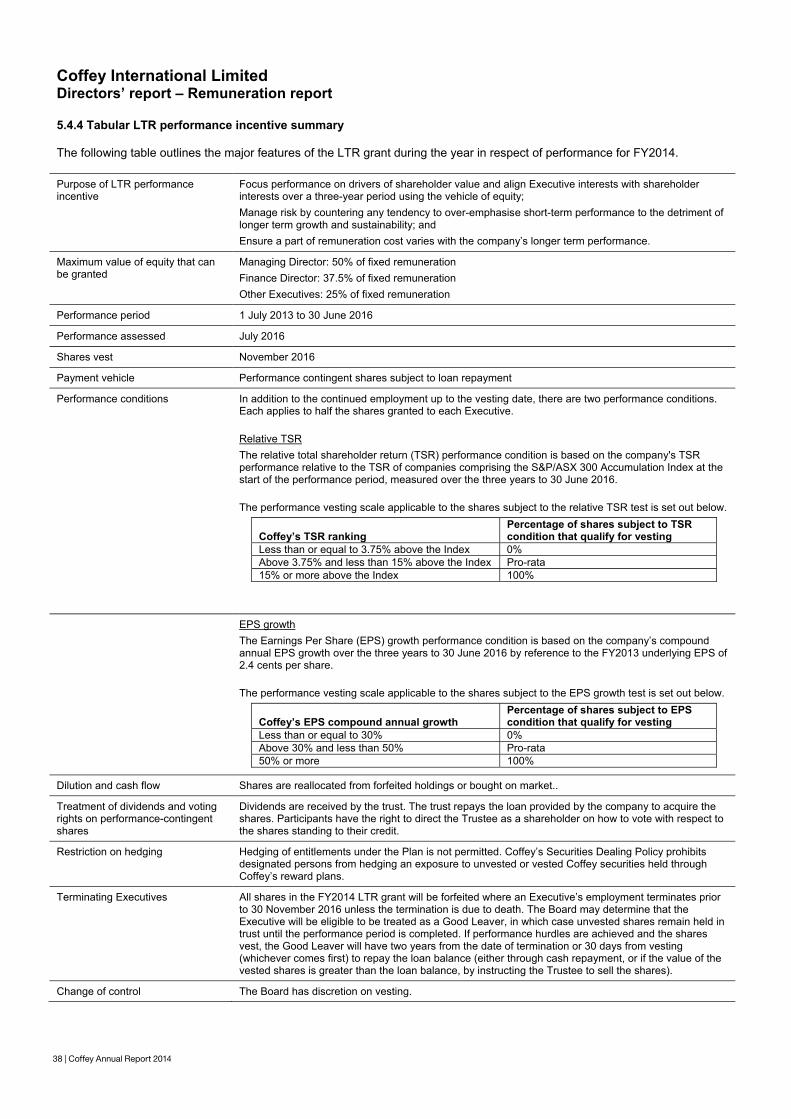
38 | Coffey Annual Report 2014
Coffey International Limited Directors’ report – Remuneration report
38 | Coffey Annual Report 2014
5.4.4 Tabular LTR performance incentive summary The following table outlines the major features of the LTR grant during the year in respect of performance for FY2014. Purpose of LTR performance incentive
Focus performance on drivers of shareholder value and align Executive interests with shareholder interests over a three-year period using the vehicle of equity; Manage risk by countering any tendency to over-emphasise short-term performance to the detriment of longer term growth and sustainability; and Ensure a part of remuneration cost varies with the company’s longer term performance.
Maximum value of equity that can be granted
Managing Director: 50% of fixed remuneration Finance Director: 37.5% of fixed remuneration Other Executives: 25% of fixed remuneration
Performance period 1 July 2013 to 30 June 2016
Performance assessed July 2016
Shares vest November 2016
Payment vehicle Performance contingent shares subject to loan repayment
Performance conditions In addition to the continued employment up to the vesting date, there are two performance conditions. Each applies to half the shares granted to each Executive.
Relative TSR The relative total shareholder return (TSR) performance condition is based on the company's TSR performance relative to the TSR of companies comprising the S&P/ASX 300 Accumulation Index at the start of the performance period, measured over the three years to 30 June 2016.
The performance vesting scale applicable to the shares subject to the relative TSR test is set out below.
Coffey’s TSR ranking Percentage of shares subject to TSR condition that qualify for vesting
Less than or equal to 3.75% above the Index 0% Above 3.75% and less than 15% above the Index Pro-rata 15% or more above the Index 100%
EPS growth The Earnings Per Share (EPS) growth performance condition is based on the company’s compound annual EPS growth over the three years to 30 June 2016 by reference to the FY2013 underlying EPS of 2.4 cents per share.
The performance vesting scale applicable to the shares subject to the EPS growth test is set out below.
Coffey’s EPS compound annual growth Percentage of shares subject to EPS condition that qualify for vesting
Less than or equal to 30% 0% Above 30% and less than 50% Pro-rata 50% or more 100%
Dilution and cash flow Shares are reallocated from forfeited holdings or bought on market..
Treatment of dividends and voting rights on performance-contingent shares
Dividends are received by the trust. The trust repays the loan provided by the company to acquire the shares. Participants have the right to direct the Trustee as a shareholder on how to vote with respect to the shares standing to their credit.
Restriction on hedging Hedging of entitlements under the Plan is not permitted. Coffey’s Securities Dealing Policy prohibits designated persons from hedging an exposure to unvested or vested Coffey securities held through Coffey’s reward plans.
Terminating Executives All shares in the FY2014 LTR grant will be forfeited where an Executive’s employment terminates prior to 30 November 2016 unless the termination is due to death. The Board may determine that the Executive will be eligible to be treated as a Good Leaver, in which case unvested shares remain held in trust until the performance period is completed. If performance hurdles are achieved and the shares vest, the Good Leaver will have two years from the date of termination or 30 days from vesting (whichever comes first) to repay the loan balance (either through cash repayment, or if the value of the vested shares is greater than the loan balance, by instructing the Trustee to sell the shares).
Change of control The Board has discretion on vesting.
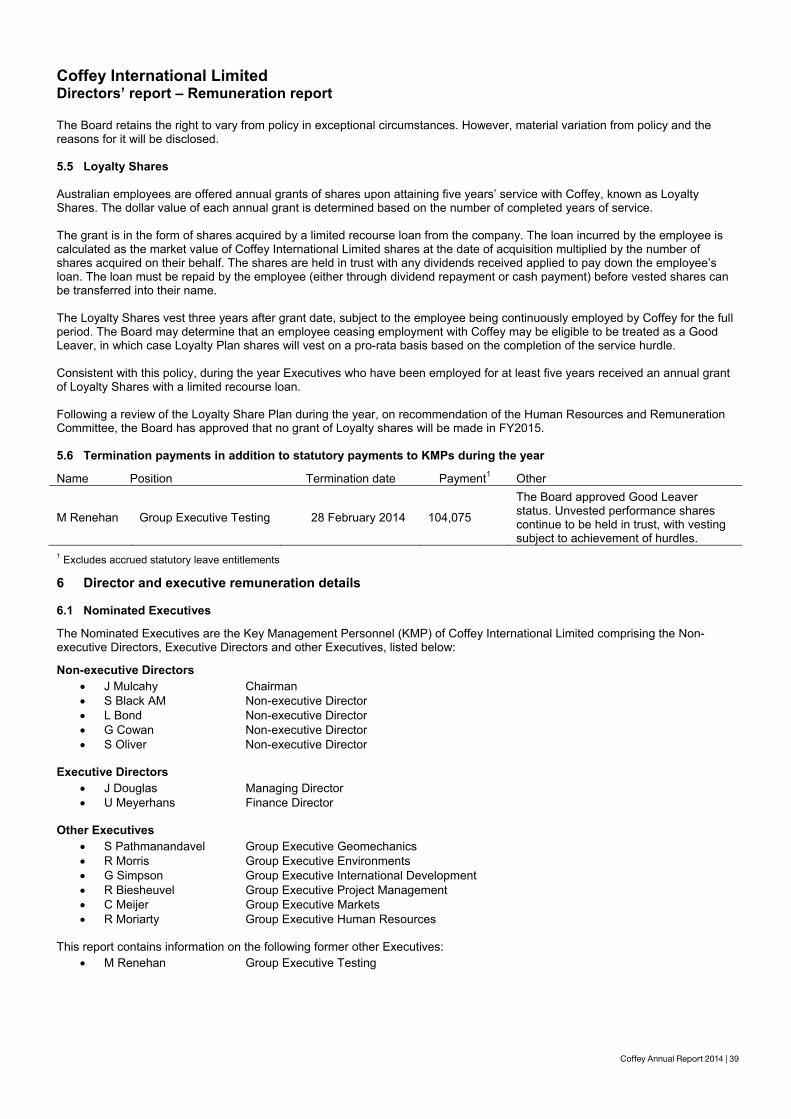
Coffey Annual Report 2014 | 39
Coffey International Limited Directors’ report – Remuneration report
Coffey Annual Report 2014 | 39
The Board retains the right to vary from policy in exceptional circumstances. However, material variation from policy and the reasons for it will be disclosed. 5.5 Loyalty Shares Australian employees are offered annual grants of shares upon attaining five years’ service with Coffey, known as Loyalty Shares. The dollar value of each annual grant is determined based on the number of completed years of service. The grant is in the form of shares acquired by a limited recourse loan from the company. The loan incurred by the employee is calculated as the market value of Coffey International Limited shares at the date of acquisition multiplied by the number of shares acquired on their behalf. The shares are held in trust with any dividends received applied to pay down the employee’s loan. The loan must be repaid by the employee (either through dividend repayment or cash payment) before vested shares can be transferred into their name. The Loyalty Shares vest three years after grant date, subject to the employee being continuously employed by Coffey for the full period. The Board may determine that an employee ceasing employment with Coffey may be eligible to be treated as a Good Leaver, in which case Loyalty Plan shares will vest on a pro-rata basis based on the completion of the service hurdle. Consistent with this policy, during the year Executives who have been employed for at least five years received an annual grant of Loyalty Shares with a limited recourse loan. Following a review of the Loyalty Share Plan during the year, on recommendation of the Human Resources and Remuneration Committee, the Board has approved that no grant of Loyalty shares will be made in FY2015. 5.6 Termination payments in addition to statutory payments to KMPs during the year Name Position Termination date Payment1 Other
M Renehan Group Executive Testing 28 February 2014 104,075
The Board approved Good Leaver status. Unvested performance shares continue to be held in trust, with vesting subject to achievement of hurdles.
1 Excludes accrued statutory leave entitlements
6 Director and executive remuneration details 6.1 Nominated Executives The Nominated Executives are the Key Management Personnel (KMP) of Coffey International Limited comprising the Non-executive Directors, Executive Directors and other Executives, listed below: Non-executive Directors
J Mulcahy Chairman S Black AM Non-executive Director L Bond Non-executive Director G Cowan Non-executive Director S Oliver Non-executive Director
Executive Directors
J Douglas Managing Director U Meyerhans Finance Director
Other Executives
S Pathmanandavel Group Executive Geomechanics R Morris Group Executive Environments G Simpson Group Executive International Development R Biesheuvel Group Executive Project Management C Meijer Group Executive Markets R Moriarty Group Executive Human Resources
This report contains information on the following former other Executives:
M Renehan Group Executive Testing
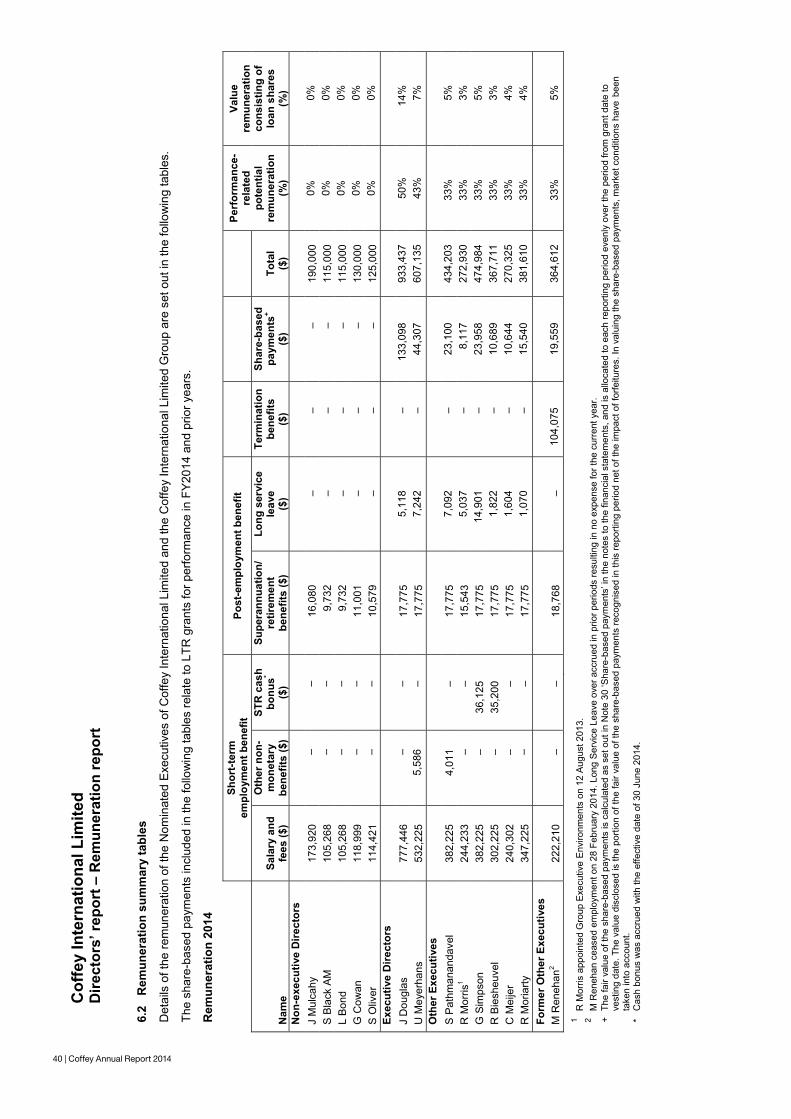
40 | Coffey Annual Report 2014
Cof
fey
Inte
rnat
iona
l Lim
ited
Dire
ctor
s’ re
port
– R
emun
erat
ion
repo
rt
40 |
Cof
fey
Ann
ual R
epor
t 201
4
6.2
Rem
uner
atio
n su
mm
ary
tabl
es
Det
ails
of t
he re
mun
erat
ion
of th
e N
omin
ated
Exe
cutiv
es o
f Cof
fey
Inte
rnat
iona
l Lim
ited
and
the
Cof
fey
Inte
rnat
iona
l Lim
ited
Gro
up a
re s
et o
ut in
the
follo
win
g ta
bles
. Th
e sh
are-
base
d pa
ymen
ts in
clud
ed in
the
follo
win
g ta
bles
rela
te to
LTR
gra
nts
for p
erfo
rman
ce in
FY
2014
and
prio
r yea
rs.
Rem
uner
atio
n 20
14
Sh
ort-t
erm
em
ploy
men
t ben
efit
Post
-em
ploy
men
t ben
efit
Pe
rfor
man
ce-
rela
ted
pote
ntia
l re
mun
erat
ion
(%)
Valu
e re
mun
erat
ion
cons
istin
g of
lo
an s
hare
s (%
) N
ame
Sala
ry a
nd
fees
($)
Oth
er n
on-
mon
etar
y be
nefit
s ($
)
STR
cas
h bo
nus*
($)
Supe
rann
uatio
n/re
tirem
ent
bene
fits
($)
Long
ser
vice
le
ave
($)
Term
inat
ion
bene
fits
($)
Shar
e-ba
sed
paym
ents
+
($)
Tota
l ($
) N
on-e
xecu
tive
Dire
ctor
s
J
Mul
cahy
17
3,92
0 –
–
16,0
80
– –
– 19
0,00
0 0%
0%
S
Bla
ck A
M
105,
268
– –
9,
732
– –
– 11
5,00
0 0%
0%
L
Bon
d 10
5,26
8 –
–
9,73
2 –
– –
115,
000
0%
0%
G C
owan
11
8,99
9 –
–
11,0
01
– –
– 13
0,00
0 0%
0%
S
Oliv
er
114,
421
– –
10
,579
–
– –
125,
000
0%
0%
Exec
utiv
e D
irect
ors
J
Dou
glas
77
7,44
6 –
–
17,7
75
5,11
8 –
133,
098
933,
437
50%
14
%
U M
eyer
hans
53
2,22
5 5,
586
–
17,7
75
7,24
2 –
44,3
07
607,
135
43%
7%
O
ther
Exe
cutiv
es
S P
athm
anan
dave
l 38
2,22
5 4,
011
–
17,7
75
7,09
2 –
23,1
00
434,
203
33%
5%
R
Mor
ris1
244,
233
– –
15
,543
5,
037
– 8,
117
272,
930
33%
3%
G
Sim
pson
38
2,22
5 –
36,1
25
17
,775
14
,901
–
23,9
58
474,
984
33%
5%
R
Bie
sheu
vel
302,
225
– 35
,200
17,7
75
1,82
2 –
10,6
89
367,
711
33%
3%
C
Mei
jer
240,
302
– –
17
,775
1,
604
– 10
,644
27
0,32
5 33
%
4%
R M
oria
rty
347,
225
– –
17
,775
1,
070
– 15
,540
38
1,61
0 33
%
4%
Form
er O
ther
Exe
cutiv
es
M R
eneh
an2
222,
210
– –
18
,768
–
104,
075
19,5
59
364,
612
33%
5%
1 R
Mor
ris a
ppoi
nted
Gro
up E
xecu
tive
Env
ironm
ents
on
12 A
ugus
t 201
3.
2 M
Ren
ehan
cea
sed
empl
oym
ent o
n 28
Feb
ruar
y 20
14. L
ong
Ser
vice
Lea
ve o
ver a
ccru
ed in
prio
r per
iods
resu
lting
in n
o ex
pens
e fo
r the
cur
rent
yea
r. +
The
fair
valu
e of
the
shar
e-ba
sed
paym
ents
is c
alcu
late
d as
set
out
in N
ote
30 ‘S
hare
-bas
ed p
aym
ents
’ in
the
note
s to
the
finan
cial
sta
tem
ents
, and
is a
lloca
ted
to e
ach
repo
rting
per
iod
even
ly o
ver t
he p
erio
d fro
m g
rant
dat
e to
vest
ing
date
. The
val
ue d
iscl
osed
is th
e po
rtion
of t
he fa
ir va
lue
of th
e sh
are-
base
d pa
ymen
ts re
cogn
ised
in th
is re
porti
ng p
erio
d ne
t of t
he im
pact
of f
orfe
iture
s. In
val
uing
the
shar
e-ba
sed
paym
ents
, mar
ket c
ondi
tions
hav
e b
een
ta
ken
into
acc
ount
. *
Cas
h bo
nus
was
acc
rued
with
the
effe
ctiv
e da
te o
f 30
June
201
4.
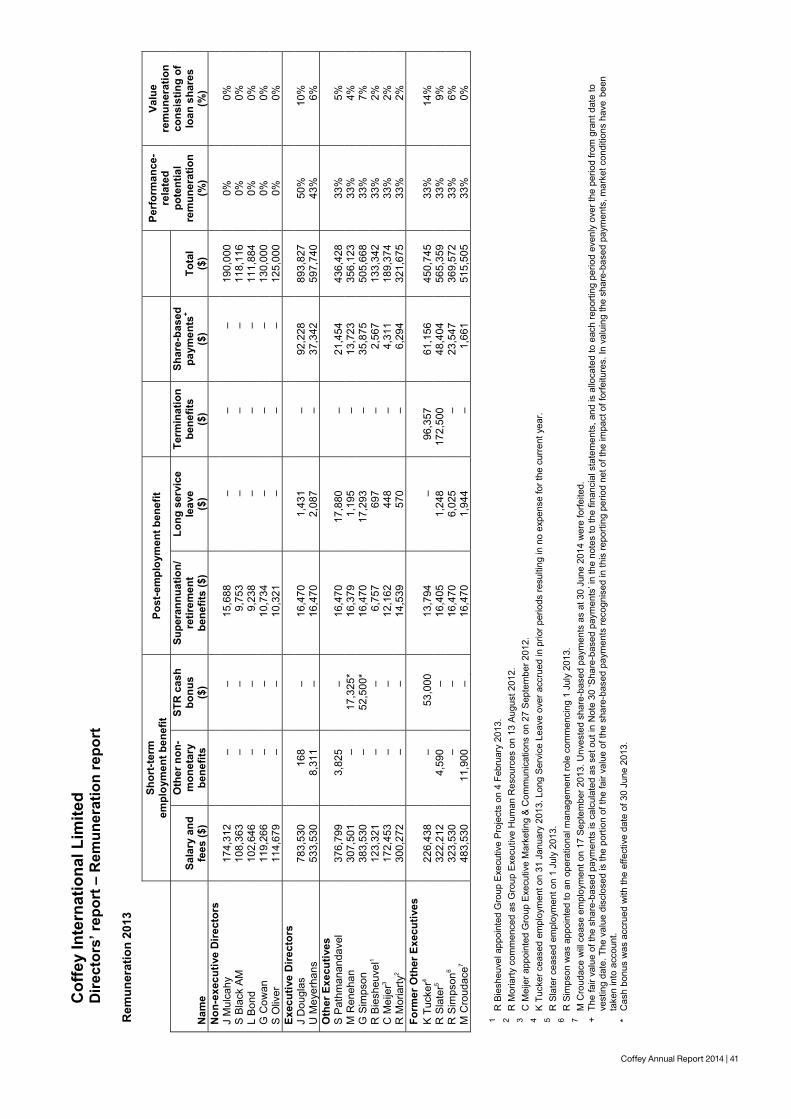
Coffey Annual Report 2014 | 41
Cof
fey
Inte
rnat
iona
l Lim
ited
Dire
ctor
s’ re
port
– R
emun
erat
ion
repo
rt
Cof
fey
Ann
ual R
epor
t 201
4 | 4
1
Rem
uner
atio
n 20
13
Sh
ort-t
erm
em
ploy
men
t ben
efit
Post
-em
ploy
men
t ben
efit
Pe
rfor
man
ce-
rela
ted
pote
ntia
l re
mun
erat
ion
(%)
Valu
e re
mun
erat
ion
cons
istin
g of
lo
an s
hare
s (%
) N
ame
Sala
ry a
nd
fees
($)
Oth
er n
on-
mon
etar
y be
nefit
s
STR
cas
h bo
nus
($)
Supe
rann
uatio
n/re
tirem
ent
bene
fits
($)
Long
ser
vice
le
ave
($)
Term
inat
ion
bene
fits
($)
Shar
e-ba
sed
paym
ents
+
($)
Tota
l ($
) N
on-e
xecu
tive
Dire
ctor
s
J
Mul
cahy
17
4,31
2 –
–
15,6
88
– –
– 19
0,00
0 0%
0%
S
Bla
ck A
M
108,
363
– –
9,
753
– –
– 11
8,11
6 0%
0%
L
Bon
d 10
2,64
6 –
–
9,23
8 –
– –
111,
884
0%
0%
G C
owan
11
9,26
6 –
–
10,7
34
– –
– 13
0,00
0 0%
0%
S
Oliv
er
114,
679
– –
10
,321
–
– –
125,
000
0%
0%
Exec
utiv
e D
irect
ors
J
Dou
glas
78
3,53
0 16
8 –
16
,470
1,
431
– 92
,228
89
3,82
7 50
%
10%
U
Mey
erha
ns
533,
530
8,31
1 –
16
,470
2,
087
– 37
,342
59
7,74
0 43
%
6%
Oth
er E
xecu
tives
S
Pat
hman
anda
vel
376,
799
3,82
5 –
16
,470
17
,880
–
21,4
54
436,
428
33%
5%
M
Ren
ehan
30
7,50
1 –
17,3
25*
16,3
79
1,19
5 –
13,7
23
356,
123
33%
4%
G
Sim
pson
38
3,53
0 –
52,5
00*
16,4
70
17,2
93
– 35
,875
50
5,66
8 33
%
7%
R B
iesh
euve
l1 12
3,32
1 –
–
6,75
7 69
7 –
2,56
7 13
3,34
2 33
%
2%
C M
eije
r3 17
2,45
3 –
–
12,1
62
448
– 4,
311
189,
374
33%
2%
R
Mor
iarty
2 30
0,27
2 –
–
14,5
39
570
– 6,
294
321,
675
33%
2%
Fo
rmer
Oth
er E
xecu
tives
K
Tuc
ker4
226,
438
– 53
,000
13
,794
–
96,3
57
61,1
56
450,
745
33%
14%
R
Sla
ter5
322,
212
4,59
0 –
16
,405
1,
248
172,
500
48,4
04
565,
359
33%
9%
R S
imps
on6
323,
530
– –
16
,470
6,
025
– 23
,547
36
9,57
2 33
%6%
M
Cro
udac
e7 48
3,53
0 11
,900
–
16
,470
1,
944
– 1,
661
515,
505
33%
0%
1 R
Bie
sheu
vel a
ppoi
nted
Gro
up E
xecu
tive
Pro
ject
s on
4 F
ebru
ary
2013
. 2
R M
oria
rty c
omm
ence
d as
Gro
up E
xecu
tive
Hum
an R
esou
rces
on
13 A
ugus
t 201
2.
3 C
Mei
jer a
ppoi
nted
Gro
up E
xecu
tive
Mar
ketin
g &
Com
mun
icat
ions
on
27 S
epte
mbe
r 201
2.
4 K
Tuc
ker c
ease
d em
ploy
men
t on
31 J
anua
ry 2
013.
Lon
g S
ervi
ce L
eave
ove
r acc
rued
in p
rior p
erio
ds re
sulti
ng in
no
expe
nse
for t
he c
urre
nt y
ear.
5 R
Sla
ter c
ease
d em
ploy
men
t on
1 Ju
ly 2
013.
6
R S
imps
on w
as a
ppoi
nted
to a
n op
erat
iona
l man
agem
ent r
ole
com
men
cing
1 J
uly
2013
. 7
M C
roud
ace
will
ceas
e em
ploy
men
t on
17 S
epte
mbe
r 201
3. U
nves
ted
shar
e-ba
sed
paym
ents
as
at 3
0 Ju
ne 2
014
wer
e fo
rfeite
d.
+ Th
e fa
ir va
lue
of th
e sh
are-
base
d pa
ymen
ts is
cal
cula
ted
as s
et o
ut in
Not
e 30
‘Sha
re-b
ased
pay
men
ts’ i
n th
e no
tes
to th
e fin
anci
al s
tate
men
ts, a
nd is
allo
cate
d to
eac
h re
porti
ng p
erio
d ev
enly
ove
r the
per
iod
from
gra
nt d
ate
to
ve
stin
g da
te. T
he v
alue
dis
clos
ed is
the
porti
on o
f the
fair
valu
e of
the
shar
e-ba
sed
paym
ents
reco
gnis
ed in
this
repo
rting
per
iod
net o
f the
impa
ct o
f for
feitu
res.
In v
alui
ng th
e sh
are-
base
d pa
ymen
ts, m
arke
t con
ditio
ns h
ave
bee
n
take
n in
to a
ccou
nt.
* C
ash
bonu
s w
as a
ccru
ed w
ith th
e ef
fect
ive
date
of 3
0 Ju
ne 2
013.
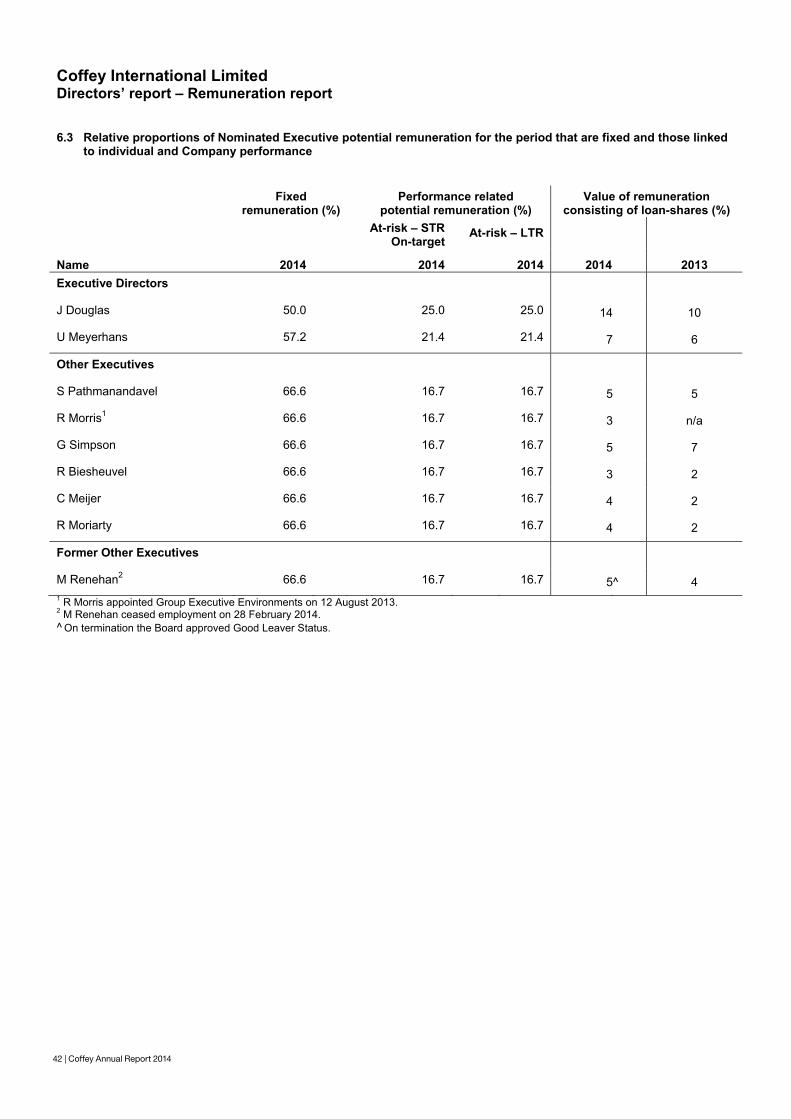
42 | Coffey Annual Report 2014
Coffey International Limited Directors’ report – Remuneration report
42 | Coffey Annual Report 2014
6.3 Relative proportions of Nominated Executive potential remuneration for the period that are fixed and those linked
to individual and Company performance
Fixed
remuneration (%) Performance related
potential remuneration (%) Value of remuneration
consisting of loan-shares (%)
At-risk – STR
On-target At-risk – LTR
Name 2014 2014 2014 2014 2013 Executive Directors
J Douglas 50.0 25.0 25.0 14 10
U Meyerhans 57.2 21.4 21.4 7 6
Other Executives
S Pathmanandavel 66.6 16.7 16.7 5 5
R Morris1 66.6 16.7 16.7 3 n/a
G Simpson 66.6 16.7 16.7 5 7
R Biesheuvel 66.6 16.7 16.7 3 2
C Meijer 66.6 16.7 16.7 4 2
R Moriarty 66.6 16.7 16.7 4 2
Former Other Executives
M Renehan2 66.6 16.7 16.7 5^ 4 1 R Morris appointed Group Executive Environments on 12 August 2013. 2 M Renehan ceased employment on 28 February 2014. ^ On termination the Board approved Good Leaver Status.
Coffey International Limited Directors’ report – Remuneration report
Coffey Annual Report 2014 | 43
6.4 Details of Nominated Executive remuneration: variable at-risk remuneration The percentage of the available STR and LTR that was paid with respect to the 2014 financial year and the percentage that was forfeited because the person did not meet the performance criteria are set out below. No part of the STR in the table below is payable in future years.
Short-Term Rewards Long-Term Rewards
(subject to vesting hurdles)
Name Paid (%) Forfeited (%)
FY2014 remuneration
granted (%)
FY2012 grant forfeited
based onmeasurement (%)
Executive Directors
J Douglas 0% 100% 100% 100%
U Meyerhans 0% 100% 100% 100%
Other Executives
S Pathmanandavel 0% 100% 100% 100%
R Morris1 0% 100% 100% N/A
G Simpson 36% 64% 100% 100%
R Biesheuvel 44% 56% 100% N/A
C Meijer2 0% 100% 100% N/A
R Moriarty 0% 100% 100% N/A
Former Other Executives
M Renehan3 0% 100% 100% 100%
1 R Morris appointed Group Executive Environments effective 12 August 2013. 2 C Meijer appointed Group Executive Markets effective 31 March 2014. 3 M Renehan ceased employment on 28 February 2014.
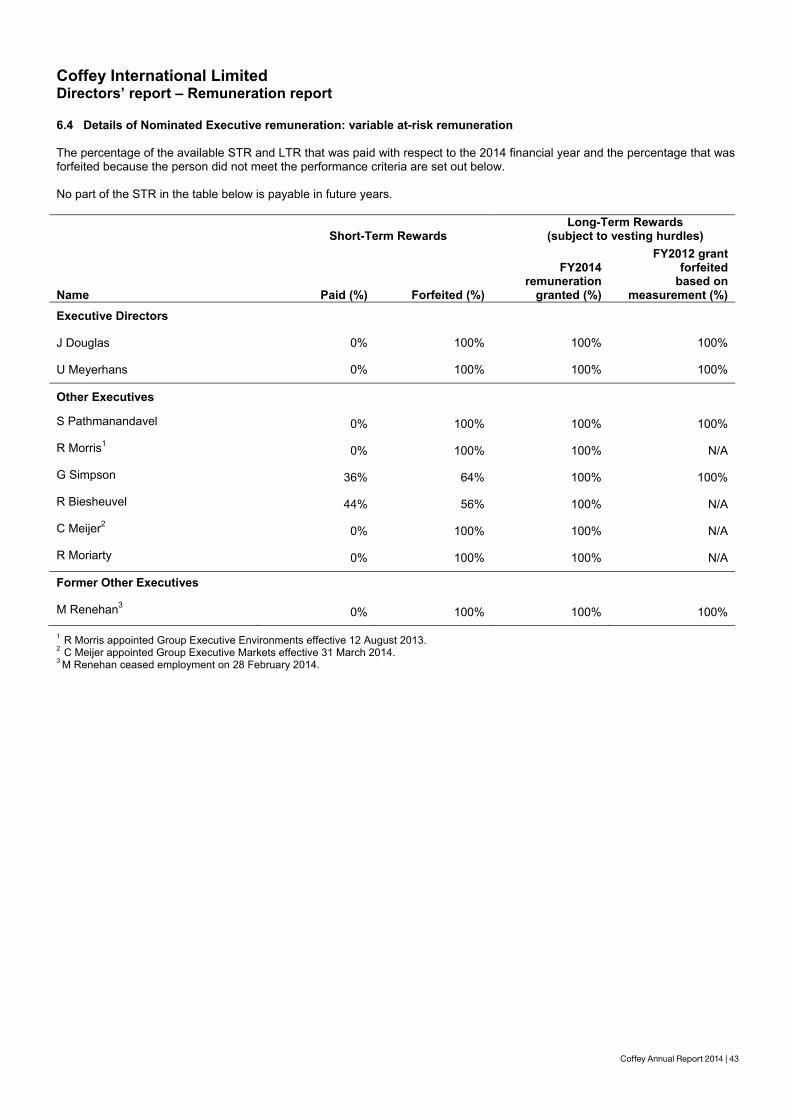
Coffey Annual Report 2014 | 43
Coffey International Limited Directors’ report – Remuneration report
Coffey Annual Report 2014 | 43
6.4 Details of Nominated Executive remuneration: variable at-risk remuneration The percentage of the available STR and LTR that was paid with respect to the 2014 financial year and the percentage that was forfeited because the person did not meet the performance criteria are set out below. No part of the STR in the table below is payable in future years.
Short-Term Rewards Long-Term Rewards
(subject to vesting hurdles)
Name Paid (%) Forfeited (%)
FY2014 remuneration
granted (%)
FY2012 grant forfeited
based onmeasurement (%)
Executive Directors
J Douglas 0% 100% 100% 100%
U Meyerhans 0% 100% 100% 100%
Other Executives
S Pathmanandavel 0% 100% 100% 100%
R Morris1 0% 100% 100% N/A
G Simpson 36% 64% 100% 100%
R Biesheuvel 44% 56% 100% N/A
C Meijer2 0% 100% 100% N/A
R Moriarty 0% 100% 100% N/A
Former Other Executives
M Renehan3 0% 100% 100% 100%
1 R Morris appointed Group Executive Environments effective 12 August 2013. 2 C Meijer appointed Group Executive Markets effective 31 March 2014. 3 M Renehan ceased employment on 28 February 2014.
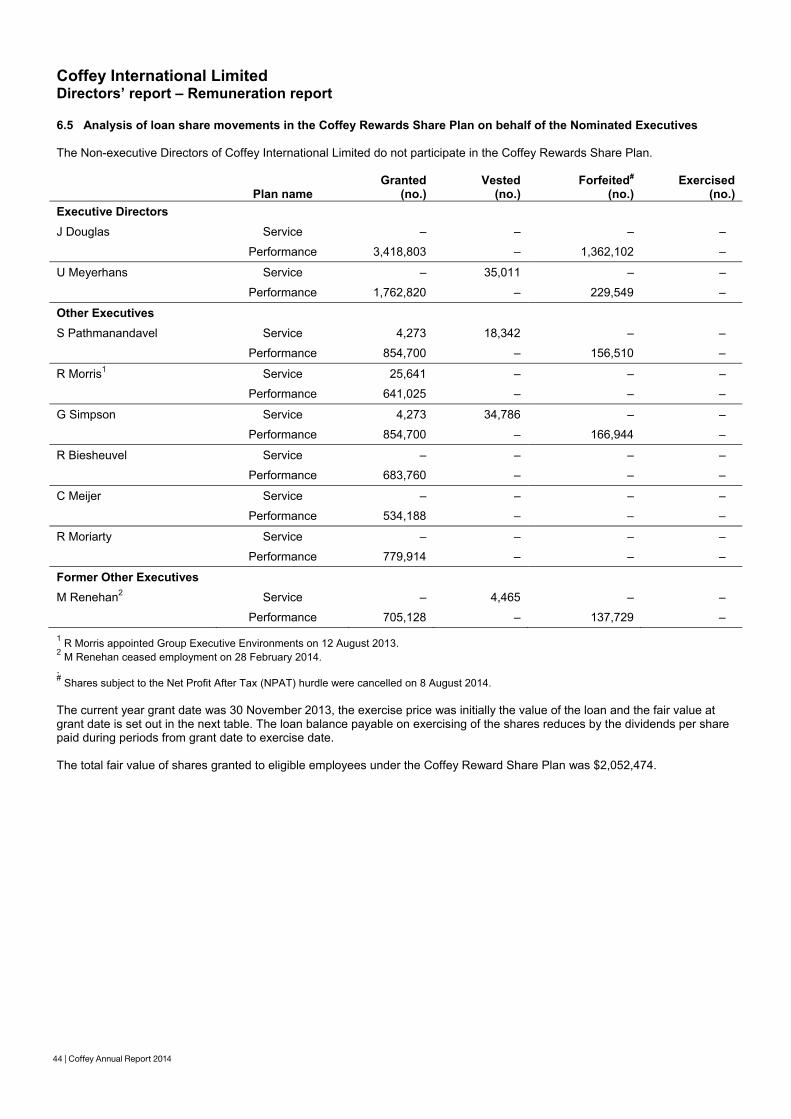
44 | Coffey Annual Report 2014
Coffey International Limited Directors’ report – Remuneration report
44 | Coffey Annual Report 2014
6.5 Analysis of loan share movements in the Coffey Rewards Share Plan on behalf of the Nominated Executives The Non-executive Directors of Coffey International Limited do not participate in the Coffey Rewards Share Plan.
Plan name Granted
(no.) Vested
(no.) Forfeited#
(no.) Exercised
(no.) Executive Directors J Douglas Service – – – –
Performance 3,418,803 – 1,362,102 –
U Meyerhans Service – 35,011 – –
Performance 1,762,820 – 229,549 –
Other Executives S Pathmanandavel Service 4,273 18,342 – –
Performance 854,700 – 156,510 –
R Morris1 Service 25,641 – – –
Performance 641,025 – – –
G Simpson Service 4,273 34,786 – –
Performance 854,700 – 166,944 –
R Biesheuvel Service – – – –
Performance 683,760 – – –
C Meijer Service – – – –
Performance 534,188 – – –
R Moriarty Service – – – –
Performance 779,914 – – –
Former Other Executives
M Renehan2 Service – 4,465 – –
Performance 705,128 – 137,729 – 1 R Morris appointed Group Executive Environments on 12 August 2013. 2 M Renehan ceased employment on 28 February 2014.
. # Shares subject to the Net Profit After Tax (NPAT) hurdle were cancelled on 8 August 2014. The current year grant date was 30 November 2013, the exercise price was initially the value of the loan and the fair value at grant date is set out in the next table. The loan balance payable on exercising of the shares reduces by the dividends per share paid during periods from grant date to exercise date. The total fair value of shares granted to eligible employees under the Coffey Reward Share Plan was $2,052,474.
Coffey International Limited Directors’ report – Remuneration report
Coffey Annual Report 2014 | 45
6.6 Grants under the Coffey Rewards Share Plan to Nominated Executives together with vesting details
Performance grants
Name Plan year
Loan-shares granted
(no.) Vested
(%) Forfeited#
(%) Earliest
vesting date
Fair value at grant date
($) Executive Directors J Douglas 2010^ 694,323 – 100% 1-Mar-14 215,761 2012 667,779 – 100% 21-Mar-15 210,350 2013 1,176,470 – – 1-Dec-15 241,176 2014 3,418,803 – – 30-Nov-16 564,103 U Meyerhans 2012 229,549 – 100% 26-Mar-15 72,307 2013 606,617 – – 1-Dec-15 124,356 2014 1,762,820 – – 30-Nov-16 290,865 Other Executives S Pathmanandavel 2012 156,510 – 100% 21-Mar-15 49,300 2013 275,735 – – 1-Dec-15 56,526 2014 854,700 – – 30-Nov-16 141,026
R Morris1 2014 641,025 – – 30-Nov-16 105,769
G Simpson 2012 166,944 – 100% 21-Mar-15 52,587 2013 294,117 – – 1-Dec-15 60,294 2014 854,700 – – 30-Nov-16 141,026 R Biesheuvel 2013 96,847 – – 13-Mar-16 22,759 2014 683,760 – – 30-Nov-16 112,820 C Meijer 2013 183,823 – – 1-Dec-15 37,684 2014 534,188 – – 30-Nov-16 88,141 R Moriarty 2013 268,382 – – 1-Dec-15 55,018 2014 779,914 – – 30-Nov-16 128,686 Former Other Executives M Renehan2 2012 137,729 – 100% 21-Mar-15 43,385 2013 242,647 – – 1-Dec-15 49,743 2014 705,128 – – 30-Nov-16 116,346 1 R Morris appointed Group Executive Environments on 12 August 2013. 2 M Renehan ceased employment on 28 February 2014. ^ Initial grant on appointment. # Shares subject to the Net Profit After Tax (NPAT) hurdle were cancelled on 8 August 2014.
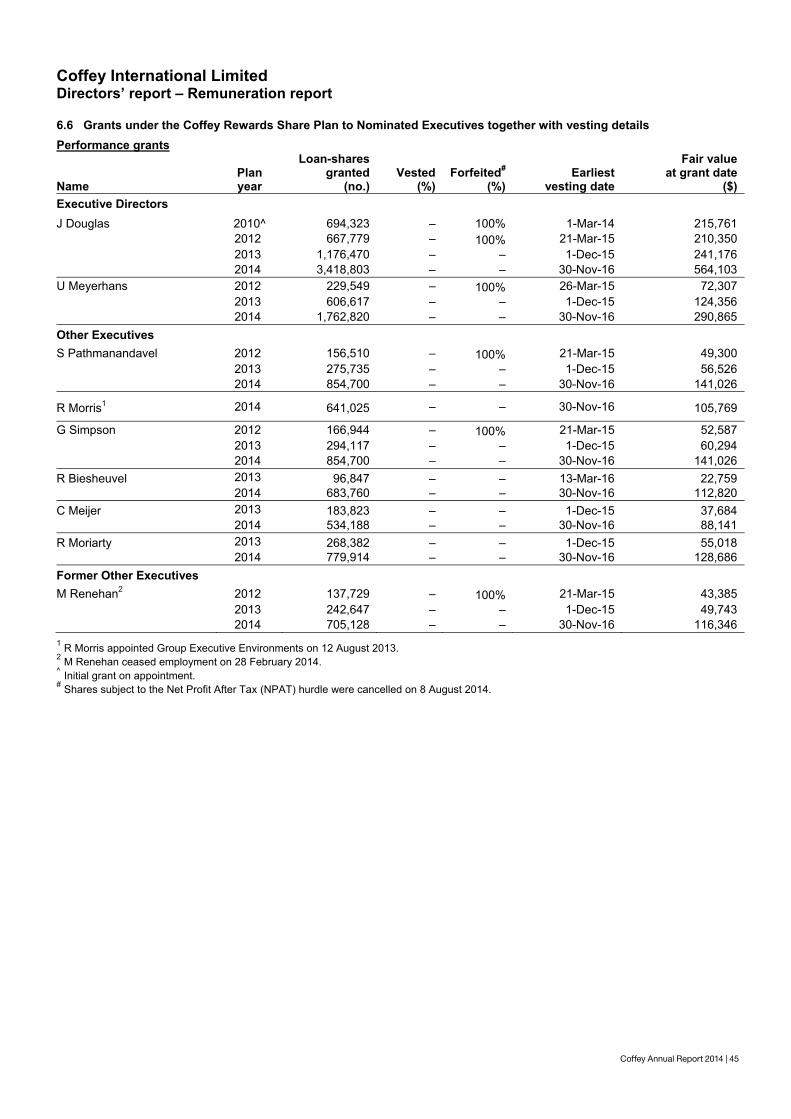
Coffey Annual Report 2014 | 45
Coffey International Limited Directors’ report – Remuneration report
Coffey Annual Report 2014 | 45
6.6 Grants under the Coffey Rewards Share Plan to Nominated Executives together with vesting details
Performance grants
Name Plan year
Loan-shares granted
(no.) Vested
(%) Forfeited#
(%) Earliest
vesting date
Fair value at grant date
($) Executive Directors J Douglas 2010^ 694,323 – 100% 1-Mar-14 215,761 2012 667,779 – 100% 21-Mar-15 210,350 2013 1,176,470 – – 1-Dec-15 241,176 2014 3,418,803 – – 30-Nov-16 564,103 U Meyerhans 2012 229,549 – 100% 26-Mar-15 72,307 2013 606,617 – – 1-Dec-15 124,356 2014 1,762,820 – – 30-Nov-16 290,865 Other Executives S Pathmanandavel 2012 156,510 – 100% 21-Mar-15 49,300 2013 275,735 – – 1-Dec-15 56,526 2014 854,700 – – 30-Nov-16 141,026
R Morris1 2014 641,025 – – 30-Nov-16 105,769
G Simpson 2012 166,944 – 100% 21-Mar-15 52,587 2013 294,117 – – 1-Dec-15 60,294 2014 854,700 – – 30-Nov-16 141,026 R Biesheuvel 2013 96,847 – – 13-Mar-16 22,759 2014 683,760 – – 30-Nov-16 112,820 C Meijer 2013 183,823 – – 1-Dec-15 37,684 2014 534,188 – – 30-Nov-16 88,141 R Moriarty 2013 268,382 – – 1-Dec-15 55,018 2014 779,914 – – 30-Nov-16 128,686 Former Other Executives M Renehan2 2012 137,729 – 100% 21-Mar-15 43,385 2013 242,647 – – 1-Dec-15 49,743 2014 705,128 – – 30-Nov-16 116,346 1 R Morris appointed Group Executive Environments on 12 August 2013. 2 M Renehan ceased employment on 28 February 2014. ^ Initial grant on appointment. # Shares subject to the Net Profit After Tax (NPAT) hurdle were cancelled on 8 August 2014.
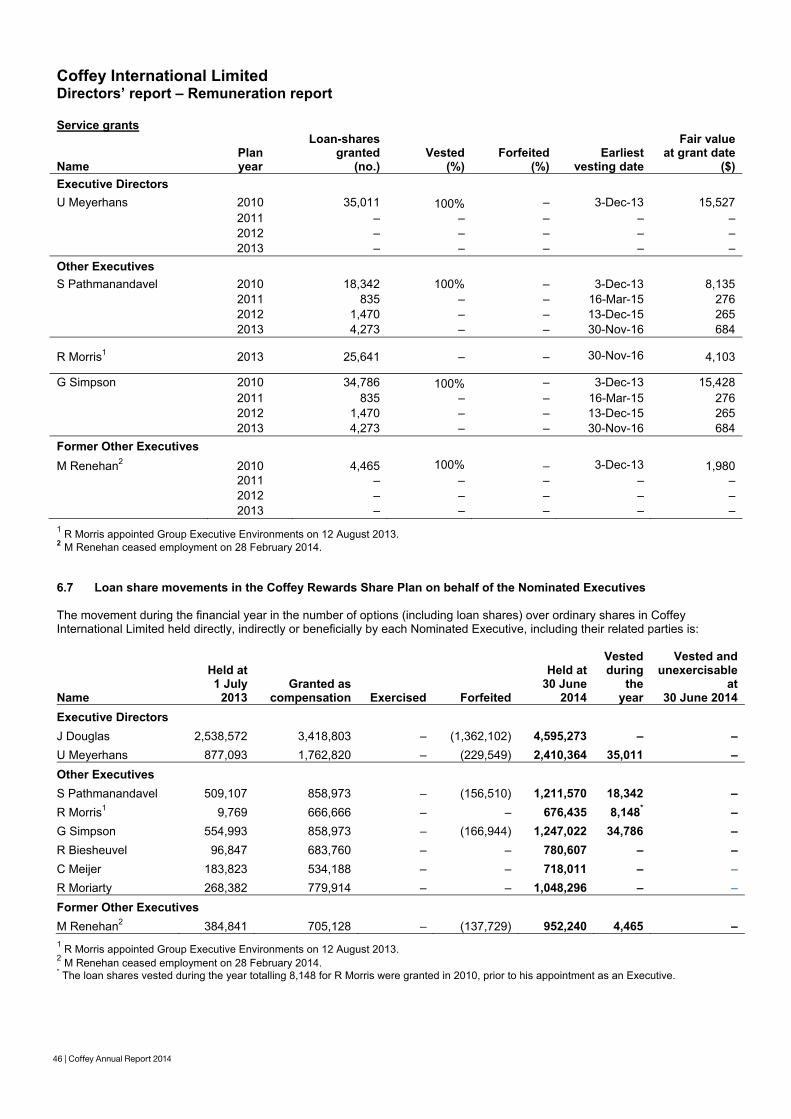
46 | Coffey Annual Report 2014
Coffey International Limited Directors’ report – Remuneration report
46 | Coffey Annual Report 2014
Service grants
Name Plan year
Loan-shares granted
(no.) Vested
(%) Forfeited
(%) Earliest
vesting date
Fair value at grant date
($) Executive Directors U Meyerhans 2010 35,011 100% – 3-Dec-13 15,527 2011 – – – – – 2012 – – – – – 2013 – – – – – Other Executives S Pathmanandavel 2010 18,342 100% – 3-Dec-13 8,135 2011 835 – – 16-Mar-15 276 2012 1,470 – – 13-Dec-15 265 2013 4,273 – – 30-Nov-16 684
R Morris1 2013 25,641 – – 30-Nov-16 4,103
G Simpson 2010 34,786 100% – 3-Dec-13 15,428 2011 835 – – 16-Mar-15 276 2012 1,470 – – 13-Dec-15 265 2013 4,273 – – 30-Nov-16 684 Former Other Executives M Renehan2 2010 4,465 100% – 3-Dec-13 1,980 2011 – – – – – 2012 – – – – – 2013 – – – – – 1 R Morris appointed Group Executive Environments on 12 August 2013. 2 M Renehan ceased employment on 28 February 2014.
6.7 Loan share movements in the Coffey Rewards Share Plan on behalf of the Nominated Executives The movement during the financial year in the number of options (including loan shares) over ordinary shares in Coffey International Limited held directly, indirectly or beneficially by each Nominated Executive, including their related parties is:
Name
Held at 1 July
2013 Granted as
compensation Exercised Forfeited
Held at 30 June
2014
Vested during
the year
Vested and unexercisable
at30 June 2014
Executive Directors J Douglas 2,538,572 3,418,803 – (1,362,102) 4,595,273 – – U Meyerhans 877,093 1,762,820 – (229,549) 2,410,364 35,011 – Other Executives S Pathmanandavel 509,107 858,973 – (156,510) 1,211,570 18,342 – R Morris1 9,769 666,666 – – 676,435 8,148* – G Simpson 554,993 858,973 – (166,944) 1,247,022 34,786 – R Biesheuvel 96,847 683,760 – – 780,607 – – C Meijer 183,823 534,188 – – 718,011 – – R Moriarty 268,382 779,914 – – 1,048,296 – – Former Other Executives M Renehan2 384,841 705,128 – (137,729) 952,240 4,465 – 1 R Morris appointed Group Executive Environments on 12 August 2013. 2 M Renehan ceased employment on 28 February 2014. * The loan shares vested during the year totalling 8,148 for R Morris were granted in 2010, prior to his appointment as an Executive.
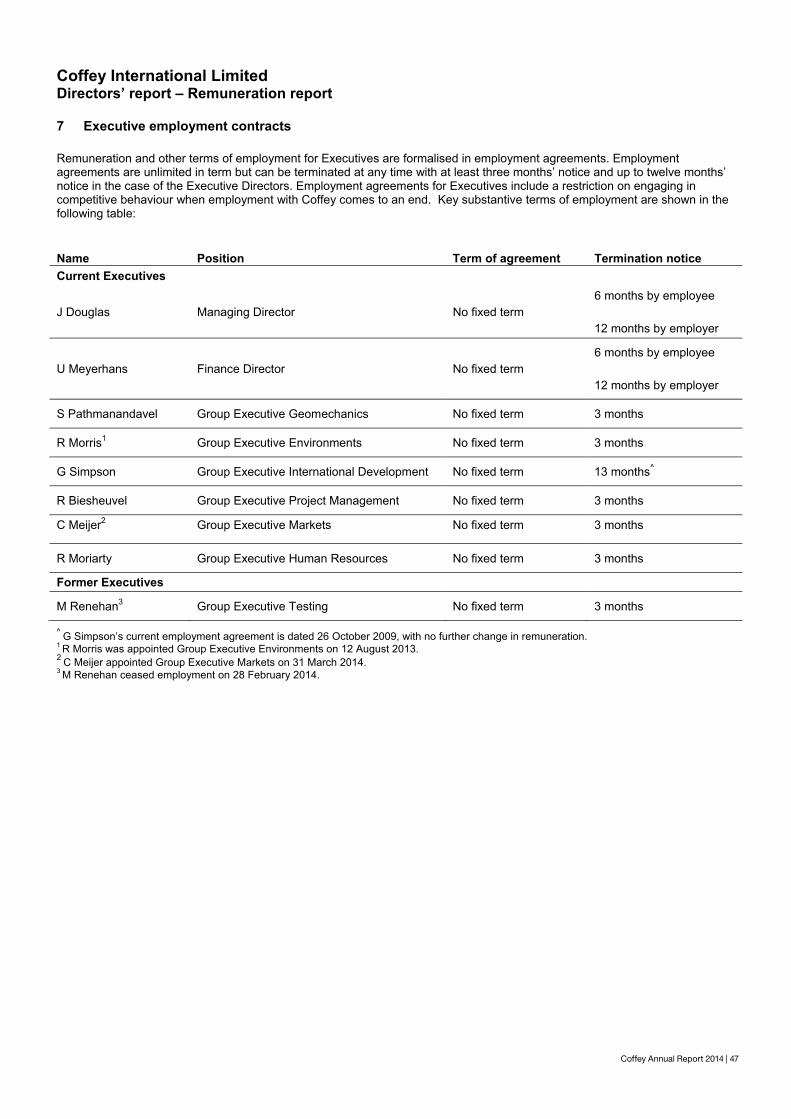
Coffey Annual Report 2014 | 47
Coffey International Limited Directors’ report – Remuneration report
46 | Coffey Annual Report 2014
Service grants
Name Plan year
Loan-shares granted
(no.) Vested
(%) Forfeited
(%) Earliest
vesting date
Fair value at grant date
($) Executive Directors U Meyerhans 2010 35,011 100% – 3-Dec-13 15,527 2011 – – – – – 2012 – – – – – 2013 – – – – – Other Executives S Pathmanandavel 2010 18,342 100% – 3-Dec-13 8,135 2011 835 – – 16-Mar-15 276 2012 1,470 – – 13-Dec-15 265 2013 4,273 – – 30-Nov-16 684
R Morris1 2013 25,641 – – 30-Nov-16 4,103
G Simpson 2010 34,786 100% – 3-Dec-13 15,428 2011 835 – – 16-Mar-15 276 2012 1,470 – – 13-Dec-15 265 2013 4,273 – – 30-Nov-16 684 Former Other Executives M Renehan2 2010 4,465 100% – 3-Dec-13 1,980 2011 – – – – – 2012 – – – – – 2013 – – – – – 1 R Morris appointed Group Executive Environments on 12 August 2013. 2 M Renehan ceased employment on 28 February 2014.
6.7 Loan share movements in the Coffey Rewards Share Plan on behalf of the Nominated Executives The movement during the financial year in the number of options (including loan shares) over ordinary shares in Coffey International Limited held directly, indirectly or beneficially by each Nominated Executive, including their related parties is:
Name
Held at 1 July
2013 Granted as
compensation Exercised Forfeited
Held at 30 June
2014
Vested during
the year
Vested and unexercisable
at30 June 2014
Executive Directors J Douglas 2,538,572 3,418,803 – (1,362,102) 4,595,273 – – U Meyerhans 877,093 1,762,820 – (229,549) 2,410,364 35,011 – Other Executives S Pathmanandavel 509,107 858,973 – (156,510) 1,211,570 18,342 – R Morris1 9,769 666,666 – – 676,435 8,148* – G Simpson 554,993 858,973 – (166,944) 1,247,022 34,786 – R Biesheuvel 96,847 683,760 – – 780,607 – – C Meijer 183,823 534,188 – – 718,011 – – R Moriarty 268,382 779,914 – – 1,048,296 – – Former Other Executives M Renehan2 384,841 705,128 – (137,729) 952,240 4,465 – 1 R Morris appointed Group Executive Environments on 12 August 2013. 2 M Renehan ceased employment on 28 February 2014. * The loan shares vested during the year totalling 8,148 for R Morris were granted in 2010, prior to his appointment as an Executive.
Coffey International Limited Directors’ report – Remuneration report
Coffey Annual Report 2014 | 47
7 Executive employment contracts Remuneration and other terms of employment for Executives are formalised in employment agreements. Employment agreements are unlimited in term but can be terminated at any time with at least three months’ notice and up to twelve months’ notice in the case of the Executive Directors. Employment agreements for Executives include a restriction on engaging in competitive behaviour when employment with Coffey comes to an end. Key substantive terms of employment are shown in the following table:
Name Position Term of agreement Termination notice Current Executives
J Douglas Managing Director No fixed term 6 months by employee 12 months by employer
U Meyerhans Finance Director No fixed term 6 months by employee 12 months by employer
S Pathmanandavel Group Executive Geomechanics No fixed term 3 months
R Morris1 Group Executive Environments No fixed term 3 months
G Simpson Group Executive International Development No fixed term 13 months^
R Biesheuvel Group Executive Project Management No fixed term 3 months
C Meijer2 Group Executive Markets No fixed term 3 months
R Moriarty Group Executive Human Resources No fixed term 3 months
Former Executives
M Renehan3 Group Executive Testing No fixed term 3 months
^ G Simpson’s current employment agreement is dated 26 October 2009, with no further change in remuneration. 1 R Morris was appointed Group Executive Environments on 12 August 2013. 2 C Meijer appointed Group Executive Markets on 31 March 2014. 3 M Renehan ceased employment on 28 February 2014.
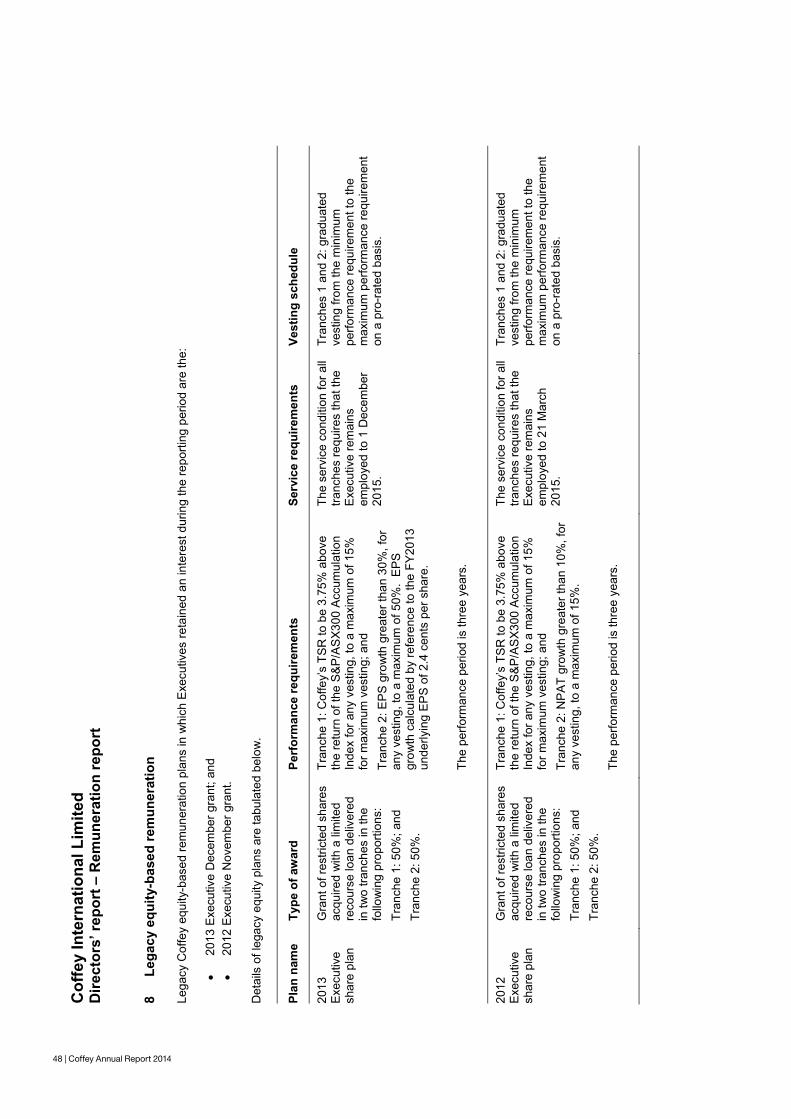
48 | Coffey Annual Report 2014
Cof
fey
Inte
rnat
iona
l Lim
ited
Dire
ctor
s’ re
port
– R
emun
erat
ion
repo
rt
48 |
Cof
fey
Ann
ual R
epor
t 201
4 8
Lega
cy e
quity
-bas
ed re
mun
erat
ion
Lega
cy C
offe
y eq
uity
-bas
ed re
mun
erat
ion
plan
s in
whi
ch E
xecu
tives
reta
ined
an
inte
rest
dur
ing
the
repo
rting
per
iod
are
the:
20
13 E
xecu
tive
Dec
embe
r gra
nt; a
nd
20
12 E
xecu
tive
Nov
embe
r gra
nt.
Det
ails
of l
egac
y eq
uity
pla
ns a
re ta
bula
ted
belo
w.
Plan
nam
e Ty
pe o
f aw
ard
Perf
orm
ance
requ
irem
ents
Se
rvic
e re
quire
men
ts
Vest
ing
sche
dule
2013
Ex
ecut
ive
shar
e pl
an
Gra
nt o
f res
trict
ed s
hare
s ac
quire
d w
ith a
lim
ited
reco
urse
loan
del
iver
ed
in tw
o tra
nche
s in
the
follo
win
g pr
opor
tions
: Tr
anch
e 1:
50%
; and
Tr
anch
e 2:
50%
.
Tran
che
1: C
offe
y’s
TSR
to b
e 3.
75%
abo
ve
the
retu
rn o
f the
S&
P/A
SX3
00 A
ccum
ulat
ion
Inde
x fo
r any
ves
ting,
to a
max
imum
of 1
5%
for m
axim
um v
estin
g; a
nd
Tran
che
2: E
PS
gro
wth
gre
ater
than
30%
, for
an
y ve
stin
g, to
a m
axim
um o
f 50%
. E
PS
gr
owth
cal
cula
ted
by re
fere
nce
to th
e FY
2013
un
derly
ing
EP
S o
f 2.4
cen
ts p
er s
hare
. Th
e pe
rform
ance
per
iod
is th
ree
year
s.
The
serv
ice
cond
ition
for a
ll tra
nche
s re
quire
s th
at th
e Ex
ecut
ive
rem
ains
em
ploy
ed to
1 D
ecem
ber
2015
.
Tran
ches
1 a
nd 2
: gra
duat
ed
vest
ing
from
the
min
imum
pe
rform
ance
requ
irem
ent t
o th
e m
axim
um p
erfo
rman
ce re
quire
men
t on
a p
ro-r
ated
bas
is.
2012
Ex
ecut
ive
shar
e pl
an
Gra
nt o
f res
trict
ed s
hare
s ac
quire
d w
ith a
lim
ited
reco
urse
loan
del
iver
ed
in tw
o tra
nche
s in
the
follo
win
g pr
opor
tions
: Tr
anch
e 1:
50%
; and
Tr
anch
e 2:
50%
.
Tran
che
1: C
offe
y’s
TSR
to b
e 3.
75%
abo
ve
the
retu
rn o
f the
S&
P/A
SX3
00 A
ccum
ulat
ion
Inde
x fo
r any
ves
ting,
to a
max
imum
of 1
5%
for m
axim
um v
estin
g; a
nd
Tran
che
2: N
PA
T gr
owth
gre
ater
than
10%
, for
an
y ve
stin
g, to
a m
axim
um o
f 15%
. Th
e pe
rform
ance
per
iod
is th
ree
year
s.
The
serv
ice
cond
ition
for a
ll tra
nche
s re
quire
s th
at th
e Ex
ecut
ive
rem
ains
em
ploy
ed to
21
Mar
ch
2015
.
Tran
ches
1 a
nd 2
: gra
duat
ed
vest
ing
from
the
min
imum
pe
rform
ance
requ
irem
ent t
o th
e m
axim
um p
erfo
rman
ce re
quire
men
t on
a p
ro-r
ated
bas
is.
Coffey International Limited Directors’ report – Remuneration report
Coffey Annual Report 2014 |49
9 Transactions with key management personnel 9.1 Loans to key management personnel Loans outstanding from Nominated Executives at the end of the current and prior years are for the purchase of shares under the Coffey Rewards Share Plan (formerly Coffey International Limited Employee Leveraged Share Plan). The loan shares are issued on conditions no more favourable than those available to other participating employees. No interest is payable on the loan balances and the loans are limited-recourse to the Executive. The terms and conditions of the Coffey Rewards Share Plan are described in Note 30. The limited-recourse loans are reduced over the life of the arrangement by the value of dividends paid per instrument. Due to its limited recourse nature, for accounting purposes the loan is not recognised as a receivable but rather is treated as an option to purchase shares in the company and no loan balances are disclosed. No write-downs or allowances for doubtful receivables have been recognised in relation to any loans made to Key Management Personnel. 9.2 Other transactions with key management personnel Transactions entered into with Nominated Executives are within normal employee relationships, on terms and conditions no more favourable than those available to other employees or shareholders. They include:
Share issues under the Coffey Rewards Share Plan (formerly Coffey International Limited Employee Leveraged Share Plan) (Note 30);
Dividends from shares in Coffey International Limited; and Terms of employment and reimbursement of expenses.
9.3 Movements in shares Movements in the number of ordinary shares in Coffey International Limited held, directly, indirectly or beneficially by each Nominated Executive, including their related parties is:
Name Held at
1 July 2013 Cash
Purchases
Received onexercise of
options and rights Sales
Held at30 June 2014
Non-executive Directors J Mulcahy 1,139,286 500,000 – – 1,639,286
S Black AM 287,027 – – – 287,027
L Bond 150,000 – – – 150,000
G Cowan 147,531 163,982 – – 311,513
S Oliver 276,800 43,200 – – 320,000
Executive Directors J Douglas 7,294,707 – – – 7,294,707 U Meyerhans 1,000,000 – – – 1,000,000 Other Executives S Pathmanandavel 224,987 – – – 224,987 R Morris1 26,681 – – – 26,681 G Simpson 272,027 – – – 272,027 C Meijer 68,000 – – – 68,000 Former Other Executives M Renehan2 12,756 - – – 12,756 1 R Morris appointed Group Executive Environments on 12 August 2013. 2 M Renehan ceased employment on 28 February 2014. (End of Remuneration Report)
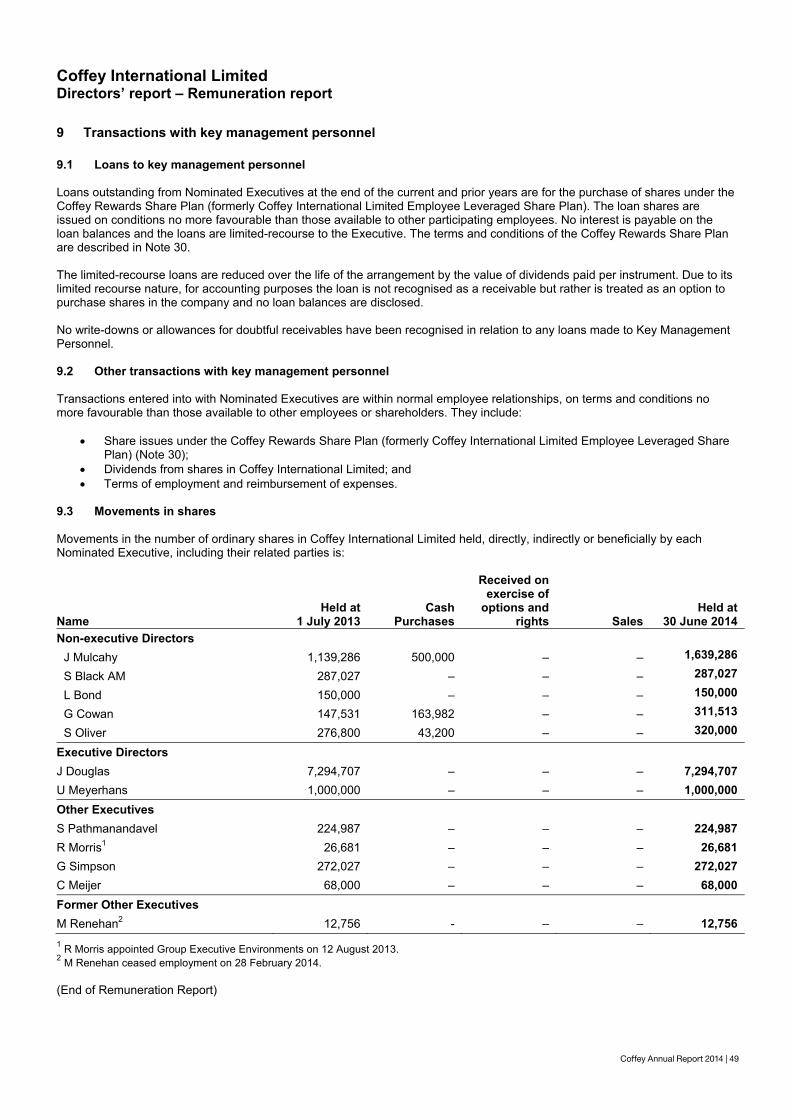
Coffey Annual Report 2014 | 49
Coffey International Limited Directors’ report – Remuneration report
Coffey Annual Report 2014 |49
9 Transactions with key management personnel 9.1 Loans to key management personnel Loans outstanding from Nominated Executives at the end of the current and prior years are for the purchase of shares under the Coffey Rewards Share Plan (formerly Coffey International Limited Employee Leveraged Share Plan). The loan shares are issued on conditions no more favourable than those available to other participating employees. No interest is payable on the loan balances and the loans are limited-recourse to the Executive. The terms and conditions of the Coffey Rewards Share Plan are described in Note 30. The limited-recourse loans are reduced over the life of the arrangement by the value of dividends paid per instrument. Due to its limited recourse nature, for accounting purposes the loan is not recognised as a receivable but rather is treated as an option to purchase shares in the company and no loan balances are disclosed. No write-downs or allowances for doubtful receivables have been recognised in relation to any loans made to Key Management Personnel. 9.2 Other transactions with key management personnel Transactions entered into with Nominated Executives are within normal employee relationships, on terms and conditions no more favourable than those available to other employees or shareholders. They include:
Share issues under the Coffey Rewards Share Plan (formerly Coffey International Limited Employee Leveraged Share Plan) (Note 30);
Dividends from shares in Coffey International Limited; and Terms of employment and reimbursement of expenses.
9.3 Movements in shares Movements in the number of ordinary shares in Coffey International Limited held, directly, indirectly or beneficially by each Nominated Executive, including their related parties is:
Name Held at
1 July 2013 Cash
Purchases
Received onexercise of
options and rights Sales
Held at30 June 2014
Non-executive Directors J Mulcahy 1,139,286 500,000 – – 1,639,286
S Black AM 287,027 – – – 287,027
L Bond 150,000 – – – 150,000
G Cowan 147,531 163,982 – – 311,513
S Oliver 276,800 43,200 – – 320,000
Executive Directors J Douglas 7,294,707 – – – 7,294,707 U Meyerhans 1,000,000 – – – 1,000,000 Other Executives S Pathmanandavel 224,987 – – – 224,987 R Morris1 26,681 – – – 26,681 G Simpson 272,027 – – – 272,027 C Meijer 68,000 – – – 68,000 Former Other Executives M Renehan2 12,756 - – – 12,756 1 R Morris appointed Group Executive Environments on 12 August 2013. 2 M Renehan ceased employment on 28 February 2014. (End of Remuneration Report)
50 | Coffey Annual Report 2014
CoDi
50 |
AuA cfoll RoTherelabee AuKP Thi
JohCh Syd8 A
offey Interrectors’ re
Coffey Annual Re
uditor’s indcopy of the auowing page.
ounding of e company is ating to the roen rounded of
uditor PMG continues
is report is ma
hn F Mulcahy airman
dney August 2014
rnational Lport
eport 2014
dependencditor’s indepe
f amounts of a kind referunding off of aff in accordanc
s in office in ac
ade in accorda
Limited
ce declaratindence decla
rred to in Clasamounts in thece with that Cl
ccordance wit
ance with a res
ion ration as requ
ss Order 98/01e Directors’ Relass Order to t
th Section 327
solution of the
uired under Se
100, issued byeport. Amounthe nearest th
7 of the Corpo
e Directors.
JohnMana
ection 307C of
y the Australiats in the Direc
housand dollar
rations Act 20
M Douglas aging Director
f the Corporati
an Securities actors’ Report ars, or in certain
001.
ions Act 2001
and Investmenand the Financn cases, to the
is set out on t
nts Commissiocial Report have nearest dolla
the
on, ve ar.
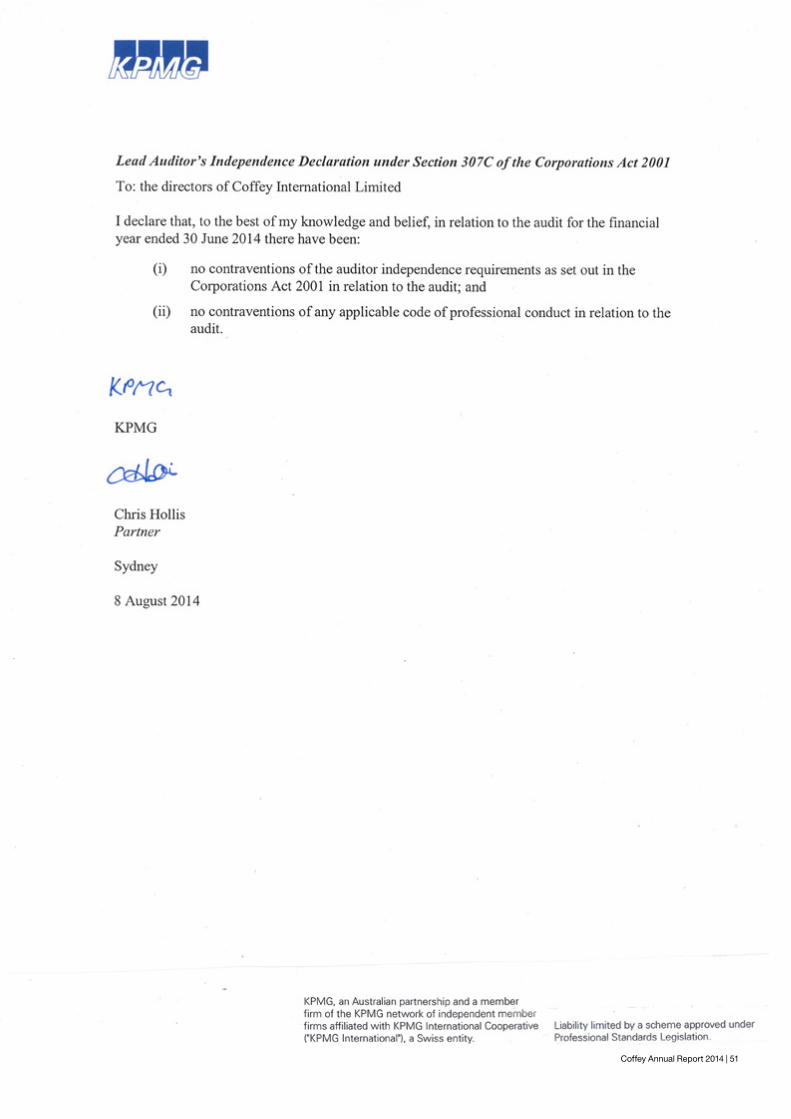
Coffey Annual Report 2014 | 51
CoDi
50 |
AuA cfoll RoTherelabee AuKP Thi
JohCh Syd8 A
offey Interrectors’ re
Coffey Annual Re
uditor’s indcopy of the auowing page.
ounding of e company is ating to the roen rounded of
uditor PMG continues
is report is ma
hn F Mulcahy airman
dney August 2014
rnational Lport
eport 2014
dependencditor’s indepe
f amounts of a kind referunding off of aff in accordanc
s in office in ac
ade in accorda
Limited
ce declaratindence decla
rred to in Clasamounts in thece with that Cl
ccordance wit
ance with a res
ion ration as requ
ss Order 98/01e Directors’ Relass Order to t
th Section 327
solution of the
uired under Se
100, issued byeport. Amounthe nearest th
7 of the Corpo
e Directors.
JohnMana
ection 307C of
y the Australiats in the Direc
housand dollar
rations Act 20
M Douglas aging Director
f the Corporati
an Securities actors’ Report ars, or in certain
001.
ions Act 2001
and Investmenand the Financn cases, to the
is set out on t
nts Commissiocial Report have nearest dolla
the
on, ve ar.
52 | Coffey Annual Report 2014
Coffey International Limited Corporate governance statement
52 | Coffey Annual Report 2014
Coffey’s approach to corporate governance Coffey International Limited (Coffey or the Company) supports the Australian Securities Exchange (ASX) Corporate Governance Council’s Corporate Governance Principles and Recommendations (Principles or Recommendations). Coffey is committed to establishing governance systems that deliver best practice in corporate governance and transparency in reporting. This is an ongoing commitment, requiring continual review, modification and enhancement of governance systems. This statement explains how Coffey conforms to the Principles. Where to locate Coffey’s corporate governance information online The charters, codes and policies relating to Coffey’s corporate governance practices referred to in this Statement are available on the corporate governance section of the Coffey website – www.coffey.com Principle 1: Lay solid foundations for management and oversight Recommendation 1.1 –Companies should establish the functions reserved to the Board and those delegated to senior executives and disclose those functions Board responsibilities The Coffey Board (Board) is responsible for the overall corporate governance of Coffey. The Board Charter sets out the following objectives of the Board:
provide strategic guidance for Coffey and effective oversight of management;
optimise Coffey’s performance and shareholder value within a framework of appropriate risk assessment and management; and
recognise Coffey’s legal and other obligations to all legitimate stakeholders.
The Board derives its authority to act from the Company’s Constitution and the Board’s responsibilities are encompassed in a formal Charter, which the Board is responsible for reviewing annually and amending as required. The Charter was most recently reviewed in June 2014. The matters that the Board has specifically reserved for its decision are: oversight of the Company,
including its controls and accountability systems;
providing input into, reviewing and approving Coffey’s strategic plans and performance objectives, and monitoring performance against those plans;
approving and monitoring financial outcomes and the integrity of financial reporting;
protecting Coffey’s financial position and its ability to meet its debts as and when they fall due;
approving and monitoring the progress of major capital expenditure, capital management (including determining Coffey’s dividend policy and declaring dividends), and acquisitions and divestitures;
reviewing and monitoring the effectiveness of Coffey’s systems of risk management and internal control (including matters of health, safety, security and environment);
evaluating the performance of the Board, determining its size and composition and setting Non-executive Director remuneration within shareholder approved limits;
appointing, approving terms of engagement and termination benefits, and monitoring the performance of the Managing Director (MD) and, if required, terminating the appointment of the MD;
ratifying the appointment and removal of any Executive Director, the Chief Financial Officer (CFO), any other member of the Management Team and the Company Secretary, approving their terms of engagement and termination benefits, and monitoring their performance;
planning for Board, MD and Management Team succession;
establishing Coffey’s culture and values, and monitoring compliance with legislative and regulatory requirements (including continuous disclosure) and ethical standards, including reviewing and ratifying codes of conduct and compliance systems;
promoting diversity on the Board, reviewing and approving Coffey policies in relation to diversity, approving the measurable objectives and monitoring progress towards their achievement;
monitoring the timeliness and effectiveness of communications with shareholders and other stakeholders;
approving and monitoring policies governing Coffey’s relationship with other stakeholders and the broader community, including policies in relation to environmental management and occupational health and safety; and
reviewing and recommending to shareholders the appointment or, if appropriate, the termination of the appointment of the external auditor.
While at all times the Board retains full responsibility for guiding and monitoring Coffey, in discharging its responsibilities it makes use of Board Committees. Specialist committees can focus on a particular area of responsibility, and report and provide recommendations to the Board.
Coffey Annual Report 2014 | 53
Coffey International Limited Corporate governance statement
Coffey Annual Report 2014 | 53
The Board has established the following standing Committees: Risk and Audit Committee (see
Principles 4 and 7); Nomination Committee (see
Principle 2); and Human Resources and
Remuneration Committee (see Principle 8).
All Coffey Directors receive copies of all Board Committee papers, including minutes, and may attend meetings of all Board Committees whether or not they are Committee members provided no conflict of interest exists. The Chair of each Committee reports back on the Committee matters, conclusions and recommendations to the Board at the next full meeting. Delegation to management The Board has delegated to the MD and, through the MD, to the Management Team responsibility for the day-to-day management and operations of Coffey and implementation of the Company’s strategy and policy initiatives. The MD and Management Team are accountable to the Board for performance of these duties, including: developing, implementing and
reviewing the effectiveness of Coffey’s Health, Safety, Security and Environment Management System;
developing and implementing corporate strategies and making recommendations to the Board on significant corporate strategic initiatives;
developing Coffey’s annual budget and managing day-to-day operations within the budget;
maintaining effective risk management and compliance management frameworks;
appointing senior management, including determining terms of appointment, evaluating performance, and developing and maintaining succession plans for senior management roles;
managing day-to-day operations in accordance with standards for social, ethical and environmental practices;
promoting equal opportunity and diversity within all levels of the organisation, developing and implementing policies and initiatives in relation to diversity, and monitoring and assessing progress towards achievement of the measurable objectives; and
keeping the Board and market fully informed about material continuous disclosure.
Specific limits on the authority delegated to the MD and the Management Team are set out in the Board-approved Delegation of Authority Policy. Management Team The Management Team comprises the MD and the direct reports to the MD from each service line and function. Each Management Team member is employed under a service agreement which sets out the terms on which the Executive is employed, including details of the Executive’s duties and responsibilities, rights and remuneration entitlements. The service agreement also sets out the circumstances in which the employment of the Executive may be terminated by either Coffey or the Executive, including details of the notice periods to be given by either party, and the amounts payable to the Executive as a consequence of the termination by Coffey of the Executive’s employment. Each member of the Management Team is employed by Coffey on a permanent basis. Key terms of these service agreements are detailed in the Remuneration Report in this Annual Financial Report.
Recommendation 1.2 – Companies should disclose the process for evaluating the performance of senior executives The performance of Management Team members is reviewed annually against key performance measures as part of Coffey’s performance management system, which is in place for all managers and employees. The system includes processes for the setting of key performance measures at the commencement of the financial year and the annual assessment of performance against these measures. Some performance measures, such as Coffey’s overall financial performance, are common for the Management Team. Other performance measures are specifically set in line with the individual role and responsibilities of the Management Team member. The following process for evaluating Management Team performance was undertaken in the reporting period: the Chairman and Non-
Executive Directors, with the assistance of the Human Resources and Remuneration Committee, reviewed the performance of the MD and the Finance Director (FD); and
the Board, with the assistance of the Human Resources and Remuneration Committee, reviewed the performance of the other members of the Management Team.
Details of the evaluation process and the linkages between the result of performance evaluations and remuneration are disclosed in the Remuneration Report in this Annual Financial Report. An induction program is in place to enable newly appointed Management Team members to gain an understanding of: the Company’s financial
position, strategies, operations and risk management policies; and
the respective rights, duties, responsibilities and roles of the Board and the Management Team.
54 | Coffey Annual Report 2014
Coffey International Limited Corporate governance statement
54 | Coffey Annual Report 2014
Principle 2: Structure the Board to add value Together, the Board members represent a diverse range of backgrounds. They have a broad range of financial and other skills and experience, and the expertise necessary to oversee Coffey’s business. The Board’s size and composition are subject to limits imposed by the Company’s Constitution, which provides for a minimum of three and a maximum of eight Directors (or such number within this range as the Board may determine from time to time). The Board currently comprises five Non-executive Directors and two Executive Directors. The Executive Directors include the MD who is the Chief Executive Officer of Coffey and the FD who is Coffey’s CFO. The Directors of Coffey at any time during the financial year are listed with a brief description of their qualifications, experience and special responsibilities in the Directors’ Report of this Annual Financial Report. The Board met 13 times during the financial year. Directors’ attendances are set out in the Directors’ Report of this Annual Financial Report. The Non-executive Directors also met without the presence of management during the financial year. Recommendation 2.1 – A majority of the Board should be independent Directors As required under the Board Charter and the Principles, the Board comprises a majority of independent Non-executive Directors. The Board regularly assesses the independence of all Non-executive Directors in accordance with the principles set out below. Independent advice Under the Board Charter, the Board collectively, an individual Director, or a Committee, has the right to seek independent professional advice at
Coffey’s expense to help them carry out their responsibilities. Before the external advice is sought, consent, which cannot be unreasonably withheld, needs to be obtained as follows:
the Board – from the Chair; individual Director – from the
Chair or the relevant Committee Chair;
Committee – from the Committee Chair; or
Chairman – from the Risk and Audit Committee Chair.
Directors have unfettered access to Coffey records and information reasonably necessary to fulfil their responsibilities. Directors also have access to the Company Secretary on any matter relevant to their role as a Director. In addition, the Board has access to other relevant employees or external parties, including external auditors and internal auditors, to seek additional information concerning Coffey’s business. Director independence
The Board Charter states that Coffey will regard a Non-executive Director as independent if the Director is not a member of management and is free of any business or other relationship that could materially interfere with, or could reasonably be perceived to materially interfere with, the exercise of their judgement as a Director of the Company. In assessing Non-executive Director independence, the Board reviews the relationship that the Director, and the Director’s associates, have with Coffey. In determining whether a Non-executive Director is independent, the Board considers whether the Director:
is a substantial shareholder of Coffey or an officer of, or otherwise associated directly with, a substantial shareholder of Coffey;
within the last three years, has been employed in an Executive capacity by Coffey;
within the last three years, has been:
o a principal of a material professional adviser to Coffey;
o a material consultant to Coffey; or
o an employee materially associated with the service provided by such an adviser or consultant to Coffey;
is a material supplier to, or customer of, Coffey, or an officer of or otherwise associated directly or indirectly with a material supplier or customer;
has a material contractual relationship with Coffey other than as a Director of Coffey;
has served on the Board for a period which could, or could reasonably be perceived to, materially interfere with the Director’s ability to act in Coffey’s best interests; or
has any interest, or any business or other relationship which could, or could reasonably be perceived to, materially interfere with the Director’s ability to act in Coffey’s best interests.
The Board has determined materiality thresholds for assessing the independence of Directors. Under those thresholds:
a person will be regarded as a substantial shareholder if they hold more than 5% of Coffey’s voting shares;
an adviser will be a material professional adviser or consultant where the annual billings to Coffey are more than 5% of the adviser’s or consultant’s total annual revenues or in aggregate, for each adviser or consultant, equal or exceed $100,000;
a supplier to Coffey will be a material supplier where Coffey accounts for more than 5% of the supplier’s annual revenues; and
a customer of the Company will be a material customer where the customer accounts for more than 5% of Coffey’s annual revenues, or Coffey accounts for more than 5% of the customer’s annual costs.
Coffey Annual Report 2014 | 55
Coffey International Limited Corporate governance statement
Coffey Annual Report 2014 | 55
Whether or not a material contractual relationship exists will be determined, on a case-by-case basis, consistent with these thresholds. Where a Director has dealings with, or is involved in, other companies or relationships to which this section applies, such dealings are disclosed publicly in the Director and Executive disclosures note to the Annual Financial Report in accordance with law. Applying these criteria the Board has determined that save for Mr Douglas and Mr Meyerhans (who are Executive Directors), all other Directors are independent. Current year - consideration of relationships and impact on independence Term of office – annual re-election
Mr Black joined the Board of Coffey in March 2002. The Board recognises that Mr Black’s tenure could be perceived to materially interfere with his ability to act independently. The Board has considered Mr Black’s length of service and formed the view that it has not interfered with his ability to execute his role as a Non-executive Director with an independent mind. However, to avoid any potential concerns in this regard, the Board requires any Director with 10 or more years of service as a Director to offer themselves for re-election every year. By doing so, the Board provides shareholders with the opportunity to consider the degree to which the Director is making a significant contribution to Coffey and make a balanced assessment of the Director’s actual and perceived independence. Recommendation 2.2 – The Chair should be an independent Director Under the Board Charter, the Board elects a Chairman from among the Non-executive Directors. It is a requirement of the Charter that the Chairman be independent.
Recommendation 2.3 – The roles of Chair and Chief Executive Officer should not be exercised by the same individual The requirement in the Board Charter that the Chairman be appointed from among the Non-executive Directors means that the roles of Chairman and MD are not exercised by the same individual. The Chairman presides over Board meetings and shareholder meetings. Under the Board Charter, the Chairman is also responsible for: leading the Board in reviewing
and discussing Board matters; managing the efficiency and
conduct of the Board’s function; briefing all Directors in relation
to key issues arising at Board meetings;
facilitating effective contribution by all Directors and monitoring Board performance;
guiding Board deliberations, free of undue bias;
promoting constructive relations between Directors and between the Board and Management;
overseeing that membership of the Board is skilled and appropriate for Coffey’s needs;
reviewing corporate governance matters with the Company Secretary and reporting on those matters to the Board; and
overseeing the implementation of policies and systems for Board performance review and renewal.
The Chairman must ensure that General Meetings are conducted efficiently, and that shareholders have adequate opportunity to air their views and obtain answers to their queries. Recommendation 2.4 – The Board should establish a nomination committee The Board has established a Nomination Committee comprising three independent Non-executive Directors: John Mulcahy (Chairman), Stuart Black and Susan Oliver.
The MD is invited to attend meetings as required. The Committee Charter states that the role of the Committee is to assist and advise the Board on matters relating to: composition of the Board
(including Board diversity); Board and Chair succession
planning; Director independence; and Board performance. The Committee collectively and its members individually have access to internal and external resources, including access to advice from external consultants or specialists. The Committee has a formal Charter that is required to be reviewed annually. The Charter was most recently reviewed in May 2014. The Company Secretary is the secretary to the Committee. The Committee meets as required, and at least annually, and met once during the financial year. Details of Directors’ attendances are set out in the Directors’ Report of this Annual Financial Report. Process of selection and appointment of new Directors When a vacancy arises, the Nomination Committee considers candidates with a broad range of skills, experience and expertise from a diverse range of backgrounds, including gender. Candidates are considered on merit and against objective criteria, and with due regard for the benefits of diversity on the Board, including gender. When the Board considers that a suitable candidate has been found, that person is appointed by the Board to fill a casual vacancy in accordance with Coffey’s Constitution, but must stand for election by Shareholders at the next Annual General Meeting (AGM). New Directors are given a thorough briefing by the Chair and/or Company Secretary on key Board issues and provided with appropriate induction documentation.
56 | Coffey Annual Report 2014
Coffey International Limited Corporate governance statement
56 | Coffey Annual Report 2014
These include:
Coffey’s financial, strategic, operational and risk management position;
their rights, duties and responsibilities; and
the role of the Board and the Board Committees.
Recommendation 2.5 – Companies should disclose the process for evaluating the performance of the Board, its committees and individual Directors
Under the Board Charter, the Board is required to conduct a formal review of its effectiveness and the effectiveness of its Committees and individual Directors annually. During the financial year, the Board completed a review of its own performance, the performance of its Committees and the performance of individual Directors. That review involved each Director completing a questionnaire covering:
the role of the Board; Board composition; Board Committee structure and
Committee effectiveness; Board operations and
dynamics; Board meetings; Board member performance;
and Board Chair performance. The aggregate results of the questionnaire were discussed at a subsequent Board meeting. The Board Charter requires that every three years, the Board considers engaging an external consultant to conduct a comprehensive review of the effectiveness of the Board, its Committees and individual Directors. After considering the financial performance of the Company, its limited resources and the potential distraction of a prolonged assessment process, the Board has deferred the engagement of an external consultant to be considered by the Board for the 2015 evaluation.
During the financial year, the Human Resources and Remuneration Committee and Risk and Audit Committee also completed a detailed review of their own performance. That review involved each Committee member, the Executive Directors and the relevant Management Team members completing a questionnaire. The review found that each Committee had been effective in performing its responsibilities under the Committee Charter. The Committees set aside time at one of the scheduled meetings to discuss its performance over the financial year in achieving the objectives set out in its Charter and to consider areas to continue improving its effectiveness. The evaluation of the MD, FD and Management Team performance is discussed in the Remuneration Report in this Annual Financial Report.
Principle 3: Promote ethical and responsible decision making
Coffey recognises that its reputation is one of its most valuable assets, and is founded largely on the ethical behaviour and integrity of the people who represent the organisation around the world. Every Coffey relationship is built on trust. Whether it’s in geoservices, project management or international development. Trust that’s hard-earned through our proven expertise, our depth of global experience and our commitment to stay one step ahead. Recommendation 3.1 –Companies should establish a code of conduct The Board has approved a Code of Conduct that sets out the principles for ethical behaviour by all Coffey employees. Coffey’s Code of Conduct commits its Directors, employees, contractors and consultants (all of which are referred to as ‘employees’ in the Code) to not only comply with the law, but to conduct business in accordance with the highest ethical
conduct and is structured to enhance Coffey’s core values and behaviours, which guide its policies, programs and training initiatives. Any breach of the Code of Conduct is a serious matter that may give rise to disciplinary action, including dismissal and legal action. Coffey is committed to the highest standards of integrity, fairness and ethical conduct, including full compliance with all relevant legal obligations in all jurisdictions in which we operate. There is no circumstance under which it is acceptable for Coffey or a person associated with Coffey to knowingly or deliberately not comply with the law or to act unethically in the course of performing or advancing Coffey’s business. Behaviour of this kind will lead to disciplinary measures that may include dismissal. All new Coffey employees are provided with Coffey’s Code of Conduct on induction. Recommendation 3.2 – Companies should establish a diversity policy. Coffey has considerable diversity in its workforce, including differences that relate to gender, age, ethnicity, disability, religious beliefs, sexual orientation and cultural background. Having a diverse workforce promotes ingenuity, strengthens problem solving, improves delivery to clients and enables better business results as well as reflecting the diversity in our clients. Building a business where people of different experiences and backgrounds can thrive encourages further diversity. That is why we ask our managers to focus on providing a work environment that is collaborative and where all employees are treated with dignity and respect. The Board has approved and published its policy on Board Diversity and Equal Opportunity. This provides the platform for an integrated diversity management policy across the Group. The Board has also established measurable objectives for improving gender diversity.
Coffey Annual Report 2014 | 57
Coffey International Limited Corporate governance statement
Coffey Annual Report 2014 | 57
The Management Team manages progress and reports at least annually to the Human Resources and Remuneration Committee on the effectiveness of diversity related initiatives. Responsibility for diversity has been included in the Board Charter, the Nomination Committee Charter (Board diversity) and the Human Resources and Remuneration Committee Charter (diversity at all levels of the organisation below Board level). Recommendation 3.3 – Companies should disclose the measurable objectives for achieving gender diversity and progress towards achieving them. The Coffey Board has established the following diversity related measurable objectives for the Group:
“to increase the percentage of women at all levels in the Company, including management and Executive levels; and
having already achieved a 29% proportion of women on the Board, to maintain a significant participation by women at Board level”.
The Board has monitored Remuneration and Performance Rating equity for three years. There is no evidence of gender bias in either of these areas. The Management Team, supported by the Board, is now focussed on improving talent mapping and succession processes over the coming year in support of its diversity program. Our efforts are having some impact, but are not yet at a satisfactory level: This year, we have maintained
representation of women in our Management Team, complementing improved representation at Board level in prior reporting periods;
Like other companies operating in our fields, we continue to have a lower level of female candidates applying for externally advertised vacancies
in the geoservices and project management disciplines. Our data from the prior calendar year shows that females are, on average, slightly more likely to be the successful, merit-based candidate.
Recommendation 3.4 – Companies should disclose the proportion of women employees in the organisation. The table below shows the proportion of women employees across the Coffey group as at 30 June 2014 (and prior year comparative):
Position
Percent
2014 2013 Board member 29% 29% Senior Manager 17% 13% Other 34% 35% Total 32% 33%
Principle 4: Safeguard integrity in financial reporting Recommendation 4.1 – The Board should establish an audit committee The Board established a combined Risk and Audit Committee at the close of the 2012 AGM comprising: Guy Cowan (Chairman), John Mulcahy, Stuart Black, Leeanne Bond and Susan Oliver. The Committee assists the Board in the discharge of its responsibilities with regard to independently verifying and safeguarding the integrity of Coffey’s financial reporting and risk oversight and management of opportunities and threats. Recommendation 4.2 – The audit committee should be appropriately structured Under its Charter, the Risk and Audit Committee must have at least three members, all of whom must be independent Non-executive Directors. The Chair of the Board is not permitted to chair this Committee.
The Charter also requires that all members have a working familiarity with basic accounting and finance practices and that at least one member has relevant financial qualifications and expertise (Mr Black and Mr Cowan). The Committee must also include members with an understanding of the industry in which Coffey operates. Any Non-executive Director of the Board may attend a meeting, by providing reasonable notice to the Committee Chair. Further details of the qualifications and experience of all Risk and Audit Committee members are disclosed in the Directors’ Report of this Annual Financial Report. The Committee meets as required, and at least four times per year. The Committee met four times during the financial year. Directors’ attendances are set out in the Directors’ Report of this Annual Financial Report. The MD, FD, Group Financial Controller and external auditors have a standing invitation to attend Risk and Audit Committee meetings. The internal auditors attend meetings at the discretion of the Committee. The Company Secretary is the secretary to the Risk and Audit Committee. The Risk and Audit Committee meets privately with the external auditor on general matters concerning the external audit and other related matters, including the half year and full year financial reports. The Risk and Audit Committee also meets privately with the internal auditor and in private session with management. The Risk and Audit Committee collectively, and its members individually, have access to internal and external resources, including access to advice from external consultants or specialists.
58 | Coffey Annual Report 2014
Coffey International Limited Corporate governance statement
58 | Coffey Annual Report 2014
Recommendation 4.3 – The audit committee should have a formal charter The Risk and Audit Committee has a formal Charter that is required to be reviewed annually. The Charter was most recently reviewed in February 2014. The Charter sets out the roles and responsibilities, composition, structure and membership requirements of the Risk and Audit Committee. The Risk and Audit Committee’s primary responsibilities include:
monitoring the integrity of financial reporting;
monitoring the effectiveness of financial risk management processes;
monitoring the effectiveness of the internal controls environment;
monitoring and reviewing the effectiveness and performance of internal audit;
monitoring and reviewing the external auditor’s qualifications, performance and independence;
reviewing the Group’s risk management policy application and effectiveness; and
monitoring legislative and regulatory compliance.
Discussion of the Risk and Audit Committee’s involvement in business risks is disclosed under Principle 7. Auditor independence
Coffey’s external auditor Independence Policy contains details of the procedures for the selection and appointment of the external auditor and for reviewing the independence of the external auditor. The external auditor is precluded from providing any services that might threaten their independence, or conflict with their assurance and compliance role. The Directors have concluded that non-audit services provided during the financial year did not compromise the external auditor’s
independence requirements under the Corporations Act 2001. The lead and signing external audit partners are required to rotate off the audit after a maximum of five years, unless exceptional circumstances arise. The internal audit function may not be performed by the external auditors.
Principle 5: Make timely and balanced disclosure Recommendation 5.1 –Companies should establish continuous disclosure policies and ensure compliance with those policies Coffey complies with its disclosure obligations under the ASX Listing Rules and the Corporations Act 2001, and has in place established procedures for dealing with compliance. Coffey has a Continuous Disclosure Policy that establishes a framework to enable Coffey to provide shareholders and the market generally with timely, direct and equal access to relevant information about the Company. The Policy sets out Coffey’s disclosure obligations, notification process and how Coffey communicates with financial markets. The Board is responsible for considering and approving ASX announcements containing Material Information, based on the recommendations of the Disclosure Committee. The Disclosure Committee – which comprises the Chairman (or another Non-executive Director), MD, FD and Company Secretary (the nominated Disclosure Officer) – is responsible for monitoring compliance with the Continuous Disclosure Policy. The Company Secretary, or in their absence the FD, is the convenor of meetings of the Disclosure Committee. The Committee is responsible for administering the Continuous Disclosure Policy including overseeing preparation of proposed external announcements ensuring
they contain material information that is both objective and factual, and are clearly written to allow investors to assess the impact of information on their investment decisions. The Committee is also responsible for recommending changes to the Continuous Disclosure Policy to the Board. The Company Secretary reports regularly to the Board on matters that were either notified or not notified to the ASX. Directors receive copies of all announcements immediately after notification to the ASX. All ASX announcements are available on the Coffey website. Communication with the financial market, investors and media is the responsibility of the Chairman, MD or FD. The Continuous Disclosure Policy covers briefings to investors and stock broking analysts, general briefings, one-on-one briefings, blackout periods, compliance and review, as well as media briefings. The Continuous Disclosure Policy was most recently reviewed and amended in April 2014. Principle 6: Respect the rights of Shareholders Recommendation 6.1 –Companies should design a Shareholder communications policy Coffey has established a Shareholder Communication Policy to promote effective engagement with its shareholders, both retail and institutional, and strives to keep shareholders informed about the Company’s activities. Coffey, on an ongoing basis, examines how best to take advantage of technology to enhance shareholder communications and how to use General Meetings to enhance two-way communication. The policy reflects the matters set out in the commentary and guidance for Recommendation 6.1. Coffey utilises the means of communication that is best suited to the information and audience at the time and most relevant and effective for our shareholders.
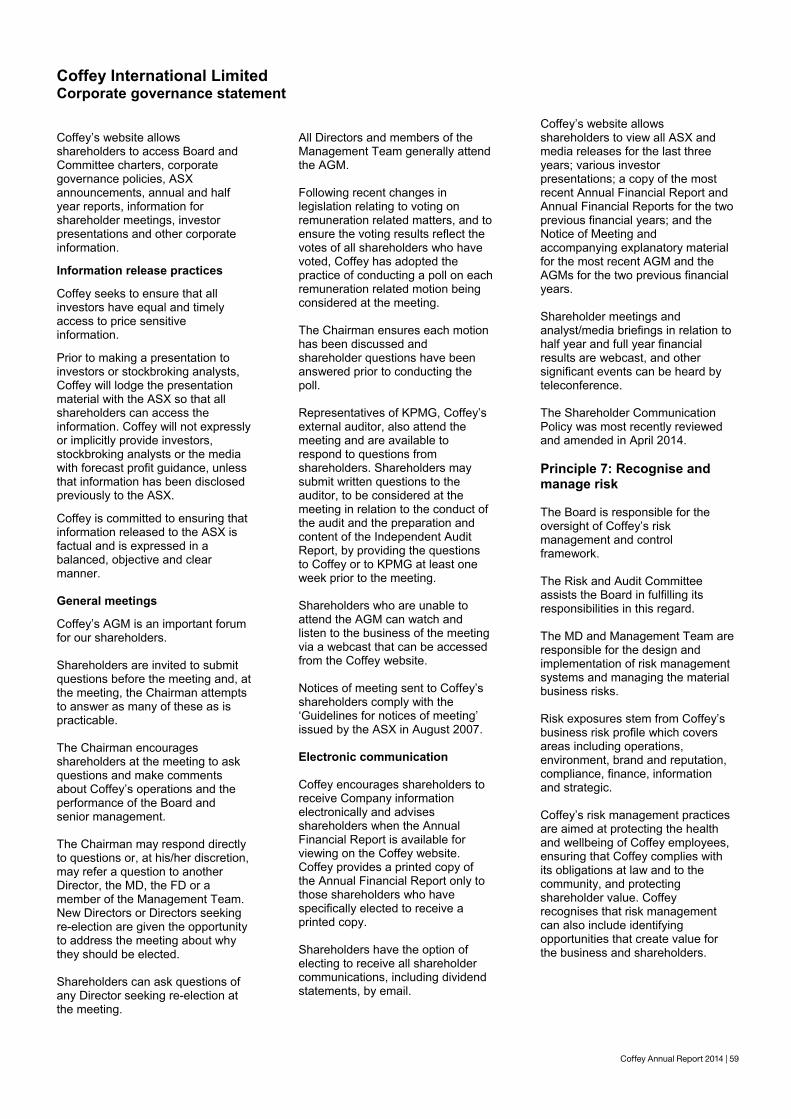
Coffey Annual Report 2014 | 59
Coffey International Limited Corporate governance statement
Coffey Annual Report 2014 | 59
Coffey’s website allows shareholders to access Board and Committee charters, corporate governance policies, ASX announcements, annual and half year reports, information for shareholder meetings, investor presentations and other corporate information. Information release practices Coffey seeks to ensure that all investors have equal and timely access to price sensitive information. Prior to making a presentation to investors or stockbroking analysts, Coffey will lodge the presentation material with the ASX so that all shareholders can access the information. Coffey will not expressly or implicitly provide investors, stockbroking analysts or the media with forecast profit guidance, unless that information has been disclosed previously to the ASX. Coffey is committed to ensuring that information released to the ASX is factual and is expressed in a balanced, objective and clear manner. General meetings Coffey’s AGM is an important forum for our shareholders. Shareholders are invited to submit questions before the meeting and, at the meeting, the Chairman attempts to answer as many of these as is practicable. The Chairman encourages shareholders at the meeting to ask questions and make comments about Coffey’s operations and the performance of the Board and senior management. The Chairman may respond directly to questions or, at his/her discretion, may refer a question to another Director, the MD, the FD or a member of the Management Team. New Directors or Directors seeking re-election are given the opportunity to address the meeting about why they should be elected. Shareholders can ask questions of any Director seeking re-election at the meeting.
All Directors and members of the Management Team generally attend the AGM. Following recent changes in legislation relating to voting on remuneration related matters, and to ensure the voting results reflect the votes of all shareholders who have voted, Coffey has adopted the practice of conducting a poll on each remuneration related motion being considered at the meeting. The Chairman ensures each motion has been discussed and shareholder questions have been answered prior to conducting the poll. Representatives of KPMG, Coffey’s external auditor, also attend the meeting and are available to respond to questions from shareholders. Shareholders may submit written questions to the auditor, to be considered at the meeting in relation to the conduct of the audit and the preparation and content of the Independent Audit Report, by providing the questions to Coffey or to KPMG at least one week prior to the meeting. Shareholders who are unable to attend the AGM can watch and listen to the business of the meeting via a webcast that can be accessed from the Coffey website. Notices of meeting sent to Coffey’s shareholders comply with the ‘Guidelines for notices of meeting’ issued by the ASX in August 2007. Electronic communication Coffey encourages shareholders to receive Company information electronically and advises shareholders when the Annual Financial Report is available for viewing on the Coffey website. Coffey provides a printed copy of the Annual Financial Report only to those shareholders who have specifically elected to receive a printed copy. Shareholders have the option of electing to receive all shareholder communications, including dividend statements, by email.
Coffey’s website allows shareholders to view all ASX and media releases for the last three years; various investor presentations; a copy of the most recent Annual Financial Report and Annual Financial Reports for the two previous financial years; and the Notice of Meeting and accompanying explanatory material for the most recent AGM and the AGMs for the two previous financial years. Shareholder meetings and analyst/media briefings in relation to half year and full year financial results are webcast, and other significant events can be heard by teleconference. The Shareholder Communication Policy was most recently reviewed and amended in April 2014. Principle 7: Recognise and manage risk The Board is responsible for the oversight of Coffey’s risk management and control framework. The Risk and Audit Committee assists the Board in fulfilling its responsibilities in this regard. The MD and Management Team are responsible for the design and implementation of risk management systems and managing the material business risks. Risk exposures stem from Coffey’s business risk profile which covers areas including operations, environment, brand and reputation, compliance, finance, information and strategic. Coffey’s risk management practices are aimed at protecting the health and wellbeing of Coffey employees, ensuring that Coffey complies with its obligations at law and to the community, and protecting shareholder value. Coffey recognises that risk management can also include identifying opportunities that create value for the business and shareholders.
60 | Coffey Annual Report 2014
Coffey International Limited Corporate governance statement
60 | Coffey Annual Report 2014
Recommendation 7.1 –Companies should establish policies for the oversight and management of material business risks The Board has approved a Risk Management Framework and supporting policies and processes to oversee and manage risk. Coffey is implementing a Risk Management Framework designed to ensure that the Company’s material business risks are identified and that adequate controls are in place and function effectively. This Framework incorporates the establishment of comprehensive policies, procedures and guidelines across the global business. This Framework acknowledges that all employees have a role in managing risk and in particular they are encouraged to report incidents, hazards and risks. The Board has approved a Risk Management Policy which is reviewed annually by the Board. Recommendation 7.2 – Establish risk management and internal control systems to manage material business risk and require management to report on the effectiveness of these systems and material business risk management Risk management processes The processes supporting risk management that operate throughout the global organisation include:
a clearly defined organisation structure with approved authority limits;
a culture that encourages managers at all levels in the organisation to consider the risk and rewards of each decision;
a comprehensive Health, Safety, Security and Environment (HSSE) management system that protects the safety and security of our staff and contractors, identifies and responds to incidents in a timely manner, and provides for appropriate protection of environments;
an enterprise risk management approach based on:
o a risk management framework derived from AS/NZ 4360;
o annual budgeting and monthly reporting systems for all business units, which enable risks to the achievement of financial results to be monitored, trends to be evaluated and variances to be addressed;
o active management of risk associated with contractual obligations including professional liability;
o policies to manage financial risks, including hedging foreign exchange exposures;
o a comprehensive group-wide insurance program;
specific compliance with ASX Principle 7 which requires Executives to sign off that all material non-compliance with regulatory obligations in their area of responsibility have been reported; and
appropriate due diligence procedures for corporate acquisitions and disposals.
Coffey has a number of other policies that directly or indirectly serve to reduce and/or manage risk. These include but are not limited to:
Health, Safety, Security and Environment Policy;
Delegation of Authority Policy; Code of Conduct; Continuous Disclosure Policy; Securities Dealing Policy; Treasury Policy; and Privacy Policy. Roles and responsibilities Board - the Board is responsible for reviewing and approving changes to risk management policies and for satisfying itself that Coffey has a sound system of risk management and internal control that is operating effectively. Risk and Audit Committee (Committee) - the Committee oversees the effectiveness of the system of risk management and internal control. The Committee receives an annual presentation of Coffey’s material business risks and
review the controls in place to mitigate the consequences of those risks. The Committee also receives regular presentations from management throughout the year on specific risk topics. Management Team - the MD has primary responsibility for designing, implementing and reporting on Coffey’s risk management framework. The Service Line Executives have primary responsibility for promoting a risk management culture within their service lines. The Management Team collectively has responsibility for promoting a risk management culture throughout Coffey, including consistent application of risk management policies across the Group. Business Units - are responsible for maintaining effective internal controls, consistently applying risk management on a risk reward basis, and reporting new or changed risk events. Internal audit -internal audit provides assurance to the Committee on the effectiveness of Coffey’s Risk Management Framework and the adequacy and effectiveness of the system of internal controls. Recommendation 7.3 – MD and CFO assurance on financial reporting risks In accordance with section 295A of the Corporations Act 2001, the MD and FD have provided a written Certificate to the Board. The Certificate states that, in their opinion, the Company’s financial reports present a true and fair view in all material respects, of the financial position and performance of the Company, and that management’s risk management and internal controls over financial reporting, which implement the policies and procedures adopted by the Board, are operating effectively in all material respects.
Coffey Annual Report 2014 | 61
Coffey International Limited Corporate governance statement
Coffey Annual Report 2014 | 61
Principle 8: Remunerate fairly and responsibly Recommendation 8.1 – The Board should establish a remuneration committee The Board has established a Human Resources and Remuneration Committee comprising at least three independent Non-executive Directors:
Susan Oliver (Chair), John Mulcahy, Leeanne Bond, Stuart Black and Guy Cowan. Any Non-executive Director of the Board may attend a meeting by providing reasonable notice to the Committee Chair. The MD and Group Executive Human Resources attend meetings of the Committee by invitation when required to report on and discuss senior management performance, and remuneration and related matters, but are not present at meetings when their own performance or remuneration is discussed. Recommendation 8.2 – The remuneration committee should be appropriately structured Under its Charter, the Human Resources and Remuneration Committee must have at least three members, the majority of whom must be independent Non-executive Directors. The Committee Chair must be an independent Director. Further details of the qualifications and experience of all Committee members are disclosed in the Directors’ Report of this Annual Financial Report. The role of the Committee is to assist the Board in fulfilling its corporate governance responsibilities in regard to remuneration and strategic human resources matters, including:
establishing and implementing a human resources strategy to ensure that appropriately talented and trained people are
available to achieve the business strategy;
undertaking the appropriate performance management, succession planning and talent development activities and programs; and
providing effective remuneration policies having regard to the creation of value for shareholders and the external remuneration market.
The Committee is responsible for ensuring Coffey has and observes coherent remuneration policies and practices which enable it to attract and retain high calibre Executives, Directors and employees who will create value for shareholders, generate sustained business performance and support Coffey’s objectives, goals and behaviours. The Committee has a formal Charter that is required to be reviewed annually. The Charter was most recently reviewed in May 2014. The Company Secretary is the secretary to the Committee. The Committee may engage and/or terminate, at the expense of the Company, any independent external adviser which it considers may assist it in the full performance of its functions. The Committee meets as required, and at least four times per year. The Committee met six times during the year. Directors’ attendances are set out in the Directors’ Report of this Annual Financial Report. Recommendation 8.3 –Companies should distinguish between Non-executive Directors’ remuneration and that of Executive Directors and senior management Coffey’s remuneration structure distinguishes between Non-executive Directors and that of the MD and Management Team. Remuneration for Non-executive Directors is fixed. Board and Committee fee rates are reviewed by the Human Resources and Remuneration Committee and approved by the Board (subject to
the shareholder approved fee pool) for each coming year. There has been no increase in Non-executive Director fees since October 2008 and the Board has resolved that there will be no increase in fees for the 2015 financial year. Remuneration does not include any performance-based components and Non-executive Directors do not participate in any reward plans or bonus schemes. The Non-executive Directors receive statutory superannuation (and may salary sacrifice fees to superannuation). Coffey does not have a retirement benefits scheme for Non-executive Directors. Fees paid to the Non-executive Directors reflect the responsibilities and demands made on the Directors. In the 2014 financial year, fees paid to Non-executive Directors totalled $675,000 well within the maximum Board remuneration pool of $700,000 per annum, inclusive of statutory entitlements. This pool was approved by Shareholders at the AGM held in November 2008. Hedging of securities under Coffey long-term reward plans by Designated Persons Coffey’s share trading policy prohibits Designated Persons from hedging an exposure to unvested or vested Coffey securities held through Coffey’s reward plans. A Remuneration Report, required under section 300A(1) of the Corporations Act 2001, is provided in the Directors’ Report of this Annual Financial Report.
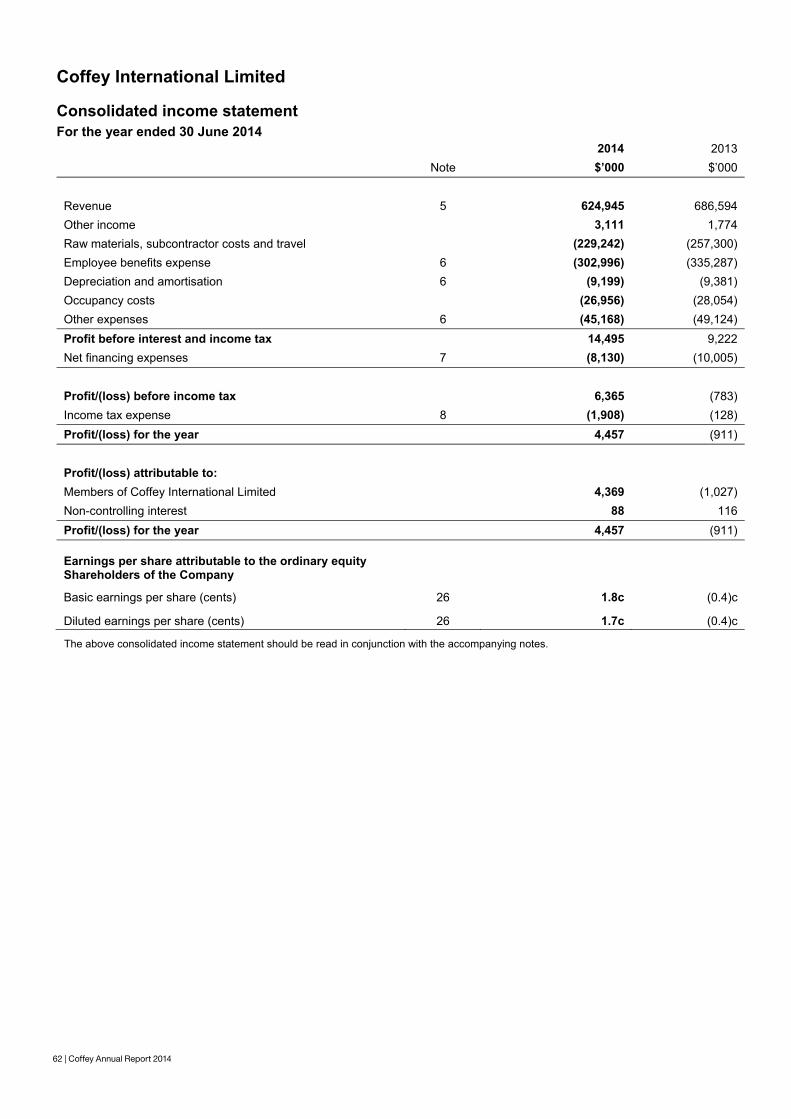
62 | Coffey Annual Report 2014
Coffey International Limited
62 | Coffey Annual Report 2014
Consolidated income statement For the year ended 30 June 2014
2014 2013 Note $’000 $’000 Revenue 5 624,945 686,594 Other income 3,111 1,774 Raw materials, subcontractor costs and travel (229,242) (257,300) Employee benefits expense 6 (302,996) (335,287) Depreciation and amortisation 6 (9,199) (9,381) Occupancy costs (26,956) (28,054) Other expenses 6 (45,168) (49,124) Profit before interest and income tax 14,495 9,222 Net financing expenses 7 (8,130) (10,005) Profit/(loss) before income tax 6,365 (783) Income tax expense 8 (1,908) (128) Profit/(loss) for the year 4,457 (911) Profit/(loss) attributable to: Members of Coffey International Limited 4,369 (1,027) Non-controlling interest 88 116 Profit/(loss) for the year 4,457 (911) Earnings per share attributable to the ordinary equity Shareholders of the Company
Basic earnings per share (cents) 26 1.8c (0.4)c
Diluted earnings per share (cents) 26 1.7c (0.4)c
The above consolidated income statement should be read in conjunction with the accompanying notes.
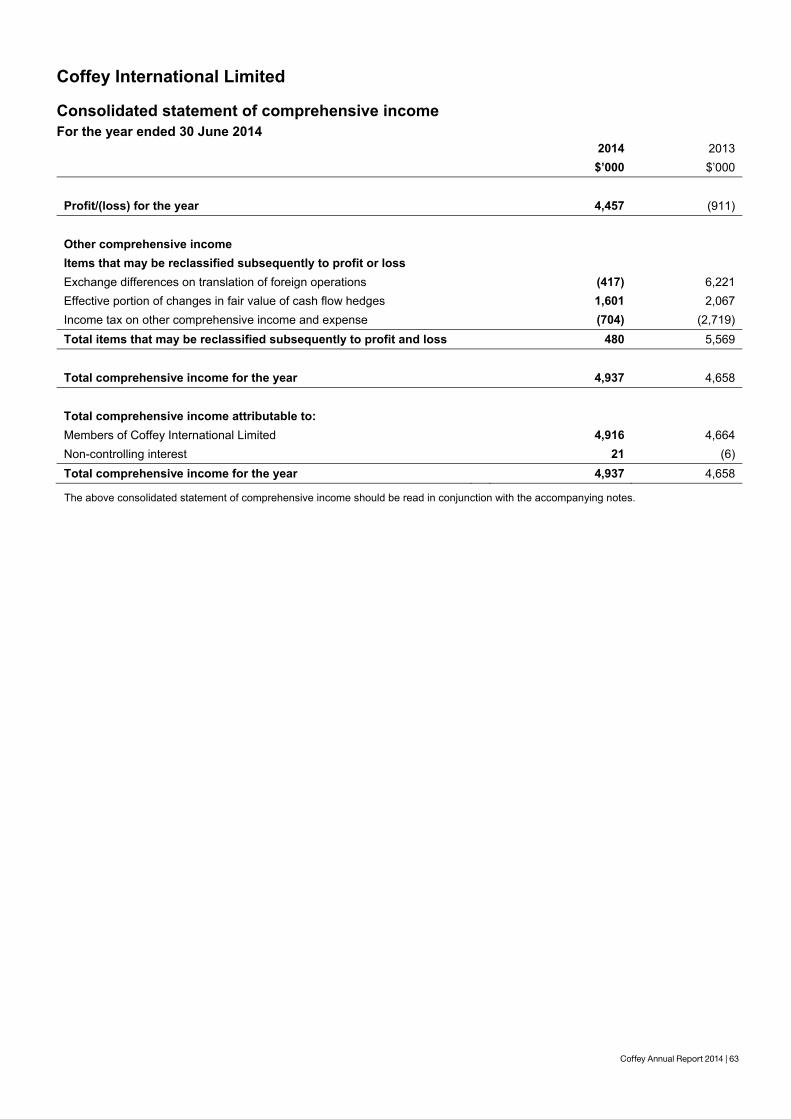
Coffey Annual Report 2014 | 63
Coffey International Limited
Coffey Annual Report 2014 | 63
Consolidated statement of comprehensive income For the year ended 30 June 2014
2014 2013 $’000 $’000 Profit/(loss) for the year 4,457 (911) Other comprehensive income Items that may be reclassified subsequently to profit or loss Exchange differences on translation of foreign operations (417) 6,221 Effective portion of changes in fair value of cash flow hedges 1,601 2,067 Income tax on other comprehensive income and expense (704) (2,719) Total items that may be reclassified subsequently to profit and loss 480 5,569 Total comprehensive income for the year 4,937 4,658 Total comprehensive income attributable to: Members of Coffey International Limited 4,916 4,664 Non-controlling interest 21 (6) Total comprehensive income for the year 4,937 4,658
The above consolidated statement of comprehensive income should be read in conjunction with the accompanying notes.
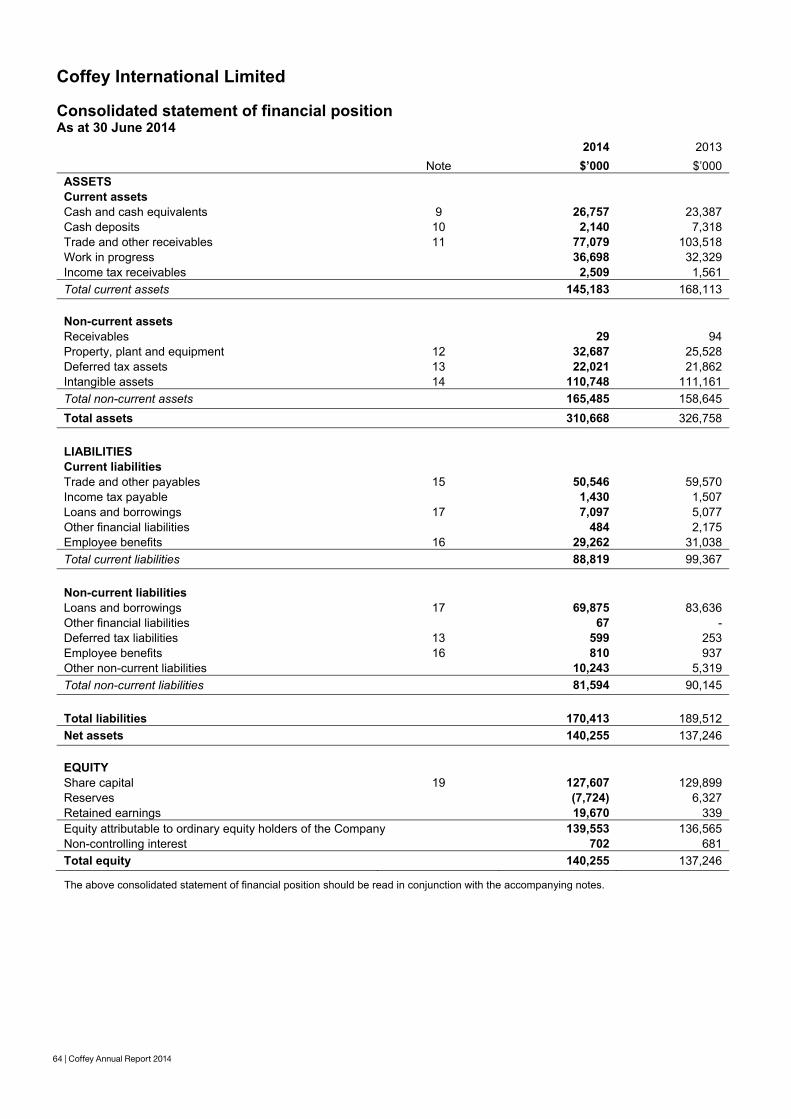
64 | Coffey Annual Report 2014
Coffey International Limited
64 | Coffey Annual Report 2014
Consolidated statement of financial position As at 30 June 2014
2014 2013 Note $’000 $’000 ASSETS Current assets Cash and cash equivalents 9 26,757 23,387 Cash deposits 10 2,140 7,318 Trade and other receivables 11 77,079 103,518 Work in progress 36,698 32,329 Income tax receivables 2,509 1,561 Total current assets 145,183 168,113 Non-current assets Receivables 29 94 Property, plant and equipment 12 32,687 25,528 Deferred tax assets 13 22,021 21,862 Intangible assets 14 110,748 111,161 Total non-current assets 165,485 158,645 Total assets 310,668 326,758 LIABILITIES Current liabilities Trade and other payables 15 50,546 59,570 Income tax payable 1,430 1,507 Loans and borrowings 17 7,097 5,077 Other financial liabilities 484 2,175 Employee benefits 16 29,262 31,038 Total current liabilities 88,819 99,367 Non-current liabilities Loans and borrowings 17 69,875 83,636 Other financial liabilities 67 - Deferred tax liabilities 13 599 253 Employee benefits 16 810 937 Other non-current liabilities 10,243 5,319 Total non-current liabilities 81,594 90,145 Total liabilities 170,413 189,512 Net assets 140,255 137,246 EQUITY Share capital 19 127,607 129,899 Reserves (7,724) 6,327 Retained earnings 19,670 339 Equity attributable to ordinary equity holders of the Company 139,553 136,565 Non-controlling interest 702 681 Total equity 140,255 137,246
The above consolidated statement of financial position should be read in conjunction with the accompanying notes.
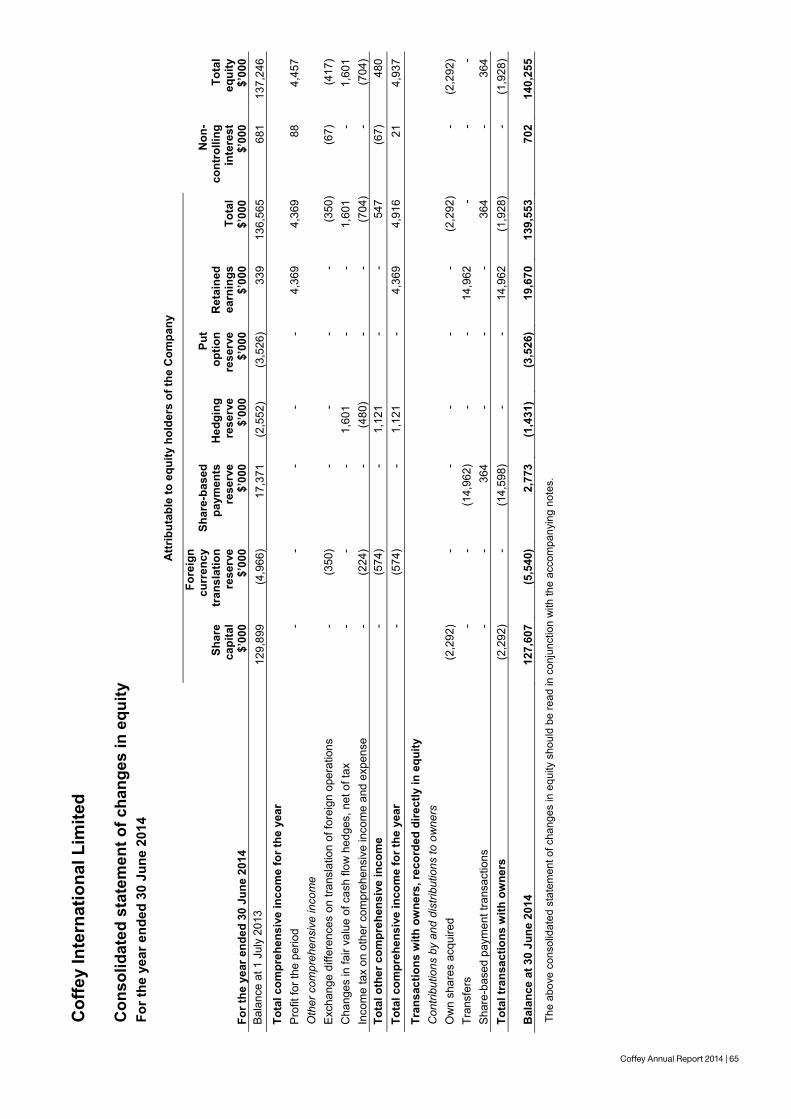
Coffey Annual Report 2014 | 65
Cof
fey
Inte
rnat
iona
l Lim
ited
Cof
fey
Ann
ual R
epor
t 201
4 | 6
5
Con
solid
ated
sta
tem
ent o
f cha
nges
in e
quity
Fo
r the
yea
r end
ed 3
0 Ju
ne 2
014
A
ttrib
utab
le to
equ
ity h
olde
rs o
f the
Com
pany
Sh
are
capi
tal
Fore
ign
curr
ency
tr
ansl
atio
n re
serv
e
Shar
e-ba
sed
paym
ents
re
serv
e H
edgi
ng
rese
rve
Put
optio
n re
serv
e R
etai
ned
earn
ings
To
tal
Non
- co
ntro
lling
in
tere
st
Tota
l eq
uity
Fo
r the
yea
r end
ed 3
0 Ju
ne 2
014
$’00
0$’
000
$’00
0$’
000
$’00
0$’
000
$’00
0$’
000
$’00
0 B
alan
ce a
t 1 J
uly
2013
12
9,89
9 (4
,966
) 17
,371
(2
,552
) (3
,526
) 33
9 13
6,56
5 68
1 13
7,24
6 To
tal c
ompr
ehen
sive
inco
me
for t
he y
ear
P
rofit
for t
he p
erio
d -
- -
- -
4,36
9 4,
369
88
4,45
7 O
ther
com
preh
ensi
ve in
com
e
Exc
hang
e di
ffere
nces
on
trans
latio
n of
fore
ign
oper
atio
ns
- (3
50)
- -
- -
(350
)(6
7)
(417
) C
hang
es in
fair
valu
e of
cas
h flo
w h
edge
s, n
et o
f tax
-
- -
1,60
1 -
- 1,
601
- 1,
601
Inco
me
tax
on o
ther
com
preh
ensi
ve in
com
e an
d ex
pens
e -
(224
) -
(480
) -
- (7
04)
- (7
04)
Tota
l oth
er c
ompr
ehen
sive
inco
me
- (5
74)
- 1,
121
- -
547
(67)
48
0 To
tal c
ompr
ehen
sive
inco
me
for t
he y
ear
- (5
74)
- 1,
121
- 4,
369
4,91
6 21
4,
937
Tran
sact
ions
with
ow
ners
, rec
orde
d di
rect
ly in
equ
ity
C
ontri
butio
ns b
y an
d di
strib
utio
ns to
ow
ners
Ow
n sh
ares
acq
uire
d (2
,292
) -
- -
- -
(2,2
92)
- (2
,292
) Tr
ansf
ers
- -
(14,
962)
-
- 14
,962
-
- -
Sha
re-b
ased
pay
men
t tra
nsac
tions
-
- 36
4 -
- -
364
- 36
4 To
tal t
rans
actio
ns w
ith o
wne
rs
(2,2
92)
- (1
4,59
8)
- -
14,9
62
(1,9
28)
- (1
,928
) B
alan
ce a
t 30
June
201
4 12
7,60
7 (5
,540
) 2,
773
(1,4
31)
(3,5
26)
19,6
70
139,
553
702
140,
255
The
abov
e co
nsol
idat
ed s
tate
men
t of c
hang
es in
equ
ity s
houl
d be
read
in c
onju
nctio
n w
ith th
e ac
com
pany
ing
note
s.
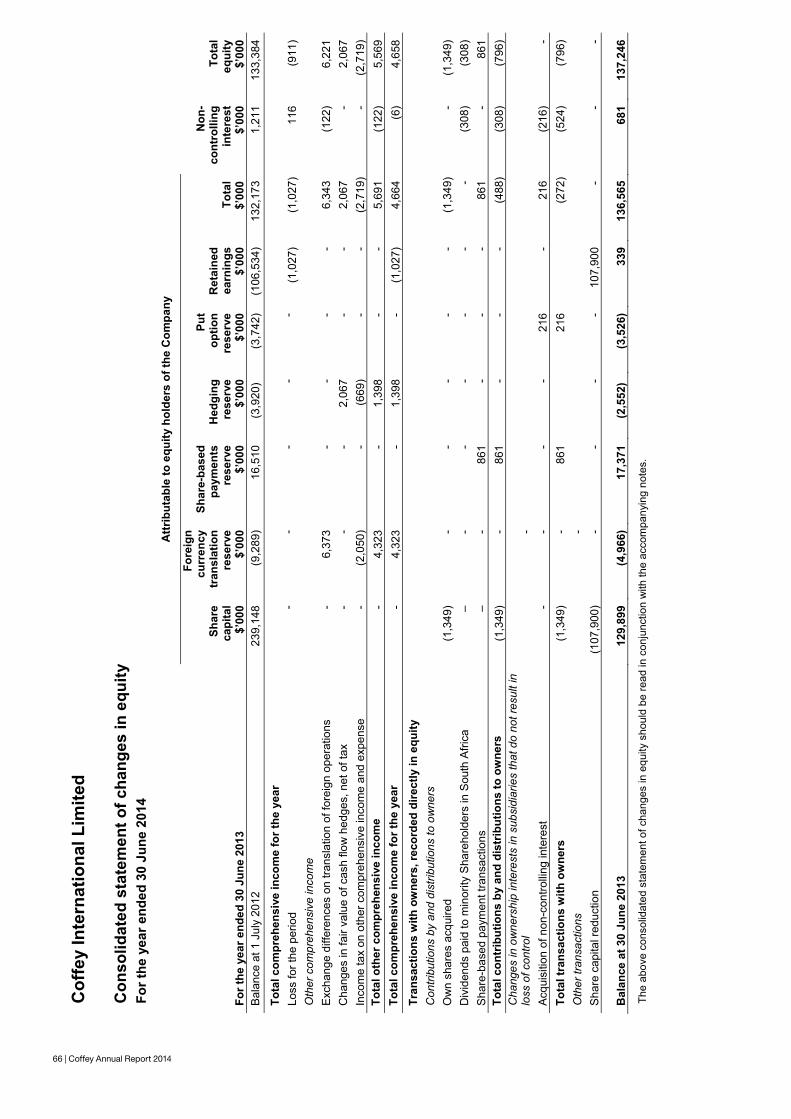
66 | Coffey Annual Report 2014
Cof
fey
Inte
rnat
iona
l Lim
ited
66 |
Cof
fey
Ann
ual R
epor
t 201
4 C
onso
lidat
ed s
tate
men
t of c
hang
es in
equ
ity
For t
he y
ear e
nded
30
June
201
4
Attr
ibut
able
to e
quity
hol
ders
of t
he C
ompa
ny
Sh
are
capi
tal
Fore
ign
curr
ency
tr
ansl
atio
n re
serv
e
Shar
e-ba
sed
paym
ents
re
serv
e H
edgi
ng
rese
rve
Put
optio
n re
serv
e R
etai
ned
earn
ings
To
tal
Non
- co
ntro
lling
in
tere
st
Tota
l eq
uity
Fo
r the
yea
r end
ed 3
0 Ju
ne 2
013
$’00
0$’
000
$’00
0$’
000
$’00
0$’
000
$’00
0$’
000
$’00
0 B
alan
ce a
t 1 J
uly
2012
23
9,14
8 (9
,289
) 16
,510
(3
,920
) (3
,742
) (1
06,5
34)
132,
173
1,21
1 13
3,38
4
Tota
l com
preh
ensi
ve in
com
e fo
r the
yea
r
Loss
for t
he p
erio
d -
--
--
(1,0
27)
(1,0
27)
116
(911
) O
ther
com
preh
ensi
ve in
com
e
Exc
hang
e di
ffere
nces
on
trans
latio
n of
fore
ign
oper
atio
ns
-6,
373
--
--
6,34
3 (1
22)
6,22
1 C
hang
es in
fair
valu
e of
cas
h flo
w h
edge
s, n
et o
f tax
-
- -
2,06
7 -
-2,
067
- 2,
067
Inco
me
tax
on o
ther
com
preh
ensi
ve in
com
e an
d ex
pens
e -
(2,0
50)
-(6
69)
--
(2,7
19)
- (2
,719
) To
tal o
ther
com
preh
ensi
ve in
com
e -
4,32
3 -
1,39
8 -
-5,
691
(122
) 5,
569
Tota
l com
preh
ensi
ve in
com
e fo
r the
yea
r -
4,32
3 -
1,39
8 -
(1,0
27)
4,66
4 (6
) 4,
658
Tran
sact
ions
with
ow
ners
, rec
orde
d di
rect
ly in
equ
ity
C
ontri
butio
ns b
y an
d di
strib
utio
ns to
ow
ners
Ow
n sh
ares
acq
uire
d (1
,349
) -
--
--
(1,3
49)
- (1
,349
) D
ivid
ends
pai
d to
min
ority
Sha
reho
lder
s in
Sou
th A
frica
–
--
--
--
(308
) (3
08)
Sha
re-b
ased
pay
men
t tra
nsac
tions
–
-86
1 -
--
861
- 86
1 To
tal c
ontr
ibut
ions
by
and
dist
ribut
ions
to o
wne
rs
(1,3
49)
-86
1 -
--
(488
)(3
08)
(796
) C
hang
es in
ow
ners
hip
inte
rest
s in
sub
sidi
arie
s th
at d
o no
t res
ult i
n lo
ss o
f con
trol
-
A
cqui
sitio
n of
non
-con
trolli
ng in
tere
st
--
--
216
- 21
6 (2
16)
- To
tal t
rans
actio
ns w
ith o
wne
rs
(1,3
49)
-86
1
216
(2
72)
(524
) (7
96)
Oth
er tr
ansa
ctio
ns
-
S
hare
cap
ital r
educ
tion
(107
,900
) -
--
-10
7,90
0 -
- -
Bal
ance
at 3
0 Ju
ne 2
013
129,
899
(4,9
66)
17,3
71
(2,5
52)
(3,5
26)
339
136,
565
681
137,
246
The
abov
e co
nsol
idat
ed s
tate
men
t of c
hang
es in
equ
ity s
houl
d be
read
in c
onju
nctio
n w
ith th
e ac
com
pany
ing
note
s.
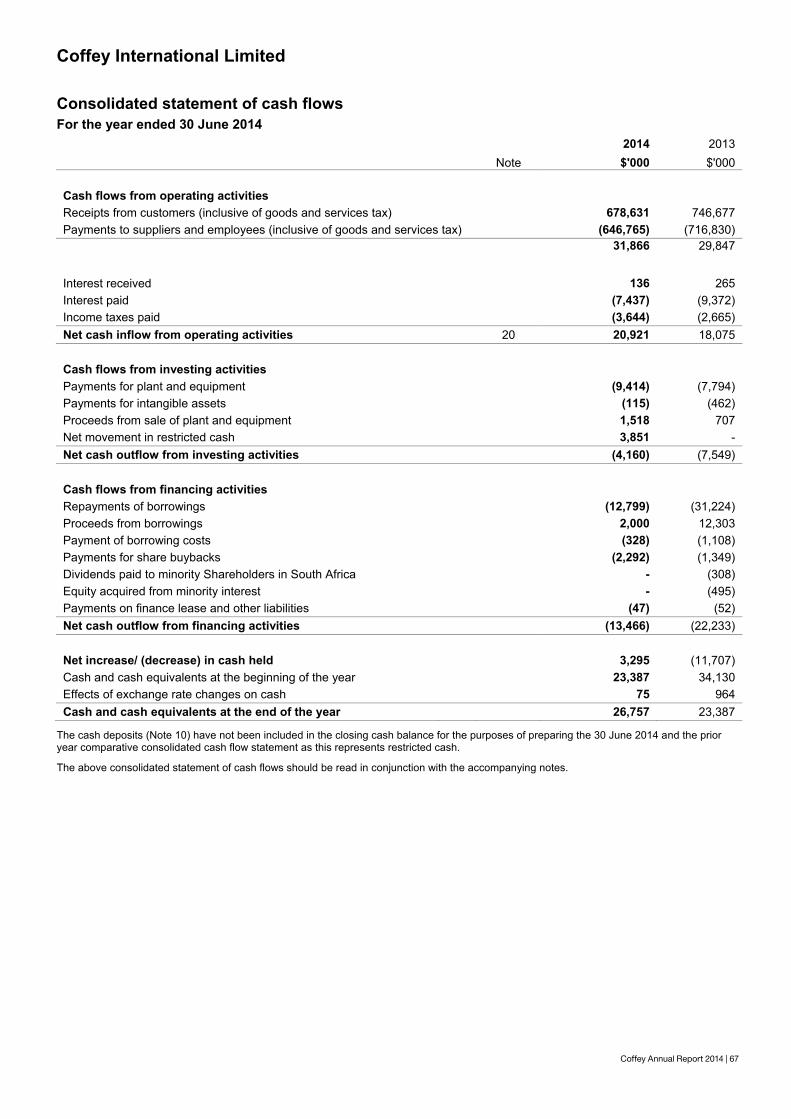
Coffey Annual Report 2014 | 67
Coffey International Limited
Coffey Annual Report 2014 | 67
Consolidated statement of cash flows For the year ended 30 June 2014
2014 2013 Note $'000 $'000 Cash flows from operating activities Receipts from customers (inclusive of goods and services tax) 678,631 746,677 Payments to suppliers and employees (inclusive of goods and services tax) (646,765) (716,830) 31,866 29,847
Interest received 136 265 Interest paid (7,437) (9,372) Income taxes paid (3,644) (2,665) Net cash inflow from operating activities 20 20,921 18,075 Cash flows from investing activities Payments for plant and equipment (9,414) (7,794) Payments for intangible assets (115) (462) Proceeds from sale of plant and equipment 1,518 707 Net movement in restricted cash 3,851 - Net cash outflow from investing activities (4,160) (7,549) Cash flows from financing activities Repayments of borrowings (12,799) (31,224) Proceeds from borrowings 2,000 12,303 Payment of borrowing costs (328) (1,108) Payments for share buybacks (2,292) (1,349) Dividends paid to minority Shareholders in South Africa - (308) Equity acquired from minority interest - (495) Payments on finance lease and other liabilities (47) (52) Net cash outflow from financing activities (13,466) (22,233) Net increase/ (decrease) in cash held 3,295 (11,707) Cash and cash equivalents at the beginning of the year 23,387 34,130 Effects of exchange rate changes on cash 75 964 Cash and cash equivalents at the end of the year 26,757 23,387
The cash deposits (Note 10) have not been included in the closing cash balance for the purposes of preparing the 30 June 2014 and the prior year comparative consolidated cash flow statement as this represents restricted cash.
The above consolidated statement of cash flows should be read in conjunction with the accompanying notes.
68 | Coffey Annual Report 2014
Coffey International Limited Notes to the financial statements For the year ended 30 June 2014
68 | Coffey Annual Report 2014
1 Summary of significant accounting policies
The consolidated financial statements as at and for the year ended 30 June 2014 comprise Coffey International Limited and its subsidiaries (together referred to as the Group). Coffey International Limited (“the Company” or “the parent entity”) is a company domiciled in Australia. The address of the Company’s registered office is Level 19 Tower B, 799 Pacific Highway, Chatswood NSW 2067. The Group is a for-profit entity and is primarily involved in the provision of specialist consulting services. The principal accounting policies adopted in the preparation of the consolidated financial statements are set out below. These policies have been consistently applied to all years presented and have been applied consistently by the Group entities, unless otherwise stated. a) Basis of preparation (i) Statement of compliance The consolidated financial statements are a general purpose financial report that has been prepared in accordance with Australian Accounting Standards (AAS) including Australian interpretations, adopted by the Australian Accounting Standards Board (AASB) and the Corporations Act 2001. The consolidated financial statements comply with International Financial Reporting Standards (IFRS) and interpretations adopted by the International Accounting Standards Board (IASB). (ii) Changes in accounting policy Except as described below, the accounting policies applied by the Group in its consolidated financial statements are the same as those applied by the Group in its consolidated financial statements as at and for the year ended 30 June 2013. The Group has adopted the following new standards and amendments to standards during the year:
AASB 13 Fair Value Measurement establishes a single framework for measuring fair value and replaces and expands the disclosure requirements about fair value measurements in other AASB’s including AASB 7 Financial Instruments: Disclosures. Accordingly, the Group has included additional disclosures in this regard (refer Note 21). This standard has not affected the Group’s accounting policies and there has been no significant impact on the measurement of the Group’s assets and liabilities.
AASB 119 Employee Benefits (2011) revised the definition of short-term employee benefits to benefits that are expected to be settled wholly within 12 months after the annual reporting period in which the employees render the related service. There were no material changes from this revision.
(iii) New standards and interpretations not yet adopted A number of new standards, amendments to standards and interpretations are effective for annual periods beginning after 1 January 2014 or are available for early adoption and have not been applied in preparing these consolidated financial statements. The Group does not plan to adopt these standards early. The application of AASB 9 Financial Instruments will become mandatory for the Group’s consolidated financial statements in 2017 and could potentially have an impact on the financial statements; however the extent of any impact has not yet been determined. (iv) Historical cost basis These consolidated financial statements have been prepared under the historical cost basis except for derivative financial instruments (Note 1(s)) in the statement of financial position which is measured at fair value. The methods used to measure fair values are discussed in Note 3.
(v) Going concern basis The accounts have been prepared on a going concern basis for the year ended 30 June 2014. b) Principles of consolidation The consolidated financial statements incorporate the assets and liabilities and the results and cash flows of the Company and its controlled entities as at and for the year ended 30 June 2014. This includes employee share trusts established for certain share-based awards. Inter-company transactions, balances and unrealised gains on transactions between Group entities are eliminated on consolidation. Unrealised losses are also eliminated unless the transaction provides evidence of the impairment of the asset transferred. Consistent accounting policies have been applied across the Group in the preparation of these consolidated financial statements. The various types of entities that are consolidated and the Group’s accounting policy for acquisition of such entities are set out below. i) Business combinations Business combinations are accounted for by applying the acquisition method as at the acquisition date. The Group measures goodwill at the acquisition date as:
the fair value of the consideration transferred; plus
the recognised amount of any non-controlling interests in the acquiree; less
the net recognised amount (generally fair value) of the identifiable assets acquired and liabilities assumed.
Coffey Annual Report 2014 | 69
Coffey International Limited Notes to the financial statements For the year ended 30 June 2014
68 | Coffey Annual Report 2014
1 Summary of significant accounting policies
The consolidated financial statements as at and for the year ended 30 June 2014 comprise Coffey International Limited and its subsidiaries (together referred to as the Group). Coffey International Limited (“the Company” or “the parent entity”) is a company domiciled in Australia. The address of the Company’s registered office is Level 19 Tower B, 799 Pacific Highway, Chatswood NSW 2067. The Group is a for-profit entity and is primarily involved in the provision of specialist consulting services. The principal accounting policies adopted in the preparation of the consolidated financial statements are set out below. These policies have been consistently applied to all years presented and have been applied consistently by the Group entities, unless otherwise stated. a) Basis of preparation (i) Statement of compliance The consolidated financial statements are a general purpose financial report that has been prepared in accordance with Australian Accounting Standards (AAS) including Australian interpretations, adopted by the Australian Accounting Standards Board (AASB) and the Corporations Act 2001. The consolidated financial statements comply with International Financial Reporting Standards (IFRS) and interpretations adopted by the International Accounting Standards Board (IASB). (ii) Changes in accounting policy Except as described below, the accounting policies applied by the Group in its consolidated financial statements are the same as those applied by the Group in its consolidated financial statements as at and for the year ended 30 June 2013. The Group has adopted the following new standards and amendments to standards during the year:
AASB 13 Fair Value Measurement establishes a single framework for measuring fair value and replaces and expands the disclosure requirements about fair value measurements in other AASB’s including AASB 7 Financial Instruments: Disclosures. Accordingly, the Group has included additional disclosures in this regard (refer Note 21). This standard has not affected the Group’s accounting policies and there has been no significant impact on the measurement of the Group’s assets and liabilities.
AASB 119 Employee Benefits (2011) revised the definition of short-term employee benefits to benefits that are expected to be settled wholly within 12 months after the annual reporting period in which the employees render the related service. There were no material changes from this revision.
(iii) New standards and interpretations not yet adopted A number of new standards, amendments to standards and interpretations are effective for annual periods beginning after 1 January 2014 or are available for early adoption and have not been applied in preparing these consolidated financial statements. The Group does not plan to adopt these standards early. The application of AASB 9 Financial Instruments will become mandatory for the Group’s consolidated financial statements in 2017 and could potentially have an impact on the financial statements; however the extent of any impact has not yet been determined. (iv) Historical cost basis These consolidated financial statements have been prepared under the historical cost basis except for derivative financial instruments (Note 1(s)) in the statement of financial position which is measured at fair value. The methods used to measure fair values are discussed in Note 3.
(v) Going concern basis The accounts have been prepared on a going concern basis for the year ended 30 June 2014. b) Principles of consolidation The consolidated financial statements incorporate the assets and liabilities and the results and cash flows of the Company and its controlled entities as at and for the year ended 30 June 2014. This includes employee share trusts established for certain share-based awards. Inter-company transactions, balances and unrealised gains on transactions between Group entities are eliminated on consolidation. Unrealised losses are also eliminated unless the transaction provides evidence of the impairment of the asset transferred. Consistent accounting policies have been applied across the Group in the preparation of these consolidated financial statements. The various types of entities that are consolidated and the Group’s accounting policy for acquisition of such entities are set out below. i) Business combinations Business combinations are accounted for by applying the acquisition method as at the acquisition date. The Group measures goodwill at the acquisition date as:
the fair value of the consideration transferred; plus
the recognised amount of any non-controlling interests in the acquiree; less
the net recognised amount (generally fair value) of the identifiable assets acquired and liabilities assumed.
Coffey International Limited Notes to the financial statements For the year ended 30 June 2014
Coffey Annual Report 2014 | 69
1 Summary of significant accounting policies (continued) If the excess of the above calculation is positive, this amount is recognised within Intangible Assets in the statement of financial position as goodwill. If negative, the difference is recognised directly in profit or loss, but only after a reassessment of the identification and measurement of the net assets acquired. Consideration transferred is measured at the fair value of the assets given (usually cash), shares issued or liabilities incurred or assumed at the date of exchange. Transaction costs incurred in connection with a business combination, such as finder’s fees, legal fees, due diligence fees, and other professional and consulting fees, are expensed as incurred. Identifiable assets acquired and liabilities and contingent liabilities assumed in a business combination are measured initially at their fair values at the acquisition date, irrespective of the extent of any non-controlling interest. For further information on the methods of measuring fair values of such balances see Note 3. Where settlement of any part of cash consideration is deferred, the amounts payable in the future are discounted to their present value as at the date of exchange. The discount rate used is the entity’s incremental borrowing rate, being the rate at which a similar borrowing could be obtained from an independent financier under comparable terms and conditions. Contingent consideration arises where the Group agrees to transfer additional consideration to former owners of an acquired business after acquisition date if certain specific events occur or conditions are met in the future. Contingent consideration is recognised either as a liability or equity at fair value based on the facts and circumstances that exist at acquisition date. Where a contingent consideration is classified as equity, it is not subject to re-measurement
after initial recognition and differences arising on settlement are adjusted to equity. Amounts classified as liability are re-measured to fair value at each reporting date, with adjustments being recorded in the income statement. ii) Subsidiaries Subsidiaries are all those entities over which the Group has direct or indirect control. Subsidiaries are fully consolidated into the financial statements from the date at which control commences until the date at which control ceases. On the loss of control, the Group derecognises the assets and liabilities of the subsidiary, any non-controlling interests and other components of equity related to the subsidiary. Any surplus or deficit arising on the loss of control is recognised in profit or loss. If the Group retains an interest in the previous subsidiary, then such interest is measured at fair value at the date that control is lost. Subsequently it is accounted for as an equity-accounted investee or as an available-for-sale financial asset depending on the level of influence retained. In the Company’s separate financial statements, investments in subsidiaries are carried at cost less provisions for impairment. Non-controlling interests in the results and equity of subsidiaries are shown separately in the consolidated statement of profit or loss, statement of comprehensive income and statement of financial position respectively. (iii) Employee share trusts The Group has formed trusts to administer the Group’s employee share schemes. These trusts are consolidated, as the substance of the relationship is that the trusts are controlled by the Group. c) Income tax The income tax expense/benefit for the year is the tax payable/receivable on the current year’s taxable income based on the national income tax rate for each jurisdiction, adjusted by changes in deferred tax assets and liabilities
attributable to temporary differences between the tax bases of assets and liabilities and their carrying amounts in the financial statements, and to unused tax losses and tax credits. The income tax expense excludes items which are recognised directly in equity. Deferred tax assets and liabilities are recognised for temporary differences at the tax rates expected to apply when the assets are recovered or liabilities are settled, based on those tax rates which are enacted or substantively enacted for each jurisdiction. The relevant tax rates are applied to the cumulative amounts of deductible and taxable temporary differences to measure the deferred tax asset or liability. An exception is made for certain temporary differences arising from the initial recognition of an asset or a liability. No deferred tax asset or liability is recognised in relation to these temporary differences if they arose in a transaction, other than a business combination, that at the time of the transaction did not affect either accounting profit or taxable profit or loss. Deferred tax assets are reviewed at each reporting date and are recognised for deductible temporary differences, unused tax losses and tax credits only if it is probable that future taxable amounts will be available to use those temporary differences and losses. Deferred tax assets and liabilities are offset when there is a legally enforceable right to offset current tax assets and liabilities and when the deferred tax balances relate to the same taxation authority. Current tax assets and tax liabilities are offset where the entity has a legally enforceable right to offset and intends either to settle on a net basis, or to realise the asset and settle the liability simultaneously. Current and deferred tax balances attributable to amounts recognised directly in equity are also recognised directly in equity.
70 | Coffey Annual Report 2014
Coffey International Limited Notes to the financial statements For the year ended 30 June 2014
70 | Coffey Annual Report 2014
1 Summary of significant accounting policies (continued) Additional income taxes that arise from the distribution of dividends are recognised at the same time as the liability to pay the related dividend is recognised. (i)Tax consolidation Coffey International Limited and its wholly owned Australian entities have implemented the tax consolidation legislation as of 1 July 2003. The entities have entered into a tax funding arrangement under which the wholly owned entities fully compensate Coffey International Limited for any current tax payable assumed, and are compensated by Coffey International Limited for any current tax receivable and deferred tax assets relating to unused tax losses or unused tax credits that are transferred to Coffey International Limited under the tax consolidation legislation. The funding amounts are determined by reference to the amounts recognised in the wholly owned entities’ financial statements. The head entity may also require payment of interim funding amounts to assist with its obligations to pay tax instalments. The funding amounts are recognised as inter-company receivables or payables. d) Foreign currency (i) Functional and presentation currency Items included in the financial statements of each of the Group’s entities are measured using the currency of the primary economic environment in which the entity operates (the functional currency). The consolidated financial statements are presented in Australian dollars (AUD), which is the Company’s functional and presentation currency as Australia is the primary economic environment in which the Group operates. The Company is of a kind referred to in ASIC Class Order 98/100 dated 10 July 1998 and in accordance with that Class Order, all financial
information presented in Australian dollars has been rounded to the nearest thousand unless otherwise stated. (ii) Foreign currency transactions and balances Foreign currency transactions are translated into the respective functional currencies of Group entities using the exchange rates prevailing at the dates of the transactions. Foreign exchange gains and losses resulting from the settlement of such transactions and from the translation at year-end exchange rates of monetary assets and liabilities denominated in foreign currencies are recognised in the income statement. Non-monetary assets and liabilities denominated in foreign currencies that are measured at fair value are translated to the functional currency at the exchange rate at the date that the fair value was determined. Foreign currency differences arising on translation of such assets and liabilities are recognised in profit or loss, except for differences arising from equity instruments or a financial liability designated as a hedge of the net investment in a foreign operation or qualifying cash flow hedges (to the extent that the hedges are effective), which are recognised directly in other comprehensive income. Non-monetary items that are measured at historical cost in a foreign currency are translated using the exchange rate at the date of the transaction. (iii) Foreign operations The results and financial position of all foreign operations (none of which has the currency of a hyperinflationary economy), are translated into Australian dollars as follows: assets and liabilities, including
goodwill and fair value adjustments arising on acquisition, are translated at the closing rate at the reporting date; and
income and expenses are translated at average monthly exchange rates for the year (unless this is not a reasonable
approximation of the cumulative effect of the rates prevailing on the transaction dates, in which case income and expenses are translated at the dates of the transactions).
All resulting exchange differences are recognised as a separate component of equity, the foreign currency translation reserve (FCTR). (iv) Hedge of net investment in foreign operation The Group applies hedge accounting to foreign currency differences arising between the functional currency of the foreign operation and AUD, regardless of whether the net investment is held directly by the Company or through an intermediate parent. Foreign currency differences arising on the retranslation of a financial liability designated as a hedge of a net investment in a foreign operation are recognised in other comprehensive income to the extent that the hedge is effective, and are presented within equity in the FCTR. To the extent that the hedge is ineffective, such differences are recognised in profit or loss. When the hedged part of a net investment is disposed of, the relevant amount in the FCTR is reclassified to profit or loss as part of the gain or loss on disposal. e) Segment reporting The Group determines and presents operating segments based on the information that internally is provided to the Managing Director (MD), who is the chief operating decision maker. An operating segment is a component of the Group that engages in business activities from which it may earn revenues and incur expenses, including those that relate to transactions with any of the Group’s other components. Segment results are regularly reviewed by the MD to assess their performance and to make decisions about resource allocation. Pricing on inter-segment transactions is determined on an arm’s length basis.
Coffey Annual Report 2014 | 71
Coffey International Limited Notes to the financial statements For the year ended 30 June 2014
Coffey Annual Report 2014 | 71
1 Summary of significant accounting policies (continued) Segment results that are reported to the MD include items directly attributable to a segment as well as those that can be allocated on a reasonable basis. The allocation of costs is undertaken to provide information on the business performance of the segment and costs are allocated on a basis that aligns the charge with the resources employed and revenue performance of the segment. Unallocated items mainly comprise central business support and corporate assets, corporate expenses, and income tax assets and liabilities. f) Revenue recognition Revenue is primarily derived from the rendering of services and is measured at the fair value of the consideration received and receivable. Amounts disclosed as revenue are net of returns, trade allowances and amounts collected on behalf of third parties. Revenue is recognised for the major business activities as follows:
(i) Geoservices business Revenue from time and materials contracts is recognised at the contractual hourly rates as labour hours are delivered and the direct expenses are incurred. Where contracts stipulate a contract price ceiling, the rates used reflect the amounts that are expected to be recoverable. Costs for such contracts are generally incurred in proportion to contracted billing schedules. This method is expected to result in reasonably consistent profit margins over the contract term. Key performance indicator (KPI) revenue is derived from contracts that have certain performance hurdles, as set out in the contract. KPI revenue is only recognised when it is probable that the economic benefits associated with the transaction will flow to the Group. The Group’s policy is to recognise KPI income on a pro-rata basis to the extent that the Group and its contractual partners are
capable of achieving the desired outcomes under the terms of the contract and the value of the KPI revenue can be reliably estimated. The recognition of such revenue therefore is subject to management judgement. Where it is no longer probable that a contract will meet the agreed upon performance criteria, amounts previously recognised as revenue for that contract are reversed with the corresponding debit against revenue.
(ii) International Development business Contract revenue and expenses are recognised in accordance with the percentage of completion method unless the outcome of the contract cannot be reliably estimated. Where the outcome of a contract cannot be reliably estimated, contract costs are recognised as an expense as incurred, and where it is probable that the costs will be recovered, revenue is recognised to the extent of costs incurred. For fixed price contracts, the stage of completion is measured by reference to costs incurred to date as a percentage of estimated total costs for each contract. Revenue from cost plus contracts is recognised by reference to the recoverable costs incurred during the reporting period plus the percentage of fees earned. Percentage of fees earned is measured by reference to the costs incurred to date as a proportion of the estimated total costs of the contract.
(iii) Project Management business Contract revenue is recognised in accordance with the percentage of completion method unless the outcome of the contract cannot be reliably estimated. Revenue from time and materials contracts is recognised at the contractual hourly rates as labour hours are delivered, and the direct expenses are incurred. Fixed price contracts are accounted for as noted in International Development above. Where the outcome of a contract cannot be reliably estimated, contract costs are recognised as an
expense as incurred, and where it is probable that the costs will be recovered, revenue is recognised to the extent of costs incurred.
(iv) Reimbursable revenue Reimbursable revenue exists across all businesses. For customer contracts where there exists the right to charge certain costs on to the customer relating to the delivery of the contract, revenue is recognised at the time the costs are incurred on a gross basis in the income statement in line with the risks and rewards. (v) Other income Other income is recognised when received or receivable. g) Finance income and finance expense Finance income comprises interest income, which is recognised as it accrues in profit or loss, using the effective interest method. Finance expense comprises interest expense on borrowings and bank overdrafts, amortisation of ancillary costs incurred in connection with the arrangement of borrowings, amortisation of discounts or premiums related to borrowings, unwinding of the discount on provisions, changes in fair value of financial liabilities at fair value through profit or loss, losses on hedging instruments that are recognised in profit or loss and finance lease charges. Borrowing costs are recognised in profit or loss using the effective interest method. h) Trade receivables All trade receivables are recognised initially at the value of the invoice sent to the customer and subsequently at the amount considered recoverable (amortised cost). Trade receivables are generally due for settlement between 30 and 60 days from the date of recognition. The carrying value of trade receivables is considered to approximate fair value.
72 | Coffey Annual Report 2014
Coffey International Limited Notes to the financial statements For the year ended 30 June 2014
72 | Coffey Annual Report 2014
1 Summary of significant accounting policies (continued) Receivables that are known to be uncollectible are written off with the associated expense recognised in other expenses in profit or loss. A provision for impairment of trade receivables is established when there is objective evidence that the Group will not be able to collect all amounts due according to the original terms of the receivables. If amounts originally provided for are subsequently received, the reversal of the provision is also credited to other expenses. i) Work in progress (i) Geoservices business Work in progress represents the sales value of unbilled labour and disbursements, less provisions, for amounts considered non-recoverable. (ii) International Development business Long-term contract work in progress is stated at the aggregate of contract costs incurred to date plus recognised profits, less recognised losses and progress billings. If there are contracts where progress billings exceed the aggregate costs incurred plus profits less losses, the net amounts are presented as unearned revenue. Contract costs include all costs directly related to specific contracts and costs that are specifically chargeable to the customer under the terms of the contract. (iii) Project Management business Work in progress on project management contracts is stated at the aggregate of contract costs incurred to date plus recognised profits less recognised losses and progress billings. If there are contracts where progress billings exceed the aggregate costs incurred plus profits less losses, the net amounts are presented as unearned revenue. Contract costs include all costs directly related to specific contracts and costs that are specifically
chargeable to the customer under the terms of the contract. j) Impairment of non-financial assets The carrying amounts of the Group’s non-financial assets, other than deferred tax assets, are reviewed at each reporting date to determine whether there is any indication of impairment. If any such indication exists, then the asset is tested for impairment. For goodwill, impairment testing is performed at least annually. In some cases assets cannot be tested for impairment on a standalone basis. In that case, assets are grouped together into the smallest group of assets that generates cash inflows from continuing use that are largely independent of the cash inflows of other assets or groups of assets (the cash-generating unit). An impairment test is performed by assessing the recoverable amount of each asset, or for goodwill, the cash-generating unit (or group of cash generating units) (CGU’s) related to the goodwill, in comparison to its carrying value. The recoverable amount of an asset or CGU is the greater of its value in use and its fair value less costs to sell. The goodwill acquired in a business combination, for the purpose of impairment testing, is allocated to cash-generating units that are expected to benefit from the synergies of the combination. An impairment loss is recognised in the income statement if the carrying amount of an asset or CGU exceeds its recoverable amount. Impairment losses recognised in respect of CGUs are allocated first to reduce the carrying amount of any goodwill allocated to the CGU and then to reduce the carrying amount of the other assets in the CGU on a pro-rata basis. An impairment loss in respect of goodwill is not reversed. In respect of other assets, impairment losses recognised in prior periods are assessed at each reporting date for any indications that the loss has
decreased or no longer exists. An impairment loss is reversed if there has been a change in the estimates used to determine the recoverable amount. An impairment loss is reversed only to the extent that the asset’s carrying amount does not exceed the carrying amount that would otherwise be recognised if the impairment charge had never been recorded. k) Plant and equipment All plant and equipment is stated at historical cost less accumulated depreciation. Historical cost includes expenditure that is directly attributable to the acquisition of the items. Depreciation is calculated on either a straight-line basis or on a diminishing value basis to write off the net cost of each item of plant and equipment over its expected useful life to the Group. Estimates of residual values and remaining useful lives are made on a regular basis for all assets, with annual reassessments for major items. The expected useful lives of plant and equipment and motor vehicles held at the reporting date ranges from three to eight years. Gains and losses on disposals are determined by comparing proceeds with the carrying amount of the related asset. These are recognised in the income statement. l) Leasehold improvements The cost of improvements to or on leasehold properties is capitalised at historic cost and depreciated on a straight line basis over the unexpired period of the lease or the estimated useful life of the improvement to the Group, whichever is shorter. Options to extend premises leases are excluded when determining the period over which the cost is to be depreciated. Leasehold improvements held at the reporting date are being depreciated over three to fifteen years.
Coffey Annual Report 2014 | 73
Coffey International Limited Notes to the financial statements For the year ended 30 June 2014
Coffey Annual Report 2014 | 73
1 Summary of significant accounting policies (continued) The Group has a policy which requires providing for costs associated with making good leased premises. Such liabilities are recognised in other payables in the statement of financial position with the related debit recognised in leasehold improvement assets. This asset is amortised over the remaining term of the lease. m) Leases Leases of property, plant and equipment where the Group, as lessee, has substantially all the risks and rewards of ownership are classified as finance leases. Finance leases are capitalised at the lease’s inception at the lower of the fair value of the leased property and the present value of the minimum lease payments. The corresponding rental obligations, net of finance charges, are included in other payables. Each lease payment is allocated between the liability and finance charges. The interest element of the finance cost is charged to the income statement over the lease period so as to produce a constant periodic rate of interest on the remaining balance of the liability for each period. The plant and equipment and motor vehicles acquired under finance leases are depreciated over the shorter of the asset’s useful life and the lease term. Leases in which a significant portion of the risks and rewards of ownership are retained by the lessor are classified as operating leases. Payments made under operating leases (net of any incentives received from the lessor) are charged to the income statement on a straight line basis over the period of the lease. Incentives received on entering into operating leases are recognised as liabilities. The liability is reduced in line with the lease term.
n) Intangible assets (i) Goodwill Goodwill represents the future economic benefits that arise from assets that are not capable of being individually identified and separately recognised following the acquisition of subsidiaries and jointly controlled entities. See Note 1 (b)(i) for further details on recognition and measurement. (ii) Customer contracts and customer relationships Customer contracts and customer relationships, where reliably measurable, acquired as part of a business combination are considered to have a finite useful life and are carried at cost less accumulated amortisation and impairment losses. Amortisation is calculated based on the timing of the projected cash flows of the contracts over their estimated useful lives, which currently vary from one to four years.
(iii) Software Costs incurred in developing systems that will contribute to future period financial benefits through revenue generation and/or cost reductions are capitalised at cost and amortised on a straight-line basis over their estimated useful lives, which vary from between three and ten years, depending on the nature of the software. IT development costs include only those costs directly attributable to the development phase and are only recognised following completion of a technical feasibility study, and where the Group has an intention and ability to use the asset. o) Trade and other payables Trade payables represent liabilities for goods and services provided to the Group prior to the end of the financial year and which are unpaid and are recognised at the value of the supplier invoice received. The amounts are unsecured and are usually paid within 45 days of recognition. The carrying value of trade payables is considered to approximate fair value. Included in other payables are accruals for liabilities that are not yet
billed or due for payment and provisions. Provisions are recognised when the Group has a present legal or constructive obligation as a result of past events, it is more likely than not that an outflow of resources will be required (normally cash) to settle the obligation; and the amount has been reliably estimated. Provisions are not recognised for future operating losses. Provisions are measured at the present value of management’s best estimate of the expenditure required to settle the present obligation at the reporting date. The discount rate used to determine the present value reflects current market assessments of the time value of money and the risks specific to the liability. The increase in the provision due to the passage of time from the unwinding of this discount is recognised as interest expense in the income statement. p) Loans and borrowings Loans and borrowings are initially recognised at fair value, net of directly attributable transaction costs incurred. Loans and borrowings are subsequently measured at amortised cost. Any difference between the proceeds (net of transaction costs) and the redemption amount is recognised in the income statement over the period of the loans using the effective interest method. Fees paid on the establishment of loan facilities, which are incremental costs relating to the actual draw down of the facility, are recognised as prepayments and amortised on a straight-line basis over the term of the facility. Loans and borrowings are classified as current liabilities unless the Group has an unconditional right to defer settlement of the liabilities for at least 12 months after the reporting date.
74 | Coffey Annual Report 2014
Coffey International Limited Notes to the financial statements For the year ended 30 June 2014
74 | Coffey Annual Report 2014
1 Summary of significant accounting policies (continued) q) Dividends Provision is made for the amount of any dividend declared, determined or publicly recommended by the Directors on or before the end of the financial year but not distributed at reporting date. r) Classification of financial instruments The financial assets and liabilities of the Group are classified into the following financial statement captions in the statement of financial position in accordance with AASB 139: financial instruments: ‘Loans and receivables’ –
separately disclosed as cash and cash equivalents, cash deposits, trade and other receivables and work in progress;
‘Financial assets/liabilities at fair value through profit or loss’ – separately disclosed as other financial assets and other financial liabilities and includes derivative financial instruments and a non-controlling interest put option liability; and
‘Financial liabilities measured at amortised cost’ – separately disclosed as trade and other payables and loans and borrowings.
s) Other financial assets and liabilities – derivative financial instruments
The Group uses derivative instruments to hedge its foreign currency and interest rate risk exposures including forward foreign exchange contracts and interest rate swaps. The Group does not enter into derivative financial instruments for speculative trading purposes. Financial instruments entered into to hedge an underlying exposure that do not qualify for hedge accounting are accounted for as trading instruments. Derivatives are recognised at fair value in either other financial assets or liabilities; attributable transaction
costs are recognised in the income statement when incurred. Subsequent to initial recognition, derivatives are measured at fair value, and changes in the fair value, if designated as a hedge of the variability in cash flows or a recognised asset or liability, are recognised directly to other comprehensive income to the extent that the hedge is effective. To the extent that the hedge is ineffective, changes in fair value are recognised in net financing costs in the income statement. If the hedging instrument no longer meets the criteria for hedge accounting, expires or is sold, terminated or exercised, then the hedge accounting is discontinued prospectively. The cumulative gain or loss previously recognised in equity remains there until the forecast transaction occurs and is transferred to the income statement in the same period. t) Employee benefits (i) Wages and salaries, and sick leave Liabilities for wages and salaries expected to be settled within 12 months of the reporting date are recognised in current other payables in respect of employees’ services up to the reporting date and are measured at the amounts expected to be paid when the liabilities are settled. Liabilities for non-accumulating sick leave are recognised when the leave is taken and are measured at the rates paid or payable. (ii) Annual leave and long service leave The liabilities for annual leave and long service leave expected to be settled within 12 months of the reporting date are recognised in the current provision for employee benefits and are measured in accordance with (i) above. The liability for long service leave expected to be settled more than 12 months from the reporting date is recognised in the non-current provision for employee benefits and measured as the present value of expected future payments to be
made in respect of services provided by employees up to the reporting date. Consideration is given to expected future wage and salary levels, average employee service period and periods of service. Expected future payments are discounted using interest rates on national government guaranteed securities with terms to maturity that match, as closely as possible, the estimated future cash outflows. (iii) Bonus plans A liability for employee benefits in the form of bonus plans is recognised in other payables when there is no realistic alternative but to settle the liability and at least one of the following conditions is met: there are formal terms in the
plan for determining the amount of the benefit;
the amounts to be paid can be reliably determined before the time of completion of the financial report; or
past practice gives clear evidence of the amount of the obligation.
Liabilities for bonus plans are settled within 12 months and are measured at amounts expected to be paid when they are settled.
(iv) Defined contribution plans A defined contribution plan is a post-employment benefit plan under which an entity pays fixed contributions into a separate entity and will have no legal or constructive obligation to pay further amounts. Obligations for contributions to defined contribution plans are recognised as a personnel expense in profit or loss when they are due. Prepaid contributions are recognised as an asset to the extent that a cash refund or a reduction in future payments is available.
Coffey Annual Report 2014 | 75
Coffey International Limited Notes to the financial statements For the year ended 30 June 2014
Coffey Annual Report 2014 | 75
1 Summary of significant accounting policies (continued) (v) Employee benefit on-costs Employee benefit on-costs, including superannuation, other retirement benefits, payroll tax and workers compensation, are recognised and included in employee benefit liabilities and costs when the employee benefits to which they relate are recognised as liabilities. (vi) Ownership-based remuneration schemes and other share-based payments Ownership-based remuneration is provided to employees through the Coffey Rewards Share and Option Plans. Shares issued under these schemes are treated as options in accordance with AASB 2 Share-based Payments. Information relating to these share plans is set out in Note 30 ‘Share-based payments’. The fair value of shares granted under the Coffey Rewards Share and Option Plans are recognised as an employee benefit expense with a corresponding increase in equity. The fair value is measured at grant date and recognised over the period during which the employees become unconditionally entitled to the shares. The amount recognised as an expense is adjusted to reflect the actual number of share options that vest, except for those that fail to vest due to market conditions not being met. The fair value of the options granted excludes the impact of any non-market vesting conditions, such as operating earnings per share targets. Non-market vesting conditions are included in assumptions about the number of options that are expected to become exercisable. At each reporting date, the entity revises its estimate of the number of options that are expected to become exercisable. The employee benefit expense recognised each period takes into account the most recent estimate. The impact of the revision to original estimates, if any, is
recognised in the income statement with a corresponding adjustment to equity. Where shares are issued to employees as compensation for the provision of services and receipt by the employee is subject to completion of a service period, the market value of shares issued is recognised as an employee benefit expense with a corresponding increase in equity when the employees become entitled to the shares. u) Cash and cash equivalents and cash deposits Cash and cash equivalents includes cash on hand; deposits held at call with financial institutions; other short-term, highly liquid investments with original maturities of three months or less that are readily convertible to known amounts of cash and which are subject to an insignificant risk of change in value; and bank overdrafts. Cash deposits are recognised separately from cash and cash equivalents in the statement of financial position. These are cash advances received from customers for contract specific expenditure. For both cash and cash equivalents and cash deposits, carrying value is considered to approximate fair value. v) Contributed equity Ordinary shares are classified as equity. Incremental costs directly attributable to the issue of new shares or options are shown in equity as a deduction, net of tax, from the proceeds. Incremental costs directly attributable to the issue of new shares or options, or for the acquisition of a business, are included in the cost of the acquisition as part of the purchase consideration. w) Earnings per share (i) Basic earnings per share Basic earnings per share is determined by dividing net profit/loss after income tax attributable to ordinary equity shareholders of the Company by the weighted average
number of ordinary shares outstanding during the financial year. (ii) Diluted earnings per share Diluted earnings per share adjusts the figures used in determining basic earnings per share to take into account the after income tax effect of interest and other financing costs associated with dilutive potential ordinary shares and the weighted average number of shares assumed to have been issued for no consideration in relation to dilutive potential ordinary shares, which comprise share options granted to employees and shares issued as consideration as part of acquisitions. Options granted to employees, which are accounted for as share-based payments, are considered to be potential ordinary shares and have been included in the determination of diluted earnings per share. The options have not been included in determining basic earnings per share. (iii) Operating earnings per share Operating earnings per share is calculated and disclosed for the information of users of these financial statements as it is the EPS performance hurdle for the Coffey Reward Plan (see Note 30 for details of this Plan). Operating earnings per share is determined by dividing net profit after income tax excluding amortisation, vendor earn out and vendor share-based payment expense attributable to the ordinary equity shareholders of the Company. x) Discontinued operations Classification as a discontinued operation occurs on disposal or when an operation in the Group meets the criteria to be classified as held for sale or distribution. When an operation is classified as a discontinued operation, the comparative statement of comprehensive income statement is presented as if the operation had been discontinued from the start of the comparative year. The post-tax profit or loss of the discontinued operation is disclosed separately on the face of the income statement.
76 | Coffey Annual Report 2014
Coffey International Limited Notes to the financial statements For the year ended 30 June 2014
76 | Coffey Annual Report 2014
1 Summary of significant accounting policies (continued) y) Goods and services tax (GST) and other transaction taxes Revenues, expenses and assets are recognised net of the amount of associated GST and other transactional taxes, unless the GST or other transactional tax incurred is not recoverable from the taxation authority. In this case, it is recognised as part of the cost of acquisition of the asset or as part of the expense. Receivables and payables are stated inclusive of the amount of GST or other transactional tax receivable or payable. The net amount recoverable from the taxation authority is included with other receivables or payables in the statement of financial position. Cash flows are presented on a gross basis. The GST and other transactional tax components of cash flows arising from investing or financing activities which are recoverable from, or payable to the taxation authority, are presented as operating cash flow. z) Reserves (i) Foreign currency translation The foreign currency translation reserve comprises all foreign exchange differences arising from the translation of the financial statements of foreign operations, where their functional currency is different to the presentation currency of the reporting entity. The reserve is recognised in profit and loss when the net investment is disposed of. (ii) Share-based payments reserve The share-based payments reserve comprises the fair value of share-based payments recognised as an expense in the income statement. Once a share option has lapsed, the Group no longer has any obligation to convert these options into share capital. The amount transferred to retained earnings represents the value of options previously recognised as an expense through
the Statement of Comprehensive Income that have now lapsed. (iii) Hedging reserve The hedging reserve comprises the effective portion of the cumulative net change in the fair value of cash flow hedging instruments related to hedged transactions that have not yet occurred. The cumulative deferred gain or loss on the hedge is recognised in profit and loss when the hedged transaction impacts the profit or loss, consistent with applicable accounting policy.
Coffey Annual Report 2014 | 77
Coffey International Limited Notes to the financial statements For the year ended 30 June 2014
Coffey Annual Report 2014 | 77
2 Critical accounting estimates and judgements Estimates and judgements are continually evaluated and are based on historical experience and other factors, including expectations of future events that may have a financial impact on the Group that are believed to be reasonable under the circumstances. a) Critical accounting judgements (i) Revenue recognition in relation to long-term contracts The timing of revenue recognition in relation to long-term contracts, primarily in the International Development and Project Management businesses, is subject to significant judgement. Management ensures that the timing of revenue recognition in relation to these contracts is appropriate through regular reassessments of the percentage completion and the costs to completion of the projects. The recognition of key performance indicator (KPI) revenue is also subject to significant judgement. Management, together with the Group’s contract partners, ensure that revenue recognised is appropriate through regular reassessments of projects against performance criteria and contracted standards that need to be met for revenue to accrue to the Group. Where it is probable that these criteria will be met, management ensures that the timing of revenue recognition is appropriate through regular reassessments of the percentage completion and the costs to completion of the projects. b) Critical accounting estimates and assumptions The Group makes estimates and assumptions concerning the future. The resulting accounting estimates will, by definition, seldom equal the related actual results. The estimates and assumptions that have a significant risk of causing a material adjustment to the carrying amounts of assets and liabilities within the next financial year are discussed below. (i) Impairment testing of goodwill The Group tests at least annually whether goodwill has suffered any impairment, in accordance with the accounting policy stated in Note 1 (j). The recoverable amounts of cash-generating units have been determined by applying a value in use method, using future cash flow models involving a number of assumptions. Estimates are used in deriving the future cash flows and the discount rates used to calculate the present value of such cash flows. Such estimates are based on current approved budgets and forecasts, extrapolated for an appropriate period taking into account growth rates that are based on internal management estimates or industry growth rates. The impact of cost savings or restructurings is reflected in future cash flow estimates only if approved by the Board. The Directors then estimate an appropriate pre-tax discount rate to apply to the future cash flows. Such rates reflect current market assessments of such rates and the risks specific to the CGUs. The estimation process is complex due to inherent risks and uncertainties. If different estimates of the projected future cash flows or a different selection of an appropriate discount rate or long term growth rate were made, these changes could materially alter the projected value of the cash flows of the asset or CGU, and as a consequence materially different amounts would be reported in the financial statements. (ii) Income taxes The Group is subject to income taxes in Australia and in the foreign jurisdictions where it has operations. There are many transactions and calculations undertaken during the ordinary course of business for which the ultimate tax determination is uncertain. The Group recognises liabilities for anticipated tax audit issues based on expectations of whether additional taxes will be due. Where the final tax outcome of these matters is different from the amounts that were initially recorded, such differences will impact the current and deferred tax provisions in the period in which the determination is made. (iii) Recoverability of financial assets The Group continually assesses the recoverability of work in progress and trade and other receivables and recognises provisions where appropriate. Certain estimates and judgement need to be made with the recognition of such provisions relating to the probability of recoverable amounts. Assessment of the collectability of trade receivables involves the use of estimates in determining the level of receivables that will not be collected. These estimates are based on historical experience, the current state of the respective economies and industry operated in and customer specific factors. Recoverability of work in progress involves the use of estimates in determining the amounts that are not able to be billed to the customer. These estimates are based on historical experience and industry and customer specific factors.
78 | Coffey Annual Report 2014
Coffey International Limited Notes to the financial statements For the year ended 30 June 2014
78 | Coffey Annual Report 2014
2 Critical accounting estimates and judgements (continued) (iv) Provisions Provisions for restructuring are recognised when the Group has approved a detailed and formal restructuring plan and the restructuring has either commenced or has been announced to relevant stakeholders. Future operating losses are not provided for. Where provisions for making good the Group’s leased premises are recognised, the amount is determined on the basis of the best estimate of the likely payments required to be made to exit the premises. This can be based on agreed contractual amounts as set out in the lease agreement with the landlord or estimates formed on the basis of historical experience of rates paid per square metre on similar premises.
3 Determination of fair value A number of the Group’s accounting policies and disclosures require the determination of fair value, for both financial and non-financial assets and liabilities. Fair value has been determined for measurement and/or disclosure purposes based on the methods listed below. Where applicable, further information about the assumptions made in determining fair value is disclosed in the notes specific to that asset or liability. a) Identifiable assets and liabilities acquired in a business combination (i) Property, plant and equipment The fair value of property, plant and equipment recognised as a result of a business combination is based on market value. The market value of property is the estimated amount for which a property could be exchanged on the date of valuation between a willing buyer and a willing seller in an arm’s length transaction after proper marketing wherein the parties had each acted knowledgeably, prudently and without compulsion. The market values of items of plant and equipment and motor vehicles are based on the quoted market prices for similar items when available and replacement cost when appropriate. (ii) Intangible assets The fair value of customer contracts and customer relationships identified as acquired as part of a business combination are normally based on discounted cash flows expected to be derived from the use of those assets. This requires the use of estimates in relation to the timing and amount of future cash flows derived from exploiting the assets acquired. Such estimates are based on current approved budgets and forecasts, extrapolated for an appropriate period taking into account growth rates, expected contract prices, operating costs and the expected useful lives of assets. The Directors then estimate an appropriate pre-tax discount rate to apply to the future cash flows. Such rates reflect current market assessments of the time value of money and the risks specific to the businesses acquired. (iii) Other financial assets The fair value of work in progress acquired in a business combination is determined based on the estimated selling price in the ordinary course of business less the estimated costs of completion and sale, and a reasonable profit margin based on the effort required to complete and sell the work in progress. The fair value of trade and other receivables, excluding work in progress, is estimated as its recoverable amount on the basis of customer specific factors and historical experience. b) Derivatives The fair value of forward exchange contracts is based on their listed market price, if available. If a listed market price is not available, then fair value is estimated by discounting the difference between the contractual forward price and the current forward price for the residual maturity of the contract using a risk-free interest rate (based on government bonds). The fair value of interest rate swaps is based on broker quotes. Fair value reflects the credit risk of the instrument and includes adjustments to take account of the credit risk of the Group entity and counterparty when appropriate. c) Non-derivative financial liabilities Fair value, which is determined for disclosure purposes only, is calculated based on the present value of future principal and interest cash flows, discounted at the market rate of interest at the reporting date. For finance leases, the market rate of interest is determined by reference to similar lease agreements.
Coffey Annual Report 2014 | 79
Coffey International Limited Notes to the financial statements For the year ended 30 June 2014
Coffey Annual Report 2014 | 79
3 Determination of fair value (continued) d) Share-based payment transactions The valuation methodology used to determine the share-based payment expense was the Monte Carlo simulation model in relation to both grants with only service (loyalty) or non-market performance conditions (EPS). The Monte Carlo simulation model was also used for grants with a performance condition, to create an estimate of the share price values which would generate the required Total Shareholder Return (TSR) at the end of the measurement period to meet the hurdle. As required by AASB 2, the model took into account the exercise price of the option, the life of the option, the current price of the underlying shares, the expected volatility of the share price, the dividends expected on the shares and the risk-free interest rate for the life of the option. The expected life of the instrument was deemed to be the period from grant date to first available date plus 24 months.
4 Operating segments During the year, the Group provided specialist consulting services across its three businesses. These activities are summarised below by each reportable segment:
a) Geoservices The Geoservices business comprises specialised geotechnical, environmental and mining consulting services, as well as materials testing and analysis. The business delivers services to public and private sector clients across resources, infrastructure and property. Offices are located across Asia Pacific, the United Kingdom, North and South America, Africa and the Middle East. b) International Development The International Development business delivers consulting and training services alongside governments and donor agencies to strengthen governance, promote economic growth, and create conditions for sustainable development. The business operates from regional offices based in Australia, the United States of America and the United Kingdom. c) Project Management The Project Management business provides project management and advisory services to public and private sector clients across the property and infrastructure project lifecycles. Offices are located throughout Australia, New Zealand and South Africa. d) Unallocated corporate Unallocated corporate comprises Group corporate management and Group treasury activities. Understanding the segment results Sales between segments are carried out at arm’s length and are eliminated on consolidation. The revenue from external parties is measured the same way as in the income statement.
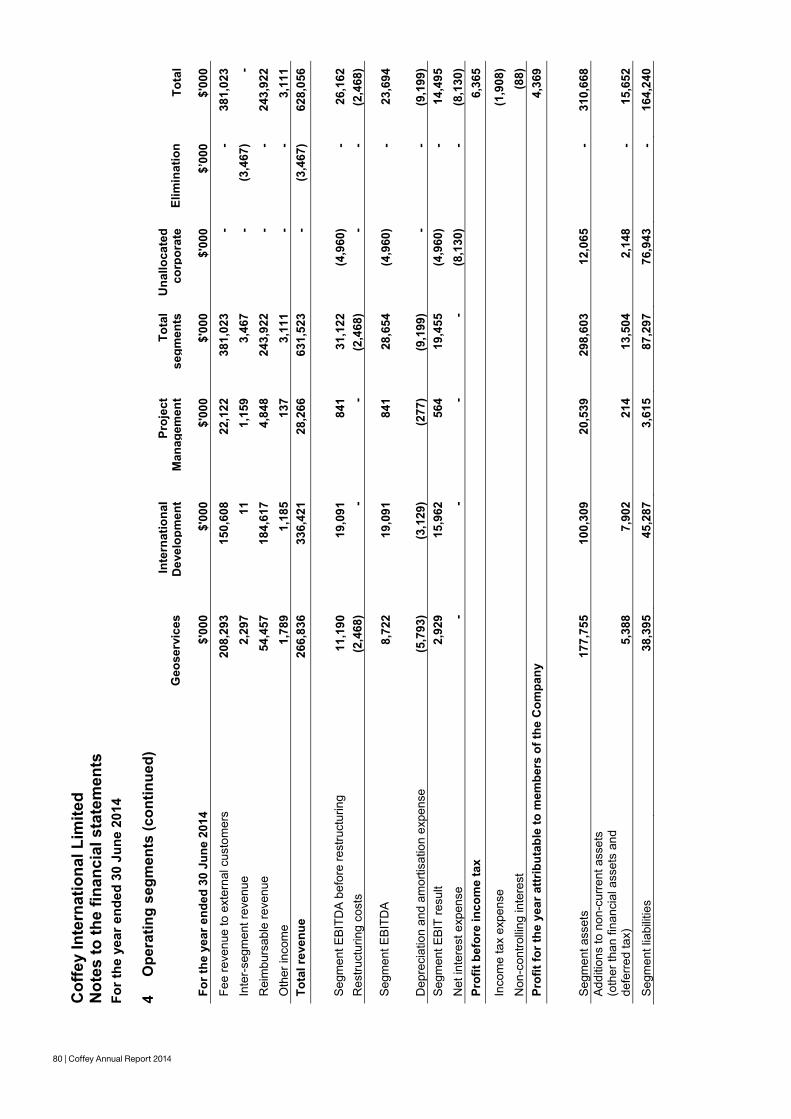
80 | Coffey Annual Report 2014
Cof
fey
Inte
rnat
iona
l Lim
ited
Not
es to
the
finan
cial
sta
tem
ents
Fo
r the
yea
r end
ed 3
0 Ju
ne 2
014
80 |
Cof
fey
Ann
ual R
epor
t 201
4 4
Ope
ratin
g se
gmen
ts (c
ontin
ued)
G
eose
rvic
es
Inte
rnat
iona
lD
evel
opm
ent
Proj
ect
Man
agem
ent
Tota
l se
gmen
tsU
nallo
cate
dco
rpor
ate
Elim
inat
ion
To
tal
For t
he y
ear e
nded
30
June
201
4 $'
000
$'00
0 $'
000
$'00
0 $'
000
$’00
0
$'00
0 Fe
e re
venu
e to
ext
erna
l cus
tom
ers
208,
293
150,
608
22,1
22
381,
023
- -
381,
023
Inte
r-se
gmen
t rev
enue
2,
297
11
1,15
9 3,
467
- (3
,467
) -
Rei
mbu
rsab
le re
venu
e 54
,457
18
4,61
7 4,
848
243,
922
- -
243,
922
Oth
er in
com
e 1,
789
1,18
5 13
7 3,
111
- -
3,11
1 To
tal r
even
ue
266,
836
336,
421
28,2
66
631,
523
- (3
,467
) 62
8,05
6
Seg
men
t EB
ITD
A b
efor
e re
stru
ctur
ing
11,1
90
19,0
91
841
31,1
22
(4,9
60)
- 26
,162
R
estru
ctur
ing
cost
s (2
,468
) -
- (2
,468
) -
-(2
,468
)
Seg
men
t EB
ITD
A
8,72
2 19
,091
84
1 28
,654
(4
,960
) -
23,6
94
Dep
reci
atio
n an
d am
ortis
atio
n ex
pens
e (5
,793
) (3
,129
) (2
77)
(9,1
99)
- -
(9,1
99)
Seg
men
t EB
IT re
sult
2,92
9 15
,962
56
4 19
,455
(4
,960
) -
14,4
95
Net
inte
rest
exp
ense
-
--
-(8
,130
) -
(8,1
30)
Prof
it be
fore
inco
me
tax
6,36
5
Inco
me
tax
expe
nse
(1,9
08)
Non
-con
trolli
ng in
tere
st
(8
8)
Prof
it fo
r the
yea
r attr
ibut
able
to m
embe
rs o
f the
Com
pany
4,36
9 S
egm
ent a
sset
s 17
7,75
5 10
0,30
9 20
,539
29
8,60
3 12
,065
-
310,
668
Add
ition
s to
non
-cur
rent
ass
ets
(oth
er th
an fi
nanc
ial a
sset
s an
d de
ferre
d ta
x)
5,38
8 7,
902
214
13,5
04
2,14
8 -
15,6
52
Segm
ent l
iabi
litie
s 38
,395
45
,287
3,
615
87,2
97
76,9
43
- 16
4,24
0
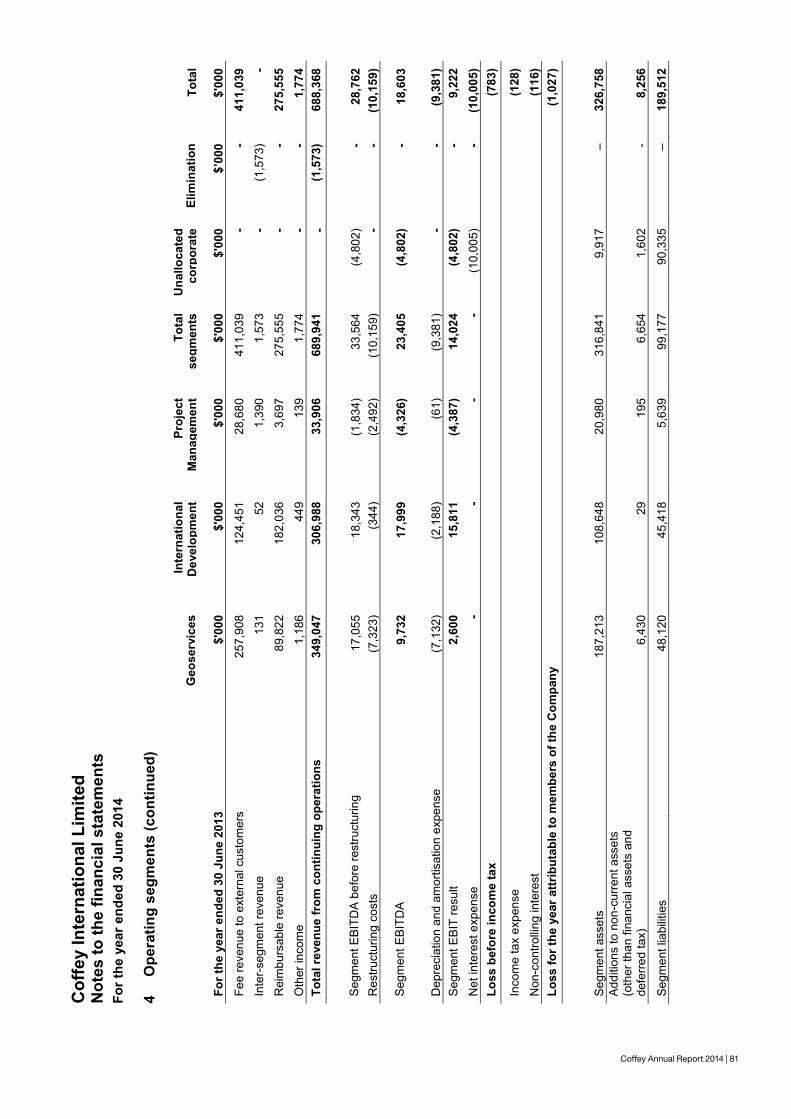
Coffey Annual Report 2014 | 81
Cof
fey
Inte
rnat
iona
l Lim
ited
Not
es to
the
finan
cial
sta
tem
ents
Fo
r the
yea
r end
ed 3
0 Ju
ne 2
014
Cof
fey
Ann
ual R
epor
t 201
4 | 8
1
4 O
pera
ting
segm
ents
(con
tinue
d)
G
eose
rvic
es
Inte
rnat
iona
lD
evel
opm
ent
Proj
ect
Man
agem
ent
Tota
l se
gmen
tsU
nallo
cate
dco
rpor
ate
Elim
inat
ion
To
tal
For t
he y
ear e
nded
30
June
201
3 $'
000
$'00
0 $'
000
$'00
0 $'
000
$’00
0
$'00
0 Fe
e re
venu
e to
ext
erna
l cus
tom
ers
257,
908
124,
451
28,6
80
411,
039
- -
411,
039
Inte
r-se
gmen
t rev
enue
13
1 52
1,
390
1,57
3 -
(1,5
73)
- R
eim
burs
able
reve
nue
89,8
22
182,
036
3,69
7 27
5,55
5 -
- 27
5,55
5 O
ther
inco
me
1,18
6 44
9 13
9 1,
774
- -
1,77
4 To
tal r
even
ue fr
om c
ontin
uing
ope
ratio
ns
349,
047
306,
988
33,9
06
689,
941
- (1
,573
) 68
8,36
8
Seg
men
t EB
ITD
A b
efor
e re
stru
ctur
ing
17,0
55
18,3
43
(1,8
34)
33,5
64
(4,8
02)
- 28
,762
R
estru
ctur
ing
cost
s (7
,323
) (3
44)
(2,4
92)
(10,
159)
-
- (1
0,15
9)
Seg
men
t EB
ITD
A
9,73
2 17
,999
(4
,326
) 23
,405
(4
,802
) -
18,6
03
Dep
reci
atio
n an
d am
ortis
atio
n ex
pens
e (7
,132
) (2
,188
) (6
1)
(9,3
81)
- -
(9,3
81)
Seg
men
t EB
IT re
sult
2,60
0 15
,811
(4
,387
) 14
,024
(4
,802
) -
9,22
2 N
et in
tere
st e
xpen
se
- -
- -
(10,
005)
-
(10,
005)
Lo
ss b
efor
e in
com
e ta
x
(7
83)
Inco
me
tax
expe
nse
(128
) N
on-c
ontro
lling
inte
rest
(116
) Lo
ss fo
r the
yea
r attr
ibut
able
to m
embe
rs o
f the
Com
pany
(1,0
27)
Seg
men
t ass
ets
187,
213
108,
648
20,9
80
316,
841
9,91
7 –
326,
758
Add
ition
s to
non
-cur
rent
ass
ets
(oth
er th
an fi
nanc
ial a
sset
s an
d de
ferre
d ta
x)
6,43
0 29
19
5 6,
654
1,60
2 -
8,25
6 Se
gmen
t lia
bilit
ies
48,1
20
45,4
18
5,63
9 99
,177
90
,335
–
189,
512
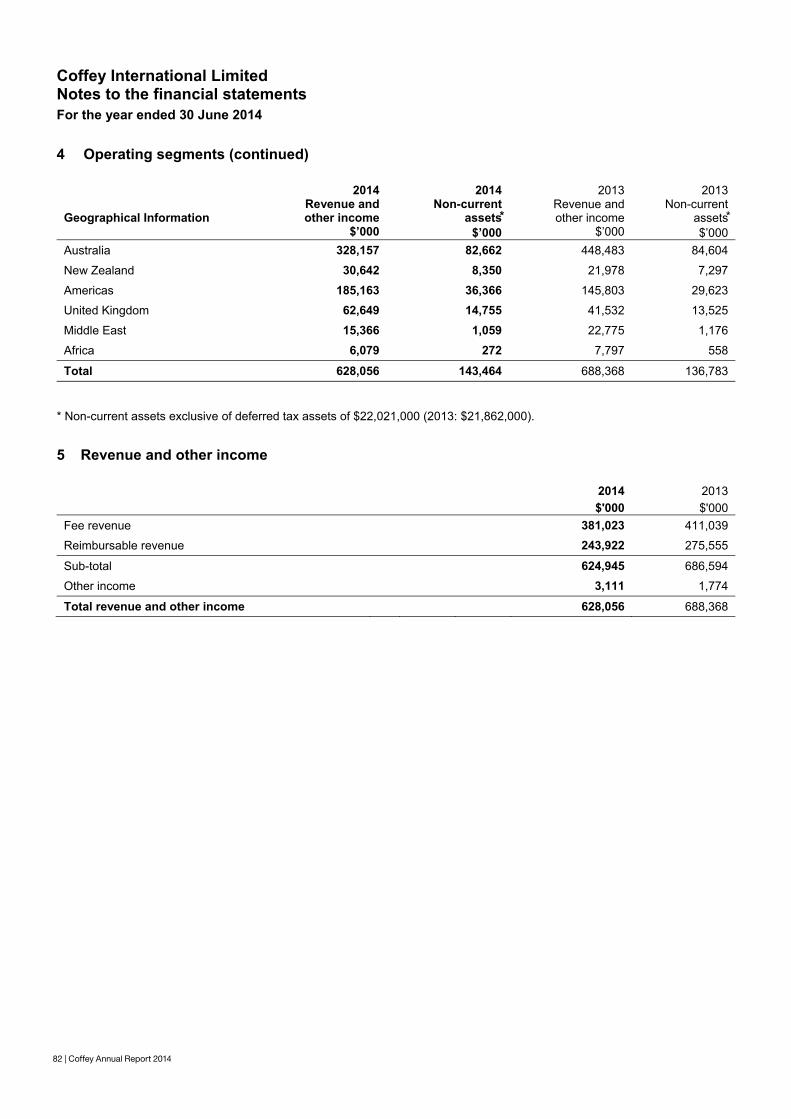
82 | Coffey Annual Report 2014
Coffey International Limited Notes to the financial statements For the year ended 30 June 2014
82 | Coffey Annual Report 2014
4 Operating segments (continued)
2014 2014 2013 2013
Geographical Information Revenue and other income
Non-currentassets⃰
Revenue and other income
Non-currentassets⃰
$’000 $’000 $’000 $’000 Australia 328,157 82,662 448,483 84,604
New Zealand 30,642 8,350 21,978 7,297
Americas 185,163 36,366 145,803 29,623
United Kingdom 62,649 14,755 41,532 13,525
Middle East 15,366 1,059 22,775 1,176
Africa 6,079 272 7,797 558
Total 628,056 143,464 688,368 136,783
* Non-current assets exclusive of deferred tax assets of $22,021,000 (2013: $21,862,000).
5 Revenue and other income
2014 2013 $'000 $'000 Fee revenue 381,023 411,039
Reimbursable revenue 243,922 275,555
Sub-total 624,945 686,594
Other income 3,111 1,774
Total revenue and other income 628,056 688,368
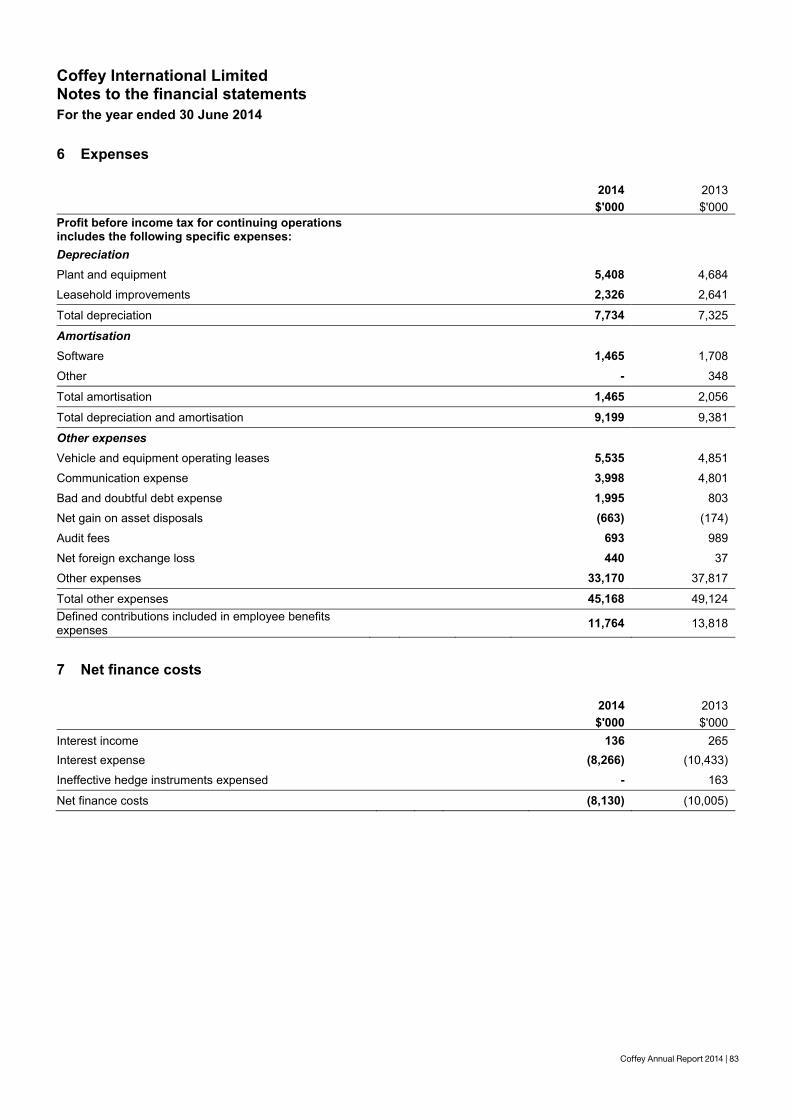
Coffey Annual Report 2014 | 83
Coffey International Limited Notes to the financial statements For the year ended 30 June 2014
Coffey Annual Report 2014 | 83
6 Expenses
2014 2013 $'000 $'000
Profit before income tax for continuing operations includes the following specific expenses:
Depreciation
Plant and equipment 5,408 4,684
Leasehold improvements 2,326 2,641
Total depreciation 7,734 7,325
Amortisation
Software 1,465 1,708
Other - 348
Total amortisation 1,465 2,056
Total depreciation and amortisation 9,199 9,381
Other expenses
Vehicle and equipment operating leases 5,535 4,851
Communication expense 3,998 4,801
Bad and doubtful debt expense 1,995 803
Net gain on asset disposals (663) (174)
Audit fees 693 989
Net foreign exchange loss 440 37
Other expenses 33,170 37,817
Total other expenses 45,168 49,124 Defined contributions included in employee benefits expenses 11,764 13,818
7 Net finance costs
2014 2013 $'000 $'000
Interest income 136 265 Interest expense (8,266) (10,433)
Ineffective hedge instruments expensed - 163
Net finance costs (8,130) (10,005)
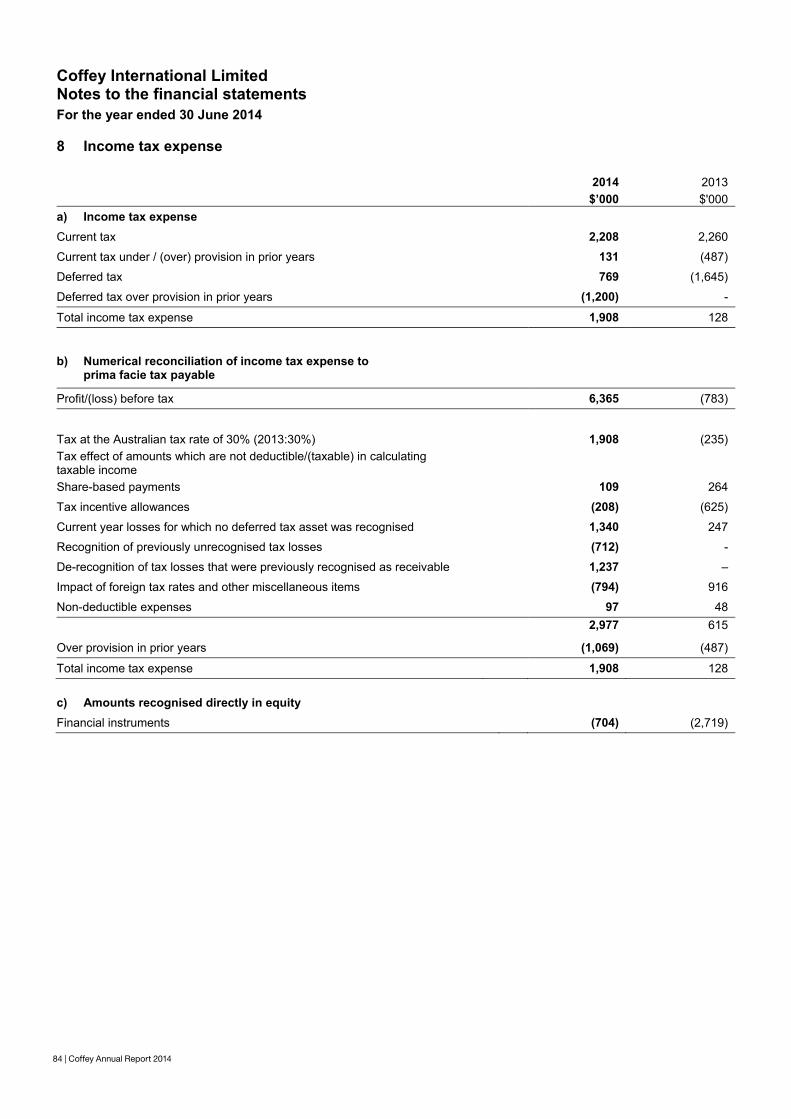
84 | Coffey Annual Report 2014
Coffey International Limited Notes to the financial statements For the year ended 30 June 2014
84 | Coffey Annual Report 2014
8 Income tax expense
2014 2013 $’000 $'000
a) Income tax expense Current tax 2,208 2,260
Current tax under / (over) provision in prior years 131 (487)
Deferred tax 769 (1,645)
Deferred tax over provision in prior years (1,200) -
Total income tax expense 1,908 128
b) Numerical reconciliation of income tax expense to prima facie tax payable
Profit/(loss) before tax 6,365 (783)
Tax at the Australian tax rate of 30% (2013:30%) 1,908 (235) Tax effect of amounts which are not deductible/(taxable) in calculating taxable income Share-based payments 109 264
Tax incentive allowances (208) (625)
Current year losses for which no deferred tax asset was recognised 1,340 247
Recognition of previously unrecognised tax losses (712) -
De-recognition of tax losses that were previously recognised as receivable 1,237 –
Impact of foreign tax rates and other miscellaneous items (794) 916
Non-deductible expenses 97 48 2,977 615
Over provision in prior years (1,069) (487)
Total income tax expense 1,908 128 c) Amounts recognised directly in equity
Financial instruments (704) (2,719)
Coffey International Limited Notes to the financial statements For the year ended 30 June 2014
Coffey Annual Report 2014 | 85
9 Cash and cash equivalents
2014 2013 $'000 $'000
Cash at bank and in hand 26,757 23,387
10 Cash deposits
2014 2013 $'000 $'000
Current
Interest bearing deposits 2,140 7,318 The interest-bearing cash deposits relate to contract revenue received from customers in advance.
11 Trade and other receivables
2014 2013 $'000 $'000
Trade receivables 70,833 89,386
Less allowance for impairment losses (1,604) (1,803)
69,229 87,583
Prepayments 2,752 5,162
Project advances 4,758 6,997
Other receivables 340 3,776
Total 77,079 103,518 Effective interest rates and credit risk The Group’s exposure to credit and currency risk and impairment losses related to trade and other receivables are disclosed in Note 21.
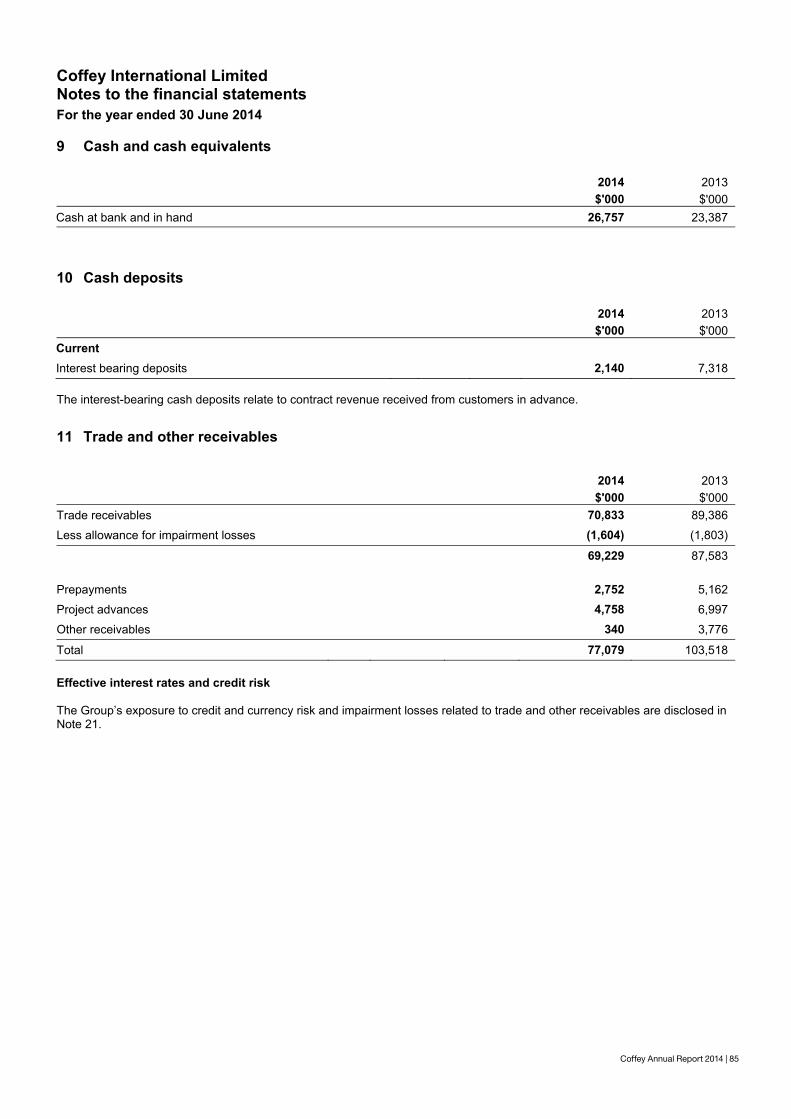
Coffey Annual Report 2014 | 85
Coffey International Limited Notes to the financial statements For the year ended 30 June 2014
Coffey Annual Report 2014 | 85
9 Cash and cash equivalents
2014 2013 $'000 $'000
Cash at bank and in hand 26,757 23,387
10 Cash deposits
2014 2013 $'000 $'000
Current
Interest bearing deposits 2,140 7,318 The interest-bearing cash deposits relate to contract revenue received from customers in advance.
11 Trade and other receivables
2014 2013 $'000 $'000
Trade receivables 70,833 89,386
Less allowance for impairment losses (1,604) (1,803)
69,229 87,583
Prepayments 2,752 5,162
Project advances 4,758 6,997
Other receivables 340 3,776
Total 77,079 103,518 Effective interest rates and credit risk The Group’s exposure to credit and currency risk and impairment losses related to trade and other receivables are disclosed in Note 21.
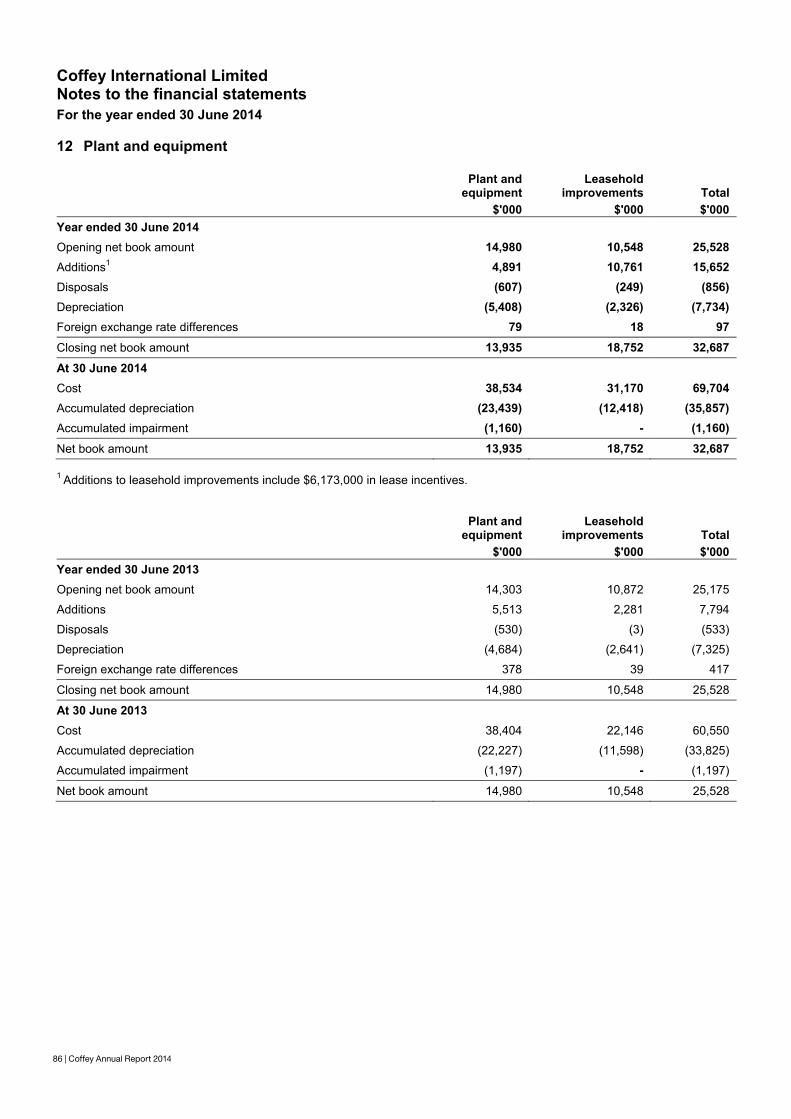
86 | Coffey Annual Report 2014
Coffey International Limited Notes to the financial statements For the year ended 30 June 2014
86 | Coffey Annual Report 2014
12 Plant and equipment
Plant and equipment
Leasehold improvements Total
$'000 $'000 $'000 Year ended 30 June 2014 Opening net book amount 14,980 10,548 25,528 Additions1 4,891 10,761 15,652 Disposals (607) (249) (856) Depreciation (5,408) (2,326) (7,734) Foreign exchange rate differences 79 18 97 Closing net book amount 13,935 18,752 32,687 At 30 June 2014 Cost 38,534 31,170 69,704 Accumulated depreciation (23,439) (12,418) (35,857) Accumulated impairment (1,160) - (1,160) Net book amount 13,935 18,752 32,687 1 Additions to leasehold improvements include $6,173,000 in lease incentives.
Plant and equipment
Leasehold improvements Total
$'000 $'000 $'000 Year ended 30 June 2013 Opening net book amount 14,303 10,872 25,175
Additions 5,513 2,281 7,794
Disposals (530) (3) (533)
Depreciation (4,684) (2,641) (7,325)
Foreign exchange rate differences 378 39 417
Closing net book amount 14,980 10,548 25,528
At 30 June 2013
Cost 38,404 22,146 60,550
Accumulated depreciation (22,227) (11,598) (33,825)
Accumulated impairment (1,197) - (1,197)
Net book amount 14,980 10,548 25,528
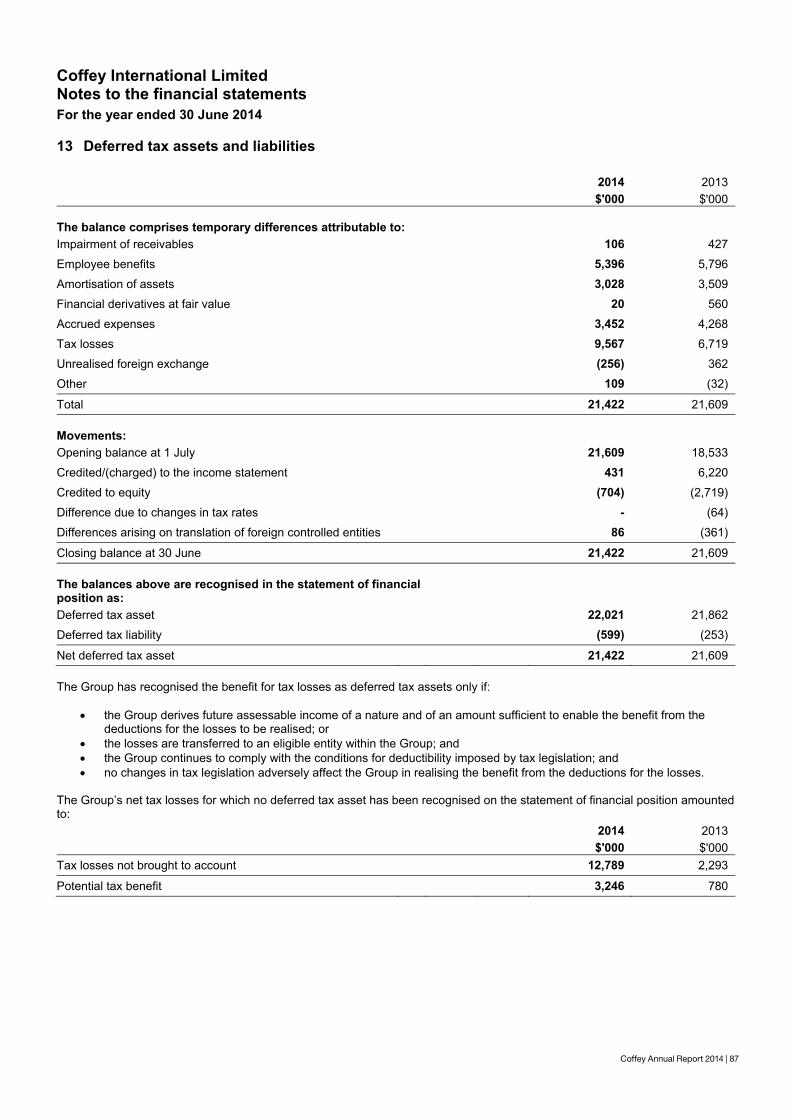
Coffey Annual Report 2014 | 87
Coffey International Limited Notes to the financial statements For the year ended 30 June 2014
Coffey Annual Report 2014 | 87
13 Deferred tax assets and liabilities
2014 2013 $'000 $'000
The balance comprises temporary differences attributable to:
Impairment of receivables 106 427
Employee benefits 5,396 5,796
Amortisation of assets 3,028 3,509
Financial derivatives at fair value 20 560
Accrued expenses 3,452 4,268
Tax losses 9,567 6,719
Unrealised foreign exchange (256) 362
Other 109 (32)
Total 21,422 21,609 Movements:
Opening balance at 1 July 21,609 18,533
Credited/(charged) to the income statement 431 6,220
Credited to equity (704) (2,719)
Difference due to changes in tax rates - (64)
Differences arising on translation of foreign controlled entities 86 (361)
Closing balance at 30 June 21,422 21,609 The balances above are recognised in the statement of financial position as:
Deferred tax asset 22,021 21,862
Deferred tax liability (599) (253)
Net deferred tax asset 21,422 21,609 The Group has recognised the benefit for tax losses as deferred tax assets only if:
the Group derives future assessable income of a nature and of an amount sufficient to enable the benefit from the deductions for the losses to be realised; or
the losses are transferred to an eligible entity within the Group; and the Group continues to comply with the conditions for deductibility imposed by tax legislation; and no changes in tax legislation adversely affect the Group in realising the benefit from the deductions for the losses.
The Group’s net tax losses for which no deferred tax asset has been recognised on the statement of financial position amounted to:
2014 2013 $'000 $'000
Tax losses not brought to account 12,789 2,293
Potential tax benefit 3,246 780
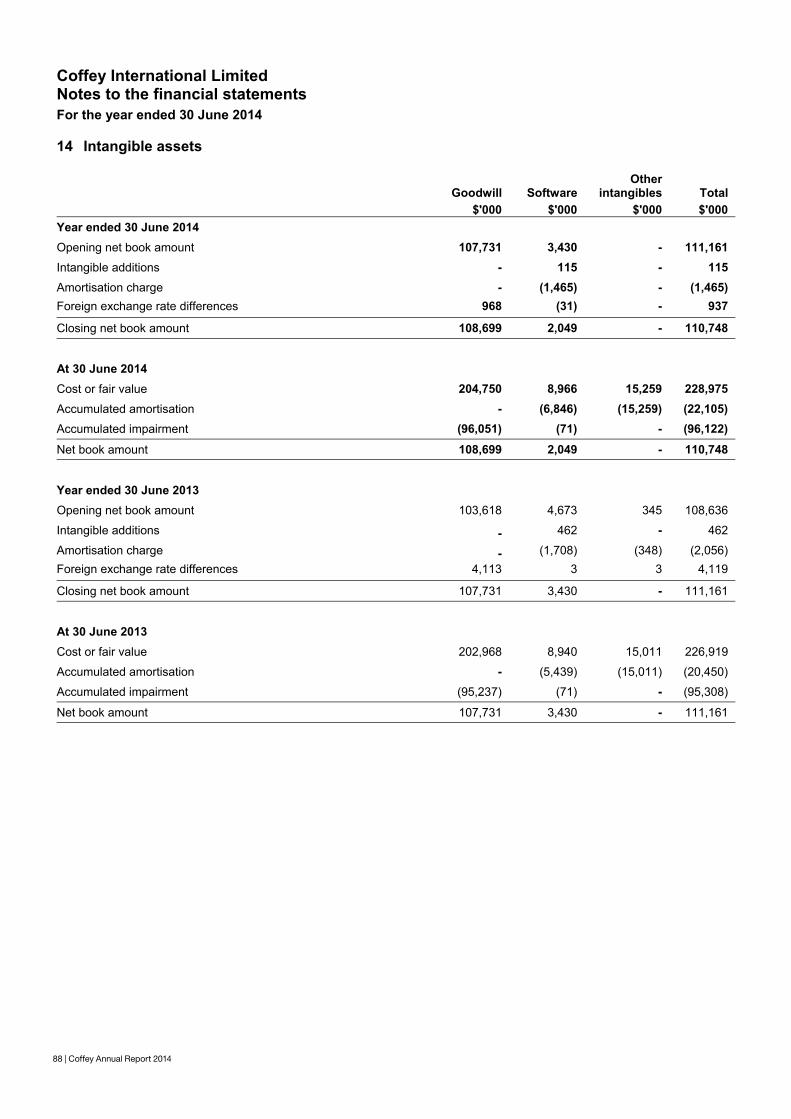
88 | Coffey Annual Report 2014
Coffey International Limited Notes to the financial statements For the year ended 30 June 2014
88 | Coffey Annual Report 2014
14 Intangible assets
Goodwill Software Other
intangibles Total $'000 $'000 $'000 $'000
Year ended 30 June 2014 Opening net book amount 107,731 3,430 - 111,161 Intangible additions - 115 - 115 Amortisation charge - (1,465) - (1,465) Foreign exchange rate differences 968 (31) - 937
Closing net book amount 108,699 2,049 - 110,748
At 30 June 2014 Cost or fair value 204,750 8,966 15,259 228,975 Accumulated amortisation - (6,846) (15,259) (22,105) Accumulated impairment (96,051) (71) - (96,122) Net book amount 108,699 2,049 - 110,748
Year ended 30 June 2013 Opening net book amount 103,618 4,673 345 108,636
Intangible additions - 462 - 462
Amortisation charge - (1,708) (348) (2,056) Foreign exchange rate differences 4,113 3 3 4,119
Closing net book amount 107,731 3,430 - 111,161
At 30 June 2013
Cost or fair value 202,968 8,940 15,011 226,919
Accumulated amortisation - (5,439) (15,011) (20,450)
Accumulated impairment (95,237) (71) - (95,308)
Net book amount 107,731 3,430 - 111,161
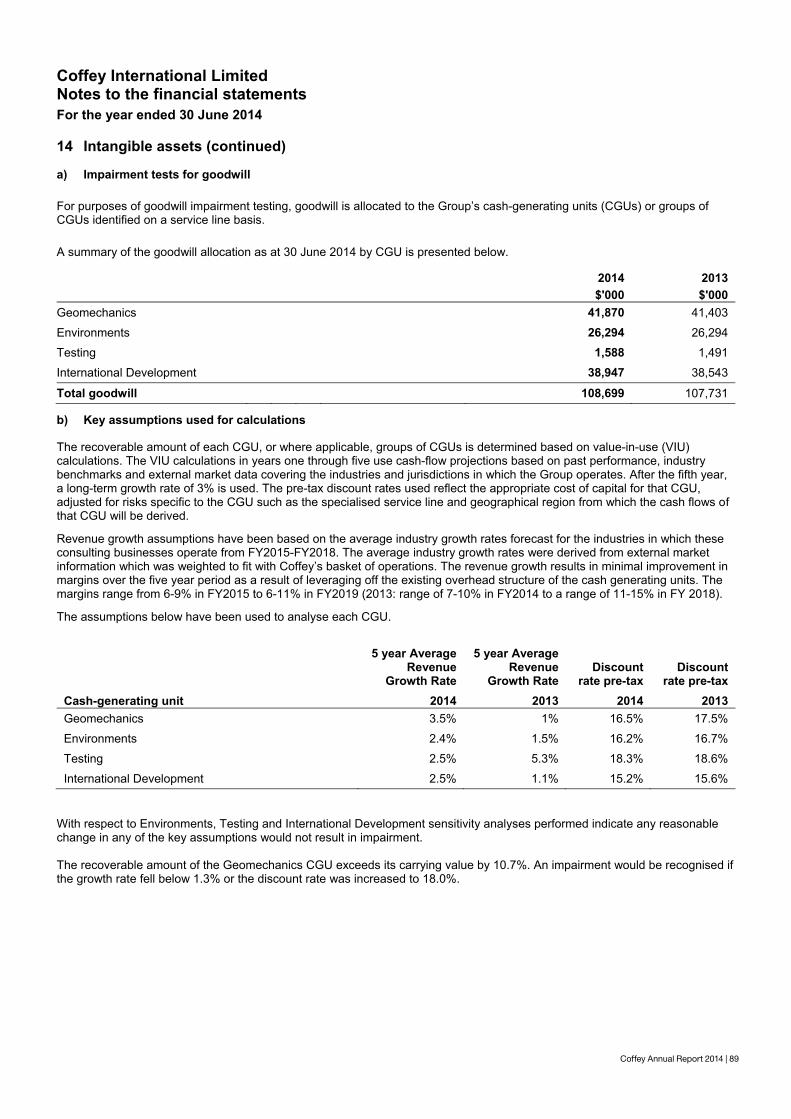
Coffey Annual Report 2014 | 89
Coffey International Limited Notes to the financial statements For the year ended 30 June 2014
Coffey Annual Report 2014 | 89
14 Intangible assets (continued) a) Impairment tests for goodwill For purposes of goodwill impairment testing, goodwill is allocated to the Group’s cash-generating units (CGUs) or groups of CGUs identified on a service line basis. A summary of the goodwill allocation as at 30 June 2014 by CGU is presented below.
2014 2013 $'000 $'000
Geomechanics 41,870 41,403
Environments 26,294 26,294
Testing 1,588 1,491
International Development 38,947 38,543
Total goodwill 108,699 107,731 b) Key assumptions used for calculations
The recoverable amount of each CGU, or where applicable, groups of CGUs is determined based on value-in-use (VIU) calculations. The VIU calculations in years one through five use cash-flow projections based on past performance, industry benchmarks and external market data covering the industries and jurisdictions in which the Group operates. After the fifth year, a long-term growth rate of 3% is used. The pre-tax discount rates used reflect the appropriate cost of capital for that CGU, adjusted for risks specific to the CGU such as the specialised service line and geographical region from which the cash flows of that CGU will be derived. Revenue growth assumptions have been based on the average industry growth rates forecast for the industries in which these consulting businesses operate from FY2015-FY2018. The average industry growth rates were derived from external market information which was weighted to fit with Coffey’s basket of operations. The revenue growth results in minimal improvement in margins over the five year period as a result of leveraging off the existing overhead structure of the cash generating units. The margins range from 6-9% in FY2015 to 6-11% in FY2019 (2013: range of 7-10% in FY2014 to a range of 11-15% in FY 2018). The assumptions below have been used to analyse each CGU.
5 year Average Revenue
Growth Rate
5 year Average Revenue
Growth Rate Discount
rate pre-tax Discount
rate pre-tax Cash-generating unit 2014 2013 2014 2013 Geomechanics 3.5% 1% 16.5% 17.5%
Environments 2.4% 1.5% 16.2% 16.7%
Testing 2.5% 5.3% 18.3% 18.6%
International Development 2.5% 1.1% 15.2% 15.6% With respect to Environments, Testing and International Development sensitivity analyses performed indicate any reasonable change in any of the key assumptions would not result in impairment. The recoverable amount of the Geomechanics CGU exceeds its carrying value by 10.7%. An impairment would be recognised if the growth rate fell below 1.3% or the discount rate was increased to 18.0%.
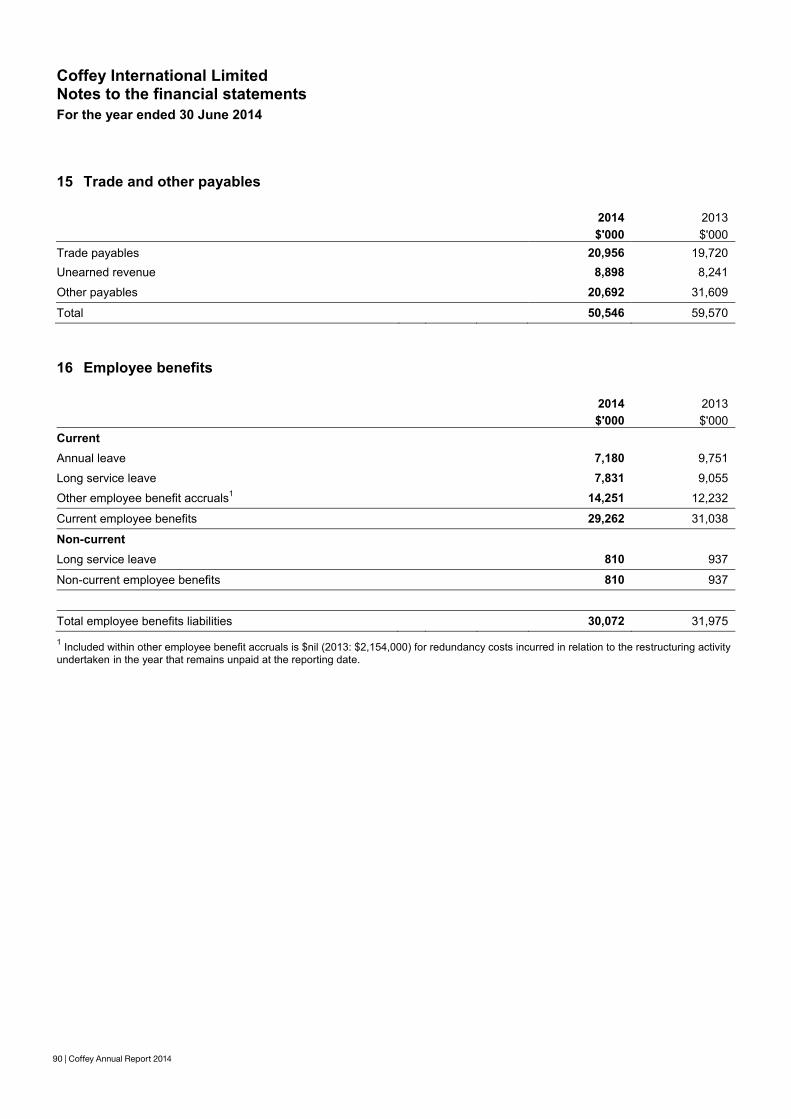
90 | Coffey Annual Report 2014
Coffey International Limited Notes to the financial statements For the year ended 30 June 2014
90 | Coffey Annual Report 2014
15 Trade and other payables
2014 2013 $'000 $'000
Trade payables 20,956 19,720 Unearned revenue 8,898 8,241
Other payables 20,692 31,609
Total 50,546 59,570
16 Employee benefits
2014 2013 $'000 $'000
Current
Annual leave 7,180 9,751
Long service leave 7,831 9,055
Other employee benefit accruals1 14,251 12,232
Current employee benefits 29,262 31,038
Non-current
Long service leave 810 937
Non-current employee benefits 810 937
Total employee benefits liabilities 30,072 31,975 1 Included within other employee benefit accruals is $nil (2013: $2,154,000) for redundancy costs incurred in relation to the restructuring activity undertaken in the year that remains unpaid at the reporting date.
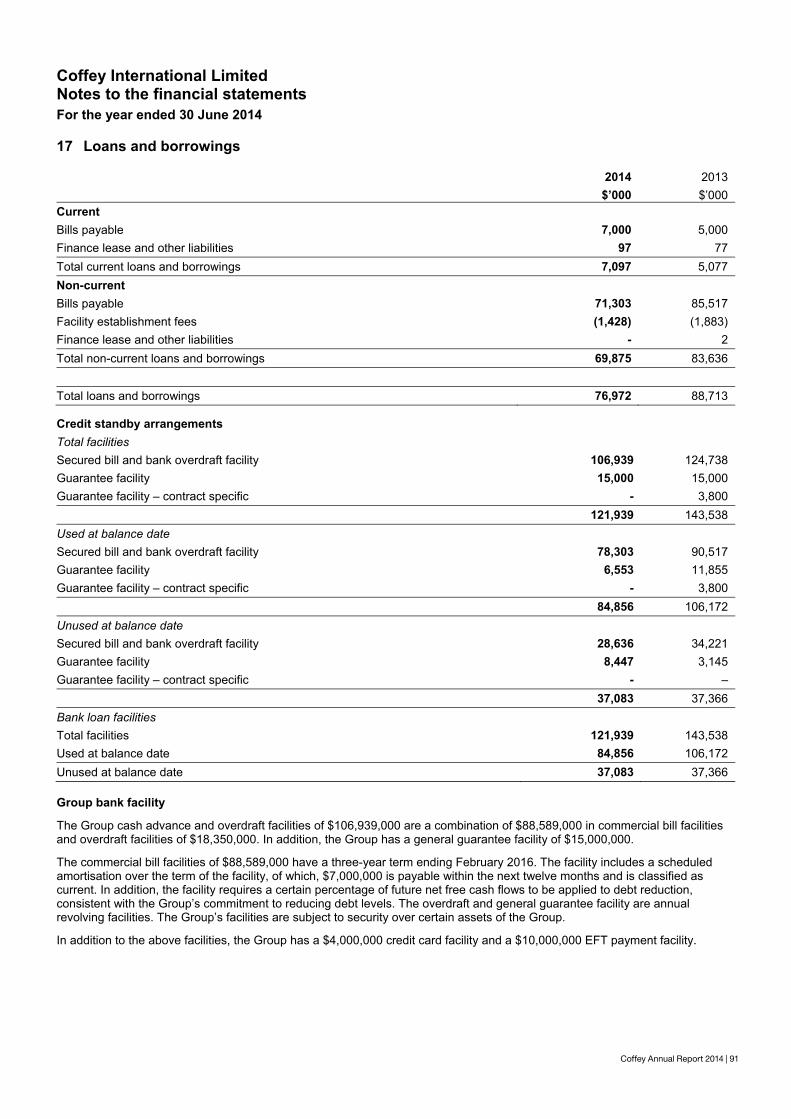
Coffey Annual Report 2014 | 91
Coffey International Limited Notes to the financial statements For the year ended 30 June 2014
90 | Coffey Annual Report 2014
15 Trade and other payables
2014 2013 $'000 $'000
Trade payables 20,956 19,720 Unearned revenue 8,898 8,241
Other payables 20,692 31,609
Total 50,546 59,570
16 Employee benefits
2014 2013 $'000 $'000
Current
Annual leave 7,180 9,751
Long service leave 7,831 9,055
Other employee benefit accruals1 14,251 12,232
Current employee benefits 29,262 31,038
Non-current
Long service leave 810 937
Non-current employee benefits 810 937
Total employee benefits liabilities 30,072 31,975 1 Included within other employee benefit accruals is $nil (2013: $2,154,000) for redundancy costs incurred in relation to the restructuring activity undertaken in the year that remains unpaid at the reporting date.
Coffey International Limited Notes to the financial statements For the year ended 30 June 2014
Coffey Annual Report 2014 | 91
17 Loans and borrowings
Credit standby arrangements Total facilities Secured bill and bank overdraft facility 106,939 124,738 Guarantee facility 15,000 15,000 Guarantee facility – contract specific - 3,800
121,939 143,538 Used at balance date Secured bill and bank overdraft facility 78,303 90,517 Guarantee facility 6,553 11,855 Guarantee facility – contract specific - 3,800
84,856 106,172 Unused at balance date Secured bill and bank overdraft facility 28,636 34,221 Guarantee facility 8,447 3,145 Guarantee facility – contract specific - –
37,083 37,366 Bank loan facilities Total facilities 121,939 143,538 Used at balance date 84,856 106,172 Unused at balance date 37,083 37,366 Group bank facility The Group cash advance and overdraft facilities of $106,939,000 are a combination of $88,589,000 in commercial bill facilities and overdraft facilities of $18,350,000. In addition, the Group has a general guarantee facility of $15,000,000. The commercial bill facilities of $88,589,000 have a three-year term ending February 2016. The facility includes a scheduled amortisation over the term of the facility, of which, $7,000,000 is payable within the next twelve months and is classified as current. In addition, the facility requires a certain percentage of future net free cash flows to be applied to debt reduction, consistent with the Group’s commitment to reducing debt levels. The overdraft and general guarantee facility are annual revolving facilities. The Group’s facilities are subject to security over certain assets of the Group. In addition to the above facilities, the Group has a $4,000,000 credit card facility and a $10,000,000 EFT payment facility.
2014 2013 $’000 $’000
Current Bills payable 7,000 5,000 Finance lease and other liabilities 97 77 Total current loans and borrowings 7,097 5,077 Non-current Bills payable 71,303 85,517 Facility establishment fees (1,428) (1,883) Finance lease and other liabilities - 2 Total non-current loans and borrowings 69,875 83,636
Total loans and borrowings 76,972 88,713
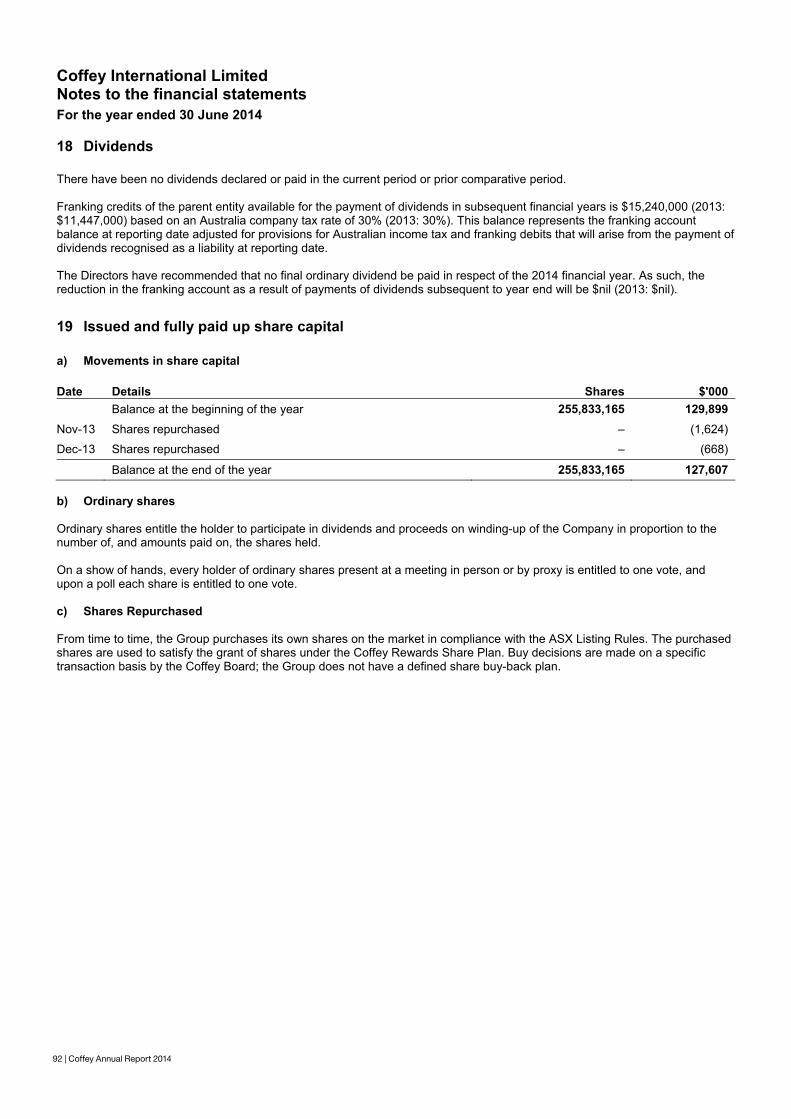
92 | Coffey Annual Report 2014
Coffey International Limited Notes to the financial statements For the year ended 30 June 2014
92 | Coffey Annual Report 2014
18 Dividends There have been no dividends declared or paid in the current period or prior comparative period. Franking credits of the parent entity available for the payment of dividends in subsequent financial years is $15,240,000 (2013: $11,447,000) based on an Australia company tax rate of 30% (2013: 30%). This balance represents the franking account balance at reporting date adjusted for provisions for Australian income tax and franking debits that will arise from the payment of dividends recognised as a liability at reporting date. The Directors have recommended that no final ordinary dividend be paid in respect of the 2014 financial year. As such, the reduction in the franking account as a result of payments of dividends subsequent to year end will be $nil (2013: $nil).
19 Issued and fully paid up share capital a) Movements in share capital Date Details Shares $'000 Balance at the beginning of the year 255,833,165 129,899 Nov-13 Shares repurchased – (1,624)
Dec-13 Shares repurchased – (668)
Balance at the end of the year 255,833,165 127,607 b) Ordinary shares Ordinary shares entitle the holder to participate in dividends and proceeds on winding-up of the Company in proportion to the number of, and amounts paid on, the shares held. On a show of hands, every holder of ordinary shares present at a meeting in person or by proxy is entitled to one vote, and upon a poll each share is entitled to one vote. c) Shares Repurchased From time to time, the Group purchases its own shares on the market in compliance with the ASX Listing Rules. The purchased shares are used to satisfy the grant of shares under the Coffey Rewards Share Plan. Buy decisions are made on a specific transaction basis by the Coffey Board; the Group does not have a defined share buy-back plan.
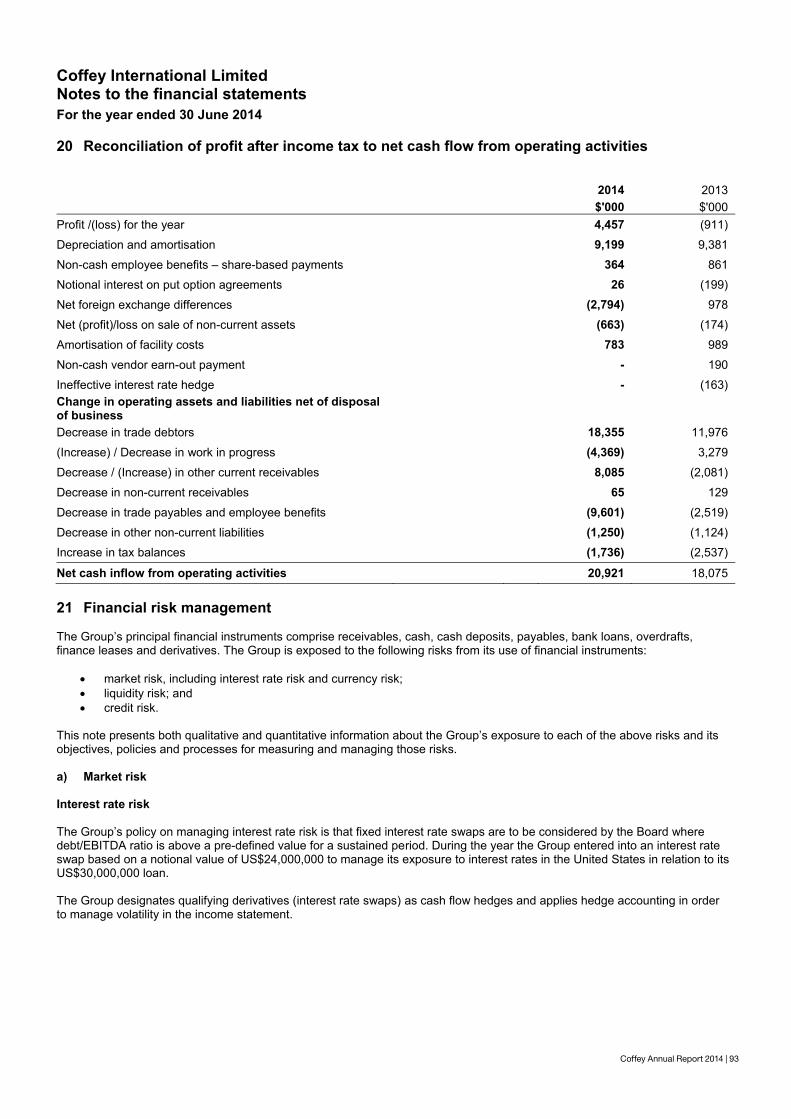
Coffey Annual Report 2014 | 93
Coffey International Limited Notes to the financial statements For the year ended 30 June 2014
Coffey Annual Report 2014 | 93
20 Reconciliation of profit after income tax to net cash flow from operating activities
2014 2013 $'000 $'000
Profit /(loss) for the year 4,457 (911)
Depreciation and amortisation 9,199 9,381
Non-cash employee benefits – share-based payments 364 861
Notional interest on put option agreements 26 (199)
Net foreign exchange differences (2,794) 978
Net (profit)/loss on sale of non-current assets (663) (174)
Amortisation of facility costs 783 989
Non-cash vendor earn-out payment - 190
Ineffective interest rate hedge - (163) Change in operating assets and liabilities net of disposal of business
Decrease in trade debtors 18,355 11,976
(Increase) / Decrease in work in progress (4,369) 3,279
Decrease / (Increase) in other current receivables 8,085 (2,081)
Decrease in non-current receivables 65 129
Decrease in trade payables and employee benefits (9,601) (2,519)
Decrease in other non-current liabilities (1,250) (1,124)
Increase in tax balances (1,736) (2,537)
Net cash inflow from operating activities 20,921 18,075 21 Financial risk management The Group’s principal financial instruments comprise receivables, cash, cash deposits, payables, bank loans, overdrafts, finance leases and derivatives. The Group is exposed to the following risks from its use of financial instruments:
market risk, including interest rate risk and currency risk; liquidity risk; and credit risk.
This note presents both qualitative and quantitative information about the Group’s exposure to each of the above risks and its objectives, policies and processes for measuring and managing those risks. a) Market risk Interest rate risk The Group’s policy on managing interest rate risk is that fixed interest rate swaps are to be considered by the Board where debt/EBITDA ratio is above a pre-defined value for a sustained period. During the year the Group entered into an interest rate swap based on a notional value of US$24,000,000 to manage its exposure to interest rates in the United States in relation to its US$30,000,000 loan. The Group designates qualifying derivatives (interest rate swaps) as cash flow hedges and applies hedge accounting in order to manage volatility in the income statement.
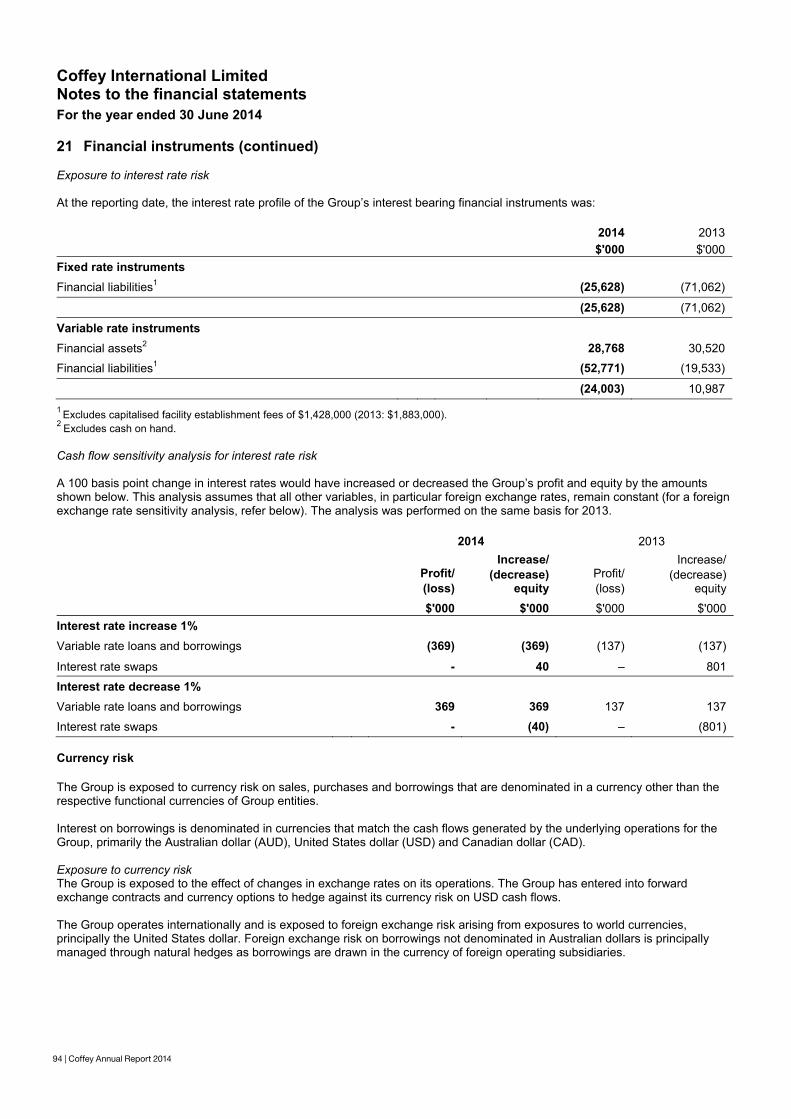
94 | Coffey Annual Report 2014
Coffey International Limited Notes to the financial statements For the year ended 30 June 2014
94 | Coffey Annual Report 2014
21 Financial instruments (continued)
Exposure to interest rate risk At the reporting date, the interest rate profile of the Group’s interest bearing financial instruments was:
2014 2013 $'000 $'000
Fixed rate instruments
Financial liabilities1 (25,628) (71,062)
(25,628) (71,062)
Variable rate instruments
Financial assets2 28,768 30,520
Financial liabilities1 (52,771) (19,533)
(24,003) 10,987 1 Excludes capitalised facility establishment fees of $1,428,000 (2013: $1,883,000). 2 Excludes cash on hand. Cash flow sensitivity analysis for interest rate risk A 100 basis point change in interest rates would have increased or decreased the Group’s profit and equity by the amounts shown below. This analysis assumes that all other variables, in particular foreign exchange rates, remain constant (for a foreign exchange rate sensitivity analysis, refer below). The analysis was performed on the same basis for 2013.
2014 2013
Profit/ (loss)
Increase/ (decrease)
equity Profit/ (loss)
Increase/ (decrease)
equity
$'000 $'000 $'000 $'000 Interest rate increase 1% Variable rate loans and borrowings (369) (369) (137) (137)
Interest rate swaps - 40 – 801
Interest rate decrease 1% Variable rate loans and borrowings 369 369 137 137
Interest rate swaps - (40) – (801) Currency risk The Group is exposed to currency risk on sales, purchases and borrowings that are denominated in a currency other than the respective functional currencies of Group entities. Interest on borrowings is denominated in currencies that match the cash flows generated by the underlying operations for the Group, primarily the Australian dollar (AUD), United States dollar (USD) and Canadian dollar (CAD). Exposure to currency risk The Group is exposed to the effect of changes in exchange rates on its operations. The Group has entered into forward exchange contracts and currency options to hedge against its currency risk on USD cash flows. The Group operates internationally and is exposed to foreign exchange risk arising from exposures to world currencies, principally the United States dollar. Foreign exchange risk on borrowings not denominated in Australian dollars is principally managed through natural hedges as borrowings are drawn in the currency of foreign operating subsidiaries.
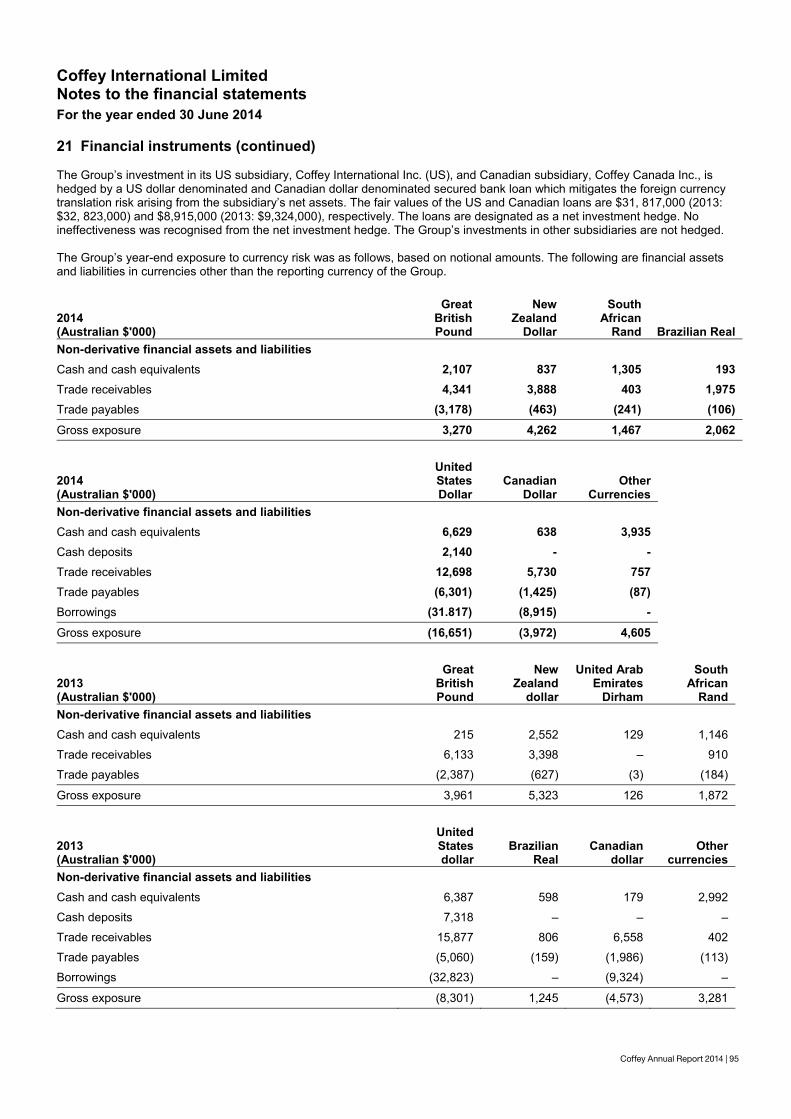
Coffey Annual Report 2014 | 95
Coffey International Limited Notes to the financial statements For the year ended 30 June 2014
Coffey Annual Report 2014 | 95
21 Financial instruments (continued) The Group’s investment in its US subsidiary, Coffey International Inc. (US), and Canadian subsidiary, Coffey Canada Inc., is hedged by a US dollar denominated and Canadian dollar denominated secured bank loan which mitigates the foreign currency translation risk arising from the subsidiary’s net assets. The fair values of the US and Canadian loans are $31, 817,000 (2013: $32, 823,000) and $8,915,000 (2013: $9,324,000), respectively. The loans are designated as a net investment hedge. No ineffectiveness was recognised from the net investment hedge. The Group’s investments in other subsidiaries are not hedged. The Group’s year-end exposure to currency risk was as follows, based on notional amounts. The following are financial assets and liabilities in currencies other than the reporting currency of the Group.
2014 (Australian $'000)
Great British Pound
NewZealand
Dollar
South African
Rand Brazilian Real Non-derivative financial assets and liabilities Cash and cash equivalents 2,107 837 1,305 193 Trade receivables 4,341 3,888 403 1,975 Trade payables (3,178) (463) (241) (106) Gross exposure 3,270 4,262 1,467 2,062
2014 (Australian $'000)
United States Dollar
Canadian Dollar
Other Currencies
Non-derivative financial assets and liabilities Cash and cash equivalents 6,629 638 3,935 Cash deposits 2,140 - - Trade receivables 12,698 5,730 757 Trade payables (6,301) (1,425) (87) Borrowings (31.817) (8,915) - Gross exposure (16,651) (3,972) 4,605
2013 (Australian $'000)
Great British Pound
New Zealand
dollar
United Arab Emirates
Dirham
SouthAfrican
Rand Non-derivative financial assets and liabilities
Cash and cash equivalents 215 2,552 129 1,146
Trade receivables 6,133 3,398 – 910
Trade payables (2,387) (627) (3) (184)
Gross exposure 3,961 5,323 126 1,872
2013 (Australian $'000)
United States dollar
Brazilian Real
Canadian dollar
Other currencies
Non-derivative financial assets and liabilities Cash and cash equivalents 6,387 598 179 2,992
Cash deposits 7,318 – – –
Trade receivables 15,877 806 6,558 402
Trade payables (5,060) (159) (1,986) (113)
Borrowings (32,823) – (9,324) –
Gross exposure (8,301) 1,245 (4,573) 3,281
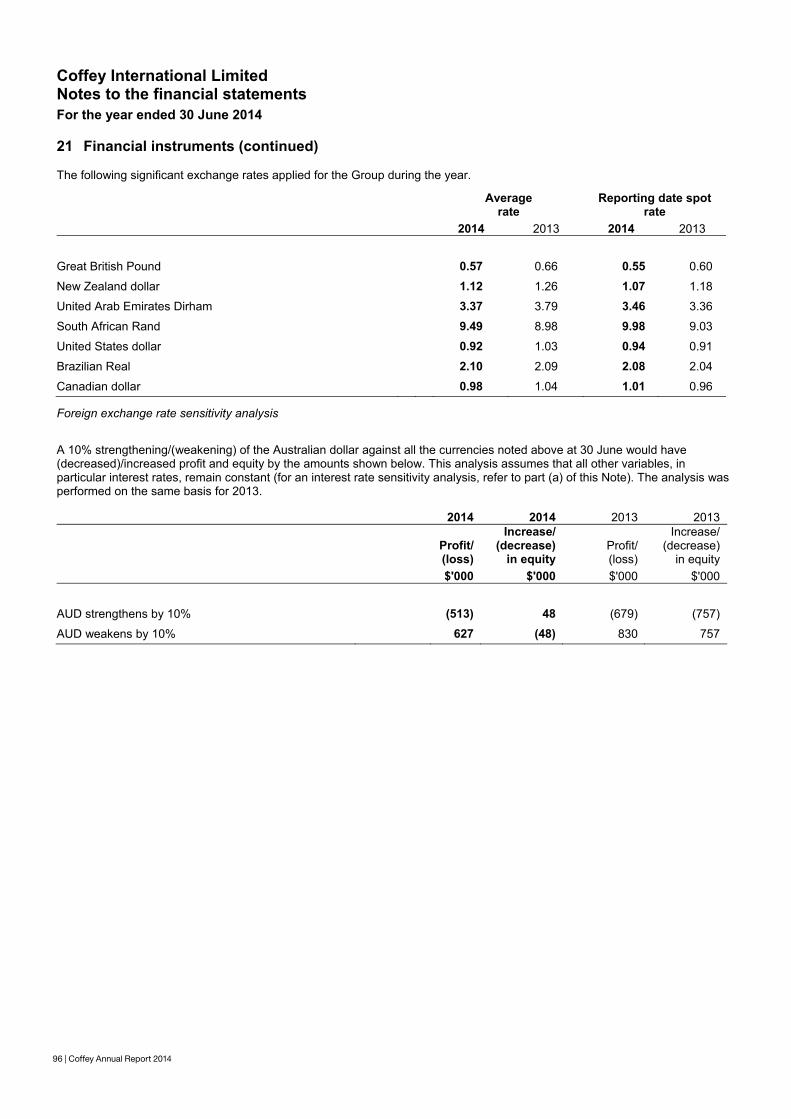
96 | Coffey Annual Report 2014
Coffey International Limited Notes to the financial statements For the year ended 30 June 2014
96 | Coffey Annual Report 2014
21 Financial instruments (continued) The following significant exchange rates applied for the Group during the year.
Averagerate
Reporting date spot rate
2014 2013 2014 2013
Great British Pound 0.57 0.66 0.55 0.60
New Zealand dollar 1.12 1.26 1.07 1.18
United Arab Emirates Dirham 3.37 3.79 3.46 3.36
South African Rand 9.49 8.98 9.98 9.03
United States dollar 0.92 1.03 0.94 0.91
Brazilian Real 2.10 2.09 2.08 2.04
Canadian dollar 0.98 1.04 1.01 0.96 Foreign exchange rate sensitivity analysis A 10% strengthening/(weakening) of the Australian dollar against all the currencies noted above at 30 June would have (decreased)/increased profit and equity by the amounts shown below. This analysis assumes that all other variables, in particular interest rates, remain constant (for an interest rate sensitivity analysis, refer to part (a) of this Note). The analysis was performed on the same basis for 2013.
2014 2014 2013 2013
Profit/(loss)
Increase/(decrease)
in equity Profit/ (loss)
Increase/(decrease)
in equity $'000 $'000 $'000 $'000
AUD strengthens by 10% (513) 48 (679) (757)
AUD weakens by 10% 627 (48) 830 757
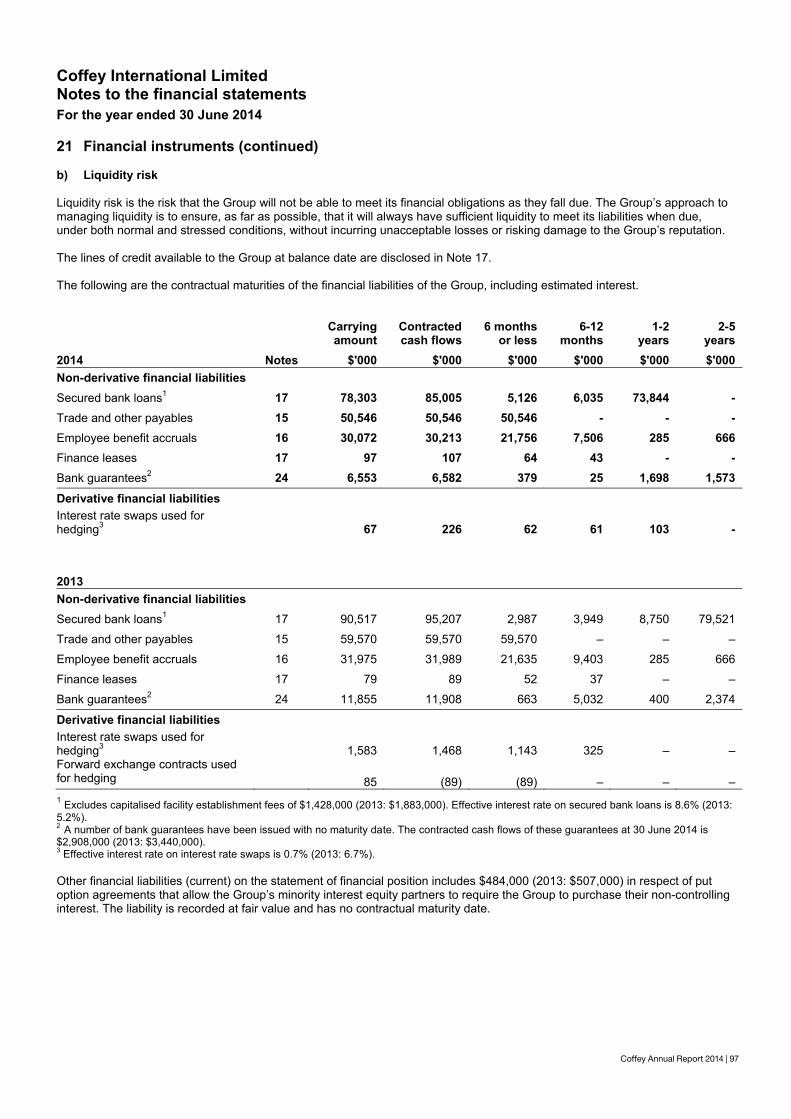
Coffey Annual Report 2014 | 97
Coffey International Limited Notes to the financial statements For the year ended 30 June 2014
96 | Coffey Annual Report 2014
21 Financial instruments (continued) The following significant exchange rates applied for the Group during the year.
Averagerate
Reporting date spot rate
2014 2013 2014 2013
Great British Pound 0.57 0.66 0.55 0.60
New Zealand dollar 1.12 1.26 1.07 1.18
United Arab Emirates Dirham 3.37 3.79 3.46 3.36
South African Rand 9.49 8.98 9.98 9.03
United States dollar 0.92 1.03 0.94 0.91
Brazilian Real 2.10 2.09 2.08 2.04
Canadian dollar 0.98 1.04 1.01 0.96 Foreign exchange rate sensitivity analysis A 10% strengthening/(weakening) of the Australian dollar against all the currencies noted above at 30 June would have (decreased)/increased profit and equity by the amounts shown below. This analysis assumes that all other variables, in particular interest rates, remain constant (for an interest rate sensitivity analysis, refer to part (a) of this Note). The analysis was performed on the same basis for 2013.
2014 2014 2013 2013
Profit/(loss)
Increase/(decrease)
in equity Profit/ (loss)
Increase/(decrease)
in equity $'000 $'000 $'000 $'000
AUD strengthens by 10% (513) 48 (679) (757)
AUD weakens by 10% 627 (48) 830 757
Coffey International Limited Notes to the financial statements For the year ended 30 June 2014
Coffey Annual Report 2014 | 97
21 Financial instruments (continued) b) Liquidity risk Liquidity risk is the risk that the Group will not be able to meet its financial obligations as they fall due. The Group’s approach to managing liquidity is to ensure, as far as possible, that it will always have sufficient liquidity to meet its liabilities when due, under both normal and stressed conditions, without incurring unacceptable losses or risking damage to the Group’s reputation. The lines of credit available to the Group at balance date are disclosed in Note 17. The following are the contractual maturities of the financial liabilities of the Group, including estimated interest.
Carrying amount
Contractedcash flows
6 monthsor less
6-12 months
1-2 years
2-5years
2014 Notes $'000 $'000 $'000 $'000 $'000 $'000 Non-derivative financial liabilities Secured bank loans1 17 78,303 85,005 5,126 6,035 73,844 - Trade and other payables 15 50,546 50,546 50,546 - - - Employee benefit accruals 16 30,072 30,213 21,756 7,506 285 666 Finance leases 17 97 107 64 43 - - Bank guarantees2 24 6,553 6,582 379 25 1,698 1,573 Derivative financial liabilities Interest rate swaps used for hedging3 67 226 62 61 103 -
2013 Non-derivative financial liabilities
Secured bank loans1 17 90,517 95,207 2,987 3,949 8,750 79,521
Trade and other payables 15 59,570 59,570 59,570 – – –
Employee benefit accruals 16 31,975 31,989 21,635 9,403 285 666
Finance leases 17 79 89 52 37 – –
Bank guarantees2 24 11,855 11,908 663 5,032 400 2,374
Derivative financial liabilities Interest rate swaps used for hedging3 1,583 1,468 1,143 325 – – Forward exchange contracts used for hedging 85 (89) (89) – – – 1 Excludes capitalised facility establishment fees of $1,428,000 (2013: $1,883,000). Effective interest rate on secured bank loans is 8.6% (2013: 5.2%). 2 A number of bank guarantees have been issued with no maturity date. The contracted cash flows of these guarantees at 30 June 2014 is $2,908,000 (2013: $3,440,000). 3 Effective interest rate on interest rate swaps is 0.7% (2013: 6.7%). Other financial liabilities (current) on the statement of financial position includes $484,000 (2013: $507,000) in respect of put option agreements that allow the Group’s minority interest equity partners to require the Group to purchase their non-controlling interest. The liability is recorded at fair value and has no contractual maturity date.
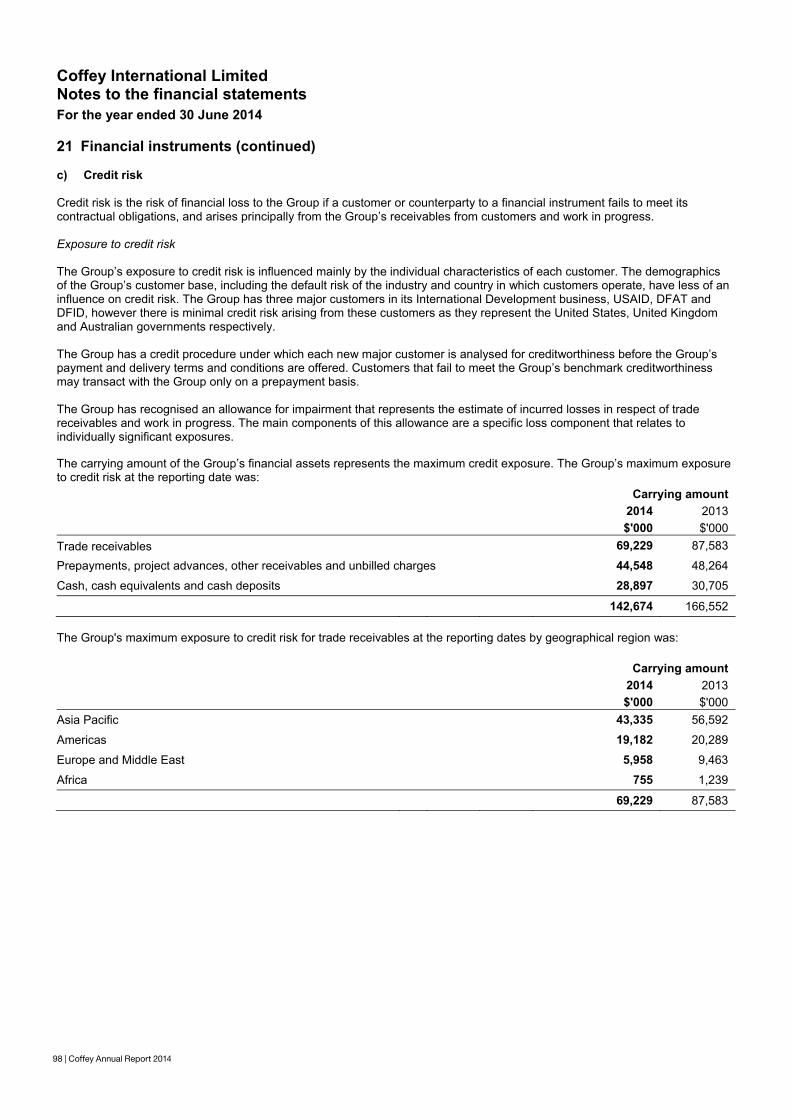
98 | Coffey Annual Report 2014
Coffey International Limited Notes to the financial statements For the year ended 30 June 2014
98 | Coffey Annual Report 2014
21 Financial instruments (continued) c) Credit risk Credit risk is the risk of financial loss to the Group if a customer or counterparty to a financial instrument fails to meet its contractual obligations, and arises principally from the Group’s receivables from customers and work in progress.
Exposure to credit risk The Group’s exposure to credit risk is influenced mainly by the individual characteristics of each customer. The demographics of the Group’s customer base, including the default risk of the industry and country in which customers operate, have less of an influence on credit risk. The Group has three major customers in its International Development business, USAID, DFAT and DFID, however there is minimal credit risk arising from these customers as they represent the United States, United Kingdom and Australian governments respectively. The Group has a credit procedure under which each new major customer is analysed for creditworthiness before the Group’s payment and delivery terms and conditions are offered. Customers that fail to meet the Group’s benchmark creditworthiness may transact with the Group only on a prepayment basis. The Group has recognised an allowance for impairment that represents the estimate of incurred losses in respect of trade receivables and work in progress. The main components of this allowance are a specific loss component that relates to individually significant exposures. The carrying amount of the Group’s financial assets represents the maximum credit exposure. The Group’s maximum exposure to credit risk at the reporting date was:
Carrying amount 2014 2013 $'000 $'000
Trade receivables 69,229 87,583
Prepayments, project advances, other receivables and unbilled charges 44,548 48,264
Cash, cash equivalents and cash deposits 28,897 30,705
142,674 166,552
The Group's maximum exposure to credit risk for trade receivables at the reporting dates by geographical region was:
Carrying amount 2014 2013 $'000 $'000
Asia Pacific 43,335 56,592
Americas 19,182 20,289
Europe and Middle East 5,958 9,463
Africa 755 1,239
69,229 87,583
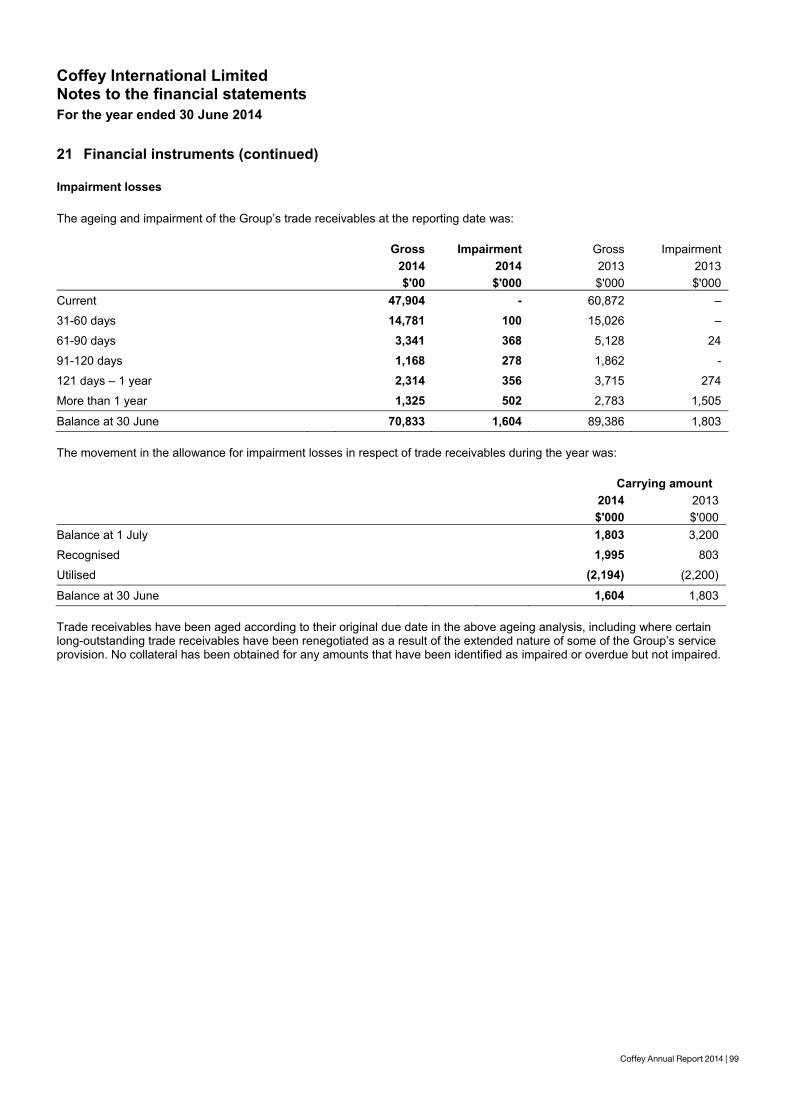
Coffey Annual Report 2014 | 99
Coffey International Limited Notes to the financial statements For the year ended 30 June 2014
98 | Coffey Annual Report 2014
21 Financial instruments (continued) c) Credit risk Credit risk is the risk of financial loss to the Group if a customer or counterparty to a financial instrument fails to meet its contractual obligations, and arises principally from the Group’s receivables from customers and work in progress.
Exposure to credit risk The Group’s exposure to credit risk is influenced mainly by the individual characteristics of each customer. The demographics of the Group’s customer base, including the default risk of the industry and country in which customers operate, have less of an influence on credit risk. The Group has three major customers in its International Development business, USAID, DFAT and DFID, however there is minimal credit risk arising from these customers as they represent the United States, United Kingdom and Australian governments respectively. The Group has a credit procedure under which each new major customer is analysed for creditworthiness before the Group’s payment and delivery terms and conditions are offered. Customers that fail to meet the Group’s benchmark creditworthiness may transact with the Group only on a prepayment basis. The Group has recognised an allowance for impairment that represents the estimate of incurred losses in respect of trade receivables and work in progress. The main components of this allowance are a specific loss component that relates to individually significant exposures. The carrying amount of the Group’s financial assets represents the maximum credit exposure. The Group’s maximum exposure to credit risk at the reporting date was:
Carrying amount 2014 2013 $'000 $'000
Trade receivables 69,229 87,583
Prepayments, project advances, other receivables and unbilled charges 44,548 48,264
Cash, cash equivalents and cash deposits 28,897 30,705
142,674 166,552
The Group's maximum exposure to credit risk for trade receivables at the reporting dates by geographical region was:
Carrying amount 2014 2013 $'000 $'000
Asia Pacific 43,335 56,592
Americas 19,182 20,289
Europe and Middle East 5,958 9,463
Africa 755 1,239
69,229 87,583
Coffey International Limited Notes to the financial statements For the year ended 30 June 2014
Coffey Annual Report 2014 | 99
21 Financial instruments (continued) Impairment losses The ageing and impairment of the Group’s trade receivables at the reporting date was:
Gross Impairment Gross Impairment 2014 2014 2013 2013 $'00 $'000 $'000 $'000
Current 47,904 - 60,872 –
31-60 days 14,781 100 15,026 –
61-90 days 3,341 368 5,128 24
91-120 days 1,168 278 1,862 -
121 days – 1 year 2,314 356 3,715 274
More than 1 year 1,325 502 2,783 1,505
Balance at 30 June 70,833 1,604 89,386 1,803 The movement in the allowance for impairment losses in respect of trade receivables during the year was:
Carrying amount 2014 2013 $'000 $'000
Balance at 1 July 1,803 3,200
Recognised 1,995 803
Utilised (2,194) (2,200)
Balance at 30 June 1,604 1,803 Trade receivables have been aged according to their original due date in the above ageing analysis, including where certain long-outstanding trade receivables have been renegotiated as a result of the extended nature of some of the Group’s service provision. No collateral has been obtained for any amounts that have been identified as impaired or overdue but not impaired.
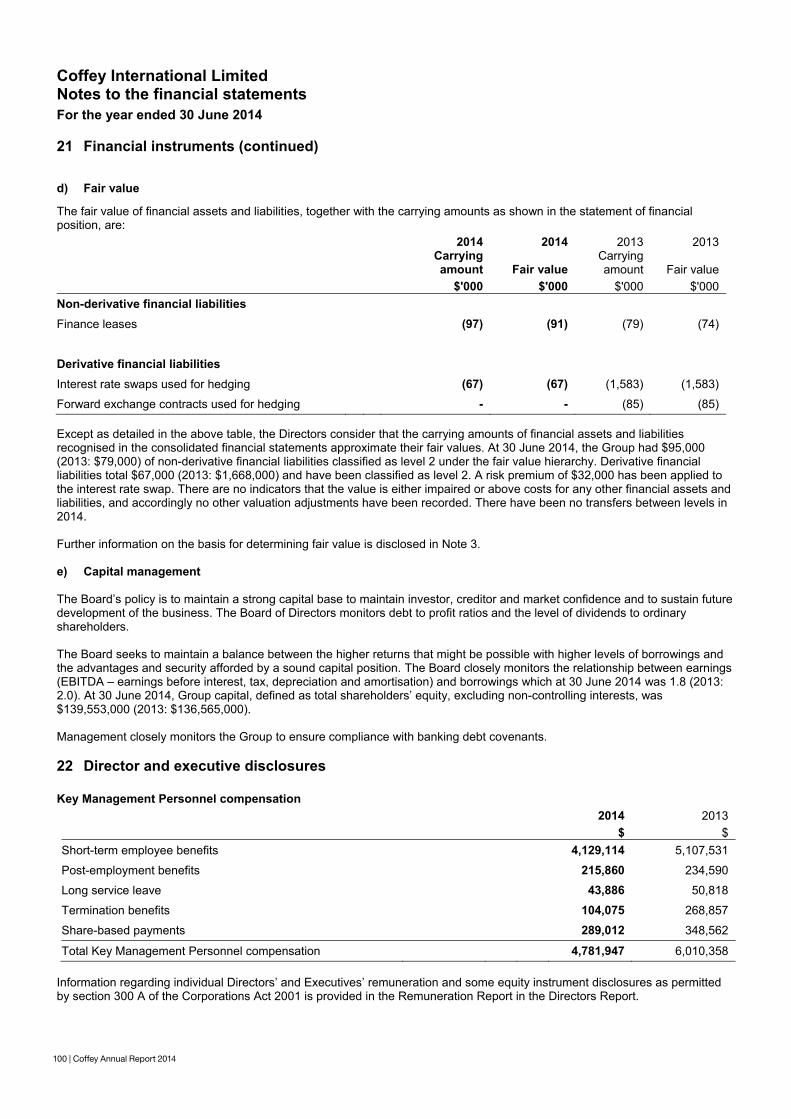
100 | Coffey Annual Report 2014
Coffey International Limited Notes to the financial statements For the year ended 30 June 2014
100 | Coffey Annual Report 2014
21 Financial instruments (continued) d) Fair value The fair value of financial assets and liabilities, together with the carrying amounts as shown in the statement of financial position, are:
2014 2014 2013 2013
Carryingamount Fair value
Carrying amount Fair value
$'000 $'000 $'000 $'000 Non-derivative financial liabilities
Finance leases (97) (91) (79) (74)
Derivative financial liabilities
Interest rate swaps used for hedging (67) (67) (1,583) (1,583)
Forward exchange contracts used for hedging - - (85) (85) Except as detailed in the above table, the Directors consider that the carrying amounts of financial assets and liabilities recognised in the consolidated financial statements approximate their fair values. At 30 June 2014, the Group had $95,000 (2013: $79,000) of non-derivative financial liabilities classified as level 2 under the fair value hierarchy. Derivative financial liabilities total $67,000 (2013: $1,668,000) and have been classified as level 2. A risk premium of $32,000 has been applied to the interest rate swap. There are no indicators that the value is either impaired or above costs for any other financial assets and liabilities, and accordingly no other valuation adjustments have been recorded. There have been no transfers between levels in 2014. Further information on the basis for determining fair value is disclosed in Note 3. e) Capital management The Board’s policy is to maintain a strong capital base to maintain investor, creditor and market confidence and to sustain future development of the business. The Board of Directors monitors debt to profit ratios and the level of dividends to ordinary shareholders.
The Board seeks to maintain a balance between the higher returns that might be possible with higher levels of borrowings and the advantages and security afforded by a sound capital position. The Board closely monitors the relationship between earnings (EBITDA – earnings before interest, tax, depreciation and amortisation) and borrowings which at 30 June 2014 was 1.8 (2013: 2.0). At 30 June 2014, Group capital, defined as total shareholders’ equity, excluding non-controlling interests, was $139,553,000 (2013: $136,565,000). Management closely monitors the Group to ensure compliance with banking debt covenants. 22 Director and executive disclosures Key Management Personnel compensation
2014 2013 $ $
Short-term employee benefits 4,129,114 5,107,531
Post-employment benefits 215,860 234,590
Long service leave 43,886 50,818
Termination benefits 104,075 268,857
Share-based payments 289,012 348,562
Total Key Management Personnel compensation 4,781,947 6,010,358 Information regarding individual Directors’ and Executives’ remuneration and some equity instrument disclosures as permitted by section 300 A of the Corporations Act 2001 is provided in the Remuneration Report in the Directors Report.
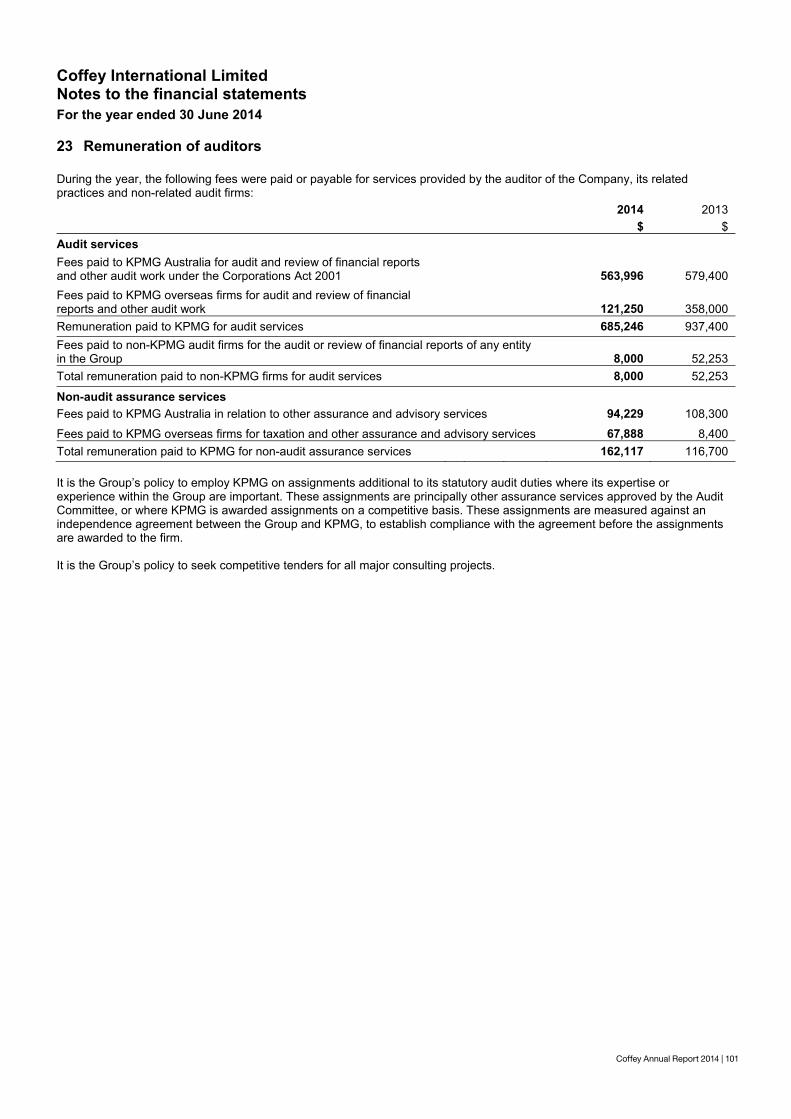
Coffey Annual Report 2014 | 101
Coffey International Limited Notes to the financial statements For the year ended 30 June 2014
100 | Coffey Annual Report 2014
21 Financial instruments (continued) d) Fair value The fair value of financial assets and liabilities, together with the carrying amounts as shown in the statement of financial position, are:
2014 2014 2013 2013
Carryingamount Fair value
Carrying amount Fair value
$'000 $'000 $'000 $'000 Non-derivative financial liabilities
Finance leases (97) (91) (79) (74)
Derivative financial liabilities
Interest rate swaps used for hedging (67) (67) (1,583) (1,583)
Forward exchange contracts used for hedging - - (85) (85) Except as detailed in the above table, the Directors consider that the carrying amounts of financial assets and liabilities recognised in the consolidated financial statements approximate their fair values. At 30 June 2014, the Group had $95,000 (2013: $79,000) of non-derivative financial liabilities classified as level 2 under the fair value hierarchy. Derivative financial liabilities total $67,000 (2013: $1,668,000) and have been classified as level 2. A risk premium of $32,000 has been applied to the interest rate swap. There are no indicators that the value is either impaired or above costs for any other financial assets and liabilities, and accordingly no other valuation adjustments have been recorded. There have been no transfers between levels in 2014. Further information on the basis for determining fair value is disclosed in Note 3. e) Capital management The Board’s policy is to maintain a strong capital base to maintain investor, creditor and market confidence and to sustain future development of the business. The Board of Directors monitors debt to profit ratios and the level of dividends to ordinary shareholders.
The Board seeks to maintain a balance between the higher returns that might be possible with higher levels of borrowings and the advantages and security afforded by a sound capital position. The Board closely monitors the relationship between earnings (EBITDA – earnings before interest, tax, depreciation and amortisation) and borrowings which at 30 June 2014 was 1.8 (2013: 2.0). At 30 June 2014, Group capital, defined as total shareholders’ equity, excluding non-controlling interests, was $139,553,000 (2013: $136,565,000). Management closely monitors the Group to ensure compliance with banking debt covenants. 22 Director and executive disclosures Key Management Personnel compensation
2014 2013 $ $
Short-term employee benefits 4,129,114 5,107,531
Post-employment benefits 215,860 234,590
Long service leave 43,886 50,818
Termination benefits 104,075 268,857
Share-based payments 289,012 348,562
Total Key Management Personnel compensation 4,781,947 6,010,358 Information regarding individual Directors’ and Executives’ remuneration and some equity instrument disclosures as permitted by section 300 A of the Corporations Act 2001 is provided in the Remuneration Report in the Directors Report.
Coffey International Limited Notes to the financial statements For the year ended 30 June 2014
Coffey Annual Report 2014 | 101
23 Remuneration of auditors During the year, the following fees were paid or payable for services provided by the auditor of the Company, its related practices and non-related audit firms:
2014 2013 $ $
Audit services Fees paid to KPMG Australia for audit and review of financial reports and other audit work under the Corporations Act 2001 563,996 579,400 Fees paid to KPMG overseas firms for audit and review of financial reports and other audit work 121,250 358,000 Remuneration paid to KPMG for audit services 685,246 937,400 Fees paid to non-KPMG audit firms for the audit or review of financial reports of any entity in the Group 8,000 52,253 Total remuneration paid to non-KPMG firms for audit services 8,000 52,253
Non-audit assurance services Fees paid to KPMG Australia in relation to other assurance and advisory services 94,229 108,300
Fees paid to KPMG overseas firms for taxation and other assurance and advisory services 67,888 8,400 Total remuneration paid to KPMG for non-audit assurance services 162,117 116,700 It is the Group’s policy to employ KPMG on assignments additional to its statutory audit duties where its expertise or experience within the Group are important. These assignments are principally other assurance services approved by the Audit Committee, or where KPMG is awarded assignments on a competitive basis. These assignments are measured against an independence agreement between the Group and KPMG, to establish compliance with the agreement before the assignments are awarded to the firm. It is the Group’s policy to seek competitive tenders for all major consulting projects.
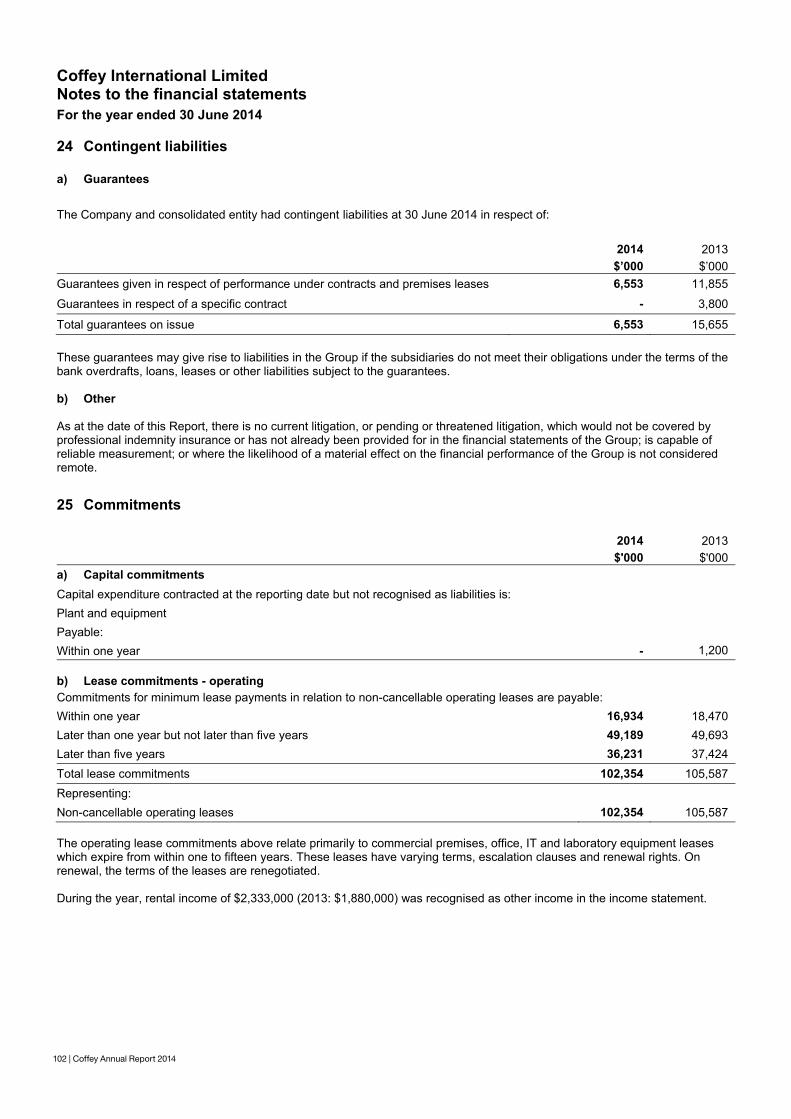
102 | Coffey Annual Report 2014
Coffey International Limited Notes to the financial statements For the year ended 30 June 2014
102 | Coffey Annual Report 2014
24 Contingent liabilities a) Guarantees The Company and consolidated entity had contingent liabilities at 30 June 2014 in respect of:
2014 2013 $’000 $’000
Guarantees given in respect of performance under contracts and premises leases 6,553 11,855
Guarantees in respect of a specific contract - 3,800
Total guarantees on issue 6,553 15,655 These guarantees may give rise to liabilities in the Group if the subsidiaries do not meet their obligations under the terms of the bank overdrafts, loans, leases or other liabilities subject to the guarantees. b) Other As at the date of this Report, there is no current litigation, or pending or threatened litigation, which would not be covered by professional indemnity insurance or has not already been provided for in the financial statements of the Group; is capable of reliable measurement; or where the likelihood of a material effect on the financial performance of the Group is not considered remote.
25 Commitments
2014 2013 $'000 $'000
a) Capital commitments Capital expenditure contracted at the reporting date but not recognised as liabilities is: Plant and equipment Payable: Within one year - 1,200 b) Lease commitments - operating Commitments for minimum lease payments in relation to non-cancellable operating leases are payable: Within one year 16,934 18,470 Later than one year but not later than five years 49,189 49,693 Later than five years 36,231 37,424 Total lease commitments 102,354 105,587 Representing: Non-cancellable operating leases 102,354 105,587 The operating lease commitments above relate primarily to commercial premises, office, IT and laboratory equipment leases which expire from within one to fifteen years. These leases have varying terms, escalation clauses and renewal rights. On renewal, the terms of the leases are renegotiated. During the year, rental income of $2,333,000 (2013: $1,880,000) was recognised as other income in the income statement.
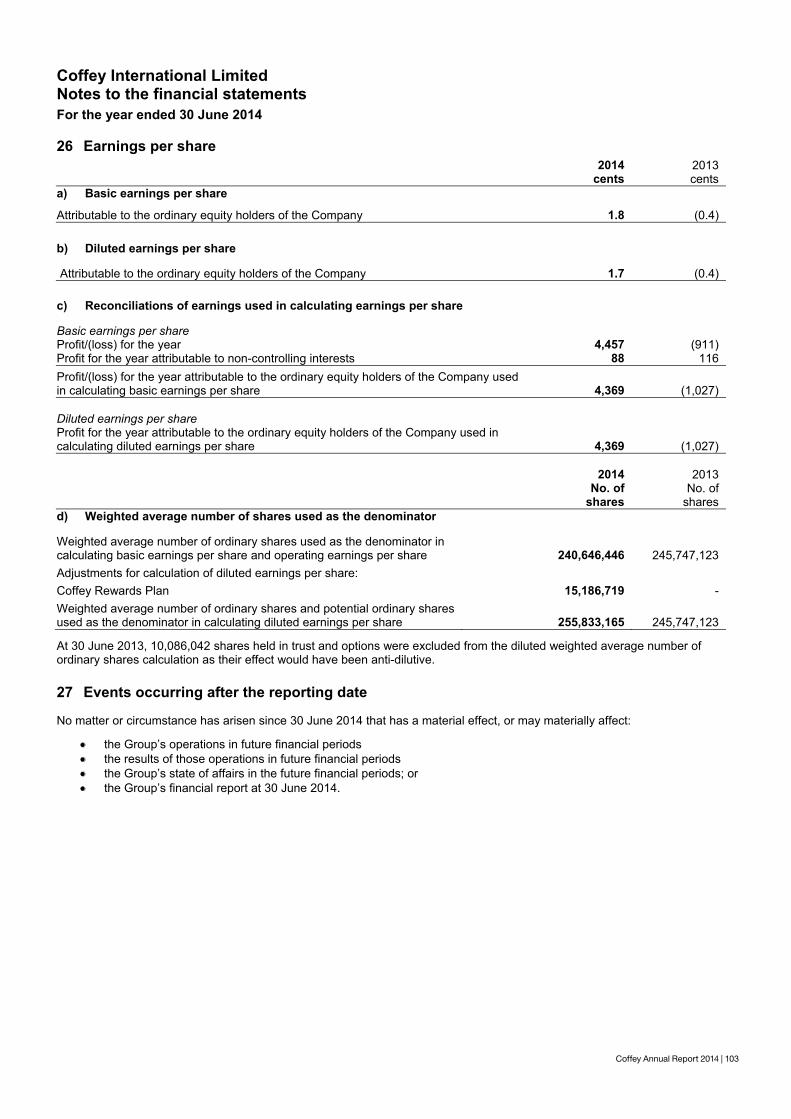
Coffey Annual Report 2014 | 103
Coffey International Limited Notes to the financial statements For the year ended 30 June 2014
102 | Coffey Annual Report 2014
24 Contingent liabilities a) Guarantees The Company and consolidated entity had contingent liabilities at 30 June 2014 in respect of:
2014 2013 $’000 $’000
Guarantees given in respect of performance under contracts and premises leases 6,553 11,855
Guarantees in respect of a specific contract - 3,800
Total guarantees on issue 6,553 15,655 These guarantees may give rise to liabilities in the Group if the subsidiaries do not meet their obligations under the terms of the bank overdrafts, loans, leases or other liabilities subject to the guarantees. b) Other As at the date of this Report, there is no current litigation, or pending or threatened litigation, which would not be covered by professional indemnity insurance or has not already been provided for in the financial statements of the Group; is capable of reliable measurement; or where the likelihood of a material effect on the financial performance of the Group is not considered remote.
25 Commitments
2014 2013 $'000 $'000
a) Capital commitments Capital expenditure contracted at the reporting date but not recognised as liabilities is: Plant and equipment Payable: Within one year - 1,200 b) Lease commitments - operating Commitments for minimum lease payments in relation to non-cancellable operating leases are payable: Within one year 16,934 18,470 Later than one year but not later than five years 49,189 49,693 Later than five years 36,231 37,424 Total lease commitments 102,354 105,587 Representing: Non-cancellable operating leases 102,354 105,587 The operating lease commitments above relate primarily to commercial premises, office, IT and laboratory equipment leases which expire from within one to fifteen years. These leases have varying terms, escalation clauses and renewal rights. On renewal, the terms of the leases are renegotiated. During the year, rental income of $2,333,000 (2013: $1,880,000) was recognised as other income in the income statement.
Coffey International Limited Notes to the financial statements For the year ended 30 June 2014
Coffey Annual Report 2014 | 103
26 Earnings per share 2014 2013
cents cents a) Basic earnings per share
Attributable to the ordinary equity holders of the Company 1.8 (0.4) b) Diluted earnings per share Attributable to the ordinary equity holders of the Company 1.7 (0.4) c) Reconciliations of earnings used in calculating earnings per share
Basic earnings per share Profit/(loss) for the year 4,457 (911) Profit for the year attributable to non-controlling interests 88 116 Profit/(loss) for the year attributable to the ordinary equity holders of the Company used in calculating basic earnings per share 4,369 (1,027)
Diluted earnings per share Profit for the year attributable to the ordinary equity holders of the Company used in calculating diluted earnings per share 4,369 (1,027)
2014
No. of shares
2013 No. of
shares d) Weighted average number of shares used as the denominator Weighted average number of ordinary shares used as the denominator in calculating basic earnings per share and operating earnings per share 240,646,446 245,747,123 Adjustments for calculation of diluted earnings per share: Coffey Rewards Plan 15,186,719 - Weighted average number of ordinary shares and potential ordinary shares used as the denominator in calculating diluted earnings per share 255,833,165 245,747,123 At 30 June 2013, 10,086,042 shares held in trust and options were excluded from the diluted weighted average number of ordinary shares calculation as their effect would have been anti-dilutive.
27 Events occurring after the reporting date No matter or circumstance has arisen since 30 June 2014 that has a material effect, or may materially affect:
the Group’s operations in future financial periods the results of those operations in future financial periods the Group’s state of affairs in the future financial periods; or the Group’s financial report at 30 June 2014.
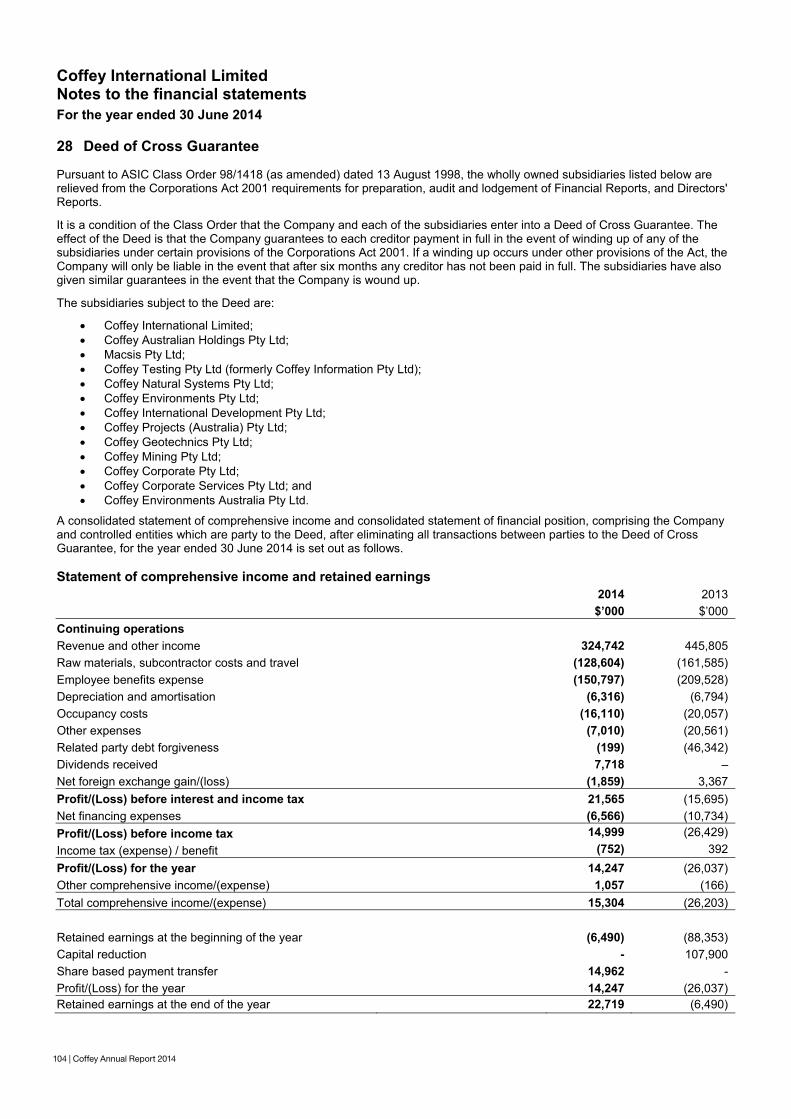
104 | Coffey Annual Report 2014
Coffey International Limited Notes to the financial statements For the year ended 30 June 2014
104 | Coffey Annual Report 2014
28 Deed of Cross Guarantee Pursuant to ASIC Class Order 98/1418 (as amended) dated 13 August 1998, the wholly owned subsidiaries listed below are relieved from the Corporations Act 2001 requirements for preparation, audit and lodgement of Financial Reports, and Directors' Reports. It is a condition of the Class Order that the Company and each of the subsidiaries enter into a Deed of Cross Guarantee. The effect of the Deed is that the Company guarantees to each creditor payment in full in the event of winding up of any of the subsidiaries under certain provisions of the Corporations Act 2001. If a winding up occurs under other provisions of the Act, the Company will only be liable in the event that after six months any creditor has not been paid in full. The subsidiaries have also given similar guarantees in the event that the Company is wound up. The subsidiaries subject to the Deed are:
Coffey International Limited; Coffey Australian Holdings Pty Ltd; Macsis Pty Ltd; Coffey Testing Pty Ltd (formerly Coffey Information Pty Ltd); Coffey Natural Systems Pty Ltd; Coffey Environments Pty Ltd; Coffey International Development Pty Ltd; Coffey Projects (Australia) Pty Ltd; Coffey Geotechnics Pty Ltd; Coffey Mining Pty Ltd; Coffey Corporate Pty Ltd; Coffey Corporate Services Pty Ltd; and Coffey Environments Australia Pty Ltd.
A consolidated statement of comprehensive income and consolidated statement of financial position, comprising the Company and controlled entities which are party to the Deed, after eliminating all transactions between parties to the Deed of Cross Guarantee, for the year ended 30 June 2014 is set out as follows. Statement of comprehensive income and retained earnings
2014 2013 $’000 $’000
Continuing operations Revenue and other income 324,742 445,805 Raw materials, subcontractor costs and travel (128,604) (161,585) Employee benefits expense (150,797) (209,528) Depreciation and amortisation (6,316) (6,794) Occupancy costs (16,110) (20,057) Other expenses (7,010) (20,561) Related party debt forgiveness (199) (46,342) Dividends received 7,718 – Net foreign exchange gain/(loss) (1,859) 3,367 Profit/(Loss) before interest and income tax 21,565 (15,695) Net financing expenses (6,566) (10,734) Profit/(Loss) before income tax 14,999 (26,429) Income tax (expense) / benefit (752) 392 Profit/(Loss) for the year 14,247 (26,037) Other comprehensive income/(expense) 1,057 (166) Total comprehensive income/(expense) 15,304 (26,203) Retained earnings at the beginning of the year (6,490) (88,353) Capital reduction - 107,900 Share based payment transfer 14,962 - Profit/(Loss) for the year 14,247 (26,037) Retained earnings at the end of the year 22,719 (6,490)
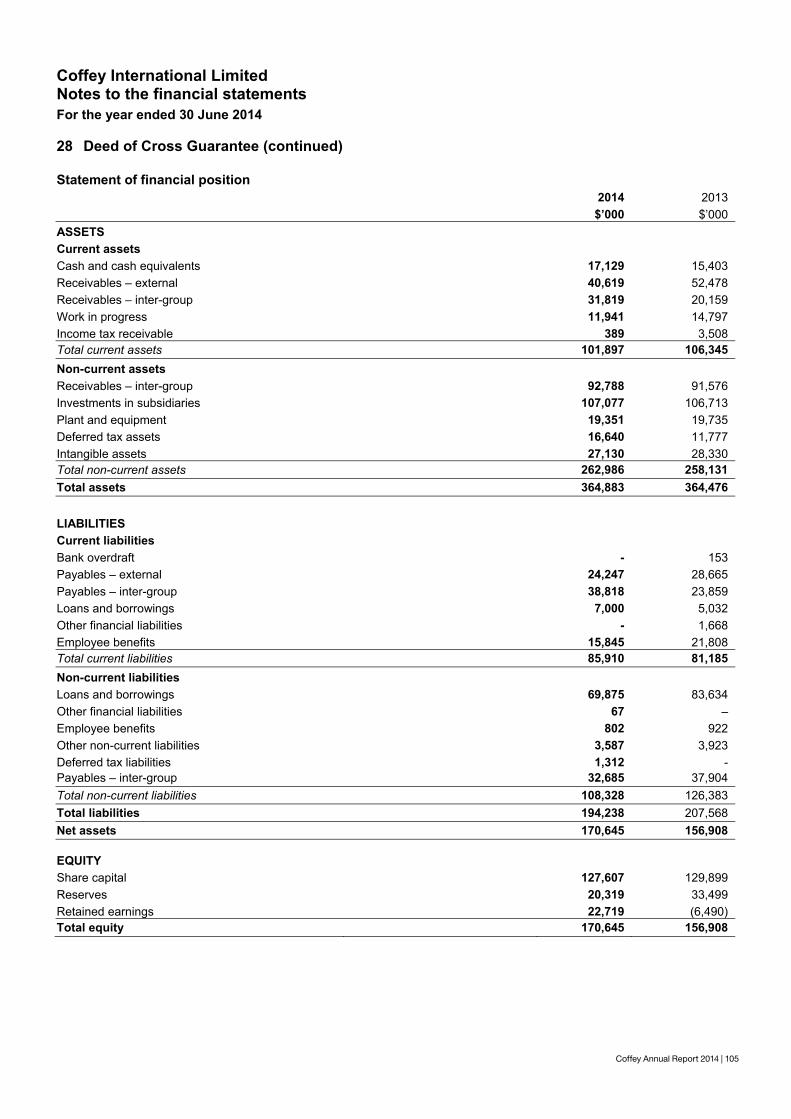
Coffey Annual Report 2014 | 105
Coffey International Limited Notes to the financial statements For the year ended 30 June 2014
Coffey Annual Report 2014 | 105
28 Deed of Cross Guarantee (continued) Statement of financial position
2014 2013 $’000 $’000
ASSETS Current assets Cash and cash equivalents 17,129 15,403 Receivables – external 40,619 52,478 Receivables – inter-group 31,819 20,159 Work in progress 11,941 14,797 Income tax receivable 389 3,508 Total current assets 101,897 106,345 Non-current assets Receivables – inter-group 92,788 91,576 Investments in subsidiaries 107,077 106,713 Plant and equipment 19,351 19,735 Deferred tax assets 16,640 11,777 Intangible assets 27,130 28,330 Total non-current assets 262,986 258,131 Total assets 364,883 364,476
LIABILITIES Current liabilities Bank overdraft - 153 Payables – external 24,247 28,665 Payables – inter-group 38,818 23,859 Loans and borrowings 7,000 5,032 Other financial liabilities - 1,668 Employee benefits 15,845 21,808 Total current liabilities 85,910 81,185 Non-current liabilities Loans and borrowings 69,875 83,634 Other financial liabilities 67 – Employee benefits 802 922 Other non-current liabilities 3,587 3,923 Deferred tax liabilities 1,312 - Payables – inter-group 32,685 37,904 Total non-current liabilities 108,328 126,383 Total liabilities 194,238 207,568 Net assets 170,645 156,908
EQUITY Share capital 127,607 129,899 Reserves 20,319 33,499 Retained earnings 22,719 (6,490) Total equity 170,645 156,908
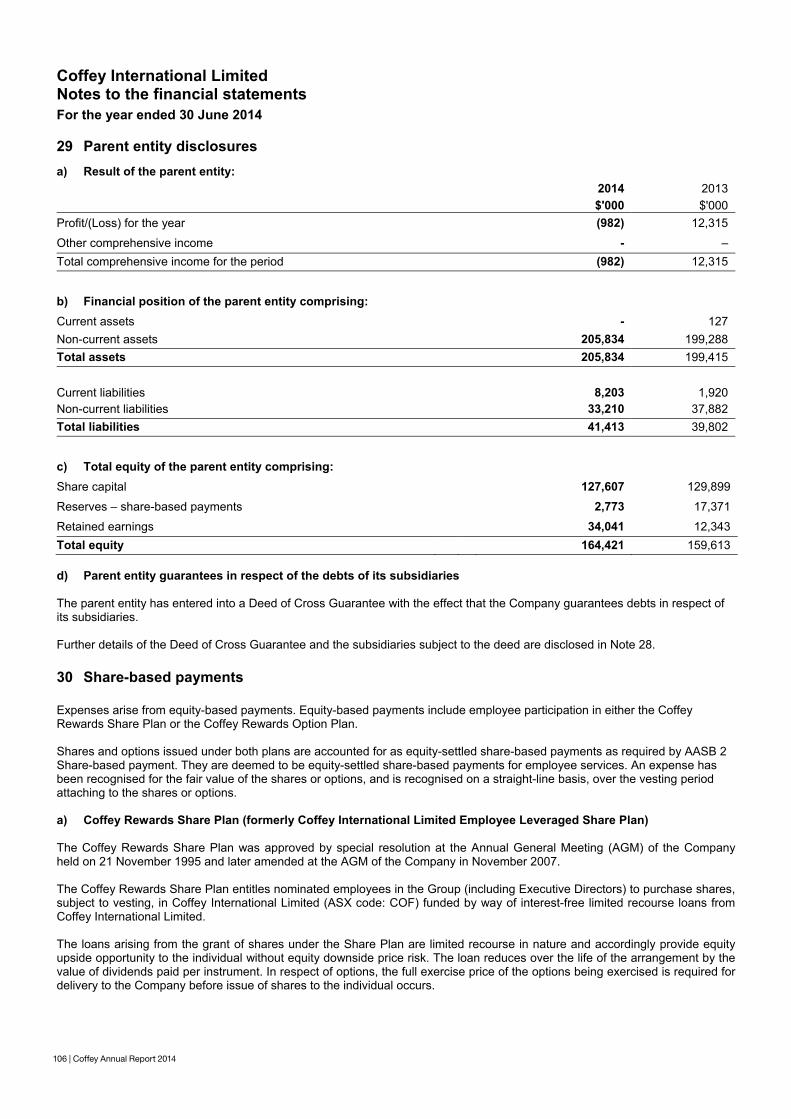
106 | Coffey Annual Report 2014
Coffey International Limited Notes to the financial statements For the year ended 30 June 2014
106 | Coffey Annual Report 2014
29 Parent entity disclosures a) Result of the parent entity: 2014 2013 $'000 $'000 Profit/(Loss) for the year (982) 12,315
Other comprehensive income - – Total comprehensive income for the period (982) 12,315
b) Financial position of the parent entity comprising: Current assets - 127 Non-current assets 205,834 199,288 Total assets 205,834 199,415 Current liabilities 8,203 1,920 Non-current liabilities 33,210 37,882 Total liabilities 41,413 39,802 c) Total equity of the parent entity comprising: Share capital 127,607 129,899
Reserves – share-based payments 2,773 17,371
Retained earnings 34,041 12,343 Total equity 164,421 159,613 d) Parent entity guarantees in respect of the debts of its subsidiaries The parent entity has entered into a Deed of Cross Guarantee with the effect that the Company guarantees debts in respect of its subsidiaries. Further details of the Deed of Cross Guarantee and the subsidiaries subject to the deed are disclosed in Note 28.
30 Share-based payments Expenses arise from equity-based payments. Equity-based payments include employee participation in either the Coffey Rewards Share Plan or the Coffey Rewards Option Plan. Shares and options issued under both plans are accounted for as equity-settled share-based payments as required by AASB 2 Share-based payment. They are deemed to be equity-settled share-based payments for employee services. An expense has been recognised for the fair value of the shares or options, and is recognised on a straight-line basis, over the vesting period attaching to the shares or options. a) Coffey Rewards Share Plan (formerly Coffey International Limited Employee Leveraged Share Plan) The Coffey Rewards Share Plan was approved by special resolution at the Annual General Meeting (AGM) of the Company held on 21 November 1995 and later amended at the AGM of the Company in November 2007. The Coffey Rewards Share Plan entitles nominated employees in the Group (including Executive Directors) to purchase shares, subject to vesting, in Coffey International Limited (ASX code: COF) funded by way of interest-free limited recourse loans from Coffey International Limited. The loans arising from the grant of shares under the Share Plan are limited recourse in nature and accordingly provide equity upside opportunity to the individual without equity downside price risk. The loan reduces over the life of the arrangement by the value of dividends paid per instrument. In respect of options, the full exercise price of the options being exercised is required for delivery to the Company before issue of shares to the individual occurs.
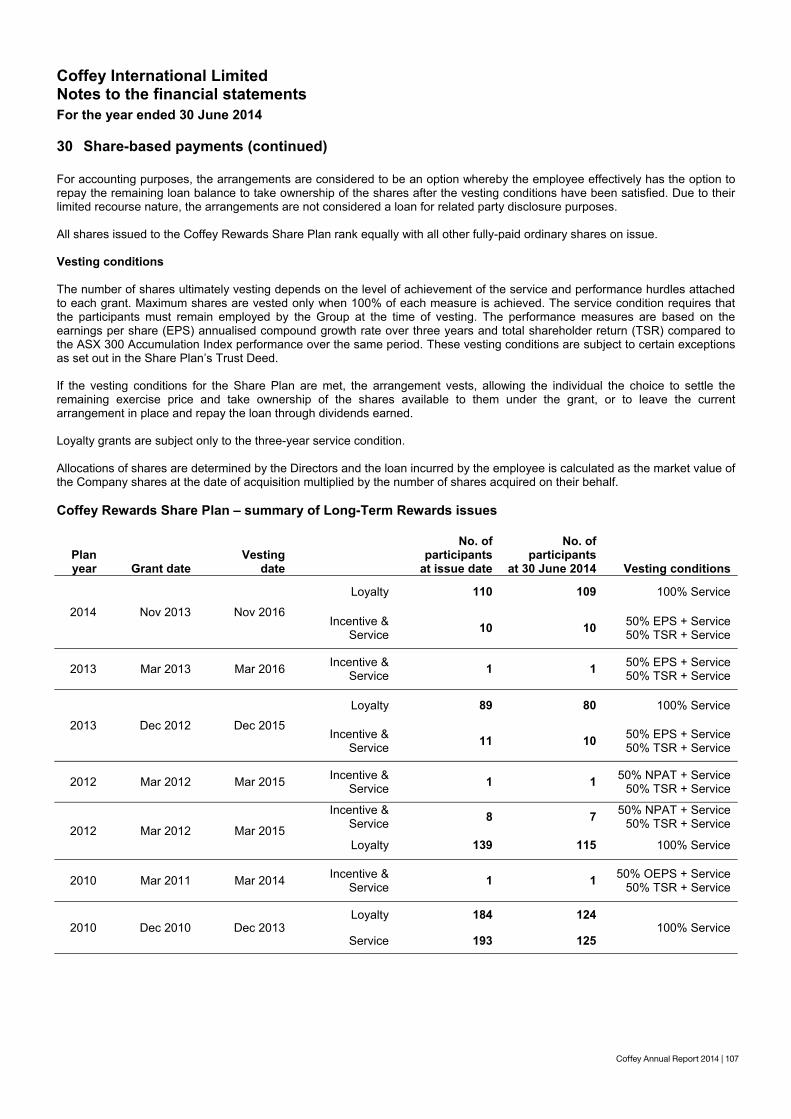
Coffey Annual Report 2014 | 107
Coffey International Limited Notes to the financial statements For the year ended 30 June 2014
Coffey Annual Report 2014 | 107
30 Share-based payments (continued) For accounting purposes, the arrangements are considered to be an option whereby the employee effectively has the option to repay the remaining loan balance to take ownership of the shares after the vesting conditions have been satisfied. Due to their limited recourse nature, the arrangements are not considered a loan for related party disclosure purposes. All shares issued to the Coffey Rewards Share Plan rank equally with all other fully-paid ordinary shares on issue. Vesting conditions The number of shares ultimately vesting depends on the level of achievement of the service and performance hurdles attached to each grant. Maximum shares are vested only when 100% of each measure is achieved. The service condition requires that the participants must remain employed by the Group at the time of vesting. The performance measures are based on the earnings per share (EPS) annualised compound growth rate over three years and total shareholder return (TSR) compared to the ASX 300 Accumulation Index performance over the same period. These vesting conditions are subject to certain exceptions as set out in the Share Plan’s Trust Deed. If the vesting conditions for the Share Plan are met, the arrangement vests, allowing the individual the choice to settle the remaining exercise price and take ownership of the shares available to them under the grant, or to leave the current arrangement in place and repay the loan through dividends earned. Loyalty grants are subject only to the three-year service condition. Allocations of shares are determined by the Directors and the loan incurred by the employee is calculated as the market value of the Company shares at the date of acquisition multiplied by the number of shares acquired on their behalf. Coffey Rewards Share Plan – summary of Long-Term Rewards issues
Plan year Grant date
Vesting date
No. ofparticipants
at issue date
No. of participants
at 30 June 2014 Vesting conditions
2014 Nov 2013 Nov 2016
Loyalty 110 109 100% Service
Incentive & Service 10 10 50% EPS + Service
50% TSR + Service
2013 Mar 2013 Mar 2016 Incentive & Service 1 1 50% EPS + Service
50% TSR + Service
2013 Dec 2012 Dec 2015
Loyalty 89 80 100% Service
Incentive & Service 11 10 50% EPS + Service
50% TSR + Service
2012 Mar 2012 Mar 2015 Incentive & Service 1 1 50% NPAT + Service
50% TSR + Service
2012 Mar 2012 Mar 2015
Incentive & Service 8 7 50% NPAT + Service
50% TSR + Service
Loyalty 139 115 100% Service
2010 Mar 2011 Mar 2014 Incentive & Service 1 1 50% OEPS + Service
50% TSR + Service
2010 Dec 2010 Dec 2013 Loyalty 184 124
100% Service Service 193 125
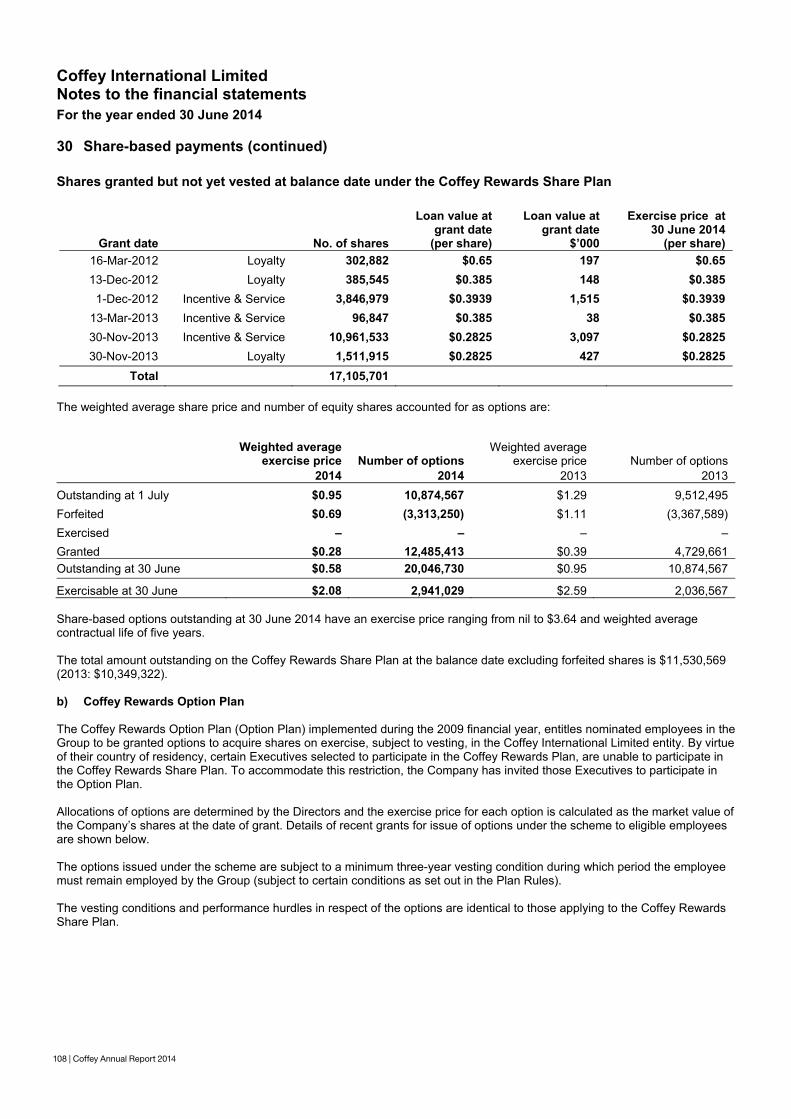
108 | Coffey Annual Report 2014
Coffey International Limited Notes to the financial statements For the year ended 30 June 2014
108 | Coffey Annual Report 2014
30 Share-based payments (continued) Shares granted but not yet vested at balance date under the Coffey Rewards Share Plan
Grant date No. of shares
Loan value atgrant date
(per share)
Loan value at grant date
$’000
Exercise price at 30 June 2014
(per share) 16-Mar-2012 Loyalty 302,882 $0.65 197 $0.65 13-Dec-2012 Loyalty 385,545 $0.385 148 $0.385 1-Dec-2012 Incentive & Service 3,846,979 $0.3939 1,515 $0.3939
13-Mar-2013 Incentive & Service 96,847 $0.385 38 $0.385 30-Nov-2013 Incentive & Service 10,961,533 $0.2825 3,097 $0.2825 30-Nov-2013 Loyalty 1,511,915 $0.2825 427 $0.2825
Total 17,105,701 The weighted average share price and number of equity shares accounted for as options are:
Weighted average
exercise price Number of options Weighted average
exercise price Number of options 2014 2014 2013 2013
Outstanding at 1 July $0.95 10,874,567 $1.29 9,512,495 Forfeited $0.69 (3,313,250) $1.11 (3,367,589) Exercised – – – – Granted $0.28 12,485,413 $0.39 4,729,661 Outstanding at 30 June $0.58 20,046,730 $0.95 10,874,567
Exercisable at 30 June $2.08 2,941,029 $2.59 2,036,567 Share-based options outstanding at 30 June 2014 have an exercise price ranging from nil to $3.64 and weighted average contractual life of five years. The total amount outstanding on the Coffey Rewards Share Plan at the balance date excluding forfeited shares is $11,530,569 (2013: $10,349,322). b) Coffey Rewards Option Plan The Coffey Rewards Option Plan (Option Plan) implemented during the 2009 financial year, entitles nominated employees in the Group to be granted options to acquire shares on exercise, subject to vesting, in the Coffey International Limited entity. By virtue of their country of residency, certain Executives selected to participate in the Coffey Rewards Plan, are unable to participate in the Coffey Rewards Share Plan. To accommodate this restriction, the Company has invited those Executives to participate in the Option Plan. Allocations of options are determined by the Directors and the exercise price for each option is calculated as the market value of the Company’s shares at the date of grant. Details of recent grants for issue of options under the scheme to eligible employees are shown below. The options issued under the scheme are subject to a minimum three-year vesting condition during which period the employee must remain employed by the Group (subject to certain conditions as set out in the Plan Rules). The vesting conditions and performance hurdles in respect of the options are identical to those applying to the Coffey Rewards Share Plan.
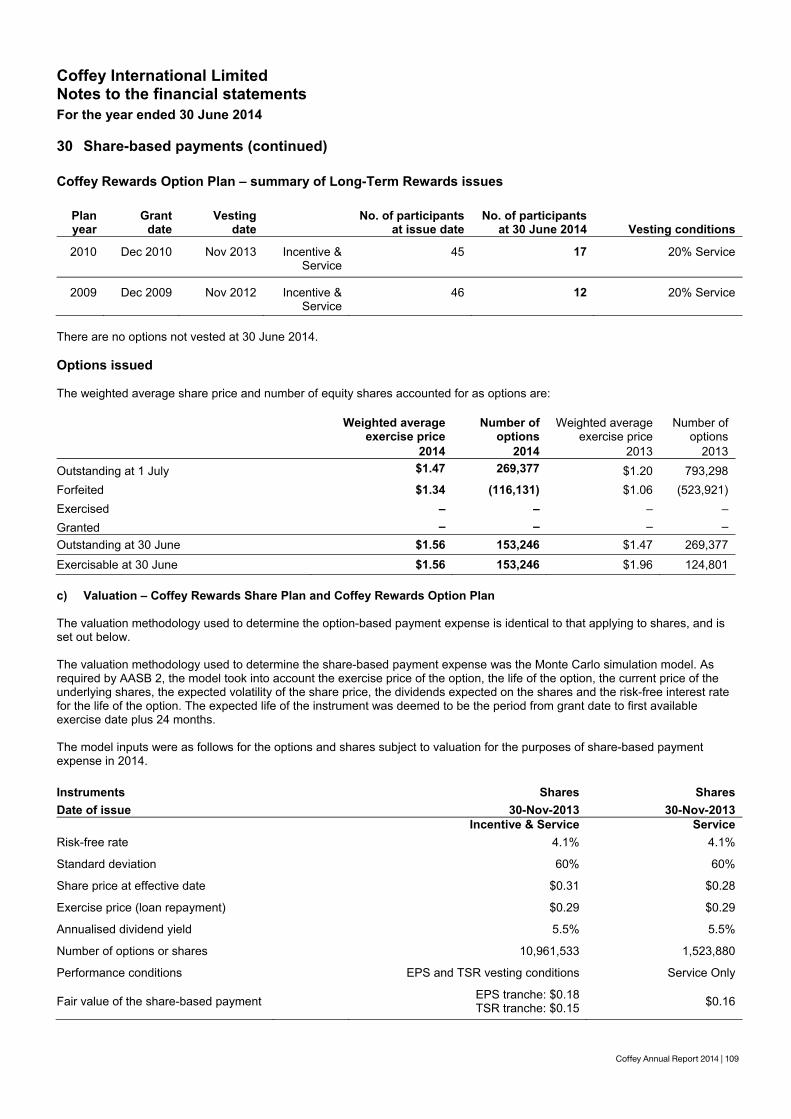
Coffey Annual Report 2014 | 109
Coffey International Limited Notes to the financial statements For the year ended 30 June 2014
Coffey Annual Report 2014 | 109
30 Share-based payments (continued) Coffey Rewards Option Plan – summary of Long-Term Rewards issues
Plan year
Grant date
Vesting date
No. of participants at issue date
No. of participants at 30 June 2014 Vesting conditions
2010 Dec 2010 Nov 2013 Incentive & Service
45 17 20% Service
2009 Dec 2009 Nov 2012 Incentive & Service
46 12 20% Service
There are no options not vested at 30 June 2014. Options issued The weighted average share price and number of equity shares accounted for as options are:
Weighted average
exercise price Number of
options Weighted average
exercise price Number of
options 2014 2014 2013 2013
Outstanding at 1 July $1.47 269,377 $1.20 793,298 Forfeited $1.34 (116,131) $1.06 (523,921) Exercised – – – – Granted – – – – Outstanding at 30 June $1.56 153,246 $1.47 269,377 Exercisable at 30 June $1.56 153,246 $1.96 124,801 c) Valuation – Coffey Rewards Share Plan and Coffey Rewards Option Plan The valuation methodology used to determine the option-based payment expense is identical to that applying to shares, and is set out below. The valuation methodology used to determine the share-based payment expense was the Monte Carlo simulation model. As required by AASB 2, the model took into account the exercise price of the option, the life of the option, the current price of the underlying shares, the expected volatility of the share price, the dividends expected on the shares and the risk-free interest rate for the life of the option. The expected life of the instrument was deemed to be the period from grant date to first available exercise date plus 24 months. The model inputs were as follows for the options and shares subject to valuation for the purposes of share-based payment expense in 2014. Instruments Shares Shares Date of issue 30-Nov-2013 30-Nov-2013 Incentive & Service ServiceRisk-free rate 4.1% 4.1%
Standard deviation 60% 60%
Share price at effective date $0.31 $0.28
Exercise price (loan repayment) $0.29 $0.29
Annualised dividend yield 5.5% 5.5%
Number of options or shares 10,961,533 1,523,880
Performance conditions EPS and TSR vesting conditions Service Only
Fair value of the share-based payment EPS tranche: $0.18 TSR tranche: $0.15 $0.16
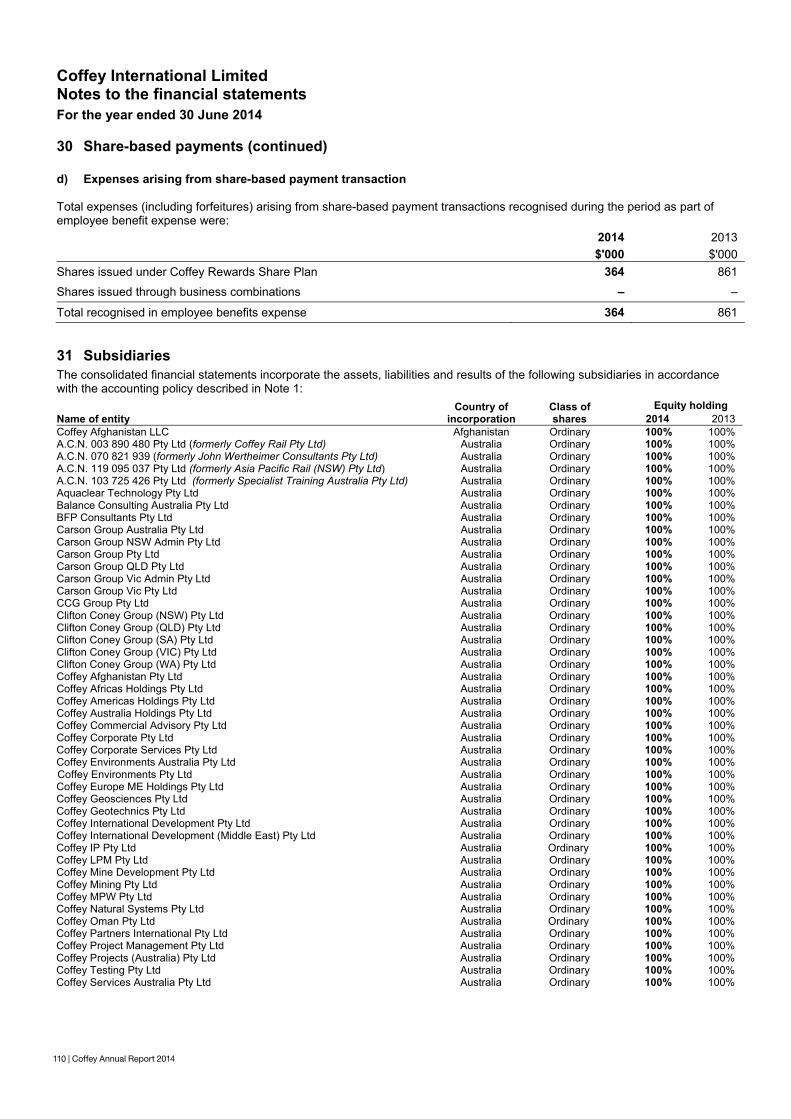
110 | Coffey Annual Report 2014
Coffey International Limited Notes to the financial statements For the year ended 30 June 2014
110 | Coffey Annual Report 2014
30 Share-based payments (continued) d) Expenses arising from share-based payment transaction Total expenses (including forfeitures) arising from share-based payment transactions recognised during the period as part of employee benefit expense were:
2014 2013 $'000 $'000
Shares issued under Coffey Rewards Share Plan 364 861
Shares issued through business combinations – –
Total recognised in employee benefits expense 364 861
31 Subsidiaries The consolidated financial statements incorporate the assets, liabilities and results of the following subsidiaries in accordance with the accounting policy described in Note 1:
Name of entity Country of
incorporation Class of shares
Equity holding 2014 2013
Coffey Afghanistan LLC Afghanistan Ordinary 100% 100% A.C.N. 003 890 480 Pty Ltd (formerly Coffey Rail Pty Ltd) Australia Ordinary 100% 100% A.C.N. 070 821 939 (formerly John Wertheimer Consultants Pty Ltd) Australia Ordinary 100% 100% A.C.N. 119 095 037 Pty Ltd (formerly Asia Pacific Rail (NSW) Pty Ltd) Australia Ordinary 100% 100% A.C.N. 103 725 426 Pty Ltd (formerly Specialist Training Australia Pty Ltd) Australia Ordinary 100% 100% Aquaclear Technology Pty Ltd Australia Ordinary 100% 100% Balance Consulting Australia Pty Ltd Australia Ordinary 100% 100% BFP Consultants Pty Ltd Australia Ordinary 100% 100% Carson Group Australia Pty Ltd Australia Ordinary 100% 100% Carson Group NSW Admin Pty Ltd Australia Ordinary 100% 100% Carson Group Pty Ltd Australia Ordinary 100% 100% Carson Group QLD Pty Ltd Australia Ordinary 100% 100% Carson Group Vic Admin Pty Ltd Australia Ordinary 100% 100% Carson Group Vic Pty Ltd Australia Ordinary 100% 100% CCG Group Pty Ltd Australia Ordinary 100% 100% Clifton Coney Group (NSW) Pty Ltd Australia Ordinary 100% 100% Clifton Coney Group (QLD) Pty Ltd Australia Ordinary 100% 100% Clifton Coney Group (SA) Pty Ltd Australia Ordinary 100% 100% Clifton Coney Group (VIC) Pty Ltd Australia Ordinary 100% 100% Clifton Coney Group (WA) Pty Ltd Australia Ordinary 100% 100% Coffey Afghanistan Pty Ltd Australia Ordinary 100% 100% Coffey Africas Holdings Pty Ltd Australia Ordinary 100% 100% Coffey Americas Holdings Pty Ltd Australia Ordinary 100% 100% Coffey Australia Holdings Pty Ltd Australia Ordinary 100% 100% Coffey Commercial Advisory Pty Ltd Australia Ordinary 100% 100% Coffey Corporate Pty Ltd Australia Ordinary 100% 100% Coffey Corporate Services Pty Ltd Australia Ordinary 100% 100% Coffey Environments Australia Pty Ltd Australia Ordinary 100% 100% Coffey Environments Pty Ltd Australia Ordinary 100% 100% Coffey Europe ME Holdings Pty Ltd Australia Ordinary 100% 100% Coffey Geosciences Pty Ltd Australia Ordinary 100% 100% Coffey Geotechnics Pty Ltd Australia Ordinary 100% 100% Coffey International Development Pty Ltd Australia Ordinary 100% 100% Coffey International Development (Middle East) Pty Ltd Australia Ordinary 100% 100% Coffey IP Pty Ltd Australia Ordinary 100% 100% Coffey LPM Pty Ltd Australia Ordinary 100% 100% Coffey Mine Development Pty Ltd Australia Ordinary 100% 100% Coffey Mining Pty Ltd Australia Ordinary 100% 100% Coffey MPW Pty Ltd Australia Ordinary 100% 100% Coffey Natural Systems Pty Ltd Australia Ordinary 100% 100% Coffey Oman Pty Ltd Australia Ordinary 100% 100% Coffey Partners International Pty Ltd Australia Ordinary 100% 100% Coffey Project Management Pty Ltd Australia Ordinary 100% 100% Coffey Projects (Australia) Pty Ltd Australia Ordinary 100% 100% Coffey Testing Pty Ltd Australia Ordinary 100% 100% Coffey Services Australia Pty Ltd Australia Ordinary 100% 100%
Coffey International Limited Notes to the financial statements For the year ended 30 June 2014
Coffey Annual Report 2014 | 111
31 Subsidiaries (continued)
Name of entity Country of
incorporation Class of shares
Equity holding 2014 2013
Coffey Strategy Pty Ltd Australia Ordinary 100% 100% DASCEM Pty Ltd Australia Ordinary 100% 100% Farsands Facilities Management Ltd Australia Ordinary 100% 100% Farsands Risk Management Pty Ltd Australia Ordinary 100% 100% Farsands Solutions Pty Ltd1 Australia Ordinary 100% 100% Farsands Project Solutions Pty Ltd Australia Ordinary 100% 100% Geosciences Consulting (ME) Pty Ltd Australia Ordinary 100% 100% Global Justice Solutions (Pacific) Pty Ltd Australia Ordinary 100% 100% Global Justice Solutions (Asia) Pty Ltd Australia Ordinary 100% 100% Global Justice Solutions Pty Ltd Australia Ordinary 100% 100% IT Environmental (Australia) Pty Ltd Australia Ordinary 100% 100% Macsis Pty Ltd Australia Ordinary 100% 100% RSG Global Consulting Pty Ltd Australia Ordinary 100% 100% Soil & Rock Engineering Pty Ltd Australia Ordinary 100% 100% Water Studies Pty Ltd Australia Ordinary 100% 100% Coffey Consultoria e Servicos Ltda Brazil Ordinary 100% 100% Clifton Coney Group (Indo-China) Ltd British Virgin Isles Ordinary 100% 100% Coffey Projects (International) Limited British Virgin Isles Ordinary 100% 100% Coffey Canada Inc. Canada Ordinary 100% 100% Coffey Geotechnics Inc. Canada Ordinary 100% 100% Coffey Consultoria Servicios SpA Chile Ordinary 100% 100% Coffey Asia Ltd Hong Kong Ordinary 100% 100% Development Company for Technical & Environmental Consultancy LLC Iraq Ordinary 100% 100% Coffey Projects (Middle East) Ltd Jersey Ordinary 100% 100% Coffey (Malaysia) Sdn Bhd Malaysia Ordinary 100% 100% Coffey Holdings Sdn Bhd Malaysia Ordinary 100% 100% Carson Group (AKL) Ltd New Zealand Ordinary 100% 100% Carson Group Ltd New Zealand Ordinary 100% 100% Clifton Coney Group (NZ) Ltd New Zealand Ordinary 100% 100% Coffey Geotechnics (NZ) Ltd New Zealand Ordinary 100% 100% Coffey International NZ Ltd New Zealand Ordinary 100% 100% Coffey Projects (New Zealand) Ltd New Zealand Ordinary 100% 100% Coffey Nigeria Ltd Nigeria Ordinary 100% 100% Aquaclear Technology (Pakistan) Pvt Ltd Pakistan Ordinary 95% 95% Coffey Services PNG Limited Papua New Guinea Ordinary 100% 100% Coffey International Inc. Philippines Ordinary 40% 40% Coffey Philippines Inc.2 Philippines Ordinary 100% 100% Coffey Consultoria y Servicios S.A.C. Peru Ordinary 100% 100% Coffey International Development Sp. z o.o Poland Ordinary 100% 100% Coffey Projects (Singapore) Pte. Ltd Singapore Ordinary 100% 100% Bovell Freeman Holly Pty Ltd South Africa Ordinary 100% 100% Coffey International (Africa) Pty Ltd South Africa Ordinary 100% 100% Coffey Mining (South Africa) Pty Ltd South Africa Ordinary 100% 100% Coffey Projects (Africa) Pty Ltd South Africa Ordinary 73% 73% Duncan Rhodes Construction Pty Ltd South Africa Ordinary 51% 51% Duncan Rhodes Procurement Pty Ltd South Africa Ordinary 51% 51% RSG Global Consulting (SA) Pty Ltd South Africa Ordinary 100% 100% Coffey Thailand Ltd Thailand Ordinary 49% 49% STA FZ-LLC3 United Arab Emirates Ordinary 100% 100% Coffey (UK) Ltd UK Ordinary 100% 100% Coffey Geotechnics Ltd UK Ordinary 100% 100% Coffey International Development Holdings Ltd UK Ordinary 100% 100% Coffey International Development Ltd UK Ordinary 100% 100% Coffey UK Finance Limited UK Ordinary 100% 100% EDGE Consultants UK Ltd UK Ordinary 100% 100% Global Justice Solutions EMEA Ltd UK Ordinary 100% 100% Libra Advisory Group Ltd UK Ordinary 100% 100% Libra Knowledge Network Ltd UK Ordinary 100% 100% Libra Ventures Ltd UK Ordinary 100% 100% Webber Associates UK Ltd UK Ordinary 100% 100% The Evaluation Partnership Ltd UK Ordinary 100% 100% Coffey International Inc. U.S.A. Ordinary 100% 100% Management Systems International Inc. U.S.A. Ordinary 100% 100% Clifton Coney Group (Vietnam) Ltd Vietnam Ordinary 100% 100% 1 Farsands Solutions Pty Ltd has a minority holding of less than 0.01% 2 The remaining 60% of the issued capital is held by a third party for the benefit of the Coffey International Group 3 STA FZ-LLC was sold effective 31 May 2014.
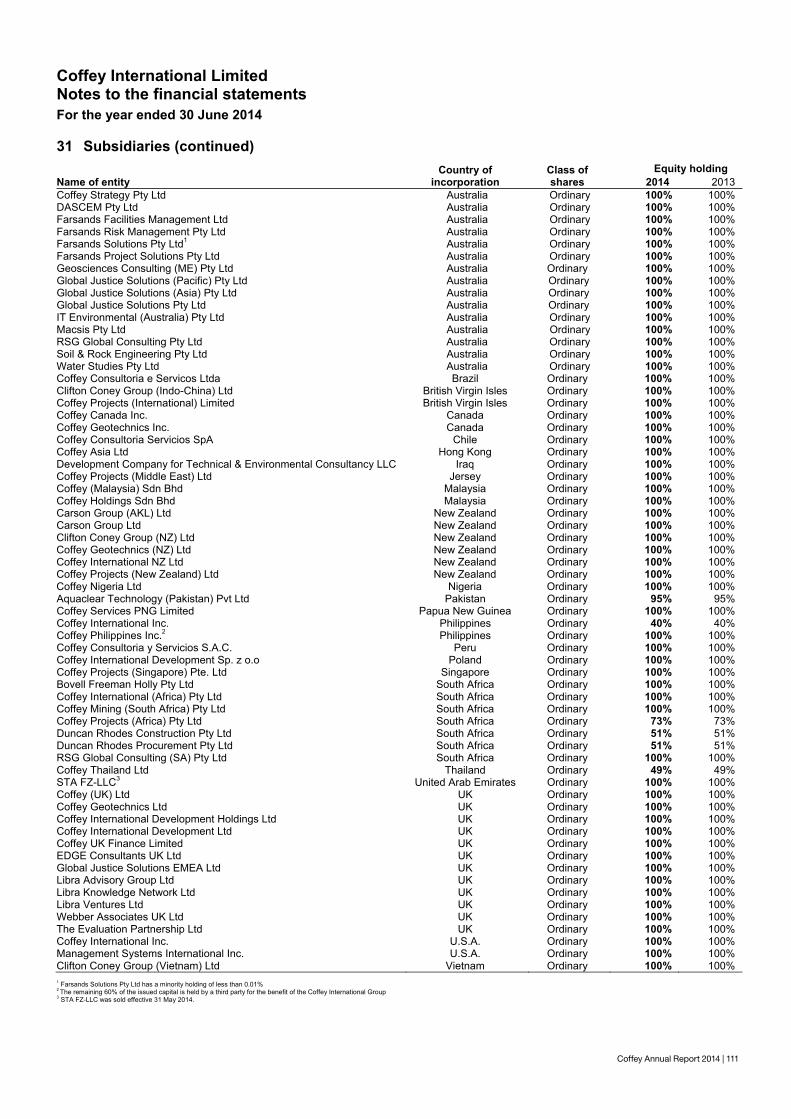
Coffey Annual Report 2014 | 111
Coffey International Limited Notes to the financial statements For the year ended 30 June 2014
Coffey Annual Report 2014 | 111
31 Subsidiaries (continued)
Name of entity Country of
incorporation Class of shares
Equity holding 2014 2013
Coffey Strategy Pty Ltd Australia Ordinary 100% 100% DASCEM Pty Ltd Australia Ordinary 100% 100% Farsands Facilities Management Ltd Australia Ordinary 100% 100% Farsands Risk Management Pty Ltd Australia Ordinary 100% 100% Farsands Solutions Pty Ltd1 Australia Ordinary 100% 100% Farsands Project Solutions Pty Ltd Australia Ordinary 100% 100% Geosciences Consulting (ME) Pty Ltd Australia Ordinary 100% 100% Global Justice Solutions (Pacific) Pty Ltd Australia Ordinary 100% 100% Global Justice Solutions (Asia) Pty Ltd Australia Ordinary 100% 100% Global Justice Solutions Pty Ltd Australia Ordinary 100% 100% IT Environmental (Australia) Pty Ltd Australia Ordinary 100% 100% Macsis Pty Ltd Australia Ordinary 100% 100% RSG Global Consulting Pty Ltd Australia Ordinary 100% 100% Soil & Rock Engineering Pty Ltd Australia Ordinary 100% 100% Water Studies Pty Ltd Australia Ordinary 100% 100% Coffey Consultoria e Servicos Ltda Brazil Ordinary 100% 100% Clifton Coney Group (Indo-China) Ltd British Virgin Isles Ordinary 100% 100% Coffey Projects (International) Limited British Virgin Isles Ordinary 100% 100% Coffey Canada Inc. Canada Ordinary 100% 100% Coffey Geotechnics Inc. Canada Ordinary 100% 100% Coffey Consultoria Servicios SpA Chile Ordinary 100% 100% Coffey Asia Ltd Hong Kong Ordinary 100% 100% Development Company for Technical & Environmental Consultancy LLC Iraq Ordinary 100% 100% Coffey Projects (Middle East) Ltd Jersey Ordinary 100% 100% Coffey (Malaysia) Sdn Bhd Malaysia Ordinary 100% 100% Coffey Holdings Sdn Bhd Malaysia Ordinary 100% 100% Carson Group (AKL) Ltd New Zealand Ordinary 100% 100% Carson Group Ltd New Zealand Ordinary 100% 100% Clifton Coney Group (NZ) Ltd New Zealand Ordinary 100% 100% Coffey Geotechnics (NZ) Ltd New Zealand Ordinary 100% 100% Coffey International NZ Ltd New Zealand Ordinary 100% 100% Coffey Projects (New Zealand) Ltd New Zealand Ordinary 100% 100% Coffey Nigeria Ltd Nigeria Ordinary 100% 100% Aquaclear Technology (Pakistan) Pvt Ltd Pakistan Ordinary 95% 95% Coffey Services PNG Limited Papua New Guinea Ordinary 100% 100% Coffey International Inc. Philippines Ordinary 40% 40% Coffey Philippines Inc.2 Philippines Ordinary 100% 100% Coffey Consultoria y Servicios S.A.C. Peru Ordinary 100% 100% Coffey International Development Sp. z o.o Poland Ordinary 100% 100% Coffey Projects (Singapore) Pte. Ltd Singapore Ordinary 100% 100% Bovell Freeman Holly Pty Ltd South Africa Ordinary 100% 100% Coffey International (Africa) Pty Ltd South Africa Ordinary 100% 100% Coffey Mining (South Africa) Pty Ltd South Africa Ordinary 100% 100% Coffey Projects (Africa) Pty Ltd South Africa Ordinary 73% 73% Duncan Rhodes Construction Pty Ltd South Africa Ordinary 51% 51% Duncan Rhodes Procurement Pty Ltd South Africa Ordinary 51% 51% RSG Global Consulting (SA) Pty Ltd South Africa Ordinary 100% 100% Coffey Thailand Ltd Thailand Ordinary 49% 49% STA FZ-LLC3 United Arab Emirates Ordinary 100% 100% Coffey (UK) Ltd UK Ordinary 100% 100% Coffey Geotechnics Ltd UK Ordinary 100% 100% Coffey International Development Holdings Ltd UK Ordinary 100% 100% Coffey International Development Ltd UK Ordinary 100% 100% Coffey UK Finance Limited UK Ordinary 100% 100% EDGE Consultants UK Ltd UK Ordinary 100% 100% Global Justice Solutions EMEA Ltd UK Ordinary 100% 100% Libra Advisory Group Ltd UK Ordinary 100% 100% Libra Knowledge Network Ltd UK Ordinary 100% 100% Libra Ventures Ltd UK Ordinary 100% 100% Webber Associates UK Ltd UK Ordinary 100% 100% The Evaluation Partnership Ltd UK Ordinary 100% 100% Coffey International Inc. U.S.A. Ordinary 100% 100% Management Systems International Inc. U.S.A. Ordinary 100% 100% Clifton Coney Group (Vietnam) Ltd Vietnam Ordinary 100% 100% 1 Farsands Solutions Pty Ltd has a minority holding of less than 0.01% 2 The remaining 60% of the issued capital is held by a third party for the benefit of the Coffey International Group 3 STA FZ-LLC was sold effective 31 May 2014.
112 | Coffey Annual Report 2014
CoDi
112
In t
TheoblCo
TheDir
TheInte
Sig
JohCh Syd8 A
offey Interrectors’ de
2 | Coffey Annual
the opinion of
a) the conthe Dire
b) there arpayable
ere are reasonligations or liampany and th
e Directors harector and Fina
e Directors draernational Fina
gned in accord
hn F Mulcahy airman
dney August 2014
rnational Leclaration
Report 2014
the Directors
solidated finaectors’ Report
giving a truefinancial yea
complying w
re reasonablee.
nable groundsbilities to whic
hose group ent
ave been givenance Director
aw attention toancial Reporti
dance with a re
Limited
of Coffey Inte
ncial statemen, are in accord
e and fair viewar ended on th
with Australian
grounds to be
s to believe thach they are or tities pursuant
n the declaratfor the financ
o Note 1 in theing Standards
esolution of th
ernational Limi
nts and notesdance with the
w of the Grouphat date; and
n Accounting S
elieve that the
at the Compamay become t to ASIC Clas
ions required ial year ended
e consolidateds.
he Directors:
ited:
that are set oe Corporations
p’s financial po
Standards and
e Group will be
ny and the Grsubject to by
ss Order 98/14
by section 29d 30 June 201
d financial stat
JohnMana
out on pages 6s Act 2001, inc
osition as at 30
d the Corporat
e able to pay i
roup entities idvirtue of the D418.
5A of the Corp4.
tements, whic
M Douglas aging Director
62 to 111, and cluding:
0 June 2014 a
ions Regulatio
ts debts as an
dentified in NoDeed of Cross
porations Act
ch includes a s
the Remuner
and of its perfo
ons 2001; and
nd when they
ote 28 will be as Guarantee be
2001 from the
statement of c
ration Report i
ormance for th
d
become due a
able to meet aetween the
e Managing
compliance wit
in
he
and
any
th
Coffey Annual Report 2014 | 113
114 | Coffey Annual Report 2014
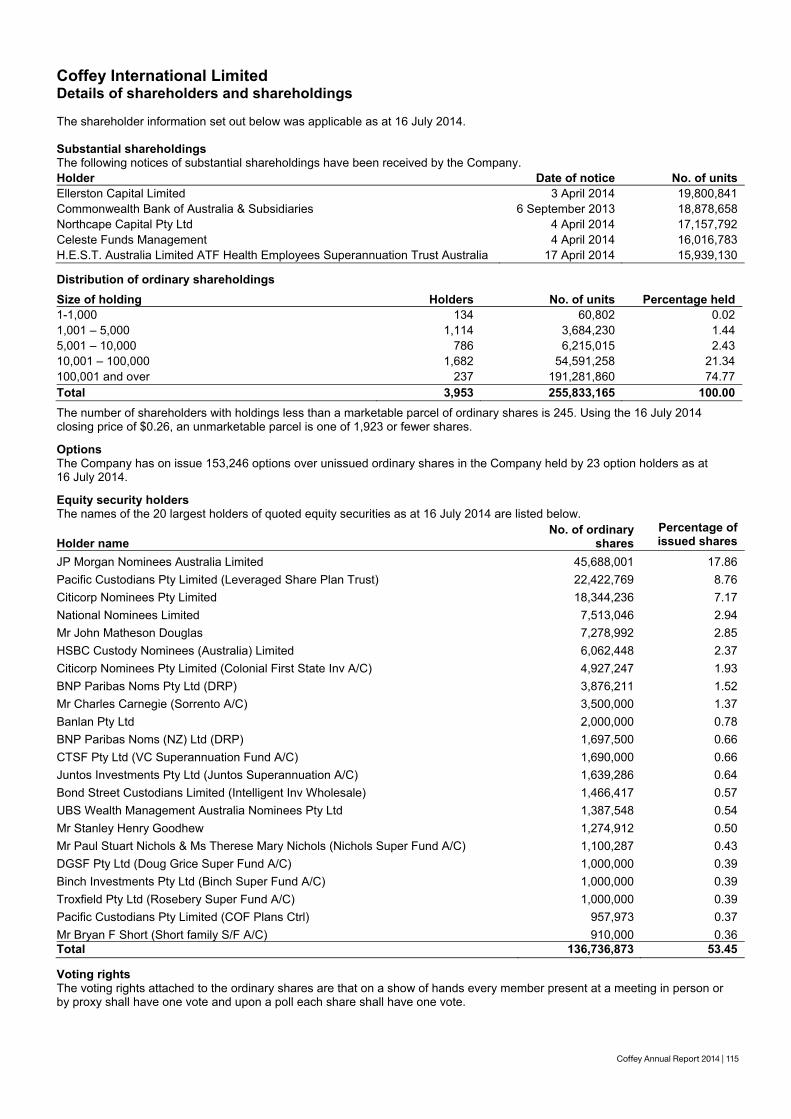
Coffey Annual Report 2014 | 115
Coffey International Limited Details of shareholders and shareholdings
Coffey Annual Report 2014 | 115
The shareholder information set out below was applicable as at 16 July 2014. Substantial shareholdings The following notices of substantial shareholdings have been received by the Company. Holder Date of notice No. of units Ellerston Capital Limited 3 April 2014 19,800,841 Commonwealth Bank of Australia & Subsidiaries 6 September 2013 18,878,658 Northcape Capital Pty Ltd 4 April 2014 17,157,792 Celeste Funds Management 4 April 2014 16,016,783 H.E.S.T. Australia Limited ATF Health Employees Superannuation Trust Australia 17 April 2014 15,939,130 Distribution of ordinary shareholdings
Size of holding Holders No. of units Percentage held 1-1,000 134 60,802 0.02 1,001 – 5,000 1,114 3,684,230 1.44 5,001 – 10,000 786 6,215,015 2.43 10,001 – 100,000 1,682 54,591,258 21.34 100,001 and over 237 191,281,860 74.77 Total 3,953 255,833,165 100.00
The number of shareholders with holdings less than a marketable parcel of ordinary shares is 245. Using the 16 July 2014 closing price of $0.26, an unmarketable parcel is one of 1,923 or fewer shares. Options The Company has on issue 153,246 options over unissued ordinary shares in the Company held by 23 option holders as at 16 July 2014. Equity security holders The names of the 20 largest holders of quoted equity securities as at 16 July 2014 are listed below.
Holder name No. of ordinary
shares Percentage of issued shares
JP Morgan Nominees Australia Limited 45,688,001 17.86 Pacific Custodians Pty Limited (Leveraged Share Plan Trust) 22,422,769 8.76 Citicorp Nominees Pty Limited 18,344,236 7.17 National Nominees Limited 7,513,046 2.94 Mr John Matheson Douglas 7,278,992 2.85 HSBC Custody Nominees (Australia) Limited 6,062,448 2.37 Citicorp Nominees Pty Limited (Colonial First State Inv A/C) 4,927,247 1.93 BNP Paribas Noms Pty Ltd (DRP) 3,876,211 1.52 Mr Charles Carnegie (Sorrento A/C) 3,500,000 1.37 Banlan Pty Ltd 2,000,000 0.78 BNP Paribas Noms (NZ) Ltd (DRP) 1,697,500 0.66 CTSF Pty Ltd (VC Superannuation Fund A/C) 1,690,000 0.66 Juntos Investments Pty Ltd (Juntos Superannuation A/C) 1,639,286 0.64 Bond Street Custodians Limited (Intelligent Inv Wholesale) 1,466,417 0.57 UBS Wealth Management Australia Nominees Pty Ltd 1,387,548 0.54 Mr Stanley Henry Goodhew 1,274,912 0.50 Mr Paul Stuart Nichols & Ms Therese Mary Nichols (Nichols Super Fund A/C) 1,100,287 0.43 DGSF Pty Ltd (Doug Grice Super Fund A/C) 1,000,000 0.39 Binch Investments Pty Ltd (Binch Super Fund A/C) 1,000,000 0.39 Troxfield Pty Ltd (Rosebery Super Fund A/C) 1,000,000 0.39 Pacific Custodians Pty Limited (COF Plans Ctrl) 957,973 0.37 Mr Bryan F Short (Short family S/F A/C) 910,000 0.36 Total 136,736,873 53.45 Voting rights The voting rights attached to the ordinary shares are that on a show of hands every member present at a meeting in person or by proxy shall have one vote and upon a poll each share shall have one vote.
116 | Coffey Annual Report 2014
Coffey International Limited
116 | Coffey Annual Report 2014
Shareholder information
Annual General Meeting Directors
Date: Tuesday, 4 November 2014 Time: 10.00am (Sydney time) Venue: AGL Theatre, Museum of Sydney Cnr Bridge and Phillip Streets Sydney NSW 2000
Dr John Mulcahy (Chairman) Mr John Douglas (Managing Director) Mr Urs Meyerhans (Finance Director) Mr Stuart Black AM Ms Leeanne Bond Mr Guy Cowan Ms Susan Oliver
Dividends Company Secretary
Final dividend: No final dividend has been declared with respect to the year ended 30 June 2014
Ms Jennifer Waldegrave E-mail: [email protected]
Share registry Registered office
Link Market Services Limited Level 12, 680 George Street Sydney NSW 2000 Australia Telephone: 1300 365 798 (within Australia) +61 1300 365 798 (outside Australia) Website: linkmarketservices.com.au
Level 19 Tower B 799 Pacific Highway Chatswood NSW 2067 Australia Telephone: +61 2 9406 1000 Facsimile: +61 2 9406 1002 E-mail: [email protected]
Securities exchange listing
Australian Securities Exchange (code: COF)
Website
coffey.com Electronic communication Auditor
Coffey encourages all shareholders to receive communications from the Group by e-mail if possible. Coffey publishes, and posts to its website, its Annual Financial Report by September each year. This Financial Report is lodged with the ASX and ASIC and is also available within the investor section of the Coffey website.
KPMG 10 Shelley Street Sydney NSW 2000

Coffey Annual Report 2014 | 117
coffey.com
Registered office
Level 19, Tower B – Citadel Tower 799 Pacific Highway Chatswood NSW 2067 Australia
t: +61 2 9406 1000 f: +61 2 9406 1002 e: [email protected]
Share registry
Link Market Services Limited Level 12 680 George Street Sydney NSW 2000 Australia
t: 1300 365 798 (within Australia) +61 1300 365 798 (outside Australia) w: linkmarketservices.com.au