CLIMATE CHANGE AND FARMING JAMES LLOYD - COTSWOLDS AONB CLIMATE CHANGE ADVISER.

Coffee Farming and Climate Change in EthiopiaImpacts, Forecasts, Resilience and Opportunities
Summary Report 2017
ECFFEnvironment & Coffee Forest Forum

The Strategic Climate Institutions Programme (SCIP)
The SCIP Fund was designed to build Ethiopia’s capacity to cope with climate change across the public, private and civil society sectors and to respond to the challenges of transitioning to a Climate Resilient Green Economy (CRGE).
Building a climate-resilient coffee economy for Ethiopia
A two-year SCIP project undertaken by the Royal Botanic Gardens, Kew, and the Environment and Coffee Forest Forum (ECFF), and partners. The aim of the project was to provide a climate-resilient coffee economy strategy for Ethiopia, based on a rigorous assessment of the influence of climate change on coffee-producing areas and wild coffee forests. The climate resilient strategy was developed in close partnership with stakeholders, including government and non-government bodies, coffee producers and industry. A summary of the strategy is presented here as the report Coffee Farming and Climate Change in Ethiopia – Impacts, Forecasts, Resilience and Opportunities.
Front and back cover picture: Sorting coffee by hand Leaves of Arabica coffee

Coffee Farming and Climate Change in Ethiopia: Key messages
The coffee growing landscape of Ethiopia is varied and complex Coffee farming in Ethiopia takes place over a vast area, under a wide variety of production systems and various growing conditions, with many different cultivation practices.
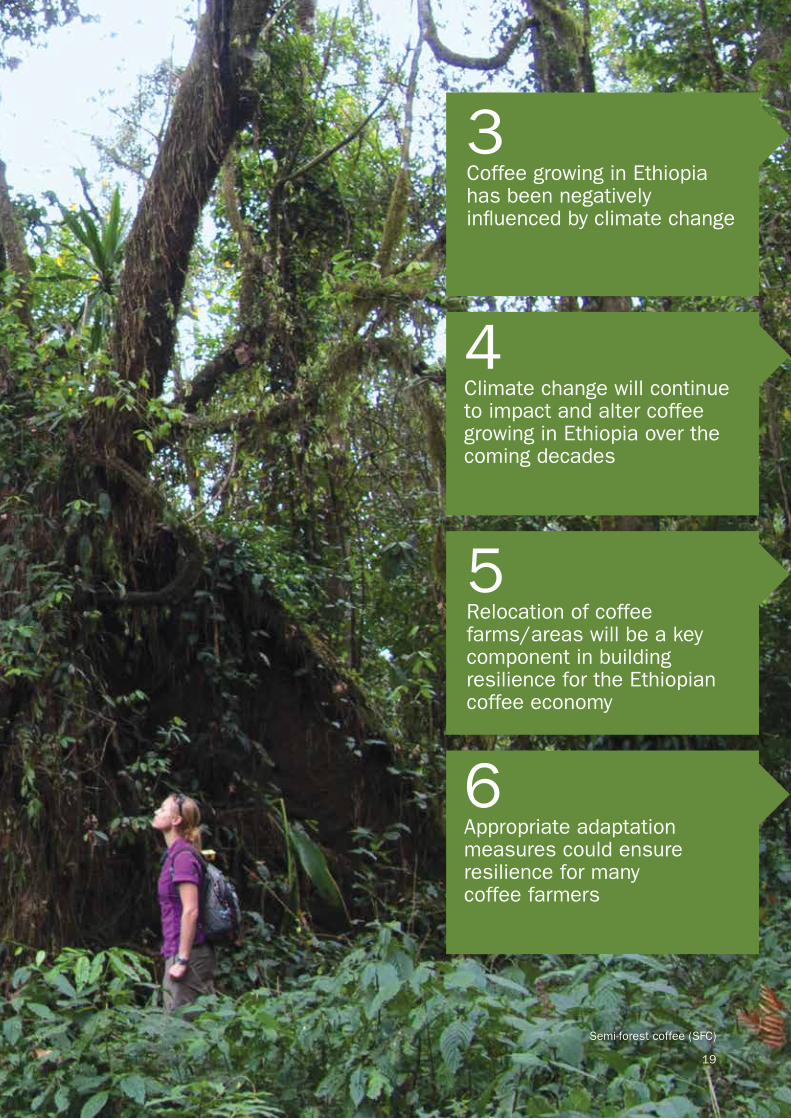
Coffee growing in Ethiopia has been negatively influenced by climate change and deforestationFeedback from coffee farming communities, and observations on coffee production and coffee plant stress, indicate that climate change has already had a negative impact. In some coffee areas, there has been dramatic forest loss.
Relocation of coffee farms/areas will be a key component in building resilience for the Ethiopian coffee economyMany higher altitude areas will become more suitable for coffee production throughout this century. Migration to these areas will be vital for ensuring resilience in the Ethiopian coffee sector.
The climate of Africa and Ethiopia has changed and will continue to change throughout this centuryThe climate of Africa and Ethiopia has changed. Ethiopia has experienced an increase in temperature of around 0.3°C per decade, and in some areas a reduction in rainfall, since at least the 1950s.
Climate change will continue to impact and alter coffee growing in Ethiopia over the coming decadesMany areas that are suitable for coffee growing in the present day will become less suitable in the future, and in some cases unsuitable. Conversely, substantial areas that were previously unsuitable for coffee farming will become suitable.
Appropriate adaptation measures could ensure resilience for many coffee farmersOn-farm adaptation and improvements in coffee farming practices could ensure resilience for many farmers.
1
3
5
2
4
6
1
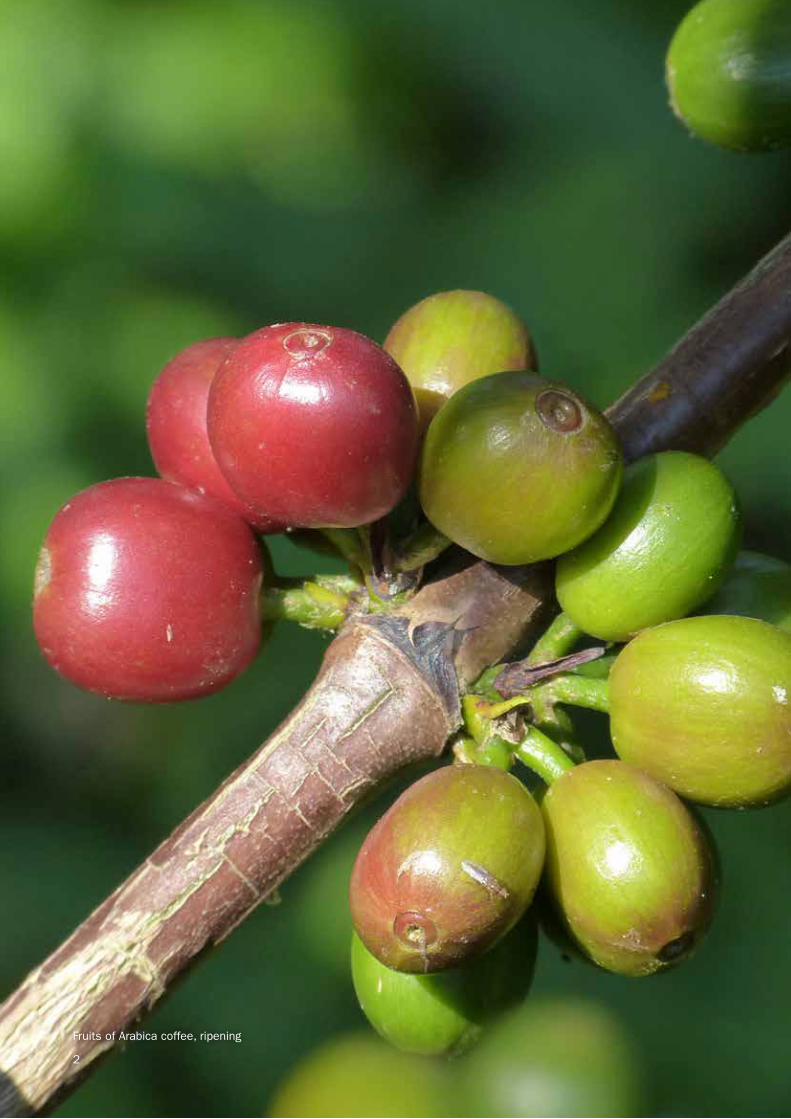
Fruits of Arabica coffee, ripening
2
Contents
The coffee growing landscape of Ethiopia 6 is varied and complexCoffee growing in Ethiopia 6Coffee consumption in Ethiopia 6Coffee farming systems 6Coffee producing regions and areas 8Overview of Ethiopia’s coffee growing climate 10
Africa and Ethiopia’s climate has changed 13and will continue to changeObserved changes 13Predicted future change 16
Coffee growing in Ethiopia has been negatively 20influenced by climate changePresent-day suitability for coffee growing in Ethiopia 20Feedback from coffee farmers and direct observation 21
Climate change will continue to impact 24and alter coffee growing in Ethiopia over the coming decadesClimate change modelling for coffee production 24in Ethiopia. 1960 to 2099
Relocation of coffee farms/areas will be 30a key component in building resiliencefor the Ethiopian coffee economy
Appropriate adaptation measures could 31ensure resilience for many coffee farmers
Main recommendations 32
References 33
Endnotes 35
Overview of methods 36
3

Coffee Farming and Climate Change in Ethiopia Introduction
44
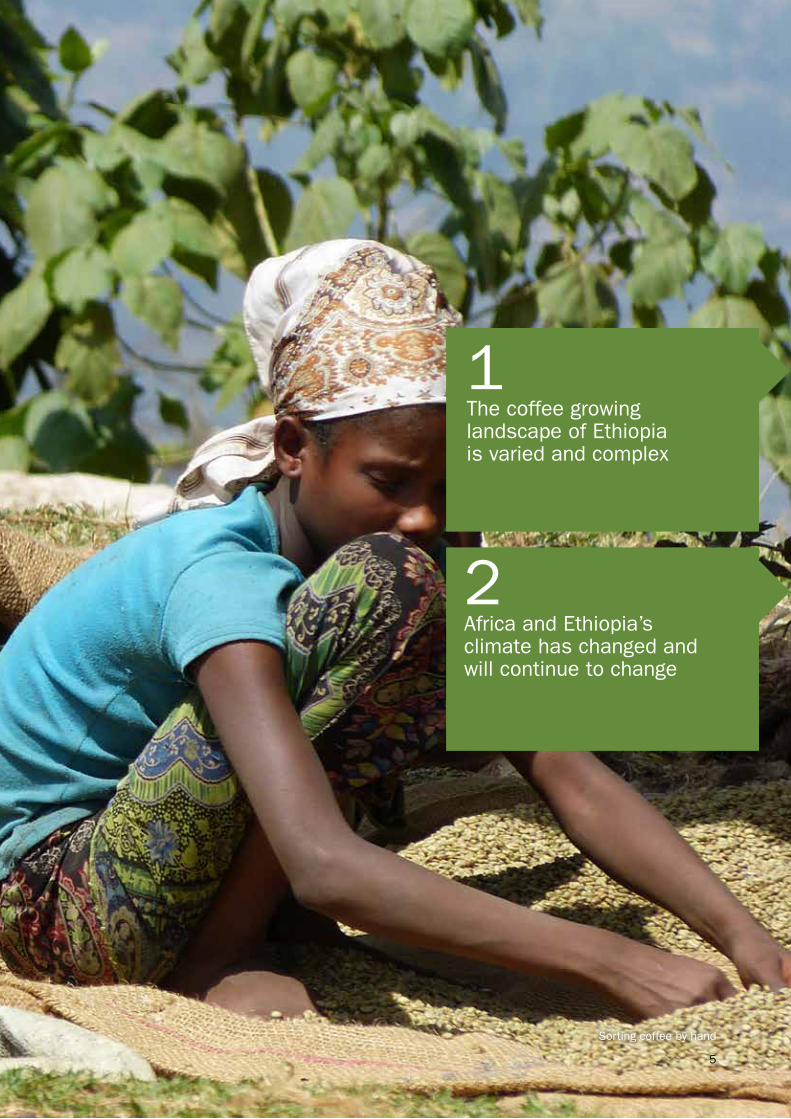
Sorting coffee by hand
1 The coffee growing landscape of Ethiopia is varied and complex
2Africa and Ethiopia’s climate has changed and will continue to change
5
The coffee growing landscape of Ethiopia is varied and complex
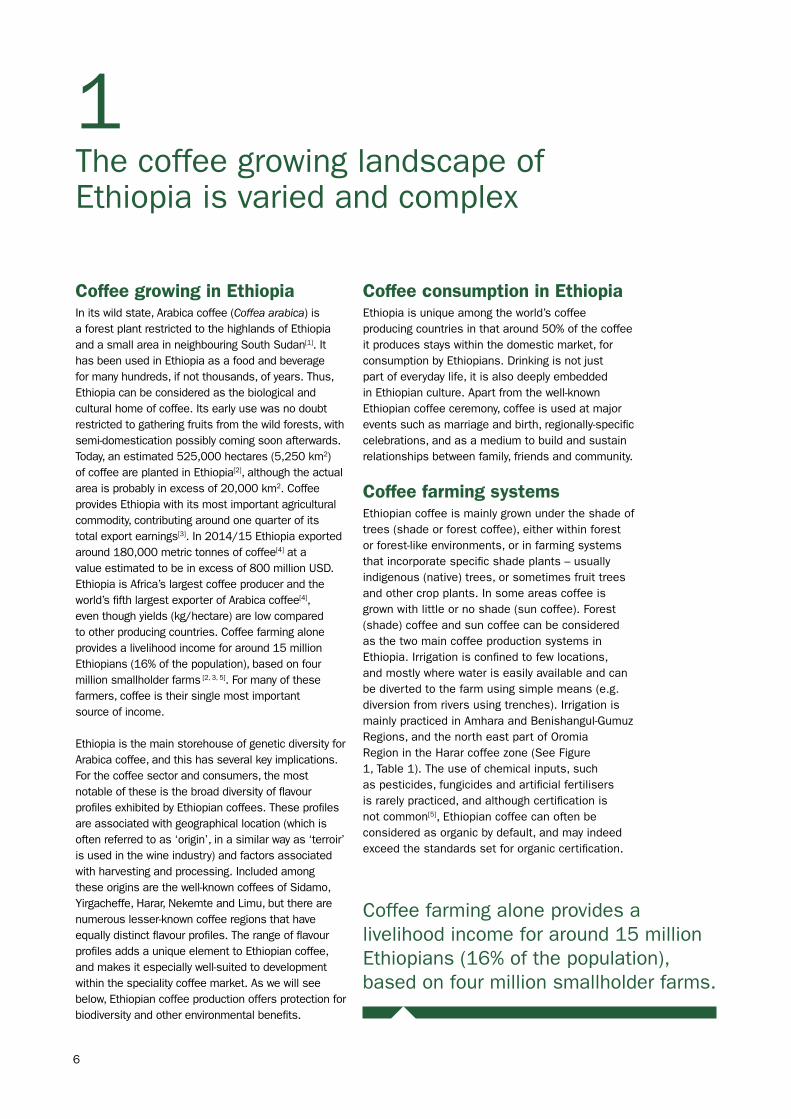
Coffee growing in EthiopiaIn its wild state, Arabica coffee (Coffea arabica) is a forest plant restricted to the highlands of Ethiopia and a small area in neighbouring South Sudan[1]. It has been used in Ethiopia as a food and beverage for many hundreds, if not thousands, of years. Thus, Ethiopia can be considered as the biological and cultural home of coffee. Its early use was no doubt restricted to gathering fruits from the wild forests, with semi-domestication possibly coming soon afterwards. Today, an estimated 525,000 hectares (5,250 km2) of coffee are planted in Ethiopia[2], although the actual area is probably in excess of 20,000 km2. Coffee provides Ethiopia with its most important agricultural commodity, contributing around one quarter of its total export earnings[3]. In 2014/15 Ethiopia exported around 180,000 metric tonnes of coffee[4] at a value estimated to be in excess of 800 million USD. Ethiopia is Africa’s largest coffee producer and the world’s fifth largest exporter of Arabica coffee[4], even though yields (kg/hectare) are low compared to other producing countries. Coffee farming alone provides a livelihood income for around 15 million Ethiopians (16% of the population), based on four million smallholder farms [2, 3, 5]. For many of these farmers, coffee is their single most important source of income.
Ethiopia is the main storehouse of genetic diversity for Arabica coffee, and this has several key implications. For the coffee sector and consumers, the most notable of these is the broad diversity of flavour profiles exhibited by Ethiopian coffees. These profiles are associated with geographical location (which is often referred to as ‘origin’, in a similar way as ‘terroir’ is used in the wine industry) and factors associated with harvesting and processing. Included among these origins are the well-known coffees of Sidamo, Yirgacheffe, Harar, Nekemte and Limu, but there are numerous lesser-known coffee regions that have equally distinct flavour profiles. The range of flavour profiles adds a unique element to Ethiopian coffee, and makes it especially well-suited to development within the speciality coffee market. As we will see below, Ethiopian coffee production offers protection for biodiversity and other environmental benefits.
Coffee consumption in EthiopiaEthiopia is unique among the world’s coffee producing countries in that around 50% of the coffee it produces stays within the domestic market, for consumption by Ethiopians. Drinking is not just part of everyday life, it is also deeply embedded in Ethiopian culture. Apart from the well-known Ethiopian coffee ceremony, coffee is used at major events such as marriage and birth, regionally-specific celebrations, and as a medium to build and sustain relationships between family, friends and community.
Coffee farming systemsEthiopian coffee is mainly grown under the shade of trees (shade or forest coffee), either within forest or forest-like environments, or in farming systems that incorporate specific shade plants – usually indigenous (native) trees, or sometimes fruit trees and other crop plants. In some areas coffee is grown with little or no shade (sun coffee). Forest (shade) coffee and sun coffee can be considered as the two main coffee production systems in Ethiopia. Irrigation is confined to few locations, and mostly where water is easily available and can be diverted to the farm using simple means (e.g. diversion from rivers using trenches). Irrigation is mainly practiced in Amhara and Benishangul-Gumuz Regions, and the north east part of Oromia Region in the Harar coffee zone (See Figure 1, Table 1). The use of chemical inputs, such as pesticides, fungicides and artificial fertilisers is rarely practiced, and although certification is not common[5], Ethiopian coffee can often be considered as organic by default, and may indeed exceed the standards set for organic certification.
1
Coffee farming alone provides a livelihood income for around 15 million Ethiopians (16% of the population), based on four million smallholder farms.
6

Coffee gardens are often planted close to dwellings and range from a few plants up to a plot of around 100 plants. Coffee gardens are usually part of a mixed cropping system and provide coffee for the household, local consumption or the wider market. Coffee gardens are planted in either shade or sun.
Agroforestry systems are typically family run, of between a quarter and one hectare, and comprise a wide variety of crops in association with indigenous (native) forest cover. The coffee is usually grown under the shade of indigenous trees with other crops on the margins, or in more open places. In the Sidamo area (including Yirgacheffe), coffee is almost exclusively produced within an intensively-managed agroforestry system.
Coffee farms/plots are dedicated to coffee growing for profit, and are typically around one to two hectares, sometimes less (a quarter hectare) or more (five hectares). The area is mostly dedicated to coffee growing, with few other crops, or may be intercropped, as in agroforestry systems. Most coffee farms use shade, provided by tree cover, but some are situated in partial to full sun.
Coffee plantations are large and intensively-managed systems, mostly planted within forest (shade). There is no definitive size limit for a plantation but generally they are more than ten hectares. Large commercial plantations (e.g. over 500 hectares) are uncommon and contribute less than 5% of exportable production.
Forest (shade) coffee can be divided into two broad categories: forest coffee and semi-forest coffee. The forest coffee system uses wild stands of coffee, which exist naturally within the forest, and the farmer undertakes minimal management and intervention. Semi-forest coffee is more intensive, with increased farming interventions (e.g. thinning of trees, understory clearance and weed cutting, and planting of coffee seedlings).
Sun coffee farming systems are usually small and mostly fall into the category of coffee gardens, which are planted in a regular-sized plot at high density. Sun coffee is usually found at higher altitudes (1700–2100 m), often near dwellings, and is characteristic of coffee farming in the Harar coffee zone.
7
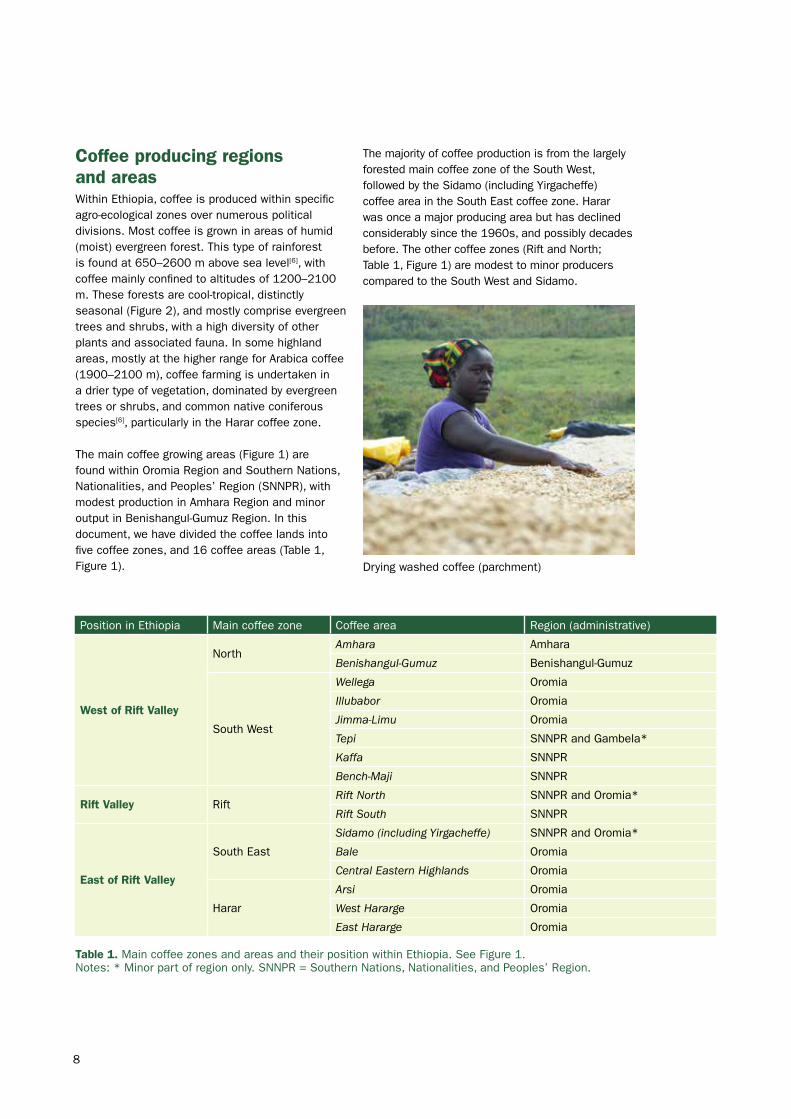
Coffee producing regions and areasWithin Ethiopia, coffee is produced within specific agro-ecological zones over numerous political divisions. Most coffee is grown in areas of humid (moist) evergreen forest. This type of rainforest is found at 650–2600 m above sea level[6], with coffee mainly confined to altitudes of 1200–2100 m. These forests are cool-tropical, distinctly seasonal (Figure 2), and mostly comprise evergreen trees and shrubs, with a high diversity of other plants and associated fauna. In some highland areas, mostly at the higher range for Arabica coffee (1900–2100 m), coffee farming is undertaken in a drier type of vegetation, dominated by evergreen trees or shrubs, and common native coniferous species[6], particularly in the Harar coffee zone.
The main coffee growing areas (Figure 1) are found within Oromia Region and Southern Nations, Nationalities, and Peoples’ Region (SNNPR), with modest production in Amhara Region and minor output in Benishangul-Gumuz Region. In this document, we have divided the coffee lands into five coffee zones, and 16 coffee areas (Table 1, Figure 1).
The majority of coffee production is from the largely forested main coffee zone of the South West, followed by the Sidamo (including Yirgacheffe) coffee area in the South East coffee zone. Harar was once a major producing area but has declined considerably since the 1960s, and possibly decades before. The other coffee zones (Rift and North; Table 1, Figure 1) are modest to minor producers compared to the South West and Sidamo.
Table 1. Main coffee zones and areas and their position within Ethiopia. See Figure 1. Notes: * Minor part of region only. SNNPR = Southern Nations, Nationalities, and Peoples’ Region.
8
Position in Ethiopia Main coffee zone Coffee area Region (administrative)
West of Rift Valley
NorthAmhara Amhara
Benishangul-Gumuz Benishangul-Gumuz
South West
Wellega Oromia
Illubabor Oromia
Jimma-Limu Oromia
Tepi SNNPR and Gambela*
Kaffa SNNPR
Bench-Maji SNNPR
Rift Valley RiftRift North SNNPR and Oromia*
Rift South SNNPR
East of Rift Valley
South East
Sidamo (including Yirgacheffe) SNNPR and Oromia*
Bale Oromia
Central Eastern Highlands Oromia
Harar
Arsi Oromia
West Hararge Oromia
East Hararge Oromia
Drying washed coffee (parchment)
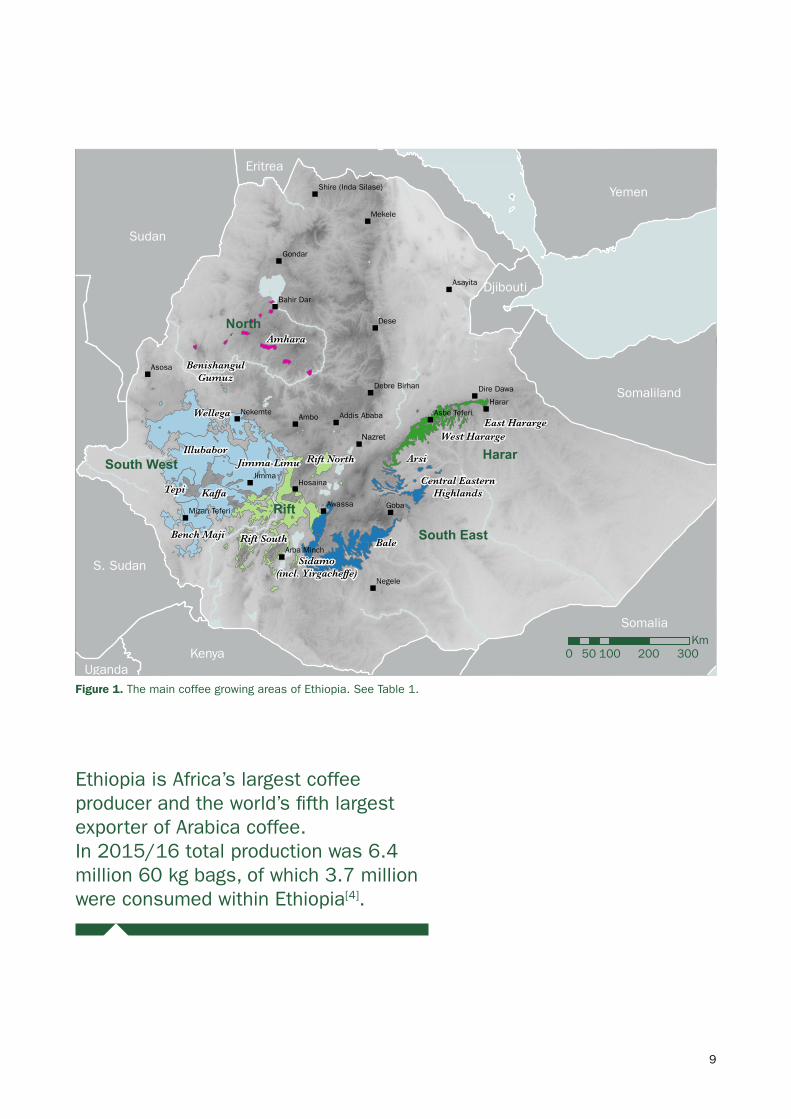
Figure 1. The main coffee growing areas of Ethiopia. See Table 1.
"
"
"
"
"
"
"
" "
"
" """
"
""
" ""
"
"
Illubabor
Wellega
Jimma-Limu
Kaffa
Rift North
Tepi
Bench MajiBale
West Hararge
Sidamo(incl. Yirgacheffe)
Rift South
Arsi
East Hararge
Amhara
Central EasternHighlands
BenishangulGumuz
Illubabor
Wellega
Jimma-Limu Rift North
Bench MajiBale
West Hararge
Sidamo(incl. Yirgacheffe)
Rift South
Arsi
East Hararge
Amhara
Central EasternHighlands
BenishangulGumuz
KaffaTepi
North
South West
South East
Rift
Harar
Sudan
Somalia
Yemen
Somaliland
S. Sudan
Kenya
Eritrea
Uganda
Djibouti
Goba
Ambo
Dese
Harar
Asosa
Negele
Nazret
Gondar
Mekele
Hosaina
Asayita
Dire Dawa
Bahir Dar
Addis Ababa
Debre Birhan
Shire (Inda Silase)
Jimma
Awassa
Nekemte
Arba Minch
Asbe Teferi
Mizan Teferi
9
0 50 100 200 300Km
Ethiopia is Africa’s largest coffee producer and the world’s fifth largest exporter of Arabica coffee.In 2015/16 total production was 6.4 million 60 kg bags, of which 3.7 million were consumed within Ethiopia[4].
10
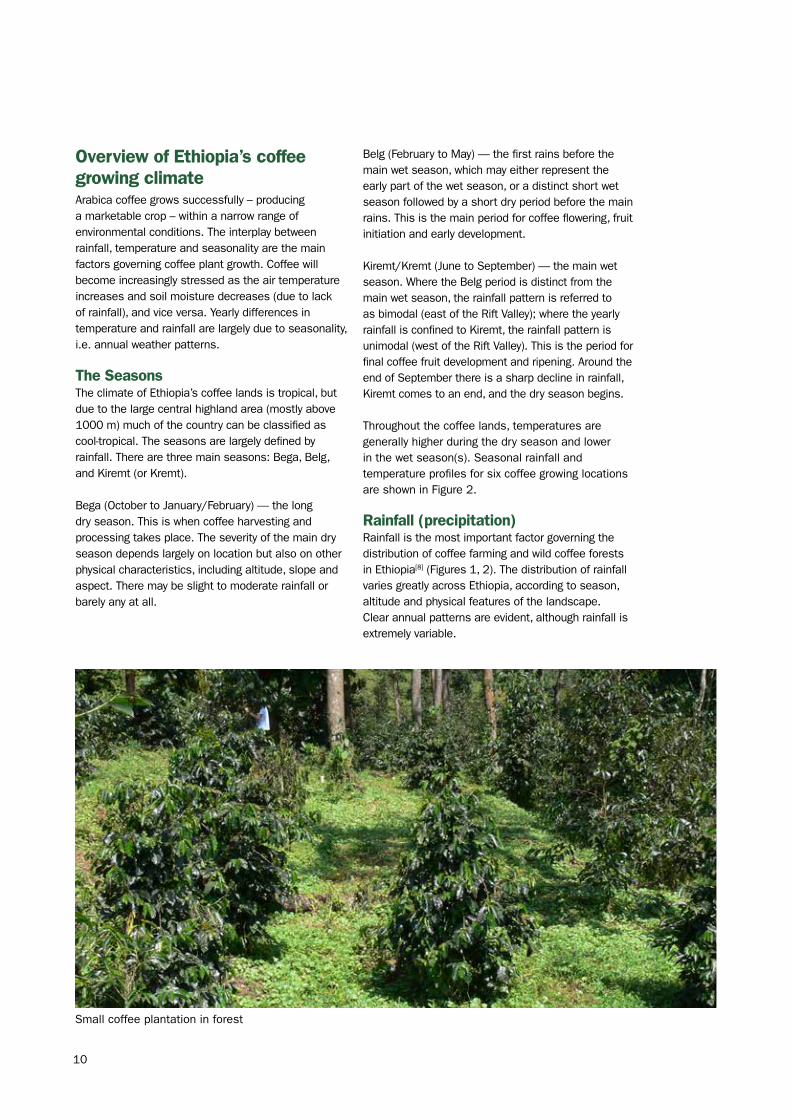
Small coffee plantation in forest
Overview of Ethiopia’s coffee growing climateArabica coffee grows successfully – producing a marketable crop – within a narrow range of environmental conditions. The interplay between rainfall, temperature and seasonality are the main factors governing coffee plant growth. Coffee will become increasingly stressed as the air temperature increases and soil moisture decreases (due to lack of rainfall), and vice versa. Yearly differences in temperature and rainfall are largely due to seasonality, i.e. annual weather patterns.
The SeasonsThe climate of Ethiopia’s coffee lands is tropical, but due to the large central highland area (mostly above 1000 m) much of the country can be classified as cool-tropical. The seasons are largely defined by rainfall. There are three main seasons: Bega, Belg, and Kiremt (or Kremt).
Bega (October to January/February) — the long dry season. This is when coffee harvesting and processing takes place. The severity of the main dry season depends largely on location but also on other physical characteristics, including altitude, slope and aspect. There may be slight to moderate rainfall or barely any at all.
Belg (February to May) — the first rains before the main wet season, which may either represent the early part of the wet season, or a distinct short wet season followed by a short dry period before the main rains. This is the main period for coffee flowering, fruit initiation and early development.
Kiremt/Kremt (June to September) — the main wet season. Where the Belg period is distinct from the main wet season, the rainfall pattern is referred to as bimodal (east of the Rift Valley); where the yearly rainfall is confined to Kiremt, the rainfall pattern is unimodal (west of the Rift Valley). This is the period for final coffee fruit development and ripening. Around the end of September there is a sharp decline in rainfall, Kiremt comes to an end, and the dry season begins. Throughout the coffee lands, temperatures are generally higher during the dry season and lower in the wet season(s). Seasonal rainfall and temperature profiles for six coffee growing locations are shown in Figure 2.
Rainfall (precipitation)Rainfall is the most important factor governing the distribution of coffee farming and wild coffee forests in Ethiopia[8] (Figures 1, 2). The distribution of rainfall varies greatly across Ethiopia, according to season, altitude and physical features of the landscape. Clear annual patterns are evident, although rainfall is extremely variable.

Figure 2. Rainfall map of Ethiopia (background), and rainfall and temperature profiles for six coffee growing locations. Bi-modal rainfall pattern (east of Rift Valley); uni-modal rainfall (west of Rift Valley). Graphs based on historical climate data (30 year averages) and WorldClim[7]. Background yearly rainfall map of Ethiopia from WorldClim[7]. See Endnotes.
11
40450
Gelemso
35400
35030
300
25
250
20
200
15150
10100
5050
Jan Feb Mar Apr May Jun Jul Aug Sep Oct Nov Dec00
40450
Maji
35400
35030
300
25
250
20
200
15150
10100
550
Jan Feb Mar Apr May Jun Jul Aug Sep Oct Nov Dec00
40450
Limu
35400
35030
300
25
250
20
200
15150
10100
550
Jan Feb Mar Apr May Jun Jul Aug Sep Oct Nov Dec00
Tem
pera
ture
(°C
)
40450
Yirgacheffe
35400
35030
300
25
250
20
200
15150
10100
550
Jan Feb Mar Apr May Jun Jul Aug Sep Oct Nov Dec00
Tem
pera
ture
(°C
)
450 40
Bahir Dar
400 35
350
300
30
250
25
200
20
15015
10010
50 5
Jan Feb Mar Apr May Jun Jul Aug Sep Oct Nov Dec0 0
Rai
nfal
l (m
m)
40450
Bale
35400
35030
300
25
250
20
200
15150
10100
550
Jan Feb Mar Apr May Jun Jul Aug Sep Oct Nov Dec00
Rai
nfal
l (m
m)
1,200 -1,600 mm
800 - 1,200 mm
400 - 800 mm
< 400 mm
> 1,600 mm
The highest rainfall is on the western side of the Rift Valley, in the main South West coffee zone. The coffee areas of the South West typically receive 1500–2100 mm of rain per year. In the southern part of South West coffee zone there is generally less annual rainfall (1300–1700 mm per year). The North coffee zone, including Amhara and Benishangul-Gumuz coffee areas, receives 1400–1800 mm per year, although the rains come later in the year and end earlier, compared to the South West. This results in a shorter, more intense wet season and a longer dry season (Figure 2, and Endnotes).
On the eastern side of the Rift Valley, the Harar coffee zone usually receives far less total rainfall than all other coffee areas (800–1200 mm per year). The Sidamo coffee area in the south is wetter (1200–1600 mm per year), and the Bale coffee area somewhere in-between (1000–1400 mm per year).
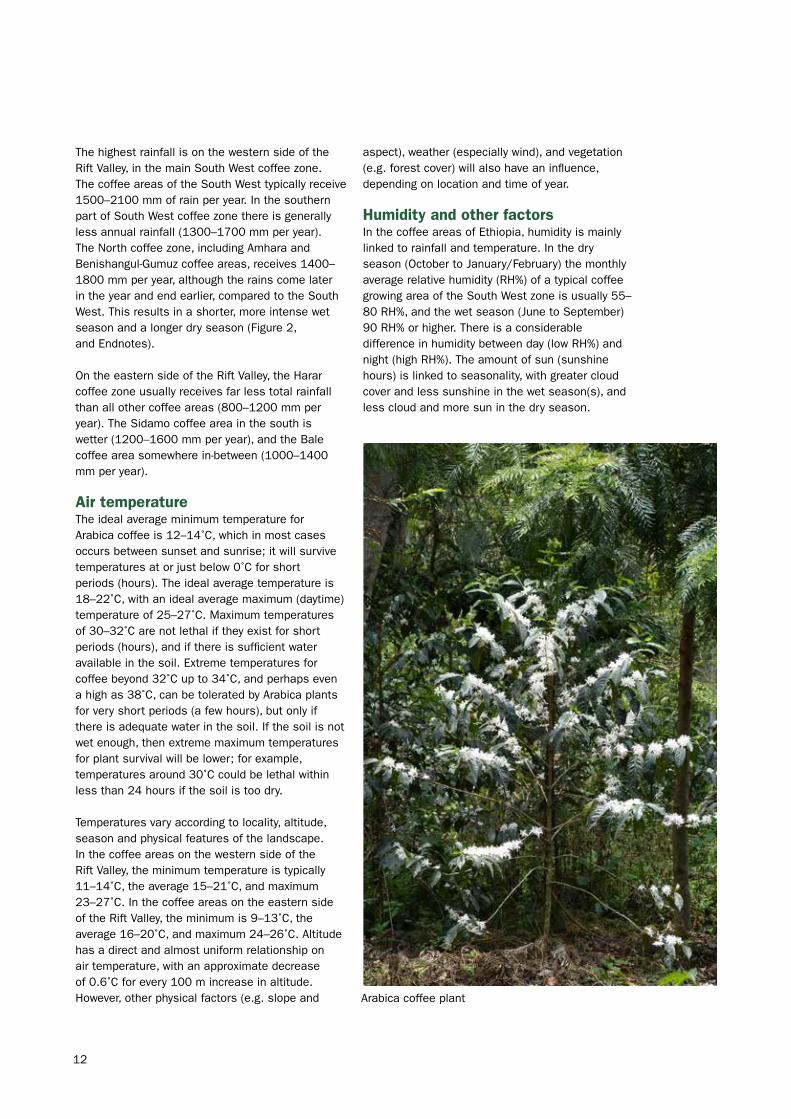
Air temperatureThe ideal average minimum temperature for Arabica coffee is 12–14˚C, which in most cases occurs between sunset and sunrise; it will survive temperatures at or just below 0˚C for short periods (hours). The ideal average temperature is 18–22˚C, with an ideal average maximum (daytime) temperature of 25–27˚C. Maximum temperatures of 30–32˚C are not lethal if they exist for short periods (hours), and if there is sufficient water available in the soil. Extreme temperatures for coffee beyond 32˚C up to 34˚C, and perhaps even a high as 38˚C, can be tolerated by Arabica plants for very short periods (a few hours), but only if there is adequate water in the soil. If the soil is not wet enough, then extreme maximum temperatures for plant survival will be lower; for example, temperatures around 30˚C could be lethal within less than 24 hours if the soil is too dry.
Temperatures vary according to locality, altitude, season and physical features of the landscape. In the coffee areas on the western side of the Rift Valley, the minimum temperature is typically 11–14˚C, the average 15–21˚C, and maximum 23–27˚C. In the coffee areas on the eastern side of the Rift Valley, the minimum is 9–13˚C, the average 16–20˚C, and maximum 24–26˚C. Altitude has a direct and almost uniform relationship on air temperature, with an approximate decrease of 0.6˚C for every 100 m increase in altitude. However, other physical factors (e.g. slope and
aspect), weather (especially wind), and vegetation (e.g. forest cover) will also have an influence, depending on location and time of year.
Humidity and other factorsIn the coffee areas of Ethiopia, humidity is mainly linked to rainfall and temperature. In the dry season (October to January/February) the monthly average relative humidity (RH%) of a typical coffee growing area of the South West zone is usually 55–80 RH%, and the wet season (June to September) 90 RH% or higher. There is a considerable difference in humidity between day (low RH%) and night (high RH%). The amount of sun (sunshine hours) is linked to seasonality, with greater cloud cover and less sunshine in the wet season(s), and less cloud and more sun in the dry season.
12
Arabica coffee plant
Africa and Ethiopia’s climate has changed and will continue to change
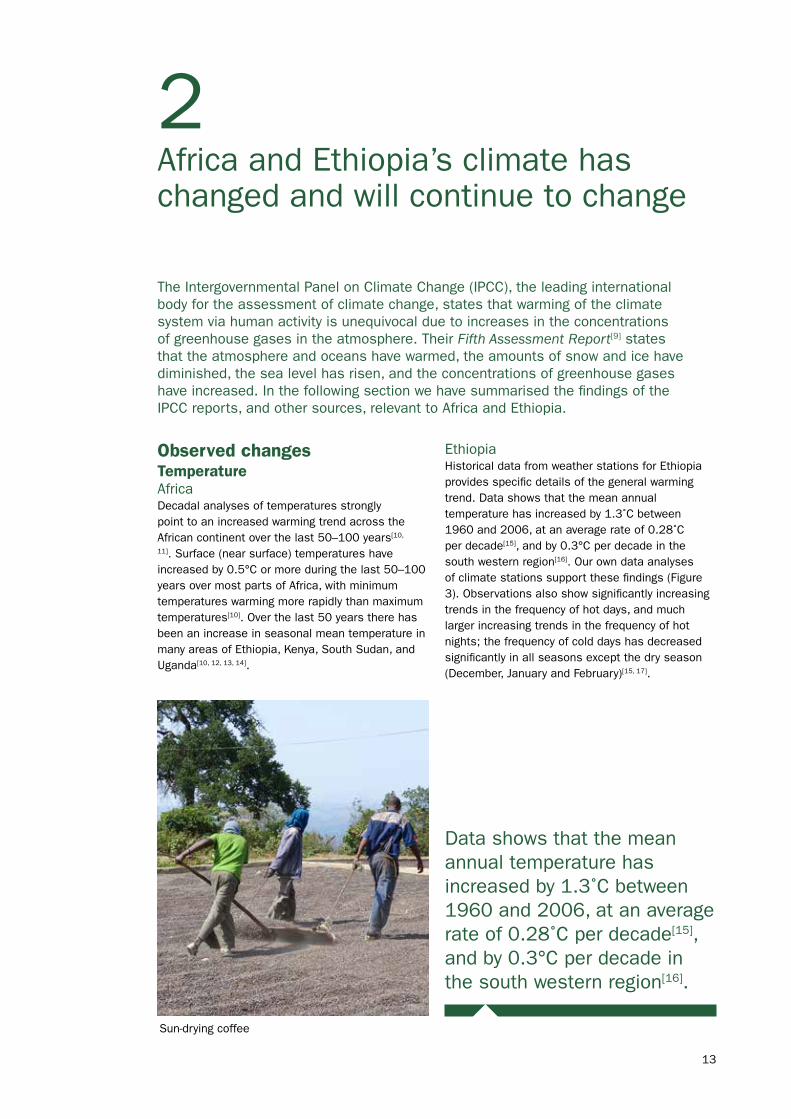
The Intergovernmental Panel on Climate Change (IPCC), the leading international body for the assessment of climate change, states that warming of the climate system via human activity is unequivocal due to increases in the concentrations of greenhouse gases in the atmosphere. Their Fifth Assessment Report[9] states that the atmosphere and oceans have warmed, the amounts of snow and ice have diminished, the sea level has risen, and the concentrations of greenhouse gases have increased. In the following section we have summarised the findings of the IPCC reports, and other sources, relevant to Africa and Ethiopia.
Observed changesTemperatureAfricaDecadal analyses of temperatures strongly point to an increased warming trend across the African continent over the last 50–100 years[10,
11]. Surface (near surface) temperatures have increased by 0.5°C or more during the last 50–100 years over most parts of Africa, with minimum temperatures warming more rapidly than maximum temperatures[10]. Over the last 50 years there has been an increase in seasonal mean temperature in many areas of Ethiopia, Kenya, South Sudan, and Uganda[10, 12, 13, 14].
EthiopiaHistorical data from weather stations for Ethiopia provides specific details of the general warming trend. Data shows that the mean annual temperature has increased by 1.3˚C between 1960 and 2006, at an average rate of 0.28˚C per decade[15], and by 0.3°C per decade in the south western region[16]. Our own data analyses of climate stations support these findings (Figure 3). Observations also show significantly increasing trends in the frequency of hot days, and much larger increasing trends in the frequency of hot nights; the frequency of cold days has decreased significantly in all seasons except the dry season (December, January and February)[15, 17].
2
13
Sun-drying coffee
Data shows that the mean annual temperature has increased by 1.3˚C between 1960 and 2006, at an average rate of 0.28˚C per decade[15], and by 0.3°C per decade in the south western region[16].

Coffee making ceremony
14

Rainfall (precipitation)AfricaMost areas of the African continent lack sufficient climate station data to draw conclusions about trends in annual rainfall over the past century. In many regions there are also discrepancies between different rainfall data sets, and precipitation patterns over the continent are extremely complex[10]. Precipitation in eastern Africa shows a high degree of variability with respect to location and timing (seasonality) and is highly influenced by the physical characteristics of the land surface (e.g. the position and height of mountains)[10]. Despite these constraints and difficulties, it has been reported that over the last three decades rainfall has decreased by around 15% over eastern Africa, in the main growing season (March and May/June)[12, 13, 14, 18]. The suggested link to the decrease in rainfall is rapid warming of the Indian Ocean, which causes an increase in convection and precipitation over the tropical Indian Ocean, contributing to the decrease in rainfall over the continental land surface. Other studies also show a decline in the March-to-May seasonal rainfall over eastern Africa[10].
EthiopiaIt has been stated[15] that the strong variability within Ethiopia’s annual and decadal rainfall makes it difficult to detect long term trends, and that there is no statistically significant trend in observed mean rainfall in any season for which climate data is available (1960–2006). However, based on data from quality-controlled climate station observations, it has been shown that spring (Belg) and summer (Kiremt) rains have declined by 15–20% since the mid-1970s and late 2000s, in southern, south-western and south-eastern Ethiopia[18, 19], particularly in the period of the early rains (Belg – February to May) in the south east and east of the country. An overall reduction of rainfall of around 10% across Ethiopia (1948–2006) has also been reported[16]. See also Figure 3.
Figure 3. Historical climate data from Gore (South West Ethiopia), showing an increase in average (mean) air temperature, and decrease in total annual rainfall, since 1953. Solid red line and red dots show recorded annual mean temperatures (gaps in the line represent missing temperature records); blue shading/peaks show recorded total annual rainfall. Dashed red line represents the temperature trend (increasing); dashed blue line represents the annual rainfall trend (decreasing).
21
22
2012
2010
2008
2006
2004
2002
2000
1998
1996
1994
1992
1990
1988
1986
1984
1982
1980
1978
1976
1974
1972
1970
1968
1966
1964
1962
1960
1958
1956
1954
1953
3000
3500
20 2500
19 2000
18 1500
17 1000
16 500
15 0
Mea
n An
nual
Tem
pera
ture
(0C
)
Total Annual Rainfall (m
m)
15
Predicted future changeTemperatureAfricaThe Representative Concentration Pathways (RCP) are the latest generation of modelled scenarios that provide input to climate models. Warming projections under a low emissions RCP (RCP 2.6) indicate that Africa will see a change of around 1°C (and less than 2°C) by the end of this century, relative to the late 20th century mean annual temperature baseline[10, 11]. Under a high emissions RCP (RCP 8.5) an increase of more than 2°C could occur by the mid-century across much of Africa and exceed 4°C by the end of the century[10] (Figure 4). It is likely that land temperatures over Africa will rise faster than the global land average, particularly in the more arid regions, and that the rate of increase in minimum temperatures will exceed that of maximum temperatures[10].
EthiopiaThe mean annual temperature of Ethiopia is projected to increase by 1.1–3.1˚C by the 2060s, and 1.5–5.1˚C by the 2090s, with the scale of the projections depending on the emission scenario[15]. Climate model projections under the A2 and B1 scenarios show warming in all four seasons across the country, which could cause a higher frequency of heat waves as well as higher rates of evapotranspiration[21].
Rainfall (precipitation)AfricaProjected rainfall change over Africa in the mid and late century is uncertain. There is low confidence in projected increases of heavy precipitation over most of Africa, except East Africa, where there is a high confidence in a projected increase in heavy precipitation[22]. However, regional climate model studies also suggest drying over most parts of Uganda, Kenya, and South Sudan in August and September by the end of the 21st century[23].
EthiopiaProjections from different General CirculationModels (GCMs) are broadly consistent in indicatingincreases in annual rainfall in Ethiopia[9, 10], butthese increases are largely due to increasingrainfall in the October–December period in southernEthiopia[15]. Projections of change in the rainyseasons of April–June and July–September, whichaffect larger areas of Ethiopia, are much more uncertain but tend towards slight increases in the south west and deceases in the north east[15]. In the Ethiopian Highlands, a region of high and complex topography, projections from the GCMs also indicate likely increases in rainfall, and extreme rainfall, by the end of the 21st century[10]. However, these future trends are not consistent with observed decreasing rainfall for many places in Ethiopia (from the 1950s to the present day). Overall, projections based on GCMs for Ethiopia are highly variable[21] and for some regions the various GCMs do not agree on the direction of precipitation trend.
Under a high emissions RCP (RCP 8.5) an increase of more than 2°C could occur by the mid-century across much of Africa and exceed 4°C by the end of the century[10].
16
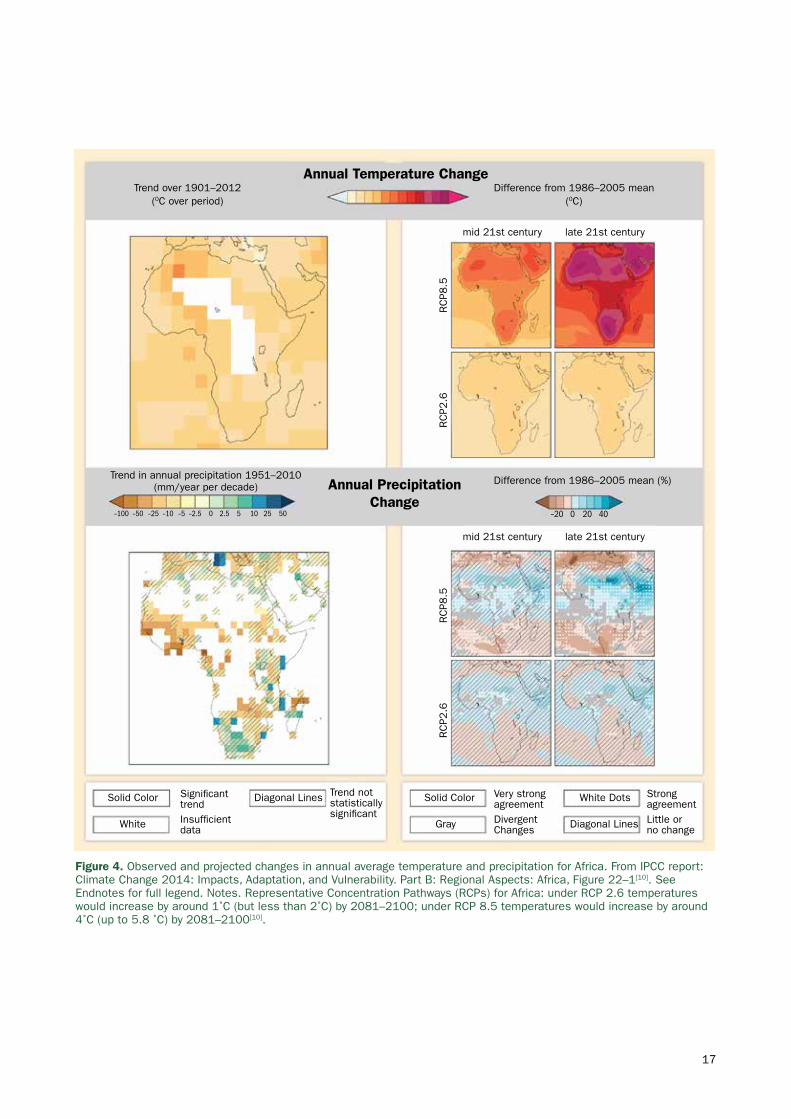
Figure 4. Observed and projected changes in annual average temperature and precipitation for Africa. From IPCC report: Climate Change 2014: Impacts, Adaptation, and Vulnerability. Part B: Regional Aspects: Africa, Figure 22–1[10]. See Endnotes for full legend. Notes. Representative Concentration Pathways (RCPs) for Africa: under RCP 2.6 temperatures would increase by around 1˚C (but less than 2˚C) by 2081–2100; under RCP 8.5 temperatures would increase by around 4˚C (up to 5.8 ˚C) by 2081–2100[10].
Annual Temperature Change
Annual Precipitation Change
Difference from 1986–2005 mean(0C)
Difference from 1986–2005 mean (%)
mid 21st century
mid 21st century
RC
P8.5
RC
P8.5
RC
P2.6
RC
P2.6
Solid Color Solid ColorDiagonal Lines
Insufficientdata
Trend notstatisticallysignificant Divergent
ChangesLittle orno change
Significanttrend
–100 –50 –25 –10 –5 –2.5 0 2.5 5 10 25 50 –20 0 20 40
Very strongagreement
Strongagreement
Diagonal Lines
White Dots
White Gray
late 21st century
late 21st century
Trend over 1901–2012(0C over period)
Trend in annual precipitation 1951–2010(mm/year per decade)
17

Building a Climate Resilient Coffee Economy for Ethiopia
SCIP project findings, analyses and main recommendations
18
3 Coffee growing in Ethiopia has been negatively influenced by climate change
5 Relocation of coffeefarms/areas will be a keycomponent in buildingresilience for the Ethiopiancoffee economy
4Climate change will continue to impact and alter coffee growing in Ethiopia over the coming decades
6Appropriate adaptation measures could ensure resilience for many coffee farmers
Semi-forest coffee (SFC)
19
Coffee growing in Ethiopia has been negatively influenced by climate change
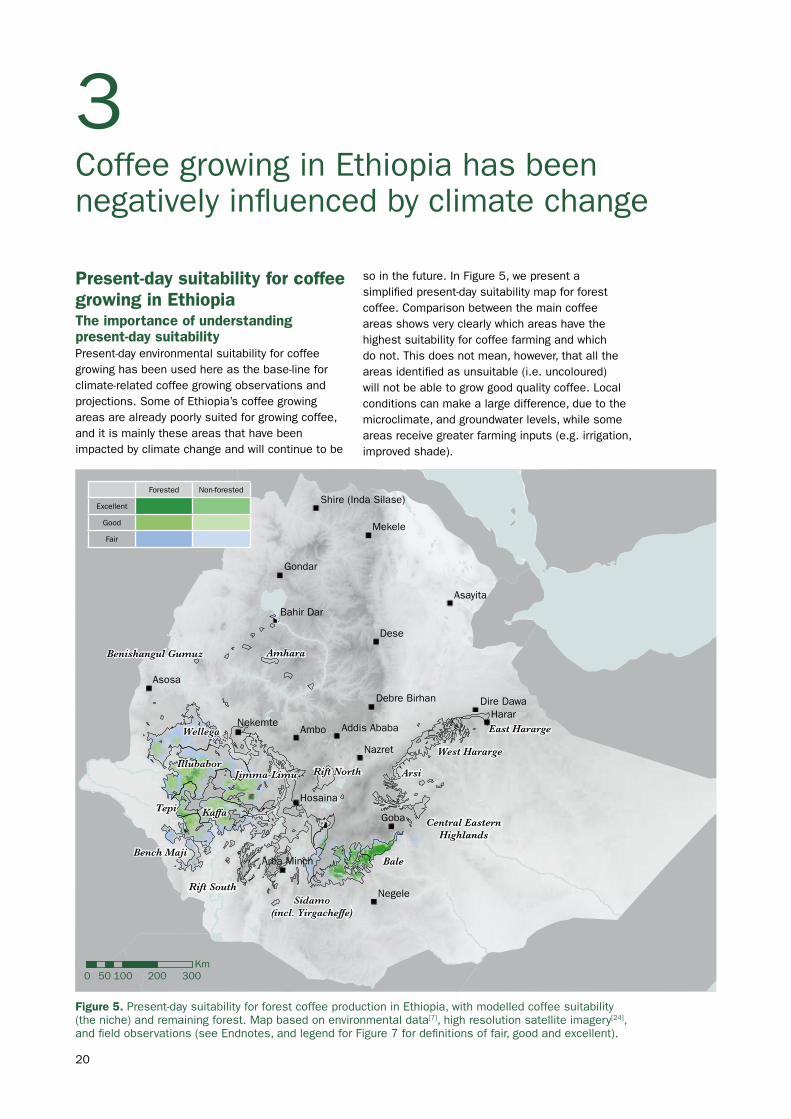
Present-day suitability for coffee growing in EthiopiaThe importance of understanding present-day suitabilityPresent-day environmental suitability for coffee growing has been used here as the base-line for climate-related coffee growing observations and projections. Some of Ethiopia’s coffee growing areas are already poorly suited for growing coffee, and it is mainly these areas that have been impacted by climate change and will continue to be
so in the future. In Figure 5, we present a simplified present-day suitability map for forest coffee. Comparison between the main coffee areas shows very clearly which areas have the highest suitability for coffee farming and which do not. This does not mean, however, that all the areas identified as unsuitable (i.e. uncoloured) will not be able to grow good quality coffee. Local conditions can make a large difference, due to the microclimate, and groundwater levels, while some areas receive greater farming inputs (e.g. irrigation, improved shade).
Figure 5. Present-day suitability for forest coffee production in Ethiopia, with modelled coffee suitability (the niche) and remaining forest. Map based on environmental data[7], high resolution satellite imagery[24], and field observations (see Endnotes, and legend for Figure 7 for definitions of fair, good and excellent).
3
20
Goba
Ambo
Dese
Harar
Arba Minch
Asosa
Negele
Nazret
Gondar
Mekele
Hosaina
Nekemte
Asayita
Dire Dawa
Bahir Dar
Addis Ababa
Debre Birhan
Shire (Inda Silase)
Wellega
IllubaborJimma-Limu Rift North
KaffaTepi
Bench MajiBale
West Hararge
Sidamo(incl. Yirgacheffe)
Rift South
Arsi
East Hararge
Amhara
Central EasternHighlands
Benishangul Gumuz
Wellega
IllubaborJimma-Limu Rift North
KaffaTepi
Bench MajiBale
West Hararge
Sidamo(incl. Yirgacheffe)
Rift South
East Hararge
Amhara
Central EasternHighlands
Benishangul Gumuz
Arsi
0 50 100 200 300Km
Forested Non-forested
Excellent
Good
Fair

The importance of forestForest cover is important for coffee because it provides the right conditions for successful cultivation, by reducing daytime air and soil temperatures, increasing humidity and preserving soil moisture. It also has key benefits for agricultural (and natural) ecosystems, including nutrient recycling, soil preservation, watershed preservation, pollination services, temperature buffering, shelter from wind and heavy rainfall, and carbon storage. Ethiopia coffee forests also provide a home for a diverse assemblage of plants and animals, and are thus important for biodiversity preservation.
Feedback from coffee farmers and direct observationFeedback from coffee farmersDuring extensive field survey (2013–2016) we interviewed farmers and farming communities about perceived changes in coffee farming, on a year-by-year and generation-by-generation basis, across Ethiopia. The main theme of the feedback was that weather patterns are now more variable than in the past, and that the climate has changed. The most common comments were: an increase in the uncertainty in the yearly weather pattern, particularly in rainfall variability and the onset of
the wet season; an extension of the dry season (and thus shortening of the wet season); a more extreme (drier and hotter) end to the main dry season; more extreme weather (heavier rain, hotter days, and warmer nights); and a very gradual, long-term decrease in rainfall, including some indication of a notable shift to less rain in the late 1970s and mid-1980s. Many of these observations have been reported elsewhere for Ethiopia[25] and East Africa[26]. This feedback was not evenly distributed over the coffee landscape, and some farmers reported little or no change in the climate, or few major weather-related issues. In general, areas identified as environmentally problematic for coffee farming (Figures 2, 5) received the most negative climate-related feedback, in terms of the number of comments and their severity.
Specific regional comments are also significant. See Figure 1 for coffee areas. On the Zege / Zeghie Peninsula (Amhara coffee area), it was said that the dry season is longer compared to several decades ago; from the 1930s there has been a shift from yearly to two-yearly harvests, and then to a good harvest roughly every five years (since the 1980s). In the Wellega coffee area, between Nekemte and Dembi Dolo, farmers and coffee sector representatives report a general decline in coffee production, with a decreasing frequency of good harvests, from once a year to every second or third year, and a general increase in drought during the end of the dry season. Coffee farms in the western part of the Wellega coffee area (1700–2000 m) report general diminishing rainfall as a problem, but with fewer lost harvests than other parts of Wellega. The coffee areas of Illubabor, Jimma-Limu, and Kaffa report increases in the unpredictability of the seasons (especially rainfall), an increase in the severity of the dry season, and an increase in the number of warmer days and nights, with locations at and below 1500 m most severely affected. In the Bench Maji coffee area, farmers also report drought issues, due to an extension of the dry season and a general increase in warm days. In the Sidamo coffee area (including Yirgacheffe), there is a perception of a more severe end to the main dry season, both before and after the early rains, with generally less rainfall and higher daytime temperatures. In the Harar coffee zone, farmers report an increase in the frequency and severity of droughts, and a gradual reduction in rainfall over several decades.
21
Green coffee after hulling
Observations of climate-related stress on coffee plantsThe best time to observe and assess stress in coffee plants is towards, or at the end of, the dry season in February and March, although observations throughout the year are also worthwhile and sometimes unexpected. Our stress assessments for the SCIP project were restricted to major, easily discernible indicators: the wilting of leaves (mild to severe), wilting and curling of leaves; leaf fall (few to many); and death of the plant (total loss of all leaves, wood dead). Coffee crop production was recorded, as were major pests and diseases and their severity. On-the-spot measurements were taken for ambient air temperature, soil temperature and soil moisture (at various depths).
During the project we observed many cases of mild to severe plant stress, and also plant death, towards the end of the dry season (February to early April). The most severe stress conditions (wilting and curling of leaves, loss of coffee crop, and plant death through drought) were recorded in the Harar coffee zone, particularly in Arsi (Figure 1). In many Harar coffee gardens, cultivation appeared to be lacking suitable farming practices (e.g. mulching, terracing or irrigation) required for growing coffee in this area which, due to low rainfall, is not ideally suited to coffee production. In 2015, we recorded the death of a large number of coffee plants in Arsi at 1400–1600 m; many hundreds of hectares of once profitable coffee plantation had died due to severe drought. Other areas showing marked stress of coffee plants were the Zege / Zeghie Peninsula in the Amhara coffee area, the Wellega coffee area, between Nekemte and Dembi Dolo, and coffee farms in the main South West coffee zone below 1400 m. In all cases stress was caused by low soil moisture, in combination with high temperatures (25°C +).
Other impacts of climate stress on coffee plants Environmental stresses can influence coffee growing in a number of ways, from slight physiological stress (discernible using scientific apparatus), to the obvious physical manifestations of water and/or heat stress, from wilted leaves (mild stress) to the death of the plant (severe stress), as discussed above. Coffee plants may also show climate-related stress through the increased occurrence, and increased intensity (and diversity), of diseases and pest attacks. When growing conditions are not suitable, coffee crop production is also likely to decline or fail. During prolonged drought episodes, for example, there is often a reduction in coffee bean size, and an increase in bean malformations, which are often referred to as ‘faults’. Faults, such as black marks, blackened beans, misshapen beans and insect damage, are measured by industry standards and have a direct influence on coffee prices, in combination with cup quality. Cup quality, how good or bad the coffee smells and tastes, is assessed by rigorous, standard protocols, in conjunction with the number of faults. These quality scores place coffee into a category, which traders use to set the grade for the coffee and hence its price. Even quite small changes in the coffee growing climate, within each year’s growing season (e.g. low rainfall), can influence yield and cup quality. We observed a close link between coffee quality and the environment: areas identified by our coffee suitability (niche) modelling as unsuitable or marginal generally produced lower quality coffee (Figures 5 and 7a). This was evident on the Zege / Zeghie Peninsula (the northern part of the Amhara coffee area), Harar, eastern Wellega, Bench Maji, and the Rift (see Figures 1 and 5).
During the project we observed many cases of mild to severe plant stress, and also plant death, towards the end of the dry season (February to early April).
We observed a close link between coffee quality and the environment: areas identified by our coffee suitability (niche) modelling as unsuitable or marginal generally produced lower quality coffee.
22

Wild coffee forest, Kaffa (SW Ethiopia)
23

24
Climate change will continue to impact and alter coffee growing in Ethiopia over the coming decades
Climate change modelling for coffee production in Ethiopia, 1960 to 2099Coffee suitability (niche) modelling, forest cover from satellite data[24], and ground control points (the location of coffee production sites) were used to compute land-surface coffee production maps for Ethiopia (see Endnotes). These maps were tested and refined via exhaustive ground survey during visits to coffee farms, coffee forests, and non-coffee areas across Ethiopia. Once satisfied that the maps accurately represented the coffee growing landscape of Ethiopia, we rigorously applied computer modelling to project what would happen in the future under various climate change simulations using numerous
General Circulation Models (GCMs), and then made assessments as to how much variability there was in the forecasts. Overviews of the modelling outcomes, for four time intervals (1960–1990, 2010–2039, 2040–2069, 2070–2099), are summarised below for the main coffee areas in tabular form (Table 2) and in Figures 6 and 7.
By the end of this century our projections showthat the current coffee growing areas of Ethiopiawill decrease considerably, if no interventions aremade (Figures 6, 7; Table 2). At the other extreme, with active migration and intervention, there could be a substantial increase in the coffee farming area of Ethiopia (see Section 5).
4
Pre-sorting of coffee fruits prior to pulping and washing
25
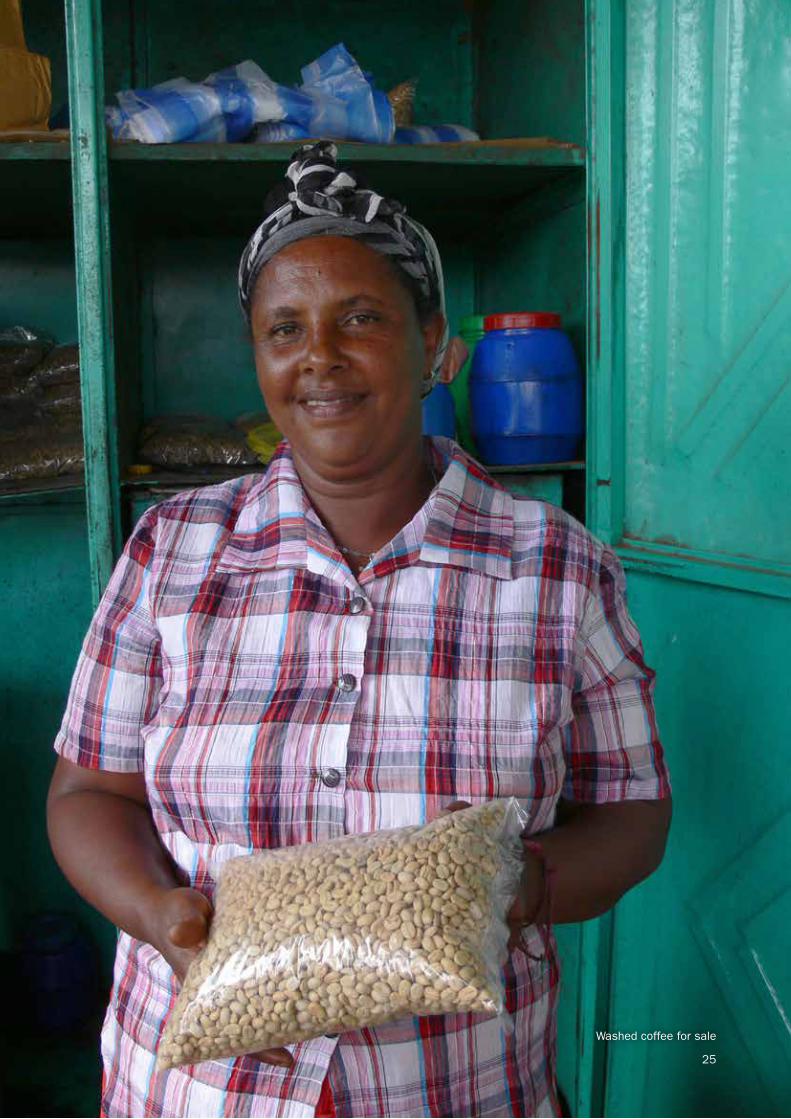
Washed coffee for sale
25

Caveats Climate change modelling and the use of GCMs for predicting the implications and impact of future climate change is fraught with difficulties and challenges, not least the uncertainty of future events. In this study we have done our upmost to present a balanced and unbiased view, and attempted to present uncertainty and disagreement where it exists in the modelling. The modelling has been rigorously back-referenced to field observations and historical data in order to reconcile modelled future outcomes with observed or assumed climate change trends.
26
Figure 6. Summary of major change for the main coffee zones of Ethiopia by the end of this century. See Table 2 and Figure 7 for further details.
Examples. North coffee zone: in the recent-past (1960–1990) coffee suitability is classified as unsuitable to marginal, with an overall improvement in coffee suitability through to 2099, although model agreement is mixed (projections are uncertain). Harar coffee zone: in the recent-past (1960–1990) coffee suitability is classified (broadly) as unsuit-able, with no improvement (actually dropping below unsuitable) through to 2099; model agreement is strong (projections have high agreement).
Unsuitable
Marginal
Fair
Good
Excellent
Coffee suitability
Considerable improvement
Improvement
little or no change
Decline
Considerable decline
Mixed outcome
Lost (no longer exists)
Model agreement
Strong
Moderate
Weak
Harar1960-1990
2010-2039
2040-2069
2070-2099
1960-1990
2010-2039
2040-2069
2070-2099
South Eastto
1960-1990
2010-2039
2040-2069
2070-2099
South Westto
North1960-1990
2010-2039
2040-2069
2070-2099
to
1960-1990
2010-2039
2040-2069
2070-2099
Riftto
At the other extreme, with active migrationand intervention, there could be a substantial increasein the coffee farming area of Ethiopia [see Section 5].
27
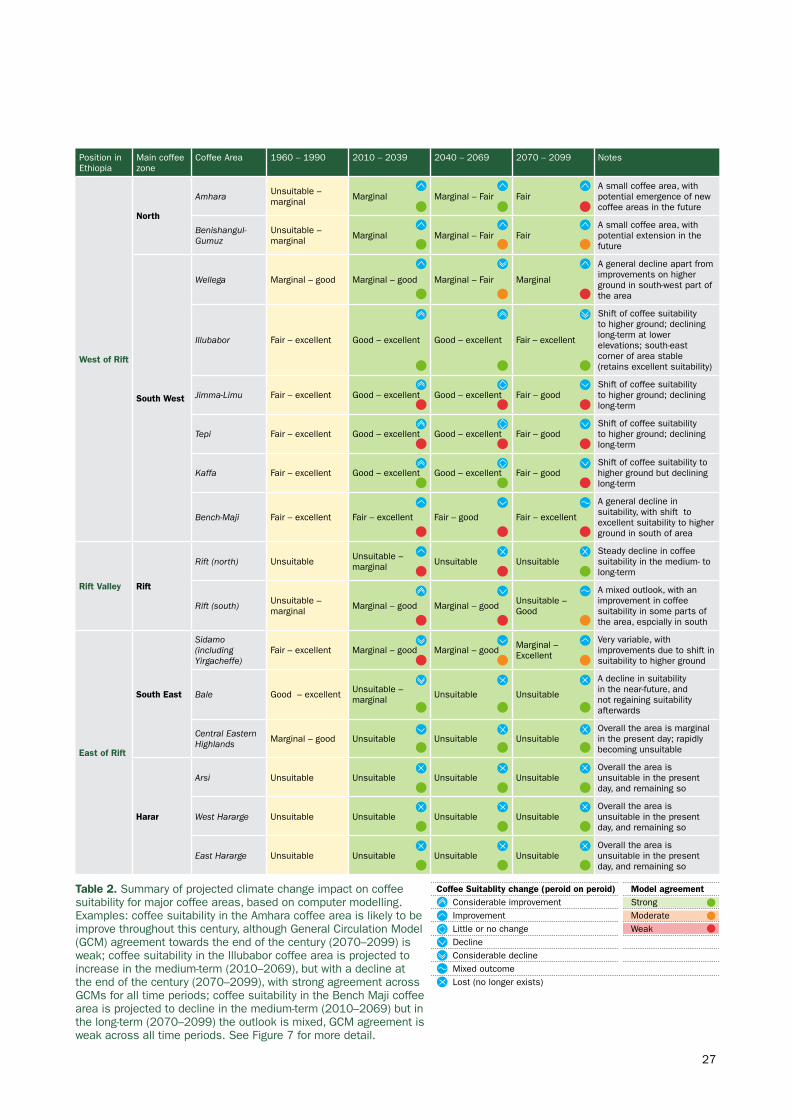
Table 2. Summary of projected climate change impact on coffee suitability for major coffee areas, based on computer modelling. Examples: coffee suitability in the Amhara coffee area is likely to be improve throughout this century, although General Circulation Model (GCM) agreement towards the end of the century (2070–2099) is weak; coffee suitability in the Illubabor coffee area is projected to increase in the medium-term (2010–2069), but with a decline at the end of the century (2070–2099), with strong agreement across GCMs for all time periods; coffee suitability in the Bench Maji coffee area is projected to decline in the medium-term (2010–2069) but in the long-term (2070–2099) the outlook is mixed, GCM agreement is weak across all time periods. See Figure 7 for more detail.
Position in Ethiopia
Main coffee zone
Coffee Area 1960 – 1990 2010 – 2039 2040 – 2069 2070 – 2099 Notes
West of Rift
North
AmharaUnsuitable – marginal Marginal Marginal – Fair Fair
A small coffee area, with potential emergence of new coffee areas in the future
Benishangul-Gumuz
Unsuitable – marginal Marginal Marginal – Fair Fair
A small coffee area, with potential extension in the future
South West
Wellega Marginal – good Marginal – good Marginal – Fair Marginal
A general decline apart from improvements on higher ground in south-west part of the area
Illubabor Fair – excellent Good – excellent Good – excellent Fair – excellent
Shift of coffee suitability to higher ground; declining long-term at lower elevations; south-east corner of area stable (retains excellent suitability)
Jimma-Limu Fair – excellent Good – excellent Good – excellent Fair – goodShift of coffee suitability to higher ground; declining long-term
Tepi Fair – excellent Good – excellent Good – excellent Fair – goodShift of coffee suitability to higher ground; declining long-term
Kaffa Fair – excellent Good – excellent Good – excellent Fair – goodShift of coffee suitability to higher ground but declining long-term
Bench-Maji Fair – excellent Fair – excellent Fair – good Fair – excellent
A general decline in suitability, with shift to excellent suitability to higher ground in south of area
Rift Valley Rift
Rift (north) Unsuitable Unsuitable – marginal Unsuitable Unsuitable
Steady decline in coffee suitability in the medium- to long-term
Rift (south)Unsuitable – marginal Marginal – good Marginal – good Unsuitable –
Good
A mixed outlook, with an improvement in coffee suitability in some parts of the area, espcially in south
East of Rift
South East
Sidamo (including Yirgacheffe)
Fair – excellent Marginal – good Marginal – good Marginal – Excellent
Very variable, with improvements due to shift in suitability to higher ground
Bale Good – excellent Unsuitable – marginal Unsuitable Unsuitable
A decline in suitability in the near-future, and not regaining suitability afterwards
Central Eastern Highlands
Marginal – good Unsuitable Unsuitable UnsuitableOverall the area is marginal in the present day; rapidly becoming unsuitable
Harar
Arsi Unsuitable Unsuitable Unsuitable UnsuitableOverall the area is unsuitable in the present day, and remaining so
West Hararge Unsuitable Unsuitable Unsuitable UnsuitableOverall the area is unsuitable in the present day, and remaining so
East Hararge Unsuitable Unsuitable Unsuitable UnsuitableOverall the area is unsuitable in the present day, and remaining so
Coffee Suitablity change (peroid on peroid) Model agreement Considerable improvement Strong Improvement Moderate Little or no change Weak Decline Considerable decline Mixed outcome Lost (no longer exists)

↓↓
↓
↓
↓
↓
↓
↓
↓
↓
↓
↓
↓
↓↓
↓↓
↓
↓
↓
↓
↓
↓
↓
↓
↓
↓
↓
↓
↓
↓
↓↓
↓
↓
↓
↓↓
↓
↓↓
↓↓
↓ ↓
↓
↓
↓
↓
↓
↓
↓
↓
↓
↓
↓
↓
↓
↓
↓
↓
↓
↓
↓
↓
↓
↓
↓↓
↓
↓↓
↓
↓
↓
↓
↓
↓↓ ↓
↓
↓
↓
↓
↓
↓
↓
↓
↓↓
↓
↓
↓
↓
↓
↓
↓
↓
↓
↓↓
↓
↓
↓
↓
↓
↓
↓
↓
↓
↓
↓
↓
↓
↓
↓
↓↓
↓
↓
↓
↓
↓
↓
↓
↓
↓
↓
↓
↓
↓↓
↓
↓
↓
↓
↓
↓
↓↓
↓
↓
↓
↓
↓
↓
↓
↓
↓
↓
↓
↓↓
↓
↓
↓↓ ↓
↓
↓
↓
↓
↓↓
↓↓
↓
↓
↓
↓
↓
↓
↓
↓
↓
↓
↓
↓
↓
↓
↓
↓
↓
↓
↓
↓
↓
↓
↓
↓
↓
↓
↓
↓
↓
↓
↓
↓
↓
↓
↓
↓
↓
↓
↓
↓
↓
↓
↓
↓
↓
↓
↓
↓
↓
↓
↓
↓ ↓
↓
↓
↓
↓
↓
↓
↓
↓
↓
↓
↓
↓
↓
↓
↓
↓
↓
↓
↓
↓
↓
↓↓
↓
↓
↓
↓
↓↓
↓
↓
↓
↓
↓
↓
↓
↓
↓
↓
↓
↓
↓
↓
↓
↓
↓
↓
↓
↓
↓
↓
↓
↓
↓
↓
↓
↓
↓
↓
↓
↓
↓↓
↓
↓
↓
↓
↓
↓
↓
↓
↓
↓
↓
AAA
AAA
A
A
AAA
A
AAA
AA
AAA
AAA
AA
AA
A
AAA
AAAA
AAAA
AAAA
AAAAA
AAAA
AAAA
A
AA
AAAA
AAA
AAAA
AAA
AAAAAAAAA
AA
AAAAAAAA
AAA
A
AAAAAAAA
A
AA
AAAAAA
AAAAAAA
A
AAA
AAAA
AAAAAAAA
AA
AAAA
AAAAAAA
AAAA
AA
AAAAAAA
AAAAAAA
AAAAAA
AAAAAA
AAAAA
AA
AAAA
AA
AAAAAAAAA
A
AAAAA
AAAAA
AA
AAAAA
A
AAAAA
AAAAAAAAAAAAAAAAAAAA
AAAAAAAAAAAAAAA
AAA
AAAA
A
A
A
A
A
AAA
AA
A
AAA
A
A
A
AAA
AAAAAAAAAA
A
AA
"
"
"
"
"
""
"
" ""
"
"
"
"
" "
"
"
"
Maji
Bale
Gore Limu
HararGimbi
BadeleDembi Dollo
Yirgacheffe
Finote Selam
Goba
Ambo
Dese
Jimma
Asosa
Negele
Awassa
Nazret
Gondar
Hosaina
Nekemte
Asayita
Dire Dawa
Bahir Dar
Arba Minch
Addis Ababa Asbe Teferi
Mizan Teferi
Debre Birhan
Harar
Dire Dawa
Maji
Bale
Gore Limu
Gimbi
BadeleDembi Dollo
Yirgacheffe
Finote Selam
Goba
Ambo
Dese
Jimma
Asosa
Negele
Awassa
Nazret
Gondar
Hosaina
Nekemte
Asayita
Bahir Dar
Arba Minch
Addis Ababa Asbe Teferi
Mizan Teferi
Debre Birhan
"
"
"
"
"
" "
"
"
"
"
"
"
"
"
"
"
"
Coffee gardens
Forest changeStatic
Rapid
Forest cover5-10%
10-25%
25-45%
45-70%
> 70%
Coffee suitability (niche)
Marginal
Fair
Good
Excellent↓↓
↓
"MekeleMekele
Present-day suitability for coffee
Coffee gardens: coffee growing ranges from a few trees to small plots. Yields may be poor and inconsistent, or good, largely depending on inputs (e.g. irrigation) and / or local conditions (microclimate, water table).
Unsuitable: coffee production is either barely possible or impossible (empty hexagons; see also Figure 7b).
Marginal: coffee production is possible but often problematic, with poor and very inconsistent yields.
Fair: coffee growing is possible and sometimes good, but may require additional inputs (e.g. irrigation, shade or better shade, and pruning). Yields poor in years with low rainfall.
Good: coffee production is good, with the potential for consistent, high quality yields. Yield and quality may be negatively influenced in some years (during adverse weather conditions, especially low rainfall and high temperatures).
Excellent: coffee production is good to excellent, with the potential for consistent, high quality yields. Yields and quality can be negatively influenced by adverse weather conditions, but this is less likely.
Figure 7a. Present-day suitability for coffee. Forest change: relative amount of deforestation, c. 2000–2013. Forest cover: relative amount of forest expressed as a percentage (100% = intact forest cover). Coffee suitability (niche): – potential suitability for coffee growing or wild coffee forests based on environmental parameters (rainfall, temperature, seasonality).
28
0 50 100 200 300Km
XX X
X X
X
X X
X
X
XX
X
XX
XX
X
X
X
X
X
X
XX
X
X
X
X
X
X
X
X
X
X
X
X
X
X
XX
X
X
XX
X
X
X
X
X
X
X
X
X
X
X
XX
X
X
X
X
X
X
X
X
X
X
X
X
X
X
XX
X
X
X
X
X
X
X
X
X
X
X
X
X
X X
X
X
X
X
XX
X
XX
X
X
X
X
i
i
i
i
i
i
i
i
i
i
i
i
i
i
i
i
i
i
i
i
i
i
i
i
i
i
i
i
i
i
i
i
i
i
i
i
i
i
i
i
i
i
i
i
i
i
i
i
i
i
i
i
i
i
i
i
i
i
i
i
i
i
i
i
i
i
i
i
i
i
i
i i
i i
i
i
i
i
i
i
i
i
i i
i
i
i
i
i
i
i
i
i
i
i
i
i
i
i
ii
i
i
i
i
i
i
i
i
i
i
i
i
i
i
i
i
i
i
i
i
i
i
i
i
i
i
i
ii
i
i
i
ii
i
i
ii
i
i
i
i
ii
i
i
i
iii
ii
iii
"
"
"
"
"
"
""
"
" ""
"
"
"
"
" "
"
"
"
"
"
"
"
"
"
"
"
"
"Maji
Bale
Gore Limu
HararGimbi
BadeleDembi Dollo
Yirgacheffe
Finote Selam
Goba
Ambo
Dese
Jimma
Asosa
Negele
Awassa
Nazret
Gondar
Mekele
Hosaina
Nekemte
Asayita
Dire Dawa
Bahir Dar
Arba Minch
Addis Ababa Asbe Teferi
Mizan Teferi
Debre Birhan
Maji
Bale
Gore Limu
HararGimbi
BadeleDembi Dollo
Yirgacheffe
Finote Selam
Goba
Ambo
Dese
Jimma
Asosa
Negele
Awassa
Nazret
Gondar
Mekele
Hosaina
Nekemte
Asayita
Dire Dawa
Bahir Dar
Arba Minch
Addis Ababa Asbe Teferi
Mizan Teferi
Debre Birhan
Coffee suitability (niche) change
i Improving
i
Little or no change
XX Worsening
Agreement between models
Strong
WeakCoffee suitability (niche)
Marginal
Fair
Good
Excellent
i
X
Suitability for coffee at the end of this century
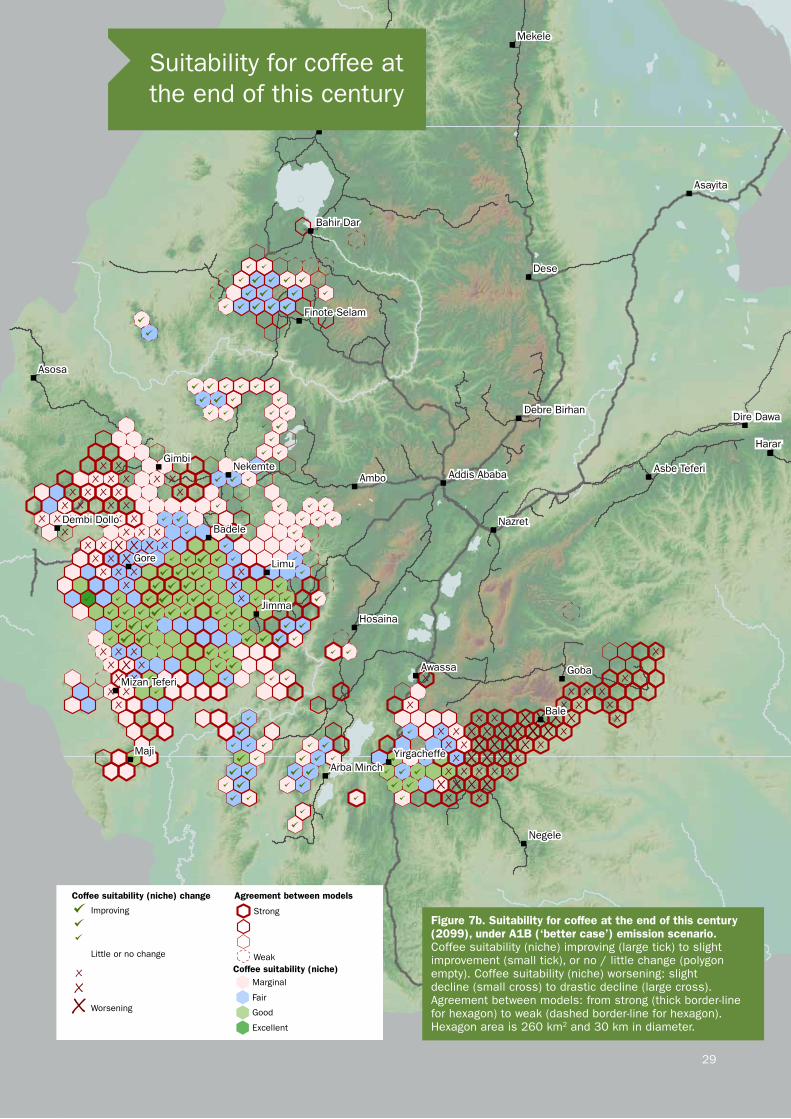
Figure 7b. Suitability for coffee at the end of this century (2099), under A1B (‘better case’) emission scenario. Coffee suitability (niche) improving (large tick) to slight improvement (small tick), or no / little change (polygon empty). Coffee suitability (niche) worsening: slight decline (small cross) to drastic decline (large cross). Agreement between models: from strong (thick border-line for hexagon) to weak (dashed border-line for hexagon). Hexagon area is 260 km2 and 30 km in diameter.
29
300Km

Figure 8. Coffee suitability (niche) area (km2), 1960–2099. Intervention. Suitability potential (allowing for assisted migration of coffee farms/areas and increased forest cover). No Intervention. Suitability based on present day forest cover (no assisted migration, no increase or decreases in forest cover). Background (part of southeastern Ethiopia) is given to provide scale only.
Relocation of coffee farms/areas will be a key component in building resilience for the Ethiopian coffee economy Climate change will negatively impact much of the current coffee farming landscape of Ethiopia, however, substantial areas that were previously unsuitable for coffee will become suitable as the century progresses. This is due to the upslope shift of coffee growing suitability (the niche) as higher altitude areas (e.g. above 2000 m) improve and lower altitude areas worsen, as the climate changes.
Assisted migration to ‘new’ areas will be a key component for ensuring resilience in the Ethiopian coffee economy due to the replacement of areas lost at lower altitudes (below 1400–1500 m) as the climate there becomes unsuitable for coffee growing. The new areas are mostly in the South West coffee zone, but North, Rift (Rift South coffee area), and South East (Sidamo coffee area) coffee zones may also provide opportunities (Table 2, Figures 6 and 7).
Relocation of coffee farms to higher altitudes will require positive action with critical attention to feasibility and planning. Before decisions are made concerning the establishment of new coffee farms and areas, suitability has
to be determined in terms of climate, agronomy (e.g. soil, shade, slope), the potential for land-use contradictions (e.g. land tenure, other existing land-use activities), market value, and logistics. A certain amount of shift could occur quite naturally, as farmers see the potential and financial incentive to start growing coffee on their land in areas previously unsuitable (e.g. because it was too cold).
In many cases afforestation and reforestation will be necessary to provide the right growing environment for coffee, but this would also bring additional benefits in terms of increasing forest cover, preserving biodiversity and providing improvements in ecosystem services. Prevention of forest loss is also a key issue, especially in the South West and South East coffee zones where recent deforestation rates are high (Figure 7a) and could have a more significant impact than climate change, at least in the short to medium term.
As part of the adaptation process it will be essential to undertake dedicated, on-the-ground monitoring to track the course of climate change and assess its impact on coffee production and farming communities.
5
30
Fair
1960–1990 2010–2039 2040–2069 2070–2099
Inte
rven
tion
No
Inte
rven
tion
Good Excellent
19,241 km2
19,767 km2
5,812km2
26,662 km2
24,911 km2
14,585 km2
20,663 km2
24,816 km2
12,557 km2
21,047 km2
26,181 km2
4,052 km2
3,312 km2
9,536 km2
6,294 km2 2,219 km2
5,976 km2
6,123 km2 2,891 km2
5,306 km2
4,700 km2 1,115 km2 4,284 km2
5,858 km2

Appropriate adaptation measures could ensure resilience for many coffee farmers Air and soil temperature and moisture can be altered by specific farming interventions, and provide a buffer against inadequate growing conditions and extreme weather events. The most obvious interventions are irrigation, shade management and mulching, but terracing has clear benefits, and pruning is also advocated in some cases. Observations of on-farm adaptation and improvements in coffee farming practices across Ethiopia indicate the potential to provide various levels of resilience for many (but not all) farmers. Careful assessment of each farming site is required to see which interventions, or combination
of measures, would be most suitable. Table 2, and
Figures 5, 6 and 7 provide a general guide as to
the scale, timing and longevity of interventions,
although a case-by-case approach is required to
assess the potential for specific locations.
Improved cultivars and selections of indigenous
Arabica coffee may provide some potential,
especially for disease resilience and improved
productivity[27], but significant climate resilience is
unlikely based on field observations of field trials,
and available genetic diversity information.
Key adaptation measures Irrigation: The use of extra water to boost and/or maintain soil water availability for coffee plants is an ancient and highly effective means of improving yield and quality. If irrigation practices are good, Arabica coffee can be successfully grown in places that would otherwise be unsuitable due to low rainfall. There are numerous examples in Ethiopia where good to excellent coffee is grown with low-cost irrigation systems.
Tree shade management: Effective shade management can improve coffee growing conditions by reducing daytime air and soil temperatures, and increasing humidity and soil moisture. The difference in daytime temperatures between shaded and unshaded coffee plots can be around 4°C. Choice of shade tree species, planting density and canopy coverage are key factors in good shade management. Effective shade management can also counter the negative effects of heavy rain (e.g. run-off prevention, and coffee flower protection from heavy raindrops) and drying winds.
Mulching: Covering the soil with different materials (e.g. compost, manure) not only helps to preserve soil moisture and decrease soil temperature (reducing evapotranspiration), but it can also increase soil fertility, supress weeds, and improve rainfall penetration into the ground. Mulching has been used to good effect in Kenya, Tanzania and other countries in East Africa.
Terracing: This is practiced in Harar and Rift coffee zones. Terracing has numerous benefits, including drastic improvements in soil quality (e.g. an increase in depth, moisture, and fertility), and reductions in water run-off and soil erosion. Terracing requires expertise and, sometimes, considerable resources, although low-intensity terracing systems are possible in some areas. Terracing can be particularly effective when used in combination with irrigation.
Pruning: This can improve coffee harvests by maximising cropping potential and re-invigorating old, unproductive trees. Improvements in yield can offset losses encountered during previous harvests. Pruning may also help to improve water-use efficiency in coffee plants.
6
31
Main recommendations
1 Timely, precise, science-based decision making is required now, and over the coming
decades, to ensure sustainability and resilience for the Ethiopian coffee sector.
2 A climate monitoring program (including a dedicated network of weather stations)
should be established and maintained to track the course of climate change, and assess its impact on coffee production and farming communities. Areas of rapid and significant change, both observed and forecast (e.g. the Bale coffee area), should be prioritised.
3 As climate and climate change science improves, it will be necessary to re-evaluate
and update future forecasts for coffee production.
4 A concerted effort should be made to identify and establish new coffee areas
at higher altitudes. Particular attention should be placed on competing land-use issues (e.g. existing land use, land tenure, nature conservation sites), soil and climate suitability, road access and other infrastructure, and adequate return-on-investment. A sustainability strategy for Ethiopian coffee production lacking relocation of coffee farms / areas is likely to be ineffective, especially if countrywide production levels are to be maintained or increased.
5 Forest preservation and re-establishment, and good management of soils and
watersheds, will play a significant role in adaptation and should be an integral part of future planning. Prevention of forest loss is a key issue, especially in the South West and South East coffee zones where recent deforestation rates are high, and could have a more significant impact than climate change at least in the short to medium term.
6 Increases in coffee productivity (kg/ hectare) and quality should be
accelerated via improvements in agronomy and processing, respectively.
7 Recent improvements in the coffee value chain need to be accelerated across
Ethiopia, including coffee sector governance and logistics.
8 Resources should be allocated to helping farmers diversify away from coffee in places
where climate change has made coffee farming economically unviable.
9 Prices paid to farmers for their coffee needs to be increased and stabilized. This
will provide better opportunities for resilience due to an increase in the potential for on-farm investment and income-loss offsetting (including harvest insurance schemes).
10 For many farms, there needs to be greater investment in locally appropriate,
cost-effective adaptation measures to improve resilience, including mulching, irrigation, improved shade management, terracing, and pruning.
11 Further research is required in order to ascertain the precise outcomes and
benefits of on-farm interventions, particularly terracing, mulching, irrigation, pruning, and shade management. Attention should also be paid to new and emerging technologies.
12 A coffee governing body should be formed, with the remit of ensuring
advocacy and effective governance for coffee sustainability and resilience.
32

References
All of the reports and most of the scientific publications are available online.
[1] Davis, A.P., Gole, T.W., Baena, S. & Moat, J. (2012). The impact of climate change on natural populations of Arabica coffee: predicting future trends and identifying priorities. PLoS ONE 7(11): e47981.
[2] Tefera, A. (2015). Ethiopia: Coffee Annual Report. GAIN Report (number ET1514–26/5/2015). USDA Foreign Agricultural Service. Pp 6.
[3] Minten, B., Tamru, S., Kuma, T. & Nyarko, Y. (2014). Structure and Performance of Ethiopia’s Coffee Export Sector. Working paper 66. June 2014. Addis Ababa: Ethiopian Development Research Institute (EDRI) and International Food Policy Research Institute (IFPRI). Pp 30. [4] International Coffee Organization (ICO). (2015). Historical Data on the Global Coffee Trade. Website: http://www.ico.org/new_historical.asp?section=Statistics
[5] Tefera, A. & Tefera, T. (2014). w. GAIN Report (number ET1402–13/5/2014). USDA Foreign Agricultural Service. Pp. 11.
[6] Friis, I., Demissew, S. & Breugel, P.V. (2010). Atlas of the Potential Vegetation of Ethiopia. Biologiske Skrifter 58: 1–307.
[7] Hijmans, R.J., Cameron, S.E., Parra, J.L., Jones, P.G. & Jarvis, A. (2005). Very high resolution interpolated climate surfaces for global land areas. International Journal of Climatology 25: 1965–1978.
[8] Hailu, B.T., Maeda, E.E., Heiskanen, J. & Pellikka, P. (2015). Reconstructing pre-agricultural expansion vegetation cover of Ethiopia. Applied Geography 62: 357–365.
[9] IPCC (2013). Summary for Policymakers. In: Climate Change 2013: The Physical Science Basis. Contribution of Working Group I to the Fifth Assessment Report of the Intergovernmental Panel on Climate Change. [Stocker, T.F., Qin, D., Plattner, G.-K., Tignor, M., Allen, S.K., Boschung, J., Nauels, A., Xia, Y., Bex, V. & Midgley, P.M. (eds.)]. Cambridge University Press, Cambridge, United Kingdom and New York, NY, USA. Pp. 28.
[10] Niang, I., Ruppel, O.C., Abdrabo, M.A., Essel, A., Lennard, C., Padgham, J. & Urquhart, P. (2014). Africa. In: Climate Change 2014: Impacts, Adaptation, and Vulnerability.
Part B: Regional Aspects. Contribution of Working Group II to the Fifth Assessment Report of the Intergovernmental Panel on Climate Change [Barros, V.R., Field, B., Dokken, D.J., Mastrandrea, M.D., Mach, K.J., Bilir, T.E., Chatterjee, M., Ebi, K.L., Estrada, Y.O., Genova, R.C., Girma, B., Kissel, E.S., Levy, A.N., MacCracken, S., Mastrandrea, P.R., & White, L.L. (eds.)]. Cambridge University Press, Cambridge, United Kingdom and New York, NY, USA, pp. 1199–1265.
[11] Carabine, E., Lemma, A., Dupar, M., Jones, L., Mulugetta, Y., Ranger, N. & van Aalst, M. (2014). The IPCC’s Fifth Assessment Report – What’s in it for Africa. Climate & Development Knowledge Network (CDKN). Pp. 1–33.
[12] Funk, C., Rowland, J., Eilerts, G., Kebebe, E., Biru, N., White, L. & Galu, G. (2012). A Climate Trend Analysis of Ethiopia. USGS Fact Sheet 2012–3053. U.S. Department of the Interior, U.S. Geological Survey (USGS), Reston, VA, USA. Pp. 6.
[13] Funk, C., Michaelsen, J. & Marshall, M. (2012). Mapping recent decadal climate variations in precipitation and temperature across Eastern Africa and the Sahel. In: Remote Sensing of Drought: Innovative Monitoring Approaches [Wardlow, B.D., Anderson, M.C. & Verdin, J.P. (eds.)]. CRC Press, Boca Raton, FL, USA. Pp. 331–358.
[14] Williams, A.P., Funk, C., Michaelsen, J., Rauscher, S.A., Robertson, I., Wils, T.H.G., Koprowski, M., Eshetu, Z. & Loader, N.J. (2012). Recent summer precipitation trends in the Greater Horn of Africa and the emerging role of Indian Ocean sea surface temperature. Climate Dynamics 39: 2307–2328.
[15] McSweeney, C., New, M. & Lizcano, G. (2010). UNDP Climate Change Country Profiles: Ethiopia. Pp. 27.
[16] Jury, M.R. & Funk, C. (2013). Climatic trends over Ethiopia: regional signals and drivers. International Journal of Climatology 33: 1924–1935.
[17] Mekasha, A., Tesfaye, K. & Duncan, J. (2014). Trends in daily observed temperature and precipitation over three Ethiopian eco-environments. International Journal of Climatology 34: 1990–1999.
[18] Funk, C., Dettinger, M.D., Michaelsen, J.C., Verdin, J.P., Brown, M.E., Barlow, M. & Hoell, A. (2008). Warming of the Indian Ocean threatens eastern and southern African food security but could be mitigated by agricultural development. Proceedings of the National Academy of Sciences of the United States of America 105: 11081–11086.
33
[19] Funk, C., Senay, G, Asfaw, A., Verdin, J., Rowland, J., Korecha, D., Eilerts, G., Michaelsen, J., Amer, S. & Choularton, R. (2005). Recent Drought Tendencies in Ethiopia and Equatorial Subtropical Eastern Africa. Vulnerability to Food Insecurity: Factor Identification and Characterization Report. Famine Early Warning Systems Network (FEWS NET). Pp. 15.
[20] Anyah, R.O. & Qiu, W. (2012). Characteristic 20th and 21st century precipitation and temperature patterns and changes over the Greater Horn of Africa. International Journal of Climatology 32: 347–363.
[21] Conway, D. & Schipper, E.L.F. (2011). Adaptation to climate change in Africa: challenges and opportunities identified from Ethiopia. Global Environmental Change 21: 227–237.
[22] Seneviratne, S.I., Nicholls, N., Easterling, D., Goodess, C.M., Kanae, S., Kossin, J., Luo, Y., Marengo, J., McInnes, K., Rahimi, M., Reichstein, M., Sorteberg, A., Vera, C. & Zhang, X. (2012). Changes in climate extremes and their impacts on the natural physical environment. In: Managing the Risks of Extreme Events and Disasters to Advance Climate Change Adaptation [Field, C.B., Barros, V., Stocker, T.F., Qin, D., Dokken, D.J., Ebi, K.L., Mastrandrea, M.D., Mach, K.J., Plattner, G.-K., Allen, S.K., Tignor, M. & Midgley, P.M. (eds.)]. A Special Report of Working Groups I and II of the Intergovernmental Panel on Climate Change (IPCC). Cambridge University Press, Cambridge, UK, and New York, NY, USA. Pp. 109–230.
[23] Patricola, C.M. & Cook, S.K. (2011). Sub-Saharan Northern African climate at the end of the twenty-first century: forcing factors and climate processes. Climate Dynamics 35: 193–212.
[24] United States Geological Survey (2015). Landsat Missions: Landsat 8. Website: http://landsat.usgs.gov/landsat8.php
[25] Dudu, V.P. (2012). Impacts of Climate Change on Coffee Farming in Ethiopia. LAP Lambert Academic Publishing, Saarbrücken, Germany. Pp 85.
[26] Craparo, A.C.W., Van Asten, P.J.A., Läderach, A., Jassogneb, L.T.P. & Graba, S.W. (2015). Coffea arabica yields decline in Tanzania due to climate change: Global implications. Agricultural and Forest Meteorology 207: 1–10.
[27] Belete, Y., Belachew, B. & Fininsa, C. (2014). Performance evaluation of indigenous Arabica coffee genotypes across different environments. Journal of Plant Breeding and Crop Science 6: 171–178.
[28] Hansen, M.C., Potapov, P.V., Moore, R., Hancher, M., Turubanova, S.A., Tyukavina, A., Thau, D., Stehman, S.V., Goetz, S.J., Loveland, T.R., Kommareddy, A., Egorov, A., Chini, L., Justice, C.O. & Townshend, J.R.G. (2013). High-resolution global maps of 21st-century forest cover change. Science 342 (15 November): 850–853. Data available on-line from: http://earthenginepartners.appspot.com/science-2013-global-forest.
34
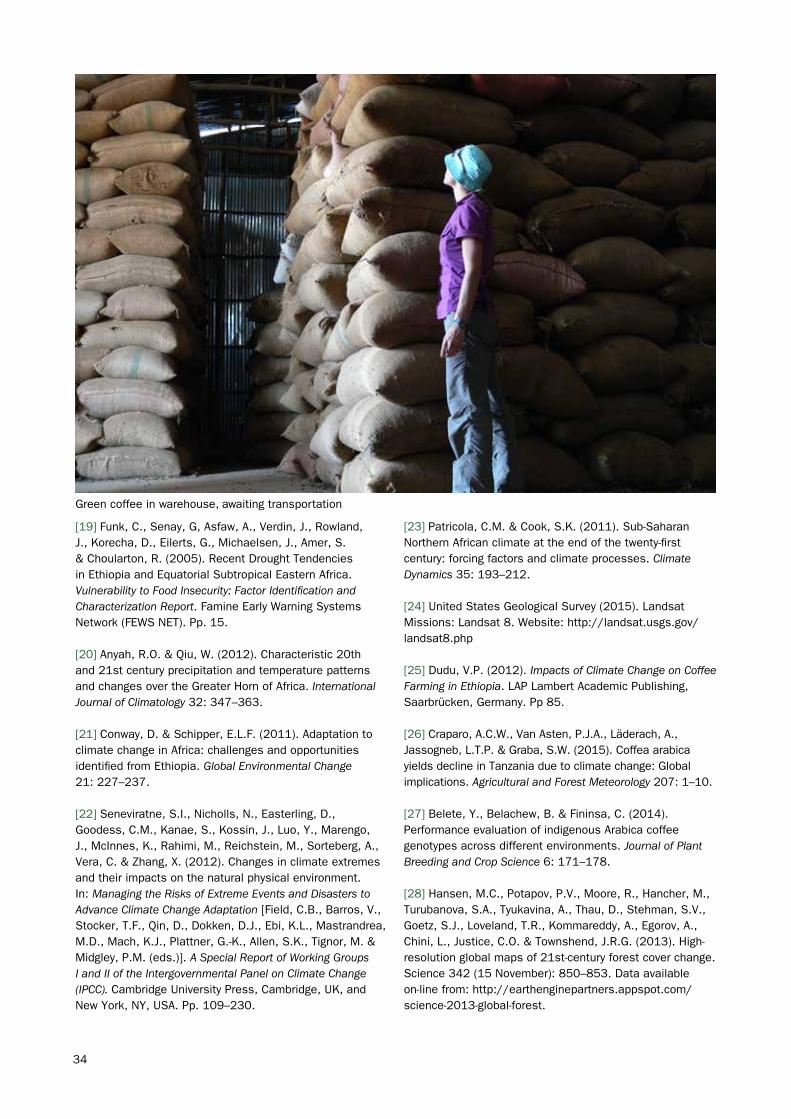
Green coffee in warehouse, awaiting transportation

ENDNOTES
Extra notes for Figures. Figure 2. Bahir Dar (Zege/Zeghie Peninsula). Sufficient annual rainfall, but the dry season (October to February/March) is too dry and coincides with highest temperatures. The bulk of the rain falls in the main wet season (May/June to September). Coffee suitability is marginal (coffee growing possible but often problematic, with poor and very inconsistent yields) and is often negatively influenced by drought during the dry season. Limu. Sufficient rain throughout the dry season (October to February) and good rains in the main wet season (May/June to September). Highest temperatures coincide with sufficient rainfall. Coffee suitability is excellent (coffee production good to excellent, with the potential for consistent, high quality yields). Maji. Sufficient rain throughout the dry season (October to February) and good rains in the main wet season (May/June to September). Highest temperatures coincide with sufficient rainfall. Coffee suitability is excellent (coffee production good to excellent, with the potential for consistent, high quality yields). Slight bimodality to main season rainfall pattern. Gelemso. Barely sufficient rain throughout the dry season (October to February) and low rainfall in the main wet season(s) (April to September). Highest temperatures may not always coincide with sufficient rainfall. Coffee suitability is unsuitable to marginal (coffee growing possible but often problematic, with poor and inconsistent yields) especially without intervention (e.g. irrigation). Bale. Barely sufficient rain throughout the dry season (October to February), and low rainfall in the main wet season(s) (April to September); low rainfall is offset by slightly lower temperatures. Coffee suitability is good to excellent (coffee production good to excellent, with the potential for consistent, high quality yields). Yield and quality may be negatively affected in some years (during adverse weather conditions, especially low rainfall). Yirgacheffe. Sufficient rain throughout the dry season (November to February) and sufficient rainfall in the main (and slightly extended) wet season(s) (April to October). Highest temperatures usually coincide with sufficient rainfall. Coffee suitability is good to excellent, with the potential for consistent, high quality yields. Yield and quality may be negatively affected in some years (during adverse weather conditions, especially low rainfall). For further interpretation, see Tables 1 and 2, Figures 1, 5, 6 and 7.
Figure 4. From IPCC report: Climate Change 2014: Impacts, Adaptation, and Vulnerability. Part B: Regional Aspects: Africa, Figure 22-1[10]. Observed and projected changes in annual average temperature and precipitation for Africa. Observed and projected changes in annual average temperature and precipitation for Africa. Top panel, left. Map of observed annual average temperature change from 1901–2012, derived from a linear trend [WGI AR5 [8] Figures SPM.1 and 2.21]. Bottom panel, left. Map of observed annual precipitation change from 1951–2010, derived from a linear trend. [WGI AR5[9] Figures SPM.2 and 2.29] For observed temperature and precipitation, trends have been calculated where sufficient data permit a robust estimate (i.e. only for grid boxes with greater than 70% complete records, and more than 20% data availability in the first and last 10% of the time period). Other areas are white. Solid colours indicate areas where trends are significant at the 10% level. Diagonal lines indicate areas where trends are not significant. Top and bottom panel, right. CMIP5 multi-model mean projections of annual average temperature changes and average per cent changes in annual mean precipitation for 2046–2065 and 2081–2100 under RCP2.6 and 8.5, relative to 1986–2005. Solid colours indicate areas with very strong agreement, where the multi-model mean change is greater than twice the baseline variability (natural internal variability in 20-year means) and ≥90% of models agree on sign of change. Colours with white dots indicate areas with strong agreement, where ≥66% of models show change greater than the baseline variability and ≥66% of models agree on sign of change. Grey indicates areas with divergent changes, where ≥66% of models show change greater than the baseline variability, but <66% agree on assign of change. Colours with diagonal lines indicate areas with little or no change, where <66% of models show change greater than the baseline variability, although there may be significant changes at shorter timescales such as seasons, months, or days. Analysis uses model data and methods building from WG1 AR5[9] Figure SPM 8, and Boxes 21–2 and CC–RCI[9].
Images by: Jenny Williams (front and back cover, and pages2, 4, 8, 12–14, 21, 23, 24 and 37); and Aaron Davis (pages 10, 18, 25 and 34).
35

Overview of methods
Ground survey, field observations and ground control pointsFor the SCIP project (2013–2016), ten field expeditions were made across the coffee landscape of Ethiopia, covering at least 30,000 km. We used historical distribution data (800 records) from as far back as 1941, and made more than 800 records during the course of the project, giving a total of over 1,600 ground control points.
Forest MappingThe maps for coffee forest extent were produced from Landsat 8 imagery[24] from 2013/14, using 38 images for 24 scenes (to allow the removal of cloud cover). Forest change data extracted from Global Forest Watch (http://www.globalforestwatch.org/)[28].
ModellingOver 2,000 simulations were run to produce the final models, with six modelling techniques used to give a consensus, across four dates (1960–1990, 2010–2039, 2040–2069, 2070–2099. Two emission scenarios were used: A1B and A2 (see below). Twenty-four Global Circulation Models (GCMs) (http://www.ccafs-climate.org/) were reviewed for the project; three were selected as the most robust for Ethiopia (1) BCCR-BCM2-0 = Bjerknes Centre for Climate Research (BCCR), University of Bergen, Norway. Model name, Bergen Climate Model (BCM) Version 2. (2) CSIRO-MK3-5 = Centre for Australian Weather and Climate Research. Model name, Mark 3.5. (3) GFDL-CM2-1 Geophysical Fluid Dynamics laboratory (GFDL) model name Coupled Climate Model 2.1. Models were applied independently to the two main regions (West Rift and East Rift) and six potential migration scenarios were examined using the BioMod 2 package (https://cran.r-project.org/web/packages/biomod2/index.html).
Climate change emissions scenariosFor our future forecasts we used A1B and A2 carbon emission scenarios. As of 2015 we reached 9.8 GtC (billion tonnes of carbon), 60% above 1990 emissions. Under the A1B and A2 scenarios we would reach 13.5 GtC by 2100. Under the A2 scenario we would reach 29.1 GtC by 2100. The A2 scenario tracks a world where we more or less continue as we are; A1B represents a more balanced future energy use (fossil fuels and new technologies). Under A1B global temperatures would increase by 2.8˚C (min. 1.7 to max. 4.4˚C) by 2090–2099; under A2 global temperatures would increase by 3.4˚C (min. 2.0 to max. 5.4˚C) by 2090–2099. It is worth noting that we observe little difference to the coffee models and projections when using these two scenarios.
Further information on project outcomesSupporting resources for climate resilience in theEthiopian coffee sector are available online.
Supporting research articleMoat, J., Williams, J., Baena, S., Wilkinson, T., Gole, T.W., Challa, Z.K., Demissew, S. & Davis. A.P. (2017). Resilience potential of the Ethiopian coffee sector under climate change. Nature Plants 3: 17081 (2017). DOI: 10.1038/nplants.2017.81 http://dx.doi.org/10.1038/nplants.2017.81
Coffee Atlas of EthiopiaDavis, A.P., Wilkinson, T., Challa, Z.K., Williams, J., Baena, S., Gole, T.W. & Moat, J. (2017). Coffee Atlas of Ethiopia. Royal Botanic Gardens,Kew (UK).
36
False colour composite Landsat 8 image of the Bale and Rift areas, SE Ethiopia.Darker red represents denser vegetation.

Authors The principal authors of this report are Aaron Davis and Justin Moat(Royal Botanic Gardens, Kew), with contributions from TadesseWoldemariam Gole and Zeleke Kebebew Challa (Environment and Coffee Forest Forum – ECFF), Sebsebe Demissew (Addis Ababa University – AAU), and Susana Baena, Jenny Williams and Tim Wilkinson (Royal Botanic Gardens, Kew). Figure 3 is attributed to Mark Lee (Royal Botanic Gardens, Kew). The report should be cited as: Moat, J., Williams, J., Baena, S., Wilkinson, T., Demissew, S., Challa, Z.K., Gole, T.W. & Davis. A.P. (2017). Coffee Farming and Climate Change in Ethiopia: Impacts, Forecasts, Resilience and Opportunities. – Summary. The Strategic Climate Institutions Programme (SCIP). Royal Botanic Gardens, Kew (UK). Pp. 37.
Main project partnersEthiopian Biodiversity Institute (EBI)National Meteorology Agency (NMA)Ministry of Environment and Forest (MEF)Ministry of Agriculture (MoA)Addis Ababa University (AAU)Oromia Coffee Farmers’ Cooperative Union (OCFCU)
AcknowledgementsWe would like to extend our gratitude to all those that have contributed to the SCIP project Building a Climate Resilient Coffee Economy for Ethiopia, and especially SCIP project funders (Governments of the UK, Norway and Denmark) and in-country project partners (see above), and fund managers KPMG EA IDAS (Ethiopia). We would also like to acknowledge the participants of three Coffee and Climate Change workshops, particularly project partner representatives (see above), Climate & Development Knowledge Network (CDKN), Department for International Development (DFiD), Ethiopian Commodity Exchange (ECX), KPMG EA IDAS (Ethiopia), Farm Africa, Jerusalem Children and Community Development Organization (JeCCDO), Oxfam, Technoserve, University of Reading (UK), and Yeti Agro. We would also like to thank three anonymous reviewers, and Dagne Chomen (OCFCU), Robert O’Sullivan (RBG, Kew), and Emma Sage (Specialty Coffee Association of America – SCAA) for assistance with fieldwork.
We gratefully acknowledge coffee farmers and coffee farming communities across Ethiopia for their participation in the project, and especially for their hospitality and positive engagement during interviews and discussions.
The SCIP FundThe project Building a Climate Resilient Coffee Economy for Ethiopia was financed by the SCIP Fund. The SCIP Fund was financed by the Governments of the UK, Norway and Denmark; the views expressed in this report do not necessarily reflect the UK, Norway and Denmark governments’ official policies.
37
Coffee leaf tea, coffee husks and dried coffee fruits
Financed by the SCIP Fund