Documents.tips 266547987 Mary Balogh Primul Pas Casatoriapdf

CodeMetropolis – code visualisation in MineCraft
Gergo Balogh and Arpad Beszedes
Department of Software EngineeringUniversity of Szeged
Hungary{geryxyz, beszedes}@inf.u-szeged.hu
Abstract—Data visualisation with high expressive power playsan important role in code comprehension. Recent visualizationtools try to fulfil the expectations of the users and use variousanalogies. For example, in an architectural metaphor, each classis represented by a building. Buildings are grouped into districtsaccording to the structure of the namespaces. We think that theseunique ways of code representation have great potential, but inour opinion they use very simple graphical techniques (shapes,figures, low resolution) to visualize the structure of the sourcecode.
On the other hand, computer games use high quality graphicand good expressive power. A good example is Minecraft, apopular role playing game with great extensibility and inter-activity from another (third party) software. It supports bothhigh definition, photo-realistic textures and long range 3D scenedisplaying.
Our main contribution is to connect data visualisation withhigh end-user graphics capabilities. To achieve this, a conversiontool was implemented. It processes the basic source code metricsas input and generates a Minecraft world with buildings, districts,and gardens. The tool is in the prototype state, but it can be usedto investigate the possibilities of this kind of data visualisation.
I. INTRODUCTION
Software systems could reach virtually infinite complexityby their nature. In theory, there is no limit of control flowembedding, or the number of methods, attributes, and othersource code elements. In practice, these are bound to thecomputational power, time and storage capacities. To compre-hend these systems, developers have to construct a detailedmental image. These images are gradually built during theimplementation of the system.
Often, these mental images are realised as physical graphicswith the aid of data visualisation software. For example,different kinds of charts are used that emphasize the differenceamong various measurable quantities of the source code, orUML diagrams which are able to visualise complex relationsand connections among various entities in the system.
A. Classical visualisation
People are different, each of them having their own pointof views. They use various “tools” to comprehend the world.Some of them need numbers, others use abstract formulas,but most of them need to see to visualize the informationas colours, shapes, and figures. To fulfil the expectations ofpeople, a lot of data visualization techniques and tools were
designed and implemented. It exceeds the purpose of thisarticle to exhaustedly evaluate these techniques and tools, butin our opinion traditional visualisation tools like Rigi [11],sv3D [5] and SHriMP Views [8] are built on innovative ideasbut often it is difficult to interact with them, and they usuallyfall behind in terms of graphics from today’s computer games,for instance.
B. About CodeCity and EvoSpace
The most closely related approaches to our tool areCodeCity [10] and EvoSpace [4] which use the analogyof skyscrapers in a city. CodeCity simplifies the design ofthe buildings to a box with height, width, and colour. Thequantitative properties of the source code – called metrics – arerepresented with these attributes. In particular, each buildingrepresents a class where height shows the number of methods,width shows the number of attributes, and color shows thetype of the class. The buildings are grouped into districts asclasses are tied together into namespaces. The diagram itselfresembles to a 3D barchart with grouping. EvoSpace uses thisanalogy in a more sophisticated way. The buildings have twostates: closed – when the user can see the large scale propertieslike width and height, and open – when we are able to examinethe low, small scale structure of the classes, see the developersand their connections. It also provides visual entity tagging andquick navigation via the connections and on a small overviewmap.
Despite their appealing appearance and great potential ingeneral, these tools still use relatively low fidelity graphicscompared to today’s most advanced computer games. In thispaper we introduce our approach for visualising source codeusing the same metaphor but employing a sophisticated gameengine called Minecraft.
C. About Minecraft
Minecraft [6] is a popular role-playing game. It is written inJava language and uses OpenGL graphical engine to displaythe scenes. Both of these technologies are widely supportedon major platforms. It is distributed both as free and ascommercial software with support. There are several binaryformats used to describe the game scene – called world –which are either open standards or free formats.
The game itself does not have a strict game-flow. Its mainfocus is creativity and the joy of creation. Only the availablecomputation power and the storage capacity can limit thefantasy of the player.978-1-4673-5739-5/13/$31.00 c© 2013 IEEE

Figure 1. JUnit project visualized by CodeMetropolis
The main concept in the game is the block. It is a box withabout one meter long sides, compared to the player. Almosteverything is built up of it, so the whole World is a 3D matrixfilled with blocks of various types. The player can collect theblocks, create (craft) new ones and interact with them. Thegame is similar to a virtual Lego with infinite playground andan infinite number of building blocks.
The player has its own backpack which can be filled withblocks and tools. The tools are used to accomplish or speed upvarious tasks like mining. Every tool has its own properties.There are some common materials like dirt, stone and sand,and some special blocks have more sophisticated purposes, forexample cheast, which can store items, and various electronic(red wire) devices like pressure sensitive plates, buttons, andswitches.
Due to its extensibility, its simple yet sophisticated func-tions, and its rich palette of possibilities Minecraft can displaycomplex structures with a low overhead.
II. DATA VISUALISATION IN CODEMETROPOLIS
CodeMetropolis is a command line tool written in C#. Ittakes the output graph of Columbus Tool [1] and creates aMinecraft world from it. The output is given with a uniquebinary format, but the related tools and the format itself areunder development and not yet published. For these reasonswe could not give a detailed specification of the output format.The world uses the metropolis metaphor, which means that thesource code metrics are represented with the various propertiesof the different kinds of buildings. Figure 1 shows an exampleworld.
The representation has two main levels. On the data level,each entity has its own property set – for example metrics.In the current version, these are loaded from the previouslymentioned graph, but we plan to support other data sources, forexample XML files. These data are displayed on the metaphor
level. All buildings in the metropolis belong to this. Thebuildings and the world itself has a couple of attributes whichcontrol visual appearance. The properties are mapped to theattributes in order to visualise the data. However, in the currentversion this mapping is hardcoded, the further versions willsupport customisation with a sophisticated mapping language.
A. Considered metrics and properties
As mentioned before, source code metrics were used toexpress the various properties of the system. Our source codeanalysis toolset, Columbus, produces a number of differentsource code metrics for various languages. Some of the mostcommonly used metrics are the following:
NOI Number of outgoing invocations, NII Number ofincoming invocations, LOC Lines of code, TLLOC Totallogical lines of code, LLOC Logical lines of code, NUMPARNumber of parameters, NL Nesting level, McCC McCabe’scyclomatic complexity, NOS Number of statements.
These common metrics were considered during the exper-iments, however the current version of CodeMetropolis doesnot use all of them (we detail the used ones below).
To create a visualization with sufficient expressive power,the structure of the system has to be displayed as well. Thegraph input contains this information, expressed with the edgesof the graph. From several types of edges only the containmentrelation was used.
Figure 2 shows a simple input graph. It represents a smallJava program which only consists of a couple of source files.The source code and the graph of this example were includedin the sample inputs.
B. Data mapping
The current version of the converter uses the followingentities and attributes to visualise the source code. These items
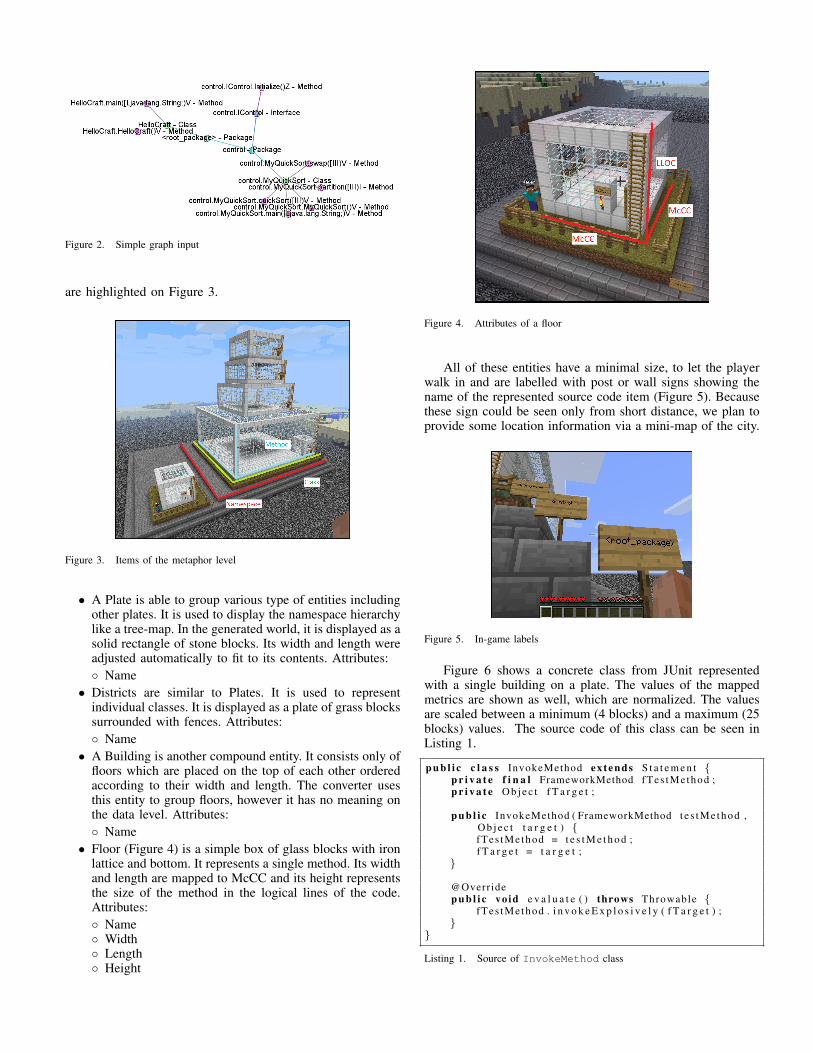
Figure 2. Simple graph input
are highlighted on Figure 3.
Figure 3. Items of the metaphor level
• A Plate is able to group various type of entities includingother plates. It is used to display the namespace hierarchylike a tree-map. In the generated world, it is displayed as asolid rectangle of stone blocks. Its width and length wereadjusted automatically to fit to its contents. Attributes:◦ Name
• Districts are similar to Plates. It is used to representindividual classes. It is displayed as a plate of grass blockssurrounded with fences. Attributes:◦ Name
• A Building is another compound entity. It consists only offloors which are placed on the top of each other orderedaccording to their width and length. The converter usesthis entity to group floors, however it has no meaning onthe data level. Attributes:◦ Name
• Floor (Figure 4) is a simple box of glass blocks with ironlattice and bottom. It represents a single method. Its widthand length are mapped to McCC and its height representsthe size of the method in the logical lines of the code.Attributes:◦ Name◦ Width◦ Length◦ Height
Figure 4. Attributes of a floor
All of these entities have a minimal size, to let the playerwalk in and are labelled with post or wall signs showing thename of the represented source code item (Figure 5). Becausethese sign could be seen only from short distance, we plan toprovide some location information via a mini-map of the city.
Figure 5. In-game labels
Figure 6 shows a concrete class from JUnit representedwith a single building on a plate. The values of the mappedmetrics are shown as well, which are normalized. The valuesare scaled between a minimum (4 blocks) and a maximum (25blocks) values. The source code of this class can be seen inListing 1.
p u b l i c c l a s s InvokeMethod ex tends S t a t e m e n t {p r i v a t e f i n a l FrameworkMethod fTes tMethod ;p r i v a t e O b j e c t f T a r g e t ;
p u b l i c InvokeMethod ( FrameworkMethod t e s tMe thod ,O b j e c t t a r g e t ) {fTes tMethod = t e s t M e t h o d ;f T a r g e t = t a r g e t ;
}
@Overridep u b l i c vo id e v a l u a t e ( ) throws Throwable {
fTes tMethod . i n v o k e E x p l o s i v e l y ( f T a r g e t ) ;}
}
Listing 1. Source of InvokeMethod class

Figure 6. Example class visualization
C. Multilevel data visualisation
One of the problems of understanding complex systemsis the flow of information. In this case, the users have toomuch low level information and they are unable to filter outthe irrelevant data. To overcome this problem, we introducedmultilevel data visualisation. With this technique, the usershave the opportunity to decide how much details they wouldlike to see.
In Minecraft, this is simply done by looking at the entitiesfrom different distances. Since Minecraft allows one to fly ina so called creative mode, the user can inspect the metropolisfrom the bird’s eye view thus seeing the large scale size of theclasses and the namespaces. Then, one can walk on the streetsand compare the size and the complexity of the methods.It is even possible to go inside the methods and – in thefuture version – explore their inner structure represented withfurniture.
III. BENEFITS AND USE CASES
The usefulness of a tool like CodeMetropolis depends onvarious factors including the experience and personal valuesof the users. People who naturally use similar metaphors tounderstand the world this could be a straightforward way ofvisualisation, while for many others the approach would bemerely an interesting but generally an experimental idea.
With these considerations kept in mind, a couple of usecases will be explained. There are two main applications ofthe data visualisation tools – and CodeMetropolis. It can beused on real life projects, or in classrooms, to help studentsunderstand complex relations and concepts. In the use cases,we were focusing on the first one, but the corresponding usecases of the second one can be easily found.
A. Bad smells detection
Bad smells are the parts of the code which will probablycause an error or are difficult to maintain. [2] Developersusually identify bad smells by reading the source code.
With CodeMetropolis, developers are actually able to seesome of the smells. For example, if the logical lines of the
methods are mapped to the height of the floors – as in thecurrent version – a giant class can be easily found by searchingthe tallest building of the metropolis. Then, by walking orflying around this building the count and size of the methodscould be examined. If there are only a couple of them, these arelarge methods that need to be split up. On the other hand, whenthere are a lot of small methods, the class might be a so calledgod or brain class which needs to move its functionalities intoanother class, maybe a new one.
B. Inspect the structure of code
When new developers are assigned to an ongoing projectthey have to understand the large scale structure of the system.They usually browse via many directories and source files,or in better cases they look at the different diagrams anddocumentations of the system. But any case simply browsingthrough a myriad of code and documents is tedious andthe developers’ motivation rapidly decreases. Furthermore,documentations is often outdated or incomplete.
The worlds of CodeMetropolis are generated from thesource code, so they always reflect the current state of thesystem. Developers can fly over the metropolis and see theclusters of the classes and the namespaces.
C. Annotating entities
When developers are inspecting the source code, they oftenleave comments to mark its parts.
The future version of our conversion tool will support codeannotation. When developers put a wall or post a sing on someentities (floors, buildings), the text on it will be inserted intothe source code as a comment. Furthermore, in the multi-playermode developers can see and interact with each other, so someparts of a code review meeting can be held in the Minecraftworld.
D. Present code history
There are several open-source Minecraft servers whichsupport extendibility. We plan to use these servers to visualizethe code history gathered from the version controlling system.
With the use of historical data, representations can begenerated for each revision, then several computer controlledplayers will be used to literally build these states of themetropolis. Each player represents a developer and will buildthe parts of the buildings that they coded. For example, ifa developer inserts a new method into a class, the playerwill go to the corresponding building and build a new floorrepresenting the new method. Project managers and otherdevelopers can join the server and see the evolution of thesystem.
E. Identify untested code
Test coverage data will be integrated into a future versionof the converter. For example, torches and glowstones can beused to illuminate the building representing the tested partsof the code. The height of the fences around the classes canrepresent the number of test cases associated with the givenclass. The colour of these fences can be used to indicate theresult of the test case (pass, fail).

F. Understanding inter-metrical relations
Since source code can be complex having many differentproperties and attributes and relations to other entities, classicalvisualisation techniques like graphs and charts cannot representso much information at once. However, to understand therelation and connection among the various metrics, the globalcontext has to be analysed.
To address this problem, CodeMetropolis will use varioussophisticated metaphors. For example, a floor represents amethod. Its width and length are mapped to its complexityand its height indicates its size. Furthermore, the number ofwindows and doors visualise the count of its parameters. Thereare torches on the wall if the method is tested and the fencesaround it indicate the number of passed test cases. Even if thedevelopers do not know the formal definition of these metrics,they are able to see the consequences of their actions whilewriting the code. Sooner or later, they will assign informalmeanings to the different kinds of graphical elements in themetropolis and they will perceive the represented source codeas a whole.
IV. CURRENT STATE
CodeMetropolis is in a prototype state, and we have a lot ofplans for various additional functionalities to be implemented.However, with this paper we intend to publish current resultsand further ideas as a proof of the implementability of theconcept.
This version was written in C# using the .Net framework. Itis a command line tool which takes the previously mentionedgraph as input and creates a Minecraft world from it. Thereare a couple of open-source API-s for every major languagewhich support editing or creations over these worlds. Our tooluses the Substrate [9] library for .NET Framework.
Currently, only the previously mentioned complexity andsize metrics are visualised with the entities listed in Sec-tion II-B and only the namespaces, classes and methods arerepresented. However, even with this limited toolset we wereable to visualise complex, real life systems and gain usefulinsights into the systems. As an example, Figure 1 shows theview of the JUnit [3] metropolis.
A. User feedback
“It makes software metrics such fun that you wantto do it.” an user
We performed a number of interviews among our col-leagues that included university lecturers, students and de-velopers working on industrial code, altogether six users wasasked. We wanted to gain early feedback on the converter andthe visualisation technique in general. In this section, both thenegative and the positive impressions about CodeMetropoliswill be summarised.
The negative opinions are grouped into several topics. Thefirst of these concerns is the problem of great distances. Themetropolis of a large or medium scale project can be hugeand the players need a lot of time to navigate in it. We planto solve this problem by implementing a quick map and anavigation system. These will be included in the multi-player
server enabling the players to see their location and quicklyteleport to other places.
Other opinions were concerned about the learning curves,either about Minecraft or about the visualisation. In ouropinion, Minecraft has very simple control logic and in-gamephysics, no cryptic keyboard short-cuts, or complex machinery.It can be learned quickly and easily while playing or withthe use of sophisticated online resources [7] covering everydetail. Minecraft supports two special items among others:cheats, which can store other items and book them, and quill,which allows the players to take notes and write books inthe game. CodeMetropolis will also support these to createin-game explanation notes for the items of the metaphor level.
The last problem was the lack of simultaneous data visu-alisation. The users could identify only three attributes: width,length, and height. This limited set is not enough to visualisethe complex items of the data level, but as explained abovewe will be able to extend the tool with additional propertieseasily.
The positive impressions are also grouped into categories.The first of these is about the expressive power provided bythe metaphor and the in-game logic of Minecraft. The secondone is that the “work while you play” approach can maintainor even increase the motivation of the users, especially stu-dents. Finally, the users mentioned one of our further plans,the round-trip source code management. For example, if theplayers destroy a floor in the metropolis, the correspondingmethod will be removed from the source code.
V. FUTURE WORKS
In this section, we will enumerate some of our furtherplans. Since almost all of these were explained in depth inthe previous sections, here only a short list is given.
Extending the palette of the entities and attributes Thefuture version of our converter will use an extended paletteof the blocks supported in Minecraft. For example, flowersto decorate beautiful code and zombies (hostile creatures) toindicate bad practices.Navigation support We plan to implement a mini-map anda teleportation system. The related classes will be connectedwith railways allowing the users to navigate and see theconnections.Round-trip source code management The changes betweenthe source code and the metropolis will be propagated to eachother.In-game explanations Post and wall sings and books will beused to explain the meaning of the various attributes and toshow the source code of the corresponding element.Visualize source code history The functionality of open-source multi-player severs will be extended to visualize sourcecode history. For example, computer controlled players (npc-sor bots) will build the metropolis as the developers committheir changes into the version control system.
VI. CONCLUSION
In some cases, developers need to step away from thesource code and inspect the system from a different per-spective. We believe that CodeMetropolis will be able to

maintain motivation without sacrificing productivity thanks toits intuitive and, for many people, already known graphicalsurface. The provided metropolis metaphor has enough expres-sive power to represent the complex items of the source code.Combined with high quality graphical techniques provided bytoday’s computer games, it is able to offer a rich graphical in-terface, an easy to learn controlling, and a rich user experience.It is probably easier to fit in classrooms than in a commercialproject. However, we will continue its development to integratethe functionalities which are useful for developers, for students,and for teachers.
APPENDIX ADEMONSTRATION
The demonstration will be carried out live, which meansthat a small example project written in Java will be visualisedfrom the source code to the metropolis in Minecraft. We willgo through the following steps:
1) The problem will be presented in a couple of slides towarm up the audience.
2) A sample world will be generated by Minecraft to illus-trate the possibilities of the game.
3) A small sample code will be introduced.4) The example project will be converted to a Minecraft
world.5) Every attribute mentioned in this paper will be explained
on the metropolis generated in the previous step.6) The authors and the audience will explore together the
metropolis of JUnit.
APPENDIX BEXECUTABLES AND SAMPLES
The current version of CodeMetropolis can be downloadedfrom the following url: http://www.inf.u-szeged.hu/∼geryxyz/code-metropolis.html. The published package contains theexecutables and two sample projects: JUnit and HelloCraft,both of them were mentioned in this paper, together withsample inputs and outputs.
The tool is distributed in two ways: in portable binariesand in a setup package. It requires the 4.5 version of the.NET framework. After installing or copying the executablesinto the desired location, the conversion can be started withthe CodeMetropolis.exe <input-file>.graphcommand from the command-line prompt. It will prompt topress the Enter-key when the conversation is finished. Theresults will be produced in the CodeWorld directory underthe current directory. It will contain the generated Minecraftworld which needs to be copied to<user-home>\AppData\Roaming\.minecraft\savesunder Microsoft Windows 7. Then the user will be able toopen it with Minecraft as a usual world. The tool was testedwith 1.5.2 version of Minecraft.
REFERENCES
[1] Rudolf Ferenc et al. “Columbus – Reverse EngineeringTool and Schema for C++”. In: Proceedings of theIEEE International Conference on Software Mainte-nance (ICSM 2002). IEEE Computer Society, Oct. 2002,pp. 172–181.
[2] Martin Fowler et al. Refactoring: Improving the Designof Existing Code. Addison-Wesley Professional, 1999,p. 464. ISBN: 0201485672.
[3] JUnit Official Website. URL: http://junit.org/.[4] D Lalanne and J Kohlas. Human Machine Interaction:
Research Results of the MMI Program. 2009.[5] A. Marcus, D. Comorski, and A. Sergeyev. “Supporting
the evolution of a software visualization tool throughusability studies”. In: Proceedings of the 13th Inter-national Workshop on Program Comprehension (May2005), pp. 307–316. DOI: 10.1109/WPC.2005.34.
[6] Minecraft Official Website. URL: http://minecraft.net/.[7] Minecraft Wiki - The ultimate resource for all things
Minecraft. URL: http : / /www.minecraftwiki . net /wiki /Minecraft\ Wiki.
[8] Margaret-anne Storey, Casey Best, and Jeff Michaud.“SHriMP views: an interactive environment for informa-tion visualization and navigation”. In: CHI ’02 extendedabstracts on Human factors in computing systems - CHI’02 (Apr. 2002), p. 520. DOI: 10.1145/506443.506459.
[9] substrate-minecraft A .NET SDK for editing Minecraftworlds. URL: https : / / code . google . com / p / substrate -minecraft/.
[10] Richard Wettel and Michele Lanza. “CodeCity”. In:Companion of the 13th international conference on Soft-ware engineering - ICSE Companion ’08. New York,New York, USA: ACM Press, May 2008, p. 921. ISBN:9781605580791. DOI: 10.1145/1370175.1370188.
[11] Kenny Wong. “Rigi user’s manual”. In: Department ofComputer Science, University of Victoria (1998).