COCONUT SQUARE - thurretail.comthurretail.com/images/Coconut_Square_flyer_4-12-18.pdf · Site Plan...
8
Retail Space Available: 1,463 SF | 1,667 SF 4970 - 4998 W. Atlantic Blvd., Margate, FL COCONUT SQUARE Coconut Square is a Neighborhood Center located at the southeast corner of Atlantic Blvd and Banks Rd in the city of Margate in Broward County, Florida. The city of Margate is a mix of residential, commercial, residential and conservation uses. It is a home to various amenities and services with great emphasis on small business growth. The center was built in 1987 and sits in a 1.85 AC of land with 185 parking spaces, dedicated turn lane and signalized intersection. Over 155,00 people and 73,656 employees within a 3 mile radius. Heavy traffic count of 48,000 cars per day on W. Atlantic Blvd and E. Hemingway Cir. and less than a mile from the very busy US Hwy 441 with traffic count of 61,500 car per day. Surrounded by National Tenants such as: Publix, Walmart Supercenter, Marshalls, Ross, Big Lots, Home Depot, Winn-Dixie and Office Depot. Demographics 2016 1 Mile 3 Mile 5 Mile Population 14,977 155,290 404,027 Daytime Population 7,060 73,656 222,174 Average Household Income $60,942 $56,696 $61,316 Commercial Real Estate Brokerage THUR RETAIL Thur & Associates RETAIL BROKER NETWORK For More Information on Leasing, Please Contact: Shary Thur | cell: 561.989.4203 | office: 561.226.1792 | email: [email protected] George Sarkisian | cell: 561.322.8713 | office: 561.226.1798 | email: [email protected] Florida Office: 327 Plaza Real Blvd Suite 301, Boca Raton, FL 33432 | p: 561.395.2441 Corporate Office: 1054 31st St NW Suite 115, Washington, DC 20007 | p: 202.823.4444 www.thurretail.com 4-12-18 N Ocean Ave W. Atlantic Blvd N. Hemingway Circle Hemingway Dr Banks Rd
Transcript of COCONUT SQUARE - thurretail.comthurretail.com/images/Coconut_Square_flyer_4-12-18.pdf · Site Plan...

Retail Space Available: 1,463 SF | 1,667 SF
4970 - 4998 W. Atlantic Blvd., Margate, FL
COCONUT SQUARE
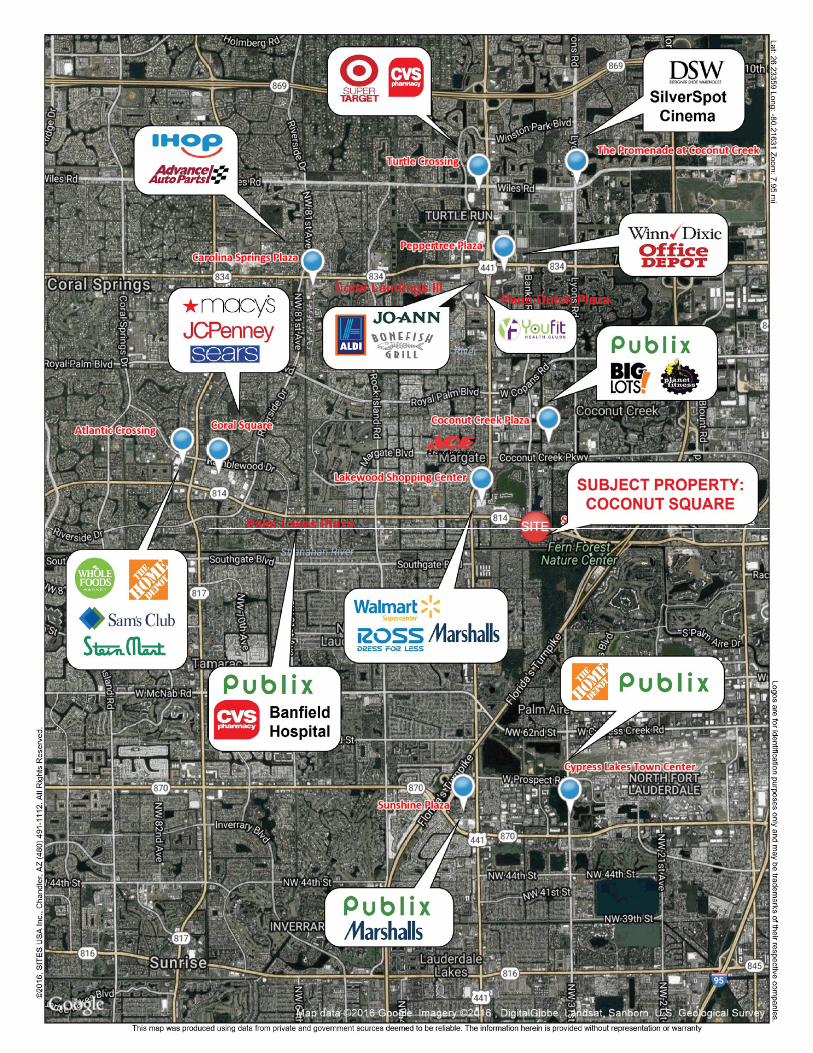
Coconut Square is a Neighborhood Center located at the southeast corner of Atlantic Blvd and Banks Rd in the city of Margate in Broward County, Florida.
The city of Margate is a mix of residential, commercial, residential and conservation uses. It is a home to various amenities and services with greatemphasis on small business growth.
The center was built in 1987 and sits in a 1.85 AC of land with 185 parking spaces, dedicated turn lane and signalized intersection. Over 155,00 people and 73,656 employees within a 3 mile radius.
Heavy traffic count of 48,000 cars per day on W. Atlantic Blvd and E. Hemingway Cir. and less than a mile from the very busy US Hwy 441 with traffic count of 61,500 car per day.
Surrounded by National Tenants such as: Publix, Walmart Supercenter, Marshalls, Ross, Big Lots, Home Depot, Winn-Dixie and Office Depot.
Demographics 2016 1 Mile 3 Mile 5 Mile
Population 14,977 155,290 404,027
Daytime Population 7,060 73,656 222,174
Average Household Income $60,942 $56,696 $61,316
Commercial Real Estate Brokerage
THUR RETAILT h u r & A s s o c i a t e s
RETAIL BROKER NETWORK
For More Information on Leasing, Please Contact: Shary Thur | cell: 561.989.4203 | office: 561.226.1792 | email: [email protected]
George Sarkisian | cell: 561.322.8713 | office: 561.226.1798 | email: [email protected] Florida Office: 327 Plaza Real Blvd Suite 301, Boca Raton, FL 33432 | p: 561.395.2441 Corporate Office: 1054 31st St NW Suite 115, Washington, DC 20007 | p: 202.823.4444
www.thurretail.com 4-12-18
N Ocean Ave
W. Atlantic Blvd
N. Hemingway Circle
Hem
ingw
ay D
r
Ban
ks R
d

4,085 SF
3,333 SF
AvailableAvailable
Dermatology
Real
Esta
teO
�ce
Coconut SquareSite Plan - updated 4-12-18
Atlantic Blvd
Bank
s Ro
ad
Hem
ingw
ay D
rive
4,597 SF
1,72
5 SF
Orie
ntal
Mas
sage
Cric
ket
Wire
less
Maj
estic
Ki
tche
n& B
ath
Brow
ard
Wel
lnes
s
Div
ino
Food
Past
a
Hai
r & N
ails
Hai
r & N
ails
Insu
ranc
e Ag
ency
1,42
3 SF
Com
mun
ity W
elln
ess
1,12
3 SF
1,72
3 SF
1,42
3 SF
1,23
7 SF
1,23
7 SF
1,45
5 SF
1,46
3 SF
1,48
2 SF
1,66
7 SF
1,40
2 S
F
1,49
8 S
F
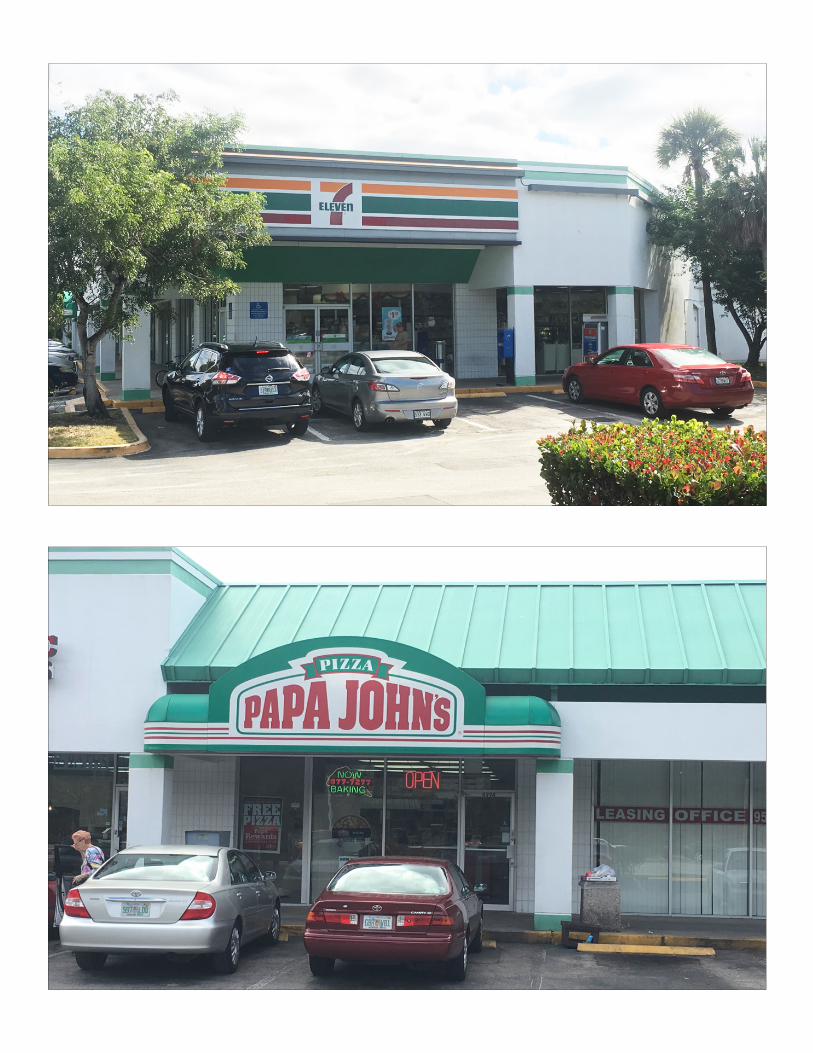
Tenant Category SF7 Eleven Convenience Store 4,085
Oriental Massage Massage 1,725
Cricket Wireless Wireless 1,423
Community Wellness Medical 1,123
Papa John’s (recently expanded) Pizza 1,723
Majestic Kitchen & Bath Home Improvement 1,423
Pasta Restaurant 1,237
Hair & Nails Beauty Salon 1,237
Hair & Nails Beauty Salon 1,455
Available Former Tax Office 1,463
Insurance Agency Insurance Office 1,482
Real Estate Office Real Estate 3,333
Available Former Print Shop 1,667
Divino Food Restaurant 1,498
Broward Wellness Health & Wellness 1,402
Dermatology Dermatology 4,597

Demographic and Income ProfileCoconut Square Prepared by Esri4970 W Atlantic Blvd, Margate, Florida, 33063 Latitude: 26.23408Ring: 1 mile radius Longitude: -80.19334
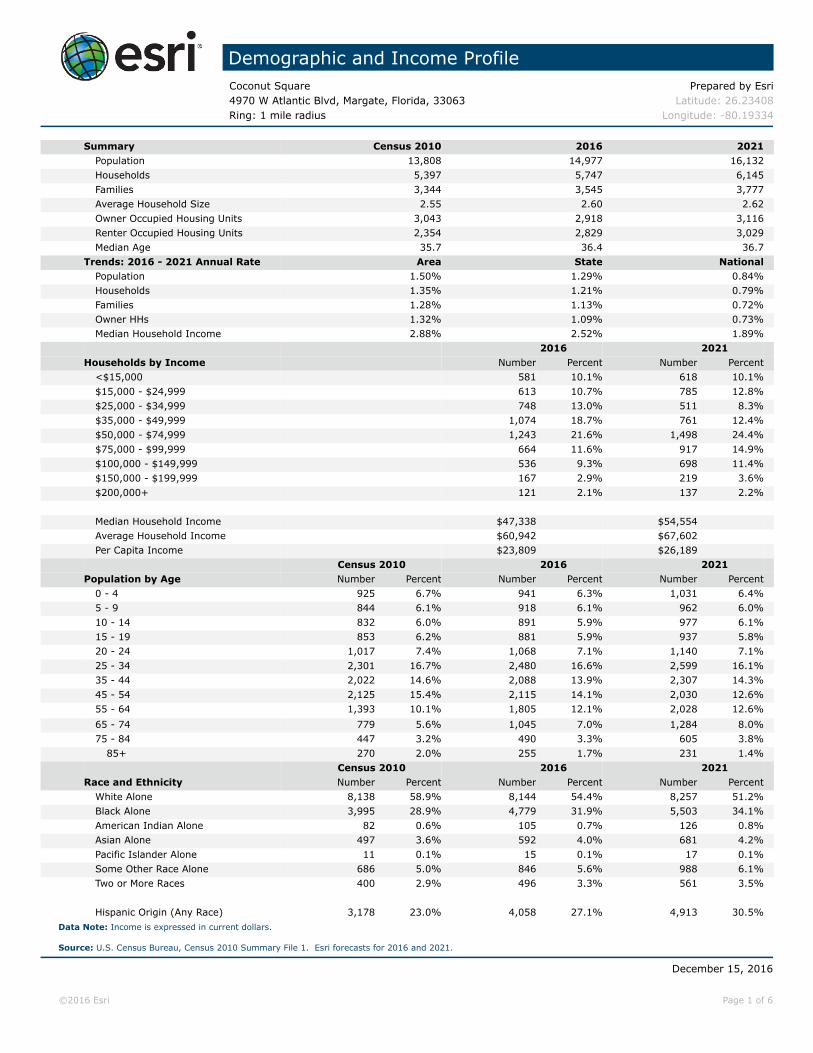
Summary Census 2010 2016 2021Population 13,808 14,977 16,132Households 5,397 5,747 6,145Families 3,344 3,545 3,777Average Household Size 2.55 2.60 2.62Owner Occupied Housing Units 3,043 2,918 3,116Renter Occupied Housing Units 2,354 2,829 3,029Median Age 35.7 36.4 36.7
Trends: 2016 - 2021 Annual Rate Area State NationalPopulation 1.50% 1.29% 0.84%Households 1.35% 1.21% 0.79%Families 1.28% 1.13% 0.72%Owner HHs 1.32% 1.09% 0.73%Median Household Income 2.88% 2.52% 1.89%
2016 2021 Households by Income Number Percent Number Percent
<$15,000 581 10.1% 618 10.1%$15,000 - $24,999 613 10.7% 785 12.8%$25,000 - $34,999 748 13.0% 511 8.3%$35,000 - $49,999 1,074 18.7% 761 12.4%$50,000 - $74,999 1,243 21.6% 1,498 24.4%$75,000 - $99,999 664 11.6% 917 14.9%$100,000 - $149,999 536 9.3% 698 11.4%$150,000 - $199,999 167 2.9% 219 3.6%$200,000+ 121 2.1% 137 2.2%
Median Household Income $47,338 $54,554Average Household Income $60,942 $67,602Per Capita Income $23,809 $26,189
Census 2010 2016 2021 Population by Age Number Percent Number Percent Number Percent
0 - 4 925 6.7% 941 6.3% 1,031 6.4%5 - 9 844 6.1% 918 6.1% 962 6.0%10 - 14 832 6.0% 891 5.9% 977 6.1%15 - 19 853 6.2% 881 5.9% 937 5.8%20 - 24 1,017 7.4% 1,068 7.1% 1,140 7.1%25 - 34 2,301 16.7% 2,480 16.6% 2,599 16.1%35 - 44 2,022 14.6% 2,088 13.9% 2,307 14.3%45 - 54 2,125 15.4% 2,115 14.1% 2,030 12.6%55 - 64 1,393 10.1% 1,805 12.1% 2,028 12.6%65 - 74 779 5.6% 1,045 7.0% 1,284 8.0%75 - 84 447 3.2% 490 3.3% 605 3.8%
85+ 270 2.0% 255 1.7% 231 1.4%Census 2010 2016 2021
Race and Ethnicity Number Percent Number Percent Number PercentWhite Alone 8,138 58.9% 8,144 54.4% 8,257 51.2%Black Alone 3,995 28.9% 4,779 31.9% 5,503 34.1%American Indian Alone 82 0.6% 105 0.7% 126 0.8%Asian Alone 497 3.6% 592 4.0% 681 4.2%Pacific Islander Alone 11 0.1% 15 0.1% 17 0.1%Some Other Race Alone 686 5.0% 846 5.6% 988 6.1%Two or More Races 400 2.9% 496 3.3% 561 3.5%
Hispanic Origin (Any Race) 3,178 23.0% 4,058 27.1% 4,913 30.5%Data Note: Income is expressed in current dollars.
Source: U.S. Census Bureau, Census 2010 Summary File 1. Esri forecasts for 2016 and 2021.
December 15, 2016
©2016 Esri Page 1 of 6
Demographic and Income ProfileCoconut Square Prepared by Esri4970 W Atlantic Blvd, Margate, Florida, 33063 Latitude: 26.23408Ring: 3 mile radius Longitude: -80.19334
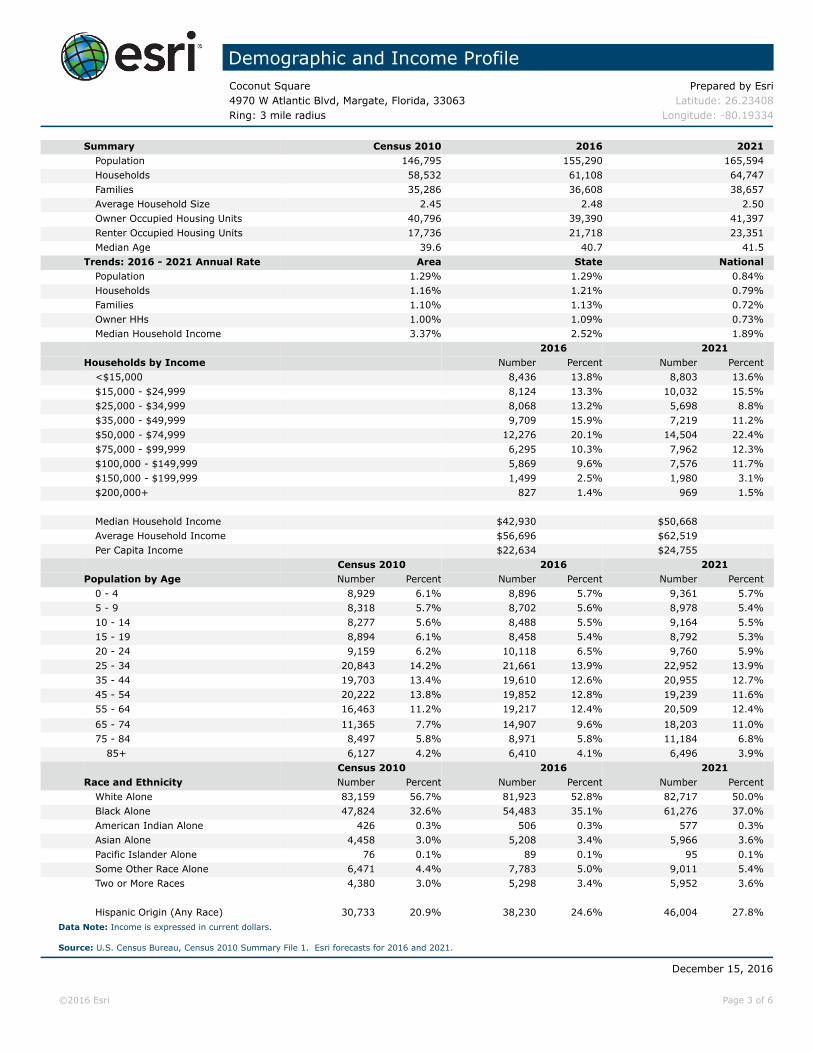
Summary Census 2010 2016 2021Population 146,795 155,290 165,594Households 58,532 61,108 64,747Families 35,286 36,608 38,657Average Household Size 2.45 2.48 2.50Owner Occupied Housing Units 40,796 39,390 41,397Renter Occupied Housing Units 17,736 21,718 23,351Median Age 39.6 40.7 41.5
Trends: 2016 - 2021 Annual Rate Area State NationalPopulation 1.29% 1.29% 0.84%Households 1.16% 1.21% 0.79%Families 1.10% 1.13% 0.72%Owner HHs 1.00% 1.09% 0.73%Median Household Income 3.37% 2.52% 1.89%
2016 2021 Households by Income Number Percent Number Percent
<$15,000 8,436 13.8% 8,803 13.6%$15,000 - $24,999 8,124 13.3% 10,032 15.5%$25,000 - $34,999 8,068 13.2% 5,698 8.8%$35,000 - $49,999 9,709 15.9% 7,219 11.2%$50,000 - $74,999 12,276 20.1% 14,504 22.4%$75,000 - $99,999 6,295 10.3% 7,962 12.3%$100,000 - $149,999 5,869 9.6% 7,576 11.7%$150,000 - $199,999 1,499 2.5% 1,980 3.1%$200,000+ 827 1.4% 969 1.5%
Median Household Income $42,930 $50,668Average Household Income $56,696 $62,519Per Capita Income $22,634 $24,755
Census 2010 2016 2021 Population by Age Number Percent Number Percent Number Percent
0 - 4 8,929 6.1% 8,896 5.7% 9,361 5.7%5 - 9 8,318 5.7% 8,702 5.6% 8,978 5.4%10 - 14 8,277 5.6% 8,488 5.5% 9,164 5.5%15 - 19 8,894 6.1% 8,458 5.4% 8,792 5.3%20 - 24 9,159 6.2% 10,118 6.5% 9,760 5.9%25 - 34 20,843 14.2% 21,661 13.9% 22,952 13.9%35 - 44 19,703 13.4% 19,610 12.6% 20,955 12.7%45 - 54 20,222 13.8% 19,852 12.8% 19,239 11.6%55 - 64 16,463 11.2% 19,217 12.4% 20,509 12.4%65 - 74 11,365 7.7% 14,907 9.6% 18,203 11.0%75 - 84 8,497 5.8% 8,971 5.8% 11,184 6.8%
85+ 6,127 4.2% 6,410 4.1% 6,496 3.9%Census 2010 2016 2021
Race and Ethnicity Number Percent Number Percent Number PercentWhite Alone 83,159 56.7% 81,923 52.8% 82,717 50.0%Black Alone 47,824 32.6% 54,483 35.1% 61,276 37.0%American Indian Alone 426 0.3% 506 0.3% 577 0.3%Asian Alone 4,458 3.0% 5,208 3.4% 5,966 3.6%Pacific Islander Alone 76 0.1% 89 0.1% 95 0.1%Some Other Race Alone 6,471 4.4% 7,783 5.0% 9,011 5.4%Two or More Races 4,380 3.0% 5,298 3.4% 5,952 3.6%
Hispanic Origin (Any Race) 30,733 20.9% 38,230 24.6% 46,004 27.8%Data Note: Income is expressed in current dollars.
Source: U.S. Census Bureau, Census 2010 Summary File 1. Esri forecasts for 2016 and 2021.
December 15, 2016
©2016 Esri Page 3 of 6

Demographic and Income ProfileCoconut Square Prepared by Esri4970 W Atlantic Blvd, Margate, Florida, 33063 Latitude: 26.23408Ring: 5 mile radius Longitude: -80.19334
Summary Census 2010 2016 2021Population 379,541 404,027 432,634Households 149,184 156,837 166,969Families 92,768 96,689 102,451Average Household Size 2.50 2.54 2.56Owner Occupied Housing Units 98,364 95,173 100,532Renter Occupied Housing Units 50,820 61,664 66,437Median Age 38.7 39.9 40.5
Trends: 2016 - 2021 Annual Rate Area State NationalPopulation 1.38% 1.29% 0.84%Households 1.26% 1.21% 0.79%Families 1.16% 1.13% 0.72%Owner HHs 1.10% 1.09% 0.73%Median Household Income 2.98% 2.52% 1.89%
2016 2021 Households by Income Number Percent Number Percent
<$15,000 20,589 13.1% 21,624 13.0%$15,000 - $24,999 19,769 12.6% 24,352 14.6%$25,000 - $34,999 20,060 12.8% 14,193 8.5%$35,000 - $49,999 24,335 15.5% 18,479 11.1%$50,000 - $74,999 30,449 19.4% 35,955 21.5%$75,000 - $99,999 16,551 10.6% 20,542 12.3%$100,000 - $149,999 16,387 10.4% 20,975 12.6%$150,000 - $199,999 5,226 3.3% 6,818 4.1%$200,000+ 3,466 2.2% 4,028 2.4%
Median Household Income $45,092 $52,232Average Household Income $61,316 $67,510Per Capita Income $24,089 $26,320
Census 2010 2016 2021 Population by Age Number Percent Number Percent Number Percent
0 - 4 23,618 6.2% 23,568 5.8% 24,879 5.8%5 - 9 22,313 5.9% 23,622 5.8% 24,329 5.6%10 - 14 22,945 6.0% 23,334 5.8% 25,289 5.8%15 - 19 24,111 6.4% 22,932 5.7% 23,763 5.5%20 - 24 23,842 6.3% 26,323 6.5% 25,331 5.9%25 - 34 53,442 14.1% 56,638 14.0% 61,145 14.1%35 - 44 53,248 14.0% 52,630 13.0% 56,407 13.0%45 - 54 56,284 14.8% 55,268 13.7% 53,330 12.3%55 - 64 43,275 11.4% 51,453 12.7% 55,546 12.8%65 - 74 26,574 7.0% 36,077 8.9% 44,714 10.3%75 - 84 18,071 4.8% 19,558 4.8% 24,740 5.7%
85+ 11,818 3.1% 12,624 3.1% 13,160 3.0%Census 2010 2016 2021
Race and Ethnicity Number Percent Number Percent Number PercentWhite Alone 215,414 56.8% 213,087 52.7% 215,506 49.8%Black Alone 122,629 32.3% 141,028 34.9% 159,732 36.9%American Indian Alone 990 0.3% 1,168 0.3% 1,327 0.3%Asian Alone 11,053 2.9% 13,076 3.2% 15,104 3.5%Pacific Islander Alone 195 0.1% 235 0.1% 259 0.1%Some Other Race Alone 17,491 4.6% 21,100 5.2% 24,524 5.7%Two or More Races 11,769 3.1% 14,333 3.5% 16,182 3.7%
Hispanic Origin (Any Race) 81,517 21.5% 101,602 25.1% 122,551 28.3%Data Note: Income is expressed in current dollars.
Source: U.S. Census Bureau, Census 2010 Summary File 1. Esri forecasts for 2016 and 2021.
December 15, 2016
©2016 Esri Page 5 of 6