Cochin Shipyard HO (COCSHI) CMP: | 375 Target: | 455
13
HO ICICI Securities – Retail Equity Research Result Update May 28, 2019 CMP: | 375 Target: | 455 ( 21%) Target Period: 12 months Cochin Shipyard (COCSHI) BUY Mixed Q4, phase-3 of IAC to be signed soon… Cochin Shipyard (CSL) reported mixed Q4FY19 numbers. Shipbuilding, shiprepair revenues grew 31.4%, 29.7% respectively. However, shiprepair segment reported EBIT loss due to initial expenses at the newly established Mumbai port facility coupled losses incurred on the ONGC rig (Sagar Bhusan). Shipbuilding segment reported strong EBIT margins of 27.4% whereas the shiprepair segment reported margins of -5.6%. Shipbuilding and shiprepair segment contributed 84% and 16% to the topline, respectively. Overall, revenues increased 31.1% YoY to | 787.6 crore. We expected revenue of | 620.5 crore for the quarter. The company reported EBITDA margins of 14% vs. 19.2% YoY. Gross margins came in at 35.2% vs. 45.2% YoY (raw material costs increased 55.2% YoY). Employee expenses declined 17.5% YoY. Absolute EBITDA de-grew 4.4% YoY to | 110 crore. Other income increased 70.6% YoY to | 65 crore. Depreciation expenses declined 2.9% YoY. Accordingly, PAT grew 6.4% YoY to | 97.5 crore. Stable performance, healthy b/s, capex on-track For FY19, shipbuilding and shiprepair revenues came in at | 2130 crore (up 23% YoY) and | 832 crore (up 33.5% YoY) respectively. CSL continues to have a strong b/s with cash balance of ~| 2581crore. Of the planned capex of | 3000 crore (| 2768 crore for the new larger size dry dock and repair facility, | 100 crore for Hooghly Cochin Shipyard and | 150 crore for developing docks at Mumbai, Andaman & Nicobar and Kolkata), CSL has already spent ~| 300 crore and ~| 275 crore for new SB and SR facility respectively. Total capex for FY19 was at ~| 500 crore. The panned ISRF facility with a revenue potential of ~| 300 crore is expected to be operational by August 2020. Going forward, newer opportunities are likely to come through semi-submersible pontoons (| 450 crore), pollution control vessels (| 900 crore), floating docks, next generation missile vessels, next generation offshore patrol vessels, survey and training vessels, etc. Valuation & Outlook CSL has a healthy order book of | 8536 crore (adding ship repair orders of ~| 250 crore). It is also likely to receive order for phase III of IAC, which is likely to be ~| 10,270 crore (| 3000 crore as fixed price contract and | 7270 crore as cost-plus contract). This takes the total order backlog to | 18,806 crore. In FY20-21E, we expect CSL to book significant revenues on the SB side, due to execution of current order book plus lumpy execution from the ‘cost-plus’ portion of IAC phase III. Thus, SB and SR revenues are likely to grow at 25.9% and -3.2% CAGR respectively, in FY20-21E. We expect overall margins to get diluted in FY20E-21E due to higher contribution from SB side. Thus, we estimate revenue, EBITDA and PAT CAGR of 18.5%, 14% and 6.8%, respectively, in FY20-21E. We value CSL at 11x FY21E earnings to arrive at target price of | 455/share. We maintain BUY recommendation on the company. Key Financial Summary (| crore) FY17 FY18 FY19 FY20E FY21E FY19E-21E Revenues 2,059 2,355 2,962 3,411 4,157 18.5 EBITDA 379 464 569 617 740 14.0 Net Profit 322 396 478 502 545 6.8 EPS (|) 23.7 29.2 36.3 38.2 41.5 P/E (x) 15.8 12.9 10.3 9.8 9.0 Price / Book (x) 2.6 1.6 1.5 1.4 1.3 EV/EBITDA (x) 8.7 3.7 4.3 5.2 5.2 RoCE (%) 18.7 13.4 18.8 17.6 17.0 RoE (%) 16.5 12.2 14.4 14.0 14.1 Source: Company, ICICI Direct Research Particulars Particular Amount Market Capitalization* | 4933 Crore Total Debt (FY19) | 123 Crore Cash & Inv (FY19) | 2581 crore EV (FY19) | 2475 Crore Equity capital | 131.5 Crore Face value | 10 Key Highlights Stable performance, healthy b/s, capex on-track All time high order book at | 18,806 crore Maintain our BUY recommendation with a revised target price of | 455 Research Analyst Chirag J Shah [email protected] Sagar K Gandhi [email protected]
Transcript of Cochin Shipyard HO (COCSHI) CMP: | 375 Target: | 455

HO
ICIC
I S
ecurit
ies –
Retail E
quit
y R
esearch
Result
Update
May 28, 2019
CMP: | 375 Target: | 455 ( 21%) Target Period: 12 months
Cochin Shipyard (COCSHI)
BUY
Mixed Q4, phase-3 of IAC to be signed soon…
Cochin Shipyard (CSL) reported mixed Q4FY19 numbers. Shipbuilding,
shiprepair revenues grew 31.4%, 29.7% respectively. However, shiprepair
segment reported EBIT loss due to initial expenses at the newly established
Mumbai port facility coupled losses incurred on the ONGC rig (Sagar
Bhusan). Shipbuilding segment reported strong EBIT margins of 27.4%
whereas the shiprepair segment reported margins of -5.6%. Shipbuilding
and shiprepair segment contributed 84% and 16% to the topline,
respectively. Overall, revenues increased 31.1% YoY to | 787.6 crore. We
expected revenue of | 620.5 crore for the quarter. The company reported
EBITDA margins of 14% vs. 19.2% YoY. Gross margins came in at 35.2% vs.
45.2% YoY (raw material costs increased 55.2% YoY). Employee expenses
declined 17.5% YoY. Absolute EBITDA de-grew 4.4% YoY to | 110 crore.
Other income increased 70.6% YoY to | 65 crore. Depreciation expenses
declined 2.9% YoY. Accordingly, PAT grew 6.4% YoY to | 97.5 crore.
Stable performance, healthy b/s, capex on-track
For FY19, shipbuilding and shiprepair revenues came in at | 2130 crore (up
23% YoY) and | 832 crore (up 33.5% YoY) respectively. CSL continues to
have a strong b/s with cash balance of ~| 2581crore. Of the planned capex
of | 3000 crore (| 2768 crore for the new larger size dry dock and repair
facility, | 100 crore for Hooghly Cochin Shipyard and | 150 crore for
developing docks at Mumbai, Andaman & Nicobar and Kolkata), CSL has
already spent ~| 300 crore and ~| 275 crore for new SB and SR facility
respectively. Total capex for FY19 was at ~| 500 crore. The panned ISRF
facility with a revenue potential of ~| 300 crore is expected to be operational
by August 2020. Going forward, newer opportunities are likely to come
through semi-submersible pontoons (| 450 crore), pollution control vessels
(| 900 crore), floating docks, next generation missile vessels, next
generation offshore patrol vessels, survey and training vessels, etc.
Valuation & Outlook
CSL has a healthy order book of | 8536 crore (adding ship repair orders of
~| 250 crore). It is also likely to receive order for phase III of IAC, which is
likely to be ~| 10,270 crore (| 3000 crore as fixed price contract and | 7270
crore as cost-plus contract). This takes the total order backlog to | 18,806
crore. In FY20-21E, we expect CSL to book significant revenues on the SB
side, due to execution of current order book plus lumpy execution from the
‘cost-plus’ portion of IAC phase III. Thus, SB and SR revenues are likely to
grow at 25.9% and -3.2% CAGR respectively, in FY20-21E. We expect overall
margins to get diluted in FY20E-21E due to higher contribution from SB side.
Thus, we estimate revenue, EBITDA and PAT CAGR of 18.5%, 14% and
6.8%, respectively, in FY20-21E. We value CSL at 11x FY21E earnings to
arrive at target price of | 455/share. We maintain BUY recommendation on
the company.
EESes
Key Financial Summary
s
s
(| crore) FY17 FY18 FY19 FY20E FY21E FY19E-21E
Revenues 2,059 2,355 2,962 3,411 4,157 18.5
EBITDA 379 464 569 617 740 14.0
Net Profit 322 396 478 502 545 6.8
EPS (|) 23.7 29.2 36.3 38.2 41.5
P/E (x) 15.8 12.9 10.3 9.8 9.0
Price / Book (x) 2.6 1.6 1.5 1.4 1.3
EV/EBITDA (x) 8.7 3.7 4.3 5.2 5.2
RoCE (%) 18.7 13.4 18.8 17.6 17.0
RoE (%) 16.5 12.2 14.4 14.0 14.1
s
Source: Company, ICICI Direct Research
Particulars
Particular Amount
Market Capitalization* | 4933 Crore
Total Debt (FY19) | 123 Crore
Cash & Inv (FY19) | 2581 crore
EV (FY19) | 2475 Crore
Equity capital | 131.5 Crore
Face value | 10
Key Highlights
Stable performance, healthy b/s,
capex on-track
All time high order book at | 18,806
crore
Maintain our BUY recommendation
with a revised target price of | 455
Research Analyst
Chirag J Shah
Sagar K Gandhi

ICICI Securities | Retail Research 2
ICICI Direct Research
Result Update | Cochin Shipyard
Exhibit 1: Variance analysis
Q4FY19 Q4FY19E Q4FY18 YoY
(%) Q3FY19
QoQ
(%)
Revenue 787.6 620.5 600.6 31.1 716.4 9.9 Shipbuilding and ship repair segment contributed 84% and 16% to the
topline, respectively
Other Income 65.0 41.9 38.1 70.6 49.7 30.6
Total Revenue 852.6 662.3 638.7 33.5 766.2 11.3
Total Raw Material
Costs 510.6 389.9 329.0 55.2 439.7 16.1
Employee Expenses 68.5 67.6 83.0 -17.5 73.1 -6.3
Other expenses 40.4 35.2 32.5 24.3 37.5 7.9
Provision for losses &
exp. 58.1 6.9 41.0 41.7 7.7 650.6
Operating Profit
(EBITDA) 110.0 120.8 115.1 -4.4 158.5 -30.6
EBITDA margin (%) 14.0% 19.5% 19.2% -520
bps 22.1%
-816
bps
Interest 5.3 2.1 2.6 103.9 2.7 97.9
Depreciation 8.7 10.9 9.0 -2.9 8.6 1.4
Total Tax 63.4 50.1 50.0 26.9 67.2 -5.6
PAT 97.5 99.6 91.6 6.4 129.7 -24.8
Key Metrics Q4FY19 Q4FY18 YoY
(%) Q3FY19
QoQ
(%)
Revenue (Segment-
wise)
Shipbuilding 661.7 503.5 31.4 552.1 19.9
As a % of Sales 84.0% 83.8% 77.1%
Shiprepair 125.9 97.1 29.7 164.4 -23.4
As a % of Sales 16.0% 16.2% 22.9%
EBIT (Segment-wise)
Shipbuilding 181.0 136.2 33.0 107.0 69.2
EBIT Margins(%) 27.4% 27.0% 19.4%
As a % of EBIT 108.9% 94.4% 53.6%
Shiprepair -7.1 17.5 -140.3 65.4 -110.8
EBIT Margins (%) -5.6% 18.0% 39.8%
As a % of EBIT -4.2% 12.1% 32.8%
Source: Company, ICICI Direct Research
Exhibit 2: Change in estimates
FY18 FY19 FY20E FY21E
(| Crore) Actual Actual Old New % Change Old New % Change
Revenue 2355.1 2962.2 3525.1 3411.4 -3.2 4271.1 4157.4 -2.7
EBITDA 463.9 569.2 605.5 617.5 2.0 728.0 740.0 1.7
EBITDA Margin (%) 19.7 19.2 17.9 18.1 20 bps 17.6 17.8 20 bps
PAT 396.3 477.8 439.5 502.5 14.3 510.0 545.4 6.9
EPS (|) 29.2 36.3 32.3 38.2 18.3 37.5 41.5 10.6
Source: Company, ICICI Direct Research
ICICI Securities | Retail Research 3
ICICI Direct Research
Result Update | Cochin Shipyard
Conference call takeaways – Q4FY19 and FY19
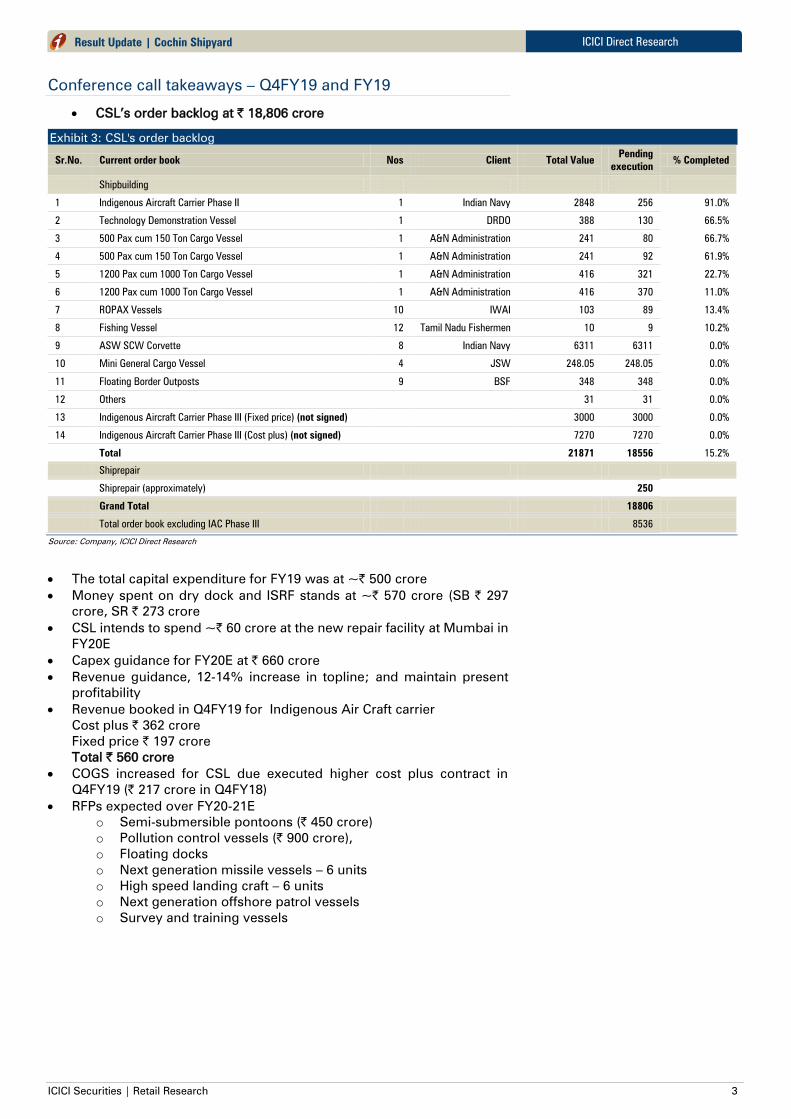
CSL’s order backlog at | 18,806 crore
Exhibit 3: CSL's order backlog
Sr.No. Current order book Nos Client Total Value Pending
execution % Completed
Shipbuilding
1 Indigenous Aircraft Carrier Phase II 1 Indian Navy 2848 256 91.0%
2 Technology Demonstration Vessel 1 DRDO 388 130 66.5%
3 500 Pax cum 150 Ton Cargo Vessel 1 A&N Administration 241 80 66.7%
4 500 Pax cum 150 Ton Cargo Vessel 1 A&N Administration 241 92 61.9%
5 1200 Pax cum 1000 Ton Cargo Vessel 1 A&N Administration 416 321 22.7%
6 1200 Pax cum 1000 Ton Cargo Vessel 1 A&N Administration 416 370 11.0%
7 ROPAX Vessels 10 IWAI 103 89 13.4%
8 Fishing Vessel 12 Tamil Nadu Fishermen 10 9 10.2%
9 ASW SCW Corvette 8 Indian Navy 6311 6311 0.0%
10 Mini General Cargo Vessel 4 JSW 248.05 248.05 0.0%
11 Floating Border Outposts 9 BSF 348 348 0.0%
12 Others 31 31 0.0%
13 Indigenous Aircraft Carrier Phase III (Fixed price) (not signed) 3000 3000 0.0%
14 Indigenous Aircraft Carrier Phase III (Cost plus) (not signed) 7270 7270 0.0%
Total 21871 18556 15.2%
Shiprepair
Shiprepair (approximately) 250
Grand Total 18806
Total order book excluding IAC Phase III 8536
Source: Company, ICICI Direct Research
The total capital expenditure for FY19 was at ~| 500 crore
Money spent on dry dock and ISRF stands at ~| 570 crore (SB | 297
crore, SR | 273 crore
CSL intends to spend ~| 60 crore at the new repair facility at Mumbai in
FY20E
Capex guidance for FY20E at | 660 crore
Revenue guidance, 12-14% increase in topline; and maintain present
profitability
Revenue booked in Q4FY19 for Indigenous Air Craft carrier
Cost plus | 362 crore
Fixed price | 197 crore
Total | 560 crore
COGS increased for CSL due executed higher cost plus contract in
Q4FY19 (| 217 crore in Q4FY18)
RFPs expected over FY20-21E
o Semi-submersible pontoons (| 450 crore)
o Pollution control vessels (| 900 crore),
o Floating docks
o Next generation missile vessels – 6 units
o High speed landing craft – 6 units
o Next generation offshore patrol vessels
o Survey and training vessels

ICICI Securities | Retail Research 4
ICICI Direct Research
Result Update | Cochin Shipyard
Opportunity segments for CSL
Shipbuilding:
Inland & coastal water segment: The government’s focus on
development of inland and coastal waterways infrastructure is expected
to spur demand of ships for this sector. The government is investing
substantially to improve infrastructure in major waterways. This will spur
demand for such vessels in the inland water segment. It is estimated that
the vessels required to meet the demand by 2030 will triple, which may
be around 3000+ vessels. CSL is working closely with Inland Water
Authority of India (IWAI) and other potential customers to provide
efficient product solutions in this segment
Special purpose vessels: Various agencies are looking for modern and
efficient vessels to equip and upgrade the assets to meet the operational
demands. This gives an opportunity to CSL for custom made vessels
such as Polar Research Vessels, Well Stimulation Vessel, Cement
Carriers, etc
Fishing segment: Government of India (GoI) has got an ambitious plan
under the “Blue Revolution” to equip the segment with more modern
and efficient fishing vessels. This segment is currently being managed
by unregulated players and gives a good opportunity for CSL to focus
and position itself as a quality player. CSL is working closely with Tamil
Nadu Fisheries by providing custom made solution to fishermen and has
contracted for the construction of 16 vessels as a pilot project. The total
requirement for the department for fishermen is about 2000 vessels. In
addition to the above, there are also potential requirements for bigger
and sophisticated vessels in this segment for the domestic and
international market
Ship repair:
India’s share in global ship repair market is less than 1% while around
7-9% of global trade is passing within 300 NM of its coastline. India’s
strategic position along the east bound and west bound international
trade routes offers an opportunity to cater to vessels plying on these
routes. A main container route connecting America and Europe to the
East passes very close to the Indian coastline presenting a major
opportunity for repairs. This presents huge untapped potential which is
valued around | 3500-4000 crore
The captive market for ship repair in India is estimated at ~| 2500 crore.
It is estimated that only 15% of the potential is being tapped currently.
Towards this end, CSL has entered into an MoU with the Mumbai Port
Trust on January 11, 2018 for operations and management of ship repair
facility at Indira Dock. CSL shall utilise the facilities for the purpose of
ship repair and allied services and for further expansion in the field of
ship repair. A similar MoU has been signed with Kolkata Port Trust on
March 17, 2018 for operations and management of ship repair facility at
Netaji Subhash Dock. CSL will utilise the facilities for the purpose of ship
repair and allied services and for the growth of ship repair in the region.
A similar MoU is on the anvil for Andaman and Nicobar Island
Order for ASW corvettes was won after a strong competitive bidding.
Accordingly, PAT margins for the order are likely to be 5-6%. However,
as per management commentary, CSL will try to squeeze and improve
margins as much as possible in this order. This will be possible because
of CSL’s learning curve during the production of the initial few corvettes.
This is likely as similar kind of eight ASW corvettes are on order. Also,
CSL is likely to act as a lead procurement agency for material
procurement of all the 16 ASW corvettes

ICICI Securities | Retail Research 5
ICICI Direct Research
Result Update | Cochin Shipyard
For Mumbai Port Trust (MPT), CSL intends to spend | 80-100 in the next
year. This is to be utilised for expansion of the ship-repair capacity within
the Indira Dock, and may include the setting up of a floating dry dock
(FDD) and upgrading the existing facility at Hughes dry dock. CSL
expects ~| 100 crore of revenue from MPT by FY19E
For the Andaman & Nicobar docks, the management intends to spend
| 10-15 crore by FY19E. Currently, the opportunity is to repair 80 vessels
of A&N administration
Update on capacity expansion: New large dry dock
Construction works of plant and machinery awarded to M/s. Larsen &
Toubro in May 2018. The 600T gantry crane under procurement. Target
completion: June 2021

ICICI Securities | Retail Research 6
ICICI Direct Research
Result Update | Cochin Shipyard
Major expansions update
New large dry dock
Dock: 310m x 75/60m x 13m and other allied facilities
Estimate: | 1799 crore
Target completion: June 2021
Construction works of plant and machinery awarded to M/s. Larsen &
Toubro on April 27, 2018
Construction works commenced in May 2018 while formal ground-
breaking works started on October 30, 2018
The 600T gantry crane under procurement
International ship repair facility (ISRF)
Ship lift: 130m x 25m x 6000T with six workstations
Estimate: | 970 crore
Target completion: November 2019
Major equipment – ship lift & transfer system ordered on consortium of
M/s Broehl & M/s. IMG, Germany in January 2017
Construction contract awarded to M/s Simplex Infrastructure, Kolkata in
October 2017
Construction commenced in November 2017
60% piling work completed
Hooghly Cochin Shipyard, Kolkata (JVC: CSL - 74% equity)
Modern small ship building facility being set up at Nazirgunge in Kolkata
Investment of | 160 crore envisaged
Contractors have been shortlisted. Tendering process progressing.
Construction activities to commence by end December 2018
Targeting commencement of operations by 2020
Mumbai Port Trust
MoU signed with Mumbai Port Trust in January 2018 for ‘Development,
Management and Operations’ of ship repair facility at Indira Dock
Formal agreement signed and site handed over to CSL on October 20,
2018.
Ship Repair operations commenced from Jan 18,2019
Nine ships repaired in facility
Kolkata Port Trust
MoU inked with Kolkata Port Trust in March 2018 for ‘Development,
Management and Operations’ of ship repair facility at Netaji Subhash
Dock
Formal agreement under discussion
Operations to commence after handing over of facility after civil works
by KoPT
A&N Islands
MoU signed with A&N administration in September 2018 for operations
and management of ship repair activities at Marine Dockyard, Port Blair
Operations to commence after signing of formal agreement

ICICI Securities | Retail Research 7
ICICI Direct Research
Result Update | Cochin Shipyard
Financial story in charts
Exhibit 4: Revenue trend (consolidated)
Source: Company, ICICI Direct Research
Exhibit 5: Shipbuilding revenue trend
Source: Company, ICICI Direct Research
Exhibit 6: Shiprepair revenue trend
Source: Company, ICICI Direct Research
2,355
2,962
3,411
4,157
-
500
1,000
1,500
2,000
2,500
3,000
3,500
4,000
4,500
FY18 FY19 FY20E FY21E
| c
rore
Revenues
1514
1732
2130
2741
3377
0
500
1000
1500
2000
2500
3000
3500
4000
FY17 FY18 FY19E FY20E FY21E
| c
rore
Shipbuilding
544
623
832
670
780
0
100
200
300
400
500
600
700
800
900
FY17 FY18 FY19E FY20E FY21E
| c
rore
Shiprepair
Growth to be driven by industrial segment
ICICI Securities | Retail Research 8
ICICI Direct Research
Result Update | Cochin Shipyard
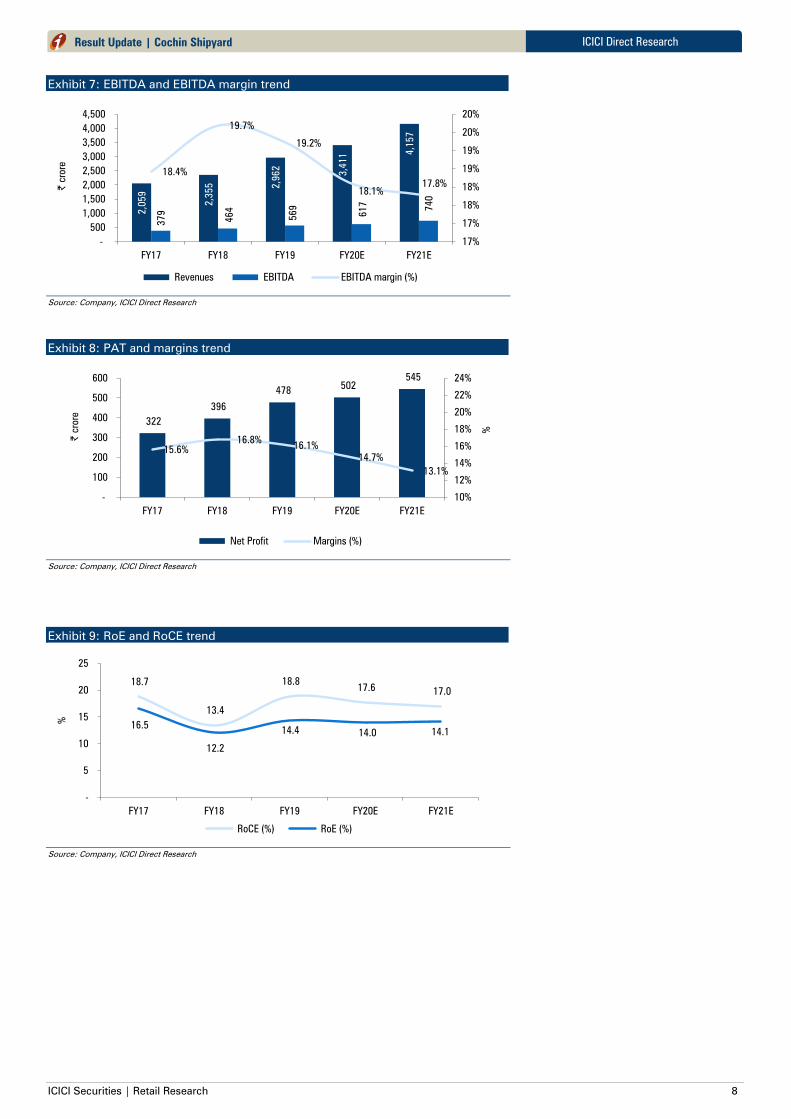
Exhibit 7: EBITDA and EBITDA margin trend
Source: Company, ICICI Direct Research
Exhibit 8: PAT and margins trend
Source: Company, ICICI Direct Research
Exhibit 9: RoE and RoCE trend
Source: Company, ICICI Direct Research
2,0
59
2,3
55
2,9
62
3,4
11 4,1
57
379
464
569
617
740
18.4%
19.7%
19.2%
18.1%
17.8%
17%
17%
18%
18%
19%
19%
20%
20%
-
500
1,000
1,500
2,000
2,500
3,000
3,500
4,000
4,500
FY17 FY18 FY19 FY20E FY21E
| c
rore
Revenues EBITDA EBITDA margin (%)
322
396
478 502
545
15.6%
16.8%16.1%
14.7%
13.1%
10%
12%
14%
16%
18%
20%
22%
24%
-
100
200
300
400
500
600
FY17 FY18 FY19 FY20E FY21E
%
| c
rore
Net Profit Margins (%)
18.7
13.4
18.8 17.6
17.0
16.5
12.2
14.4 14.0 14.1
-
5
10
15
20
25
FY17 FY18 FY19 FY20E FY21E
%
RoCE (%) RoE (%)

ICICI Securities | Retail Research 9
ICICI Direct Research
Result Update | Cochin Shipyard
Exhibit 10: Recommendation History vs. Consensus
Source: Bloomberg, Company, ICICI Direct Research
Exhibit 11: Top 10 Shareholders
Rank Name Latest Filing Date O/S Position Position Change
1 Government of India 31-12-2018 75.21% 98.93M -3.02M
2 Reliance Nippon Life Asset Management Limited 31-12-2018 6.20% 8.16M -0.14M
3 PineBridge India Private Limited 31-12-2018 1.92% 2.53M -0.08M
4 HDFC Asset Management Co., Ltd. 31-12-2018 1.48% 1.94M -0.87M
5 Aditya Birla Sun Life AMC Limited 31-03-2019 0.69% 0.91M +0.08M
6 Mellon Investments Corporation 31-03-2019 0.24% 0.31M -0.00M
7 Union Asset Management Company Private Limited 31-03-2019 0.22% 0.29M -0.03M
8 SBI Funds Management Pvt. Ltd. 31-03-2019 0.10% 0.13M 0
9 ICICI Prudential Asset Management Co. Ltd. 31-03-2019 0.07% 0.09M 0
10 BlackRock Institutional Trust Company, N.A. 31-03-2019 0.06% 0.08M +0.00M
Source: Reuters, ICICI Direct Research
Exhibit 12: Recent Activity
Investor name Value Shares Investor name Value Shares
Aditya Birla Sun Life AMC Limited +0.46M +0.08M Government of India -16.23M -3.02M
BlackRock Asset Management Ireland Limited +0.06M +0.01M HDFC Asset Management Co., Ltd. -4.69M -0.87M
Dimensional Fund Advisors, L.P. +0.04M +0.01M IDFC Asset Management Company Private Limited -2.64M -0.50M
BlackRock Institutional Trust Company, N.A. +0.01M +0.00M Mahindra Asset Management Company Pvt. Ltd. -0.72M -0.14M
Reliance Nippon Life Asset Management Limited -0.73M -0.14M
Buys Sells
Source: Reuters, ICICI Direct Research
Exhibit 13: Shareholding Pattern
(in %) Mar-18 Jun-18 Sep-18 Dec-18 Mar-19
Promoter 75.0 75.0 75.0 75.2 75.2
FII 3.5 3.2 2.7 2.9 3.0
DII 11.1 11.4 10.8 9.8 8.2
Others 10.4 10.4 11.5 12.1 13.6
Source: Company, ICICI Direct Research
0
20
40
60
80
100
120
0
100
200
300
400
500
600
700
800
May-19Mar-19Jan-19Dec-18Nov-18Sep-18Aug-18Jun-18May-18Mar-18Feb-18Dec-17Nov-17
(%
)(|
)
Series1 Idirect target
ICICI Securities | Retail Research 10
ICICI Direct Research
Result Update | Cochin Shipyard
Financial summary
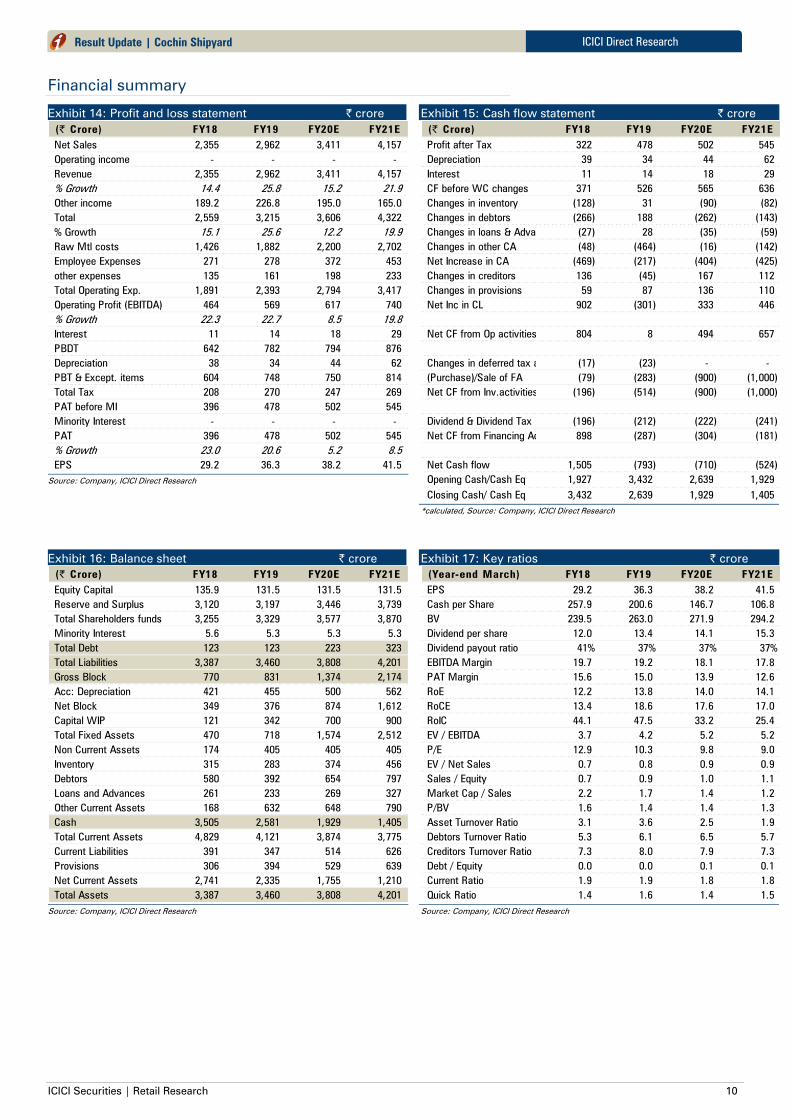
Exhibit 14: Profit and loss statement | crore
(| Crore) FY18 FY19 FY20E FY21E
Net Sales 2,355 2,962 3,411 4,157
Operating income - - - -
Revenue 2,355 2,962 3,411 4,157
% Growth 14.4 25.8 15.2 21.9
Other income 189.2 226.8 195.0 165.0
Total 2,559 3,215 3,606 4,322
% Growth 15.1 25.6 12.2 19.9
Raw Mtl costs 1,426 1,882 2,200 2,702
Employee Expenses 271 278 372 453
other expenses 135 161 198 233
Total Operating Exp. 1,891 2,393 2,794 3,417
Operating Profit (EBITDA) 464 569 617 740
% Growth 22.3 22.7 8.5 19.8
Interest 11 14 18 29
PBDT 642 782 794 876
Depreciation 38 34 44 62
PBT & Except. items 604 748 750 814
Total Tax 208 270 247 269
PAT before MI 396 478 502 545
Minority Interest - - - -
PAT 396 478 502 545
% Growth 23.0 20.6 5.2 8.5
EPS 29.2 36.3 38.2 41.5
Source: Company, ICICI Direct Research
Exhibit 15: Cash flow statement | crore
(| Crore) FY18 FY19 FY20E FY21E
Profit after Tax 322 478 502 545
Depreciation 39 34 44 62
Interest 11 14 18 29
CF before WC changes 371 526 565 636
Changes in inventory (128) 31 (90) (82)
Changes in debtors (266) 188 (262) (143)
Changes in loans & Advances (27) 28 (35) (59)
Changes in other CA (48) (464) (16) (142)
Net Increase in CA (469) (217) (404) (425)
Changes in creditors 136 (45) 167 112
Changes in provisions 59 87 136 110
Net Inc in CL 902 (301) 333 446
Net CF from Op activities 804 8 494 657
Changes in deferred tax assets (17) (23) - -
(Purchase)/Sale of FA (79) (283) (900) (1,000)
Net CF from Inv.activities (196) (514) (900) (1,000)
Dividend & Dividend Tax (196) (212) (222) (241)
Net CF from Financing Activities 898 (287) (304) (181)
Net Cash flow 1,505 (793) (710) (524)
Opening Cash/Cash Eq 1,927 3,432 2,639 1,929
Closing Cash/ Cash Eq 3,432 2,639 1,929 1,405
*calculated, Source: Company, ICICI Direct Research
Exhibit 16: Balance sheet | crore
(| Crore) FY18 FY19 FY20E FY21E
Equity Capital 135.9 131.5 131.5 131.5
Reserve and Surplus 3,120 3,197 3,446 3,739
Total Shareholders funds 3,255 3,329 3,577 3,870
Minority Interest 5.6 5.3 5.3 5.3
Total Debt 123 123 223 323
Total Liabilities 3,387 3,460 3,808 4,201
Gross Block 770 831 1,374 2,174
Acc: Depreciation 421 455 500 562
Net Block 349 376 874 1,612
Capital WIP 121 342 700 900
Total Fixed Assets 470 718 1,574 2,512
Non Current Assets 174 405 405 405
Inventory 315 283 374 456
Debtors 580 392 654 797
Loans and Advances 261 233 269 327
Other Current Assets 168 632 648 790
Cash 3,505 2,581 1,929 1,405
Total Current Assets 4,829 4,121 3,874 3,775
Current Liabilities 391 347 514 626
Provisions 306 394 529 639
Net Current Assets 2,741 2,335 1,755 1,210
Total Assets 3,387 3,460 3,808 4,201
Source: Company, ICICI Direct Research
Exhibit 17: Key ratios | crore
(Year-end March) FY18 FY19 FY20E FY21E
EPS 29.2 36.3 38.2 41.5
Cash per Share 257.9 200.6 146.7 106.8
BV 239.5 263.0 271.9 294.2
Dividend per share 12.0 13.4 14.1 15.3
Dividend payout ratio 41% 37% 37% 37%
EBITDA Margin 19.7 19.2 18.1 17.8
PAT Margin 15.6 15.0 13.9 12.6
RoE 12.2 13.8 14.0 14.1
RoCE 13.4 18.6 17.6 17.0
RoIC 44.1 47.5 33.2 25.4
EV / EBITDA 3.7 4.2 5.2 5.2
P/E 12.9 10.3 9.8 9.0
EV / Net Sales 0.7 0.8 0.9 0.9
Sales / Equity 0.7 0.9 1.0 1.1
Market Cap / Sales 2.2 1.7 1.4 1.2
P/BV 1.6 1.4 1.4 1.3
Asset Turnover Ratio 3.1 3.6 2.5 1.9
Debtors Turnover Ratio 5.3 6.1 6.5 5.7
Creditors Turnover Ratio 7.3 8.0 7.9 7.3
Debt / Equity 0.0 0.0 0.1 0.1
Current Ratio 1.9 1.9 1.8 1.8
Quick Ratio 1.4 1.6 1.4 1.5
Source: Company, ICICI Direct Research
ICICI Securities | Retail Research 11
ICICI Direct Research
Result Update | Cochin Shipyard
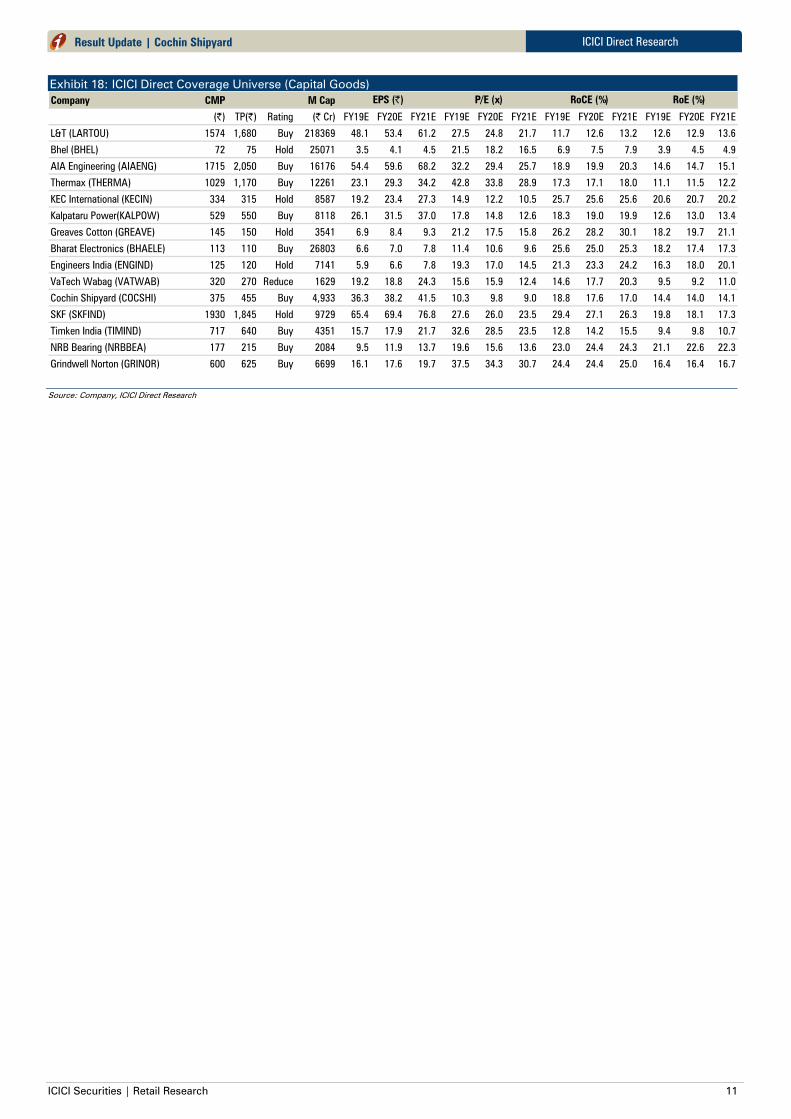
Exhibit 18: ICICI Direct Coverage Universe (Capital Goods)
Company CMP M Cap
(|) TP(|) Rating (| Cr) FY19E FY20E FY21E FY19E FY20E FY21E FY19E FY20E FY21E FY19E FY20E FY21E
L&T (LARTOU) 1574 1,680 Buy 218369 48.1 53.4 61.2 27.5 24.8 21.7 11.7 12.6 13.2 12.6 12.9 13.6
Bhel (BHEL) 72 75 Hold 25071 3.5 4.1 4.5 21.5 18.2 16.5 6.9 7.5 7.9 3.9 4.5 4.9
AIA Engineering (AIAENG) 1715 2,050 Buy 16176 54.4 59.6 68.2 32.2 29.4 25.7 18.9 19.9 20.3 14.6 14.7 15.1
Thermax (THERMA) 1029 1,170 Buy 12261 23.1 29.3 34.2 42.8 33.8 28.9 17.3 17.1 18.0 11.1 11.5 12.2
KEC International (KECIN) 334 315 Hold 8587 19.2 23.4 27.3 14.9 12.2 10.5 25.7 25.6 25.6 20.6 20.7 20.2
Kalpataru Power(KALPOW) 529 550 Buy 8118 26.1 31.5 37.0 17.8 14.8 12.6 18.3 19.0 19.9 12.6 13.0 13.4
Greaves Cotton (GREAVE) 145 150 Hold 3541 6.9 8.4 9.3 21.2 17.5 15.8 26.2 28.2 30.1 18.2 19.7 21.1
Bharat Electronics (BHAELE) 113 110 Buy 26803 6.6 7.0 7.8 11.4 10.6 9.6 25.6 25.0 25.3 18.2 17.4 17.3
Engineers India (ENGIND) 125 120 Hold 7141 5.9 6.6 7.8 19.3 17.0 14.5 21.3 23.3 24.2 16.3 18.0 20.1
VaTech Wabag (VATWAB) 320 270 Reduce 1629 19.2 18.8 24.3 15.6 15.9 12.4 14.6 17.7 20.3 9.5 9.2 11.0
Cochin Shipyard (COCSHI) 375 455 Buy 4,933 36.3 38.2 41.5 10.3 9.8 9.0 18.8 17.6 17.0 14.4 14.0 14.1
SKF (SKFIND) 1930 1,845 Hold 9729 65.4 69.4 76.8 27.6 26.0 23.5 29.4 27.1 26.3 19.8 18.1 17.3
Timken India (TIMIND) 717 640 Buy 4351 15.7 17.9 21.7 32.6 28.5 23.5 12.8 14.2 15.5 9.4 9.8 10.7
NRB Bearing (NRBBEA) 177 215 Buy 2084 9.5 11.9 13.7 19.6 15.6 13.6 23.0 24.4 24.3 21.1 22.6 22.3
Grindwell Norton (GRINOR) 600 625 Buy 6699 16.1 17.6 19.7 37.5 34.3 30.7 24.4 24.4 25.0 16.4 16.4 16.7
RoE (%)EPS (|) P/E (x) RoCE (%)
Source: Company, ICICI Direct Research

ICICI Securities | Retail Research 12
ICICI Direct Research
Result Update | Cochin Shipyard
RATING RATIONALE
ICICI Direct endeavors to provide objective opinions and recommendations. ICICI Direct assigns ratings to its
stocks according to their notional target price vs. current market price and then categorizes them as Buy, Hold,
Reduce and Sell. The performance horizon is two years unless specified and the notional target price is defined
as the analysts' valuation for a stock
Buy: >15%
Hold: -5% to 15%;
Reduce: -15% to -5%;
Sell: <-15%
Pankaj Pandey Head – Research [email protected]
ICICI Direct Research Desk,
ICICI Securities Limited,
1st Floor, Akruti Trade Centre,
Road No 7, MIDC,
Andheri (East)
Mumbai – 400 093

ICICI Securities | Retail Research 13
ICICI Direct Research
Result Update | Cochin Shipyard
ANALYST CERTIFICATION
I/We, Chirag Shah PGDBM; Sagar Gandhi MBA (Finance) Research Analysts, authors and the names subscribed to this report, hereby certify that all of the views expressed in this research report accurately reflect our views about
the subject issuer(s) or securities. We also certify that no part of our compensation was, is, or will be directly or indirectly related to the specific recommendation(s) or view(s) in this report. It is also confirmed that above mentioned
Analysts of this report have not received any compensation from the companies mentioned in the report in the preceding twelve months and do not serve as an officer, director or employee of the companies mentioned in the report.
Terms & conditions and other disclosures:
ICICI Securities Limited (ICICI Securities) is a full-service, integrated investment banking and is, inter alia, engaged in the business of stock brokering and distribution of financial products. ICICI Securities Limited is a SEBI registered
Research Analyst with SEBI Registration Number – INH000000990. ICICI Securities Limited SEBI Registration is INZ000183631 for stock broker. ICICI Securities is a subsidiary of ICICI Bank which is India’s largest private sector bank
and has its various subsidiaries engaged in businesses of housing finance, asset management, life insurance, general insurance, venture capital fund management, etc. (“associates”), the details in respect of which are available on
www.icicibank.com
ICICI Securities is one of the leading merchant bankers/ underwriters of securities and participate in virtually all securities trading markets in India. We and our associates might have investment banking and other business relationship
with a significant percentage of companies covered by our Investment Research Department. ICICI Securities generally prohibits its analysts, persons reporting to analysts and their relatives from maintaining a financial interest in the
securities or derivatives of any companies that the analysts cover.
Recommendation in reports based on technical and derivative analysis centre on studying charts of a stock's price movement, outstanding positions, trading volume etc as opposed to focusing on a company's fundamentals and, as
such, may not match with the recommendation in fundamental reports. Investors may visit icicidirect.com to view the Fundamental and Technical Research Reports.
Our proprietary trading and investment businesses may make investment decisions that are inconsistent with the recommendations expressed herein.
ICICI Securities Limited has two independent equity research groups: Institutional Research and Retail Research. This report has been prepared by the Retail Research. The views and opinions expressed in this document may or may
not match or may be contrary with the views, estimates, rating, target price of the Institutional Research.
The information and opinions in this report have been prepared by ICICI Securities and are subject to change without any notice. The report and information contained herein is strictly confidential and meant solely for the selected
recipient and may not be altered in any way, transmitted to, copied or distributed, in part or in whole, to any other person or to the media or reproduced in any form, without prior written consent of ICICI Securities. While we would
endeavour to update the information herein on a reasonable basis, ICICI Securities is under no obligation to update or keep the information current. Also, there may be regulatory, compliance or other reasons that may prevent ICICI
Securities from doing so. Non-rated securities indicate that rating on a particular security has been suspended temporarily and such suspension is in compliance with applicable regulations and/or ICICI Securities policies, in
circumstances where ICICI Securities might be acting in an advisory capacity to this company, or in certain other circumstances.
This report is based on information obtained from public sources and sources believed to be reliable, but no independent verification has been made nor is its accuracy or completeness guaranteed. This report and information herein
is solely for informational purpose and shall not be used or considered as an offer document or solicitation of offer to buy or sell or subscribe for securities or other financial instruments. Though disseminated to all the customers
simultaneously, not all customers may receive this report at the same time. ICICI Securities will not treat recipients as customers by virtue of their receiving this report. Nothing in this report constitutes investment, legal, accounting
and tax advice or a representation that any investment or strategy is suitable or appropriate to your specific circumstances. The securities discussed and opinions expressed in this report may not be suitable for all investors, who
must make their own investment decisions, based on their own investment objectives, financial positions and needs of specific recipient. This may not be taken in substitution for the exercise of independent judgment by any recipient.
The recipient should independently evaluate the investment risks. The value and return on investment may vary because of changes in interest rates, foreign exchange rates or any other reason. ICICI Securities accepts no liabilities
whatsoever for any loss or damage of any kind arising out of the use of this report. Past performance is not necessarily a guide to future performance. Investors are advised to see Risk Disclosure Document to understand the risks
associated before investing in the securities markets. Actual results may differ materially from those set forth in projections. Forward-looking statements are not predictions and may be subject to change without notice.
ICICI Securities or its associates might have managed or co-managed public offering of securities for the subject company or might have been mandated by the subject company for any other assignment in the past twelve months.
ICICI Securities or its associates might have received any compensation from the companies mentioned in the report during the period preceding twelve months from the date of this report for services in respect of managing or co-
managing public offerings, corporate finance, investment banking or merchant banking, brokerage services or other advisory service in a merger or specific transaction.
ICICI Securities encourages independence in research report preparation and strives to minimize conflict in preparation of research report. ICICI Securities or its associates or its analysts did not receive any compensation or other
benefits from the companies mentioned in the report or third party in connection with preparation of the research report. Accordingly, neither ICICI Securities nor Research Analysts and their relatives have any material conflict of
interest at the time of publication of this report.
Compensation of our Research Analysts is not based on any specific merchant banking, investment banking or brokerage service transactions.
ICICI Securities or its subsidiaries collectively or Research Analysts or their relatives do not own 1% or more of the equity securities of the Company mentioned in the report as of the last day of the month preceding the publication of
the research report.
Since associates of ICICI Securities are engaged in various financial service businesses, they might have financial interests or beneficial ownership in various companies including the subject company/companies mentioned in this
report.
ICICI Securities may have issued other reports that are inconsistent with and reach different conclusion from the information presented in this report.
Neither the Research Analysts nor ICICI Securities have been engaged in market making activity for the companies mentioned in the report.
We submit that no material disciplinary action has been taken on ICICI Securities by any Regulatory Authority impacting Equity Research Analysis activities.
This report is not directed or intended for distribution to, or use by, any person or entity who is a citizen or resident of or located in any locality, state, country or other jurisdiction, where such distribution, publication, availability or
use would be contrary to law, regulation or which would subject ICICI Securities and affiliates to any registration or licensing requirement within such jurisdiction. The securities described herein may or may not be eligible for sale in
all jurisdictions or to certain category of investors. Persons in whose possession this document may come are required to inform themselves of and to observe such restriction.
.