Cocaine Production and Trafficking: What do we know?* Por...
54
otá - Colombia - Bogotá - Colombia - Bogotá - Colombia - Bogotá - Colombia - Bogotá - Colombia - Bogotá - Colombia - Bogotá - Col Cocaine Production and Trafficking: What do we know? Por: Daniel Mejía L Carlos Esteban Posada P No. 444 2007
Transcript of Cocaine Production and Trafficking: What do we know?* Por...
- Bogotá - Colombia - Bogotá - Colombia - Bogotá - Colombia - Bogotá - Colombia - Bogotá - Colombia - Bogotá - Colombia - Bogotá - Colombia - Bogotá - Colombia - Bogotá - Colombia - Bogotá - Colombia
Cocaine Production and Trafficking: What do we know?* Por: Daniel Mejía L Carlos Esteban Posada P
No. 4442007
Cocaine Production and Trafficking: What do we know?Cocaine Production and Trafficking: What do we know?Cocaine Production and Trafficking: What do we know?Cocaine Production and Trafficking: What do we know?♣♣♣♣
Daniel Mejía♦ and Carlos Esteban Posada•
This version: April 2007.
AbstractAbstractAbstractAbstract
The main purpose of this chapter is to summarize the information currently available on
cocaine production and trafficking. The chapter starts by describing the available data
on cocaine production and trade, the collection methodologies, (if available) used by
different sources, the main biases in the data, and the accuracy of different data sources.
Next, the chapter states some of the key empirical questions and hypotheses regarding
cocaine production and trade and takes a first look at how well the data matches these
hypotheses. Also, the chapter states some of the main puzzles in the cocaine market and
studies some of the possible explanations. These puzzles and empirical questions should
guide future research into our understanding of the key determinants of illicit drug
production and trafficking. Finally, the chapter studies the different policies that
producer countries have adopted to fight against cocaine production and the role
consumer countries play in the implementation of anti-drug policies.
KeywordsKeywordsKeywordsKeywords: Cocaine; Narcotraffic; War on Drugs.
JEL classificationJEL classificationJEL classificationJEL classification: K42; C81; H56.
♣ Chapter prepared for the Project on the Development Impact of the Illegal Drug Trade, The World Bank. The authors wish to thank Norman Loayza, Phil Keefer and workshop participants at the World Bank for helpful comments and suggestions. Diana Jaramillo provided excellent research assistance. As usual, the views expressed in this article are solely those of the authors and do not compromise Banco de la República, Colombia or its Board of Governors. ♦ Corresponding author. Research Unit, Banco de la República, Colombia. E-mail: [email protected] • Research Unit, Banco de la República, Colombia. E-mail: [email protected].
2
INTRODUCTIONINTRODUCTIONINTRODUCTIONINTRODUCTION
The nature of illegal and black markets makes it very difficult to collect
data such as quantities transacted, intermediate and final good’s prices, and
other relevant market characteristics like the quality of the product being dealt
and the distribution of profits within the industry. Illegal drug markets are not
the exception.1 For instance, in measuring consumption “buyers cannot report a
price in dollars per standardized unit, but only how much they spent on some
quantity of white powder, the contents of which is unknown.” (Reuter and
Greenfield, 2001, p. 169). Notwithstanding the difficulties of collecting accurate
data, the market’s numbers on the size, quantities, prices, etc. always attract a
good deal of attention, not only among policy makers who want to request
appropriations, governments that want to measure the success of anti-drug
policies and analysts who want to identify the claimants of the business’ profits,
but also from journalists who want to impress the public. Many times the
numbers are, voluntarily or not, misused “to buttress preconceived and personal
agendas” and “the emotional and ideological charge carried by most data users
leads to widespread data misuse.” (Thoumi, 2005a, p. 186).
This chapter describes the available data to measure the incidence and
prevalence of cocaine production and trafficking. It also describes the main data
sources, the collection methodologies, if available, and examines the accuracy and
biases of different data sources. Based on the description of the data and its
biases, the chapter states some key empirical questions and hypotheses that
should drive future research into our understanding of the determinants of
cocaine production and trafficking, and of the outcomes and side effects of the
war against illegal drugs. Some of the questions and hypotheses that are
addressed in this chapter are: If the price elasticity of demand is a crucial
parameter of the effectiveness of the war on drugs, what are the short- and long-
term price elasticities of demand for cocaine? What are the productivity
parameters behind the estimation of potential cocaine production? Have illegal
1 See Reuter (2001) and Thoumi (2005a).
3
drug producers made technological advances in the production of cocaine that
counteract the measures taken in the war on drugs? What are the results of the
war against illegal drugs? Is this war sustainable in the long run? What are the
side effects of this war?
The chapter also studies the outcomes of the war against the production of
cocaine in the producer countries, the role of consumer countries (mostly
developed) in the implementation of specific anti-dug policies, and examines the
effectiveness of these policies and some of their possible side effects. Finally, the
chapter briefly discusses the sustainability of policies aimed at reducing the
production of cocaine in source countries. Before describing the data and
collection methodologies, we turn to describing some basic information about the
main topic of this chapter: cocaine.
A BRIEF INTRODUCTION TO COCAINE A BRIEF INTRODUCTION TO COCAINE A BRIEF INTRODUCTION TO COCAINE A BRIEF INTRODUCTION TO COCAINE
Cocaine is a powerful addictive drug that is produced in large quantities in
only a few Latin American countries. These are Bolivia, Colombia, and Peru.2
The main ingredient to produce cocaine is the cocaine alkaloid, a chemical
compound that can be extracted from the leaves of coca plants.3 Coca was grown
in the Andes long before the arrival of European settlers. Its leaves were (and, in
some cases, still are) chewed by the local indigenous population in the Americas
to help relieve fatigue caused by altitude sickness and for its mild stimulant
effects. Today, prevailing indigenous populations in Bolivia and Peru still use
coca leaves in religious and social ceremonies.4
The coca plant is a very hardy, medium-sized bush that grows in a
tropical rainforest climate anywhere between 100 and 1700 meters above sea
2 The purpose of this chapter is not to explain why illegal drug production takes place in some countries while not in others. Francisco Thoumi has extensively examined this topic (see Thoumi 2003, 2005a, b). 3 The cocaine alkaloid was first isolated in the West in 1855 by German chemist Friedrich Gaedcke. Five years later Albert Niemann described an improved isolation process of the cocaine alkaloid for his Ph.D. thesis and named it “cocaine” (see http://cocaine.org/ and the references there cited). 4 See Thoumi (2005c) for a detailed explanation of how anti-drug policies create a cultural clash between government agencies interested in fighting cocaine production and local native populations that have grown and used coca in traditional cultural and religious ceremonies for a long time.
4
level. The time between planting and harvesting ranges from six and nine months
depending on the coca variety, climate and geographical conditions. Coca bushes
can be grown and harvested year-round, but most growth occurs from December
to April. Coca is harvested, on average, four times per year (minimum — three
and maximum — eight, depending on the variety and location of the coca) and
requires up to 300 man-days to harvest one hectare — about 2.5 acres — for one
year (CIA, 2004).
Although there are over 250 different varieties of the coca plant, only a
few are widely used today to produce cocaine for the illegal drug markets.5
Cocaine production is a relatively simple process that can take place in small
local workshops. The process of producing cocaine consists of three main steps:
after being harvested and dried, the coca leaves are converted into coca paste,
then into cocaine base, and then into the final product, cocaine (cocaine
hydrochloride). The manufacturing process requires a few chemicals (precursors)
such as sulfuric acid, potassium permanganate, ether, hydrochloric acid, acetone
and ethyl ether, plus water, filters, and microwave ovens.
Depending on different factors such as coca variety, geography, bushes per
hectare, etc., one hectare planted with coca bushes produces, on average, between
1,000 and 1,200 kg of fresh coca leaf per hectare per harvest. Between 1.1 and 1.4
grams of cocaine can be produced from 1 kg of coca leaf. Using an average of
four harvests per year, and the yields described above, we can arrive at a
ballpark production estimate between 5 and 6 kg of cocaine per hectare per year.6
Cocaine hydrochloride, a white crystalline powder,7 is a highly potent and
addictive stimulant.8 It is either snorted or dissolved in water and injected. Due
5 These are the Huanuco coca (in Bolivia and Peru), the Amazonian coca (in the Amazon River Basin), and Colombian coca (in Colombia, primarily) (https://www.cia.gov/saynotodrugs/cocaine_b.html). 6 These yields numbers were taken from different reports (CIA, 2004 and UNODC, 2005). The number used by UNODC to calculate potential production of cocaine in Colombia was 4.7 kg of cocaine per hectare per year until 2004, which, according to the source, is taken from a study undertaken by the US government under the name of “Operation Breakthrough”. However, recent field research carried out by UNODC in Colombia has found a large increase in this productivity estimate. In fact, for the 2006 report, UNODC uses a productivity estimate of 7.7 kg of cocaine per hectare per year. We will elaborate on this below. 7 Commonly used street terms for cocaine are: blow, coke, snow, nose candy, flake, big C, lady, snowbirds, and wicky stick (see www.dea.gov/concern/cocaine_factsheet.html, and www.streetdrugs.org).
5
to the high price of cocaine, by the late seventies and beginning of the eighties
drug dealers discovered a new and cheaper alternative for low income users:
crack, a rocky crystal that is obtained by mixing cocaine, baking soda, and water
in a saucepan, and whose name derives from the crackling sound produced when
the ingredients are being burned to smoke the resulting vapors (see Levitt and
Dubner, 2005, and NIDA, 2005).
Cocaine is the second most consumed illegal drug in the US (after
marihuana) and the third in most European countries (after marihuana and
heroin). Cocaine consumption triggers different physical effects. In moderate
doses it causes disturbances in heart rates, elevated blood pressure, dilated
pupils, decreased appetite, irritability and argumentative behavior, among others.
In large doses it causes loss of coordination, collapse, blurred vision, dizziness,
anxiety, heart attacks, chest pain, respiratory failure, strokes, seizures and
headaches, abdominal pain, nausea, and paranoia.9 The duration of the euphoric
effect of cocaine (“the high”) depends on the route of administration. With faster
absorption, the high is more intense, but does not last as long. When snorted,
“the high” can last from 15 to 30 minutes; when smoked it can last from about 5
to 10 minutes (NIDA, 2006).
DATA SOURCESDATA SOURCESDATA SOURCESDATA SOURCES
There are two main sources of data for illegal drug production, prices,
extent of cultivation of illegal crops, seizures of drug shipments, etc. These are
the United Nations Office on Drugs and Crime (UNODC) and the US
government’s White House Office of Drug Control Policy (ONDCP). In addition
to these two sources, other institutions, many times government departments in
producer countries, either gather their own statistics or collaborate in the
gathering of data with UNODC and/or ONDCP.
8 The stimulation produced by cocaine consumption comes from its interference with the reabsorption process of dopamine, which is a chemical messenger that is associated with pleasure and movement (National Institute of Drug Abuse – NIDA). 9 NIDA, 2006 and www.streetdrugs.org/cocaine.htm.
6
Established in 1997, UNODC has become the main source for data on
illegal drug markets. It employs about 500 staff members worldwide and has 21
field offices located in the main producer countries, as well as in those countries
used as traffic corridors. The mandate of UNODC is to assist member countries
in their struggle against illegal drugs, crime, and terrorism.10 UNODC relies on
voluntary contributions — mainly from just a few countries — for almost 90% of
its budget,.11 UNODC works jointly with the respective government institutions
in the producer countries to undertake the “Coca Cultivation Survey” each year.
Through the Illicit Crop Monitoring Programme (ICMP), UNODC uses the
interpretation and processing of satellite images to monitor illegal crops in
producer countries: coca in the three Andean producer countries and opium
poppy in South and East Asian countries.12 Also, using surveys and studies on
yields, this institution produces an estimate of potential cocaine production,
gathers prices of intermediate goods such as dry coca leaf and coca base, and
collects other crucial statistics such as eradication measures, drug shipments
seizures, and the number of cocaine processing laboratories destroyed as reported
by different governmental institutions in producer countries.13
ONDCP’s data on coca cultivation are prepared by the US Director of
Central Intelligence, Crime and Narcotics Center (CNC), and are published each
10 More information on the mandate of UNODC, as well as its main goals, can be obtained at: http://www.unodc.org/unodc/en/about.html 11 Jensema and Thoumi (2004) argue that UNODC’s large proportion of earmarked funding from a few donor countries biases the type of projects where the funds are spent, hampers its policy evaluation efforts as criticisms can easily translate into a fund shortage, and prevents the organization from experimenting with programs that are not in line with the donor countries’ position on illegal drug issues. Available at: http://www.drug-policy.org/documents/Thoumi_Jensema_paper 12 The analysis of these images includes a number of corrections for cloud cover, spraying, dates of acquisition, etc. For a detailed explanation the reader is referred to the methodological description available in the Survey Reports for each of the Andean countries available at: www.unodc.org/unodc/en/crop_monitoring.html). 13 Thoumi (2005a) argues that UNODC does not have enough personnel and claims that “it simply does not have the capability to conduct significant critical studies and to evaluate in detail the quality of the data it collects” (Thoumi, 2005a, p. 189). This claim, however, is backed up only by a specific criticism on a figure of the size of the illegal drug business ($500 billion, which was a clear overestimation) produced by UNODC back in 1997 when this organization was first established. The author also asserts that for the production of UNODC’s main substantial product, The World Drug Report, the organization relies on several consultants who are hired to write chapters and sections for the report, which, in some sense, contradicts the claim that UNODC lacks the human resources to produce significant quality statistics and analysis.
7
March in the International Narcotics Control Strategy Report as part of the US
President’s determination of whether to provide assistance to drug producer and
transit countries. In preparing its estimates of coca cultivation, CNC analyzes
black and white, high-resolution satellite imagery and aerial photographs. These
are taken only between November and January of each year, weather permitting.
The satellite images and aerial photographs cover a representative area of the
producer countries’ known or suspected drug growing areas. The technique for
analyzing the satellite images and aerial photographs is similar to the one used to
estimate agricultural crops throughout the United States (see GAO, 2003 and
ONDCP, 2005). However, according to a study conducted by ONDCP in 2002,
the CNC’s methodology had not adopted a “statistically rigorous accuracy
assessment, commonly known as an error rate” in its methodology to measure
coca cultivation. Also, the technology used by CNC was inappropriate as it did
not account for image distortions or variations in the terrain and the atmosphere,
such as cloud cover. Following the recommendations made by the ONDCP’s
study, CNC expected to have many of the recommended changes in place for its
2002 analysis (see GAO, 2003).
UNODC´s methodology for collecting data on coca cultivation covers
almost the entire territories in the producer countries, whereas ONDCP´s only
covers a representative sample. UNODC also makes more corrections than
ONDCP for possible biases and mistakes in the interpretation of aerial imagery.
Finally, UNODC has been actively involved in conducting the “Coca Cultivation
Surveys” in each one of the producer countries, which are complemented by
continous efforts to undertake field studies to update parameters such as yields
per hectare, an important parameter for coming up with and estimating potential
cocaine production. Although UNODC stands as a more reliable source of data
on coca cultivation, cocaine production, and related issues, we will be referring to
the two data sources in the following section of the paper in order to compare
them to each other (if possible).
8
COCAINE PRODUCTION: STYLIZED FACTS COCAINE PRODUCTION: STYLIZED FACTS COCAINE PRODUCTION: STYLIZED FACTS COCAINE PRODUCTION: STYLIZED FACTS
i. Coca Cultivation
According to ONDCP, coca cultivation in the three Andean countries
remained relatively stable throughout the 1990s. On average, coca was cultivated
in about 200,000 hectares in the three producer countries, but the share of each
country in total coca cultivation changed dramatically during the decade. While
Peru had the largest number of hectares in 1990 (about 57% of the total) and
Colombia the lowest (19%), by 1999 these shares had completely reversed, with
Peru having 21% of the total, Bolivia 12%, and Colombia 67% (Figure 1). On
one hand, this change was, in part, a result of increasing eradication efforts
undertaken by the Bolivian and Peruvian governments, and of aerial interdiction
efforts undertaken by the Peruvian government to close the air bridge between
coca producing centers in Peru and cocaine processing laboratories in Colombia.
On the other hand, in Colombia, after the demise of the Medellin and Cali cartels
by the middle of the nineties, the Fuerzas Armadas Revolucionarias de Colombia
(FARC) and the Autodefensas Unidas de Colombia (AUC), their historical
origins as leftist guerrillas and right-wing paramilitaries notwithstanding, started
to get increasingly involved in the production and commercialization of cocaine to
finance their insurgent activities against each other and against the Colombian
state.14 As a result, coca cultivation reached its highest levels ever recorded in
Colombia (about 163,000 hectares) by 2001. The response of the Colombian
government to the large increase in coca cultivation was the implementation of
Plan Colombia in 2001, the official name of a multi-year, comprehensive strategy
designed and implemented to bring about lasting peace by reducing the
production of illegal drugs. As a result, from 2000 to 2003 coca cultivation in
Colombia decreased by more than 30%, whereas in Bolivia and Peru it remained
relatively stable. According to the latest UNODC and ONDCP reports, total
coca cultivation in the three producer countries has remained relatively stable in
the last three years reported (Figure 2 (a) and (b)). Nevertheless, ONDCP´s
14 See Rangel (2000) and Grossman and Mejía (2007).
9
figures should be handled with care as they expanded by 81% the size of the
landmass that was imaged and sampled for coca cultivation and, when the new
areas covered are taken into account, there is an increase of 39,000 has.
cultivated with coca.15 As ONDCP claims in a recent press release, “Because
these areas were not previously surveyed, it is impossible to determine for how
long they have been under coca cultivation...The higher cultivation figure in this
year’s estimate does not necessarily mean that coca cultivation increased in the
last year; but rather reflects an improved understanding of where coca is now
growing in Colombia.” Summarizing, according to the two sources, total
cultivation in the three Andean countries shows a large decrease between 2001
and 2003, in large part due to the large decreased observed in Colombia after the
implementation of Plan Colombia. And, if anything, coca cultivation has
remained relatively stable during the last three years reported. Although the
observed figures for the last few years are not enough evidence to conclusively
support a ballooning effect, where a decrease in cultivation in one area due to
“effective” anti-drug policies would lead to the reallocation of crops to new areas
and, as a result, total cultivation remains unchanged (or increases), it does send a
warning signal of the potential for large increases in Bolivia and Peru if anti-drug
policies and monitoring are not maintained in all areas where coca can and has
been grown in the past (see Department of State, 2005).
Since UNODC only started the Illicit Crop Monitoring System in Colombia in
1999, in Peru in 2000, and in Bolivia in 2003, data between the two main sources
of information can be compared only for those years. Figure 3 shows the
evolution of coca bush cultivation in Colombia according to the two main
sources. Although the levels are different, with an almost constant average
difference between the two sources of 30,000 hectares, the tendency is the same:
first increasing between 1999 and 2000, and then decreasing until 2004. The same
pattern is observed for Bolivia and Peru, that is, an almost constant level of coca
cultivation with a small increasing tendency in the last year. However, while
15 Figures 1 and 2(b) present ONDCP´s estimates of total coca cultivation preserving the sample fixed, that is, they do not take into account for 2005 the 81% increase in the fields surveyed.
10
ONDCP’s estimate of coca cultivation in Colombia is larger than UNODC’s in
the last four years, the opposite is true for Bolivia and Peru for those years when
the two sources gathered data separately.
ii. Intermediate Prices
While in Bolivia and Peru there is an active market of coca leaf, in Colombia
the market for coca leaf is very limited because most farmers process the coca
leaves into coca base themselves in small “kitchens” located on their farms. Thus,
UNODC collects monthly data on prices of sun-dried coca leaf in Bolivia and
Peru and of coca base in Colombia based on semi-structured interviews of
farmers, storekeepers, and others who participate in the cultivation of coca and
the production of coca base. In many instances these prices are collected only in a
few regions where coca is grown and, as a result, the selected sample may be far
from representative and should be handled with care. For instance, during 2004
the prices of coca leaf in Bolivia were collected only in the Yungas of La Paz in
Bolivia by UNODC and in the Chapare region (also in Bolivia) by DIRECO, in
13 different points in Peru, and in 5 departments in Colombia.
The price of dried coca leaf in Bolivia and Peru increased dramatically from
1996 to 2001. This increase in prices was the result of eradication measures taken
by the Bolivian and Peruvian governments, as well as the efforts of the Peruvian
government during the second half of the nineties, partially financed with US
funding, to close the air bridge that connected the coca and coca paste-producing
centers in Peru and the Colombian laboratories that are specialized in processing
the coca paste into cocaine. Figures 4 (a) and (b) show the evolution of coca leaf
prices in Bolivia and Peru respectively along with potential coca leaf production
as calculated by UNODC based on yields per hectares. While in Bolivia, the price
of dried coca leaf has decreased due to increased production in the last three
years recorded (2003 through 2005), in Peru dried coca leaf prices have risen in
the last few years. In Colombia, however, despite the large decrease in coca
cultivation between 2001 and 2004 described above, neither the price of coca base
11
nor coca base production have shown any increasing tendency between 2000 and
2005 (see Figure 5). According to UNODC (2005) the price of coca base increased
between 2001 and 2003. However, this is true only in nominal terms. The price of
coca base has been stable (when seen in dollar terms) or decreasing (in real
pesos) ever since the beginning of the implementation of Plan Colombia in 2001,
precisely the moment when coca cultivation started to decrease rapidly.
According to some sources, this apparent puzzle — of lower cultivation of coca
and lower prices of coca base — can be partially explained by the offsetting effects
of larger imports of coca paste from Peru and the large increases in productivity
per hectare in the production of coca base.16 The next section will elaborate on
this and on a “twin puzzle”, namely the stability of prices of cocaine in the US
market despite the large decrease in aggregate coca cultivation between 2000 and
2003 in the three producer countries and a relatively stable aggregate demand for
cocaine in the consumer countries.
iii. Potential Cocaine Production
Using yields per hectare as well as technical coefficients for each of the main
links in the cocaine production chain, UNODC produces an estimate of potential
manufacture of cocaine for each one of the three producer countries in the
Andean region. Until 2004 UNODC’s estimates relied on information of technical
coefficients from other sources, the main one being Operation Breakthrough, a
DEA project designed to estimate the amount of cocaine produced in the Andean
region by examining the yield and alkaloid content of coca crops and the
efficiency of clandestine cocaine producing laboratories. In 2004, however,
UNODC started a series of field studies to complement its crop monitoring
system by estimating coca leaf yields per hectare, average weight loss for sun-
dried and oven-dried leaves, and conversion rates from coca leaf to cocaine,
16 Despite the successful closure of the air bridge between Peru and Colombia, the organizations involved in coca cultivation and cocaine production figured out other ways (perhaps less efficient but still profitable, such as transportation by river, or using mules to travel jungle paths) to move coca paste from Peru to Colombia (see Kawell, 2001).
12
among others (see the Coca Cultivation Surveys for the three producer countries
produced by UNODC in 2005 and 2006.) The implementation of these surveys,
however, is often hampered by the social tensions prevailing in the coca
producing regions and by the farmers’ reluctance to collaborate with the
interviewers. Despite the difficulties in carrying out these studies, their
implementation is of the greatest importance, not only to better understand coca
and its derivatives’ markets, but also to be able to evaluate the efficiency of anti-
drug programs and monitor changes in each link of the cocaine production
process.17
Not surprisingly, according to UNODC the main trend of potential cocaine
production is very similar to that described above for coca cultivation, that is, a
relatively stable total potential production of cocaine from 1990 to 1999 (at about
850 metric tons) and then decreasing between 2000 to 2003. By 2003 cocaine
production had reached a minimum level of about 800 metric tons due, almost
completely, to the large decrease in potential production in Colombia (see Figure
6 (a)). For 2004 and 2005, however, new estimates of coca leaf yields per hectare
obtained by UNODC and the Colombian government point to worrisome results,
namely, that productivity per hectare has increased from 4.7 to 7.7 kg per
hectare per year (a 63% increase)18. This new estimate — plus the sustained high
prices of coca leaf in Bolivia (above $5/kg) and Peru (above $2.5/kg), which
likely created an incentive for farmers in these two countries to increase coca
cultivation — have resulted in a large increase in the estimated potential cocaine
production between 2003 and 2004. While in Bolivia, potential cocaine
production increased by 35% in 2004 and by 23% in Peru (in the same year), in
Colombia it increased by 16%, despite the reduction in the number of coca
cultivated hectares.
17 For instance, in 2004 the media reported the discovery, in the Sierra Nevada (in the northern part of Colombia), of a new coca variety which supposedly had higher cocaine content, a higher level of purity, and was also resistant to glyphosate. This new variety was seen as the response of drug traffickers to the intensive aerial spraying efforts by the Colombian government, with strong financial and technical support from the US (see McDermott, 2004). However, the Transnational Institute (TNI) has questioned the validity of this report arguing that “A few scientific facts provide grounds for questioning the credibility of this report about the cocaine alkaloid content of the coca leaf…The report’s claim that the plant is resistant to glyphosate is equally ambiguous” (see TNI, 2004). 18 See UNODC (2006).
13
Based on the most recent CNC cultivation estimates, along with the DEA’s
coca yield and laboratory efficiency data, the US State Department also produces
an estimate of potential cocaine production. According to this source, after
reaching a peak of more than one thousand metric tons in 2001, total cocaine
production in the Andean countries declined between 2001 and 2004 (see Figure 6
(b)). For 2005, potential cocaine production is not comparable to prior years due
to the fact that ONDCP includes in its calculation those newly surveyed fields
that were not included in previous years. In fact, our own calculations suggest
that potential cocaine production would have been 431 metric tons (the same as
in 2004) if one does not include the new surveyed areas. While potential cocaine
production according to this source has remained relatively stable during the last
three years in Bolivia and Peru (at 60 metric tons and 140 metric tons per year
respectively), in Colombia it decreased very rapidly until 2004 and it remained
stable during 2005. By 2004 and 2005 potential cocaine production in this
country (430 MT) was about 50% of what it was in 2001 (840 MT).19 According
to an ONDCP report (ONDCP, 2005), the fact that potential cocaine production
declined more rapidly than coca bush cultivation is explained by the fact that,
since intense aerial spraying started in Colombia in 2001, there are an increasing
proportion of coca fields that are newly planted, and these are known to be less
productive than more mature fields. However, as we will see below, although it
might be true that aerial spraying decreases the average age of coca fields, and
this, in turn, decreases the yields, there is new evidence of an increase in yields
per hectare coming from different strategies implemented by illegal groups
engaged in cocaine production in response to the increase eradication measures
taken by the Colombian and US governments.
Although UNODC’s and the State Department’s estimates of potential
cocaine production show a similar proportional decrease between 2001 and 2003,
the latter source shows a reversion of the decreasing trend for 2004 and 2005 due
to higher yields per hectare, while the former shows an increase in 2005 that is
19 Again, without including in the calculations the 39,000 has of new surveyed fields of 2005 to make the data comparable to previous years.
14
only due to an increase in the fields surveyed, and, as a result, the number for
2005 is not really comparable to the numbers observed for previous years.
iv. Average Purity
UNODC and ONDCP also gather statistics on the average purity of cocaine
by using information from laboratories and cocaine shipment seizures in producer
and transit countries respectively, as well as the information at the retail level
from street seizures in consumer countries. On one hand, between 2002 and 2004
the average purity of cocaine in the producer countries ranged between 82% and
95% (UNODC, 2006). On the other, because purity levels in consumer countries
are obtained from drug seizures, many times done at the retail level, the average
purity of cocaine varies very widely, even for a given transaction size in a given
city and year (Caulkins, 1994). Also, the spread in expected purity does not
decrease as the quantities being transacted increases, and, as a result, the
interpretation of simple averages should be handled with care (ONDCP, 2004).
According to ONDCP, the average expected purity of cocaine20 in the US market
increased rapidly throughout the eighties for all quantities being transacted, then
decreased during the first few years of the nineties and remained relatively stable
during the nineties. Finally, in the last few years, expected purity of powder
cocaine has increased, reaching levels of about 70% for purchases of less than two
grams, 67% for purchases of 2 to 10 grams, and 62% for purchases of 10 to 59
grams and of more than 50 grams (see Figure 7).21 Although one would expect
increasing purity levels as the quantities being transacted increases (as was in
fact observed in the eighties), purity differences across quantity levels had almost
disappeared in the nineties, mainly because purity levels at the highest quantities
transacted fell. According to ONDCP (2004) this suggests that diluting cocaine
was not as common a practice in the nineties as it was in the eighties. In fact,
20 Expected purity levels are based on observations obtained through purchases only and do not include observations from seizures and other enforcement activities (ONDCP, 2004). 21 The same patterns are observed when information on purity levels obtained through seizures and other enforcement activities are also included (see Figure 8).
15
after 1998 one observes higher purity levels for the lowest quantity purchases,
which may come from the compositional effects from the aggregation of different
number of transactions from higher and lower purity transactions, markets, and
cities, and not because distributors inside the US refine cocaine across the
distribution chain (UNODC, 2004).
According to evidence cited by Caulkins and Reuter (1998), purity levels do
not seem to affect transaction prices at the retail level in consumer countries.
This apparent puzzle, however, is explained by the authors with the observation
that illegal drugs are experience goods, where the price paid is in part determined
by the purity the buyer expects at the time of purchase based on information
such as the size of the purchase, location, and other observable characteristics.
Given the lack of official regulation in illegal drug markets, sellers can deceive
costumers about the purity of the product being transacted. At the same time,
buyers can later argue that the product was of lower quality than that agreed at
the time of the transaction. These disputes, not surprisingly, end up many times
generating a substantial amount of violence.22
A A A A BRIEF BRIEF BRIEF BRIEF LOOK AT CONSUMPTION TRENDSLOOK AT CONSUMPTION TRENDSLOOK AT CONSUMPTION TRENDSLOOK AT CONSUMPTION TRENDS
Although this chapter concentrates on cocaine production and trafficking,
in order to say anything meaningful about the price of cocaine in world markets,
we must briefly review demand.
The United States, where cocaine is the second-most consumed illegal drug
after marihuana is the main consumer country in the world. In most European
countries, cocaine is the third illegal drug consumed, after marihuana and
heroin.23 While in the US, the annual prevalence rate of abuse in the 15 to 64-
year-old population is about 2.8%, in European countries, on average, this rate is
22 This is not the only link in the trafficking chain where violence arises as a method to resolve disputes. In fact, the recourse to violence is one prominent characteristic of organizations involved in illegal drug trafficking. 23 According to UNODC (2005a) there are approximately 13.4 million cocaine users in the world. Two-thirds are in the Americas (about 6.5 million in the US and 1.9 in South America).
16
2.7% in Spain, 2.4% in the UK24, 1.1% in the Netherlands, Italy and Ireland, and
less than 0,3% in countries such as France, Sweden and Poland.
Cocaine consumption in the US decreased rapidly between 1985 and 1993;
since then it has remained relatively stable. While in 1985 the annual prevalence
rate among the 12-year-olds in the general population and above was about 5.1%,
by 1993 this rate had decreased to about 2%. Among high school students,
prevalence rates also decreased rapidly between 1985 and 1992: from 13.1% to
3.1%. In the second half of the 1990’s, the prevalence rate among 12th graders in
the US has fluctuated between 3% and 6% (UNODC, 2005a, using information
from SAMHSA). The percentage of the population reporting current (during the
month before the interview) and occasional (one to eleven times during the
twelve months before the interview) use of cocaine also shows the same pattern
(see Figure 9). Other indicators, such as the trend in cocaine treatment
admissions, show a decreasing tendency of cocaine use between 1992 and 2002
(the last year recorded). While the primary admission rate25 for cocaine per
100,000 inhabitants (age 12 or older) was about 125 in 1992, by 2002 it had
decreased by approximately 24% to about 100 (SAMHSA, 2005).26 Among high
school students, the evidence on cocaine consumption trends is somehow mixed.
While measures of 30-day prevalence rates for cocaine use among 12th graders
began to increase and then peaked in 1999 and then decreased until 2003 (see
Figure 10), the perception of harmfulness of cocaine consumption27–as perceived
by 12th graders–seems to have declined in the last few years recorded (University
of Michigan (2004)).
In Europe, however, cocaine consumption, according to most estimates,
has been on the rise over the last few years.28 For instance, in Spain, the country
that shows the highest rates of cocaine consumption in Europe, the prevalence of
24 For the population between 16 and 59 years of age. 25 The primary substance is the main substance reported at the time of admission. 26 Cocaine admissions as percent of all admissions also declined from about 17.5% in 1992 to about 13% in 2002. 27 When they respond to the question: How much do you think people risk harming themselves (physically
or in other ways), if they try cocaine powder once or twice, and occasionally. 28 European countries, probably with the exception of Spain, show prevalence rates of consumption much lower than those in the US.
17
cocaine use among the general population (age 15 to 64) increased from 1.5% in
1995 to 2.7% in 2003; in the Netherlands it increased from 0.7% in 1997 to 1.1%
in 2001; in Switzerland, cocaine use among 15- and 16-year-olds increased from
0.9% in 1994 to 2.5% in 2002; Germany experienced an increase of cocaine use of
the population between 18 and 64 years of age from 0.2% in 1990 to 1% in 2003
(UNODC, 2004).
COCAINE PRICESCOCAINE PRICESCOCAINE PRICESCOCAINE PRICES
The price per pure gram of cocaine decreased from more than $500 for
purchases of two grams or less, and $200 for purchases of more than 50 grams in
1980, to about $200 and to about $38, respectively, in 2001.29 Since 2001 the
price of cocaine in the US has been increasing at a relatively slow pace. These
patterns are observed for both the US and Europe for cocaine at street purity
(Figure 11). According to UNODC, cocaine prices, at the retail and wholesale
level, have followed similar trends over time (Figure 12).
THE MAIN PUZZLETHE MAIN PUZZLETHE MAIN PUZZLETHE MAIN PUZZLE (and (and (and (and itsitsitsits resolution...) resolution...) resolution...) resolution...)
According to most measures available until 2005, potential cocaine
production showed a decreased of about 30% or more between 2000 and 2004,
while demand in the consumer countries, if anything, had remained relatively
stable. Yet, prices of intermediate inputs (coca leaf and coca base) in producer
countries and of cocaine in the consumer countries had been stable or decreasing
until then.30 With a roughly stable demand (except in many European countries
where cocaine consumption is rising, but is still “low” when compared to the
29 Caulkins and Reuter (1998) study the relative importance of the cost components in determining cocaine prices at the retail level. According to their estimates, a little over 50% of the cost can be attributed to risk (for incarceration about 24%, and for death about 30%), whereas import costs only account for about 12% of the retail value of cocaine, labor costs for about 13%, and costs of product and assets seizures for about 10%. The same study also highlights the huge variability of prices across time and market levels and explains why enforcement interventions create only temporary spikes in prices, due to the response (in their words, adaptation) of suppliers. 30 A very small increase in cocaine prices at the retail level in consumer countries (at “street purity”) is perceivable in the last few years recorded by UNODC (see Figure 12).
18
prices observed in the US), lower production estimates and increasing seizures,
increasing interception of drug shipments, and destruction of cocaine processing
laboratories, cocaine prices would have been expected to rise or remain stable,
and not fall as seems, in fact, to have been the case (at least until new
information became available recently). Or, as Reuter (2001, p. 18) puts it, “If
thorough enforcement did not raise drug prices, then it might still claim success if
it lowered availability. But the data, mostly from surveys of high school seniors,
show no decrease”. However, in the process of writing this chapter, UNODC
released the results of field research done in Colombia where they found a large
increase in productivity estimates. Specifically, they found that, on average, the
number of kilograms produced by one hectare of coca in one year increased from
4.7 to 7.7 (UNODC, 2006). This corresponds to a 40% increase in the yields per
hectare. When this new estimates of productivity are used to calculate potential
cocaine production they find that, although there has been a large decrease in the
number of coca cultivated hectares in Colombia (of more than 30% between 2001
and 2005), each hectare is now found to be more productive. As a result of these
two factors, and as explained before, potential cocaine production in Colombia
has not decreased as much as was thought before.
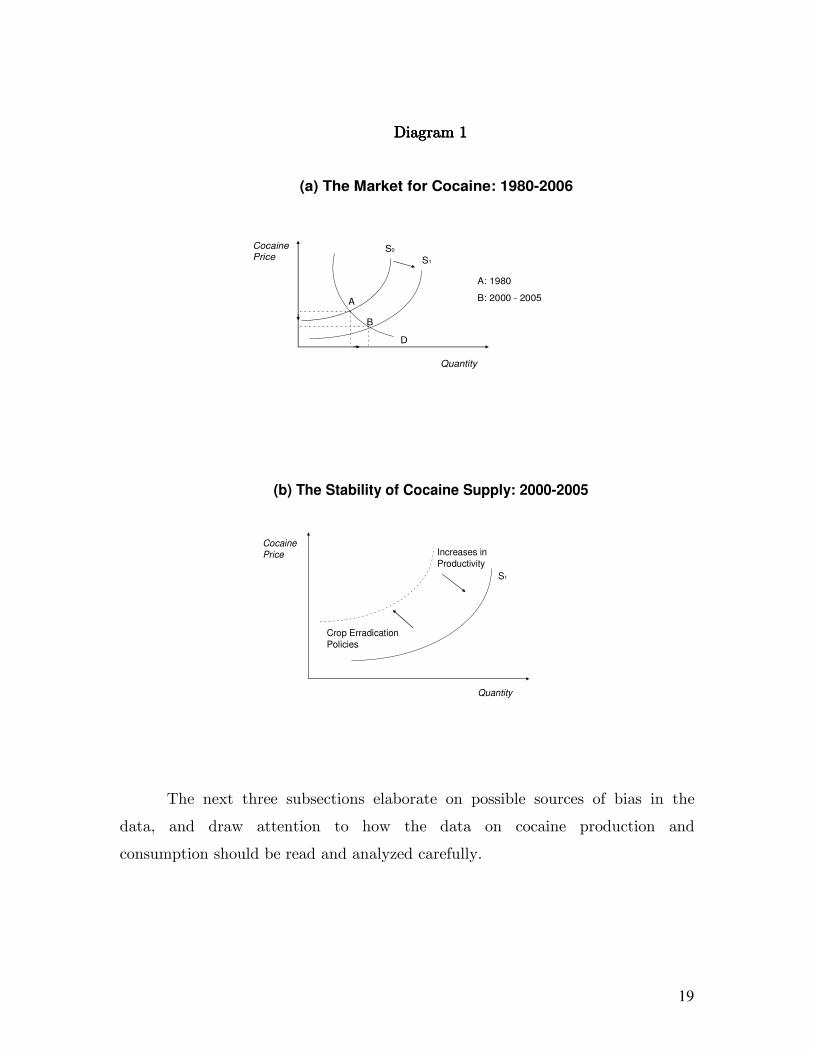
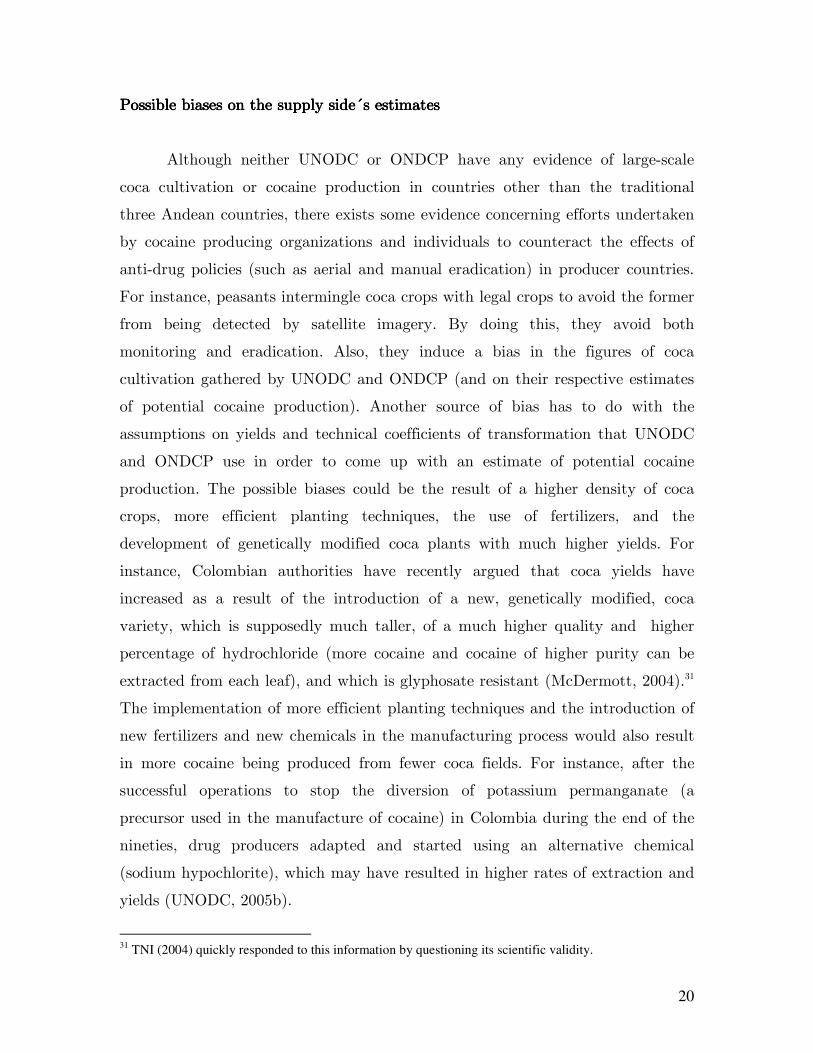
Diagram 1a below summarizes the main changes in the market for cocaine
between 1980 and 2005, and Diagram 1b summarizes the two opposing forces
that have kept cocaine supply relatively stable during the last five years: first,
eradication measures, by destroying coca crops, tend to decrease cocaine supply
and, second, increases in productivity in the production of coca leaf and cocaine
have counteracted anti-drug policies in producer countries. Despite the large
amount of resources spent on the war on drugs, a relatively stable demand
together with the stability of cocaine supply described above have kept quantities
and prices of cocaine about constant in the last 5 years.
19
Diagram 1Diagram 1Diagram 1Diagram 1
(a) The Market for Cocaine: 1980-2006
CocainePrice
Quantity
S0
S1
D
A
B
A: 1980
B: 2000 - 2005
(b) The Stability of Cocaine Supply: 2000-2005
CocainePrice
Quantity
Crop Erradication
Policies
Increases in
Productivity
S1
The next three subsections elaborate on possible sources of bias in the
data, and draw attention to how the data on cocaine production and
consumption should be read and analyzed carefully.
20
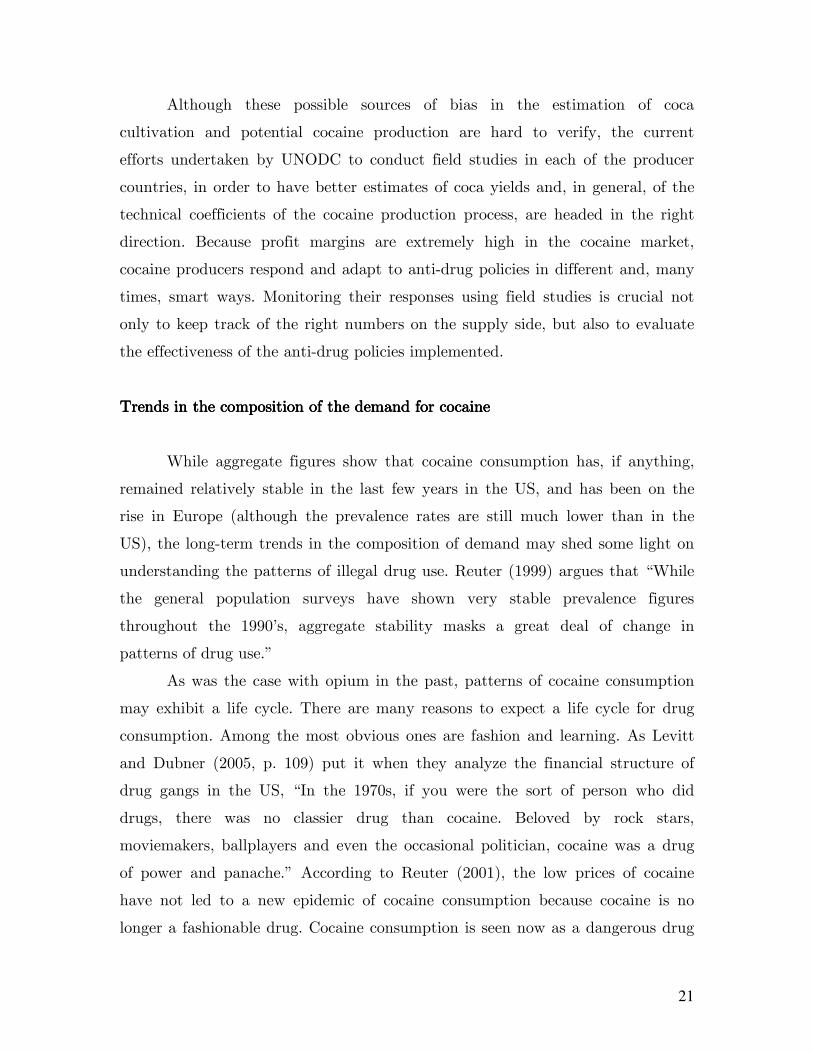
Possible biases Possible biases Possible biases Possible biases oooon the supply siden the supply siden the supply siden the supply side´s estimates´s estimates´s estimates´s estimates
Although neither UNODC or ONDCP have any evidence of large-scale
coca cultivation or cocaine production in countries other than the traditional
three Andean countries, there exists some evidence concerning efforts undertaken
by cocaine producing organizations and individuals to counteract the effects of
anti-drug policies (such as aerial and manual eradication) in producer countries.
For instance, peasants intermingle coca crops with legal crops to avoid the former
from being detected by satellite imagery. By doing this, they avoid both
monitoring and eradication. Also, they induce a bias in the figures of coca
cultivation gathered by UNODC and ONDCP (and on their respective estimates
of potential cocaine production). Another source of bias has to do with the
assumptions on yields and technical coefficients of transformation that UNODC
and ONDCP use in order to come up with an estimate of potential cocaine
production. The possible biases could be the result of a higher density of coca
crops, more efficient planting techniques, the use of fertilizers, and the
development of genetically modified coca plants with much higher yields. For
instance, Colombian authorities have recently argued that coca yields have
increased as a result of the introduction of a new, genetically modified, coca
variety, which is supposedly much taller, of a much higher quality and higher
percentage of hydrochloride (more cocaine and cocaine of higher purity can be
extracted from each leaf), and which is glyphosate resistant (McDermott, 2004).31
The implementation of more efficient planting techniques and the introduction of
new fertilizers and new chemicals in the manufacturing process would also result
in more cocaine being produced from fewer coca fields. For instance, after the
successful operations to stop the diversion of potassium permanganate (a
precursor used in the manufacture of cocaine) in Colombia during the end of the
nineties, drug producers adapted and started using an alternative chemical
(sodium hypochlorite), which may have resulted in higher rates of extraction and
yields (UNODC, 2005b).
31 TNI (2004) quickly responded to this information by questioning its scientific validity.
21
Although these possible sources of bias in the estimation of coca
cultivation and potential cocaine production are hard to verify, the current
efforts undertaken by UNODC to conduct field studies in each of the producer
countries, in order to have better estimates of coca yields and, in general, of the
technical coefficients of the cocaine production process, are headed in the right
direction. Because profit margins are extremely high in the cocaine market,
cocaine producers respond and adapt to anti-drug policies in different and, many
times, smart ways. Monitoring their responses using field studies is crucial not
only to keep track of the right numbers on the supply side, but also to evaluate
the effectiveness of the anti-drug policies implemented.
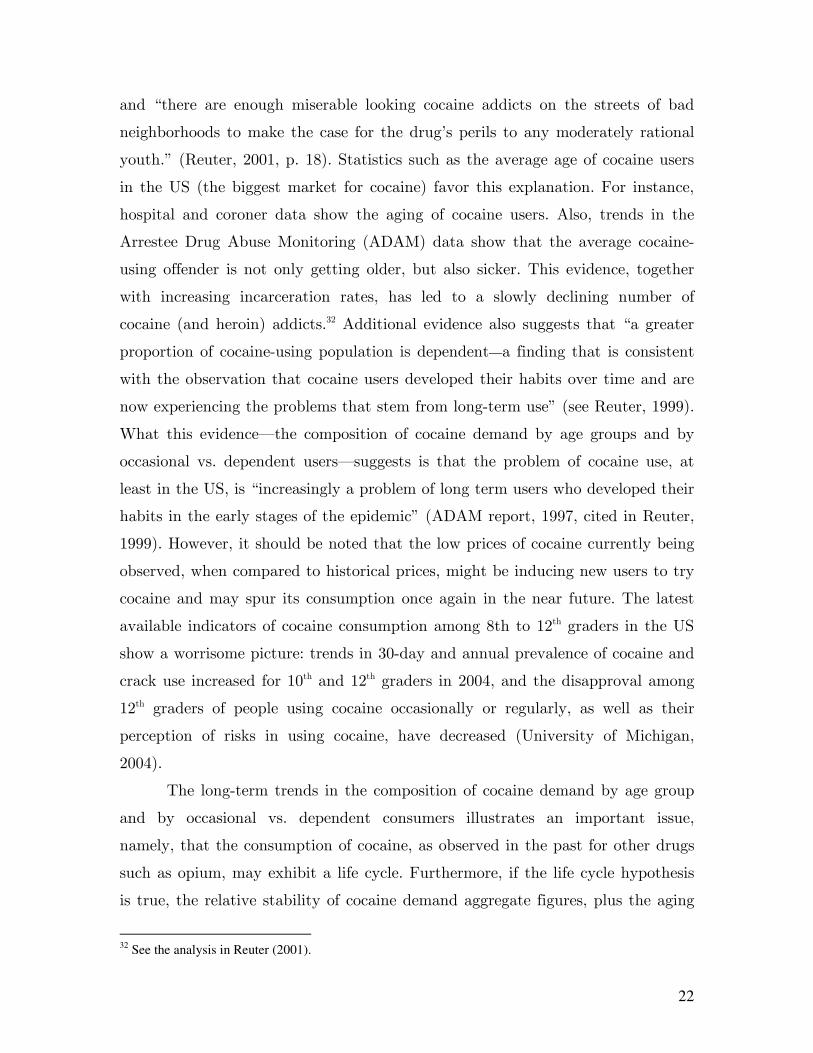
Trends in the composition Trends in the composition Trends in the composition Trends in the composition of the demand of the demand of the demand of the demand for cocainefor cocainefor cocainefor cocaine
While aggregate figures show that cocaine consumption has, if anything,
remained relatively stable in the last few years in the US, and has been on the
rise in Europe (although the prevalence rates are still much lower than in the
US), the long-term trends in the composition of demand may shed some light on
understanding the patterns of illegal drug use. Reuter (1999) argues that “While
the general population surveys have shown very stable prevalence figures
throughout the 1990’s, aggregate stability masks a great deal of change in
patterns of drug use.”
As was the case with opium in the past, patterns of cocaine consumption
may exhibit a life cycle. There are many reasons to expect a life cycle for drug
consumption. Among the most obvious ones are fashion and learning. As Levitt
and Dubner (2005, p. 109) put it when they analyze the financial structure of
drug gangs in the US, “In the 1970s, if you were the sort of person who did
drugs, there was no classier drug than cocaine. Beloved by rock stars,
moviemakers, ballplayers and even the occasional politician, cocaine was a drug
of power and panache.” According to Reuter (2001), the low prices of cocaine
have not led to a new epidemic of cocaine consumption because cocaine is no
longer a fashionable drug. Cocaine consumption is seen now as a dangerous drug
22
and “there are enough miserable looking cocaine addicts on the streets of bad
neighborhoods to make the case for the drug’s perils to any moderately rational
youth.” (Reuter, 2001, p. 18). Statistics such as the average age of cocaine users
in the US (the biggest market for cocaine) favor this explanation. For instance,
hospital and coroner data show the aging of cocaine users. Also, trends in the
Arrestee Drug Abuse Monitoring (ADAM) data show that the average cocaine-
using offender is not only getting older, but also sicker. This evidence, together
with increasing incarceration rates, has led to a slowly declining number of
cocaine (and heroin) addicts.32 Additional evidence also suggests that “a greater
proportion of cocaine-using population is dependent—a finding that is consistent
with the observation that cocaine users developed their habits over time and are
now experiencing the problems that stem from long-term use” (see Reuter, 1999).
What this evidence–the composition of cocaine demand by age groups and by
occasional vs. dependent users–suggests is that the problem of cocaine use, at
least in the US, is “increasingly a problem of long term users who developed their
habits in the early stages of the epidemic” (ADAM report, 1997, cited in Reuter,
1999). However, it should be noted that the low prices of cocaine currently being
observed, when compared to historical prices, might be inducing new users to try
cocaine and may spur its consumption once again in the near future. The latest
available indicators of cocaine consumption among 8th to 12th graders in the US
show a worrisome picture: trends in 30-day and annual prevalence of cocaine and
crack use increased for 10th and 12th graders in 2004, and the disapproval among
12th graders of people using cocaine occasionally or regularly, as well as their
perception of risks in using cocaine, have decreased (University of Michigan,
2004).
The long-term trends in the composition of cocaine demand by age group
and by occasional vs. dependent consumers illustrates an important issue,
namely, that the consumption of cocaine, as observed in the past for other drugs
such as opium, may exhibit a life cycle. Furthermore, if the life cycle hypothesis
is true, the relative stability of cocaine demand aggregate figures, plus the aging
32 See the analysis in Reuter (2001).
23
of cocaine consumers, at least in the US, might indicate future declines in the
consumption of cocaine in this country.
Other Other Other Other sources of bias sources of bias sources of bias sources of bias in the numbersin the numbersin the numbersin the numbers
After the demise of the Medellin and Cali cartels during the 1990’s, new
players entered the cocaine production and commercialization business in
Colombia by the end of the decade (when Colombia was already the largest
producer of cocaine). These new cartels, such as the Norte del Valle cartel, the
Costa cartel, and the different guerrilla and paramilitary fronts, are characterized
for being smaller and having a relatively more widespread command structure. In
other words, it is no longer true that the production and commercialization of
cocaine is controlled by a few drug lords such as Pablo Escobar or the Rodriguez
Orejuela brothers. Instead, one can argue (based on “informed” anecdotal
evidence) that after the demise of the Medellin and Cali cartels, cocaine
production and commercialization is controlled by a larger group of less visible
organizations. This, in turn, may have induced greater competition between the
new groups in control of the cocaine trade, lower profit margins (but still huge),
and lower prices. Greater competition in the initial stages of the cocaine
trafficking chain may have counteract the effects of anti-drug policies
implemented in producer countries and, as a result, may have prevented cocaine
wholesale prices (that is, prices recorded at consumer countries’ borders) from
going up.
Yet another, perhaps related, explanation posed by UNODC (2005a) is the
use of cocaine stocks to “fuel” drug markets while the actual surge in anti-drug
policies lasts. In other words, organizations involved in cocaine commercialization
have been running down their stocks of cocaine with the expectation that the
current level of anti-drug policies cannot last much longer. However, there is no
significant evidence to support this explanation. In any case, if it were true, the
stocks “should be soon exhausted and a contraction of the market should then
become visible.” (UNODC, 2005a).
24
While it is very hard, if not impossible, to directly verify some of the
above explanations due to obvious reasons including the lack of price records and
transaction quantities at each of the different commercialization stages (or the
lack of access to the drug traffickers’ accounting books), the availability of better
and more reliable data on coca cultivation, yields, consumption, etc.–as it
becomes available–will help clarify the validity of other possible explanations.
Specifically, field studies in coca growing regions such as the ones currently being
cunducted by UNODC, will continue to help clarify whether there has been an
increase in yields, better planting techniques, etc. In other words, better
assesments of productivity parameters (and how they change over time) are key
to understanding the cocaine market. And, going back one step in the cocaine
production chain, field studies would be very helpful to confront the measures of
coca cultivation obtained from satellite images with those that would be obtained
directly in the fields. This is because, as explained above, there is anecdotal
evidence that coca growers have found ways to avoid being detected by the
satellite images, and therefore, the measures obtained from satellite pictures
might be biased downwards. Random, in-the-field measures will provide an
estimate of this bias. Also crucial for the analysis of the cocaine market is the
understanding of the response of drug producers to anti-drug policies. The
following section elaborates this point.
ANTIANTIANTIANTI----DRUG POLICIES IN PRODUCER COUNTRIESDRUG POLICIES IN PRODUCER COUNTRIESDRUG POLICIES IN PRODUCER COUNTRIESDRUG POLICIES IN PRODUCER COUNTRIES
Anti-drug policies in the three producer countries have had different
emphases in the past few years. In Colombia, anti-drug policies have focused on a
combination of strategies: from attempts to prevent coca cultivation (using aerial
spraying of herbicides over coca fields and alternative development and crop
substitution programs), to disrupting the cocaine manufacture and
commercialization chain (by interdicting drug shipments, destroying the
infrastructure used for cocaine production and transportation such as cocaine
processing laboratories, landing strips and small airplanes). In Bolivia and Peru,
25
where aerial spraying of herbicides is forbidden by the law, anti-drug policies
have focused mainly on alternative development programs and manual (forced or
voluntary) eradication campaigns. Interdiction of drug shipments, especially of
coca paste, has been an important component in the fight against cocaine
production in Peru and Bolivia, especially in the last few years where interdiction
has increased rapidly, probably due to the increased cultivation triggered by
higher prices of coca leaf in these two countries. Peru also made huge efforts at
the end of the nineties by disrupting the air bridge between coca base producers
and Colombian manufacturers of cocaine. According to most sources, it was the
combination of these policies, together with a set of well-targeted alternative
livelihood programs in coca growing regions that reduced coca cultivation in Peru
from 115,000 hectares in 1995 to about 48,000 in 2005.
In Bolivia and Peru, where many farmers’ livelihood depends on coca
cultivation, the government has implemented alternative development programs
in well-defined coca growing regions. These programs seek to provide the
necessary incentives so that farmers abandon coca cultivation and engage in the
cultivation of legal crops. These incentives take the form of monthly payments
for not engaging in coca cultivation and/or assistance in the development of new
(legal) agricultural activities. Although these programs have been relatively
successful at the local level, their dependence on continuing national and
international funding undermines their potential success in the long run.
Governments in the three producer countries often rely on funding from
developed countries to finance alternative livelihood programs and have to decide
which regions to allocate the scarce funding, at the expense of experiencing
increases in coca cultivation in those regions that cannot be targeted with these
programs (UNODC, 2005a). For instance, after the implementation of alternative
development programs in Aguatya and Bajo Huallaga (the two regions in Peru
with the largest proportion of coca cultivation during the nineties), coca
cultivation had almost disappeared by 2004. Nevertheless, the high prices of coca
leaf induced coca growers in other regions without any form of government
attention (in the form of alternative programs, health and education services,
26
etc.) to increase coca cultivation. As a result, coca cultivation, if anything, has
remained relatively stable in Peru during the last six years.
UNODC together with government agencies in producer countries collect
statistics on the number of eradicated hectares of coca crops. As explained before,
in Peru and Bolivia eradication is done manually, whereas in Colombia it is
mostly done by aerial spraying of herbicides in the coca fields.33 This accounts for
the difference between the average number of eradicated hectares per year in
Bolivia (about 10,100 has per year between 1999 and 2005) and Peru (about
9,800 has per year), compared to Colombia (close to 110,000 has per year).
Eradication in the three countries is undertaken by governmental entities
(DIRECO in Bolivia, DIRAN–Antinarcotics Police–in Colombia, and CORAH
and DEVIDA for forced and voluntary eradication respectively in Peru) with
technical and financial support from the US government. Figures 13 (a, b, and c)
show the number of eradicated hectares, as reported by each of the governmental
entities in charge of eradication in Bolivia, Colombia and Peru respectively,
together with the estimated number of hectares cultivated with coca bush for the
each of three producer countries, as reported by UNODC.
As the aerial eradication campaigns in Colombia were intensified after the
implementation of Plan Colombia, those individuals and organizations who
benefit from coca cultivation (and cocaine production) have figured out ways of
counteracting these campaigns. Because spraying with aerial herbicides is
prohibited in national parks in Colombia, there has been a rapid increase in coca
cultivation in National Parks.34 The same pattern has been observed in Bolivia
and Peru, where farmers have sought remote or protected areas for coca
cultivation as a result of the government’s pressure to reduce coca cultivation in
the existing centers of cultivation. According to UNODC (2005b), between 2003
and 2004, cultivation in national parks in Bolivia increased by more than 70%
and, during the same time, cultivation increased by 53% in protected and forest
areas in Peru (see UNODC (2005b) for Bolivia and Peru)).
33 See González (2006) for a thorough description of aerial eradication programs in Colombia. 34 However, at the time this chapter was being written, the Colombian government was evaluating the possibility of lifting the ban on aerial eradication campaigns in national parks.
27
Individuals involved in the cocaine production business have created many
other ways of counteracting eradication campaigns: prune operations right after
aerial spaying (where the coca plant is cut at one foot above the ground and then
grows rapidly), intermingling coca crops with legal crops to avoid being detected,
spraying coca plants with substances such as molasses to prevent the herbicide
from destroying the leaves of the plant, and the development of genetically
modified coca plants that supposedly are resistant to the herbicides currently
being used.
But aerial spraying, forced eradication, and alternative development
programs are not the only measures taken by producer countries to fight illegal
drug production and trafficking. Other policies include, but are not limited to:
curtailing the flow of raw materials used in the cultivation of coca and the
processing of cocaine, discovering and destroying the small local workshops and
laboratories where coca base is processed, destroying the landing strips used by
trafficking organizations to ship drugs, interdicting drug shipments, dismantling
the drug cartels and the networks and (many times fake) firms that are created
for the money laundering of the proceeds obtained from the (huge) profits
derived from illegal drug trafficking.
Available measures of the efforts undertaken in these other fronts on the
war on drugs show an increasing number of operations against the different links
in the cocaine production and trafficking chain. For instance, coca base and
cocaine seizures have increased in the past few years in all the producer
countries. Figures 14 (a) and (b) show coca base and cocaine seizures in Bolivia
and Colombia respectively. Other measures such as the number of destroyed
illegal laboratories used for processing coca paste and cocaine also show
increasing efforts to combat illegal drug production (see Figures 15 (a) and (b)
for Bolivia and Colombia respectively35).36 Cocaine seizures have increased rapidly
35 For Peru, the numbers of illegal laboratories destroyed are: 964 in 2003 and 861 in 2004. 36 See the UNODC (2005b - Coca Cultivation Surveys for each of the producer countries) for other measures of recent success in the war against cocaine production and trafficking. For the case of Colombia, the Dirección Nacional de Estupefacientes – DNE publishes every year a summary of results in the war against illegal drug production in Colombia (see DNE, 2004).
28
in the three producer countries as well as in the US in the last few years (see
Figure 16).
Side effects of antiSide effects of antiSide effects of antiSide effects of anti----drdrdrdrug policiesug policiesug policiesug policies
The implementation of anti-drug policies has important side effects in
producer countries. Forced eradication measures (either manual or through aerial
spraying campaigns) target, by definition, the first link in the cocaine production
chain. But one can argue, perhaps convincingly, that of all those involved in
cocaine production and commercialization, the peasants are perhaps the ones who
receive the fewest benefits. Most coca cultivation in the three producer countries
takes place in remote and isolated areas that lack any form of government
infrastructure, public education, or health services.37 In other words, eradication
measures target those who are most vulnerable to negative income shocks and, as
a result, have created social pressure against them, which has many times
resulted in uprising and riots such as the ones recently observed in Bolivia.38 As
Sherret (2005) suggests, the lack of coordination between aerial spraying
campaigns (or any form of forced eradication), alternative development programs,
and state-financed development infrastructure in the coca growing areas
evidences “a larger pattern of neglect and disregard for those affected by
centrally directed policies.” (Sherret, 2005, p. 164).
One of the most debated issues regarding the side effects of anti-drug
policies has to do with the environmental effects of aerial spraying of herbicides
to destroy coca bushes in Colombia. Considerable debate has been generated, in
Colombia and abroad, over the use of aerial spraying of herbicides to combat
illegal drug production. As Lauret Sherret noted recently, “The controversy over
the health effects of the use of glyphosate herbicides often centers on anecdotal
evidence gathered from people living in the areas subject to fumigation versus the
scientific evidence obtained from laboratory experimentation..., and when the
37 See Contraloria General de la República (2001). 38 See Stoner (2004) and Lindsay (2003).
29
political agendas (of the interested parties) are taken into account, the layers of
complexity around this problem are only exacerbated” (Sharret, 2005, p. 157).
The Anti-Narcotics Police in Colombia have used aerial fumigation for
more than a decade, but since the implementation of Plan Colombia (with strong
funding from the US) aerial spraying campaigns have intensified, especially in the
southern part of the country where most of the coca is produced. A formula
known as Roundup (a mixture of glyphosate, the active ingredient in the
herbicide, and Cosmo-Flux, a surfactant that is used to aid the herbicide in
penetrating the waxy cuticle of coca leaves) is used by the Antinarcotics Police in
the aerial eradication campaigns. It affects the leaves of the coca plants, but not
its roots or the soil, and as a result, “the bush can be subject of a prune
operation at about one feet over the ground to obtain a renewal of the bush in
about six months.” (UNODC, 2005b). With an herbicide concentration of 10.4
liters per hectare of coca approved by the Colombian Anti-Narcotics Council, the
spraying effectiveness is estimated to be above 90%. Common effects on humans,
as reported by those people affected, are fever, eye irritation, gastrointestinal
irritation and diarrhea, skin irritation, and dizziness.
However, the available evidence regarding the effect of aerial spraying of
Roundup is quite diverse. A recent study by OEA (2005) argues that the health
effects on people from the use of glyphosate and Cosmo-Flux are minimal, and
the exposure and frequency of exposure are very low. The same study also argues
that the effects on wildlife, mammals, and birds are negligible. This study only
finds evidence of a moderate adverse effect on some aquatic animals in those
localities where coca is grown and where still water is present. Yet, another
report prepared by the Center for International Policy (CIP) and NGO’s from
Colombia and Ecuador, argues against the use of the Roundup formula for aerial
eradication of coca crops because it “has not been subject to scientific studies to
determine its effects on the environment and human health, which goes against
the principle of environmental precaution” (CIP, 2004, p. 139, author’s
translation). The study cites evidence from peasants who claim to have been
affected by aerial spraying campaigns in different ways: skin irritation, allergies,
30
eye, nose and throat irritations, nausea, and diarrhea.39 The study also repeatedly
argues that the aerial campaigns in Putumayo and Caqueta, the departments in
southern Colombia with the highest density of coca cultivation in the peak years
of 2000 and 2001, have been indiscriminate and many times have destroyed legal
crops, such as yucca, sugar cane, and plantains, which, according to anecdotal
evidence from the peasants cited in the report, leaves them without any means of
subsistence. Although CIP’s report extensively describes the effects of aerial
fumigation with glyphosate on human health and the environment, it barely
mentions the negative environmental effects that coca cultivation and cocaine
production themselves have on the environment.
Perhaps the most independent and thorough review on the environmental
and health effects of aerial spraying of glyphosate is that of Sherret (2005). This
study explains the crucial distinction between the active herbicide (glyhosate)
and its commercially available formulations. The distinction is important because
the formula (which, as explained before, is a combination of glyphosate and
surfactants) exhibits synergism–when the observed effects of two chemicals
being used together is greater than the effects of those chemicals used
individually. Many times, the instructions for use of glyphosate and its
formulations are violated, a point that is shared by most of the studies (see, for
instance, Sherret, 2005 and CIP, 2004), and it is precisely the misuse of the
herbicide that causes harmful health and environmental effects. For instance,
among the many instructions stated by the manufacturer of the formula used in
Colombia, it is stated that Roundup should be applied at distances not longer
than 2 to 3 meters from the tallest plant, a recommendation that is many times
violated, not only because of difficult topographic conditions, but most of the
times to reduce the probability of airplanes used for spraying campaigns being hit
by gunfire from the illegal organizations that benefit from the cocaine production
and trafficking business. As a result of being unable to spray coca crops from the
39 According to Sherret (2005), “The governments of Colombia and the US have claimed on numerous occasions that supporters of the insurgent and counterinsurgent groups, who derive much of their income from the narcotics industry, are responsible for most of the health complaints that have received so much attention.”
31
recommended height, oftentimes the herbicides end up affecting legal crop
plantations, water sources, and other sites not targeted by the aerial eradication
campaigns.
The study by Sherret (2005) also emphasizes the fact that the most
harmful environmental effects, so far identified by scientific evidence, are on
aquatic organisms and amphibians, when glyphosate formulations are, perhaps
mistakenly, applied to aquatic ecosystems.
The environmental costs of cocaine production are also an important side
effect of anti-drug policies. More precisely, the criminalization of coca cultivation
and cocaine production also create environmental costs because. Because cocaine
production is illegal, it is an activity which is not subject to government
environmental regulations. According to John Walters, the director of ONDCP,
“600 million liters of so-called precursor chemicals are used annually in South
America for cocaine production. To increase yields, coca growers use highly
poisonous herbicides and pesticides, including paraquat. Processors also
indiscriminately discard enormous amounts of gasoline, kerosene, sulfuric acid,
ammonia, sodium bicarbonate, potassium carbonate, acetone, ether, and lime
onto the ground and into nearby waterways.” (Walters, 2002). Although John
Walters uses this evidence to complain to those who criticize the aerial
eradication campaigns, both the environmental costs of aerial eradication, and of
coca cultivation and cocaine production have a more fundamental root: the illegal
nature of these activities. If cocaine production were legalized, the cultivation of
coca and the production of cocaine would be managed as any other crop. They
would be regulated, and no chemicals would have to be sprayed to destroy the
crops. Further and independent research is needed to estimate and better
understand not only the environmental effects of aerial spraying of glyphosate,
but also the environmental costs of cocaine production. Together they will
provide a picture of the environmental costs of the criminalization of coca
cultivation and cocaine production.
But eradication measures are not the only measures that generate
resistance and controversy due to its side effects. Policies such as those
32
implemented by the Peruvian government during the second half of the nineties,
which aimed at closing the air bridge used to transport unrefined coca paste from
coca growing regions in Peru to refining laboratories in Colombia, did not escape
fatal accidents. Closing the air bridge not only involved destroying landing strips
(which were easily constructed somewhere else at a relatively low cost) but also
shooting down small airplanes suspected of carrying illegal drugs. However, the
airplanes that were shot down by the Peruvian Air Force (using information
provided by US surveillance planes) were not always carrying illegal drugs, and
sometimes resulted in deadly accidents involving innocent people. 40
THE SUSTAINABILITY AND FUTURE PROSPECTS OF ANTITHE SUSTAINABILITY AND FUTURE PROSPECTS OF ANTITHE SUSTAINABILITY AND FUTURE PROSPECTS OF ANTITHE SUSTAINABILITY AND FUTURE PROSPECTS OF ANTI----DRUDRUDRUDRUG G G G
POLICIESPOLICIESPOLICIESPOLICIES
There are perhaps too many issues regarding the sustainability of anti-
drug policies in producer countries to be discussed in this chapter. However it is
worth mentioning a few. On one hand, there is the question of who should bear
the costs of alternative livelihood programs and eradication activities? Producer
or consumer countries? While governments in the producer countries face internal
pressure from farmers who claim, perhaps sincerely, that their only way of
subsistence is the cultivation of coca41, they also face external pressure from the
consumer countries to fight against the production of illegal drugs (in the form,
for instance, of the threat of being labeled a “narco-state” by the international
community, or of not being “certified” by the United States’ State Department
each year). But, besides being an illegal activity, cocaine production and
trafficking have had direct links with terrorist and insurgent activities, especially
in the case of Colombia. Most probably, if producer countries stop fighting the
drug trade and consumer countries do not penalize them for doing this, the price
of cocaine would drop dramatically and the drug business would no longer be a
source of financial resources for illegal armed groups in producer countries.
40 See, for instance, Kawell (2001). 41 See CIP (2004).
33
There is enough evidence of the involvement of guerrilla and paramilitary groups
in illegal drug production and trafficking to finance their war against each other
and against the Colombian state.42
The funds to fight against the production of illegal drugs are limited and
many times the governments in producer countries have to sacrifice other,
perhaps more productive, investments in order to finance the war against drugs.
Also, funds provided by consumer countries (mostly developed economies) are
often earmarked to be spent on predetermined activities, which leave little or no
room for governments to allocate the funds to its most productive use in the war
against drugs. In Colombia, for instance, most of the support provided by the US
government comes in the form of small airplanes that can only be used for the
spraying of herbicides in coca fields, in training programs for the pilots, and in
the form of technical support to identify coca fields. These imposed political
constraints create inefficiencies in the allocation of funds,43 as well as
environmental and social problems in the producer countries, which are not taken
into account by the producer countries at the time of earmarking the aid for
specific anti-drug policies.
The last section posed some questions regarding the side effects (costs) of
anti-drug policies (on health, the environment, and the fiscal sustainability), but
any analysis of their sustainability should also evaluate their results. The fact
that cocaine is an addictive drug is perhaps the crucial determinant of how
effective the reduction of cocaine supply is in decreasing the availability of illegal
drugs in the consumer countries. As Echeverry (2004) argues, “the efficacy (of
the war on drugs) lies on a variable that measures consumer’s responsiveness to
price increases, i.e. the price elasticity of demand”.44 The rationale for this
argument is very simple: if the elasticity of demand for illegal drugs — which
captures the percentage increase in demand due to a 1% decrease in the price — is
low enough (which, at first sight, seems to be the case for those goods that create
42 See, among others, Rangel (2000), Rabasa and Chalk (2001), Thoumi (2003), Bottía (2003), and Diaz
and Sanchez (2004). 43 See Grossman and Mejía (2007). 44 See Becker et al. (2004).
34
addiction) so that any decrease in the supply would translate into a sufficiently
large increase in the price of illegal drugs, then those policies aimed at reducing
illegal drug production may be self-defeating, as they create a greater incentive
for producing (and trafficking) the good. In other words, the same policies that
aim to reduce the supply of illegal drugs, by inducing further increases in the
price, fuel more production and lead to more violence.45 However, the scarcity of
data on prices and quantities of cocaine transacted makes available estimates of
the price elasticity of demand unreliable. While most available empirical studies
have found a short-run elasticity of demand less than one in absolute value
(Saffer and Chaloupka, 1999; Chaloupka et al., 1999; DeSimone and Farrelly,
2003), other studies have found evidence of a higher response of cocaine demand
to price changes (Caulkins, 1996). Using a rational addiction framework (where,
in addition to the goods being addictive, peer pressure to consume the good plays
an important role, and current consumption does not only depend on past but
also on future consumption),46 Grossman and Chaloupka (1998) estimate a long-
run price elasticity of demand for cocaine of about —1.35.47 Whether the price
elasticity of demand for cocaine is higher than one in absolute value, or whether
this is true in the short or in the long run, should be on the agenda for future
research as better data becomes available. But, even if it were true that cocaine
demand is elastic to price changes in the long run, there is still the question of
whether producer countries can sustain the high levels of expenditures (in
eradication programs, alternative development projects, interdiction efforts, etc.)
observed in the last few years in the war against cocaine production and
trafficking.48 Also important is the evaluation of the results and, as mentioned
above, the understanding of those measures taken by drug producers and
traffickers to counteract anti-drug policies. As we saw before, although
eradication measures undertaken under Plan Colombia have decreased the
number of cultivated hectares, drug producers have responded with better
45 See the framework developed in Becker et al. (2004). 46 See Becker and Murphy (1988). 47 However, when individual-specific fixed effects are included, this elasticity reduces to about –0.67. See also a related explanation in DeSimone and Farrelly (2003). 48 See Echeverry (2004).
35
planting techniques, have moved to new territories, have come up with coca
plants that have a much higher yield, etc. The reason for these responses is very
simple: because cocaine production and trafficking is illegal, the profit margins
are huge (the price of 1 gram of cocaine in producer countries is approximately
one tenth of its weight in gold and that same gram in the streets of Chicago or
New York sells for as much as ten times its weight in gold) and, thus, the
resources that drug producers are willing to invest in counteracting anti-drug
policies are also huge.
Yet another argument for the limits of supply side controls says that these
policies are doomed from the beginning, because prices of coca leaf are just a
negligible fraction of retail prices in consumer countries (the costs of coca leaf
required to produce one kg of cocaine is between $300 and $500, whereas that
kilogram at the retail level could sell at $150.000 in the US at average purity
levels).49 The argument is that even if refiners had to pay twice or three times as
much to purchase the coca leaf required to produce one kilogram of cocaine, and
if this extra cost is passed along, the increase in retail prices would be negligible.
As a result, “if retail prices do not rise, then total consumption in the United
States will not decline as a consequence of eradication.” (Reuter, 2001, p. 19).
According to the same author, alternative development programs are also subject
to the same incompleteness as that for eradication, because they assume that
cocaine refiners will not increase the price sufficiently to tempt farmers back to
coca growing.
On one hand, any sound and sustainable policy that aims at reducing
cocaine production and trafficking by fighting the first link in the chain (coca
cultivation) should, at least, coordinate strategies between the carrots (such as
the provision of incentives to farmers to abandon coca cultivation through
alternative livelihood opportunities, and better education and public health
provision) and the sticks (the credible commitment on the part of the
government of being not only willing, but also able, to take measures such as
forced eradication and interdiction measures to sufficiently increase the costs of
49 See Reuter (2001).
36
engaging in the production of cocaine). On the other hand, if consumer countries
are unwilling to take measures such as legalizing the use of illegal hard drugs (as
seems to have been the case), but at the same time want to reduce the inflow of
these illegal drugs to their markets, increasing amounts of funds will be
necessary, not only to finance the implementation of anti-drug policies to curtail
production and trafficking in producer countries, but also to implement policies
aimed at reducing the demand for illicit drugs. Policies aimed at teaching
potential cocaine users about the dangers induced by the consumption of cocaine,
and at treating hard core cocaine users seem to be much more cost effective than
trying to curtail the supply of cocaine at its source. A recent study by Caulkins,
et al. (2005) finds that consumption can be reduced more cheaply in the United
States by treating heavy users than by three alternative enforcement measures
usually carried out: control of supply in the producer countries, interdiction of
drug shipments and drug seizures, and conventional enforcement measures.
Demand reduction programs have a wide range of action. Among others they
seek to prevent and reduce the use of illicit drugs, treat the addicted and reduce
the consequences of drug abuse, and increase the public’s awareness of
vulnerability and risks associated with drug consumption by disseminate
information regarding the harmful effects of drugs in local communities and
schools. Policies aimed at reducing consumption also make it less likely that drug
users switch to alternative drugs when the one they are using is not available.
If the legalization of drugs is not possible, perhaps due to political agendas
in consumer and producer countries, efforts to reduce the supply and the demand
should be undertaken together. That is, each one carried out in isolation will not
work because they are complementary. For instance, in times of supply shortages
drug prices may increase and purity levels decline, and it is more likely that,
first, chronic users will seek treatment, and, second, potential new users will have
less opportunity to obtain drugs. Also, as the demand for cocaine goes down as a
result of programs to reduce consumption, there are fewer addicts and the
criminal networks in charge of selling drugs might be weakened, which in turn
makes it more costly for drug traffickers to smuggle illicit drugs and to make
37
them available to consumers. Drug substitution therapies and personalized
therapeutic programs decrease the cost to drug addicts of seeking treatment and
decrease the number of users under the influence of criminal organizations, which,
in turn has implications for the cost to criminal organizations of supplying
drugs.50
CONCLUDING REMARKSCONCLUDING REMARKSCONCLUDING REMARKSCONCLUDING REMARKS
“Many tens of billions” is probably the right figure for cocaine
expenditures per year in consumer countries.51 Close to 14 million people are
cocaine consumers in the world. Two thirds of these are in the Americas. Only
three countries in the world produce cocaine: Bolivia, Colombia and Peru.
Potential cocaine production in 2004 was estimated to be about 650 metric tons.
A pure gram of cocaine is worth, at the retail level in consumer countries, as
much as ten times its weight in gold. In producer countries, the same gram is
worth, on average, slightly more than one tenth of its weight in gold. While
these figures might be striking enough by themselves to generate interest in the
topic, they hide huge complexities. Clearly, a thorough understanding of those
complexities requires accurate data and relevant information about the market
for cocaine.
The main purposes of this chapter was to provide a thorough review of
what we know (and what we do not) about cocaine production and trafficking.
By describing the available data on cocaine production and trafficking, the
collection methodologies, and some of the possible biases (and what may cause
them), we have taken an important step toward understanding the complexities
and puzzles that should drive future research into our knowledge of illegal drug
production and trafficking. Additionally, the chapter described some puzzles that
arise from the available data, and studied some of the hypotheses that may help
explain these puzzles. Furthermore, the chapter explained the policies to fight
against cocaine production and trafficking implemented in producer countries, the
50 See INCB, 2004. 51 $35 billion is the low-end estimate and $115 billion the high-end estimate (see Reuter and Greenfield, 2001)
38
results of these policies, and the role of consumer countries in their
implementation. Finally, the chapter reviews and studies the side effects,
sustainability, and future prospects of anti-drug policies.
REFERENCESREFERENCESREFERENCESREFERENCES
Becker, G. and K. Murphy (1988); A Theory of Rational Addiction, Journal of
Political Economy, 96, pp. 675-700.
------ and M. Grossman (2004); The Economic Theory of Illegal Goods: The Case
of Drugs, NBER WP #10976, Cambridge, MA.
Bottía, M. (2003); La presencia y expansión municipal de las FARC:
Es avaricia y contagio, más que ausencia estatal, Working Paper 2003-03, CEDE,
Universidad de los Andes, March.
Caulkins, J. (1994); Developing Price Series for Cocaine. Santa Monica, CA,
RAND.
---- (1996); Estimating Elisticities of demand for Cocaine and heroin with DUF
Data, Working Paper, Carnegie Mellon University.
Caulkins, J. and P. Reuter (1998); What Price Data Tell us About Drug
Markets, Journal of Drug Issues, Vol. 28, 3, pp. 593-613.
Caulkins, J., Reuter, P., Iguchi, M., and Chiesa, J. (2005); How Goes the “War on Drugs”? An Assessment of US Drug Problems and Policy, RAND occasional paper series.
39
Center for International Policy — CIP (and other NGO’s) (2004); Informe de la
misión de observación sobre los efectos del Plan Colombia en los departamentos
de Nariño y Putumayo, November.
Available at: http://www.ciponline.org/colombia/0404mision.pdf
Central Intelligence Agency (2004); Coca fact paper: a primer.
Available at: http://www.odci.gov/saynotodrugs/cocaine_q.html
Chaloupka, F., M. Grossman, and J. Tauras (1999); The demand of Cocaine and
Marihuana by Youths, in The Econometric Analysis of Substance Use and Abuse:
An Integration of Econometrics and Behavioral Economics Approaches,
Chaloupka et al. eds., University of Chicago Press, pp. 133-155.
Contraloría General de la Nación (2001); Plan Colombia. Primer informe de
evaluación, Bogotá.
Department of State (2005); International Narcotics Control Strategy
Report; Remarks at Special Briefing; Washington, DC.
DeSimone, J. and M. Farrelly (2003); Price and Enforcement Effects on Cocaine
and Marihuana Demand, Economic Inquiry, 41(1), pp. 98-115.
Díaz, A.M. and Sanchez, F. (2004); Geography of Illicit Crops and Armed
Conflict in Colombia (in Spanish), Working Paper 2004-18, CEDE,
Universidad de los Andes, March.
Dirección Nacional de Estupefacientes (Colombia) (2004); Acciones y Resultados
2003.
Available at:
http://www.cultivosilicitoscolombia.gov.co/documentos/lb2003.pdf
40
Echeverry, J.C. (2004); Colombia and the War on Drugs: How Short is the Short
Run?, Documento CEDE #13, Bogotá.
General Accounting Office (GAO) (2003); Drug Control: Coca Cultivation and
Eradication Estimates in Colombia, Draft Report, GAO-03-319R, Washington,
DC.
González, S. (2006); El Programa de Erradicación de Cultivos Ilícitos Mediante Aspersión Aérea de Glifosato: hacia la clarificación de la política y su debate, Centro de Estudios y Observatorio de Drogas y Delitos —CEODD, Facultad de Economía, Universidad del Rosario, Bogotá.
Grossman, H. and D. Mejía (2005); The War Against Drug Producers, Economics
of Governance, in press.
Grossman, M. and F. Chaloupka (1998); The Demand for Cocaine by Young
Adults: A Rational Addiction Approach, Journal of Health Economics, 17,
August, pp. 427-474.
International Narcotics Control Board, INCB (2004); Integration of supply and demand reduction strategies: moving beyond a balanced approach, available at: http://www.incb.org/pdf/e/ar/2004/incb_report_2004_1.pdf
Jensema, E. and F. Thoumi (2004); Drug policies and the funding of the United
Nations Office on Drugs and Crime, mimeo.
Available at:
http://www.drug-policy.org/documents/Thoumi_Jensema_paper
Kawell, J. (2001); Closing the Latin American air-bridge: A disturbing history,
Foreign Policy, Info Focus, May.
Levitt, S. and S. Dubner (2005); Freakonomics: a rogue economist explores the
hidden side of everything, Harper Collins Publishers, New York, First Edition.
41
Lindsay, R. (2003); Bolivia coca growers fight eradication, Washington Times,
March 25th.
McDermott, J. (2004); New Super Strain of Coca Plant Stuns Anti-Drug
Officials, The Scotsman, Scotland, August 27.
Available at: http://www.mindfully.org/GE/2004/RoundupReady-
Coca27aug04.htm
University of Michigan (2004); Monitoring the Future, The University of
Michigan, Institute for Social Research.
Available at: http://www.monitoringthefuture.org/new.html
National Institute of Drug Abuse (2006); NIDA Info Facts: Cocaine.
Available at: http://www.nida.nih.gov/infofacts/cocaine.html
OEA (2005); Estudio de los efectos del Programa de Erradicación de Cultivos Ilícitos mediante la aspersión aérea con el herbicida Glifosato (PECIG) y de los cultivos ilícitos en la salud humana y en el medio ambiente. Washington, DC, March.
ONDCP (2002); Estimation of Cocaine Availability 1996-2000, Washington, DC,
March.
ONDCP (2004); National Drug Control Strategy, Washington, DC, March.
Available at:
http://www.whitehousedrugpolicy.gov/publications/policy/ndcs04/2004ndcs.pdf
---- (2005); 2004 Coca and Opium Poppy Estimates for Colombia and the Andes,
Press Release, March 25th.
Available at:
http://www.whitehousedrugpolicy.gov/news/press05/032505.html
42
Rabassa, Angel and Peter Chalk (2001); Colombian Labyrinth. RAND.
Rangel, A. (2000); Parasites and Predators: Guerrillas and the Insurrection
Economy of Colombia, Journal of International Affairs, 53(2), Spring, pp. 577-
601.
Reuter, P. (1999); Drug Use Measures: What Are They Really Telling Us?,
National Institute of Justice Journal, April, pp. 12-19.
Reuter, P. and V. Greenfield (2001); Measuring Global Drug Markets: How good
are the numbers and why should we care about them?. World Economics, Vol. 2
(4), October-December.
----- (2001); The Limits of Supply-Side Drug Control, The Milken Institute
Review, First Quarter.
Rocha, R. (2000); Algunos mitos y datos de la economía de la droga, Webpondo,
August.
Available at:
http://www.webpondo.org/files/Revista%20del%20Rosario.pdf
Substance Abuse and Mental Health Services Administration (SAMHSA) (2005);
The DASIS Report, January 28.
Available at:
http://oas.samhsa.gov/2k5/CocaineTX/CocaineTX.pdf
Saffer, H. and F. Chaloupka (1999); The Demand for Illicit Drugs, Economic
Inquiry, 37(3), pp. 401-411.
Sherret, L. (2005); Futility in Action: Coca Fumigation in Colombia, Journal of
Drug Issues, Winter, pp. 151-168.
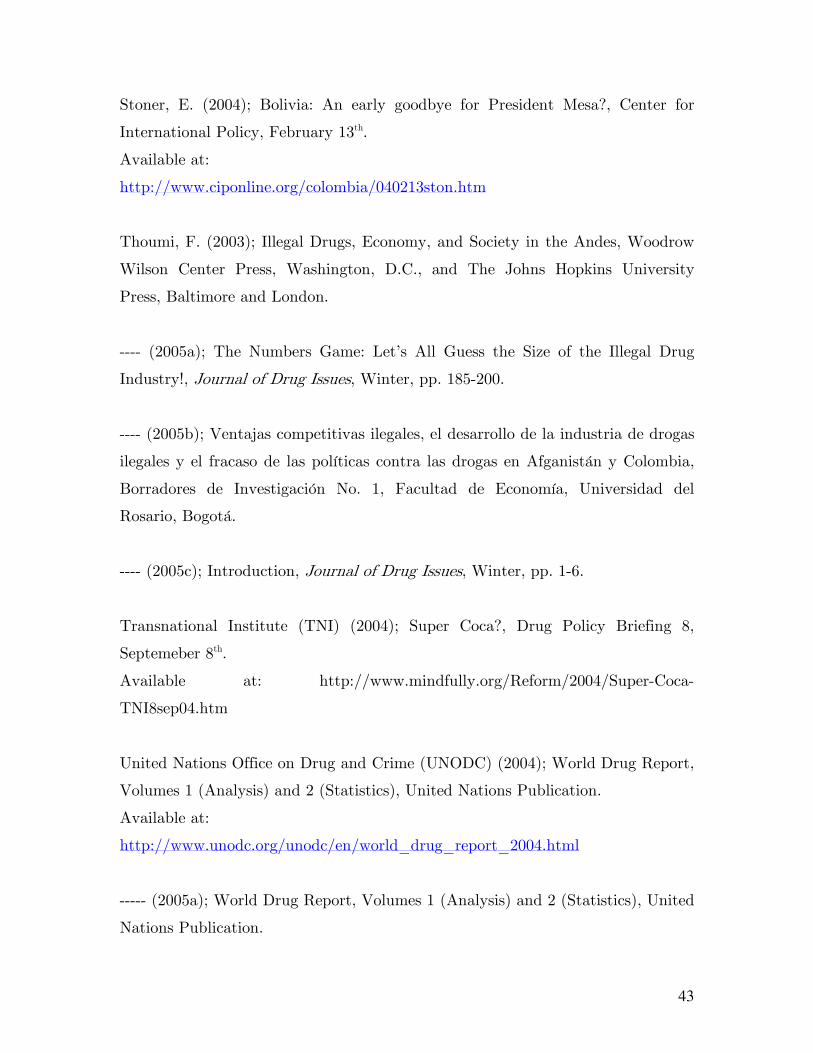
43
Stoner, E. (2004); Bolivia: An early goodbye for President Mesa?, Center for
International Policy, February 13th.
Available at:
http://www.ciponline.org/colombia/040213ston.htm
Thoumi, F. (2003); Illegal Drugs, Economy, and Society in the Andes, Woodrow
Wilson Center Press, Washington, D.C., and The Johns Hopkins University
Press, Baltimore and London.
---- (2005a); The Numbers Game: Let’s All Guess the Size of the Illegal Drug
Industry!, Journal of Drug Issues, Winter, pp. 185-200.
---- (2005b); Ventajas competitivas ilegales, el desarrollo de la industria de drogas
ilegales y el fracaso de las políticas contra las drogas en Afganistán y Colombia,
Borradores de Investigación No. 1, Facultad de Economía, Universidad del
Rosario, Bogotá.
---- (2005c); Introduction, Journal of Drug Issues, Winter, pp. 1-6.
Transnational Institute (TNI) (2004); Super Coca?, Drug Policy Briefing 8,
Septemeber 8th.
Available at: http://www.mindfully.org/Reform/2004/Super-Coca-
TNI8sep04.htm
United Nations Office on Drug and Crime (UNODC) (2004); World Drug Report,
Volumes 1 (Analysis) and 2 (Statistics), United Nations Publication.
Available at:
http://www.unodc.org/unodc/en/world_drug_report_2004.html
----- (2005a); World Drug Report, Volumes 1 (Analysis) and 2 (Statistics), United
Nations Publication.
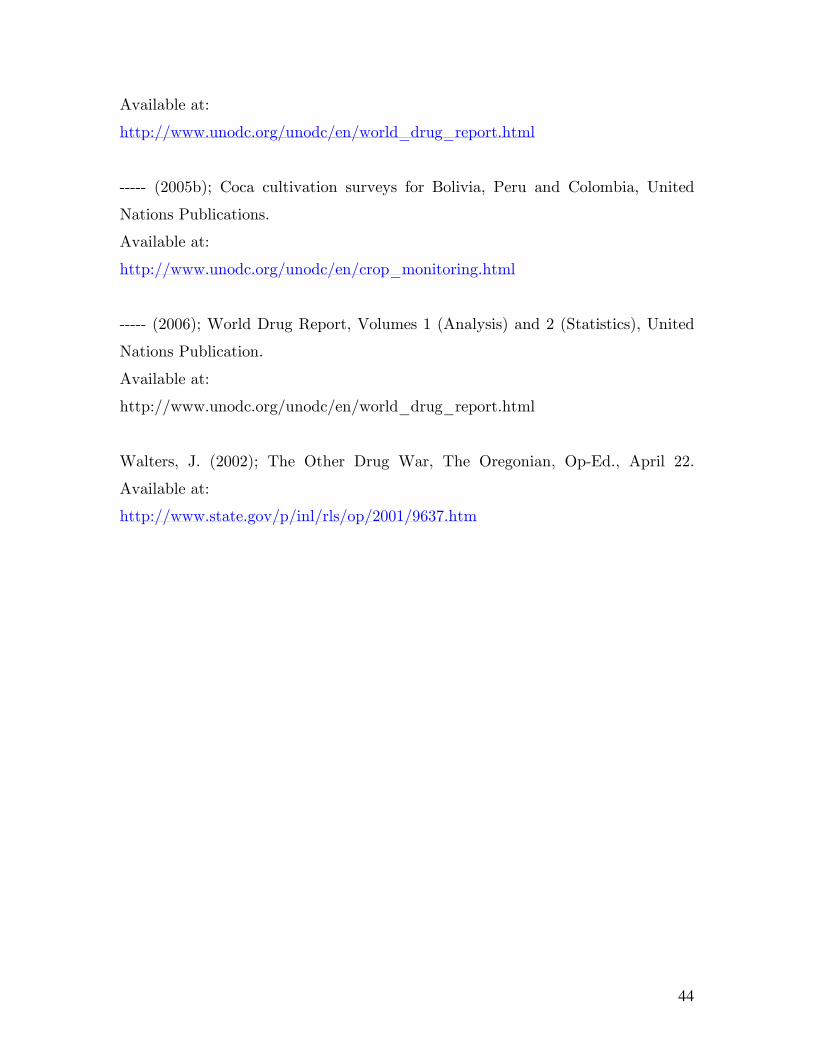
44
Available at:
http://www.unodc.org/unodc/en/world_drug_report.html
----- (2005b); Coca cultivation surveys for Bolivia, Peru and Colombia, United
Nations Publications.
Available at:
http://www.unodc.org/unodc/en/crop_monitoring.html
----- (2006); World Drug Report, Volumes 1 (Analysis) and 2 (Statistics), United
Nations Publication.
Available at:
http://www.unodc.org/unodc/en/world_drug_report.html
Walters, J. (2002); The Other Drug War, The Oregonian, Op-Ed., April 22.
Available at:
http://www.state.gov/p/inl/rls/op/2001/9637.htm
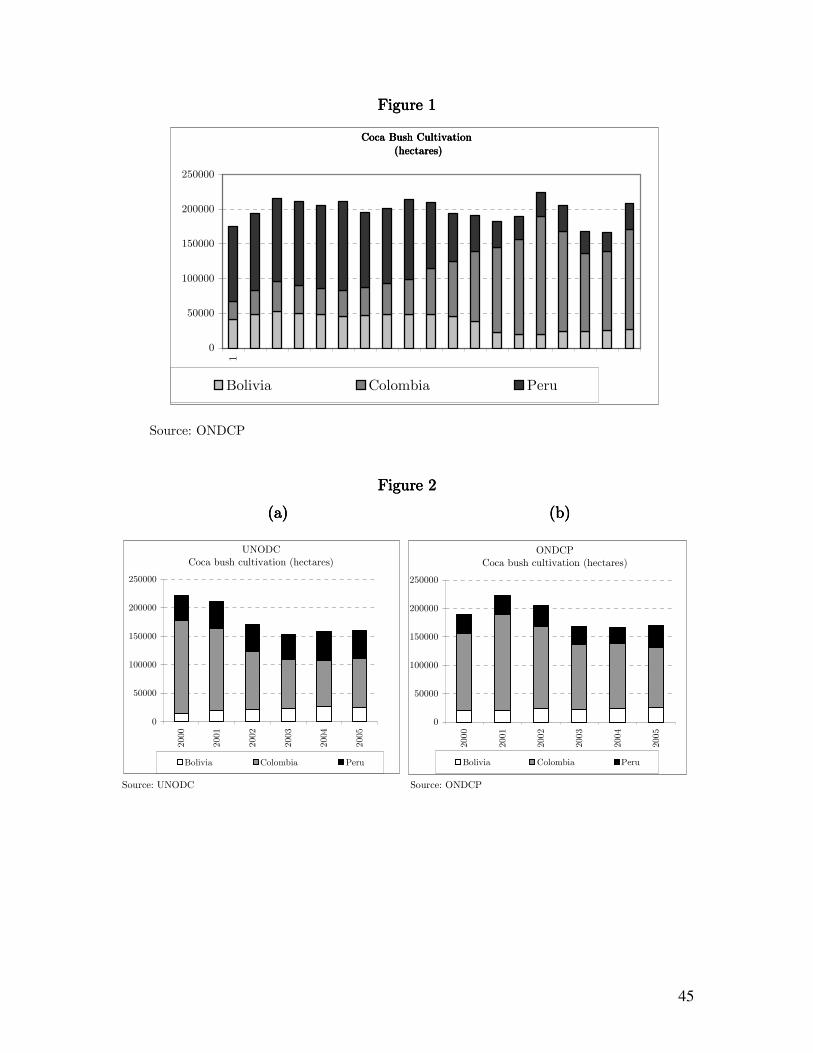
45
FiFiFiFigure 1gure 1gure 1gure 1
Source: ONDCP
Coca Bush CultivationCoca Bush CultivationCoca Bush CultivationCoca Bush Cultivation
(hectares) (hectares) (hectares) (hectares)
0
50000
100000
150000
200000
250000
1
Bolivia Colombia Peru
Figure 2Figure 2Figure 2Figure 2
(a)(a)(a)(a) (b)(b)(b)(b)
Source: UNODC Source: ONDCP
UNODCCoca bush cultivation (hectares)
0
50000
100000
150000
200000
250000
2000
2001
2002
2003
2004
2005
Bolivia Colombia Peru
ONDCPCoca bush cultivation (hectares)
0
50000
100000
150000
200000
250000
2000
2001
2002
2003
2004
2005
Bolivia Colombia Peru
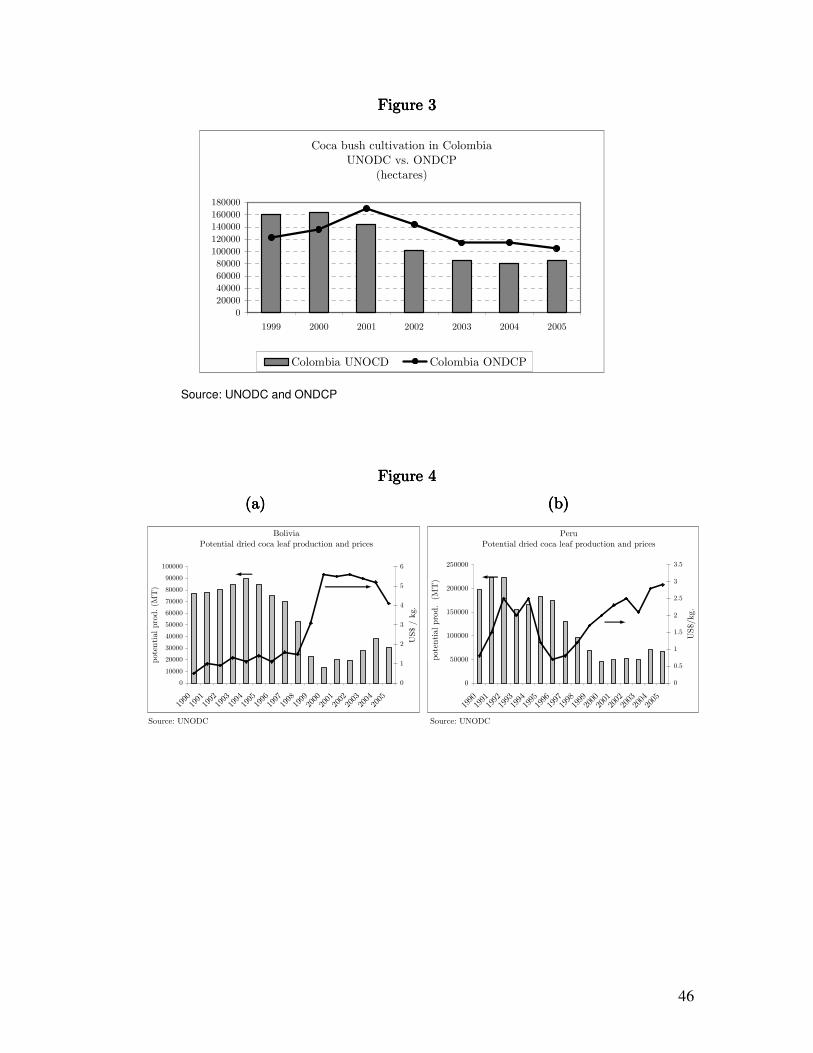
46
Figure 3Figure 3Figure 3Figure 3
Source: UNODC and ONDCP
Coca bush cultivation in Colombia UNODC vs. ONDCP
(hectares)
0
20000
40000
60000
80000
100000
120000
140000
160000
180000
1999 2000 2001 2002 2003 2004 2005
Colombia UNOCD Colombia ONDCP
Figure 4Figure 4Figure 4Figure 4
(a) (b)(a) (b)(a) (b)(a) (b)
Source: UNODC Source: UNODC
PeruPotential dried coca leaf production and prices
0
50000
100000
150000
200000
250000
1990199119921993199419951996199719981999200020012002200320042005
potential prod. (MT)
0
0.5
1
1.5
2
2.5
3
3.5
US$/kg.
BoliviaPotential dried coca leaf production and prices
0
10000
20000
30000
40000
50000
60000
70000
80000
90000
100000
1990199119921993199419951996199719981999200020012002200320042005
potential prod. (MT)
0
1
2
3
4
5
6
US$ / kg.
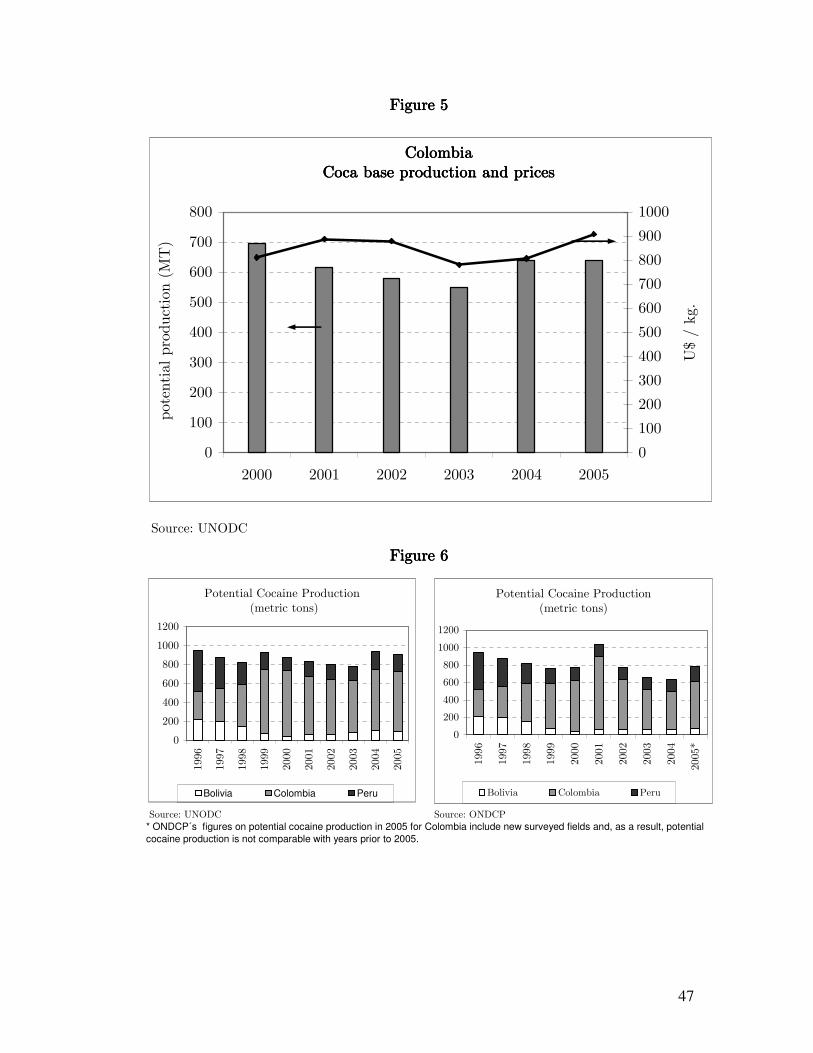
47
Figure 5Figure 5Figure 5Figure 5
Source: UNODC
Colombia Colombia Colombia Colombia Coca base production and prices Coca base production and prices Coca base production and prices Coca base production and prices
0
100
200
300
400
500
600
700
800
2000 2001 2002 2003 2004 2005
potential production (MT)
0
100
200
300
400
500
600
700
800
900
1000
U$ / kg.
Figure 6Figure 6Figure 6Figure 6
Source: UNODC Source: ONDCP* ONDCP´s figures on potential cocaine production in 2005 for Colombia include new surveyed fields and, as a result, potential
cocaine production is not comparable with years prior to 2005.
Potential Cocaine Production (metric tons)
0
200
400
600
800
1000
1200
1996
1997
1998
1999
2000
2001
2002
2003
2004
2005*
Bolivia Colombia Peru
Potential Cocaine Production (metric tons)
0
200
400
600
800
1000
1200
1996
1997
1998
1999
2000
2001
2002
2003
2004
2005
Bolivia Colombia Peru
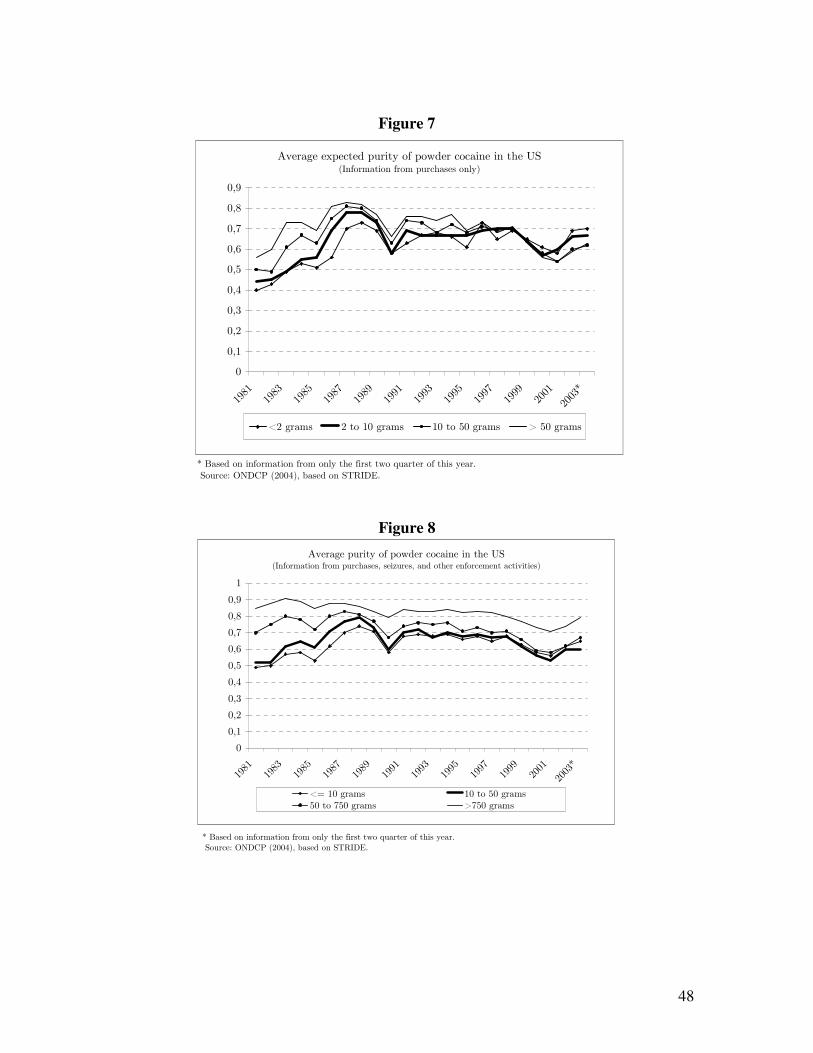
48
Figure 7
* Based on information from only the first two quarter of this year. Source: ONDCP (2004), based on STRIDE.
Average expected purity of powder cocaine in the US(Information from purchases only)
0
0,1
0,2
0,3
0,4
0,5
0,6
0,7
0,8
0,9
1981
1983
1985
1987
1989
1991
1993
1995
1997
1999
2001
2003*
<2 grams 2 to 10 grams 10 to 50 grams > 50 grams
Figure 8
* Based on information from only the first two quarter of this year. Source: ONDCP (2004), based on STRIDE.
Average purity of powder cocaine in the US(Information from purchases, seizures, and other enforcement activities)
0
0,1
0,2
0,3
0,4
0,5
0,6
0,7
0,8
0,9
1
1981
1983
1985
1987
1989
1991
1993
1995
1997
1999
2001
2003*
<= 10 grams 10 to 50 grams50 to 750 grams >750 grams
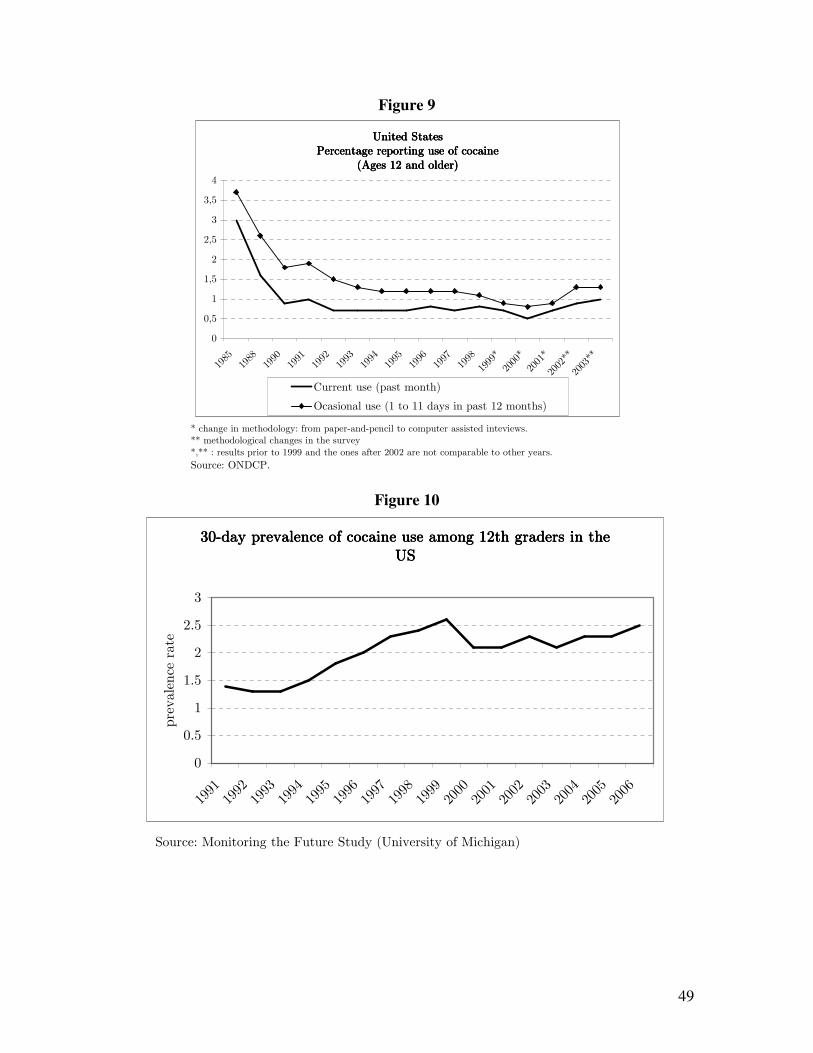
49
Figure 9
* change in methodology: from paper-and-pencil to computer assisted inteviews.** methodological changes in the survey
*,** : results prior to 1999 and the ones after 2002 are not comparable to other years.
Source: ONDCP.
United States United States United States United States Percentage reporting use of cocaine Percentage reporting use of cocaine Percentage reporting use of cocaine Percentage reporting use of cocaine
(Ages 12 and older)(Ages 12 and older)(Ages 12 and older)(Ages 12 and older)
0
0,5
1
1,5
2
2,5
3
3,5
4
1985
1988
1990
1991
1992
1993
1994
1995
1996
1997
1998
1999*
2000*
2001*
2002**
2003**
Current use (past month)
Ocasional use (1 to 11 days in past 12 months)
Figure 10
Source: Monitoring the Future Study (University of Michigan)
30-day prevalence of cocaine use among 12th graders in the 30-day prevalence of cocaine use among 12th graders in the 30-day prevalence of cocaine use among 12th graders in the 30-day prevalence of cocaine use among 12th graders in the USUSUSUS
0
0.5
1
1.5
2
2.5
3
1991199219931994199519961997199819992000200120022003200420052006
prevalence rate
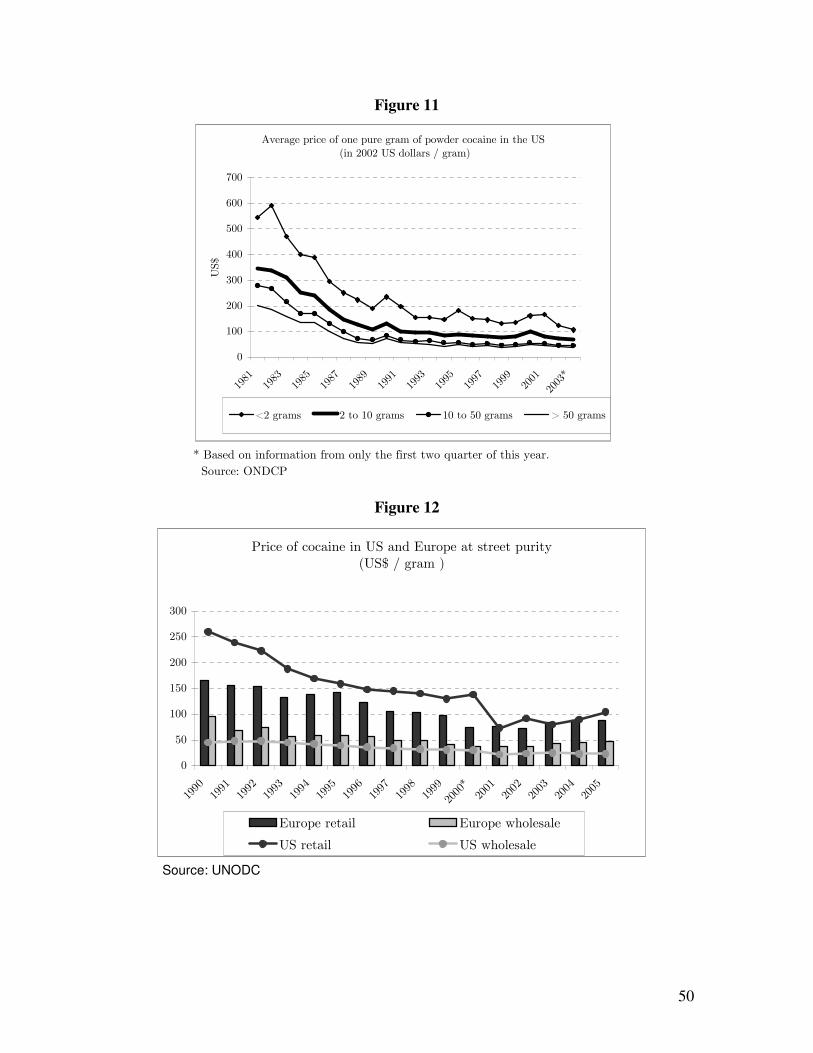
50
Figure 11
* Based on information from only the first two quarter of this year.
Source: ONDCP
Average price of one pure gram of powder cocaine in the US
(in 2002 US dollars / gram)
0
100
200
300
400
500
600
700
1981
1983
1985
1987
1989
1991
1993
1995
1997
1999
2001
2003*
US$
<2 grams 2 to 10 grams 10 to 50 grams > 50 grams
Figure 12
Source: UNODC
Price of cocaine in US and Europe at street purity (US$ / gram )
0
50
100
150
200
250
300
1990
1991
1992
1993
1994
1995
1996
1997
1998
1999
2000*2001
2002
2003
2004
2005
Europe retail Europe wholesale
US retail US wholesale
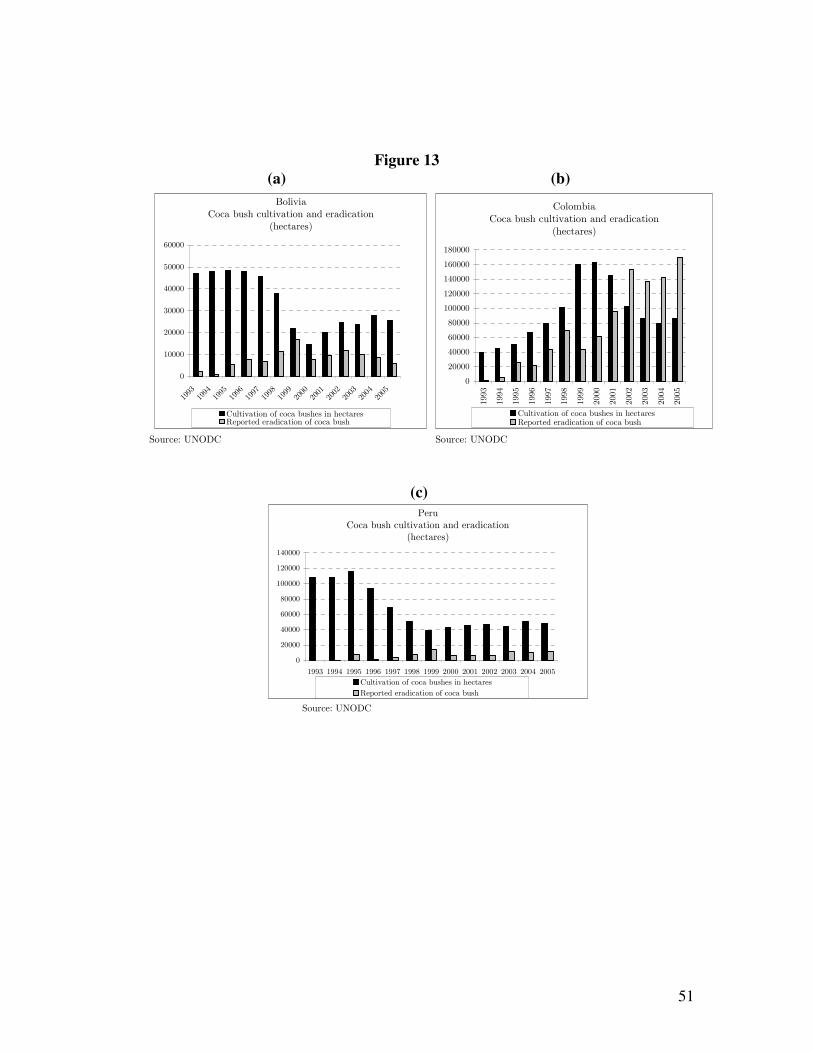
51
Figure 13
(a) (b)
Source: UNODC Source: UNODC
BoliviaCoca bush cultivation and eradication
(hectares)
0
10000
20000
30000
40000
50000
60000
1993199419951996199719981999200020012002200320042005
Cultivation of coca bushes in hectaresReported eradication of coca bush
ColombiaCoca bush cultivation and eradication
(hectares)
0
20000
40000
60000
80000
100000
120000
140000
160000
180000
1993
1994
1995
1996
1997
1998
1999
2000
2001
2002
2003
2004
2005
Cultivation of coca bushes in hectaresReported eradication of coca bush
(c)
Source: UNODC
PeruCoca bush cultivation and eradication
(hectares)
0
20000
40000
60000
80000
100000
120000
140000
1993 1994 1995 1996 1997 1998 1999 2000 2001 2002 2003 2004 2005
Cultivation of coca bushes in hectares
Reported eradication of coca bush
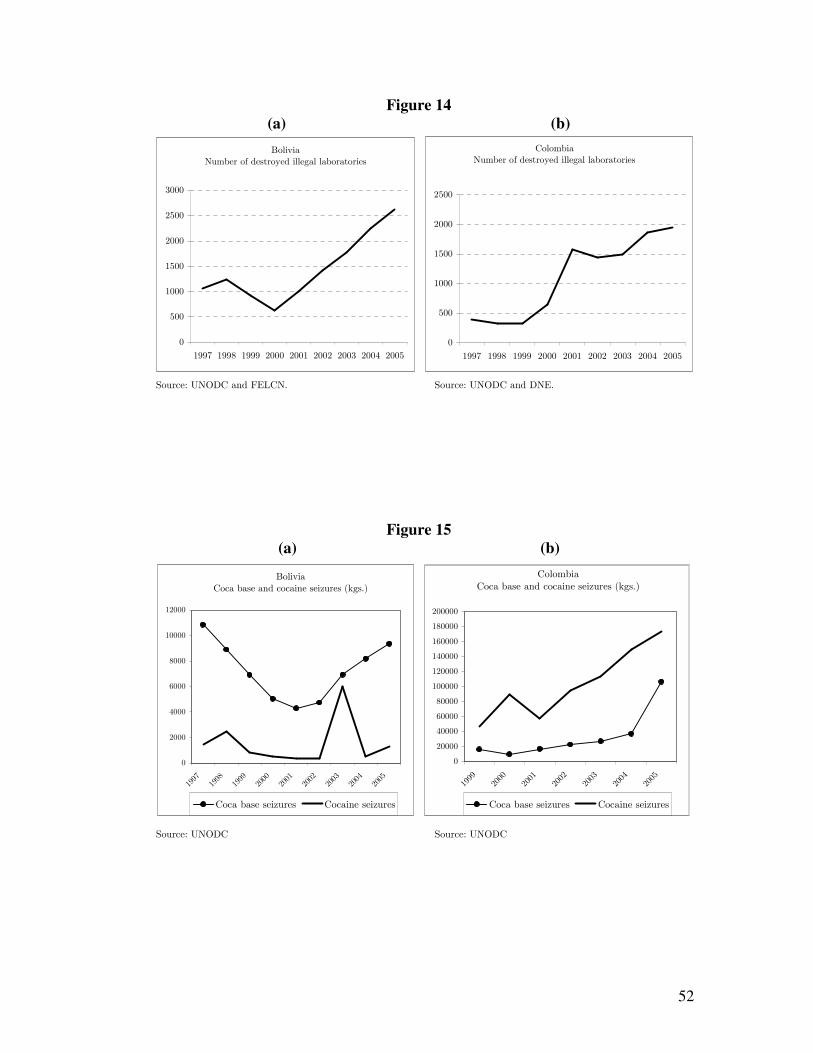
52
Figure 14
(a) (b)
Source: UNODC and FELCN. Source: UNODC and DNE.
Colombia Number of destroyed illegal laboratories
0
500
1000
1500
2000
2500
1997 1998 1999 2000 2001 2002 2003 2004 2005
Bolivia Number of destroyed illegal laboratories
0
500
1000
1500
2000
2500
3000
1997 1998 1999 2000 2001 2002 2003 2004 2005
Figure 15
(a) (b)
Source: UNODC Source: UNODC
Colombia Coca base and cocaine seizures (kgs.)
0
20000
40000
60000
80000
100000
120000
140000
160000
180000
200000
1999
2000
2001
2002
2003
2004
2005
Coca base seizures Cocaine seizures
Bolivia
Coca base and cocaine seizures (kgs.)
0
2000
4000
6000
8000
10000
12000
1997
1998
1999
2000
2001
2002
2003
2004
2005
Coca base seizures Cocaine seizures
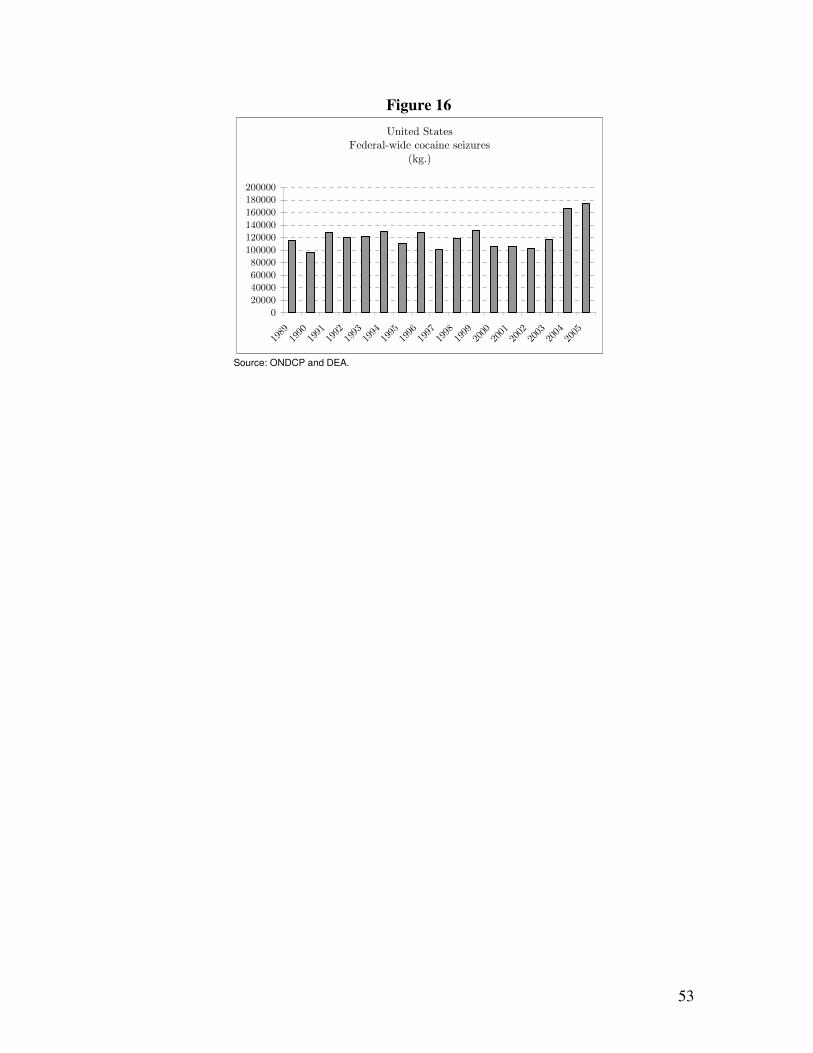
53
Figure 16
Source: ONDCP and DEA.
United StatesFederal-wide cocaine seizures
(kg.)
0
20000
4000060000
80000100000
120000140000
160000
180000200000
19891990199119921993199419951996199719981999200020012002200320042005