Coca -Cola European Partners · 2019-09-18 · Coca-Cola European Partners plc is a leading...
30
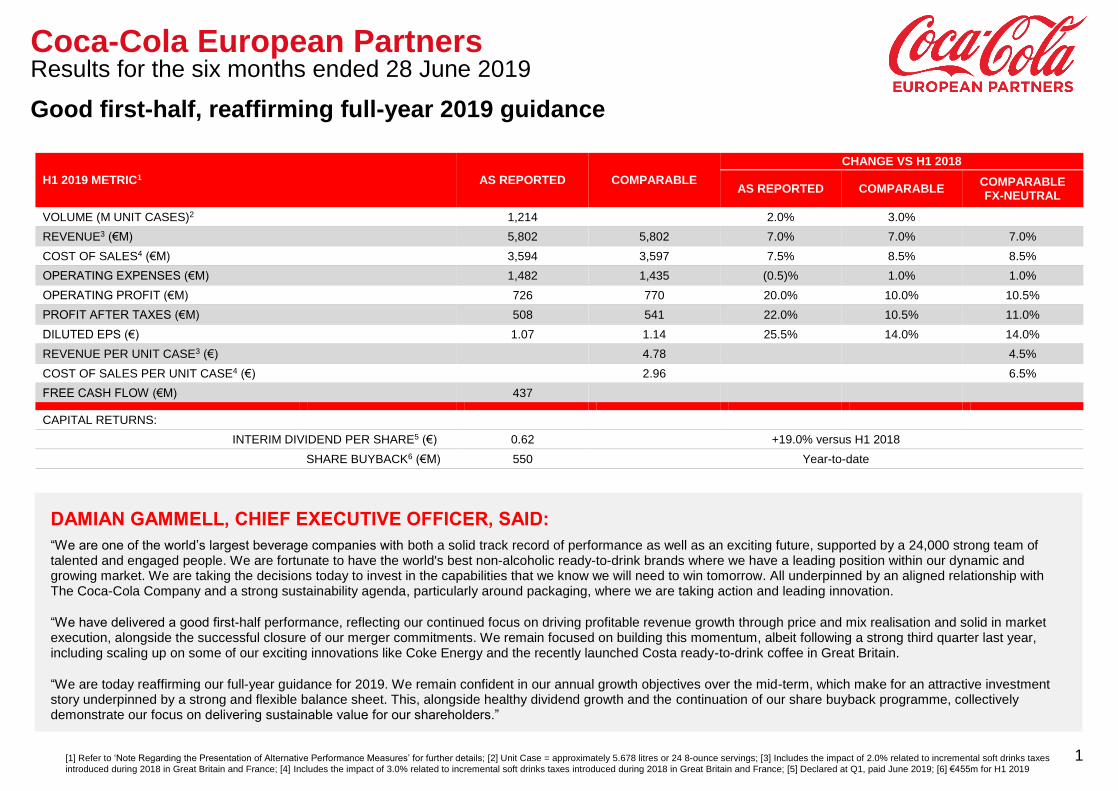
1 H1 2019 METRIC 1 AS REPORTED COMPARABLE CHANGE VS H1 2018 AS REPORTED COMPARABLE COMPARABLE FX-NEUTRAL VOLUME (M UNIT CASES) 2 1,214 2.0% 3.0% REVENUE 3 (€M) 5,802 5,802 7.0% 7.0% 7.0% COST OF SALES 4 (€M) 3,594 3,597 7.5% 8.5% 8.5% OPERATING EXPENSES (€M) 1,482 1,435 (0.5)% 1.0% 1.0% OPERATING PROFIT (€M) 726 770 20.0% 10.0% 10.5% PROFIT AFTER TAXES (€M) 508 541 22.0% 10.5% 11.0% DILUTED EPS (€) 1.07 1.14 25.5% 14.0% 14.0% REVENUE PER UNIT CASE 3 (€) 4.78 4.5% COST OF SALES PER UNIT CASE 4 (€) 2.96 6.5% FREE CASH FLOW (€M) 437 CAPITAL RETURNS: INTERIM DIVIDEND PER SHARE 5 (€) 0.62 +19.0% versus H1 2018 SHARE BUYBACK 6 (€M) 550 Year-to-date Coca-Cola European Partners Results for the six months ended 28 June 2019 Good first-half, reaffirming full-year 2019 guidance DAMIAN GAMMELL, CHIEF EXECUTIVE OFFICER, SAID: “We are one of the world’s largest beverage companies with both a solid track record of performance as well as an exciting future, supported by a 24,000 strong team of talented and engaged people. We are fortunate to have the world's best non-alcoholic ready-to-drink brands where we have a leading position within our dynamic and growing market. We are taking the decisions today to invest in the capabilities that we know we will need to win tomorrow. All underpinned by an aligned relationship with The Coca-Cola Company and a strong sustainability agenda, particularly around packaging, where we are taking action and leading innovation. “We have delivered a good first-half performance, reflecting our continued focus on driving profitable revenue growth through price and mix realisation and solid in market execution, alongside the successful closure of our merger commitments. We remain focused on building this momentum, albeit following a strong third quarter last year, including scaling up on some of our exciting innovations like Coke Energy and the recently launched Costa ready-to-drink coffee in Great Britain. “We are today reaffirming our full-year guidance for 2019. We remain confident in our annual growth objectives over the mid-term, which make for an attractive investment story underpinned by a strong and flexible balance sheet. This, alongside healthy dividend growth and the continuation of our share buyback programme, collectively demonstrate our focus on delivering sustainable value for our shareholders.” [1] Refer to ‘Note Regarding the Presentation of Alternative Performance Measures’ for further details; [2] Unit Case = approximately 5.678 litres or 24 8-ounce servings; [3] Includes the impact of 2.0% related to incremental soft drinks taxes introduced during 2018 in Great Britain and France; [4] Includes the impact of 3.0% related to incremental soft drinks taxes introduced during 2018 in Great Britain and France; [5] Declared at Q1, paid June 2019; [6] €455m for H1 2019
Transcript of Coca -Cola European Partners · 2019-09-18 · Coca-Cola European Partners plc is a leading...
1
H1 2019 METRIC1 AS REPORTED COMPARABLE
CHANGE VS H1 2018
AS REPORTED COMPARABLE COMPARABLE FX-NEUTRAL
VOLUME (M UNIT CASES)2 1,214 2.0% 3.0%
REVENUE3 (€M) 5,802 5,802 7.0% 7.0% 7.0%
COST OF SALES4 (€M) 3,594 3,597 7.5% 8.5% 8.5%
OPERATING EXPENSES (€M) 1,482 1,435 (0.5)% 1.0% 1.0%
OPERATING PROFIT (€M) 726 770 20.0% 10.0% 10.5%
PROFIT AFTER TAXES (€M) 508 541 22.0% 10.5% 11.0%
DILUTED EPS (€) 1.07 1.14 25.5% 14.0% 14.0%
REVENUE PER UNIT CASE3 (€) 4.78 4.5%
COST OF SALES PER UNIT CASE4 (€) 2.96 6.5%
FREE CASH FLOW (€M) 437
CAPITAL RETURNS:
INTERIM DIVIDEND PER SHARE5 (€) 0.62 +19.0% versus H1 2018
SHARE BUYBACK6 (€M) 550 Year-to-date
Coca-Cola European Partners Results for the six months ended 28 June 2019
Good first-half, reaffirming full-year 2019 guidance
DAMIAN GAMMELL, CHIEF EXECUTIVE OFFICER, SAID:
“We are one of the world’s largest beverage companies with both a solid track record of performance as well as an exciting future, supported by a 24,000 strong team of talented and engaged people. We are fortunate to have the world's best non-alcoholic ready-to-drink brands where we have a leading position within our dynamic and growing market. We are taking the decisions today to invest in the capabilities that we know we will need to win tomorrow. All underpinned by an aligned relationship with The Coca-Cola Company and a strong sustainability agenda, particularly around packaging, where we are taking action and leading innovation.
“We have delivered a good first-half performance, reflecting our continued focus on driving profitable revenue growth through price and mix realisation and solid in market execution, alongside the successful closure of our merger commitments. We remain focused on building this momentum, albeit following a strong third quarter last year, including scaling up on some of our exciting innovations like Coke Energy and the recently launched Costa ready-to-drink coffee in Great Britain.
“We are today reaffirming our full-year guidance for 2019. We remain confident in our annual growth objectives over the mid-term, which make for an attractive investment story underpinned by a strong and flexible balance sheet. This, alongside healthy dividend growth and the continuation of our share buyback programme, collectively demonstrate our focus on delivering sustainable value for our shareholders.”
[1] Refer to ‘Note Regarding the Presentation of Alternative Performance Measures’ for further details; [2] Unit Case = approximately 5.678 litres or 24 8-ounce servings; [3] Includes the impact of 2.0% related to incremental soft drinks taxes
introduced during 2018 in Great Britain and France; [4] Includes the impact of 3.0% related to incremental soft drinks taxes introduced during 2018 in Great Britain and France; [5] Declared at Q1, paid June 2019; [6] €455m for H1 2019
2
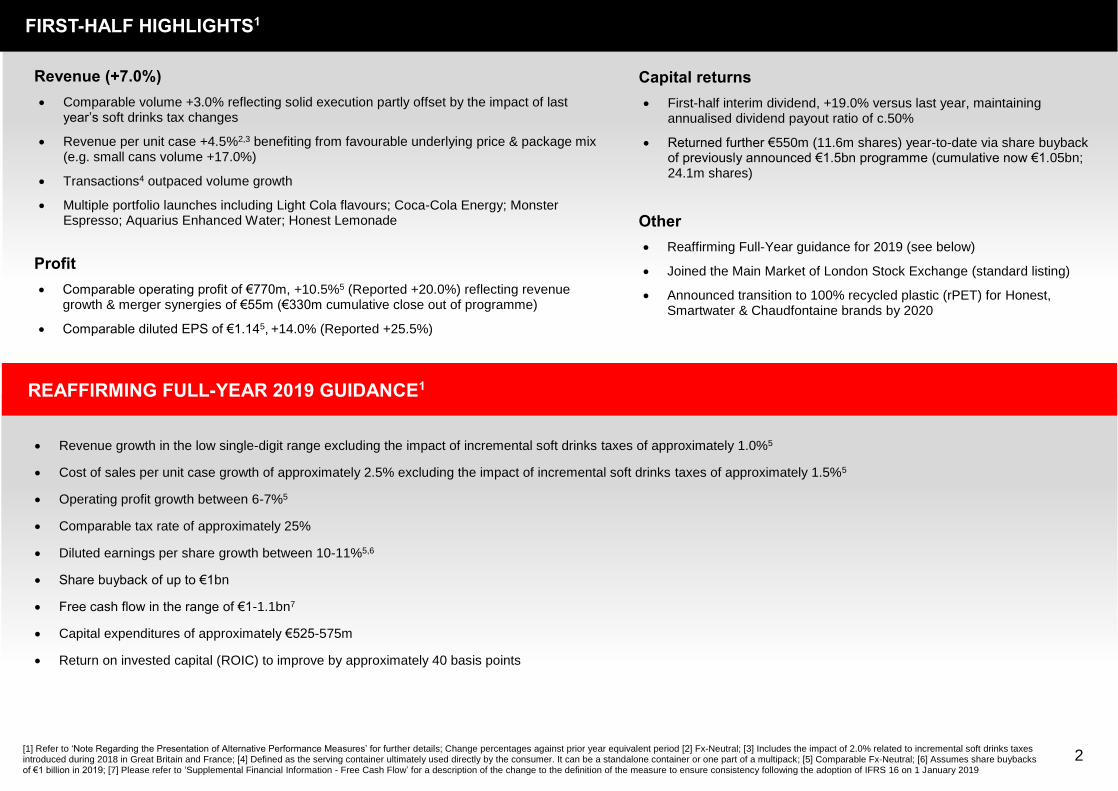
REAFFIRMING FULL-YEAR 2019 GUIDANCE1
Revenue growth in the low single-digit range excluding the impact of incremental soft drinks taxes of approximately 1.0%5
Cost of sales per unit case growth of approximately 2.5% excluding the impact of incremental soft drinks taxes of approximately 1.5%5
Operating profit growth between 6-7%5
Comparable tax rate of approximately 25%
Diluted earnings per share growth between 10-11%5,6
Share buyback of up to €1bn
Free cash flow in the range of €1-1.1bn7
Capital expenditures of approximately €525-575m
Return on invested capital (ROIC) to improve by approximately 40 basis points
[1] Refer to ‘Note Regarding the Presentation of Alternative Performance Measures’ for further details; Change percentages against prior year equivalent period [2] Fx-Neutral; [3] Includes the impact of 2.0% related to incremental soft drinks taxes introduced during 2018 in Great Britain and France; [4] Defined as the serving container ultimately used directly by the consumer. It can be a standalone container or one part of a multipack; [5] Comparable Fx-Neutral; [6] Assumes share buybacks of €1 billion in 2019; [7] Please refer to ‘Supplemental Financial Information - Free Cash Flow’ for a description of the change to the definition of the measure to ensure consistency following the adoption of IFRS 16 on 1 January 2019
FIRST-HALF HIGHLIGHTS1
Revenue (+7.0%)
Comparable volume +3.0% reflecting solid execution partly offset by the impact of last year’s soft drinks tax changes
Revenue per unit case +4.5%2,3 benefiting from favourable underlying price & package mix (e.g. small cans volume +17.0%)
Transactions4 outpaced volume growth
Multiple portfolio launches including Light Cola flavours; Coca-Cola Energy; Monster Espresso; Aquarius Enhanced Water; Honest Lemonade
Profit
Comparable operating profit of €770m, +10.5%5 (Reported +20.0%) reflecting revenue growth & merger synergies of €55m (€330m cumulative close out of programme)
Comparable diluted EPS of €1.145, +14.0% (Reported +25.5%)
Capital returns
First-half interim dividend, +19.0% versus last year, maintaining annualised dividend payout ratio of c.50%
Returned further €550m (11.6m shares) year-to-date via share buyback of previously announced €1.5bn programme (cumulative now €1.05bn; 24.1m shares)
Other
Reaffirming Full-Year guidance for 2019 (see below)
Joined the Main Market of London Stock Exchange (standard listing)
Announced transition to 100% recycled plastic (rPET) for Honest, Smartwater & Chaudfontaine brands by 2020
3
v s
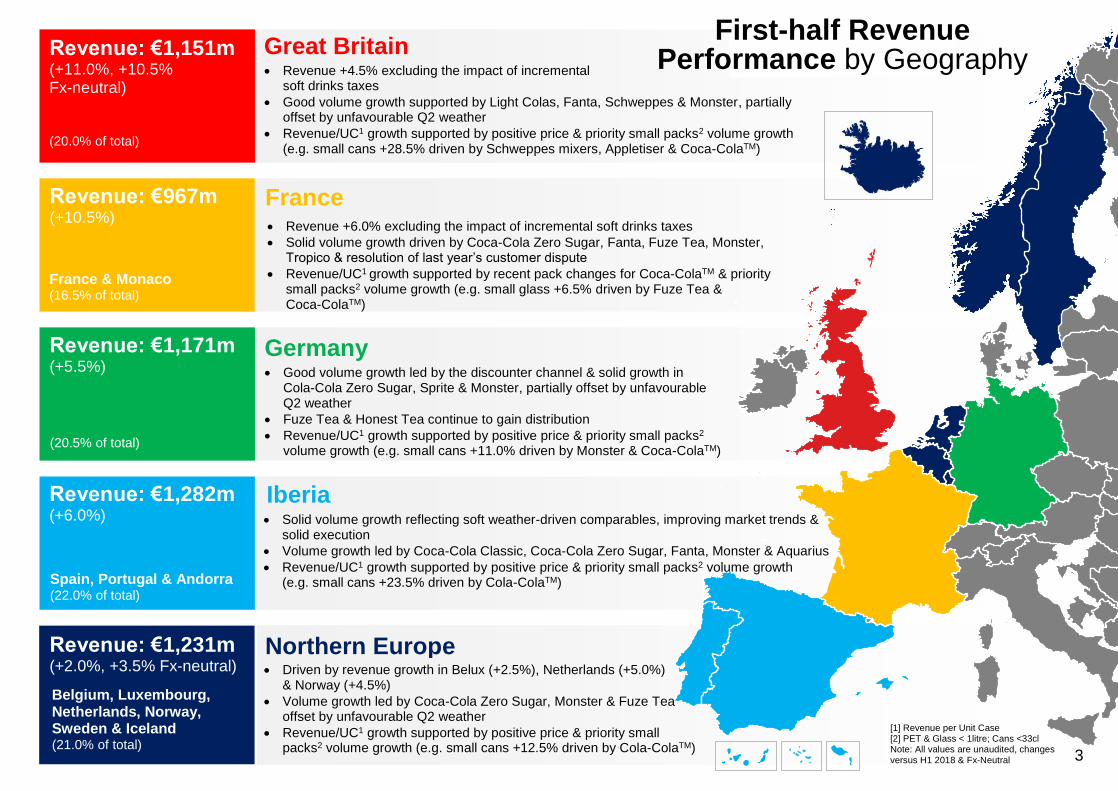
Great Britain Revenue +4.5% excluding the impact of incremental
soft drinks taxes
Good volume growth supported by Light Colas, Fanta, Schweppes & Monster, partially offset by unfavourable Q2 weather
Revenue/UC1 growth supported by positive price & priority small packs2 volume growth (e.g. small cans +28.5% driven by Schweppes mixers, Appletiser & Coca-ColaTM)
Revenue: €1,151m (+11.0%, +10.5% Fx-neutral) (20.0% of total)
France Revenue: €967m (+10.5%)
Revenue +6.0% excluding the impact of incremental soft drinks taxes
Solid volume growth driven by Coca-Cola Zero Sugar, Fanta, Fuze Tea, Monster, Tropico & resolution of last year’s customer dispute
Revenue/UC1 growth supported by recent pack changes for Coca-ColaTM & priority small packs2 volume growth (e.g. small glass +6.5% driven by Fuze Tea & Coca-ColaTM)
(20.5% of total)
Germany Good volume growth led by the discounter channel & solid growth in
Cola-Cola Zero Sugar, Sprite & Monster, partially offset by unfavourable Q2 weather
Fuze Tea & Honest Tea continue to gain distribution
Revenue/UC1 growth supported by positive price & priority small packs2 volume growth (e.g. small cans +11.0% driven by Monster & Coca-ColaTM)
Revenue: €1,171m (+5.5%)
Iberia Revenue: €1,282m (+6.0%)
Northern Europe Revenue: €1,231m (+2.0%, +3.5% Fx-neutral)
France & Monaco (16.5% of total)
Spain, Portugal & Andorra (22.0% of total)
Belgium, Luxembourg, Netherlands, Norway, Sweden & Iceland (21.0% of total)
[1] Revenue per Unit Case [2] PET & Glass < 1litre; Cans <33cl Note: All values are unaudited, changes versus H1 2018 & Fx-Neutral
Driven by revenue growth in Belux (+2.5%), Netherlands (+5.0%) & Norway (+4.5%)
Volume growth led by Coca-Cola Zero Sugar, Monster & Fuze Tea offset by unfavourable Q2 weather
Revenue/UC1 growth supported by positive price & priority small packs2 volume growth (e.g. small cans +12.5% driven by Cola-ColaTM)
First-half Revenue Performance by Geography
Solid volume growth reflecting soft weather-driven comparables, improving market trends & solid execution
Volume growth led by Coca-Cola Classic, Coca-Cola Zero Sugar, Fanta, Monster & Aquarius
Revenue/UC1 growth supported by positive price & priority small packs2 volume growth (e.g. small cans +23.5% driven by Cola-ColaTM)
4
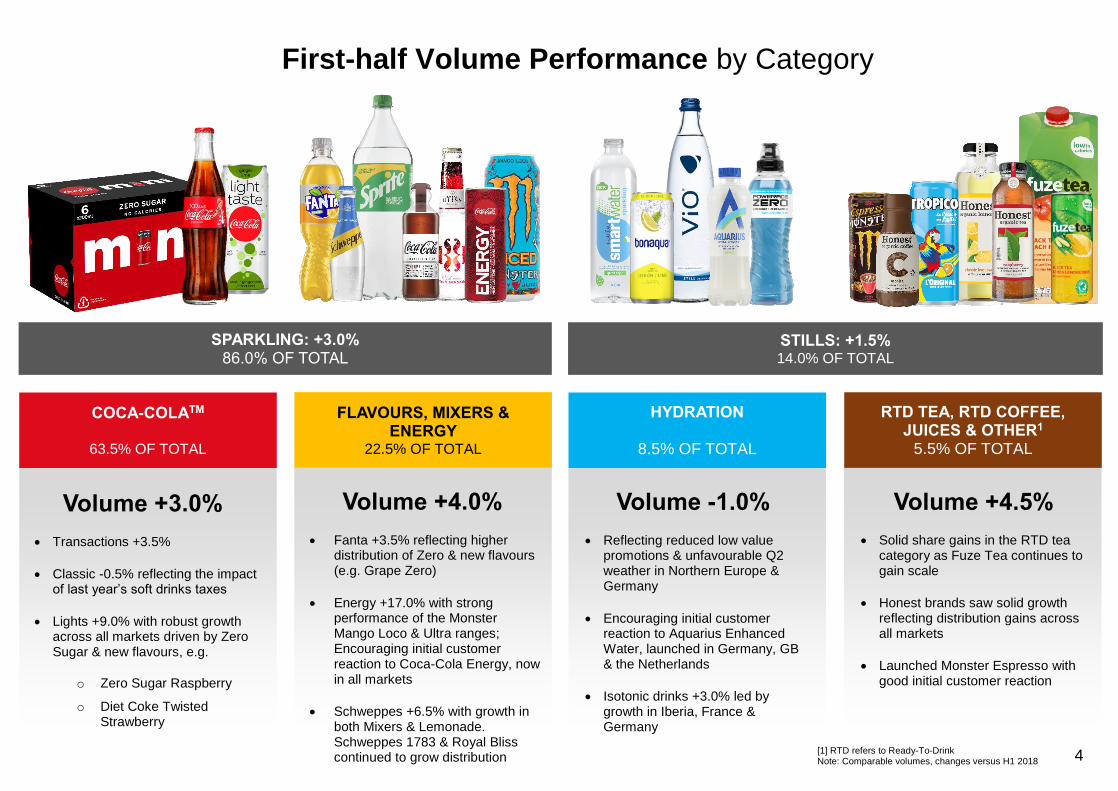
First-half Volume Performance by Category
Volume +3.0%
Transactions +3.5%
Classic -0.5% reflecting the impact of last year’s soft drinks taxes
Lights +9.0% with robust growth across all markets driven by Zero Sugar & new flavours, e.g.
o Zero Sugar Raspberry
o Diet Coke Twisted Strawberry
SPARKLING: +3.0% 86.0% OF TOTAL
STILLS: +1.5% 14.0% OF TOTAL
COCA-COLATM
63.5% OF TOTAL
FLAVOURS, MIXERS & ENERGY
22.5% OF TOTAL
HYDRATION
8.5% OF TOTAL
RTD TEA, RTD COFFEE, JUICES & OTHER1
5.5% OF TOTAL
Volume +4.0%
Fanta +3.5% reflecting higher distribution of Zero & new flavours (e.g. Grape Zero)
Energy +17.0% with strong performance of the Monster Mango Loco & Ultra ranges; Encouraging initial customer reaction to Coca-Cola Energy, now in all markets
Schweppes +6.5% with growth in both Mixers & Lemonade. Schweppes 1783 & Royal Bliss continued to grow distribution
Volume -1.0%
Reflecting reduced low value promotions & unfavourable Q2 weather in Northern Europe & Germany
Encouraging initial customer reaction to Aquarius Enhanced Water, launched in Germany, GB & the Netherlands
Isotonic drinks +3.0% led by growth in Iberia, France & Germany
Volume +4.5%
Solid share gains in the RTD tea category as Fuze Tea continues to gain scale
Honest brands saw solid growth reflecting distribution gains across all markets
Launched Monster Espresso with good initial customer reaction
[1] RTD refers to Ready-To-Drink Note: Comparable volumes, changes versus H1 2018
5
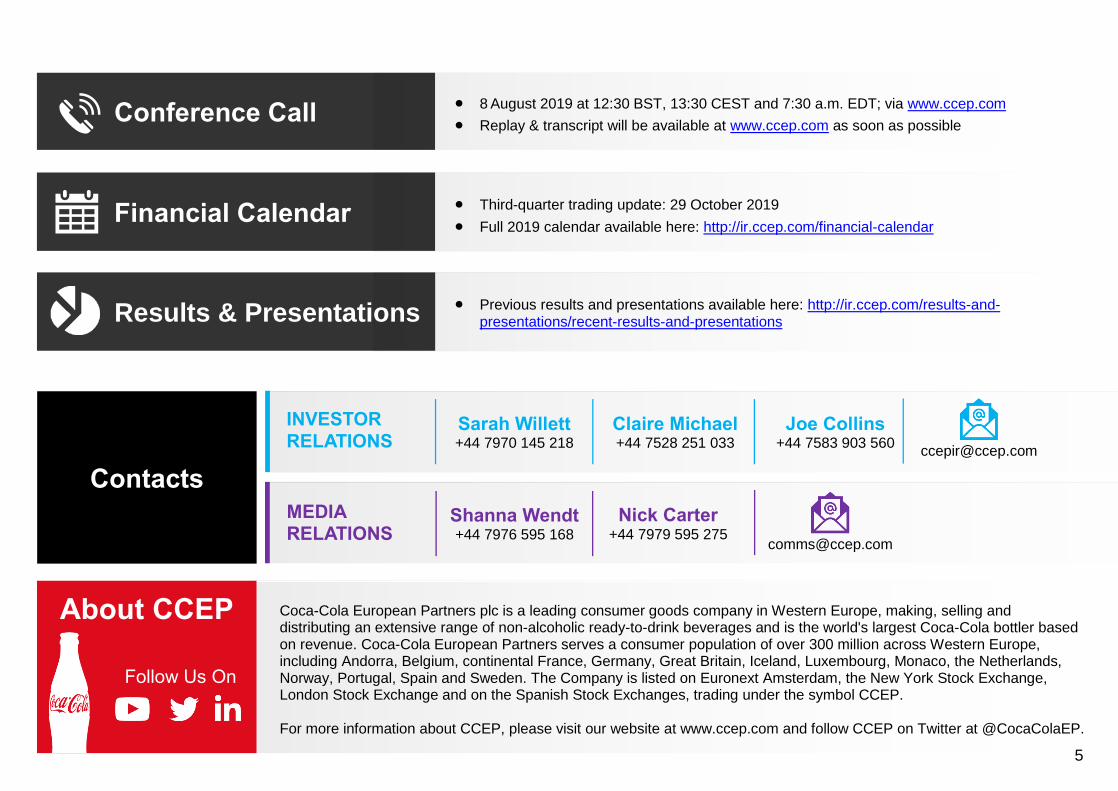
About CCEP
Conference Call
Financial Calendar
8 August 2019 at 12:30 BST, 13:30 CEST and 7:30 a.m. EDT; via www.ccep.com Replay & transcript will be available at www.ccep.com as soon as possible
Coca-Cola European Partners plc is a leading consumer goods company in Western Europe, making, selling and distributing an extensive range of non-alcoholic ready-to-drink beverages and is the world's largest Coca-Cola bottler based on revenue. Coca-Cola European Partners serves a consumer population of over 300 million across Western Europe, including Andorra, Belgium, continental France, Germany, Great Britain, Iceland, Luxembourg, Monaco, the Netherlands, Norway, Portugal, Spain and Sweden. The Company is listed on Euronext Amsterdam, the New York Stock Exchange, London Stock Exchange and on the Spanish Stock Exchanges, trading under the symbol CCEP. For more information about CCEP, please visit our website at www.ccep.com and follow CCEP on Twitter at @CocaColaEP.
Contacts
Third-quarter trading update: 29 October 2019
Full 2019 calendar available here: http://ir.ccep.com/financial-calendar
INVESTOR
RELATIONS Sarah Willett +44 7970 145 218
Claire Michael +44 7528 251 033
Joe Collins +44 7583 903 560
MEDIA RELATIONS
Shanna Wendt +44 7976 595 168
Nick Carter +44 7979 595 275
Follow Us On
Results & Presentations Previous results and presentations available here: http://ir.ccep.com/results-and-presentations/recent-results-and-presentations
Forward-Looking Statements
This document contains statements, estimates or projections that constitute “forward-looking statements” concerning the financialcondition, performance, results, strategy and objectives of Coca-Cola European Partners plc and its subsidiaries (together“CCEP” or the “Group”). Generally, the words “believe,” “expect,” “intend,” “estimate,” “anticipate,” “project,” “plan,” “seek,” “may,”“could,” “would,” “should,” “might,” “will,” “forecast,” “outlook,” “guidance,” “possible,” “potential,” “predict,” “objective” and similarexpressions identify forward-looking statements, which generally are not historical in nature.
Forward-looking statements are subject to certain risks that could cause actual results to differ materially from CCEP’s historicalexperience and present expectations or projections. As a result, undue reliance should not be placed on forward-lookingstatements, which speak only as of the date on which they are made. These risks include but are not limited to those set forthin the “Risk Factors” section of CCEP’s 2018 Integrated Report/Annual Report on Form 20-F, including the statements underthe following headings: Changing consumer preferences and the health impact of soft drinks (such as sugar alternatives); Legaland regulatory intervention (such as the development of regulations regarding packaging and taxes); Packaging and plastics(such as climate change, resource scarcity, marine litter and water scarcity); Competitiveness and transformation; Cyber andsocial engineering attacks; The market (such as customer consolidation and route to market); Economic and political conditions(such as continuing developments in relation to the UK’s exit from the EU); The relationship with TCCC and other franchisors;Product quality; and Other risks.
Due to these risks, CCEP’s actual future results, dividend payments, and capital and leverage ratios may differ materially fromthe plans, goals, expectations and guidance set out in CCEP’s forward-looking statements. Additional risks that may impactCCEP’s future financial condition and performance are identified in filings with the SEC which are available on the SEC’s websiteat www.sec.gov. CCEP does not undertake any obligation to publicly update or revise any forward-looking statements, whetheras a result of new information, future events, or otherwise, except as required under applicable rules, laws and regulations.CCEP assumes no responsibility for the accuracy and completeness of any forward-looking statements. Any or all of the forward-looking statements contained in this filing and in any other of CCEP’s respective public statements may prove to be incorrect.
P a g e | 6
Note Regarding the Presentation of Alternative Performance Measures
We use certain alternative performance measures (non-GAAP performance measures) to make financial, operating and planningdecisions and to evaluate and report performance. We believe these measures provide useful information to investors and assuch, where clearly identified, we have included certain alternative performance measures in this document to allow investorsto better analyse our business performance and allow for greater comparability. To do so, we have excluded items affecting thecomparability of period-over-period financial performance as described below. The alternative performance measures includedherein should be read in conjunction with and do not replace the directly reconcilable GAAP measure.
For purposes of this document, the following terms are defined:
‘‘As reported’’ are results extracted from our condensed consolidated interim financial statements.
‘‘Comparable’’ is defined as results excluding items impacting comparability, such as restructuring charges, out of period mark-to-market impact of hedges and net tax items relating to rate and law changes. Comparable volume is also adjusted for sellingdays.
‘‘Fx-neutral’’ is defined as comparable results excluding the impact of foreign exchange rate changes. Foreign exchange impactis calculated by recasting current year results at prior year exchange rates.
‘‘Free cash flow’’ is defined as net cash flows from operations, less capital expenditures, payments of principal on leaseobligations and interest paid, plus proceeds from capital disposals. Please refer to Supplemental Financial Information - FreeCash Flow for a description of the change to the definition of the measure following the adoption of IFRS 16 on 1 January 2019.
Free cash flow is used as a measure of the Group’s cash generation from operating activities, taking into account investmentsin property, plant and equipment and non-discretionary lease and interest payments.
‘‘Adjusted EBITDA’’ is calculated as Earnings Before Interest, Tax, Depreciation and Amortisation (EBITDA), after adding backitems impacting the comparability of year-over-year financial performance. Adjusted EBITDA does not reflect our cashexpenditures, or future requirements for capital expenditures or contractual commitments. Further, Adjusted EBITDA does notreflect changes in, or cash requirements for, our working capital needs, and although depreciation and amortisation are non-cash charges, the assets being depreciated and amortised are likely to be replaced in the future and Adjusted EBITDA doesnot reflect cash requirements for such replacements.
‘‘Net Debt’’ is defined as the net of cash and cash equivalents less currency adjusted borrowing. We believe that reporting NetDebt is useful as it reflects a metric used by the Group to assess cash management and leverage. In addition, the ratio of netdebt to Adjusted EBITDA is used by investors, analysts and credit rating agencies to analyse our operating performance in thecontext of targeted financial leverage.
‘‘Capex’’ or “Capital expenditures’’ is defined as payments for purchases of property, plant and equipment plus purchases ofcapitalised software less proceeds from disposals of property, plant and equipment. Capex is used as a measure to ensure thatthe cash spending is in line with the Group’s overall strategy for the use of cash.
‘‘ROIC’’ is defined as comparable operating profit after tax divided by the average of opening and closing invested capital forthe year. Invested capital is calculated as the addition of borrowings and equity less cash and cash equivalents. ROIC is usedas a measure of capital efficiency and reflects how well the Group generates comparable operating profit relative to thecapital invested in the business.
‘‘Dividend Payout Ratio’’ is defined as dividends as a proportion of comparable profit after tax.
Additionally, within this document, we provide certain forward-looking non-GAAP financial Information, which management usesfor planning and measuring performance. We are not able to reconcile forward-looking non-GAAP measures to reported measureswithout unreasonable efforts because it is not possible to predict with a reasonable degree of certainty the actual impact or exacttiming of items that may impact comparability throughout 2019.
Unless otherwise stated, percent amounts are rounded to the nearest 0.5%.
P a g e | 7
Supplementary Financial Information - Income Statement
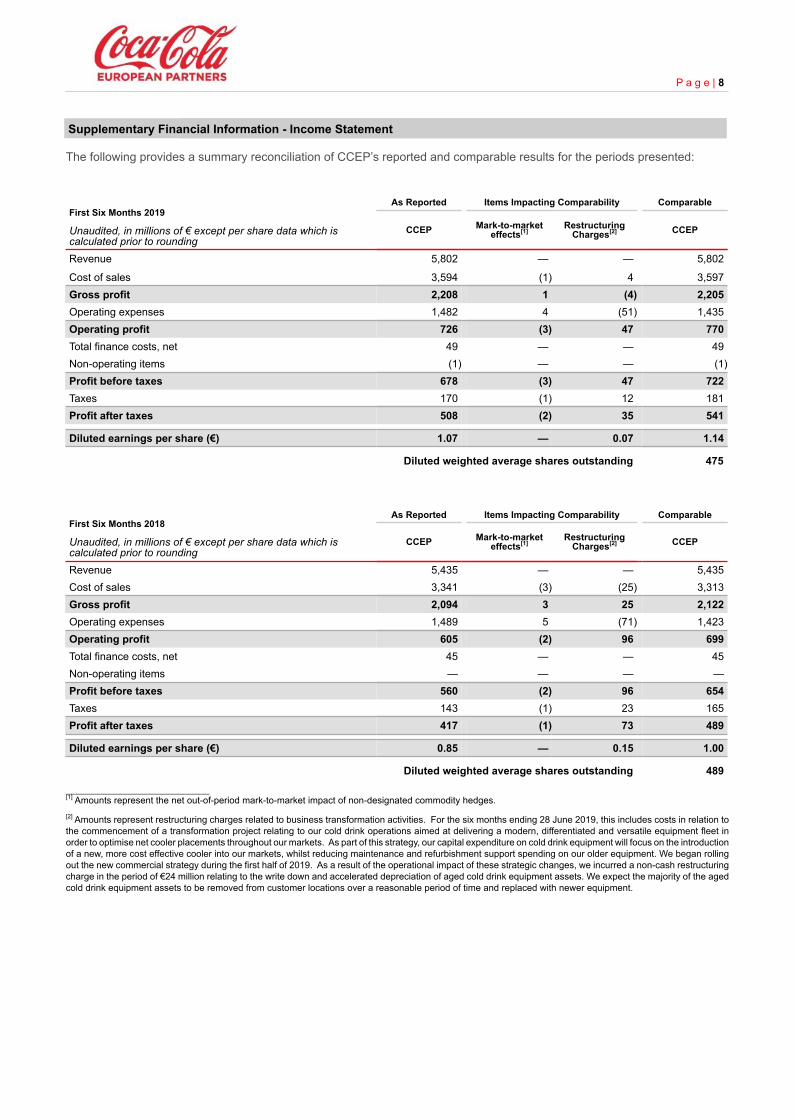
The following provides a summary reconciliation of CCEP’s reported and comparable results for the periods presented:
First Six Months 2019
Unaudited, in millions of € except per share data which iscalculated prior to rounding
As Reported Items Impacting Comparability Comparable
CCEP Mark-to-marketeffects[1]
RestructuringCharges[2] CCEP
Revenue 5,802 — — 5,802
Cost of sales 3,594 (1) 4 3,597Gross profit 2,208 1 (4) 2,205Operating expenses 1,482 4 (51) 1,435Operating profit 726 (3) 47 770Total finance costs, net 49 — — 49Non-operating items (1) — — (1)Profit before taxes 678 (3) 47 722Taxes 170 (1) 12 181Profit after taxes 508 (2) 35 541
Diluted earnings per share (€) 1.07 — 0.07 1.14
Diluted weighted average shares outstanding 475
First Six Months 2018
Unaudited, in millions of € except per share data which iscalculated prior to rounding
As Reported Items Impacting Comparability Comparable
CCEP Mark-to-marketeffects[1]
RestructuringCharges[2] CCEP
Revenue 5,435 — — 5,435Cost of sales 3,341 (3) (25) 3,313Gross profit 2,094 3 25 2,122Operating expenses 1,489 5 (71) 1,423Operating profit 605 (2) 96 699Total finance costs, net 45 — — 45Non-operating items — — — —Profit before taxes 560 (2) 96 654Taxes 143 (1) 23 165Profit after taxes 417 (1) 73 489
Diluted earnings per share (€) 0.85 — 0.15 1.00
Diluted weighted average shares outstanding 489___________________________[1] Amounts represent the net out-of-period mark-to-market impact of non-designated commodity hedges.[2] Amounts represent restructuring charges related to business transformation activities. For the six months ending 28 June 2019, this includes costs in relation tothe commencement of a transformation project relating to our cold drink operations aimed at delivering a modern, differentiated and versatile equipment fleet inorder to optimise net cooler placements throughout our markets. As part of this strategy, our capital expenditure on cold drink equipment will focus on the introductionof a new, more cost effective cooler into our markets, whilst reducing maintenance and refurbishment support spending on our older equipment. We began rollingout the new commercial strategy during the first half of 2019. As a result of the operational impact of these strategic changes, we incurred a non-cash restructuringcharge in the period of €24 million relating to the write down and accelerated depreciation of aged cold drink equipment assets. We expect the majority of the agedcold drink equipment assets to be removed from customer locations over a reasonable period of time and replaced with newer equipment.
P a g e | 8
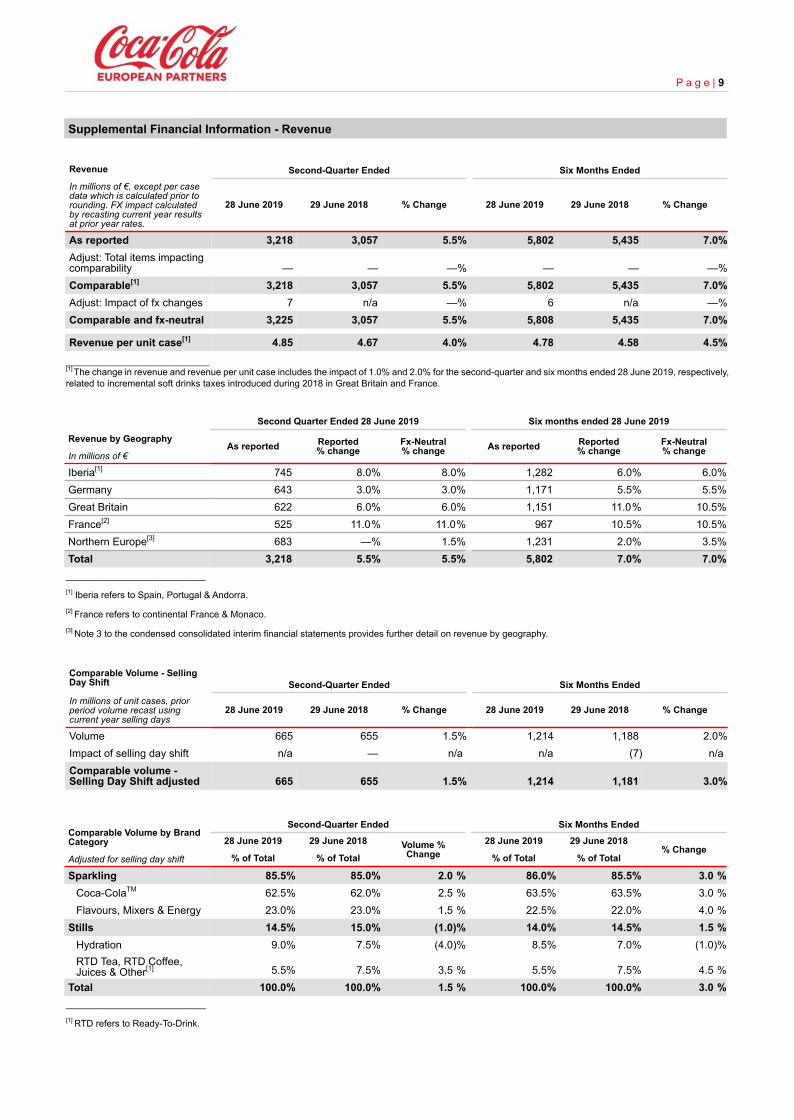
Supplemental Financial Information - Revenue
Revenue
In millions of €, except per casedata which is calculated prior torounding. FX impact calculatedby recasting current year resultsat prior year rates.
Second-Quarter Ended Six Months Ended
28 June 2019 29 June 2018 % Change 28 June 2019 29 June 2018 % Change
As reported 3,218 3,057 5.5% 5,802 5,435 7.0%Adjust: Total items impactingcomparability — — —% — — —%Comparable[1] 3,218 3,057 5.5% 5,802 5,435 7.0%Adjust: Impact of fx changes 7 n/a —% 6 n/a —%Comparable and fx-neutral 3,225 3,057 5.5% 5,808 5,435 7.0%
Revenue per unit case[1] 4.85 4.67 4.0% 4.78 4.58 4.5%___________________________[1] The change in revenue and revenue per unit case includes the impact of 1.0% and 2.0% for the second-quarter and six months ended 28 June 2019, respectively,related to incremental soft drinks taxes introduced during 2018 in Great Britain and France.
Revenue by Geography
In millions of €
Second Quarter Ended 28 June 2019 Six months ended 28 June 2019
As reported Reported % change
Fx-Neutral % change As reported Reported
% changeFx-Neutral % change
Iberia[1] 745 8.0% 8.0% 1,282 6.0% 6.0%Germany 643 3.0% 3.0% 1,171 5.5% 5.5%Great Britain 622 6.0% 6.0% 1,151 11.0% 10.5%France[2] 525 11.0% 11.0% 967 10.5% 10.5%Northern Europe[3] 683 —% 1.5% 1,231 2.0% 3.5%Total 3,218 5.5% 5.5% 5,802 7.0% 7.0%___________________________[1] Iberia refers to Spain, Portugal & Andorra.[2] France refers to continental France & Monaco.[3] Note 3 to the condensed consolidated interim financial statements provides further detail on revenue by geography.
Comparable Volume - SellingDay Shift
In millions of unit cases, priorperiod volume recast usingcurrent year selling days
Second-Quarter Ended Six Months Ended
28 June 2019 29 June 2018 % Change 28 June 2019 29 June 2018 % Change
Volume 665 655 1.5% 1,214 1,188 2.0%Impact of selling day shift n/a — n/a n/a (7) n/aComparable volume -Selling Day Shift adjusted 665 655 1.5% 1,214 1,181 3.0%
Comparable Volume by BrandCategory
Adjusted for selling day shift
Second-Quarter Ended Six Months Ended
28 June 2019 29 June 2018 Volume %Change
28 June 2019 29 June 2018% Change
% of Total % of Total % of Total % of Total
Sparkling 85.5% 85.0% 2.0 % 86.0% 85.5% 3.0 %Coca-ColaTM 62.5% 62.0% 2.5 % 63.5% 63.5% 3.0 %Flavours, Mixers & Energy 23.0% 23.0% 1.5 % 22.5% 22.0% 4.0 %
Stills 14.5% 15.0% (1.0)% 14.0% 14.5% 1.5 %Hydration 9.0% 7.5% (4.0)% 8.5% 7.0% (1.0)%RTD Tea, RTD Coffee,Juices & Other[1] 5.5% 7.5% 3.5 % 5.5% 7.5% 4.5 %
Total 100.0% 100.0% 1.5 % 100.0% 100.0% 3.0 %___________________________[1] RTD refers to Ready-To-Drink.
P a g e | 9

Supplemental Financial Information - Cost of Sales and Operating Expenses
Cost of Sales
Cost of Sales
In millions of €, except per case data which is calculated prior to rounding. FX impact calculatedby recasting current year results at prior year rates.
Six Months Ended
28 June 2019 29 June 2018 % Change
As reported 3,594 3,341 7.5%Adjust: Total items impacting comparability 3 (28) 1.0%Comparable[1] 3,597 3,313 8.5%Adjust: Impact of fx changes 4 n/a —%Comparable & fx-neutral 3,601 3,313 8.5%
Cost of sales per unit case[1] 2.96 2.79 6.5%
___________________________[1] The change in cost of sales and cost of sales per unit case includes the impact of 3.0% for the six months ended 28 June 2019 related to incremental soft drinkstaxes introduced during 2018 in Great Britain and France.
Reported cost of sales were €3,594 million, up 7.5 percent. Comparable cost of sales were €3,597 million, up 8.5 percent on aboth a comparable and a comparable and fx-neutral basis. Cost of sales per unit case increased by 6.5 percent on a comparableand fx-neutral basis. This reflects brand mix, higher concentrate costs through the incidence pricing model given revenue perunit case growth, as well as the impact of incremental soft drinks taxes introduced during 2018 in Great Britain and France.
Operating Expenses
Operating Expenses
In millions of €
Six Months Ended
28 June 2019 29 June 2018 % Change
As reported 1,482 1,489 (0.5)%Adjust: Total items impacting comparability (47) (66) 1.5 %Comparable 1,435 1,423 1.0 %Adjust: Impact of fx changes — n/a — %
Comparable & fx-neutral 1,435 1,423 1.0 %
Reported operating expenses were €1,482 million, down 0.5 percent. Comparable operating expenses were €1,435 million, up1.0 percent on both a comparable and a comparable and fx-neutral basis. This reflects our continued investments for the futurepartially offset by synergy benefits and a continued focus on managing expenses.
P a g e | 10
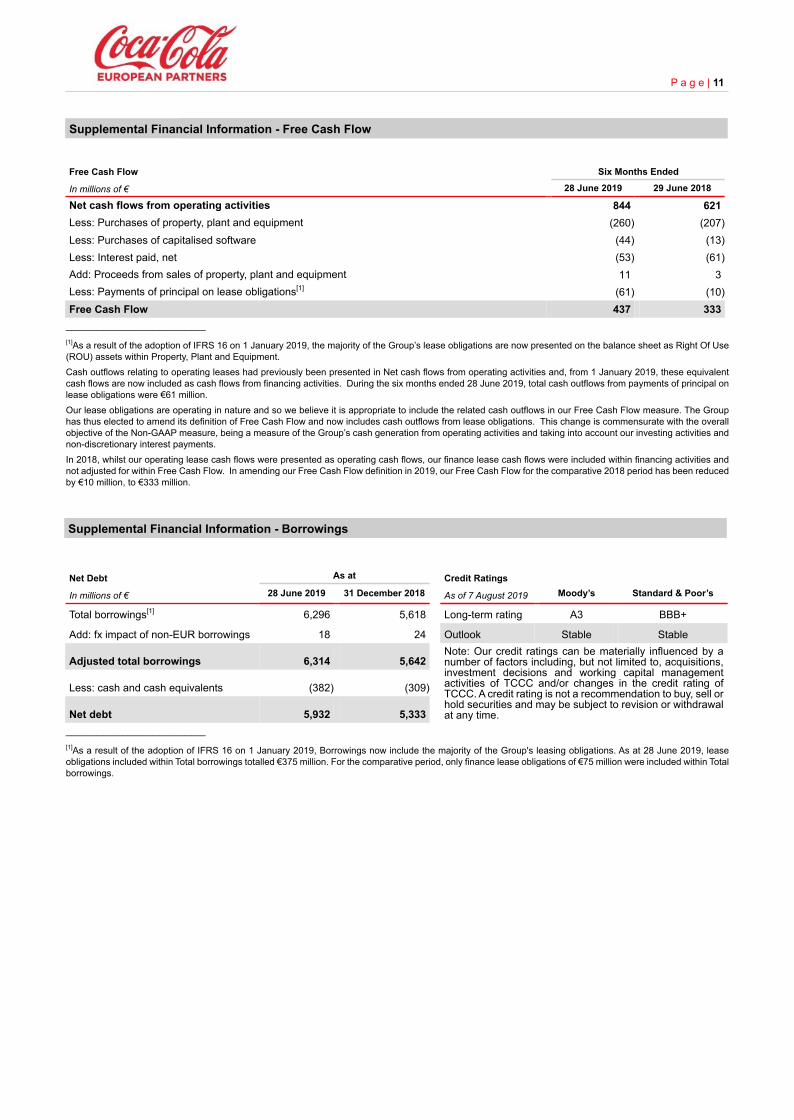
Supplemental Financial Information - Free Cash Flow
Free Cash Flow
In millions of €
Six Months Ended
28 June 2019 29 June 2018
Net cash flows from operating activities 844 621Less: Purchases of property, plant and equipment (260) (207)Less: Purchases of capitalised software (44) (13)Less: Interest paid, net (53) (61)Add: Proceeds from sales of property, plant and equipment 11 3Less: Payments of principal on lease obligations[1] (61) (10)Free Cash Flow 437 333
___________________________[1]As a result of the adoption of IFRS 16 on 1 January 2019, the majority of the Group’s lease obligations are now presented on the balance sheet as Right Of Use(ROU) assets within Property, Plant and Equipment. Cash outflows relating to operating leases had previously been presented in Net cash flows from operating activities and, from 1 January 2019, these equivalentcash flows are now included as cash flows from financing activities. During the six months ended 28 June 2019, total cash outflows from payments of principal onlease obligations were €61 million. Our lease obligations are operating in nature and so we believe it is appropriate to include the related cash outflows in our Free Cash Flow measure. The Grouphas thus elected to amend its definition of Free Cash Flow and now includes cash outflows from lease obligations. This change is commensurate with the overallobjective of the Non-GAAP measure, being a measure of the Group’s cash generation from operating activities and taking into account our investing activities andnon-discretionary interest payments. In 2018, whilst our operating lease cash flows were presented as operating cash flows, our finance lease cash flows were included within financing activities andnot adjusted for within Free Cash Flow. In amending our Free Cash Flow definition in 2019, our Free Cash Flow for the comparative 2018 period has been reducedby €10 million, to €333 million.
Supplemental Financial Information - Borrowings
Net Debt
In millions of €
As at Credit Ratings
As of 7 August 201928 June 2019 31 December 2018 Moody’s Standard & Poor’s
Total borrowings[1] 6,296 5,618 Long-term rating A3 BBB+
Add: fx impact of non-EUR borrowings 18 24 Outlook Stable Stable
Adjusted total borrowings 6,314 5,642Note: Our credit ratings can be materially influenced by anumber of factors including, but not limited to, acquisitions,investment decisions and working capital managementactivities of TCCC and/or changes in the credit rating ofTCCC. A credit rating is not a recommendation to buy, sell orhold securities and may be subject to revision or withdrawalat any time.
Less: cash and cash equivalents (382) (309)
Net debt 5,932 5,333___________________________[1]As a result of the adoption of IFRS 16 on 1 January 2019, Borrowings now include the majority of the Group's leasing obligations. As at 28 June 2019, leaseobligations included within Total borrowings totalled €375 million. For the comparative period, only finance lease obligations of €75 million were included within Totalborrowings.
P a g e | 11
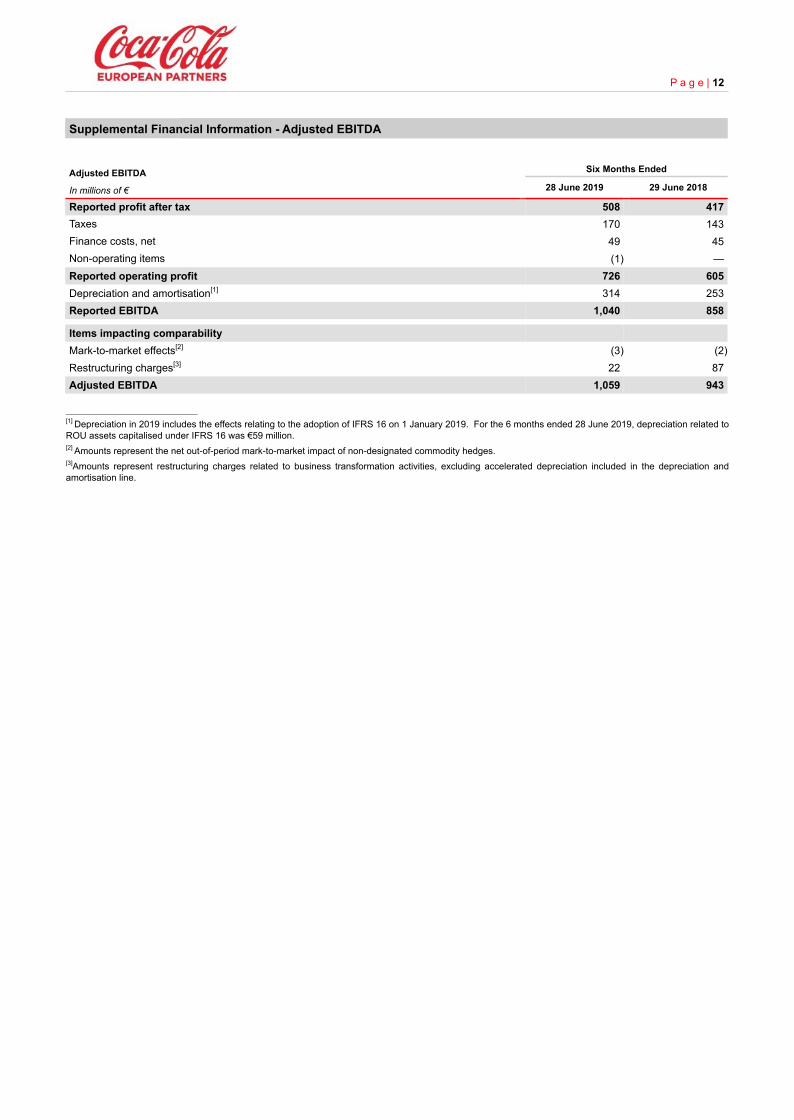
Supplemental Financial Information - Adjusted EBITDA
Adjusted EBITDA
In millions of €
Six Months Ended
28 June 2019 29 June 2018
Reported profit after tax 508 417Taxes 170 143Finance costs, net 49 45Non-operating items (1) —Reported operating profit 726 605Depreciation and amortisation[1] 314 253Reported EBITDA 1,040 858
Items impacting comparabilityMark-to-market effects[2] (3) (2)Restructuring charges[3] 22 87Adjusted EBITDA 1,059 943
______________________[1] Depreciation in 2019 includes the effects relating to the adoption of IFRS 16 on 1 January 2019. For the 6 months ended 28 June 2019, depreciation related toROU assets capitalised under IFRS 16 was €59 million.[2] Amounts represent the net out-of-period mark-to-market impact of non-designated commodity hedges.[3]Amounts represent restructuring charges related to business transformation activities, excluding accelerated depreciation included in the depreciation andamortisation line.
P a g e | 12
Principal Risks
The Directors recognise that the Group’s risk management programme is essential to understand the nature, scope, potentiallikelihood and impact of enterprise-wide risks and to manage them effectively, responding appropriately to the changing riskprofile of our operating environment. The Directors believe a strong risk culture with a clear risk management programme inCCEP will ensure well-informed business decisions are taken and risks are actively managed throughout the Group.
The following is a summary of the Group’s Principal Risks that are included in our 2018 Integrated Report and Form 20-F forthe year ended 31 December 2018:
• Changing consumer preferences and the health impact of soft drinks
• Legal and regulatory intervention
• Packaging and plastic
• Competitiveness and transformation
• Cyber and social engineering attacks
• Market
• Economic and political conditions
• Relationship with The Coca-Cola Company (TCCC) and other franchisors
• Product quality
Our principal risks have not changed materially in the first 6 months of 2019 and represent our principal risks for the remainingsix months of the year. For further details of our principal risks please refer to pages 40 - 43 and for the risk factors please referto pages 162 - 168 of our 2018 Integrated Report and Form 20-F.
Related Parties
Related party disclosures are presented in Note 10 of the Notes to the condensed consolidated interim financial statementscontained in this interim management report.
Going Concern
After making appropriate enquiries, the Directors have a reasonable expectation that the Company has adequate resources tocontinue in operational existence for a period of 12 months from the date of signing these accounts. Accordingly, the condensedconsolidated interim financial statements have been prepared on a going concern basis.
P a g e | 13
Responsibility Statement
The Directors of the Company confirm that to the best of their knowledge:
• The Condensed Consolidated Interim Financial Statements for the six months ended 28 June 2019 have been preparedin accordance with International Accounting Standard 34, ‘Interim Financial Reporting’, as adopted by the European Unionand issued by the International Accounting Standards Board.
• The interim management report includes a fair review of the information required by the Disclosure Guidance andTransparency Rules of the UK Financial Conduct Authority (DTR) 4.2.7 R and DTR 4.2.8 R as follows:
• DTR 4.2.7 R: an indication of important events that have occurred during the first six months of the financial year,and their impact on the condensed set of financial statements; and a description of the principal risks anduncertainties for the remaining six months of the financial year; and
• DTR 4.2.8 R: related parties transactions that have taken place in the first six months of the current financial yearand that have materially affected the financial position or the performance of the Group during that period; andany changes in the related parties transactions described in the last annual report that could have a material effecton the financial position or performance of the Group in the first six months of the current financial year.
The Directors of the Company are shown on pages 50-54 in the 2018 Integrated Report and Form 20-F for the year ended 31December 2018, save for the following changes:
• L. Phillip Humann and Curtis R. Welling stepped down as directors at the end of the AGM on 29 May 2019
• Dagmar Kollmann and Lord Mark Price were appointed as directors with effect from the end of the AGM on 29 May 2019
A list of current directors is maintained on CCEP’s website: www.ccep.com.
On behalf of the Board
Damian Gammell Manik Jhangiani
Chief Executive Officer Chief Financial Officer
8 August 2019
P a g e | 14
P a g e | 15
Independent Review Report to Coca-Cola European Partners plc
Introduction We have been engaged by the Company to review the condensed set of financial statements in the half-yearly financialreport for the six months ended 28 June 2019 which comprises condensed consolidated interim income statement,condensed consolidated interim statement of comprehensive income, condensed consolidated interim statement of financialposition, condensed consolidated interim statement of cash flows, condensed consolidated interim statement of changes inequity and the related explanatory notes 1 - 14. We have read the other information contained in the half yearly financialreport and considered whether it contains any apparent misstatements or material inconsistencies with the information in thecondensed set of financial statements.
This report is made solely to the company in accordance with guidance contained in International Standard on ReviewEngagements 2410 (UK and Ireland) "Review of Interim Financial Information Performed by the Independent Auditor of theEntity" issued by the Auditing Practices Board. To the fullest extent permitted by law, we do not accept or assumeresponsibility to anyone other than the company, for our work, for this report, or for the conclusions we have formed.
Directors' Responsibilities The half-yearly financial report is the responsibility of, and has been approved by, the directors. The directors are responsiblefor preparing the half-yearly financial report in accordance with the Disclosure Guidance and Transparency Rules of theUnited Kingdom's Financial Conduct Authority.
As disclosed in note 1, the annual financial statements of the group are prepared in accordance with IFRS as issued by theInternational Accounting Standards Board and IFRSs as adopted by the European Union. The condensed set of financialstatements included in this half-yearly financial report has been prepared in accordance with International AccountingStandard 34, "Interim Financial Reporting", as issued by the International Accounting Standards Board and as adopted by theEuropean Union.
Our Responsibility Our responsibility is to express to the Company a conclusion on the condensed set of financial statements in the half-yearlyfinancial report based on our review.
Scope of Review We conducted our review in accordance with International Standard on Review Engagements (UK and Ireland) 2410,"Review of Interim Financial Information Performed by the Independent Auditor of the Entity" issued by the Auditing PracticesBoard for use in the United Kingdom. A review of interim financial information consists of making enquiries, primarily ofpersons responsible for financial and accounting matters, and applying analytical and other review procedures. A review issubstantially less in scope than an audit conducted in accordance with International Standards on Auditing (UK) andconsequently does not enable us to obtain assurance that we would become aware of all significant matters that might beidentified in an audit. Accordingly, we do not express an audit opinion.
Conclusion Based on our review, nothing has come to our attention that causes us to believe that the condensed set of financialstatements in the half-yearly financial report for the six months ended 28 June 2019 is not prepared, in all material respects,in accordance with International Accounting Standard 34 as issued by the International Accounting Standards Board and asadopted by the European Union and the Disclosure Guidance and Transparency Rules of the United Kingdom's FinancialConduct Authority.
Ernst & Young LLP
London
8 August 2019
Notes:
1. The maintenance and integrity of the Coca-Cola European Partners plc website is the responsibility of the directors; the work carried out by the auditors doesnot involve consideration of these matters and, accordingly, the auditors accept no responsibility for any changes that may have occurred to the financialstatements since they were initially presented on the web site.
2. Legislation in the United Kingdom governing the preparation and dissemination of financial statements may differ from legislation in other jurisdictions.
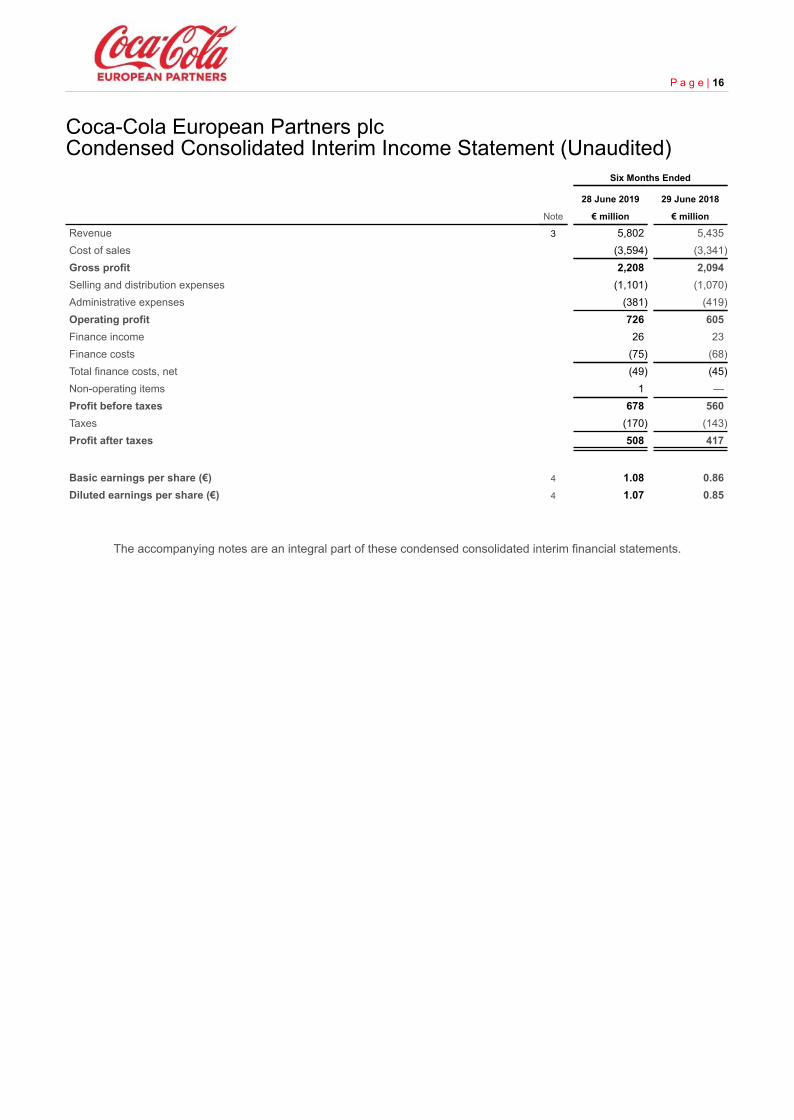
Coca-Cola European Partners plc Condensed Consolidated Interim Income Statement (Unaudited)
Six Months Ended
28 June 2019 29 June 2018
Note € million € million
Revenue 3 5,802 5,435Cost of sales (3,594) (3,341)Gross profit 2,208 2,094Selling and distribution expenses (1,101) (1,070)Administrative expenses (381) (419)Operating profit 726 605Finance income 26 23Finance costs (75) (68)Total finance costs, net (49) (45)Non-operating items 1 —Profit before taxes 678 560Taxes (170) (143)Profit after taxes 508 417
Basic earnings per share (€) 4 1.08 0.86Diluted earnings per share (€) 4 1.07 0.85
The accompanying notes are an integral part of these condensed consolidated interim financial statements.
P a g e | 16
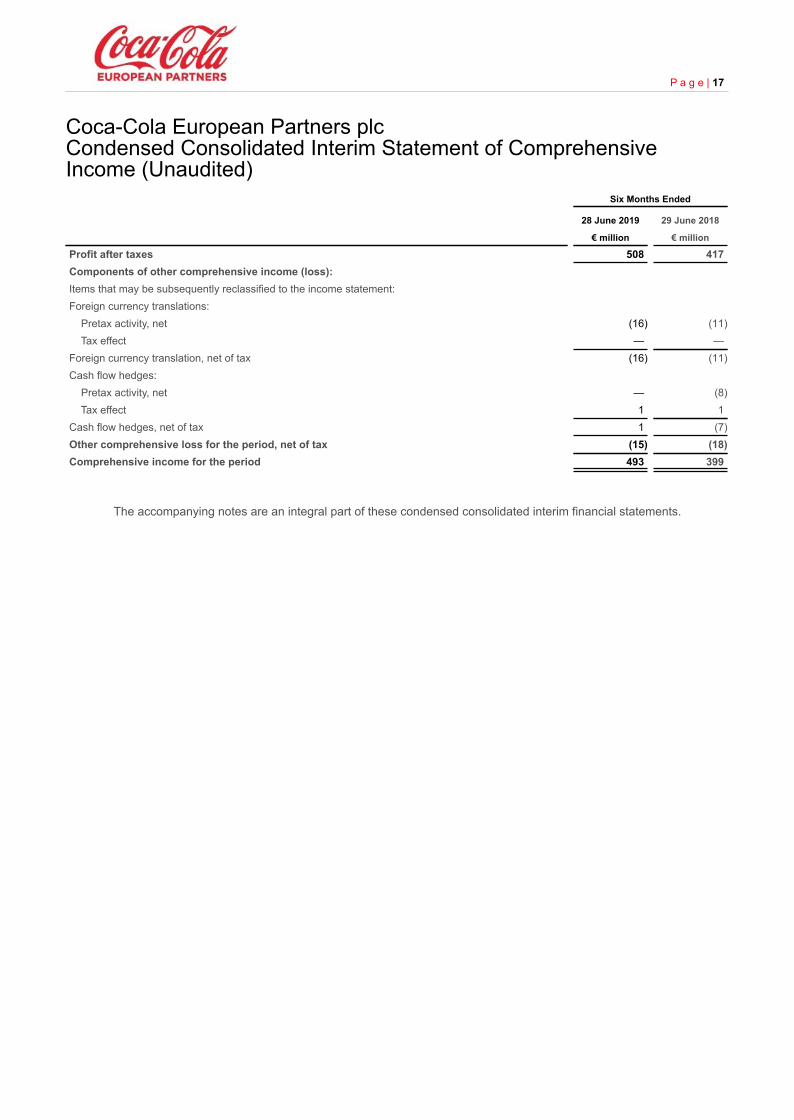
Coca-Cola European Partners plc Condensed Consolidated Interim Statement of ComprehensiveIncome (Unaudited)
Six Months Ended
28 June 2019 29 June 2018
€ million € million
Profit after taxes 508 417Components of other comprehensive income (loss):Items that may be subsequently reclassified to the income statement:Foreign currency translations: Pretax activity, net (16) (11) Tax effect — —Foreign currency translation, net of tax (16) (11)Cash flow hedges: Pretax activity, net — (8) Tax effect 1 1Cash flow hedges, net of tax 1 (7)Other comprehensive loss for the period, net of tax (15) (18)Comprehensive income for the period 493 399
The accompanying notes are an integral part of these condensed consolidated interim financial statements.
P a g e | 17
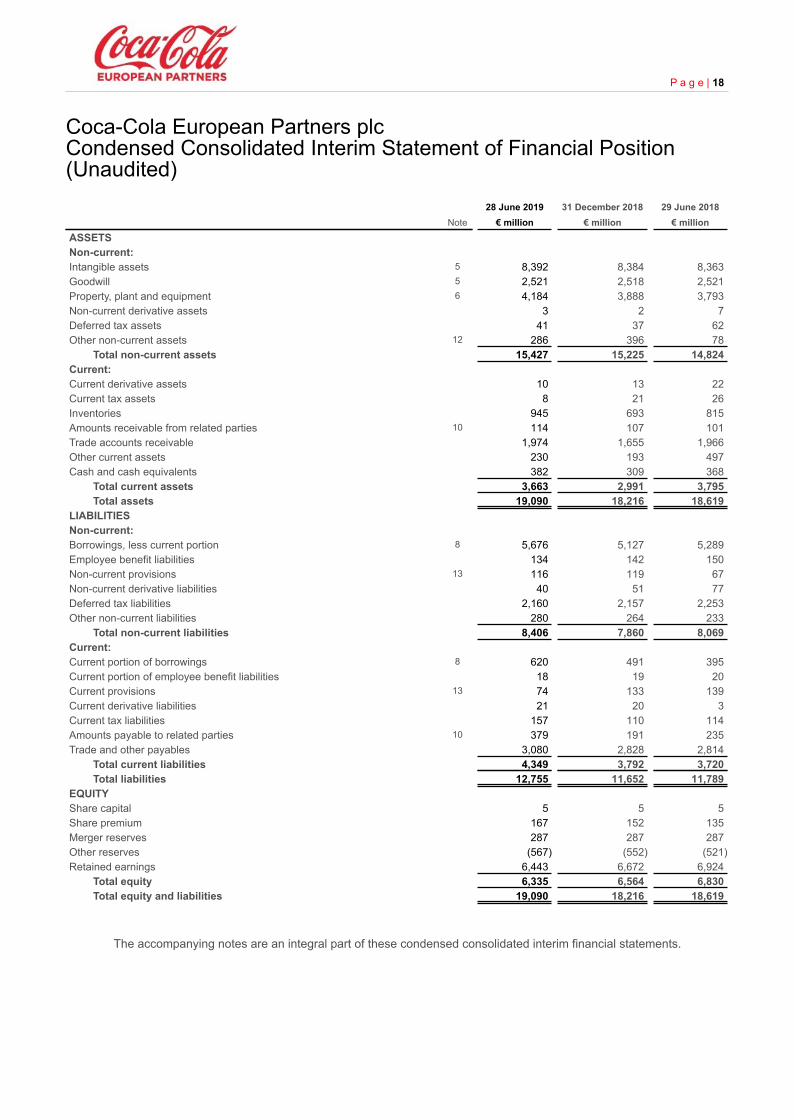
Coca-Cola European Partners plc Condensed Consolidated Interim Statement of Financial Position(Unaudited)
28 June 2019 31 December 2018 29 June 2018Note € million € million € million
ASSETSNon-current:Intangible assets 5 8,392 8,384 8,363Goodwill 5 2,521 2,518 2,521Property, plant and equipment 6 4,184 3,888 3,793Non-current derivative assets 3 2 7Deferred tax assets 41 37 62Other non-current assets 12 286 396 78
Total non-current assets 15,427 15,225 14,824Current:Current derivative assets 10 13 22Current tax assets 8 21 26Inventories 945 693 815Amounts receivable from related parties 10 114 107 101Trade accounts receivable 1,974 1,655 1,966Other current assets 230 193 497Cash and cash equivalents 382 309 368
Total current assets 3,663 2,991 3,795Total assets 19,090 18,216 18,619
LIABILITIESNon-current:Borrowings, less current portion 8 5,676 5,127 5,289Employee benefit liabilities 134 142 150Non-current provisions 13 116 119 67Non-current derivative liabilities 40 51 77Deferred tax liabilities 2,160 2,157 2,253Other non-current liabilities 280 264 233
Total non-current liabilities 8,406 7,860 8,069Current:Current portion of borrowings 8 620 491 395Current portion of employee benefit liabilities 18 19 20Current provisions 13 74 133 139Current derivative liabilities 21 20 3Current tax liabilities 157 110 114Amounts payable to related parties 10 379 191 235Trade and other payables 3,080 2,828 2,814
Total current liabilities 4,349 3,792 3,720Total liabilities 12,755 11,652 11,789
EQUITYShare capital 5 5 5Share premium 167 152 135Merger reserves 287 287 287Other reserves (567) (552) (521)Retained earnings 6,443 6,672 6,924
Total equity 6,335 6,564 6,830Total equity and liabilities 19,090 18,216 18,619
The accompanying notes are an integral part of these condensed consolidated interim financial statements.
P a g e | 18
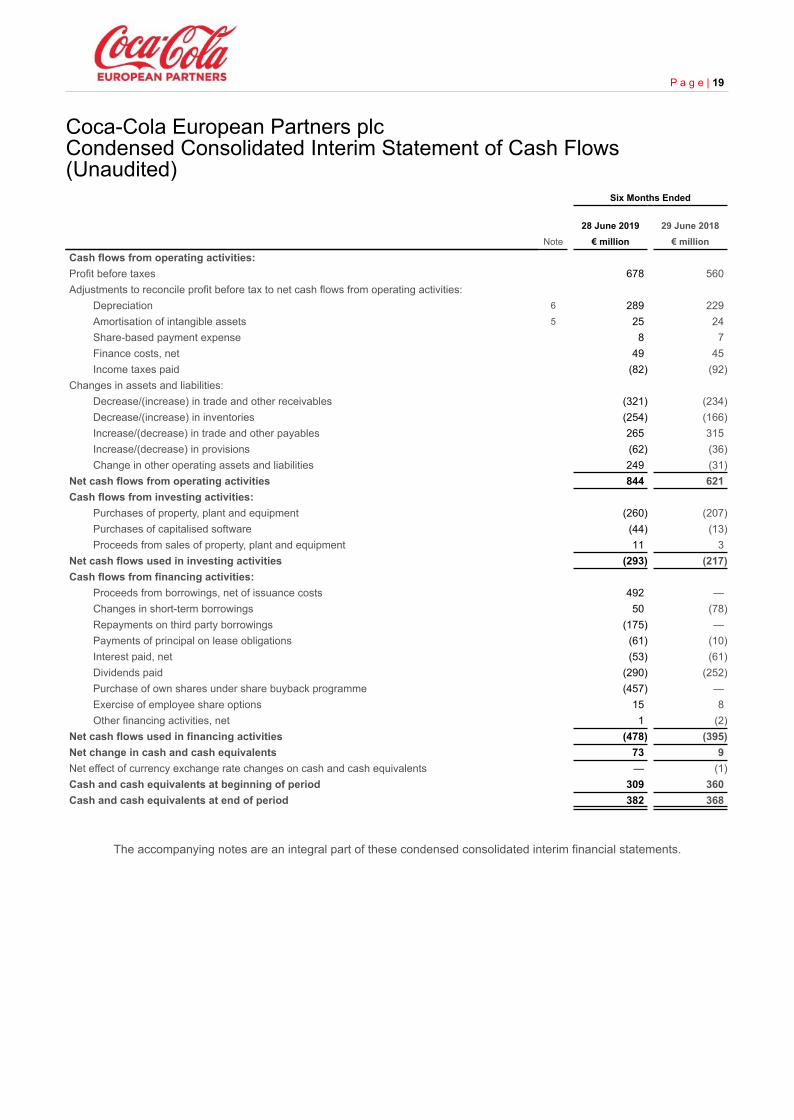
Coca-Cola European Partners plc Condensed Consolidated Interim Statement of Cash Flows(Unaudited)
Six Months Ended
28 June 2019 29 June 2018Note € million € million
Cash flows from operating activities:Profit before taxes 678 560Adjustments to reconcile profit before tax to net cash flows from operating activities:
Depreciation 6 289 229Amortisation of intangible assets 5 25 24Share-based payment expense 8 7Finance costs, net 49 45Income taxes paid (82) (92)
Changes in assets and liabilities:Decrease/(increase) in trade and other receivables (321) (234)Decrease/(increase) in inventories (254) (166)Increase/(decrease) in trade and other payables 265 315Increase/(decrease) in provisions (62) (36)Change in other operating assets and liabilities 249 (31)
Net cash flows from operating activities 844 621Cash flows from investing activities:
Purchases of property, plant and equipment (260) (207)Purchases of capitalised software (44) (13)Proceeds from sales of property, plant and equipment 11 3
Net cash flows used in investing activities (293) (217)Cash flows from financing activities:
Proceeds from borrowings, net of issuance costs 492 —Changes in short-term borrowings 50 (78)Repayments on third party borrowings (175) —Payments of principal on lease obligations (61) (10)Interest paid, net (53) (61)Dividends paid (290) (252)Purchase of own shares under share buyback programme (457) —Exercise of employee share options 15 8Other financing activities, net 1 (2)
Net cash flows used in financing activities (478) (395)Net change in cash and cash equivalents 73 9Net effect of currency exchange rate changes on cash and cash equivalents — (1)Cash and cash equivalents at beginning of period 309 360Cash and cash equivalents at end of period 382 368
The accompanying notes are an integral part of these condensed consolidated interim financial statements.
P a g e | 19
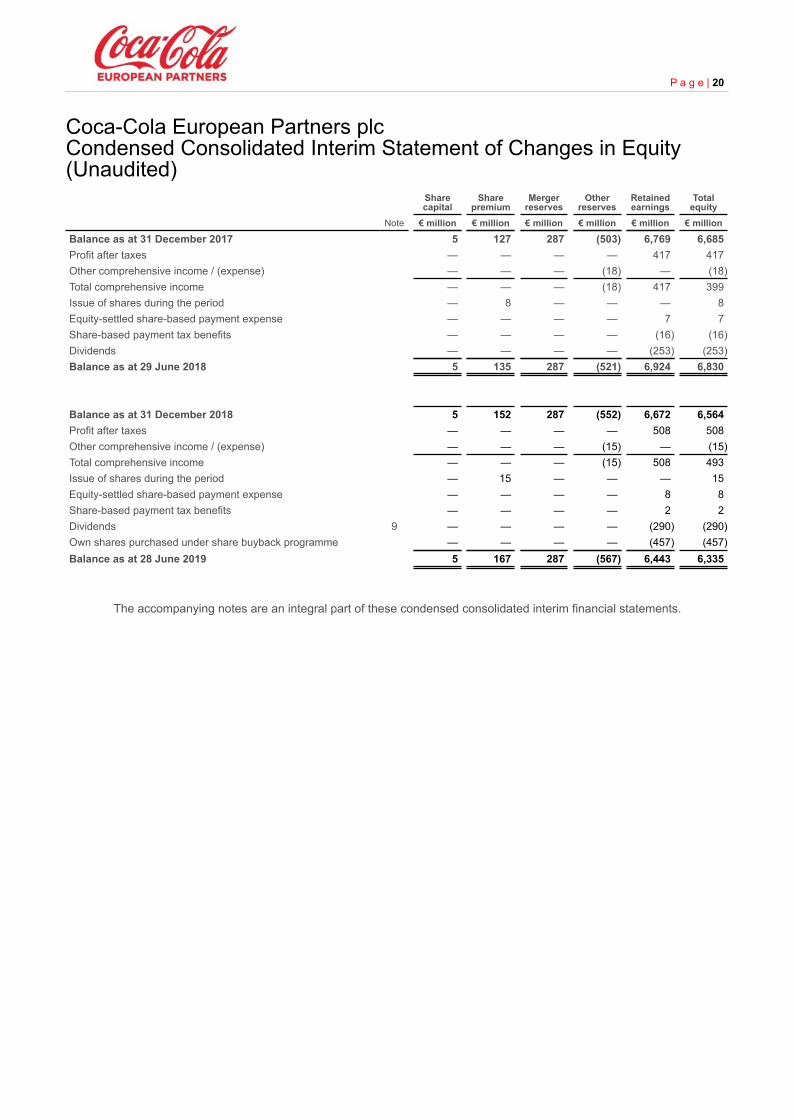
Coca-Cola European Partners plc Condensed Consolidated Interim Statement of Changes in Equity(Unaudited)
Sharecapital
Sharepremium
Mergerreserves
Otherreserves
Retainedearnings
Totalequity
Note € million € million € million € million € million € million
Balance as at 31 December 2017 5 127 287 (503) 6,769 6,685Profit after taxes — — — — 417 417Other comprehensive income / (expense) — — — (18) — (18)Total comprehensive income — — — (18) 417 399Issue of shares during the period — 8 — — — 8Equity-settled share-based payment expense — — — — 7 7Share-based payment tax benefits — — — — (16) (16)Dividends — — — — (253) (253)Balance as at 29 June 2018 5 135 287 (521) 6,924 6,830
Balance as at 31 December 2018 5 152 287 (552) 6,672 6,564Profit after taxes — — — — 508 508Other comprehensive income / (expense) — — — (15) — (15)Total comprehensive income — — — (15) 508 493Issue of shares during the period — 15 — — — 15Equity-settled share-based payment expense — — — — 8 8Share-based payment tax benefits — — — — 2 2Dividends 9 — — — — (290) (290)Own shares purchased under share buyback programme — — — — (457) (457)Balance as at 28 June 2019 5 167 287 (567) 6,443 6,335
The accompanying notes are an integral part of these condensed consolidated interim financial statements.
P a g e | 20
Notes to the Condensed Consolidated Interim Financial StatementsNote 1 GENERAL INFORMATION AND BASIS OF PREPARATION
Coca-Cola European Partners plc (the Company) and its subsidiaries (together CCEP, the Group) are a leading consumer goodsgroup in Western Europe making, selling and distributing an extensive range of non-alcoholic ready-to-drink beverages. TheGroup is the world’s largest independent Coca-Cola bottler based on revenue. CCEP serves a consumer population of over300 million across Western Europe, including Andorra, Belgium, continental France, Germany, Great Britain, Iceland,Luxembourg, Monaco, the Netherlands, Norway, Portugal, Spain and Sweden. CCEP is a public company limited by shares,incorporated under the laws of England and Wales with the registered number in England of 09717350. The Group’s sharesare listed and traded on Euronext Amsterdam, the New York Stock Exchange, London Stock Exchange and on the SpanishStock Exchanges. The address of the Company’s registered office is Pemberton House, Bakers Road, Uxbridge, MiddlesexUB8 1EZ, United Kingdom.
These condensed consolidated interim financial statements do not constitute statutory accounts as defined by Section 434 ofthe Companies Act 2006. They have been reviewed but not audited by the Group’s auditor, unless otherwise stated. The statutoryaccounts for the Company for the year ended 31 December 2018, which were prepared in accordance with IFRS as issued bythe International Accounting Standards Board (IASB), IFRS as adopted by the European Union and in accordance with theprovisions of the Companies Act 2006, have been delivered to the Registrar of Companies. The auditor’s opinion on thoseaccounts was unqualified and did not contain a statement made under section 498 (2) or (3) of the Companies Act 2006.
The condensed consolidated interim financial statements of the Group for the six months ended 28 June 2019 were approvedand signed by Damian Gammell, Chief Executive Officer on 8 August 2019 having been duly authorised to do so by the Boardof Directors.
Basis of Preparation and Accounting PoliciesThe condensed consolidated interim financial statements of the Group have been prepared in accordance with the DisclosureGuidance and Transparency Rules of the Financial Conduct Authority and International Accounting Standard 34, “InterimFinancial Reporting” (IAS 34) and should be read in conjunction with our 2018 Consolidated Financial Statements. The 2018Consolidated Financial Statements were prepared in accordance with IFRS as issued by the IASB, IFRS as adopted by theEuropean Union and in accordance with the provisions of the Companies Act 2006.
The 2018 Consolidated Financial Statements include a full description of the Group’s accounting policies. The same accountingpolicies and methods of computation have been used as described in the 2018 Consolidated Financial Statements, with theexception of taxes on income and the adoption of IFRS 16, “Leases” as set out in Note 2. Taxes on income in interim periodsare accrued using the tax rate that would be applicable to expected total annual profit or loss.
For consistent preparation, the amount within the Condensed Consolidated Interim Statement of Cash Flows for the six monthsended 29 June 2018 relating to payments of principal on lease obligations has been presented in line with current yearclassification. There has been no change in our net cash flows from financing activities for the six months ended 29 June 2018.
Reporting periodsResults are presented for the interim period from 1 January 2019 to 28 June 2019.
The Group’s financial year ends on 31 December. For half-yearly reporting convenience, the first six month period closes onthe Friday closest to the end of the interim calendar period. There was one less selling day in the six months ended 28 June2019 versus the six months ended 29 June 2018, and there will be one more selling day in the second six months of 2019 versusthe second six months of 2018 (based upon a standard five-day selling week).
The following table summarises the number of selling days, for the years ended 31 December 2019 and 31 December 2018(based on a standard five-day selling week):
Half year Full year2019 129 2612018 130 261Change -1 0
Trading seasonalityOperating results for the first half of 2019 may not be indicative of the results expected for the year ended 31 December 2019as sales of the Group’s products are seasonal, with the second and third quarters accounting for higher unit sales of the Group’sproducts than the first and fourth quarters. The seasonality of the Group’s sales volume, combined with the accounting for fixedcosts such as depreciation, amortisation, rent and interest expense, impacts the Group’s results for the first half of the year.
P a g e | 21
Additionally, year-over-year shifts in holidays, selling days and weather patterns can impact the Group’s results on an annualor half-yearly basis.
Exchange ratesThe Group’s reporting currency is the Euro. CCEP translates the income statements of non-Euro functional currency subsidiaryoperations to the Euro at average exchange rates and the balance sheets at the closing exchange rate as at the end of theperiod.
The principal exchange rates used for translation purposes in respect of one Euro were:
Average for the Six Months Ended Closing as at28 June 2019 29 June 2018 28 June 2019 31 December 2018 29 June 2018
UK Sterling 1.14 1.14 1.12 1.12 1.13US Dollar 0.89 0.83 0.88 0.87 0.86Norwegian Krone 0.10 0.10 0.10 0.10 0.11Swedish Krone 0.10 0.10 0.09 0.10 0.10Icelandic Krone 0.01 0.01 0.01 0.01 0.01
P a g e | 22
Note 2
IFRS 16 LEASESOn 1 January 2019, the Group adopted IFRS 16, “Leases” on a modified retrospective basis from 1 January 2019. The Grouphas not restated its 2018 financial statements as permitted under the specific transitional provisions in the standard. The impactfrom the new leasing standard is therefore recognised in the opening balance sheet on 1 January 2019.
Prior to the adoption of IFRS 16, the Group classified and accounted for each of its leases (as lessee) as either a finance leaseor an operating lease under the principles of IAS 17, “Leases”. Finance leases were capitalised at the commencement of thelease at the inception date fair value of the leased asset or, if lower, at the present value of the minimum lease payments. Leasepayments were apportioned between interest and reduction of the lease liability. For operating leases, the leased asset was notcapitalised and the lease payments were recognised as rent expense in the statement of profit or loss on a straight-line basisover the lease term. Any prepaid rent and accrued rent were recognised under Prepayments and Trade and other payables,respectively.
The objective of IFRS 16 is to ensure a single lessee accounting model and requires a lessee to recognise assets and liabilitiesfor all leases with a term of more than 12 months, unless the underlying asset is of low value. The lease liability was initiallymeasured at the present value of lease payments, discounted using the Group’s incremental borrowing rate (IBR). The weightedaverage incremental borrowing rate applied to the lease liabilities on 1 January 2019 was 1.30 percent. The lease term comprisesthe non-cancellable period of the contract, together with periods covered by an option to extend the lease whenever the Groupis reasonably certain to exercise that option. Subsequently, the lease liability is measured by increasing the carrying amount toreflect interest on the lease liability and reducing it by lease payments made.
In adopting IFRS 16 Leases, the following expedients were applied:
• The right of use asset is measured at the value of the lease liability, adjusted for any prepaid or accrued lease payments.
• A single discount rate applied to a portfolio of leases with reasonably similar characteristics.
• On adoption, the Group used hindsight in determining lease term.
• Short-term lease exemption applied to Machinery & Equipment and IT asset classes for leases expiring within 12months of 1 January 2019.
• Reliance on previous assessments on whether leases were onerous immediately before the date of initial application.
The Group does not separate lease from non-lease components for each of its lease categories, except for property leases. Forproperty leases, only base rent is included in the calculation of the right of use asset. All low value leases with total minimumlease payments under €5,000 are expensed on a straight line basis. The assessment of low value for a leased asset is madeon the basis of the value of an asset when it is (or was) new, regardless of whether the actual asset being leased is new.
For leases previously classified as finance leases, the Group recognised the carrying amount of the lease asset and leaseliability immediately before transition as the carrying amount of the right of use asset and the lease liability at the date of adoption.The measurement principles of IFRS 16 are only applied after that date. This resulted in measurement adjustments of €6 millionrelating to non-lease components of finance leases that were included in the lease liability calculation for certain asset classes.The remeasurements to lease liabilities were recognised as adjustments to the related right of use assets immediately after thedate of initial application.
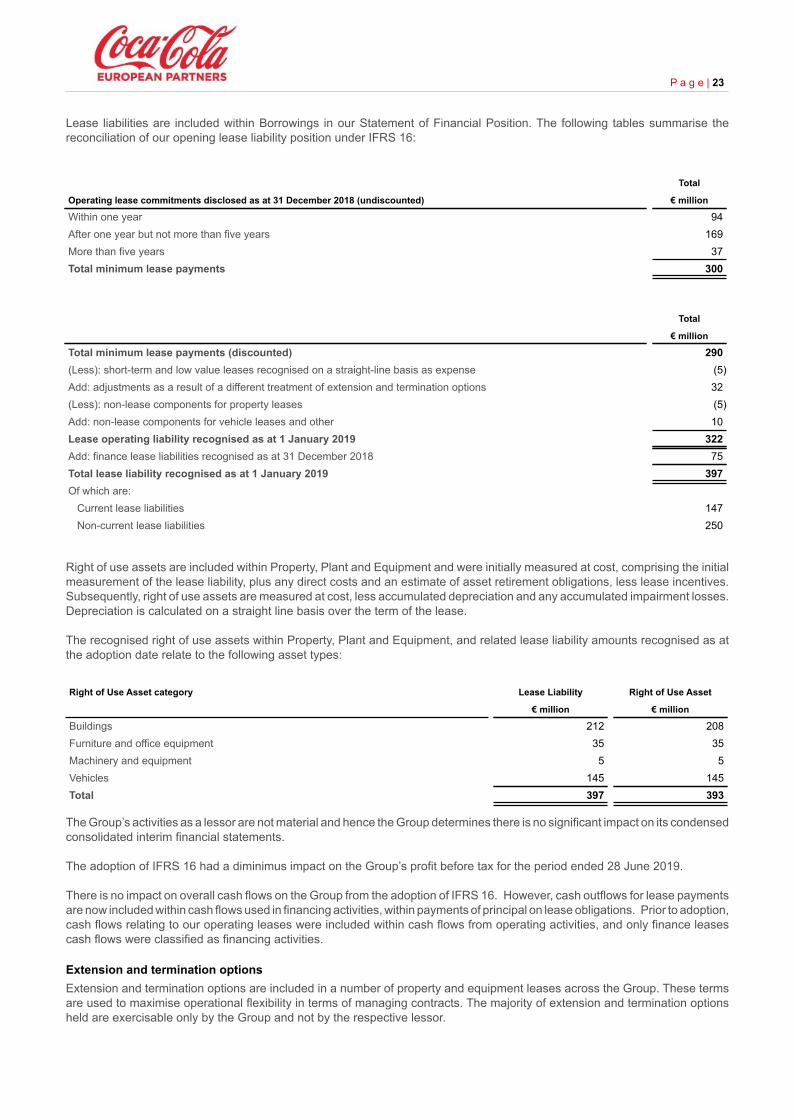
Lease liabilities are included within Borrowings in our Statement of Financial Position. The following tables summarise thereconciliation of our opening lease liability position under IFRS 16:
Operating lease commitments disclosed as at 31 December 2018 (undiscounted)
Total
€ million
Within one year 94After one year but not more than five years 169More than five years 37Total minimum lease payments 300
Total
€ million
Total minimum lease payments (discounted) 290(Less): short-term and low value leases recognised on a straight-line basis as expense (5)Add: adjustments as a result of a different treatment of extension and termination options 32(Less): non-lease components for property leases (5)Add: non-lease components for vehicle leases and other 10Lease operating liability recognised as at 1 January 2019 322Add: finance lease liabilities recognised as at 31 December 2018 75Total lease liability recognised as at 1 January 2019 397Of which are: Current lease liabilities 147 Non-current lease liabilities 250
Right of use assets are included within Property, Plant and Equipment and were initially measured at cost, comprising the initialmeasurement of the lease liability, plus any direct costs and an estimate of asset retirement obligations, less lease incentives.Subsequently, right of use assets are measured at cost, less accumulated depreciation and any accumulated impairment losses.Depreciation is calculated on a straight line basis over the term of the lease.
The recognised right of use assets within Property, Plant and Equipment, and related lease liability amounts recognised as atthe adoption date relate to the following asset types:
Right of Use Asset category Lease Liability Right of Use Asset
€ million € million
Buildings 212 208Furniture and office equipment 35 35Machinery and equipment 5 5Vehicles 145 145Total 397 393
The Group’s activities as a lessor are not material and hence the Group determines there is no significant impact on its condensedconsolidated interim financial statements.
The adoption of IFRS 16 had a diminimus impact on the Group’s profit before tax for the period ended 28 June 2019.
There is no impact on overall cash flows on the Group from the adoption of IFRS 16. However, cash outflows for lease paymentsare now included within cash flows used in financing activities, within payments of principal on lease obligations. Prior to adoption,cash flows relating to our operating leases were included within cash flows from operating activities, and only finance leasescash flows were classified as financing activities.
Extension and termination optionsExtension and termination options are included in a number of property and equipment leases across the Group. These termsare used to maximise operational flexibility in terms of managing contracts. The majority of extension and termination optionsheld are exercisable only by the Group and not by the respective lessor.
P a g e | 23
In determining the lease term, the Group considers all facts and circumstances associated with exercising an extension ortermination option. Extension options (or periods after termination options) are only included in the lease term if the lease isreasonably certain to be extended (or not terminated). The assessment is reviewed if a significant event or a significant changein circumstances occurs which affects this assessment and that is within the control of the lessee.
P a g e | 24
Note 3OPERATING SEGMENT
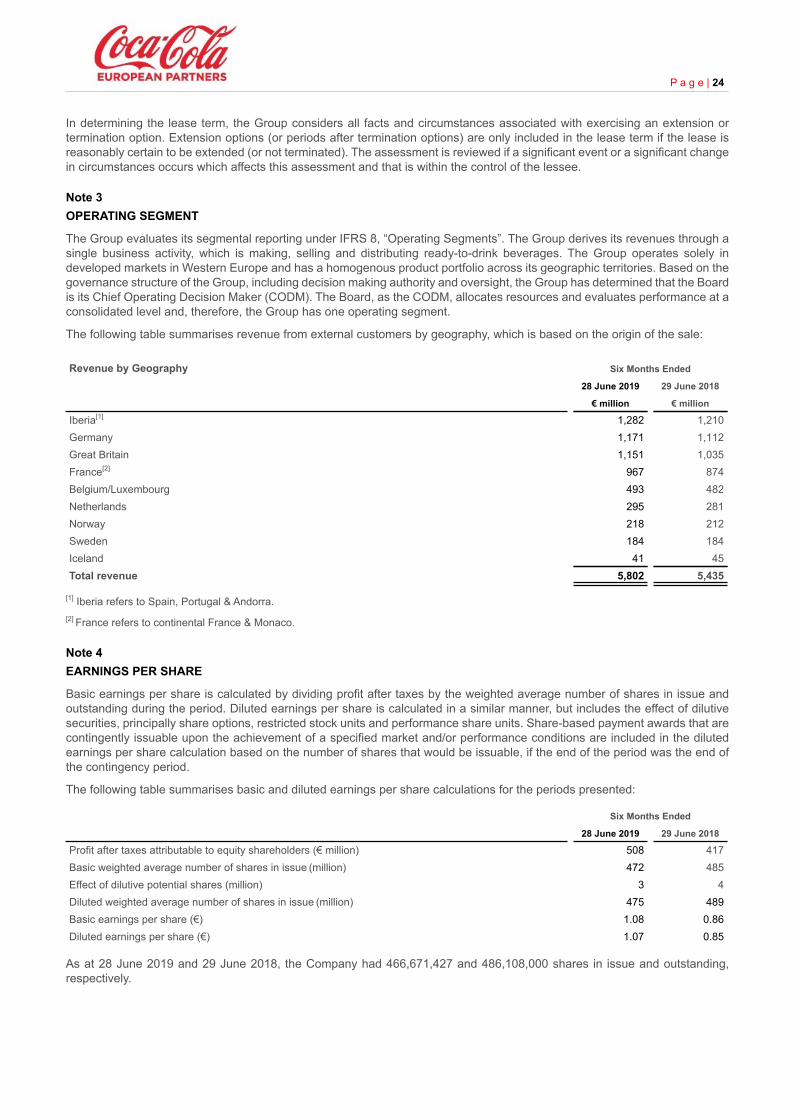
The Group evaluates its segmental reporting under IFRS 8, “Operating Segments”. The Group derives its revenues through asingle business activity, which is making, selling and distributing ready-to-drink beverages. The Group operates solely indeveloped markets in Western Europe and has a homogenous product portfolio across its geographic territories. Based on thegovernance structure of the Group, including decision making authority and oversight, the Group has determined that the Boardis its Chief Operating Decision Maker (CODM). The Board, as the CODM, allocates resources and evaluates performance at aconsolidated level and, therefore, the Group has one operating segment.
The following table summarises revenue from external customers by geography, which is based on the origin of the sale:
Revenue by Geography Six Months Ended
28 June 2019 29 June 2018
€ million € million
Iberia[1] 1,282 1,210Germany 1,171 1,112Great Britain 1,151 1,035France[2] 967 874Belgium/Luxembourg 493 482Netherlands 295 281Norway 218 212Sweden 184 184Iceland 41 45Total revenue 5,802 5,435
[1] Iberia refers to Spain, Portugal & Andorra.[2] France refers to continental France & Monaco.
Note 4 EARNINGS PER SHARE
Basic earnings per share is calculated by dividing profit after taxes by the weighted average number of shares in issue andoutstanding during the period. Diluted earnings per share is calculated in a similar manner, but includes the effect of dilutivesecurities, principally share options, restricted stock units and performance share units. Share-based payment awards that arecontingently issuable upon the achievement of a specified market and/or performance conditions are included in the dilutedearnings per share calculation based on the number of shares that would be issuable, if the end of the period was the end ofthe contingency period.
The following table summarises basic and diluted earnings per share calculations for the periods presented:
Six Months Ended
28 June 2019 29 June 2018
Profit after taxes attributable to equity shareholders (€ million) 508 417Basic weighted average number of shares in issue (million) 472 485Effect of dilutive potential shares (million) 3 4Diluted weighted average number of shares in issue (million) 475 489Basic earnings per share (€) 1.08 0.86Diluted earnings per share (€) 1.07 0.85
As at 28 June 2019 and 29 June 2018, the Company had 466,671,427 and 486,108,000 shares in issue and outstanding,respectively.

For the six months ended 28 June 2019, there were no outstanding options to purchase shares excluded from the dilutedearnings per share calculation. For the six months ended 29 June 2018, outstanding options to purchase 0.7 million shareswere excluded from the diluted earnings per share calculation because the effect of including these options in the computationwould have been antidilutive. The dilutive impact of the remaining options outstanding and unvested restricted share units wasincluded in the effect of dilutive securities.
P a g e | 25
Note 5 INTANGIBLE ASSETS AND GOODWILL
The following table summarises the movement in net book value for intangible assets and goodwill during the six monthsended 28 June 2019:
Intangibleassets Goodwill
€ million € million
Net book value as at 31 December 2018 8,384 2,518Additions 43 —Amortisation expense (25) —Currency translation adjustments (10) 3Net book value as at 28 June 2019 8,392 2,521
Note 6 PROPERTY, PLANT AND EQUIPMENT
The following table summarises the movement in net book value for property, plant and equipment during the six months ended28 June 2019:
Total
€ million
Net book value as at 31 December 2018 3,888Adjustment for adoption of IFRS 16[1] 322Additions 293Disposals (31)Depreciation expense (289)Currency translation adjustments 1Net book value as at 28 June 2019 4,184
[1] Adjustment for the adoption of IFRS 16, “Leases” on 1 January 2019, as described in Note 2.
During the period the Group commenced a transformation project relating to our cold drink operations aimed at delivering amodern, differentiated and versatile equipment fleet in order to optimise net cooler placements throughout our markets. As partof this strategy, our capital expenditure on cold drink equipment will focus on the introduction of a new, more cost effective coolerinto our markets, whilst reducing maintenance and refurbishment support spending on our older equipment. We began rollingout the new commercial strategy during the first half of 2019. As a result of the operational impact of the strategic changes, weincurred a non-cash restructuring charge in the period of €24 million relating to the write down and accelerated depreciation ofaged cold drink equipment assets. We expect the majority of the aged cold drink equipment assets to be removed from customerlocations over a reasonable period of time and replaced with newer equipment.
Note 7 FAIR VALUES AND FINANCIAL RISK MANAGEMENT
Fair Value MeasurementsAll assets and liabilities for which fair value is measured or disclosed in the condensed consolidated interim financial statementsare categorised in the fair value hierarchy as described in our 2018 Consolidated Financial Statements.
The fair values of the Group’s cash and cash equivalents, trade accounts receivable, amounts receivable from related parties,trade and other payables, and amounts payable to related parties approximate their carrying amounts due to their short-termnature.

The fair values of the Group’s borrowings are estimated based on borrowings with similar maturities and credit quality andcurrent market interest rates. These are categorised in Level 2 of the fair value hierarchy as the Group uses certain pricingmodels and quoted prices for similar liabilities in active markets in assessing their fair values. The total fair value of borrowingsas at 28 June 2019 and 31 December 2018, was €6.6 billion and €5.7 billion, respectively. This compared to the carrying valueof total borrowings as at 28 June 2019 and 31 December 2018 of €6.3 billion and €5.6 billion, respectively. Refer to Note 8 forfurther details regarding the Group’s borrowings.
The Group’s derivative assets and liabilities are carried at fair value, which is determined using a variety of valuation techniques,depending on the specific characteristics of the hedging instrument taking into account credit risk. The fair value of our derivativecontracts (including forwards, options, cross-currency swaps and interest rate swaps) are determined using standard valuationmodels. The significant inputs used in these models are readily available in public markets or can be derived from observablemarket transactions and, therefore, the derivative contracts have been classified as Level 2. Inputs used in these standardvaluation models include the applicable spot, forward, and discount rates. The standard valuation model for the option contractsalso includes implied volatility, which is specific to individual options and is based on rates quoted from a widely used third-partyresource. As at 28 June 2019 and 31 December 2018, the total value of derivative assets was €13 million and €15 million,respectively. As at 28 June 2019 and 31 December 2018, the total value of derivative liabilities was €61 million and €71 million,respectively.
For assets and liabilities that are recognised in the condensed consolidated interim financial statements on a recurring basis,the Group determines whether transfers have occurred between levels in the hierarchy by re-assessing categorisation at theend of each reporting period. There have been no transfers between Level 1 and Level 2 during the periods presented.
Financial Instruments Risk Management Objectives and PoliciesThe Group’s activities expose it to several financial risks including market risk, credit risk, and liquidity risk. Financial risk activitiesare governed by appropriate policies and procedures to minimise the uncertainties these risks create over the Group’s futurecash flows. Such policies are developed and approved by the Group’s Treasury and Commodities Risk Committee through theauthority provided to it by the Group’s Board of Directors. There have been no changes in the risk management policies sincethe year end.
P a g e | 26
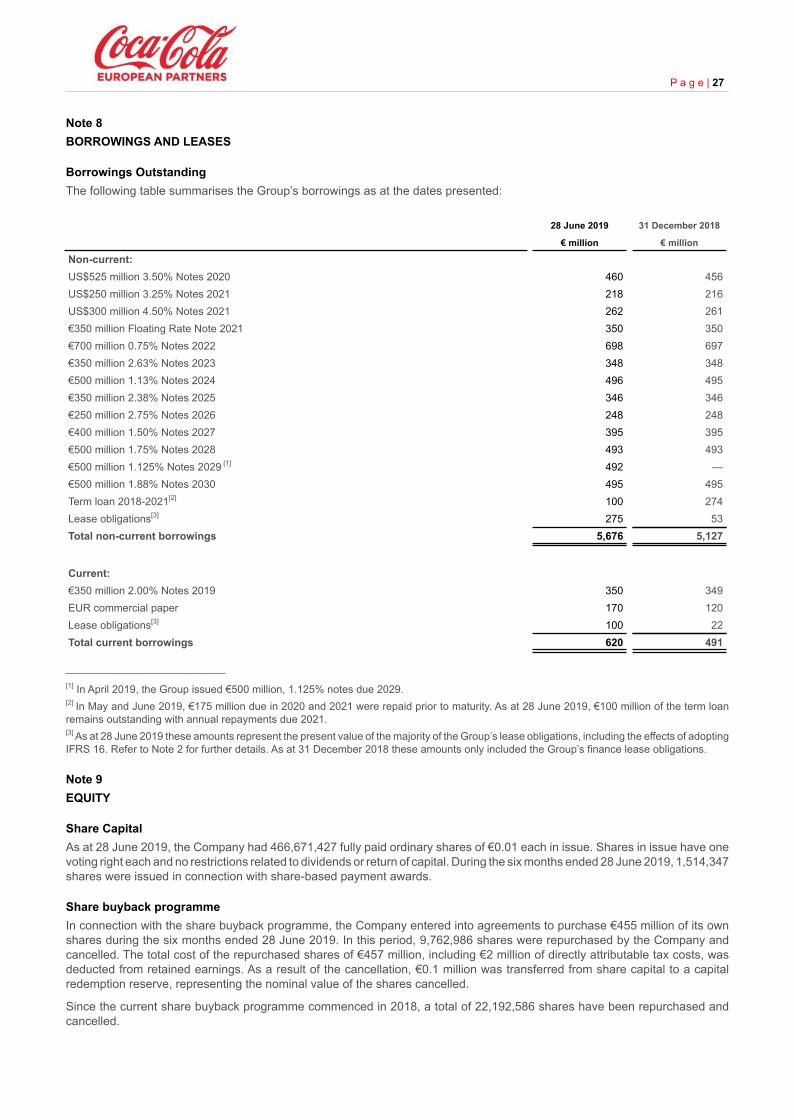
Note 8 BORROWINGS AND LEASES
Borrowings OutstandingThe following table summarises the Group’s borrowings as at the dates presented:
28 June 2019 31 December 2018
€ million € million
Non-current:US$525 million 3.50% Notes 2020 460 456US$250 million 3.25% Notes 2021 218 216US$300 million 4.50% Notes 2021 262 261€350 million Floating Rate Note 2021 350 350€700 million 0.75% Notes 2022 698 697€350 million 2.63% Notes 2023 348 348€500 million 1.13% Notes 2024 496 495€350 million 2.38% Notes 2025 346 346€250 million 2.75% Notes 2026 248 248€400 million 1.50% Notes 2027 395 395€500 million 1.75% Notes 2028 493 493€500 million 1.125% Notes 2029 [1] 492 —€500 million 1.88% Notes 2030 495 495Term loan 2018-2021[2] 100 274Lease obligations[3] 275 53Total non-current borrowings 5,676 5,127
Current:€350 million 2.00% Notes 2019 350 349EUR commercial paper 170 120Lease obligations[3] 100 22Total current borrowings 620 491
___________________________[1] In April 2019, the Group issued €500 million, 1.125% notes due 2029.[2] In May and June 2019, €175 million due in 2020 and 2021 were repaid prior to maturity. As at 28 June 2019, €100 million of the term loanremains outstanding with annual repayments due 2021.[3] As at 28 June 2019 these amounts represent the present value of the majority of the Group’s lease obligations, including the effects of adoptingIFRS 16. Refer to Note 2 for further details. As at 31 December 2018 these amounts only included the Group’s finance lease obligations.
P a g e | 27
Note 9 EQUITY
Share CapitalAs at 28 June 2019, the Company had 466,671,427 fully paid ordinary shares of €0.01 each in issue. Shares in issue have onevoting right each and no restrictions related to dividends or return of capital. During the six months ended 28 June 2019, 1,514,347shares were issued in connection with share-based payment awards.
Share buyback programmeIn connection with the share buyback programme, the Company entered into agreements to purchase €455 million of its ownshares during the six months ended 28 June 2019. In this period, 9,762,986 shares were repurchased by the Company andcancelled. The total cost of the repurchased shares of €457 million, including €2 million of directly attributable tax costs, wasdeducted from retained earnings. As a result of the cancellation, €0.1 million was transferred from share capital to a capitalredemption reserve, representing the nominal value of the shares cancelled.
Since the current share buyback programme commenced in 2018, a total of 22,192,586 shares have been repurchased andcancelled.

DividendsOn 30 April 2019, the Company declared a first half interim dividend of €0.62 per share, which was paid on 6 June 2019.
P a g e | 28
Note 10 RELATED PARTY TRANSACTIONS
For the purpose of these condensed consolidated interim financial statements, transactions with related parties mainly comprisetransactions between subsidiaries of the Group and the related parties of the Group.
Transactions with The Coca-Cola Company (TCCC)TCCC exhibits significant influence over the Group, as defined by IAS 24, “Related Party Disclosures”. As at 28 June 2019,18.9% of the total outstanding ordinary shares in the Group were owned by European Refreshments, a wholly owned subsidiaryof TCCC. The Group is a key bottler of TCCC products and has entered into bottling agreements with TCCC to sell, make anddistribute products of TCCC in the Group’s territories. The Group purchases concentrate from TCCC and also receives marketingfunding to help promote the sale of TCCC products. Bottling agreements with TCCC for each of the Group’s territories extendthrough 28 May 2026, with terms of 10 years, with each containing the right for the Group to request a 10-year renewal.Additionally, two of the Group’s 17 Directors were nominated by TCCC, one of whom is also an employee of TCCC.
The principal transactions with TCCC are for the purchase of concentrate, syrup and finished product. The following tablesummarises the transactions with TCCC that directly impacted the Condensed Consolidated Interim Income Statement for theperiods presented:
Six Months Ended
28 June 2019 29 June 2018
€ million € million
Amounts affecting revenue[1] 31 29Amounts affecting cost of sales[2] (1,610) (1,429)Amounts affecting operating expenses[3] (10) 2Total net amount affecting the Consolidated Income Statement (1,589) (1,398)
[1] Amounts principally relate to fountain syrup and packaged product sales.[2] Amounts principally relate to the purchase of concentrate, syrup, mineral water and juice as well as funding for marketing programmes. [3] Amounts principally relate to certain costs associated with new product development initiatives.
The following table summarises the transactions with TCCC that impacted the Consolidated Statement of Financial Position asat the dates presented:
28 June 2019 31 December 2018
€ million € million
Amount due from TCCC 108 101
Amount payable to TCCC 356 166
Transactions with Cobega companiesCobega exhibits significant influence over the Group, as defined by IAS 24, “Related Party Disclosures”. Cobega S.A. indirectlyowned 19.8% of the total outstanding ordinary shares of the Group as at 28 June 2019 through its ownership interest in OlivePartners S.A. Additionally, five of the Group’s 17 Directors, including the Chairman, were nominated by Olive Partners S.A.,three of whom are affiliated with Cobega S.A.
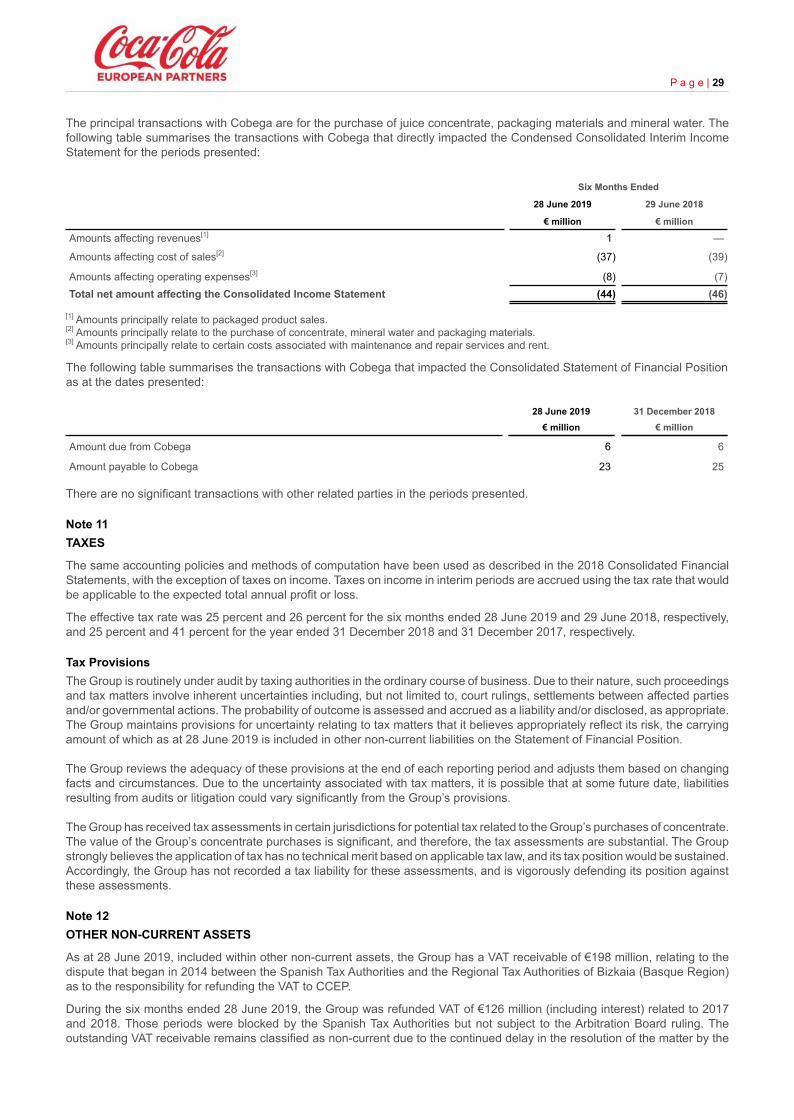
The principal transactions with Cobega are for the purchase of juice concentrate, packaging materials and mineral water. Thefollowing table summarises the transactions with Cobega that directly impacted the Condensed Consolidated Interim IncomeStatement for the periods presented:
Six Months Ended
28 June 2019 29 June 2018
€ million € million
Amounts affecting revenues[1] 1 —
Amounts affecting cost of sales[2] (37) (39)
Amounts affecting operating expenses[3] (8) (7)Total net amount affecting the Consolidated Income Statement (44) (46)
[1] Amounts principally relate to packaged product sales.[2] Amounts principally relate to the purchase of concentrate, mineral water and packaging materials. [3] Amounts principally relate to certain costs associated with maintenance and repair services and rent.
The following table summarises the transactions with Cobega that impacted the Consolidated Statement of Financial Positionas at the dates presented:
28 June 2019 31 December 2018€ million € million
Amount due from Cobega 6 6
Amount payable to Cobega 23 25
There are no significant transactions with other related parties in the periods presented.
P a g e | 29
Note 11 TAXES
The same accounting policies and methods of computation have been used as described in the 2018 Consolidated FinancialStatements, with the exception of taxes on income. Taxes on income in interim periods are accrued using the tax rate that wouldbe applicable to the expected total annual profit or loss.
The effective tax rate was 25 percent and 26 percent for the six months ended 28 June 2019 and 29 June 2018, respectively,and 25 percent and 41 percent for the year ended 31 December 2018 and 31 December 2017, respectively.
Tax ProvisionsThe Group is routinely under audit by taxing authorities in the ordinary course of business. Due to their nature, such proceedingsand tax matters involve inherent uncertainties including, but not limited to, court rulings, settlements between affected partiesand/or governmental actions. The probability of outcome is assessed and accrued as a liability and/or disclosed, as appropriate.The Group maintains provisions for uncertainty relating to tax matters that it believes appropriately reflect its risk, the carryingamount of which as at 28 June 2019 is included in other non-current liabilities on the Statement of Financial Position.
The Group reviews the adequacy of these provisions at the end of each reporting period and adjusts them based on changingfacts and circumstances. Due to the uncertainty associated with tax matters, it is possible that at some future date, liabilitiesresulting from audits or litigation could vary significantly from the Group’s provisions.
The Group has received tax assessments in certain jurisdictions for potential tax related to the Group’s purchases of concentrate.The value of the Group’s concentrate purchases is significant, and therefore, the tax assessments are substantial. The Groupstrongly believes the application of tax has no technical merit based on applicable tax law, and its tax position would be sustained.Accordingly, the Group has not recorded a tax liability for these assessments, and is vigorously defending its position againstthese assessments.
Note 12 OTHER NON-CURRENT ASSETS
As at 28 June 2019, included within other non-current assets, the Group has a VAT receivable of €198 million, relating to thedispute that began in 2014 between the Spanish Tax Authorities and the Regional Tax Authorities of Bizkaia (Basque Region)as to the responsibility for refunding the VAT to CCEP.
During the six months ended 28 June 2019, the Group was refunded VAT of €126 million (including interest) related to 2017and 2018. Those periods were blocked by the Spanish Tax Authorities but not subject to the Arbitration Board ruling. Theoutstanding VAT receivable remains classified as non-current due to the continued delay in the resolution of the matter by the
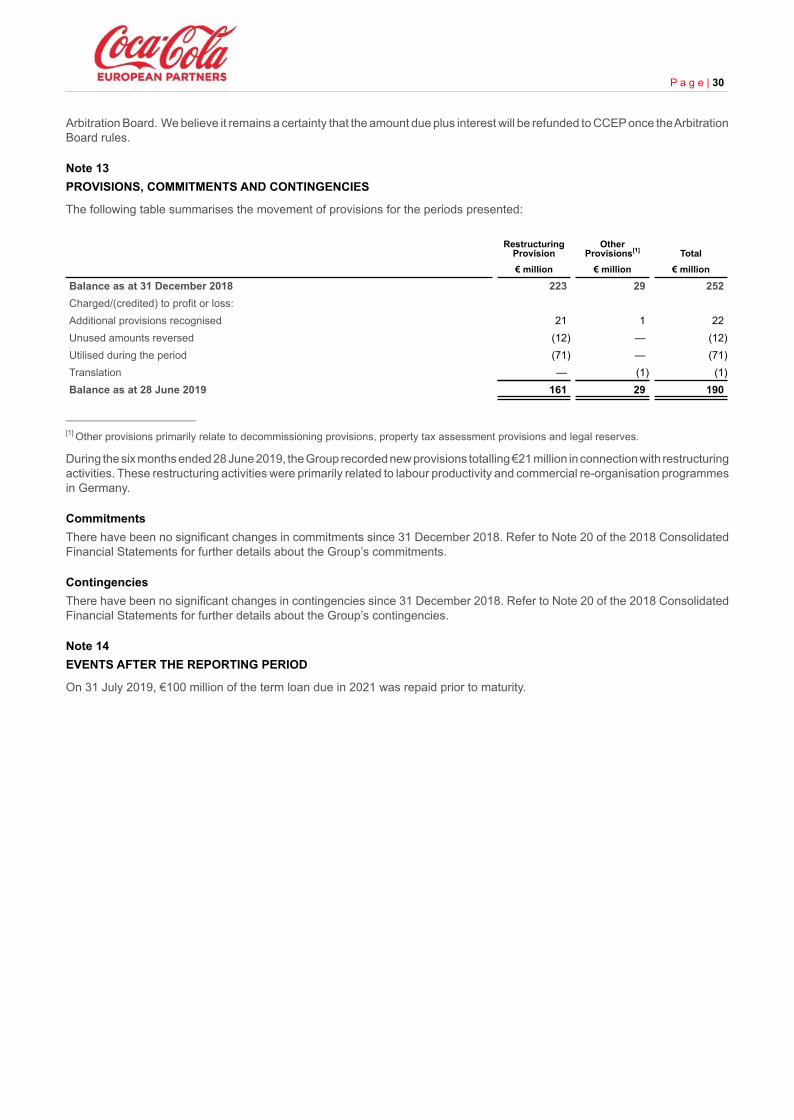
Arbitration Board. We believe it remains a certainty that the amount due plus interest will be refunded to CCEP once the ArbitrationBoard rules.
P a g e | 30
Note 13 PROVISIONS, COMMITMENTS AND CONTINGENCIES
The following table summarises the movement of provisions for the periods presented:
RestructuringProvision
OtherProvisions[1] Total
€ million € million € million
Balance as at 31 December 2018 223 29 252Charged/(credited) to profit or loss:Additional provisions recognised 21 1 22Unused amounts reversed (12) — (12)Utilised during the period (71) — (71)Translation — (1) (1)Balance as at 28 June 2019 161 29 190
______________________[1] Other provisions primarily relate to decommissioning provisions, property tax assessment provisions and legal reserves.
During the six months ended 28 June 2019, the Group recorded new provisions totalling €21 million in connection with restructuringactivities. These restructuring activities were primarily related to labour productivity and commercial re-organisation programmesin Germany.
CommitmentsThere have been no significant changes in commitments since 31 December 2018. Refer to Note 20 of the 2018 ConsolidatedFinancial Statements for further details about the Group’s commitments.
ContingenciesThere have been no significant changes in contingencies since 31 December 2018. Refer to Note 20 of the 2018 ConsolidatedFinancial Statements for further details about the Group’s contingencies.
Note 14 EVENTS AFTER THE REPORTING PERIOD
On 31 July 2019, €100 million of the term loan due in 2021 was repaid prior to maturity.