Cobar Management Pty Ltd - CSA · CMPL 2011 AEMR ii Cobar Management Pty Ltd CSA Mine Annual...
125
COBAR MANAGEMENT PTY LTD CSA Mine Annual Environmental Management Report AEMR 2011
Transcript of Cobar Management Pty Ltd - CSA · CMPL 2011 AEMR ii Cobar Management Pty Ltd CSA Mine Annual...
COBAR MANAGEMENT PTY LTD
CSA Mine
Annual Environmental Management Report
AEMR 2011

i
Blank Page
CMPL 2011 AEMR
ii
Cobar Management Pty Ltd
CSA Mine
Annual Environmental Management Report
2011
Name of Mine CSA Mine
Mining Leases CML 5
MOP Commencement Date: 01/01/2008 MOP Completion Date: 31/12/2012
AEMR Commencement Date: 01/01/2011 AEMR End Date: 31/12/2011
Name of Leaseholder: Isokind Pty Ltd.
Name of Mine Operator: Cobar Management Pty Ltd
Reporting Officer: Tanya Gilbert
Title: Manager - Health, Safety, Environment and Training
Signature
Date 31 January 2012
Cobar Management Pty Ltd
ABN: 38 083 171 546
PO Box 31, Cobar, NSW 2835
Tel: (02) 6836 5100
Fax: (02) 6836 2146
www.cmpl.com.au
CMPL 2011 AEMR
iii
CONTENTS 1 INTRODUCTION ....................................................................................................................................... 1
1.1 History of Operations ............................................................................................................................... 1
1.2 Consents, Leases and Licenses ................................................................................................................. 2
Mine Contacts .................................................................................................................................................... 5
1.3 Actions required from 2010 AEMR review ............................................................................................... 6
2 SUMMARY OF OPERATIONS DURING THE REPORTING PERIOD .......................................... 10
2.1 Mineral Exploration ............................................................................................................................... 11
2.2 Land Preparation.................................................................................................................................... 13
2.3 Construction ........................................................................................................................................... 14
2.4 Mining ..................................................................................................................................................... 16
2.5 Mineral Processing ................................................................................................................................. 22
2.6 Waste Management ................................................................................................................................. 25
2.7 Ore and Product Stockpiles .................................................................................................................... 28
2.8 Water Management ................................................................................................................................. 31
2.9 Hazardous Materials .............................................................................................................................. 43
2.10 Other Infrastructure Management ..................................................................................................... 48
3 ENVIRONMENTAL MANAGEMENT AND PERFORMANCE ........................................................ 51
3.1 Air Pollution ........................................................................................................................................... 51
3.2 Erosion and Sedimentation ..................................................................................................................... 61
3.3 Surface Water Quality ............................................................................................................................ 62
3.4 Ground Water ......................................................................................................................................... 66
3.5 Contaminated Polluted Land .................................................................................................................. 74
3.6 Threatened Flora .................................................................................................................................... 75
3.7 Threatened Fauna ................................................................................................................................... 76
3.8 Weeds ...................................................................................................................................................... 77
3.9 Blasting ................................................................................................................................................... 78
3.10 Operational Noise .............................................................................................................................. 78
3.11 Visual, Stray Light ............................................................................................................................. 78
3.12 Aboriginal Heritage ........................................................................................................................... 79
3.13 Natural and European Heritage ........................................................................................................ 80
3.14 Spontaneous Combustion ................................................................................................................... 81
3.15 Bushfire .............................................................................................................................................. 81
3.16 Mine Subsidence ................................................................................................................................ 81
3.17 Hydrocarbon Contamination ............................................................................................................. 82
3.18 Methane Drainage / Ventilation......................................................................................................... 82
3.19 Public Safety ...................................................................................................................................... 83
3.20 Other Issues and Risks ....................................................................................................................... 83
4 COMMUNITY RELATIONS .................................................................................................................. 91
CMPL 2011 AEMR
iv
4.1 Environmental Complaints ..................................................................................................................... 91
4.2 Community Liaison ................................................................................................................................. 91
5 REHABILITATION ................................................................................................................................. 99
5.1 Buildings ................................................................................................................................................. 99
5.2 Rehabilitation of Disturbed Land ........................................................................................................... 99
5.3 Other Infrastructure .............................................................................................................................. 103
5.4 Rehabilitation Trials and Research ...................................................................................................... 104
5.5 Further Development of the Final Rehabilitation Plan ........................................................................ 110
6 ACTIVITIES PROPOSED FOR 2012 ................................................................................................... 114
7 REFERENCES ........................................................................................................................................ 116
7.1 Plans ..................................................................................................................................................... 117
7.2 Appendices ............................................................................................................................................ 117
TABLES
Table 1 MOP Amendments during the 2008 - 2012 MOP Period ...................................................................... 2 Table 2 CMPL Mining and Exploration Leases (as at 31/12/11) ........................................................................ 3 Table 3 CMPL Land Tenure (as of 31/12/11) ..................................................................................................... 4 Table 4 CMPL Licences and Permits (as of 31/12/2011) ................................................................................... 4 Table 5 CSA Mine Management and Environmental Contacts .......................................................................... 5 Table 6 Actions Required from the 2010 AEMR Review .................................................................................. 7 Table 7 Update on Proposed activities for the 2011 AEMR Period .................................................................... 8 Table 8 Actual and Forecast Production (dmt) (as of 31/12/2011) ................................................................... 17 Table 9 Backfill Production and Final Tailings 2011 ....................................................................................... 18 Table 10 CMPL Current Mining Equipment (as of 31/12/11) .......................................................................... 19 Table 11 CSA Budget versus Actual Mine Production 2011 ............................................................................ 22 Table 12 Metal Recovery 2011 ......................................................................................................................... 23 Table 13 Reagent Consumption 2011 ............................................................................................................... 24 Table 14 CSA Identified Topsoil Stockpiles ..................................................................................................... 29 Table 15 CSA Cumulative Waste and Stockpile Production ............................................................................ 30 Table 16 Summary of Catchment Areas ........................................................................................................... 33 Table 17 CSA Mine Water Storage................................................................................................................... 36 Table 18 CSA 2011 Water Balance .................................................................................................................. 41 Table 19 CSA Bulk Hazardous and Dangerous Goods Storage (as of 31/12/11) ............................................. 45 Table 20 Comparison of NPI Emission Sources by Activity Levels for 2009-10 and 2010-11 ........................ 55 Table 21 Summary of CMPL Energy Consumption and Greenhouse Gas Emissions ...................................... 56 Table 22 Short-Medium Term Energy Saving and Carbon Emission Reduction Opportunities ....................... 58 Table 23 Long Term Energy Saving and Carbon Emission Reduction Opportunities ...................................... 58 Table 24 Priority Management Practice Actions .............................................................................................. 60 Table 25 CSA Surface Water Monitoring Results 2010 and 2011 .................................................................... 63 Table 26 STSF Piezometers and Trigger Depths .............................................................................................. 67 Table 27 CSA Piezometer Water Quality Monitoring Results 2011 ................................................................. 72 Table 28 CSA Environmental Incidents 2011 ................................................................................................... 89 Table 29 Land Use Options............................................................................................................................... 93 Table 30 CMPL Donation Recipients 2011 ...................................................................................................... 98 Table 31 LFA Rehabilitation Monitoring Results 2011 .................................................................................. 109 Table 32 Summary of Proposed Rehabilitation .............................................................................................. 112 Table 33 Maintenance Activities on Rehabilitated Land 2011 ....................................................................... 113 Table 34 Proposed activities for 2012 ............................................................................................................. 114
CMPL 2011 AEMR
v
FIGURES
Figure 1 CMPL Organisation Chart 2011 ........................................................................................................... 5 Figure 2 CSA Mine General Waste Management Performance 2011 ............................................................... 26 Figure 3 CSA Topsoil Stockpile Locations ....................................................................................................... 29 Figure 4 Burrendong Dam Water Storage Level (%) and Cumulative Rainfall (mm) 2011 ............................. 31 Figure 5 CSA Mine Catchment Boundaries 2011 ............................................................................................. 33 Figure 6 Long Term Raw Water Used per Tonne Milled ................................................................................. 40 Figure 7 CSA Mine Water Balance 2011 .......................................................................................................... 42 Figure 8 Backfill Sump Upgrade Design and Completed backfill Sump November 2011 ............................... 49 Figure 9 2011 Cobar Mean temperatures and CSA Mine Rainfall ................................................................... 51 Figure 10 CSA Depositional Dust Monitoring Results 2011 ............................................................................ 53 Figure 11 CSA Mine Total Energy Consumption (GJ) 2010 – 2011 ................................................................ 56 Figure 12 CSA Mine Total Greenhouse Gas Emissions (t CO2-e) 2010 - 2011 ............................................... 56 Figure 13 Management Practices Assessments – Level of Development ......................................................... 60 Figure 14 Erosion and Sediment Control Inspections 2011 .............................................................................. 61 Figure 15 CSA Piezometer Depths 2011 .......................................................................................................... 66 Figure 16 Cross Section of TSF Piezometer Setup ........................................................................................... 69 Figure 17 CSA Ground Water Monitoring Results 2011 .................................................................................. 73 Figure 18 CSA Contaminated Sites Register (as of 31/12/11) .......................................................................... 75 Figure 19 Due Diligence Process for the Protection of Aboriginal Heritage .................................................... 79 Figure 20 CMPL Environmental Incidents by Type 2010 and 2011 ................................................................ 88 Figure 21 Conceptual Stages of Sustainable Ecosystem Development........................................................... 111
PLANS
1 Mine Context
2 Land Preparation and Mining Activities
3 Rehabilitation
4 Mining Plan - Vertical Section
5 Site Layout
APPENDICES
A Environmental Protection Licence 1864
B 2010 AEMR Review Meeting Minutes
C Stormwater Drainage Improvement Works Report
D CMPL Environment and Community Policy
E CSA Air and Water Quality Monitoring Data 2011
F Contaminated Sites Sampling Report 2011
G Industrial Heritage Site Listing Report
H STSF Surveillance Report 2010
I 2011 Annual Return EPL 1864
J 2011CSA Rehabilitation Monitoring Report
K Rehabilitation Monitoring Methodology and Determination of Completion Criteria for
Rehabilitation Ecosystems report
CMPL 2011 AEMR
vi
ABBREVIATIONS
ANZECC Australia and New Zealand Conservation
Council
LPMA Land and Property Management Authority
ARPANSA Australian Radiation Protection and Nuclear
Safety Authority
LFA Landform Function Analysis
CHF Cemented Hydraulic Fill Mt Mega Tonne
CMPL Cobar Mining Pty Ltd m Meter
CML Consolidated Mining Lease mm Milli meter
Cu Copper MOP Mining Operations Plan
CSA Cornish, Scottish, Australian Mine NATA National Association of Testing Authorities
DSC Dam Safety Committee NGER National Greenhouse and Energy Reporting
Act 2007
DSEWPC Department of Sustainability, Environment,
Water, Population and Communities
NPI National Pollutant Inventory
DTIRIS Department of Trade and Investment,
Regional Infrastructure and Services
NORM Naturally Occurring radioactive materials
DMP Derelict Mines Program NTSF North Tailings Storage Facility
DEM Digital Elevation Model OEH Office of Environment and Heritage
DRE Division of Energy and Resources PJ Pentajoule
dmt Dry Metric Tonnes PET Polyethylene Terephthalate
EEO Energy Efficiency Opportunities Act PAF Potentially Acid Forming
ESAP Energy Savings Action Plan REMP Rehabilitation and Environment Management
Plan
ESS Energy Savings Scheme RC Reverse Circulation
EPA Environment Protection Authority SWMP Site Water Management Plan
EPL Environment Protection Licence STSF South Tailings Storage Facility
EL Exploration Lease SG Specific Gravity
ft Foot TSF Tailings Storage Facility
GJ Gigajoules t Tonnes
HDPE High Density Polyethylene WRF Waste Rock Fill
KPI Key Performance Indicator wmt Wet Metric Tonne

CMPL 2011 AEMR
vii
Blank Page
1
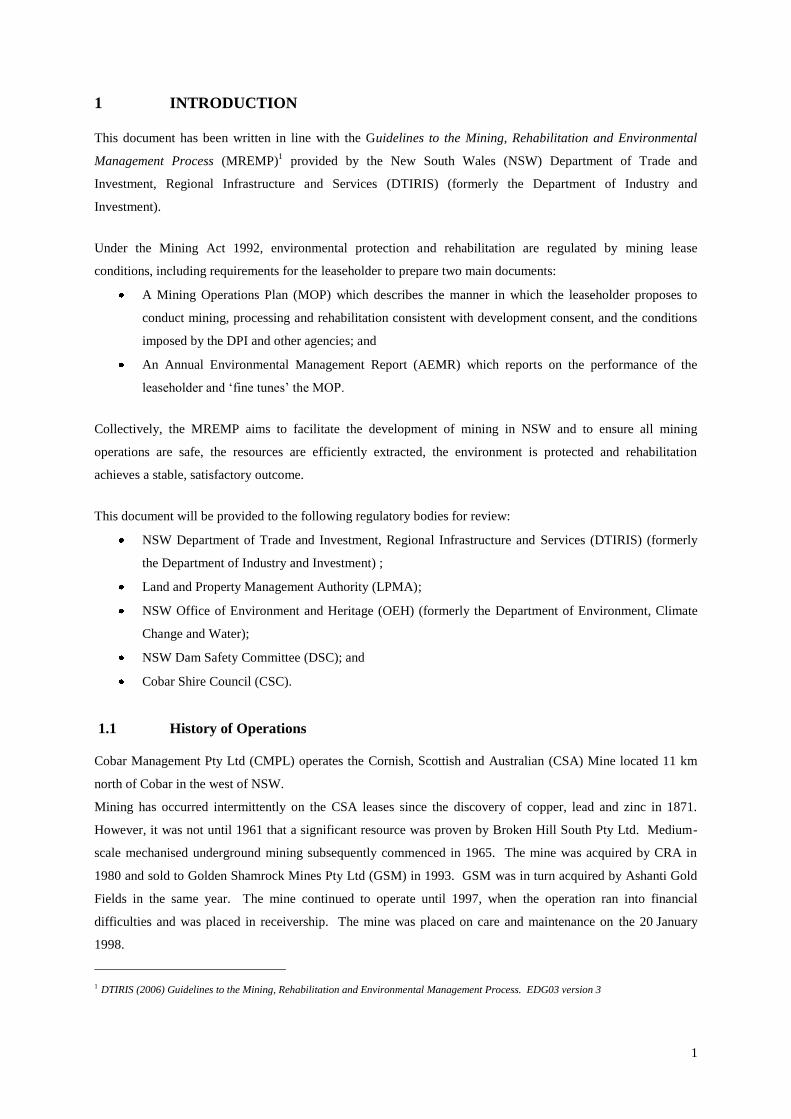
1 INTRODUCTION
This document has been written in line with the Guidelines to the Mining, Rehabilitation and Environmental
Management Process (MREMP)1 provided by the New South Wales (NSW) Department of Trade and
Investment, Regional Infrastructure and Services (DTIRIS) (formerly the Department of Industry and
Investment).
Under the Mining Act 1992, environmental protection and rehabilitation are regulated by mining lease
conditions, including requirements for the leaseholder to prepare two main documents:
A Mining Operations Plan (MOP) which describes the manner in which the leaseholder proposes to
conduct mining, processing and rehabilitation consistent with development consent, and the conditions
imposed by the DPI and other agencies; and
An Annual Environmental Management Report (AEMR) which reports on the performance of the
leaseholder and ‘fine tunes’ the MOP.
Collectively, the MREMP aims to facilitate the development of mining in NSW and to ensure all mining
operations are safe, the resources are efficiently extracted, the environment is protected and rehabilitation
achieves a stable, satisfactory outcome.
This document will be provided to the following regulatory bodies for review:
NSW Department of Trade and Investment, Regional Infrastructure and Services (DTIRIS) (formerly
the Department of Industry and Investment) ;
Land and Property Management Authority (LPMA);
NSW Office of Environment and Heritage (OEH) (formerly the Department of Environment, Climate
Change and Water);
NSW Dam Safety Committee (DSC); and
Cobar Shire Council (CSC).
1.1 History of Operations
Cobar Management Pty Ltd (CMPL) operates the Cornish, Scottish and Australian (CSA) Mine located 11 km
north of Cobar in the west of NSW.
Mining has occurred intermittently on the CSA leases since the discovery of copper, lead and zinc in 1871.
However, it was not until 1961 that a significant resource was proven by Broken Hill South Pty Ltd. Medium-
scale mechanised underground mining subsequently commenced in 1965. The mine was acquired by CRA in
1980 and sold to Golden Shamrock Mines Pty Ltd (GSM) in 1993. GSM was in turn acquired by Ashanti Gold
Fields in the same year. The mine continued to operate until 1997, when the operation ran into financial
difficulties and was placed in receivership. The mine was placed on care and maintenance on the 20 January
1998.
1 DTIRIS (2006) Guidelines to the Mining, Rehabilitation and Environmental Management Process. EDG03 version 3
CMPL 2011 AEMR
2
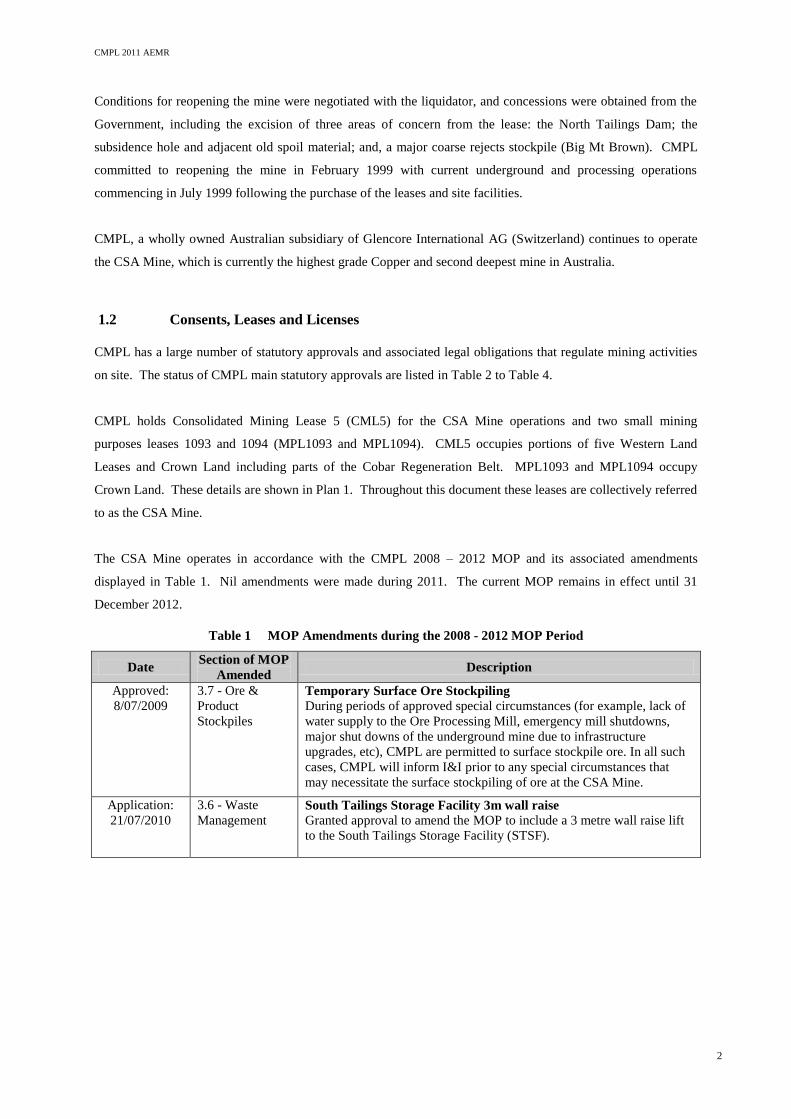
Conditions for reopening the mine were negotiated with the liquidator, and concessions were obtained from the
Government, including the excision of three areas of concern from the lease: the North Tailings Dam; the
subsidence hole and adjacent old spoil material; and, a major coarse rejects stockpile (Big Mt Brown). CMPL
committed to reopening the mine in February 1999 with current underground and processing operations
commencing in July 1999 following the purchase of the leases and site facilities.
CMPL, a wholly owned Australian subsidiary of Glencore International AG (Switzerland) continues to operate
the CSA Mine, which is currently the highest grade Copper and second deepest mine in Australia.
1.2 Consents, Leases and Licenses
CMPL has a large number of statutory approvals and associated legal obligations that regulate mining activities
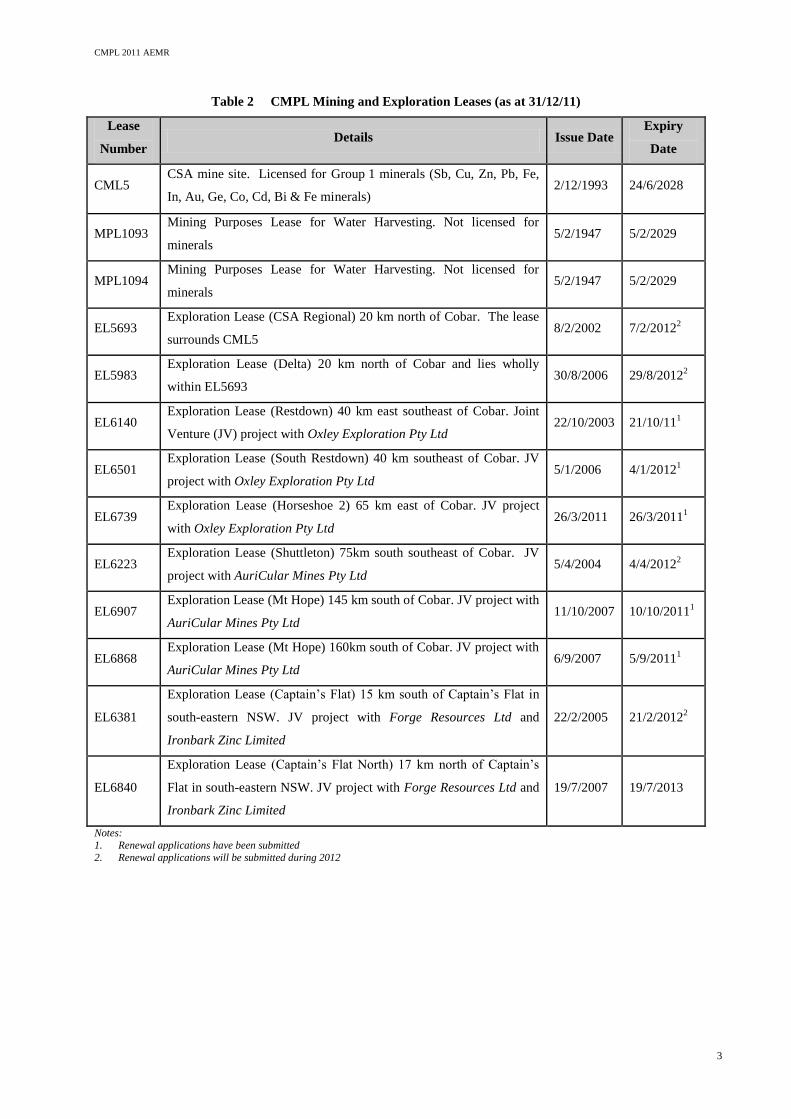
on site. The status of CMPL main statutory approvals are listed in Table 2 to Table 4.
CMPL holds Consolidated Mining Lease 5 (CML5) for the CSA Mine operations and two small mining
purposes leases 1093 and 1094 (MPL1093 and MPL1094). CML5 occupies portions of five Western Land
Leases and Crown Land including parts of the Cobar Regeneration Belt. MPL1093 and MPL1094 occupy
Crown Land. These details are shown in Plan 1. Throughout this document these leases are collectively referred
to as the CSA Mine.
The CSA Mine operates in accordance with the CMPL 2008 – 2012 MOP and its associated amendments
displayed in Table 1. Nil amendments were made during 2011. The current MOP remains in effect until 31
December 2012.
Table 1 MOP Amendments during the 2008 - 2012 MOP Period
Date Section of MOP
Amended Description
Approved:
8/07/2009
3.7 - Ore &
Product
Stockpiles
Temporary Surface Ore Stockpiling
During periods of approved special circumstances (for example, lack of
water supply to the Ore Processing Mill, emergency mill shutdowns,
major shut downs of the underground mine due to infrastructure
upgrades, etc), CMPL are permitted to surface stockpile ore. In all such
cases, CMPL will inform I&I prior to any special circumstances that
may necessitate the surface stockpiling of ore at the CSA Mine.
Application:
21/07/2010
3.6 - Waste
Management South Tailings Storage Facility 3m wall raise Granted approval to amend the MOP to include a 3 metre wall raise lift
to the South Tailings Storage Facility (STSF).
CMPL 2011 AEMR
3
Table 2 CMPL Mining and Exploration Leases (as at 31/12/11)
Lease
Number Details Issue Date
Expiry
Date
CML5 CSA mine site. Licensed for Group 1 minerals (Sb, Cu, Zn, Pb, Fe,
In, Au, Ge, Co, Cd, Bi & Fe minerals) 2/12/1993 24/6/2028
MPL1093 Mining Purposes Lease for Water Harvesting. Not licensed for
minerals 5/2/1947 5/2/2029
MPL1094 Mining Purposes Lease for Water Harvesting. Not licensed for
minerals 5/2/1947 5/2/2029
EL5693 Exploration Lease (CSA Regional) 20 km north of Cobar. The lease
surrounds CML5 8/2/2002 7/2/2012
2
EL5983 Exploration Lease (Delta) 20 km north of Cobar and lies wholly
within EL5693 30/8/2006 29/8/2012
2
EL6140 Exploration Lease (Restdown) 40 km east southeast of Cobar. Joint
Venture (JV) project with Oxley Exploration Pty Ltd 22/10/2003 21/10/11
1
EL6501 Exploration Lease (South Restdown) 40 km southeast of Cobar. JV
project with Oxley Exploration Pty Ltd 5/1/2006 4/1/2012
1
EL6739 Exploration Lease (Horseshoe 2) 65 km east of Cobar. JV project
with Oxley Exploration Pty Ltd 26/3/2011 26/3/2011
1
EL6223 Exploration Lease (Shuttleton) 75km south southeast of Cobar. JV
project with AuriCular Mines Pty Ltd 5/4/2004 4/4/2012
2
EL6907 Exploration Lease (Mt Hope) 145 km south of Cobar. JV project with
AuriCular Mines Pty Ltd 11/10/2007 10/10/2011
1
EL6868 Exploration Lease (Mt Hope) 160km south of Cobar. JV project with
AuriCular Mines Pty Ltd 6/9/2007 5/9/2011
1
EL6381
Exploration Lease (Captain’s Flat) 15 km south of Captain’s Flat in
south-eastern NSW. JV project with Forge Resources Ltd and
Ironbark Zinc Limited
22/2/2005 21/2/20122
EL6840
Exploration Lease (Captain’s Flat North) 17 km north of Captain’s
Flat in south-eastern NSW. JV project with Forge Resources Ltd and
Ironbark Zinc Limited
19/7/2007 19/7/2013
Notes:
1. Renewal applications have been submitted
2. Renewal applications will be submitted during 2012
CMPL 2011 AEMR
4
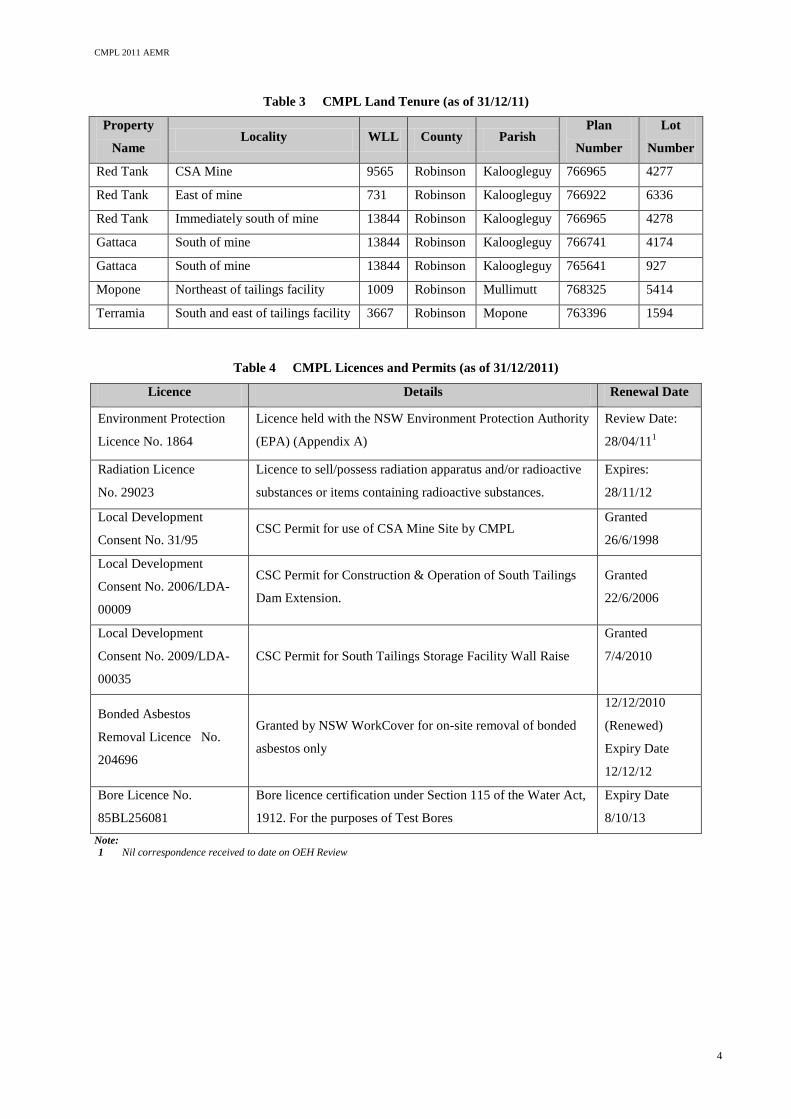
Table 3 CMPL Land Tenure (as of 31/12/11)
Property
Name Locality WLL County Parish
Plan
Number
Lot
Number
Red Tank CSA Mine 9565 Robinson Kaloogleguy 766965 4277
Red Tank East of mine 731 Robinson Kaloogleguy 766922 6336
Red Tank Immediately south of mine 13844 Robinson Kaloogleguy 766965 4278
Gattaca South of mine 13844 Robinson Kaloogleguy 766741 4174
Gattaca South of mine 13844 Robinson Kaloogleguy 765641 927
Mopone Northeast of tailings facility 1009 Robinson Mullimutt 768325 5414
Terramia South and east of tailings facility 3667 Robinson Mopone 763396 1594
Table 4 CMPL Licences and Permits (as of 31/12/2011)
Licence Details Renewal Date
Environment Protection
Licence No. 1864
Licence held with the NSW Environment Protection Authority
(EPA) (Appendix A)
Review Date:
28/04/111
Radiation Licence
No. 29023
Licence to sell/possess radiation apparatus and/or radioactive
substances or items containing radioactive substances.
Expires:
28/11/12
Local Development
Consent No. 31/95 CSC Permit for use of CSA Mine Site by CMPL
Granted
26/6/1998
Local Development
Consent No. 2006/LDA-
00009
CSC Permit for Construction & Operation of South Tailings
Dam Extension.
Granted
22/6/2006
Local Development
Consent No. 2009/LDA-
00035
CSC Permit for South Tailings Storage Facility Wall Raise
Granted
7/4/2010
Bonded Asbestos
Removal Licence No.
204696
Granted by NSW WorkCover for on-site removal of bonded
asbestos only
12/12/2010
(Renewed)
Expiry Date
12/12/12
Bore Licence No.
85BL256081
Bore licence certification under Section 115 of the Water Act,
1912. For the purposes of Test Bores
Expiry Date
8/10/13
Note: 1 Nil correspondence received to date on OEH Review
5
Mine Contacts
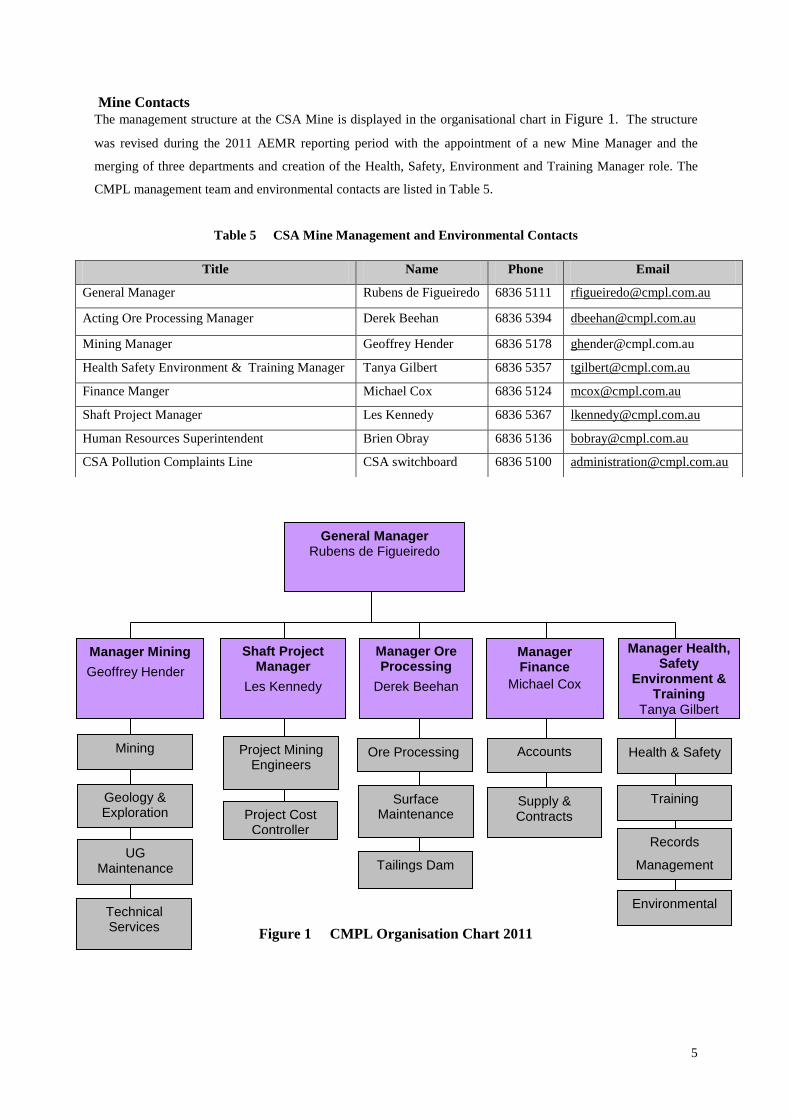
The management structure at the CSA Mine is displayed in the organisational chart in Figure 1. The structure
was revised during the 2011 AEMR reporting period with the appointment of a new Mine Manager and the
merging of three departments and creation of the Health, Safety, Environment and Training Manager role. The
CMPL management team and environmental contacts are listed in Table 5.
Table 5 CSA Mine Management and Environmental Contacts
Title Name Phone Email
General Manager Rubens de Figueiredo 6836 5111 [email protected]
Acting Ore Processing Manager Derek Beehan 6836 5394 [email protected]
Mining Manager Geoffrey Hender 6836 5178 [email protected]
Health Safety Environment & Training Manager Tanya Gilbert 6836 5357 [email protected]
Finance Manger Michael Cox 6836 5124 [email protected]
Shaft Project Manager Les Kennedy 6836 5367 [email protected]
Human Resources Superintendent Brien Obray 6836 5136 [email protected]
CSA Pollution Complaints Line CSA switchboard 6836 5100 [email protected]
Figure 1 CMPL Organisation Chart 2011
General Manager Rubens de Figueiredo
Manager Ore Processing
Derek Beehan
Manager Finance
Michael Cox
Manager Health, Safety
Environment & Training
Tanya Gilbert
Manager Mining
Geoffrey Hender
Shaft Project Manager
Les Kennedy
Accounts
Supply & Contracts
Mining
UG Maintenance
Geology & Exploration
Technical Services
Records
Management
Health & Safety
Training
Environmental
Ore Processing
Surface Maintenance
Tailings Dam
Project Mining Engineers
Project Cost Controller

6
1.3 Actions required from 2010 AEMR review
The 2010 AEMR review meeting and site inspection was held at the CSA Mine on 31 March 2011 and was
attended by representatives from DTIRIS, OEH, LPMA, CSC, NSW Office of Water (NOW), Peak Gold Mine
(PGM), and Straits Tritton Copper Mine (Tritton).
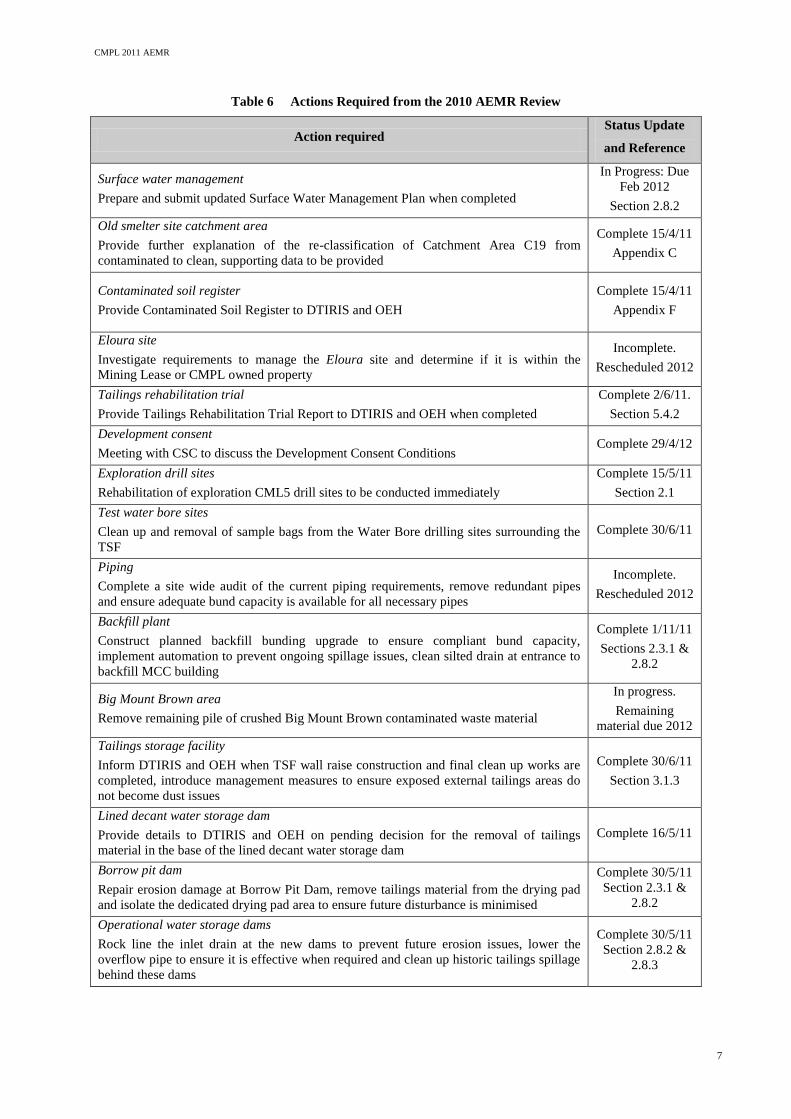
The 2010 AEMR review meeting minutes are provided in Appendix B. Actions arising from the meeting and the
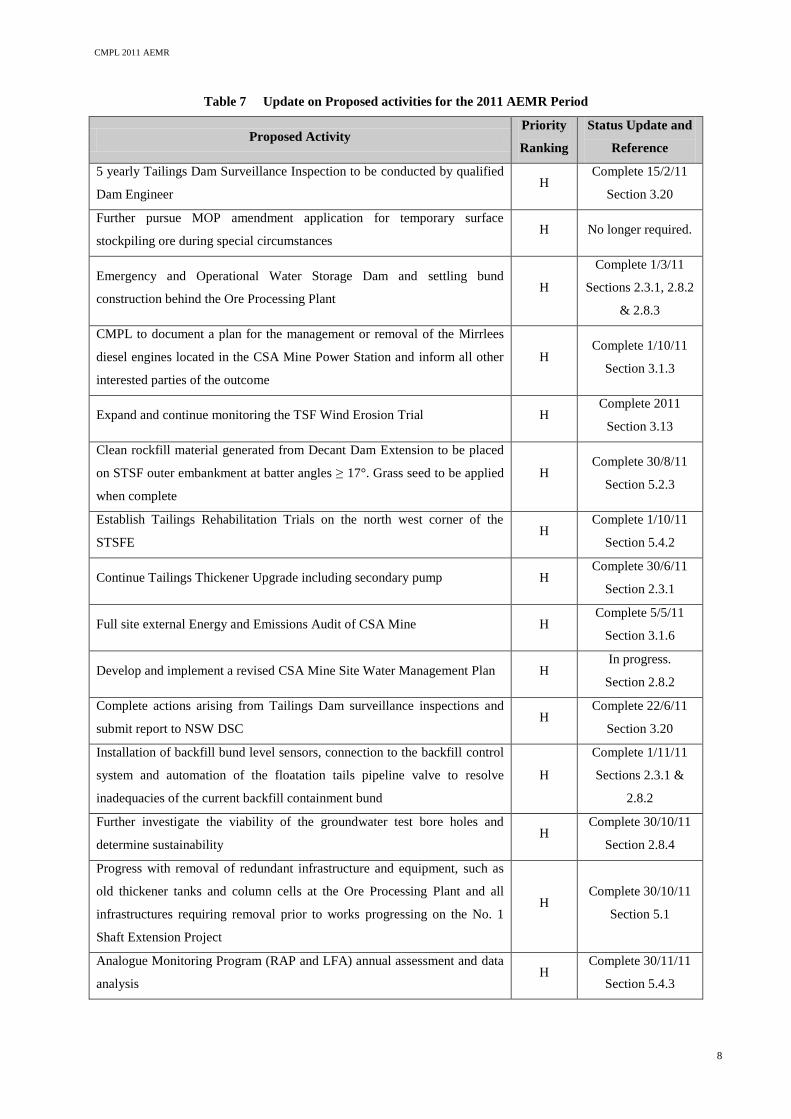
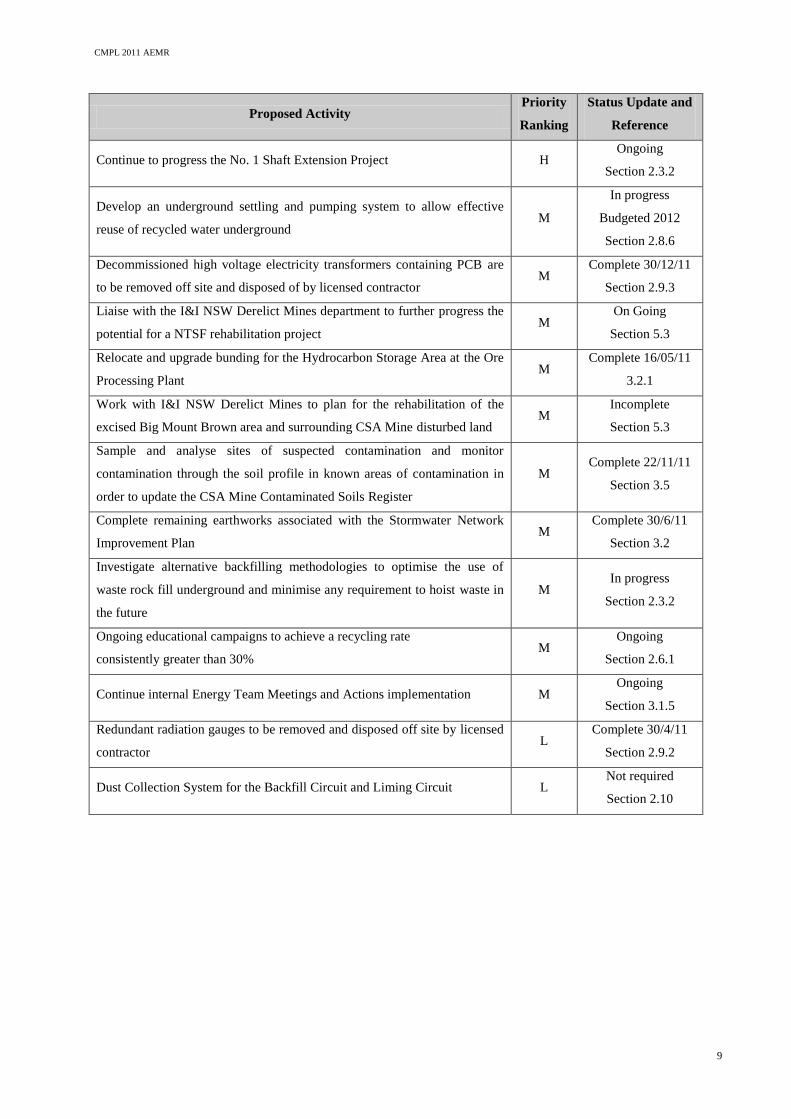
Sections of this report in which they are addressed are listed in Table 6. Table 7 provides an update on all
activities proposed for 2011 as listed in Section 6 of the 2010 AEMR.
CMPL 2011 AEMR
7
Table 6 Actions Required from the 2010 AEMR Review
Action required Status Update
and Reference
Surface water management
Prepare and submit updated Surface Water Management Plan when completed
In Progress: Due
Feb 2012
Section 2.8.2
Old smelter site catchment area
Provide further explanation of the re-classification of Catchment Area C19 from
contaminated to clean, supporting data to be provided
Complete 15/4/11
Appendix C
Contaminated soil register
Provide Contaminated Soil Register to DTIRIS and OEH
Complete 15/4/11
Appendix F
Eloura site
Investigate requirements to manage the Eloura site and determine if it is within the
Mining Lease or CMPL owned property
Incomplete.
Rescheduled 2012
Tailings rehabilitation trial
Provide Tailings Rehabilitation Trial Report to DTIRIS and OEH when completed
Complete 2/6/11.
Section 5.4.2
Development consent
Meeting with CSC to discuss the Development Consent Conditions Complete 29/4/12
Exploration drill sites
Rehabilitation of exploration CML5 drill sites to be conducted immediately
Complete 15/5/11
Section 2.1
Test water bore sites
Clean up and removal of sample bags from the Water Bore drilling sites surrounding the
TSF
Complete 30/6/11
Piping
Complete a site wide audit of the current piping requirements, remove redundant pipes
and ensure adequate bund capacity is available for all necessary pipes
Incomplete.
Rescheduled 2012
Backfill plant
Construct planned backfill bunding upgrade to ensure compliant bund capacity,
implement automation to prevent ongoing spillage issues, clean silted drain at entrance to
backfill MCC building
Complete 1/11/11
Sections 2.3.1 &
2.8.2
Big Mount Brown area
Remove remaining pile of crushed Big Mount Brown contaminated waste material
In progress.
Remaining
material due 2012
Tailings storage facility
Inform DTIRIS and OEH when TSF wall raise construction and final clean up works are
completed, introduce management measures to ensure exposed external tailings areas do
not become dust issues
Complete 30/6/11
Section 3.1.3
Lined decant water storage dam
Provide details to DTIRIS and OEH on pending decision for the removal of tailings
material in the base of the lined decant water storage dam
Complete 16/5/11
Borrow pit dam
Repair erosion damage at Borrow Pit Dam, remove tailings material from the drying pad
and isolate the dedicated drying pad area to ensure future disturbance is minimised
Complete 30/5/11
Section 2.3.1 &
2.8.2
Operational water storage dams
Rock line the inlet drain at the new dams to prevent future erosion issues, lower the
overflow pipe to ensure it is effective when required and clean up historic tailings spillage
behind these dams
Complete 30/5/11
Section 2.8.2 &
2.8.3
CMPL 2011 AEMR
8
Table 7 Update on Proposed activities for the 2011 AEMR Period
Proposed Activity Priority
Ranking
Status Update and
Reference
5 yearly Tailings Dam Surveillance Inspection to be conducted by qualified
Dam Engineer H
Complete 15/2/11
Section 3.20
Further pursue MOP amendment application for temporary surface
stockpiling ore during special circumstances H No longer required.
Emergency and Operational Water Storage Dam and settling bund
construction behind the Ore Processing Plant H
Complete 1/3/11
Sections 2.3.1, 2.8.2
& 2.8.3
CMPL to document a plan for the management or removal of the Mirrlees
diesel engines located in the CSA Mine Power Station and inform all other
interested parties of the outcome
H Complete 1/10/11
Section 3.1.3
Expand and continue monitoring the TSF Wind Erosion Trial H Complete 2011
Section 3.13
Clean rockfill material generated from Decant Dam Extension to be placed
on STSF outer embankment at batter angles ≥ 17°. Grass seed to be applied
when complete
H Complete 30/8/11
Section 5.2.3
Establish Tailings Rehabilitation Trials on the north west corner of the
STSFE H
Complete 1/10/11
Section 5.4.2
Continue Tailings Thickener Upgrade including secondary pump H Complete 30/6/11
Section 2.3.1
Full site external Energy and Emissions Audit of CSA Mine H Complete 5/5/11
Section 3.1.6
Develop and implement a revised CSA Mine Site Water Management Plan H In progress.
Section 2.8.2
Complete actions arising from Tailings Dam surveillance inspections and
submit report to NSW DSC H
Complete 22/6/11
Section 3.20
Installation of backfill bund level sensors, connection to the backfill control
system and automation of the floatation tails pipeline valve to resolve
inadequacies of the current backfill containment bund
H
Complete 1/11/11
Sections 2.3.1 &
2.8.2
Further investigate the viability of the groundwater test bore holes and
determine sustainability H
Complete 30/10/11
Section 2.8.4
Progress with removal of redundant infrastructure and equipment, such as
old thickener tanks and column cells at the Ore Processing Plant and all
infrastructures requiring removal prior to works progressing on the No. 1
Shaft Extension Project
H Complete 30/10/11
Section 5.1
Analogue Monitoring Program (RAP and LFA) annual assessment and data
analysis H
Complete 30/11/11
Section 5.4.3
CMPL 2011 AEMR
9
Proposed Activity Priority
Ranking
Status Update and
Reference
Continue to progress the No. 1 Shaft Extension Project H Ongoing
Section 2.3.2
Develop an underground settling and pumping system to allow effective
reuse of recycled water underground M
In progress
Budgeted 2012
Section 2.8.6
Decommissioned high voltage electricity transformers containing PCB are
to be removed off site and disposed of by licensed contractor M
Complete 30/12/11
Section 2.9.3
Liaise with the I&I NSW Derelict Mines department to further progress the
potential for a NTSF rehabilitation project M
On Going
Section 5.3
Relocate and upgrade bunding for the Hydrocarbon Storage Area at the Ore
Processing Plant M
Complete 16/05/11
3.2.1
Work with I&I NSW Derelict Mines to plan for the rehabilitation of the
excised Big Mount Brown area and surrounding CSA Mine disturbed land M
Incomplete
Section 5.3
Sample and analyse sites of suspected contamination and monitor
contamination through the soil profile in known areas of contamination in
order to update the CSA Mine Contaminated Soils Register
M Complete 22/11/11
Section 3.5
Complete remaining earthworks associated with the Stormwater Network
Improvement Plan M
Complete 30/6/11
Section 3.2
Investigate alternative backfilling methodologies to optimise the use of
waste rock fill underground and minimise any requirement to hoist waste in
the future
M In progress
Section 2.3.2
Ongoing educational campaigns to achieve a recycling rate
consistently greater than 30% M
Ongoing
Section 2.6.1
Continue internal Energy Team Meetings and Actions implementation M Ongoing
Section 3.1.5
Redundant radiation gauges to be removed and disposed off site by licensed
contractor L
Complete 30/4/11
Section 2.9.2
Dust Collection System for the Backfill Circuit and Liming Circuit L Not required
Section 2.10
CMPL 2011 AEMR
10
2 SUMMARY OF OPERATIONS DURING THE REPORTING PERIOD
In 2011 the production rate was maintained above 1,000,000 tonnes (t); this was an excellent result for the third
year running. Prior to 2009 the previous five years production average was 720,000 t.
2011 budgeted production rates were set at 1,150,000 dry metric tonnes (dmt) of ore which would produce
181,419 dmt of concentrate and 51,705 t of copper (Cu). Actual production achieved in 2011 was just below
target with 1,038,913 dmt ore milled, 162,533 dmt concentrate produced and 44,698 t of Cu.
The primary focus of the Ore Processing department for 2011 was to modify the plant and services to an extent
that long-term production and budget throughput could be maintained consistently. To this extent a number of
major projects were undertaken and completed during the year including:
Improved housekeeping standards;
Mill HV Upgrade;
Feeder impact bed replacement;
150ft Thickener repairs;
Flotation floor concrete removal;
Powerhouse HV Upgrade;
Power factor correction stage 1;
MCC 01 power & distribution upgrade; and,
C2/C3 Diverter chute installation.
Works to upgrade the grinding circuit in the mill in conjunction with the ongoing shaft extension project will
commence in 2012 with a scheduled completion date of quarter four 2013. Projects include:
The construction and installation of a new surface coarse ore stockpile on surface;
Installation of a new grinding mill; and,
Installation of overland conveyors and associated equipment.
The primary focus for the Mining Department for 2011 was achieving budget ore production at grade and cost.
A number of projects were completed or commenced in 2011, these included:
Commenced No1 Shaft Extension Project;
Development of the infrastructure for, and support of, the No1 Shaft Extension Project;
Upgrade of the existing surface refrigeration plant;
End of life change out of key pieces of fleet including, 2 trucks, 2 loaders, 2 concrete agitators, 1
production drill and 1 development jumbo; and,
Power supply ring main.
CMPL 2011 AEMR
11
Key projects for the underground mine in 2012 and 2013 include:
Progression of the No1 Shaft Extension Project;
Development of the drives and chambers required for the No1 Shaft Extension Project including
construction of new crusher, conveyors, drives and workshops;
Changing stope void fill medium from cemented hydraulic (CHF) fill to paste fill;
Introduction of a proximity detection technology underground;
End of life change out of key pieces of fleet including 3 trucks, 2 loaders, 1 Tele-handler;
Expand refrigeration capacity; and,
Extend fibre optic capability to the bottom of the mine.
Projects completed in 2011 coupled with those to be completed in 2012 will ensure an increase in sustainability
and a reduction in major process disruptions thus providing more positive improvements and opportunities to the
operation.
2.1 Mineral Exploration
CMPL’s 2011 exploration activities were principally focussed on underground drilling at the CSA Mine.
Limited surface exploration programmes were completed. A summary of all surface exploration activities is
summarised in the following sections.
Improved environmental management of exploration operations was achieved in 2011 through the fostering of
close links between the Environment and Geology Teams and the continued adherence to improved
environmental management procedures first implemented in 2010. During 2011, pre-disturbance baseline
studies for all new exploration programs requiring ground disturbance and an annual inspection of rehabilitated
exploration programs were completed by the Environment Team. Both programs will be continued in 2012.
Detailed exploration proposals specific to exploration activities during the 2012 AEMR period will be submitted
as appropriate to DTIRIS for approval prior to commencement, either as Surface Disturbance Notices, Review of
Environmental Factors, or other formats as required by the department.
2.1.1 CML5
Four diamond drill holes were completed on CML5 over 2010 targeting the underground Western Gossan
mineralisation and potential extensions to mineralisation. Three of these drill holes were rehabilitated in 2011
with the fourth planned to be rehabilitated early in 2012. Exploration drill hole sites are inspected on the
completion of rehabilitation works and annually thereafter to monitor the progress and success of rehabilitation.
Further diamond drilling and Reverse Circulation (RC) percussion drilling is scheduled to occur on CML5
during 2012.
CMPL 2011 AEMR
12
2.1.2 EL5693 CSA Regional
EL5693 field work during 2011 involved non-invasive ground geophysical surveys. Planned drilling for 2011
was not carried out due to scheduling issues resulting from delays in the engagement of contractors at the
beginning of the year. The exploration drilling schedule for 2012 will see a total of 2,200 m RC drilling take
place on the EL5693 lease.
2.1.3 EL5983 Delta
Four RC holes were drilled on EL5983 in 2010. All four drill sites were fully rehabilitated during 2011 Planned
drilling for 2011 was not carried out due to scheduling issues resulting from delays in the engagement of
contractors at the beginning of the year. Approximately 300 m of RC drilling is planned within the lease during
2012.
2.1.4 EL6140, EL6501, EL6739 (Restdown, South Restdown and Horseshoe)
No field work has been conducted by CMPL on EL6140, EL6501, or EL6739 since 2009. These leases are
subject to a farm-out arrangement with Oxley Exploration NL. Sixty two RC holes were completed by Oxley
within the EL6140 during 2011. Of these, 10 holes have been rehabilitated. The remainder will be rehabilitated
during the first quarter of 2012.
A total of 1,981 soil samples were collected across the three tenements. Sample sites were rehabilitated
immediately following collection of the sample; as per standard practice.
2.1.5 EL6223 (Shuttleton)
The two diamond drill holes drilled in 2010 were rehabilitated during 2011. Drilling planned for 2011 was not
completed due to scheduling issues resulting from delays to the engagement of contractors at the beginning of
the year. Drill Sites were inspected by the CSA Environmental Team in December 2011 and were found to be
safe, stable and non-polluting. Pioneer species including Cooper and Galvanised Burr, Corkscrew Grass were
present on the sites. The site will be monitored annually until the relinquishment of the EL to monitor the
progress of rehabilitation and implement any required works.
Non-invasive ground geophysics, a further 1,000 m diamond drilling and 1,000 m RC drilling are planned for the
Shuttleton lease during 2012.
2.1.6 EL6907, EL6868 (Mount Hope)
The three diamond drill holes completed on lease EL6907 during 2010 were rehabilitated in early 2011. Non-
invasive soil sampling, surface geophysical surveys and three diamond drill holes were completed within
EL6907 during 2011. One of these holes has been rehabilitated while the remaining two will be rehabilitated in
early 2012. Work proposed for 2011 for EL6868 was not completed due to scheduling issues resulting from
delays to the engagement of contractors at the beginning of the year. These works have been postponed to 2012.
Drill sites were inspected by the CSA Environmental Team in December 2011 and were found to be safe, stable
and non-polluting. Pioneer species (including some weeds) were found to be colonising on drill sites, providing
CMPL 2011 AEMR
13
the initial cover for perennial shrub and pasture species to establish. This site will be inspected in the 2012
reporting period to track rehabilitation progress and implement any required works.
2.1.7 EL6381, EL6840 (Captain’s Flat)
One diamond drill hole was completed on EL6381 during 2011. This site will be rehabilitated early in 2012.
Further diamond drilling, RC drilling and non-invasive surface geophysical surveys are planned for Captain’s
Flat during 2012. Sites will be inspected by the CSA Environment Team at the completion of rehabilitation and
annually thereafter to monitor the progress of rehabilitation and to ensure sites are safe, stable and non-polluting.
Surface exploration activities for the 2012 AEMR period will cover all tenements and will include diamond and
RC drilling as well as the basic non-invasive ground surveys and soil sampling. Sites will be rehabilitated as
soon as practicable after completion of programs, in line with departmental guidelines. Rehabilitation activities
will include cleaning up the site, filling sumps, ripping (where appropriate), and capping drill holes.
2.2 Land Preparation
Mining operations at the CSA Mine during 2011 were conducted in accordance with the 2008 – 2012 MOP.
CMPL activities continue to minimise land clearing as best practice in order to preserve the natural vegetation
and stability of the surrounding environment. Where clearing is required, it is managed through the CSA Work
Permit System. Permission to excavate is granted through this procedure and associated form to ensure that the
proposed area of disturbance has been checked for underground services (power and water) and approved for
vegetation clearing by the Environment Team.
This system applies to all employees and contractors at the CSA Mine and ensures considerations such as the
size of the proposed site, the stockpiling of soil and vegetation, search for any historical or cultural sites, and
drainage are all accounted for prior to approval of the works. Any actions or conditions associated with the
works are documented and signed off on the permit.
2.2.1 Topsoil
Land preparation and surface material stockpiling is assessed in all CMPL operations to ensure long term storage
requirements are met without further disturbance or unnecessary clearing. Approximately 29,700 m3
of
previously cleared areas at the CSA Mine have been identified as potential topsoil stockpile locations. The
majority of the areas are located in cleared areas surrounding the Tailings Storage Facility (TSF), hence
minimising potential future losses due to double handling and transport during rehabilitation works.
The management of all topsoil on site is carried out in accordance with the CMPL Topsoil Management Plan
which has been developed to ensure all topsoil handling, stockpiling and use is carried out in line with Mining
Lease conditions and Environmental Protection Licence (EPL) requirements.
Permanent stockpile height restrictions exist on site, with a maximum of 3 m for topsoil and 5 m for waste rock
stockpiles. CMPL encourages the establishment of vegetation on all topsoil stockpiles to enhance soil viability
CMPL 2011 AEMR
14
and minimise erosion losses. Cleared vegetation around project sites or surrounding areas is often spread over
the topsoil stockpile sites to assist with revegetation.
No projects requiring land clearing occurred over the 2011 AEMR period.
2.2.2 Underground Waste Rock
Underground mining operations at the CSA Mine produce approximately 400,000 t of waste rock annually.
Waste rock produced is predominantly disposed of into underground voids left by stoping operations. There are
occasionally cases in which the volume of waste rock generated by development exceeds the volume of void
produced by stoping operations (generally during the development of accesses to new resources). In order to
prevent production loss from development curtailment, surface hoisting of development waste has been
permitted during such times. Material permitted for hoisting is only from areas pre-assessed for acid generation
potential. Material identified as potentially acid forming (PAF) or acid forming (AF) is not permitted for
hoisting to surface. Non acid forming (NAF) material that is hoisted to surface is used as a resource in projects
on site where possible.
2.2.3 Contaminated Land
Waste from the clean up of contaminated materials, process spills and the de-silting of dirty or contaminated
catchment dams are disposed of at the South Tailings Storage Facility (STSF). During 2011 fifteen overflow
incidents involving tailings, backfill, hydrocarbons or process water were recorded at the CSA Mine.
These incidents resulted in a combined total of approximately 4,000 m3 of contaminated material being disposed
of at the STSF. Information on these incidents is displayed in Section 3.20.
2.3 Construction
2.3.1 Construction Activities
Several construction projects were completed at the CSA Mine in 2011 including:
Emergency and operational water storage dam and settling bund construction:
Works occurred in January 2011 to construct an operational water storage dam behind the tailings thickener
at the Mill. The dam increased the mills water storage capacity and will be used as emergency back-up
storage during a tailings thickener failure. This project included construction of an earthen storage dam, a
significant capacity increase and improvement to the concrete settling bund, installation of a new pump,
piping and electrics.
A number of design inadequacies were identified after the installation of the concrete settling bund
including its inability to be regularly maintained by plant available on site and its capacity and functionality
to capture tailings and sediments. These design inadequacies are scheduled to be addressed in January
2012 with the upgrade of the concrete settling bund detailed in Section 2.3.2.
CMPL 2011 AEMR
15
Backfill area:
In November 2011 a 22 m3 sump was installed and a bund was upgraded at the backfill plant to increase its
overall capacity to 56 m3 or 112% of the mixing tank. These works have significantly reduced the
likelihood of uncontrolled spills occurring from the backfill plant. Spillages of backfill in this area reduced
dramatically from 7 incidents in 2010 to only 1 in 2011. Additional information is included in Section
2.10.
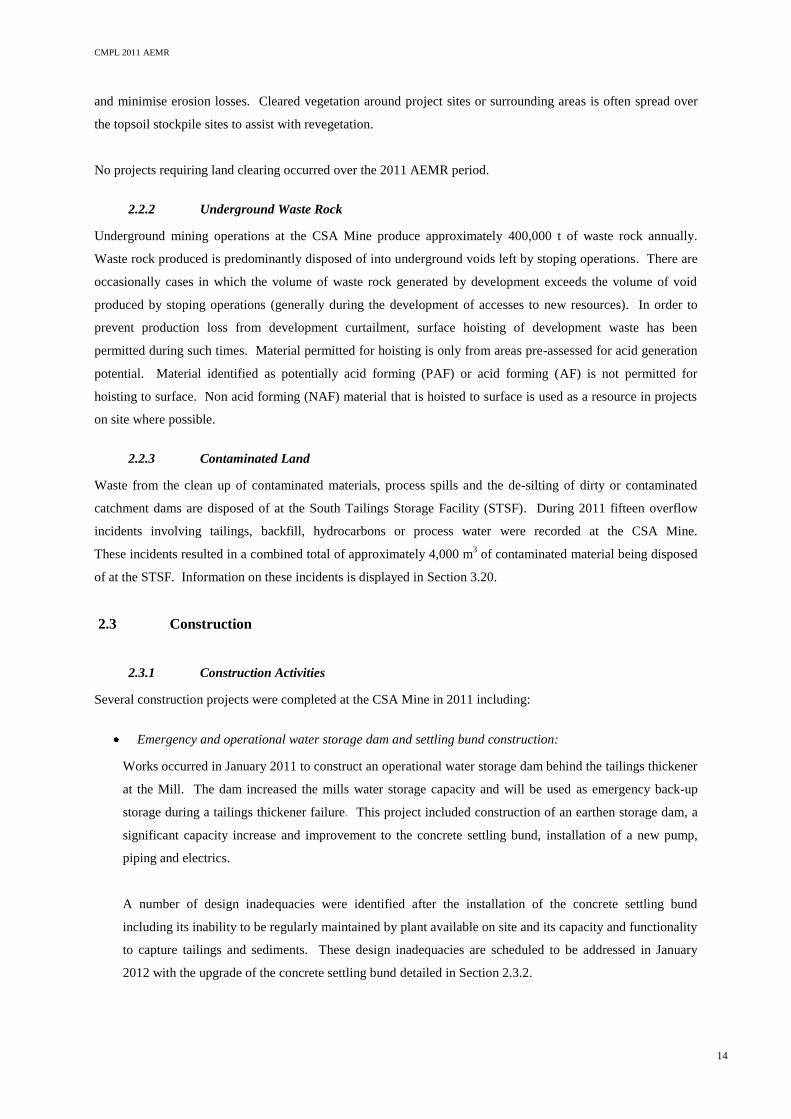
Nitric Acid bund resealing
In 2011 it was identified that corrosion of the concrete bund housing the nitric acid tank had occurred due
to spills nitric acid occurring over a number of years. CMPL engaged specialist contractors to supply and
install a sealing system that would ensure the integrity of the bund for the life of the mine. Works included
the installation of an acid resistant fibre glass coating followed by a sealing product.
Before and After Resealing the Nitric Acid Bund
Tailings thickener upgrade:
An upgrade of the Mill Control Centre (MCC02) was completed in June 2011. This upgrade ensures the
electrical capacity to operate a secondary pump from the tailings thickener. Surface protection of the
internal and external walls of the tailings thickener was completed in January 2011.
2.3.2 Scheduled Construction Activities 2012
Several construction works and smaller infrastructure improvement upgrades are planned for 2012, these
include:
Underground internal shaft extension:
Works commenced in early 2010 to extend the No. 1 Shaft by approximately 500 m and install a new
winder. These works will enable hoisting of ore and waste rock to the surface from a lower level in the
mine, deliver fresh air to the bottom of the mine, and enable efficient transport of personnel to and from
their workplaces.
During 2011,horizontal development of the No. 1 shaft access (8740 L) and vertical development of the 1.5
diameter raise bore (9240L – 9000 L) was completed. Works on surface associated with the project
included the establishment of two lay down areas (3,600 m2
and 4,500 m2), the addition of demountable
CMPL 2011 AEMR
16
offices and the removal of surface infrastructure such as old winders and fans and their associated concrete
and electrical structures.
Further works will continue throughout 2012 and 2013 with commissioning of the new No. 1 Shaft
expected in December 2013. Works scheduled for completion in 2012 include the establishment of a
laydown yard at the portal (3,000 m2), the addition of a new change house, and ongoing horizontal and
vertical progression of the shaft.
Concrete settling bund upgrade
A number of design inadequacies were identified following the installation of the concrete settling bund at
the mill in 2011. The bunds ability to capture tailings and sediments from the residue pit, and its ability to
be regularly maintained by onsite equipment was found to be inadequate. The sump is scheduled to be
upgraded to address these inadequacies in January 2012. The sump will be enlarged to allow access by
onsite plant and the residence time of water in the bund will be increased to improve settling and allow the
passing of clean water.
Backfill area
A feasibility study on the use of paste fill in underground operations will be conducted in 2012. Pending
the outcome of the feasibility study, CMPL will seek to implement paste fill to replace the current fill
medium of Cemented Hydraulic Fill (CHF). The proposed works will involve a significant alteration of the
current plant and an associated stockpile. An application to amend the MOP will be submitted to DTIRIS
prior to works commencing should they be proposed for the 2008-2012 MOP period.
Tailings thickener replacement:
An 18 m diameter thickener is proposed to be installed to replace the existing 150 foot (ft) thickener. The
existing thickener utilises out-dated technologies and is in need of major repairs to ensure ongoing
operation. Initial project scoping, design and risk assessments have been completed and works are
anticipated to commence in quarter four 2012.
2.4 Mining
2.4.1 Underground Resource Status
The current resource is estimated at 11.3 Mt with 6.0% Cu between 9275 m relative level (RL) to 8400 m RL.
The 8400m RL is approximately 1900 m below the surface. There is potential for further resources to exist at
depth and also within this RL range.
The current proved and probable reserves in the CSA Mine active ore bodies (QTS North and South systems)
from 9250 m RL to 8400 m RL stand at 5.6 Mt with 4.79% Cu. There is also potential for further reserves in
other systems, which are yet to be evaluated.
CMPL 2011 AEMR
17
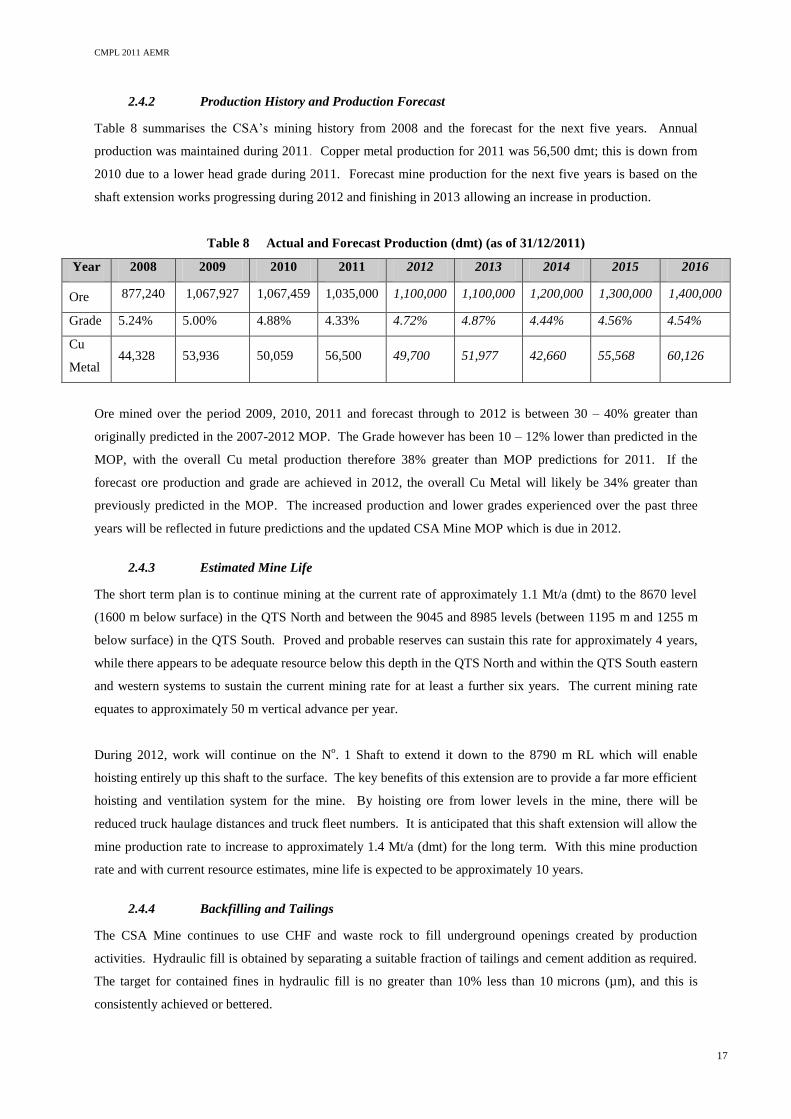
2.4.2 Production History and Production Forecast
Table 8 summarises the CSA’s mining history from 2008 and the forecast for the next five years. Annual
production was maintained during 2011. Copper metal production for 2011 was 56,500 dmt; this is down from
2010 due to a lower head grade during 2011. Forecast mine production for the next five years is based on the
shaft extension works progressing during 2012 and finishing in 2013 allowing an increase in production.
Table 8 Actual and Forecast Production (dmt) (as of 31/12/2011)
Year 2008 2009 2010 2011 2012 2013 2014 2015 2016
Ore 877,240 1,067,927 1,067,459 1,035,000 1,100,000 1,100,000 1,200,000 1,300,000 1,400,000
Grade 5.24% 5.00% 4.88% 4.33% 4.72% 4.87% 4.44% 4.56% 4.54%
Cu
Metal 44,328 53,936 50,059 56,500 49,700 51,977 42,660 55,568 60,126
Ore mined over the period 2009, 2010, 2011 and forecast through to 2012 is between 30 – 40% greater than
originally predicted in the 2007-2012 MOP. The Grade however has been 10 – 12% lower than predicted in the
MOP, with the overall Cu metal production therefore 38% greater than MOP predictions for 2011. If the
forecast ore production and grade are achieved in 2012, the overall Cu Metal will likely be 34% greater than
previously predicted in the MOP. The increased production and lower grades experienced over the past three
years will be reflected in future predictions and the updated CSA Mine MOP which is due in 2012.
2.4.3 Estimated Mine Life
The short term plan is to continue mining at the current rate of approximately 1.1 Mt/a (dmt) to the 8670 level
(1600 m below surface) in the QTS North and between the 9045 and 8985 levels (between 1195 m and 1255 m
below surface) in the QTS South. Proved and probable reserves can sustain this rate for approximately 4 years,
while there appears to be adequate resource below this depth in the QTS North and within the QTS South eastern
and western systems to sustain the current mining rate for at least a further six years. The current mining rate
equates to approximately 50 m vertical advance per year.
During 2012, work will continue on the No. 1 Shaft to extend it down to the 8790 m RL which will enable
hoisting entirely up this shaft to the surface. The key benefits of this extension are to provide a far more efficient
hoisting and ventilation system for the mine. By hoisting ore from lower levels in the mine, there will be
reduced truck haulage distances and truck fleet numbers. It is anticipated that this shaft extension will allow the
mine production rate to increase to approximately 1.4 Mt/a (dmt) for the long term. With this mine production
rate and with current resource estimates, mine life is expected to be approximately 10 years.
2.4.4 Backfilling and Tailings
The CSA Mine continues to use CHF and waste rock to fill underground openings created by production
activities. Hydraulic fill is obtained by separating a suitable fraction of tailings and cement addition as required.
The target for contained fines in hydraulic fill is no greater than 10% less than 10 microns (µm), and this is
consistently achieved or bettered.
CMPL 2011 AEMR
18
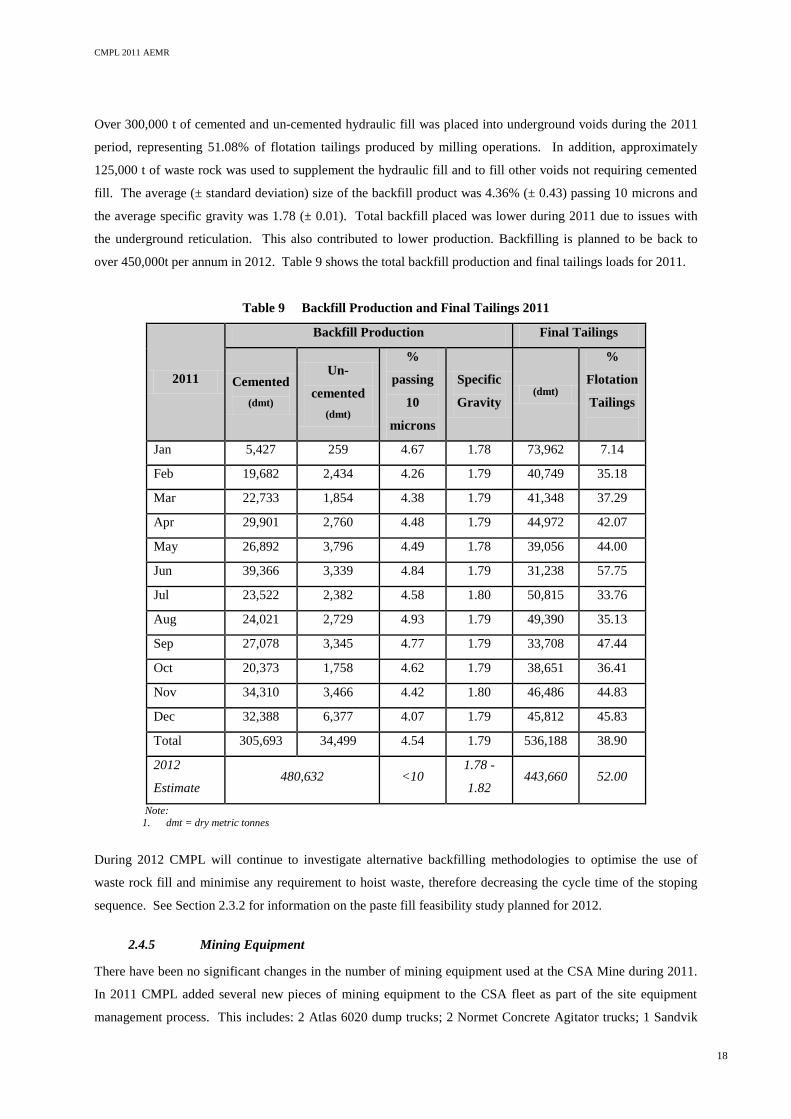
Over 300,000 t of cemented and un-cemented hydraulic fill was placed into underground voids during the 2011
period, representing 51.08% of flotation tailings produced by milling operations. In addition, approximately
125,000 t of waste rock was used to supplement the hydraulic fill and to fill other voids not requiring cemented
fill. The average (± standard deviation) size of the backfill product was 4.36% (± 0.43) passing 10 microns and
the average specific gravity was 1.78 (± 0.01). Total backfill placed was lower during 2011 due to issues with
the underground reticulation. This also contributed to lower production. Backfilling is planned to be back to
over 450,000t per annum in 2012. Table 9 shows the total backfill production and final tailings loads for 2011.
Table 9 Backfill Production and Final Tailings 2011
2011
Backfill Production Final Tailings
Cemented
(dmt)
Un-
cemented
(dmt)
%
passing
10
microns
Specific
Gravity (dmt)
%
Flotation
Tailings
Jan 5,427 259 4.67 1.78 73,962 7.14
Feb 19,682 2,434 4.26 1.79 40,749 35.18
Mar 22,733 1,854 4.38 1.79 41,348 37.29
Apr 29,901 2,760 4.48 1.79 44,972 42.07
May 26,892 3,796 4.49 1.78 39,056 44.00
Jun 39,366 3,339 4.84 1.79 31,238 57.75
Jul 23,522 2,382 4.58 1.80 50,815 33.76
Aug 24,021 2,729 4.93 1.79 49,390 35.13
Sep 27,078 3,345 4.77 1.79 33,708 47.44
Oct 20,373 1,758 4.62 1.79 38,651 36.41
Nov 34,310 3,466 4.42 1.80 46,486 44.83
Dec 32,388 6,377 4.07 1.79 45,812 45.83
Total 305,693 34,499 4.54 1.79 536,188 38.90
2012
Estimate 480,632 <10
1.78 -
1.82 443,660 52.00
Note: 1. dmt = dry metric tonnes
During 2012 CMPL will continue to investigate alternative backfilling methodologies to optimise the use of
waste rock fill and minimise any requirement to hoist waste, therefore decreasing the cycle time of the stoping
sequence. See Section 2.3.2 for information on the paste fill feasibility study planned for 2012.
2.4.5 Mining Equipment
There have been no significant changes in the number of mining equipment used at the CSA Mine during 2011.
In 2011 CMPL added several new pieces of mining equipment to the CSA fleet as part of the site equipment
management process. This includes: 2 Atlas 6020 dump trucks; 2 Normet Concrete Agitator trucks; 1 Sandvik
CMPL 2011 AEMR
19
Jumbo; 1 Production Drill Simba L6C; and, 2 Elphinstone R2900 Loaders. Extra equipment used during 2011
operations included a contract Cable-Bolt Rig and contract Jaycon Shotcrete Rig.
Plans for 2012 will see an additional dump truck introduced to the underground fleet to compensate for the
additional haulage distance. It will see the replacement of an Atlas MT5010 Ejector Truck with the latest model
from Atlas, as well as the replacement of 2 CAT AD55B with an Atlas 6020.
With the shaft extension project continuing through 2012 and into 2013 there is likely to be an increase in the
number of contractors associated with these projects, and therefore an increase in the number of contractor light
vehicles.
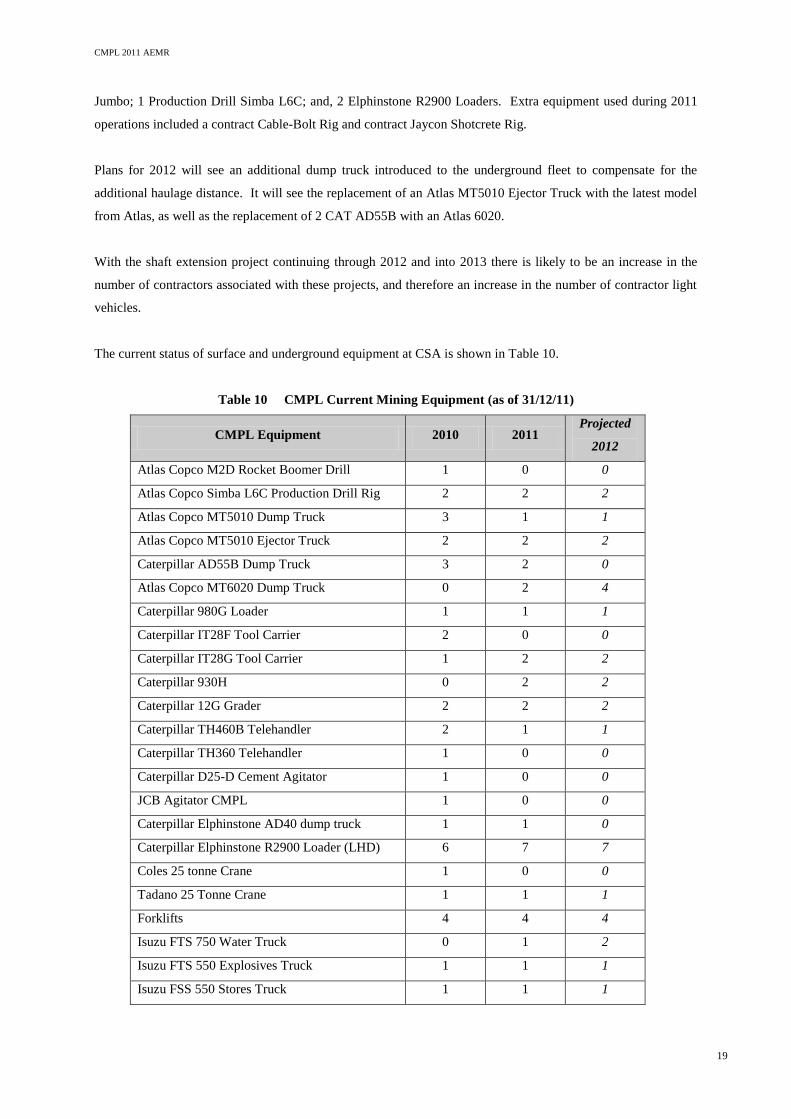
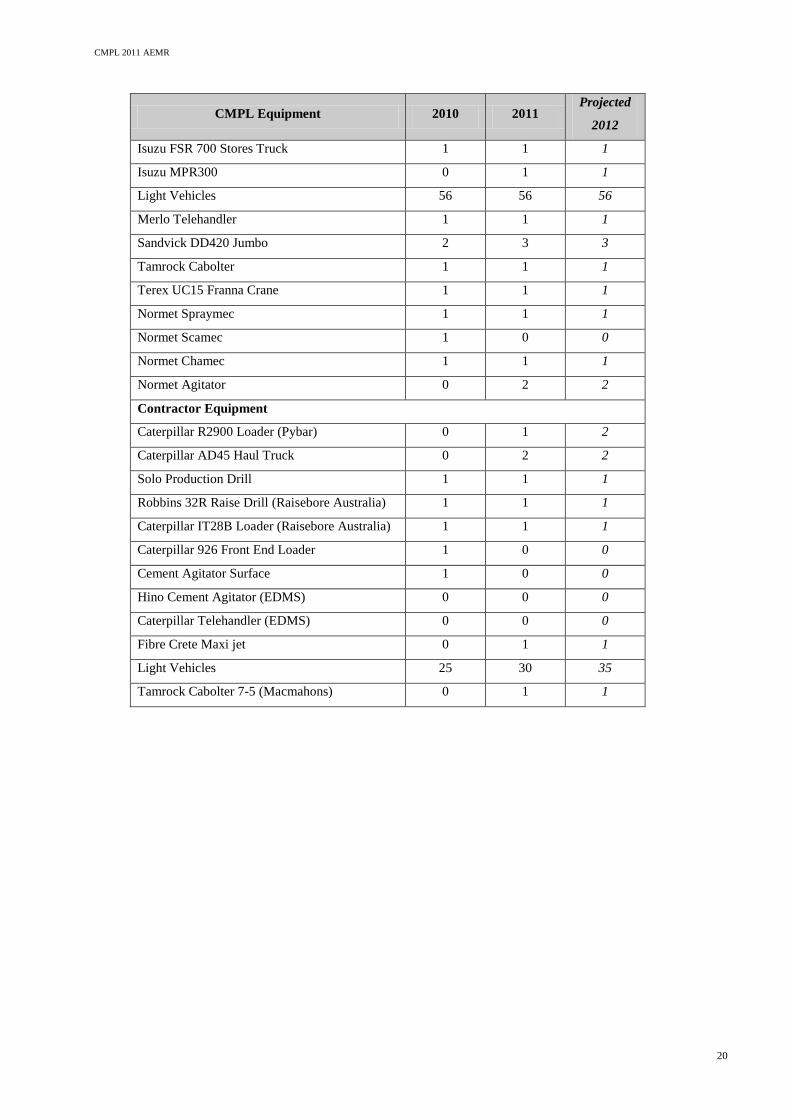
The current status of surface and underground equipment at CSA is shown in Table 10.
Table 10 CMPL Current Mining Equipment (as of 31/12/11)
CMPL Equipment 2010 2011 Projected
2012
Atlas Copco M2D Rocket Boomer Drill 1 0 0
Atlas Copco Simba L6C Production Drill Rig 2 2 2
Atlas Copco MT5010 Dump Truck 3 1 1
Atlas Copco MT5010 Ejector Truck 2 2 2
Caterpillar AD55B Dump Truck 3 2 0
Atlas Copco MT6020 Dump Truck 0 2 4
Caterpillar 980G Loader 1 1 1
Caterpillar IT28F Tool Carrier 2 0 0
Caterpillar IT28G Tool Carrier 1 2 2
Caterpillar 930H 0 2 2
Caterpillar 12G Grader 2 2 2
Caterpillar TH460B Telehandler 2 1 1
Caterpillar TH360 Telehandler 1 0 0
Caterpillar D25-D Cement Agitator 1 0 0
JCB Agitator CMPL 1 0 0
Caterpillar Elphinstone AD40 dump truck 1 1 0
Caterpillar Elphinstone R2900 Loader (LHD) 6 7 7
Coles 25 tonne Crane 1 0 0
Tadano 25 Tonne Crane 1 1 1
Forklifts 4 4 4
Isuzu FTS 750 Water Truck 0 1 2
Isuzu FTS 550 Explosives Truck 1 1 1
Isuzu FSS 550 Stores Truck 1 1 1
CMPL 2011 AEMR
20
CMPL Equipment 2010 2011 Projected
2012
Isuzu FSR 700 Stores Truck 1 1 1
Isuzu MPR300 0 1 1
Light Vehicles 56 56 56
Merlo Telehandler 1 1 1
Sandvick DD420 Jumbo 2 3 3
Tamrock Cabolter 1 1 1
Terex UC15 Franna Crane 1 1 1
Normet Spraymec 1 1 1
Normet Scamec 1 0 0
Normet Chamec 1 1 1
Normet Agitator 0 2 2
Contractor Equipment
Caterpillar R2900 Loader (Pybar) 0 1 2
Caterpillar AD45 Haul Truck 0 2 2
Solo Production Drill 1 1 1
Robbins 32R Raise Drill (Raisebore Australia) 1 1 1
Caterpillar IT28B Loader (Raisebore Australia) 1 1 1
Caterpillar 926 Front End Loader 1 0 0
Cement Agitator Surface 1 0 0
Hino Cement Agitator (EDMS) 0 0 0
Caterpillar Telehandler (EDMS) 0 0 0
Fibre Crete Maxi jet 0 1 1
Light Vehicles 25 30 35
Tamrock Cabolter 7-5 (Macmahons) 0 1 1
CMPL 2011 AEMR
21
2.4.6 Mining Method
The mining method used at CSA for the majority of stoping remains the same as in previous years, that is, top
down, continuous advance, long-hole open stoping. Most stopes are filled with CHF and the balance is filled
with development waste. Some bottom up long-hole open stoping was carried out in 2011 and this will continue
in the 2012 reporting period.
2.4.7 Mine Development
During the 2011 AEMR period, underground horizontal development advance totalled 3,510 m. The Mine
vertical section provided (Plan 4) details mine development over 2011 and the outlook for 2012. Section 3.2.3
provides further detail on the shaft extension development project.
Mining has focused on the K, O and S lenses of the QTS North system and from the QR1 lens in the QTS South
system during the past five years and will continue to do so for the 2012 AEMR period. Ore has been extracted
as required from other smaller QTS North lenses to supplement ore supply and to provide an optimal feed grade
to the mill, as allowed by mining sequences and ground stress management. A similar approach will be taken
over the 2012 mining period. In addition it is planned to mine crown pillars from the upper sections of the QTS
north ore bodies as required.
Stoping is almost complete above the 8850 level in the QTS North except for some crown recoveries. The QTS
South mining is complete above the 9190 level, with a new stoping block will be developed below 9045 in the
QTS South, the bottom of the ore body is currently estimated at 8985. During the 2012 reporting period mining
will continue below the 8890 level in the QTS North and below 9045 level in the QTS South.
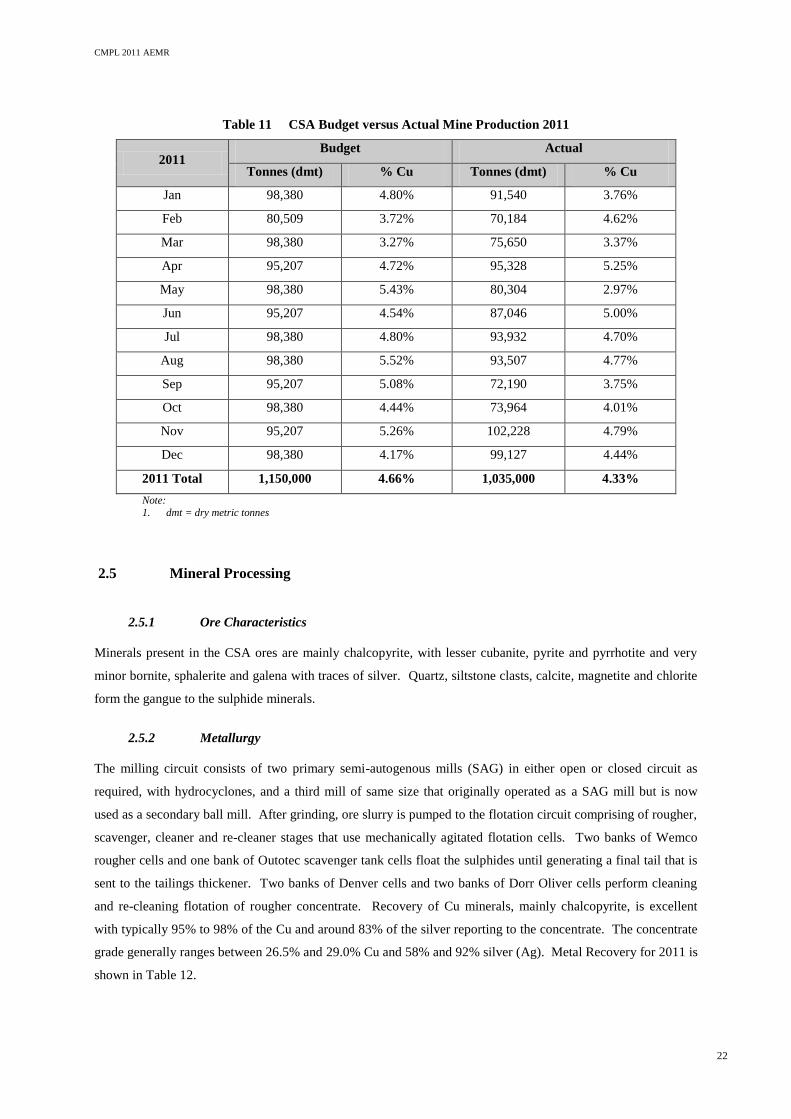
2.4.8 Mine Production
Actual stope performance and metal output for 2011 was below the budgeted figures. This was mainly the result
of lower utilisation of equipment, issues with the stoping and unplanned delays. Variations in monthly grades,
against budgeted figures, reflect timing fluctuations of individual stopes. Table 11 shows the comparison of
monthly budget and actual production performance during 2011.
Mine production was sourced from a variety of stopes within the mine. The QTS North Ore System provided
80% of the ore produced, while the remaining 20% came from the QTS South Ore System.
CMPL 2011 AEMR
22
Table 11 CSA Budget versus Actual Mine Production 2011
2011 Budget Actual
Tonnes (dmt) % Cu Tonnes (dmt) % Cu
Jan 98,380 4.80% 91,540 3.76%
Feb 80,509 3.72% 70,184 4.62%
Mar 98,380 3.27% 75,650 3.37%
Apr 95,207 4.72% 95,328 5.25%
May 98,380 5.43% 80,304 2.97%
Jun 95,207 4.54% 87,046 5.00%
Jul 98,380 4.80% 93,932 4.70%
Aug 98,380 5.52% 93,507 4.77%
Sep 95,207 5.08% 72,190 3.75%
Oct 98,380 4.44% 73,964 4.01%
Nov 95,207 5.26% 102,228 4.79%
Dec 98,380 4.17% 99,127 4.44%
2011 Total 1,150,000 4.66% 1,035,000 4.33%
Note:
1. dmt = dry metric tonnes
2.5 Mineral Processing
2.5.1 Ore Characteristics
Minerals present in the CSA ores are mainly chalcopyrite, with lesser cubanite, pyrite and pyrrhotite and very
minor bornite, sphalerite and galena with traces of silver. Quartz, siltstone clasts, calcite, magnetite and chlorite
form the gangue to the sulphide minerals.
2.5.2 Metallurgy
The milling circuit consists of two primary semi-autogenous mills (SAG) in either open or closed circuit as
required, with hydrocyclones, and a third mill of same size that originally operated as a SAG mill but is now
used as a secondary ball mill. After grinding, ore slurry is pumped to the flotation circuit comprising of rougher,
scavenger, cleaner and re-cleaner stages that use mechanically agitated flotation cells. Two banks of Wemco
rougher cells and one bank of Outotec scavenger tank cells float the sulphides until generating a final tail that is
sent to the tailings thickener. Two banks of Denver cells and two banks of Dorr Oliver cells perform cleaning
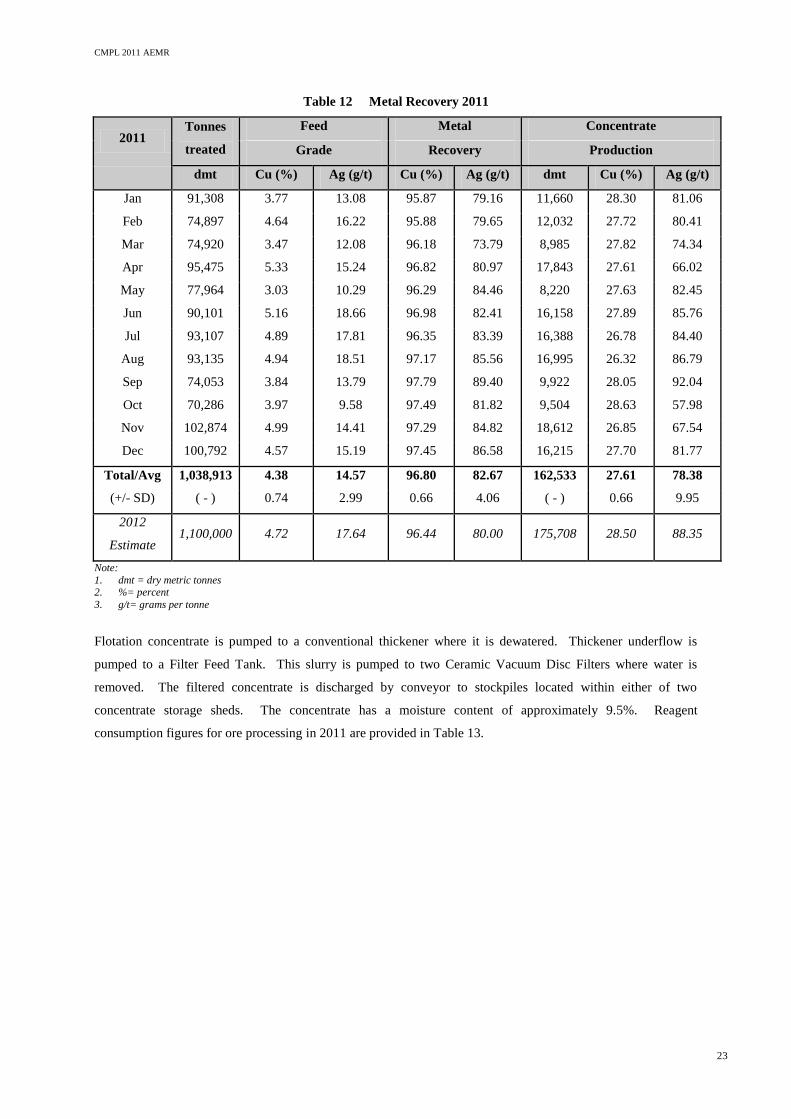
and re-cleaning flotation of rougher concentrate. Recovery of Cu minerals, mainly chalcopyrite, is excellent
with typically 95% to 98% of the Cu and around 83% of the silver reporting to the concentrate. The concentrate
grade generally ranges between 26.5% and 29.0% Cu and 58% and 92% silver (Ag). Metal Recovery for 2011 is
shown in Table 12.
CMPL 2011 AEMR
23
Table 12 Metal Recovery 2011
2011 Tonnes
treated
Feed Metal Concentrate
Grade Recovery Production
dmt Cu (%) Ag (g/t) Cu (%) Ag (g/t) dmt Cu (%) Ag (g/t)
Jan 91,308 3.77 13.08 95.87 79.16 11,660 28.30 81.06
Feb 74,897 4.64 16.22 95.88 79.65 12,032 27.72 80.41
Mar 74,920 3.47 12.08 96.18 73.79 8,985 27.82 74.34
Apr 95,475 5.33 15.24 96.82 80.97 17,843 27.61 66.02
May 77,964 3.03 10.29 96.29 84.46 8,220 27.63 82.45
Jun 90,101 5.16 18.66 96.98 82.41 16,158 27.89 85.76
Jul 93,107 4.89 17.81 96.35 83.39 16,388 26.78 84.40
Aug 93,135 4.94 18.51 97.17 85.56 16,995 26.32 86.79
Sep 74,053 3.84 13.79 97.79 89.40 9,922 28.05 92.04
Oct 70,286 3.97 9.58 97.49 81.82 9,504 28.63 57.98
Nov 102,874 4.99 14.41 97.29 84.82 18,612 26.85 67.54
Dec 100,792 4.57 15.19 97.45 86.58 16,215 27.70 81.77
Total/Avg 1,038,913 4.38 14.57 96.80 82.67 162,533 27.61 78.38
(+/- SD) ( - ) 0.74 2.99 0.66 4.06 ( - ) 0.66 9.95
2012
Estimate 1,100,000 4.72 17.64 96.44 80.00 175,708 28.50 88.35
Note:
1. dmt = dry metric tonnes 2. %= percent
3. g/t= grams per tonne
Flotation concentrate is pumped to a conventional thickener where it is dewatered. Thickener underflow is
pumped to a Filter Feed Tank. This slurry is pumped to two Ceramic Vacuum Disc Filters where water is
removed. The filtered concentrate is discharged by conveyor to stockpiles located within either of two
concentrate storage sheds. The concentrate has a moisture content of approximately 9.5%. Reagent
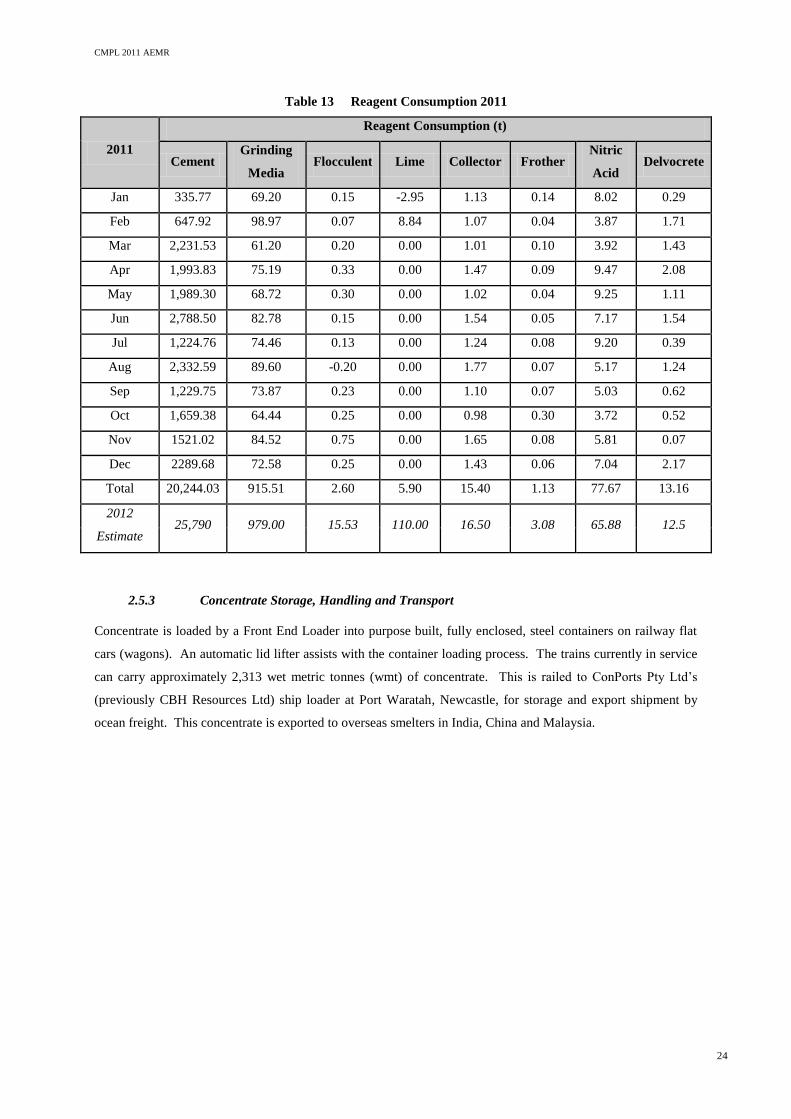
consumption figures for ore processing in 2011 are provided in Table 13.
CMPL 2011 AEMR
24
Table 13 Reagent Consumption 2011
2011
Reagent Consumption (t)
Cement Grinding
Media Flocculent Lime Collector Frother
Nitric
Acid Delvocrete
Jan 335.77 69.20 0.15 -2.95 1.13 0.14 8.02 0.29
Feb 647.92 98.97 0.07 8.84 1.07 0.04 3.87 1.71
Mar 2,231.53 61.20 0.20 0.00 1.01 0.10 3.92 1.43
Apr 1,993.83 75.19 0.33 0.00 1.47 0.09 9.47 2.08
May 1,989.30 68.72 0.30 0.00 1.02 0.04 9.25 1.11
Jun 2,788.50 82.78 0.15 0.00 1.54 0.05 7.17 1.54
Jul 1,224.76 74.46 0.13 0.00 1.24 0.08 9.20 0.39
Aug 2,332.59 89.60 -0.20 0.00 1.77 0.07 5.17 1.24
Sep 1,229.75 73.87 0.23 0.00 1.10 0.07 5.03 0.62
Oct 1,659.38 64.44 0.25 0.00 0.98 0.30 3.72 0.52
Nov 1521.02 84.52 0.75 0.00 1.65 0.08 5.81 0.07
Dec 2289.68 72.58 0.25 0.00 1.43 0.06 7.04 2.17
Total 20,244.03 915.51 2.60 5.90 15.40 1.13 77.67 13.16
2012
Estimate 25,790 979.00 15.53 110.00 16.50 3.08 65.88 12.5
2.5.3 Concentrate Storage, Handling and Transport
Concentrate is loaded by a Front End Loader into purpose built, fully enclosed, steel containers on railway flat
cars (wagons). An automatic lid lifter assists with the container loading process. The trains currently in service
can carry approximately 2,313 wet metric tonnes (wmt) of concentrate. This is railed to ConPorts Pty Ltd’s
(previously CBH Resources Ltd) ship loader at Port Waratah, Newcastle, for storage and export shipment by
ocean freight. This concentrate is exported to overseas smelters in India, China and Malaysia.
CMPL 2011 AEMR
25
2.6 Waste Management
CMPL have long recognised the need for a reliable and regular waste removal and recycling service for the CSA
Mine that meets environmental, safety, operational, future growth and financial requirements. The CMPL Waste
Management System aims to achieve the following objectives:
Cost effective waste management and recycling system;
A holistic approach to waste minimisation and recycling;
Maximise recycling outcomes where possible to minimise waste to landfill;
Provide accurate invoicing and waste tracking receipts; and
Assist where possible to enable the provision of recycling for the town of Cobar.
2.6.1 General Waste
General waste at the CSA Mine is separated into co-mingled recyclables and non-recyclable / putrescibles waste.
Dubbo based company JR Richards & Sons Waste and Recycling Services (JRR) is contracted for the collection
of both waste streams from the CSA Mine. This service includes the supply and servicing of separate, colour-
coded general waste and co-mingled recycle bins.
All non-recyclable and putrescibles waste is taken to the Cobar landfill facility for disposal, while all co-mingled
recyclable waste is transported to the JRR Material Recovery Facility in Dubbo for processing and eventual sale.
This co-mingled service allows for all recycle materials to be collected together, including paper, cardboard,
PET/HDPE plastics, aluminium, glass and tin.
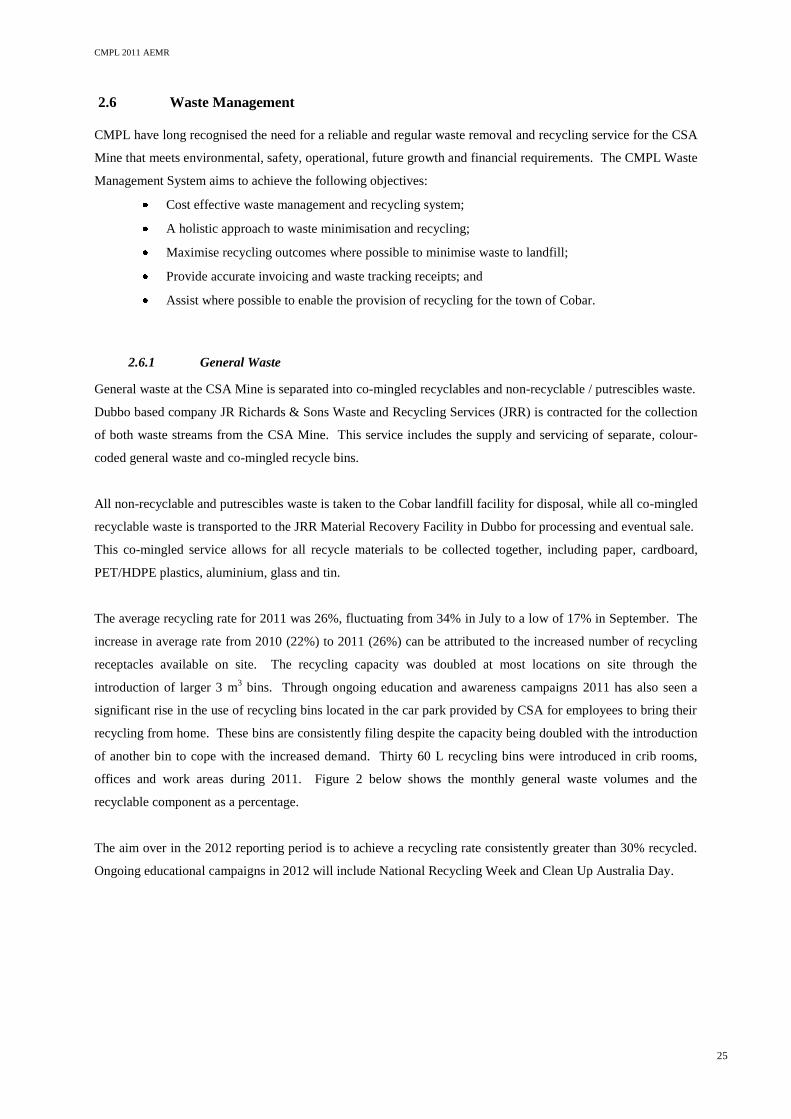
The average recycling rate for 2011 was 26%, fluctuating from 34% in July to a low of 17% in September. The
increase in average rate from 2010 (22%) to 2011 (26%) can be attributed to the increased number of recycling
receptacles available on site. The recycling capacity was doubled at most locations on site through the
introduction of larger 3 m3 bins. Through ongoing education and awareness campaigns 2011 has also seen a
significant rise in the use of recycling bins located in the car park provided by CSA for employees to bring their
recycling from home. These bins are consistently filing despite the capacity being doubled with the introduction
of another bin to cope with the increased demand. Thirty 60 L recycling bins were introduced in crib rooms,
offices and work areas during 2011. Figure 2 below shows the monthly general waste volumes and the
recyclable component as a percentage.
The aim over in the 2012 reporting period is to achieve a recycling rate consistently greater than 30% recycled.
Ongoing educational campaigns in 2012 will include National Recycling Week and Clean Up Australia Day.
CMPL 2011 AEMR
26
Figure 2 CSA Mine General Waste Management Performance 2011
2.6.2 Industrial Waste
Industrial waste at the CSA Mine is split into the main waste streams: metals, rubber, hydrocarbons, and
sewerage waste. Each of these waste streams is managed and tracked separately.
Metal waste includes steel and Cu cables, both of which are removed off site for recycling. A total of 132 t of
scrap steel was sold to external contractors during 2011 for recycling.
54 t of steel and rubber mill liners were removed off site by contract recyclers who separate the rubber from the
metal to ensure the recyclable components are maximised. Most of the CSA Mine’s rubber tyre recycling is
managed through a returns arrangement with the local tyre supplier. In addition to this arrangement, 328 rubber
tyres were sent off site to The Tyre Doctor (licensed contractor based in Leeton) for recycling in 2011.
Hydrocarbons are recycled where possible from surface (processing plant and workshops) and underground
(workshops). An EPA licensed contractor collects the waste oil on an as needs basis. During 2011 106,500 L of
waste oil was collected by Renewable Oil Services Pty Ltd (EPA Transport Licence No. 12991; EPA Depot
Licence No. 13092). Waste grease and other mixed oily products (rags, plastic liners, gloves, filters, filters etc.)
are collected by the same licensed contractor on an as need basis. A total of 34 drums (205 L each) and 12 IBC
pods (1000 L each) of waste grease and associated contaminated products were removed from site during 2011,
producing a total of 11,758kg of recyclable product. A further 2,640 kg of waste batteries were removed from
site for recycling over the 2011 period.
Underground sewage waste is removed from site by a licensed contractor and disposed of at a designated pit
provided at the CSC landfill. During 2011 approximately 222,000 L of sewage waste was removed by Every
CMPL 2011 AEMR
27
Day Mine Services (EDMS) and Cobar Mining Contractors. Due to regulation changes in 2011, sewage waste is
only required to be tracked if it is being transported interstate hence transportation to the CSC landfill does not
require a Transport Certificate or an EPL.
2.6.3 Underground Waste Rock
Waste rock produced by underground mining operations is disposed of into underground voids left by stoping
operations, or hoisted to the surface (only during periods of low void inventory). Cumulative mine waste
production is provided in Table 15 in Section 2.7.4. A total of 396,476 t of waste rock production is budgeted
underground for the 2012 period.
2.6.4 Tailings Waste
Backfill fines, or flotation tailings when backfill is not required, are sent to the Final Tailings Thickener for
dewatering prior to pumping to the TSF. Target moisture content of final tailings is Specific Gravity (SG) = 1.5.
Tailings are pumped approximately 2.2 km in a High Density Polyethylene (HDPE) pipeline to the TSF and
deposited from a central raised causeway. The TSF comprises the STSF of approximately 82 ha and the North
Tailings Storage Facility (NTSF) of 103 ha. The NTSF has not been used since CMPL took over the CSA
operation and is excised from CML5.
The amount of tailings deposited is regularly monitored; a monthly summary is provided in Table 9 of
Section 2.4. A total of 536,188 t of tailings was deposited between 1 January and 31 December 2011 at an
average production rate of just over 1,468 t per day. This accounted for 61.1% of flotation tailings. The
remaining 38.9% of the flotation tailings was backfilled into the underground workings.
Thickened tailings will continue to be deposited in the STSF over the 2012 AEMR period. Tailings will be
deposited in thin discrete layers, approximately 100 mm in thickness from the end of the discharge causeway.
Discharge is distributed between 13 spigots close to the end of the causeway to limit the discharge velocity of
tailings from the pipes. The distribution of flow via at least three spigots has resulted in the development of a
well defined beach.
Deposition of tailings will be alternated between the North West side and South East side of the causeway. This
approach is intended to maximise evaporative drying by sun and wind exposure of the non-active tailings beach
area. This structured deposition method will help reduce rate of rise of the tailings by allowing tailings on the
beach to dry and desiccate before it is subsequently covered with fresh wet tailings. This will achieve a high dry
density of the tailings, increase water recovery and optimise storage capacity.
CMPL 2011 AEMR
28
2.7 Ore and Product Stockpiles
2.7.1 Ore Stockpiles
Ore hoisted to surface is stored in any of four concrete, open topped storage bins. Total capacity is
approximately 6,000 wmt.
A scoping study is budgeted in 2012 which will aim to determine the options for introducing a surface ore
stockpile as part of the works associated with the Mill Grinding Circuit upgrade. This is required to occur in
conjunction with the shaft project. Further details and options will be presented to the relevant regulators for
approval towards quarter four 2012.
2.7.2 Product Stockpiles
Flotation concentrate is stored in either of two concentrate storage sheds, with combined storage capacity of
approximately 25,000 wmt. The sheds are covered and partially enclosed which assists in the minimisation of
dust generation. Each shed has a concrete floor and wall bunds which minimises losses to the environment.
Run-off from the sheds is contained and directed to a contaminated water collection dam (Borrow Pit Dam).
Approximately 6,425 dmt of Cu concentrate was stored in the concentrate storage sheds as at 31 December 2011.
A stockpile of approximately 15,992 dmt was stored at the port awaiting shipment.
2.7.3 Topsoil Stockpiles
A comprehensive review of all topsoil resources was conducted in 2011 with volumes updated based on
construction records (where available) and GIS software. Current stockpiles of topsoil at the CSA Mine total
approximately 63,329 m3. An estimated 5,500 m
3 of topsoil is stockpiled behind the NTSF from operations prior
to CMPL taking over in 1999. All remaining topsoil on site resulted from the development of the STSFE in
2006 (50,969 m3) and the extension to the TSF Decant Dam in 2010 (6,680 m
3).
Topsoil and subsoil was handled according to best practice procedures by separating topsoil and subsoil in two
separate stockpiles during the construction of the Decant Dam Extension in 2010. Topsoil from the STSFE
development is stockpiled along the TSF access road (18,714 m3) and at the site of the original interim stockpile
adjacent to Railway Dam (32,255 m3), while the new stockpile resulting from the Decant Dam extension is
stockpiled adjacent to the southern wall of the Decant Dam facility. These small stockpiles (based on a
maximum height of 3 m) are located close to the TSF to ensure potential losses due to excessive handling are
minimised. This topsoil will remain stockpiled until required for rehabilitation purposes on site. Where
available, green waste has been placed on topsoil stockpiles and stockpiles seeded to encourage organic matter
and the maintenance of a viable seed bank.
Table 14 displays CSA topsoil stockpile information and Figure 3 displays topsoil stockpile locations.
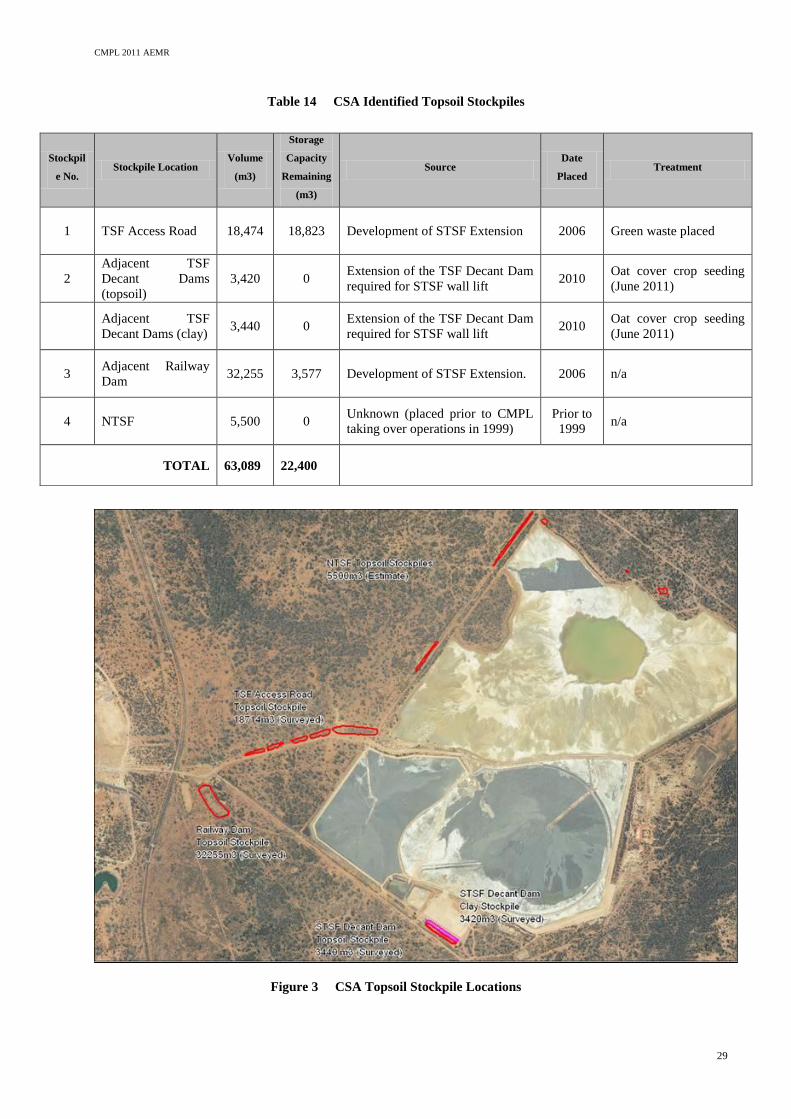
CMPL 2011 AEMR
29
Table 14 CSA Identified Topsoil Stockpiles
Figure 3 CSA Topsoil Stockpile Locations
Stockpil
e No. Stockpile Location
Volume
(m3)
Storage
Capacity
Remaining
(m3)
Source Date
Placed Treatment
1 TSF Access Road 18,474 18,823 Development of STSF Extension 2006 Green waste placed
2
Adjacent TSF
Decant Dams
(topsoil)
3,420 0 Extension of the TSF Decant Dam
required for STSF wall lift 2010
Oat cover crop seeding
(June 2011)
Adjacent TSF
Decant Dams (clay) 3,440 0
Extension of the TSF Decant Dam
required for STSF wall lift 2010
Oat cover crop seeding
(June 2011)
3 Adjacent Railway
Dam 32,255 3,577 Development of STSF Extension. 2006 n/a
4 NTSF 5,500 0 Unknown (placed prior to CMPL
taking over operations in 1999)
Prior to
1999 n/a
TOTAL 63,089 22,400
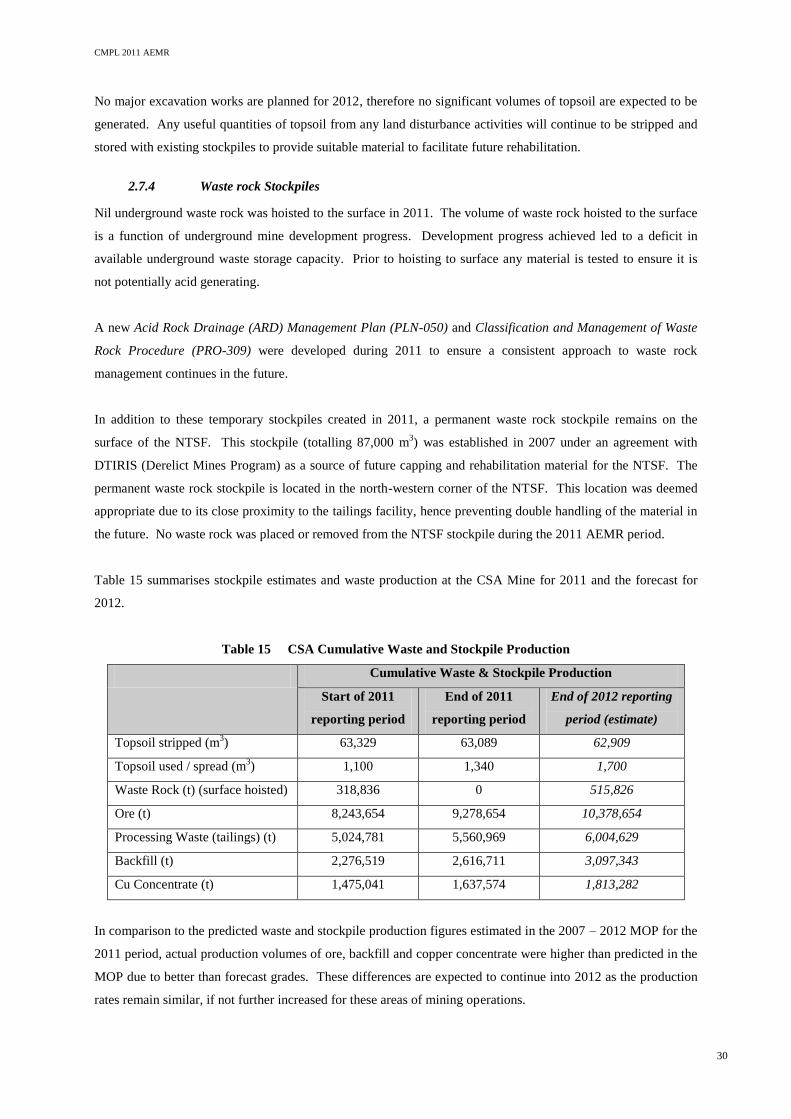
CMPL 2011 AEMR
30
No major excavation works are planned for 2012, therefore no significant volumes of topsoil are expected to be
generated. Any useful quantities of topsoil from any land disturbance activities will continue to be stripped and
stored with existing stockpiles to provide suitable material to facilitate future rehabilitation.
2.7.4 Waste rock Stockpiles
Nil underground waste rock was hoisted to the surface in 2011. The volume of waste rock hoisted to the surface
is a function of underground mine development progress. Development progress achieved led to a deficit in
available underground waste storage capacity. Prior to hoisting to surface any material is tested to ensure it is
not potentially acid generating.
A new Acid Rock Drainage (ARD) Management Plan (PLN-050) and Classification and Management of Waste
Rock Procedure (PRO-309) were developed during 2011 to ensure a consistent approach to waste rock
management continues in the future.
In addition to these temporary stockpiles created in 2011, a permanent waste rock stockpile remains on the
surface of the NTSF. This stockpile (totalling 87,000 m3) was established in 2007 under an agreement with
DTIRIS (Derelict Mines Program) as a source of future capping and rehabilitation material for the NTSF. The
permanent waste rock stockpile is located in the north-western corner of the NTSF. This location was deemed
appropriate due to its close proximity to the tailings facility, hence preventing double handling of the material in
the future. No waste rock was placed or removed from the NTSF stockpile during the 2011 AEMR period.
Table 15 summarises stockpile estimates and waste production at the CSA Mine for 2011 and the forecast for
2012.
Table 15 CSA Cumulative Waste and Stockpile Production
Cumulative Waste & Stockpile Production
Start of 2011
reporting period
End of 2011
reporting period
End of 2012 reporting
period (estimate)
Topsoil stripped (m3) 63,329 63,089 62,909
Topsoil used / spread (m3) 1,100 1,340 1,700
Waste Rock (t) (surface hoisted) 318,836 0 515,826
Ore (t) 8,243,654 9,278,654 10,378,654
Processing Waste (tailings) (t) 5,024,781 5,560,969 6,004,629
Backfill (t) 2,276,519 2,616,711 3,097,343
Cu Concentrate (t) 1,475,041 1,637,574 1,813,282
In comparison to the predicted waste and stockpile production figures estimated in the 2007 – 2012 MOP for the
2011 period, actual production volumes of ore, backfill and copper concentrate were higher than predicted in the
MOP due to better than forecast grades. These differences are expected to continue into 2012 as the production
rates remain similar, if not further increased for these areas of mining operations.
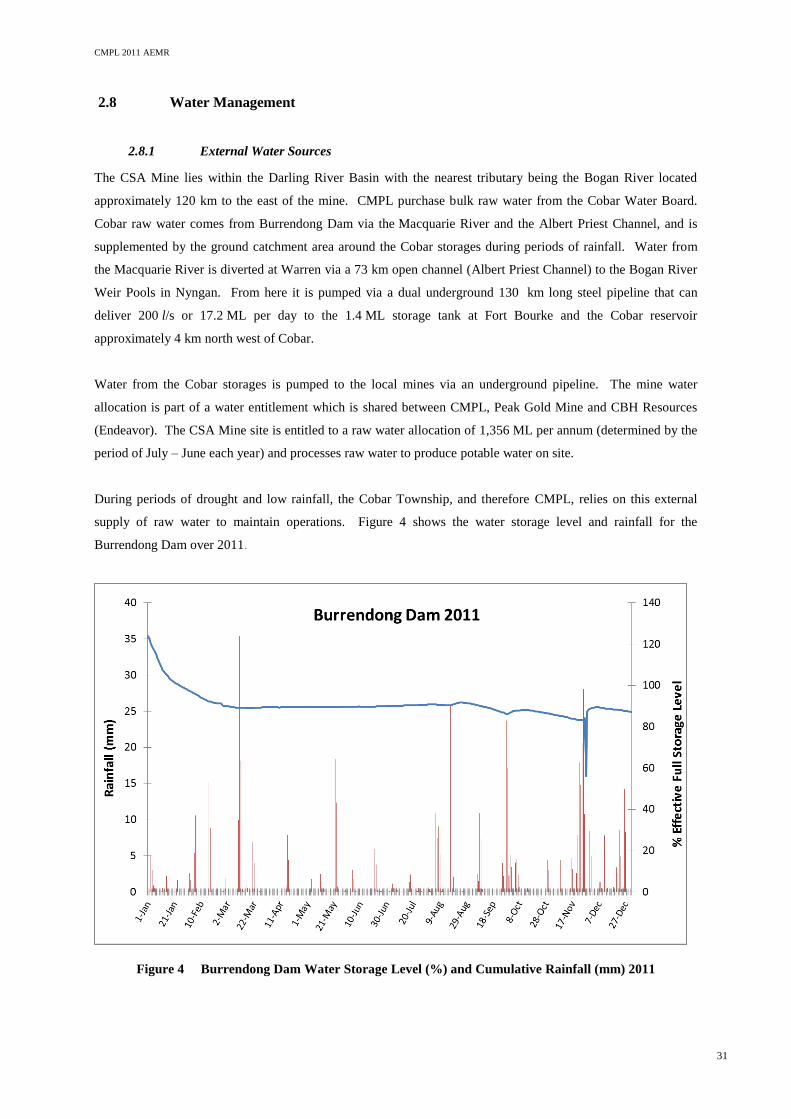
CMPL 2011 AEMR
31
2.8 Water Management
2.8.1 External Water Sources
The CSA Mine lies within the Darling River Basin with the nearest tributary being the Bogan River located
approximately 120 km to the east of the mine. CMPL purchase bulk raw water from the Cobar Water Board.
Cobar raw water comes from Burrendong Dam via the Macquarie River and the Albert Priest Channel, and is
supplemented by the ground catchment area around the Cobar storages during periods of rainfall. Water from
the Macquarie River is diverted at Warren via a 73 km open channel (Albert Priest Channel) to the Bogan River
Weir Pools in Nyngan. From here it is pumped via a dual underground 130 km long steel pipeline that can
deliver 200 l/s or 17.2 ML per day to the 1.4 ML storage tank at Fort Bourke and the Cobar reservoir
approximately 4 km north west of Cobar.
Water from the Cobar storages is pumped to the local mines via an underground pipeline. The mine water
allocation is part of a water entitlement which is shared between CMPL, Peak Gold Mine and CBH Resources
(Endeavor). The CSA Mine site is entitled to a raw water allocation of 1,356 ML per annum (determined by the
period of July – June each year) and processes raw water to produce potable water on site.
During periods of drought and low rainfall, the Cobar Township, and therefore CMPL, relies on this external
supply of raw water to maintain operations. Figure 4 shows the water storage level and rainfall for the
Burrendong Dam over 2011.
Figure 4 Burrendong Dam Water Storage Level (%) and Cumulative Rainfall (mm) 2011
CMPL 2011 AEMR
32
2.8.2 Surface Water Sources
In 2011 expert consultants were commissioned by CMPL to develop a Site Water Management Plan (SWMP).
The SWMP is currently in draft, finalisation is expected in quarter one 2012. The plan will be submitted to
DTIRIS and OEH on finalisation. The SWMP strategically manages water onsite in order to:
Avoid discharge of contaminated water;
Reduce reliance of water from external sources;
Reduce losses from evaporation and seepage;
Maximise water re-use on site by recycling where practicable;
Separate clean, contaminated and dirty water sources where practicable.
The SWMP outlines operational procedures to cover critical water management issues and events (e.g. forecast
high rainfall events and water storage dams are at capacity). These procedures ensure there are appropriate
responses to events with controls put in place to prevent breaches of EPL1864 including the discharge of
contaminated water. The procedures also outline measures to ensure there is maximum efficiency in water re-
use.
As part of the SWMP CSA Mine catchment boundaries were detailed and mapped using the Digital Elevation
Model (DEM). There are thirty five catchments within the mine lease boundaries for which rainfall runoff is
controlled and prevented from leaving site. These catchments are summarised in Table 16 and displayed in
Figure 5.
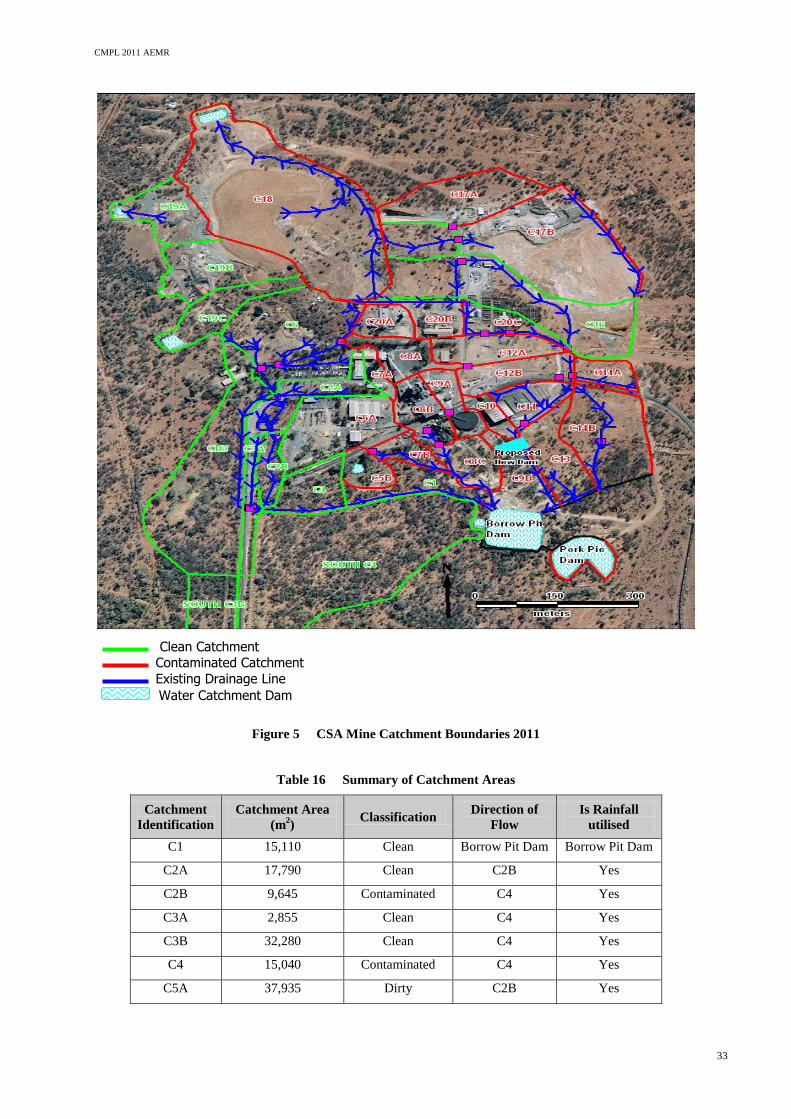
CMPL 2011 AEMR
33
Clean Catchment Contaminated Catchment
Existing Drainage Line
Water Catchment Dam
Figure 5 CSA Mine Catchment Boundaries 2011
Table 16 Summary of Catchment Areas
Catchment
Identification
Catchment Area
(m2)
Classification Direction of
Flow
Is Rainfall
utilised
C1 15,110 Clean Borrow Pit Dam Borrow Pit Dam
C2A 17,790 Clean C2B Yes
C2B 9,645 Contaminated C4 Yes
C3A 2,855 Clean C4 Yes
C3B 32,280 Clean C4 Yes
C4 15,040 Contaminated C4 Yes
C5A 37,935 Dirty C2B Yes
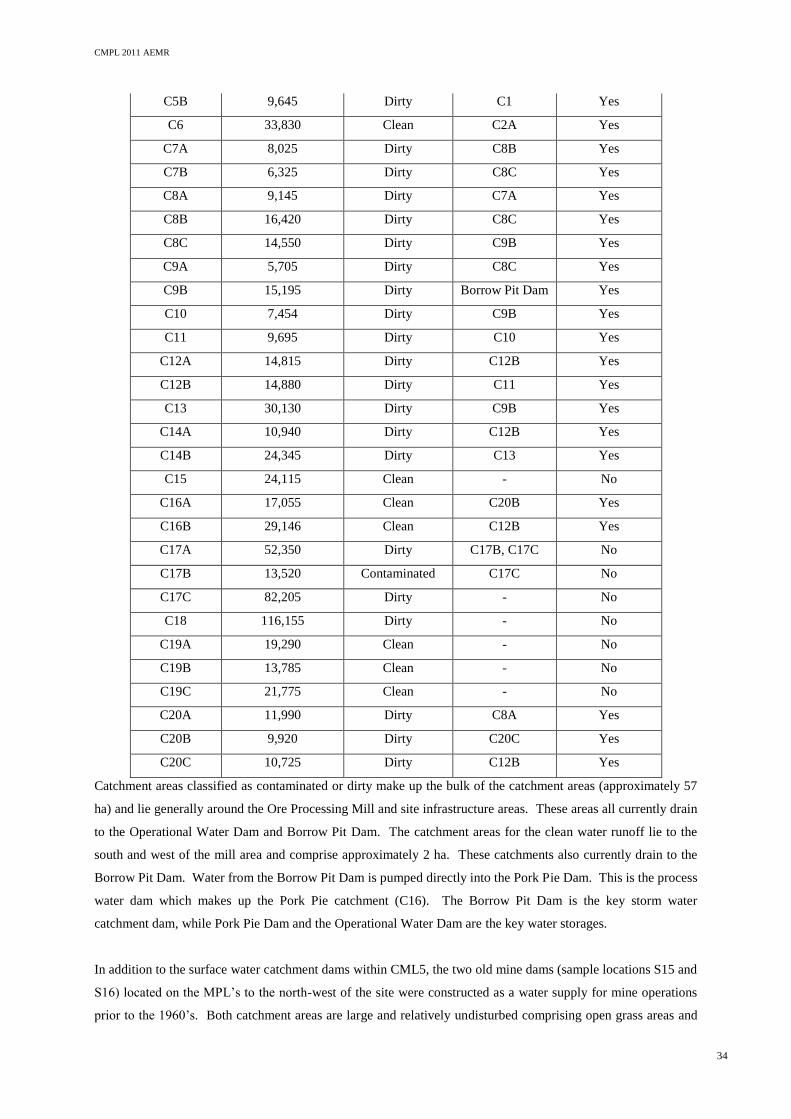
CMPL 2011 AEMR
34
C5B 9,645 Dirty C1 Yes
C6 33,830 Clean C2A Yes
C7A 8,025 Dirty C8B Yes
C7B 6,325 Dirty C8C Yes
C8A 9,145 Dirty C7A Yes
C8B 16,420 Dirty C8C Yes
C8C 14,550 Dirty C9B Yes
C9A 5,705 Dirty C8C Yes
C9B 15,195 Dirty Borrow Pit Dam Yes
C10 7,454 Dirty C9B Yes
C11 9,695 Dirty C10 Yes
C12A 14,815 Dirty C12B Yes
C12B 14,880 Dirty C11 Yes
C13 30,130 Dirty C9B Yes
C14A 10,940 Dirty C12B Yes
C14B 24,345 Dirty C13 Yes
C15 24,115 Clean - No
C16A 17,055 Clean C20B Yes
C16B 29,146 Clean C12B Yes
C17A 52,350 Dirty C17B, C17C No
C17B 13,520 Contaminated C17C No
C17C 82,205 Dirty - No
C18 116,155 Dirty - No
C19A 19,290 Clean - No
C19B 13,785 Clean - No
C19C 21,775 Clean - No
C20A 11,990 Dirty C8A Yes
C20B 9,920 Dirty C20C Yes
C20C 10,725 Dirty C12B Yes
Catchment areas classified as contaminated or dirty make up the bulk of the catchment areas (approximately 57
ha) and lie generally around the Ore Processing Mill and site infrastructure areas. These areas all currently drain
to the Operational Water Dam and Borrow Pit Dam. The catchment areas for the clean water runoff lie to the
south and west of the mill area and comprise approximately 2 ha. These catchments also currently drain to the
Borrow Pit Dam. Water from the Borrow Pit Dam is pumped directly into the Pork Pie Dam. This is the process
water dam which makes up the Pork Pie catchment (C16). The Borrow Pit Dam is the key storm water
catchment dam, while Pork Pie Dam and the Operational Water Dam are the key water storages.
In addition to the surface water catchment dams within CML5, the two old mine dams (sample locations S15 and
S16) located on the MPL’s to the north-west of the site were constructed as a water supply for mine operations
prior to the 1960’s. Both catchment areas are large and relatively undisturbed comprising open grass areas and

CMPL 2011 AEMR
35
scattered to dense scrub, hence both dams are used to monitor baseline water quality. These dams act as a
potential alternative water supply for the CSA Mine operations in the future. Water is able to be pumped to site
into the process water system if required.
A summary of all current water storages at the CSA Mine is shown in Table 17. Plan 2 shows the location of
these existing water catchment and storage dams.
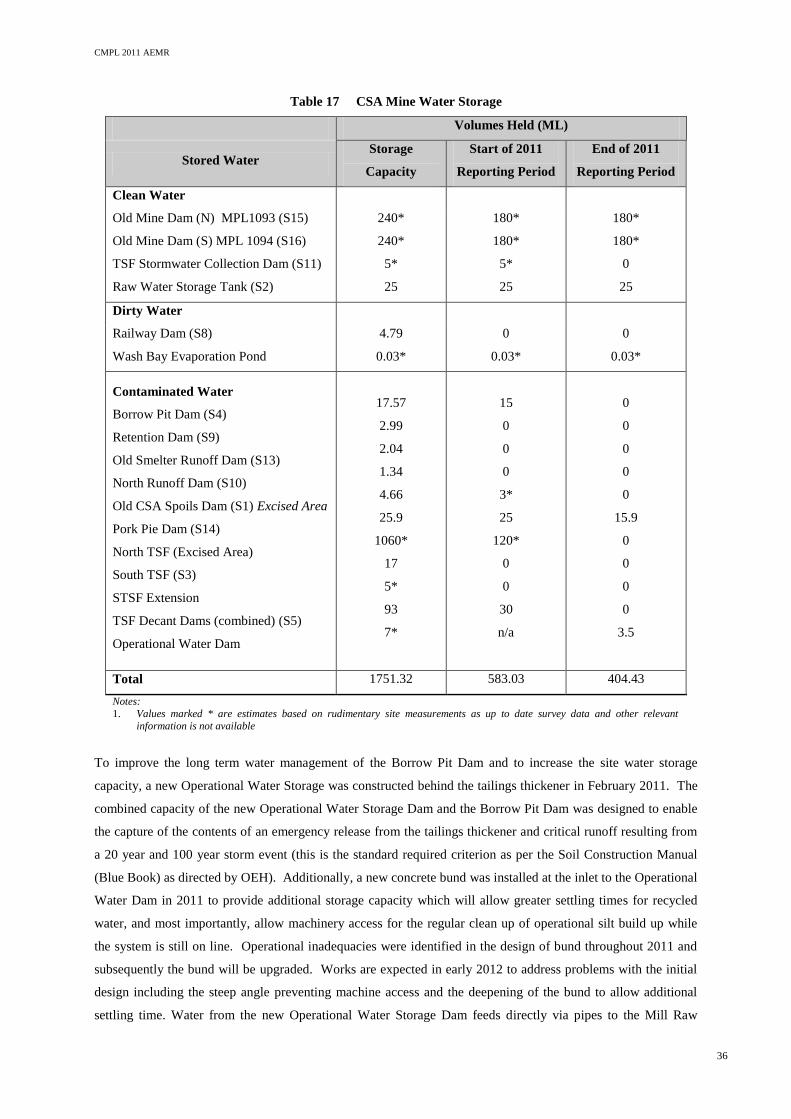
CMPL 2011 AEMR
36
Table 17 CSA Mine Water Storage
Volumes Held (ML)
Stored Water Storage
Capacity
Start of 2011
Reporting Period
End of 2011
Reporting Period
Clean Water
Old Mine Dam (N) MPL1093 (S15)
Old Mine Dam (S) MPL 1094 (S16)
TSF Stormwater Collection Dam (S11)
Raw Water Storage Tank (S2)
240*
240*
5*
25
180*
180*
5*
25
180*
180*
0
25
Dirty Water
Railway Dam (S8)
Wash Bay Evaporation Pond
4.79
0.03*
0
0.03*
0
0.03*
Contaminated Water
Borrow Pit Dam (S4)
Retention Dam (S9)
Old Smelter Runoff Dam (S13)
North Runoff Dam (S10)
Old CSA Spoils Dam (S1) Excised Area
Pork Pie Dam (S14)
North TSF (Excised Area)
South TSF (S3)
STSF Extension
TSF Decant Dams (combined) (S5)
Operational Water Dam
17.57
2.99
2.04
1.34
4.66
25.9
1060*
17
5*
93
7*
15
0
0
0
3*
25
120*
0
0
30
n/a
0
0
0
0
0
15.9
0
0
0
0
3.5
Total 1751.32 583.03 404.43
Notes:
1. Values marked * are estimates based on rudimentary site measurements as up to date survey data and other relevant
information is not available
To improve the long term water management of the Borrow Pit Dam and to increase the site water storage
capacity, a new Operational Water Storage was constructed behind the tailings thickener in February 2011. The
combined capacity of the new Operational Water Storage Dam and the Borrow Pit Dam was designed to enable
the capture of the contents of an emergency release from the tailings thickener and critical runoff resulting from
a 20 year and 100 year storm event (this is the standard required criterion as per the Soil Construction Manual
(Blue Book) as directed by OEH). Additionally, a new concrete bund was installed at the inlet to the Operational
Water Dam in 2011 to provide additional storage capacity which will allow greater settling times for recycled
water, and most importantly, allow machinery access for the regular clean up of operational silt build up while
the system is still on line. Operational inadequacies were identified in the design of bund throughout 2011 and
subsequently the bund will be upgraded. Works are expected in early 2012 to address problems with the initial
design including the steep angle preventing machine access and the deepening of the bund to allow additional
settling time. Water from the new Operational Water Storage Dam feeds directly via pipes to the Mill Raw
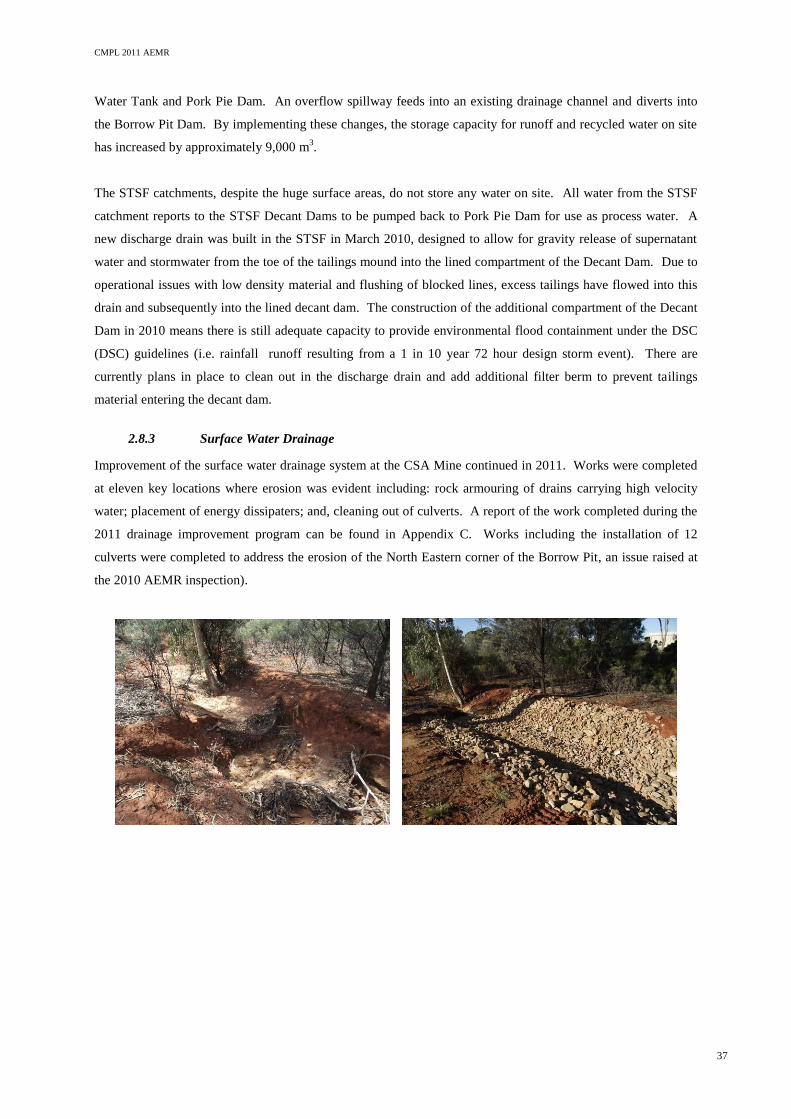
CMPL 2011 AEMR
37
Water Tank and Pork Pie Dam. An overflow spillway feeds into an existing drainage channel and diverts into
the Borrow Pit Dam. By implementing these changes, the storage capacity for runoff and recycled water on site
has increased by approximately 9,000 m3.
The STSF catchments, despite the huge surface areas, do not store any water on site. All water from the STSF
catchment reports to the STSF Decant Dams to be pumped back to Pork Pie Dam for use as process water. A
new discharge drain was built in the STSF in March 2010, designed to allow for gravity release of supernatant
water and stormwater from the toe of the tailings mound into the lined compartment of the Decant Dam. Due to
operational issues with low density material and flushing of blocked lines, excess tailings have flowed into this
drain and subsequently into the lined decant dam. The construction of the additional compartment of the Decant
Dam in 2010 means there is still adequate capacity to provide environmental flood containment under the DSC
(DSC) guidelines (i.e. rainfall runoff resulting from a 1 in 10 year 72 hour design storm event). There are
currently plans in place to clean out in the discharge drain and add additional filter berm to prevent tailings
material entering the decant dam.
2.8.3 Surface Water Drainage
Improvement of the surface water drainage system at the CSA Mine continued in 2011. Works were completed
at eleven key locations where erosion was evident including: rock armouring of drains carrying high velocity
water; placement of energy dissipaters; and, cleaning out of culverts. A report of the work completed during the
2011 drainage improvement program can be found in Appendix C. Works including the installation of 12
culverts were completed to address the erosion of the North Eastern corner of the Borrow Pit, an issue raised at
the 2010 AEMR inspection).
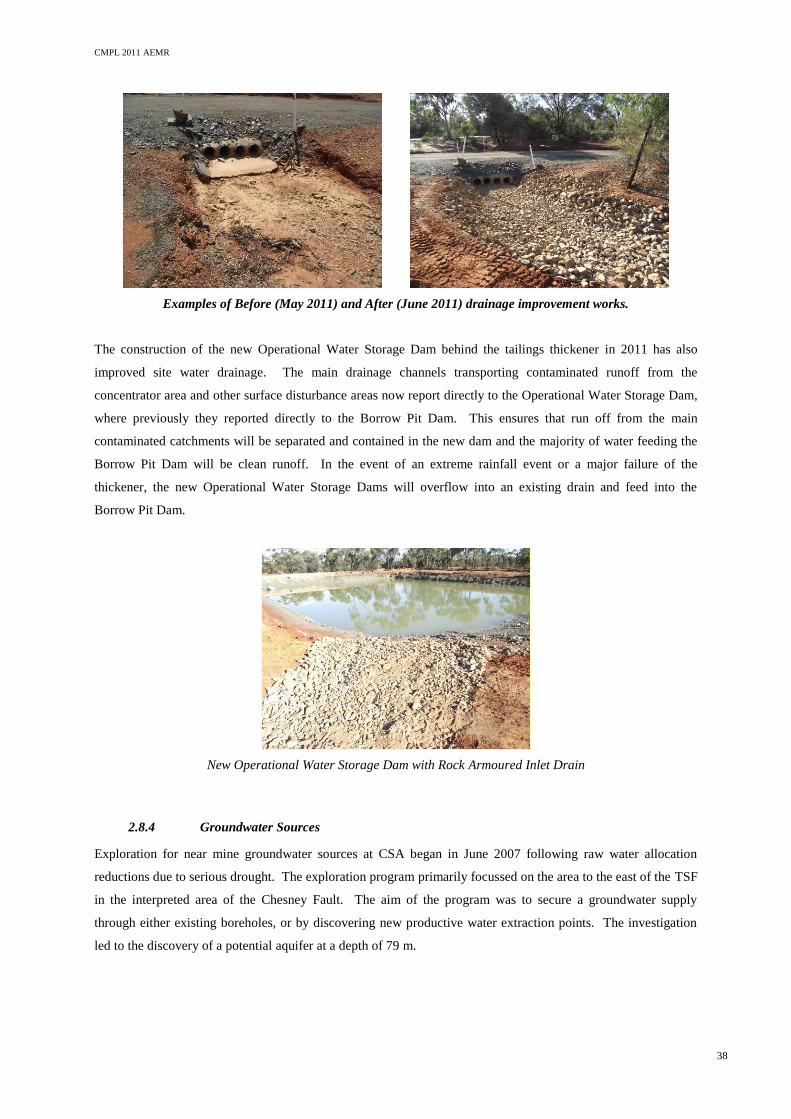
CMPL 2011 AEMR
38
Examples of Before (May 2011) and After (June 2011) drainage improvement works.
The construction of the new Operational Water Storage Dam behind the tailings thickener in 2011 has also
improved site water drainage. The main drainage channels transporting contaminated runoff from the
concentrator area and other surface disturbance areas now report directly to the Operational Water Storage Dam,
where previously they reported directly to the Borrow Pit Dam. This ensures that run off from the main
contaminated catchments will be separated and contained in the new dam and the majority of water feeding the
Borrow Pit Dam will be clean runoff. In the event of an extreme rainfall event or a major failure of the
thickener, the new Operational Water Storage Dams will overflow into an existing drain and feed into the
Borrow Pit Dam.
New Operational Water Storage Dam with Rock Armoured Inlet Drain
2.8.4 Groundwater Sources
Exploration for near mine groundwater sources at CSA began in June 2007 following raw water allocation
reductions due to serious drought. The exploration program primarily focussed on the area to the east of the TSF
in the interpreted area of the Chesney Fault. The aim of the program was to secure a groundwater supply
through either existing boreholes, or by discovering new productive water extraction points. The investigation
led to the discovery of a potential aquifer at a depth of 79 m.
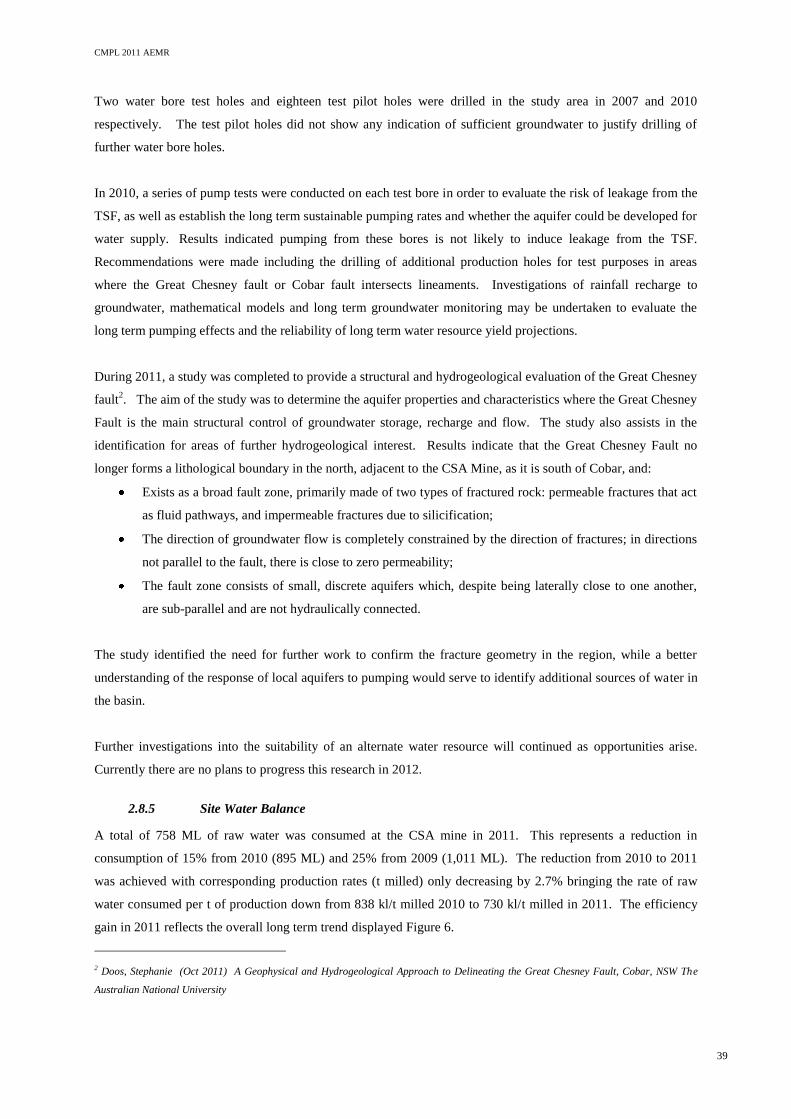
CMPL 2011 AEMR
39
Two water bore test holes and eighteen test pilot holes were drilled in the study area in 2007 and 2010
respectively. The test pilot holes did not show any indication of sufficient groundwater to justify drilling of
further water bore holes.
In 2010, a series of pump tests were conducted on each test bore in order to evaluate the risk of leakage from the
TSF, as well as establish the long term sustainable pumping rates and whether the aquifer could be developed for
water supply. Results indicated pumping from these bores is not likely to induce leakage from the TSF.
Recommendations were made including the drilling of additional production holes for test purposes in areas
where the Great Chesney fault or Cobar fault intersects lineaments. Investigations of rainfall recharge to
groundwater, mathematical models and long term groundwater monitoring may be undertaken to evaluate the
long term pumping effects and the reliability of long term water resource yield projections.
During 2011, a study was completed to provide a structural and hydrogeological evaluation of the Great Chesney
fault2. The aim of the study was to determine the aquifer properties and characteristics where the Great Chesney
Fault is the main structural control of groundwater storage, recharge and flow. The study also assists in the
identification for areas of further hydrogeological interest. Results indicate that the Great Chesney Fault no
longer forms a lithological boundary in the north, adjacent to the CSA Mine, as it is south of Cobar, and:
Exists as a broad fault zone, primarily made of two types of fractured rock: permeable fractures that act
as fluid pathways, and impermeable fractures due to silicification;
The direction of groundwater flow is completely constrained by the direction of fractures; in directions
not parallel to the fault, there is close to zero permeability;
The fault zone consists of small, discrete aquifers which, despite being laterally close to one another,
are sub-parallel and are not hydraulically connected.
The study identified the need for further work to confirm the fracture geometry in the region, while a better
understanding of the response of local aquifers to pumping would serve to identify additional sources of water in
the basin.
Further investigations into the suitability of an alternate water resource will continued as opportunities arise.
Currently there are no plans to progress this research in 2012.
2.8.5 Site Water Balance
A total of 758 ML of raw water was consumed at the CSA mine in 2011. This represents a reduction in
consumption of 15% from 2010 (895 ML) and 25% from 2009 (1,011 ML). The reduction from 2010 to 2011
was achieved with corresponding production rates (t milled) only decreasing by 2.7% bringing the rate of raw
water consumed per t of production down from 838 kl/t milled 2010 to 730 kl/t milled in 2011. The efficiency
gain in 2011 reflects the overall long term trend displayed Figure 6.
2 Doos, Stephanie (Oct 2011) A Geophysical and Hydrogeological Approach to Delineating the Great Chesney Fault, Cobar, NSW The
Australian National University
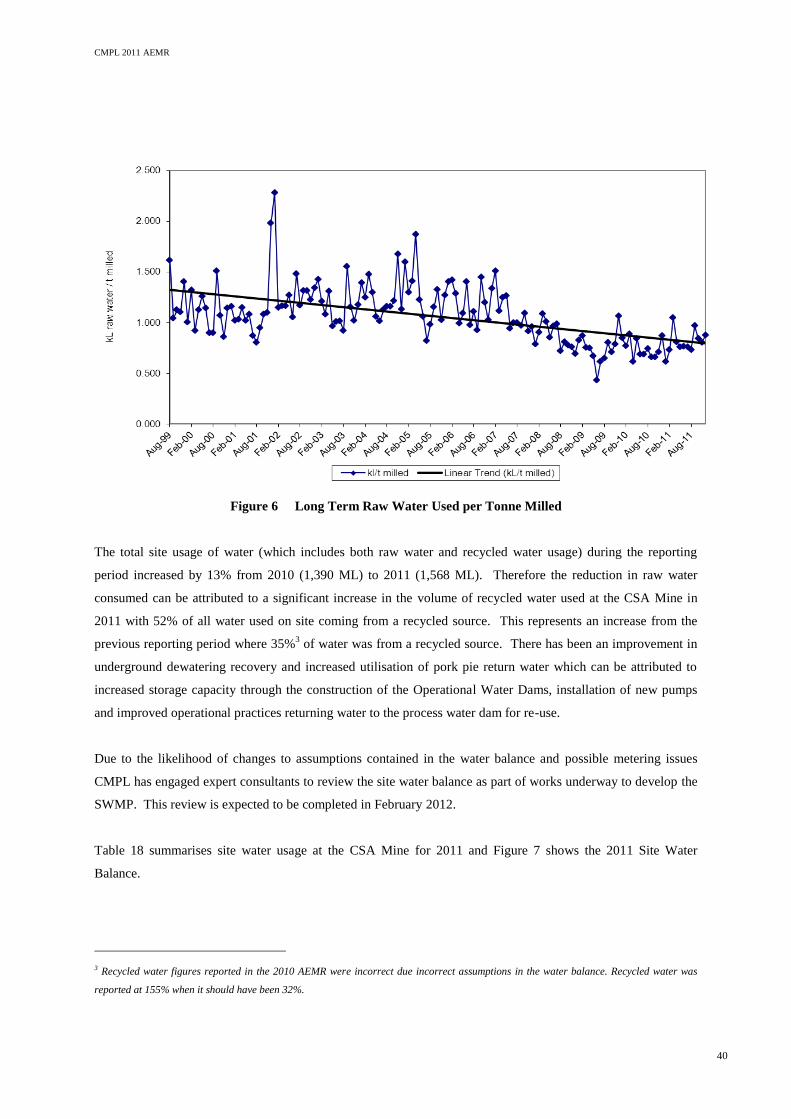
CMPL 2011 AEMR
40
Figure 6 Long Term Raw Water Used per Tonne Milled
The total site usage of water (which includes both raw water and recycled water usage) during the reporting
period increased by 13% from 2010 (1,390 ML) to 2011 (1,568 ML). Therefore the reduction in raw water
consumed can be attributed to a significant increase in the volume of recycled water used at the CSA Mine in
2011 with 52% of all water used on site coming from a recycled source. This represents an increase from the
previous reporting period where 35%3 of water was from a recycled source. There has been an improvement in
underground dewatering recovery and increased utilisation of pork pie return water which can be attributed to
increased storage capacity through the construction of the Operational Water Dams, installation of new pumps
and improved operational practices returning water to the process water dam for re-use.
Due to the likelihood of changes to assumptions contained in the water balance and possible metering issues
CMPL has engaged expert consultants to review the site water balance as part of works underway to develop the
SWMP. This review is expected to be completed in February 2012.
Table 18 summarises site water usage at the CSA Mine for 2011 and Figure 7 shows the 2011 Site Water
Balance.
3 Recycled water figures reported in the 2010 AEMR were incorrect due incorrect assumptions in the water balance. Recycled water was
reported at 155% when it should have been 32%.
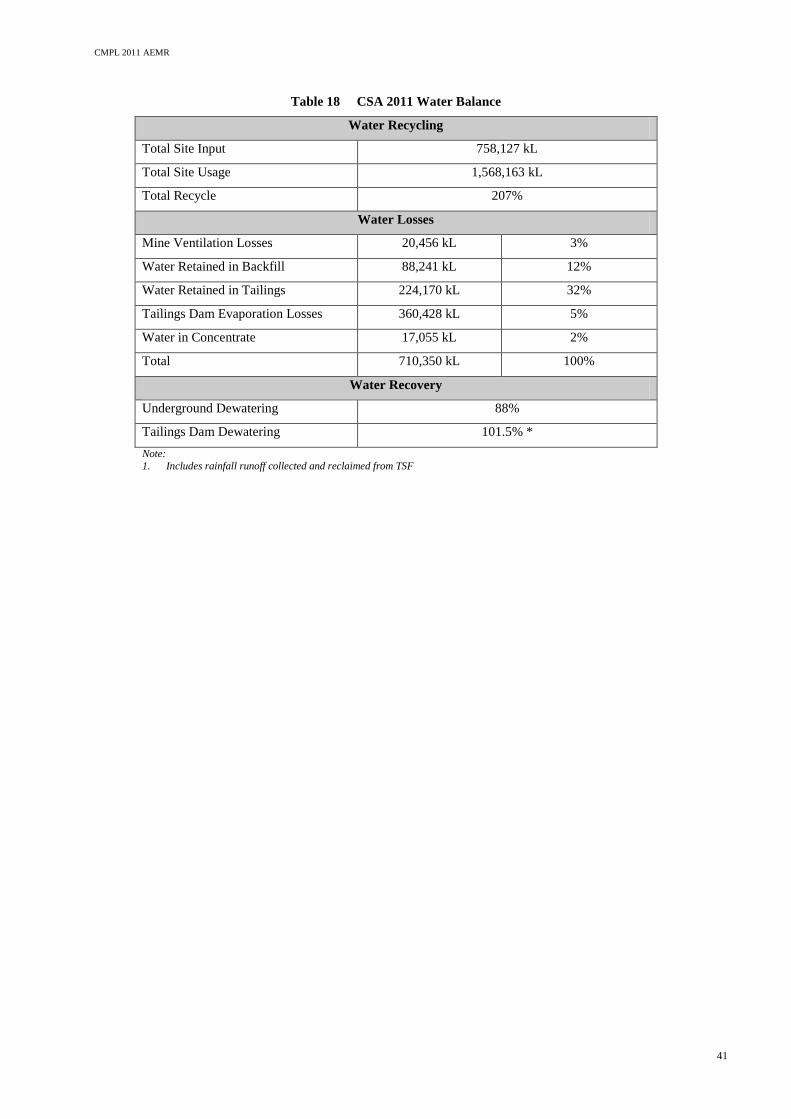
CMPL 2011 AEMR
41
Table 18 CSA 2011 Water Balance
Water Recycling
Total Site Input 758,127 kL
Total Site Usage 1,568,163 kL
Total Recycle 207%
Water Losses
Mine Ventilation Losses 20,456 kL 3%
Water Retained in Backfill 88,241 kL 12%
Water Retained in Tailings 224,170 kL 32%
Tailings Dam Evaporation Losses 360,428 kL 5%
Water in Concentrate 17,055 kL 2%
Total 710,350 kL 100%
Water Recovery
Underground Dewatering 88%
Tailings Dam Dewatering 101.5% *
Note:
1. Includes rainfall runoff collected and reclaimed from TSF
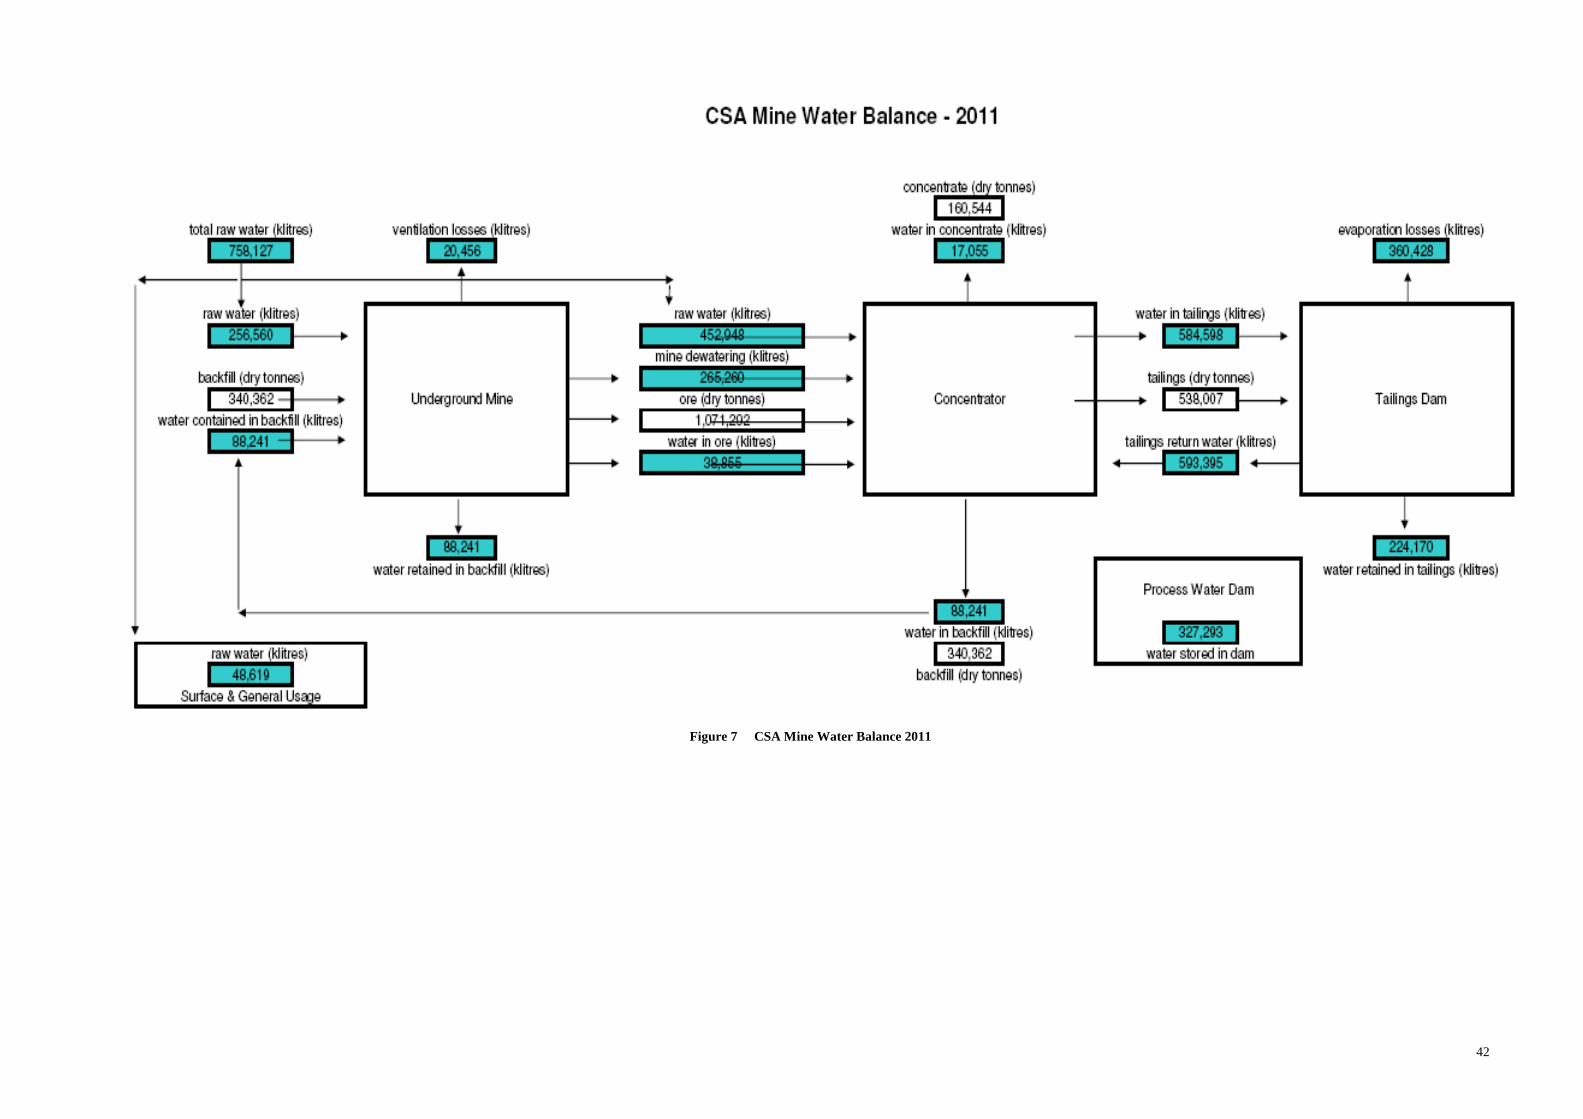
42
Figure 7 CSA Mine Water Balance 2011
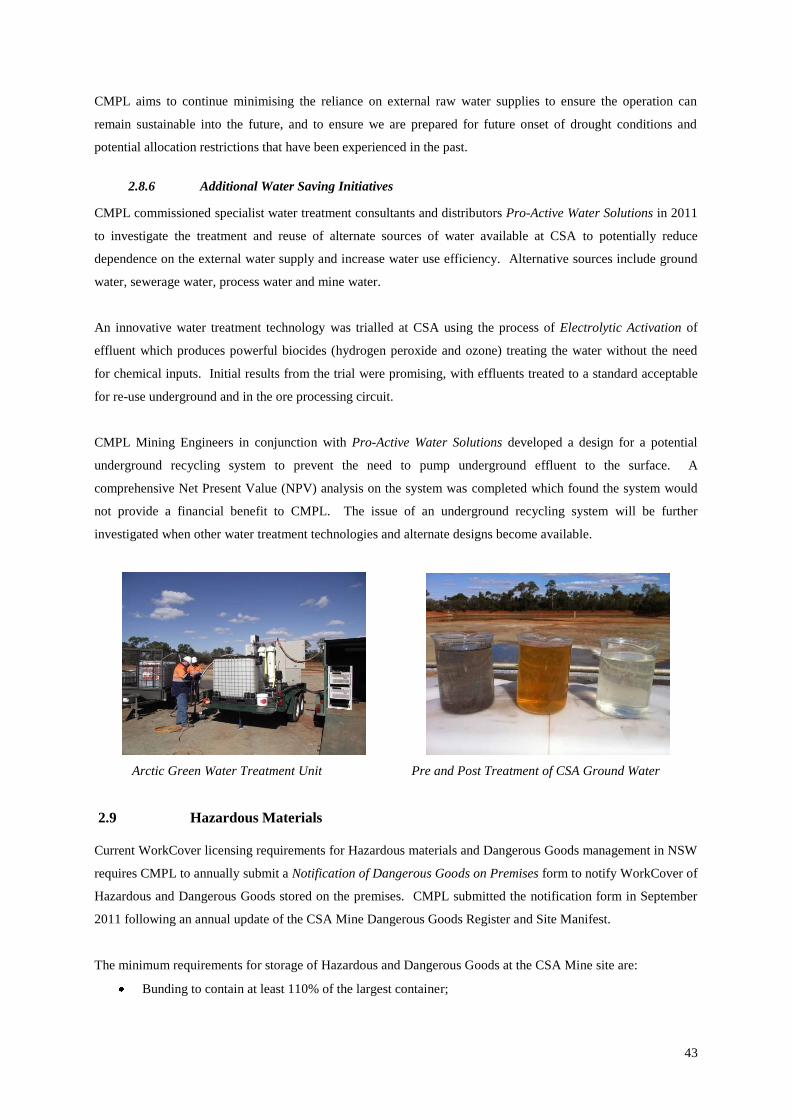
43
CMPL aims to continue minimising the reliance on external raw water supplies to ensure the operation can
remain sustainable into the future, and to ensure we are prepared for future onset of drought conditions and
potential allocation restrictions that have been experienced in the past.
2.8.6 Additional Water Saving Initiatives
CMPL commissioned specialist water treatment consultants and distributors Pro-Active Water Solutions in 2011
to investigate the treatment and reuse of alternate sources of water available at CSA to potentially reduce
dependence on the external water supply and increase water use efficiency. Alternative sources include ground
water, sewerage water, process water and mine water.
An innovative water treatment technology was trialled at CSA using the process of Electrolytic Activation of
effluent which produces powerful biocides (hydrogen peroxide and ozone) treating the water without the need
for chemical inputs. Initial results from the trial were promising, with effluents treated to a standard acceptable
for re-use underground and in the ore processing circuit.
CMPL Mining Engineers in conjunction with Pro-Active Water Solutions developed a design for a potential
underground recycling system to prevent the need to pump underground effluent to the surface. A
comprehensive Net Present Value (NPV) analysis on the system was completed which found the system would
not provide a financial benefit to CMPL. The issue of an underground recycling system will be further
investigated when other water treatment technologies and alternate designs become available.
Arctic Green Water Treatment Unit Pre and Post Treatment of CSA Ground Water
2.9 Hazardous Materials
Current WorkCover licensing requirements for Hazardous materials and Dangerous Goods management in NSW
requires CMPL to annually submit a Notification of Dangerous Goods on Premises form to notify WorkCover of
Hazardous and Dangerous Goods stored on the premises. CMPL submitted the notification form in September
2011 following an annual update of the CSA Mine Dangerous Goods Register and Site Manifest.
The minimum requirements for storage of Hazardous and Dangerous Goods at the CSA Mine site are:
Bunding to contain at least 110% of the largest container;
CMPL 2011 AEMR
44
The display of signs for each hazardous product stored within the facility illustrating the substance
name, dangerous goods class, packaging group and emergency response details;
The display of labels on all individual containers (product name, UN number, dangerous goods class
and packaging group);
Material Safety Data Sheets (MSDS) to be available within immediate storage area;
Effective measures to exclude rain and surface stormwater runoff from the storage area;
Spill containment kits and/or fire extinguisher within the vicinity of storage areas appropriate to the
volume of hazardous material stored; and,
Easy access for emergency response and spill clean-up kits.
Hydrocarbons are stored in underground workshops and fuelling facilities and in surface workshops, bulk diesel
self bunded tanks, and designated waste hydrocarbon collection areas. These areas and all other major
Hazardous and Dangerous Goods storage locations are detailed in Table 19.
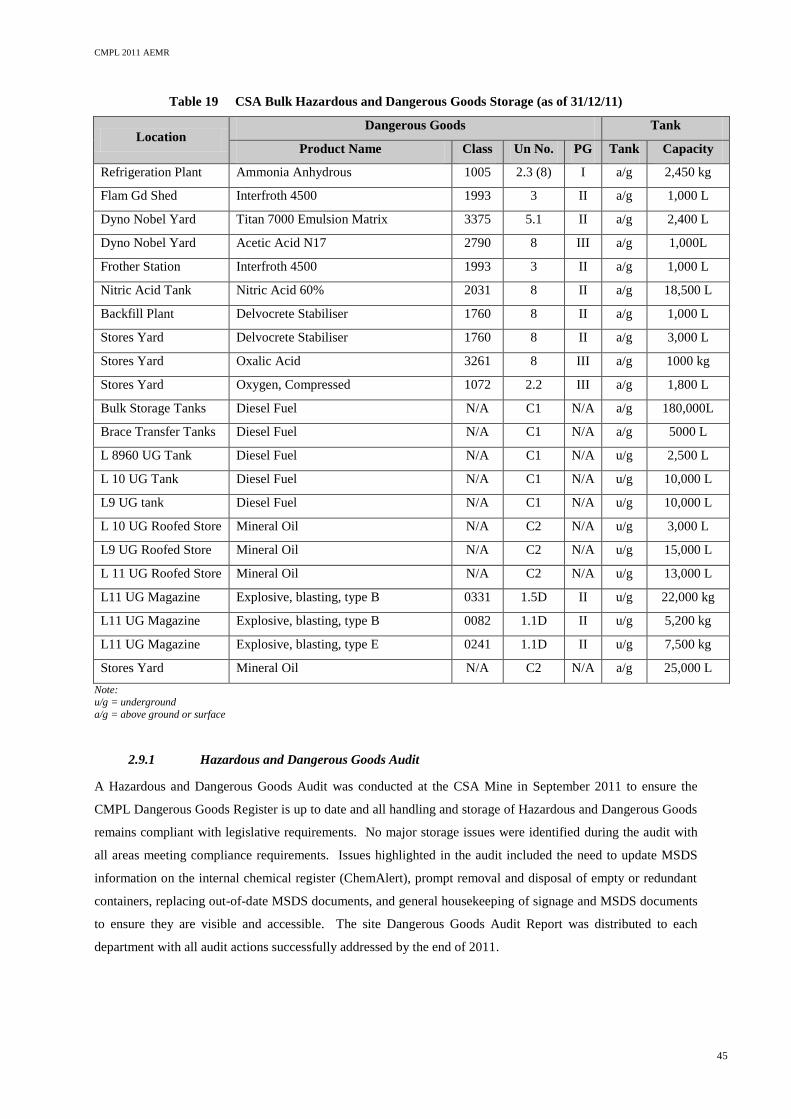
CMPL 2011 AEMR
45
Table 19 CSA Bulk Hazardous and Dangerous Goods Storage (as of 31/12/11)
Location Dangerous Goods Tank
Product Name Class Un No. PG Tank Capacity
Refrigeration Plant Ammonia Anhydrous 1005 2.3 (8) I a/g 2,450 kg
Flam Gd Shed Interfroth 4500 1993 3 II a/g 1,000 L
Dyno Nobel Yard Titan 7000 Emulsion Matrix 3375 5.1 II a/g 2,400 L
Dyno Nobel Yard Acetic Acid N17 2790 8 III a/g 1,000L
Frother Station Interfroth 4500 1993 3 II a/g 1,000 L
Nitric Acid Tank Nitric Acid 60% 2031 8 II a/g 18,500 L
Backfill Plant Delvocrete Stabiliser 1760 8 II a/g 1,000 L
Stores Yard Delvocrete Stabiliser 1760 8 II a/g 3,000 L
Stores Yard Oxalic Acid 3261 8 III a/g 1000 kg
Stores Yard Oxygen, Compressed 1072 2.2 III a/g 1,800 L
Bulk Storage Tanks Diesel Fuel N/A C1 N/A a/g 180,000L
Brace Transfer Tanks Diesel Fuel N/A C1 N/A a/g 5000 L
L 8960 UG Tank Diesel Fuel N/A C1 N/A u/g 2,500 L
L 10 UG Tank Diesel Fuel N/A C1 N/A u/g 10,000 L
L9 UG tank Diesel Fuel N/A C1 N/A u/g 10,000 L
L 10 UG Roofed Store Mineral Oil N/A C2 N/A u/g 3,000 L
L9 UG Roofed Store Mineral Oil N/A C2 N/A u/g 15,000 L
L 11 UG Roofed Store Mineral Oil N/A C2 N/A u/g 13,000 L
L11 UG Magazine Explosive, blasting, type B 0331 1.5D II u/g 22,000 kg
L11 UG Magazine Explosive, blasting, type B 0082 1.1D II u/g 5,200 kg
L11 UG Magazine Explosive, blasting, type E 0241 1.1D II u/g 7,500 kg
Stores Yard Mineral Oil N/A C2 N/A a/g 25,000 L
Note:
u/g = underground
a/g = above ground or surface
2.9.1 Hazardous and Dangerous Goods Audit
A Hazardous and Dangerous Goods Audit was conducted at the CSA Mine in September 2011 to ensure the
CMPL Dangerous Goods Register is up to date and all handling and storage of Hazardous and Dangerous Goods
remains compliant with legislative requirements. No major storage issues were identified during the audit with
all areas meeting compliance requirements. Issues highlighted in the audit included the need to update MSDS
information on the internal chemical register (ChemAlert), prompt removal and disposal of empty or redundant
containers, replacing out-of-date MSDS documents, and general housekeeping of signage and MSDS documents
to ensure they are visible and accessible. The site Dangerous Goods Audit Report was distributed to each
department with all audit actions successfully addressed by the end of 2011.
CMPL 2011 AEMR
46
2.9.2 Radiation
CMPL is licensed to sell/possess radiation apparatus and radioactive substances or items containing radioactive
substances. See Table 4 in Section 2.1 for licence details. A small amount of radioactive material is held on site
in “in-stream-analysis” probes and density level gauges. These are stored according to the recommended
procedures and locked away from general access. All qualified electrical personnel at CMPL are trained and
certified in Industrial Radiation Safety which allows the electrical team to work with radiation devices on site in
relation to safety and maintenance. A total of 23 redundant gauges were removed from site by licensed
contractor SN Technologies Pty Ltd in April 2011. Consent was granted by the Department of Environment,
Climate Change and Water (DECCW) at the time under clause 23 of the Radiation Control Regulation 2003 to
dispose of the radioactive substances.
The CSA Mine also participated in the state-wide Naturally Occurring Radioactive Materials (NORMs) test
program in May 2011, which was run by the Inspector of Mines (Mine Safety Operations) from the NSW
Department of Trade & Investment.
The program was developed to fulfil a gap in data from the NSW mining industry, due to no requirements to
address the matter of NORMs in the past as there was an exemption in some legislation. As part of the Council
of Australian Governments (COAG) agreement between Australian States, and significant work to standardise
many Occupational Health and Safety (OHS) matters across the country (e.g. National Mine Safety Framework),
NSW now needs to get up to speed on this matter.
One of the consequences of this is that all NSW mines, quarries or coal mines will need to do radiation testing,
which may lead to the requirement to develop Radiation Management Plans. As there are thousands of such
sites, this would clearly require a lot of work and expense of getting radiation expert reports and so on. In the
vast majority of cases, the reports are likely to come back with the findings that radiation doses are below any
trigger thresholds requiring significant action by the mines.
The Chief Inspector of Mines has therefore recognised that it would save the industry a lot of expense if the
Department completed a sample test program. The aim would then be to hopefully exempt mines or sectors of
the industry, based on the results of the test program.
The Commonwealth agency ARPANSA (Australian Radiation Protection and Nuclear Safety Authority) carried
out the sampling of the NSW mining industry throughout 2011. Field work for the Cobar area was carried out in
May 2011, with a one day site visit to the CSA Mine on 3 May 2011. Liquid and solid samples were collected
from mill feed, copper concentrate, tailings, process water, mine de-watering, and underground the exhaust
ventilation air sample.
The Department did some sampling at CSA Mine in 1995. Apparently the sampling was done on 6 Level and 9
Level West at that time. The same ARPANSA laboratory did the previous work. The results from this project
CMPL 2011 AEMR
47
are therefore being sourced to allow for comparison. ARPANSA intends to publish the work as a scientific
paper, using generic data which does not identify mines or companies.
2.9.3 Polychlorinated biphenyls (PCBs)
The last of the transformers testing positive for the presence of PCB levels above the allowable limit (as per tests
conducted in 2009) were removed from site during 2011. This work was completed by a licensed contractor,
with all oil removed from the units prior to relocating from the mine site. A further six alternator transformers
were also removed from site in September 2011 which were previously located at the surface Powerhouse. All
high voltage electricity transformers will continue to be PCB tested as part of routine oil testing process.
2.9.4 Asbestos
Due to the age of numerous structures on the CSA Mine site there are some materials containing asbestos
present. CMPL therefore has an obligation to ensure that such Asbestos Containing Materials (ACM) is
managed in accordance with legislative requirements to prevent health and environment related risks.
All ACM present at the CSA Mine is in a bonded form and includes concrete and fibro walls on the surface
industrial buildings, the majority of building roofs, and the majority of concrete pipes on site. ACM in a bonded
form does not present an immediate health risk, if it remains undisturbed and in good condition
The CSA Mine Asbestos Management Plan is maintained to assist CMPL workers to comply with asbestos
prohibitions and prevent exposure to airborne asbestos fibres. While the ultimate goal is for all work areas to be
free of ACM, it is generally impracticable, especially with the limited life of mine timeframe. Due consideration
is given to the removal of ACM during any refurbishment or maintenance where practicable, in preference to
other control measures such as enclosure, encapsulation or sealing.
CMPL conducts an inspection of each building and structure on surface at the CSA mine on an annual basis.
The CSA Mine Asbestos Register is maintained with regular updates of the results from these inspections. The
register contains details of the location, type and condition of any asbestos products found on site. Where no
asbestos is found, a record of such a finding is also kept. The Asbestos Register is available on the CMPL
intranet, and is made available for inspection by employees, contractors, maintenance personnel and government
representatives. All asbestos material and air samples are analysed by a National Association of Testing
Authorities (NATA) accredited laboratory with all results included in the appendix of the register.
The most recent Annual Asbestos Site Audit and Air Monitoring were carried out in all surface buildings that
contain asbestos material during September and October 2011. Results showed that all samples remain well
below exposure limits and indicate CSA workplaces remain safe from asbestos exposure. The annual
monitoring results were used to update the Site Asbestos Register in November 2011.
The long term outlook for bonded asbestos products on site is to monitor, maintain and replace as required.
There are no plans to replace any buildings at this stage. Any building modifications or repairs will see the
CMPL 2011 AEMR
48
removal of any associated asbestos material and replaced with new materials. This approach has seen a
progressive reduction of asbestos material on site since the program began in 2006.
2.10 Other Infrastructure Management
Additional activities undertaken by CMPL during the reporting period that did not require any changes to the
MOP include:
Backfill Plant Bunding Upgrade:
Ongoing backfill spill incidents during 2009, 2010 and early 2011 clearly identified the inadequacy of the
backfill bunds capacity to contain spillages generated at the backfill plant. Occasional releases of backfill
to the outside environment surrounding plant occurred causing an environmental hazard.
In 2010 a complete review of the current backfill system and bund infrastructure was undertaken. At the
backfill plant the bund volume was found to be 34 m3 and the mixing transfer tank, identified as the major
item holding slurry, had a capacity of 50 m3. Therefore the bunds capacity could only capture 68% of the
mixing tank material (when full) in the event of a spill. As such the bund was not compliant with AS4681
(The storage & handling of Class 9 miscellaneous dangerous goods and articles) which stipulates the bund
must have 110% capacity of the tank.
To rectify this issue a 22 m3 sump was installed and the bund was upgraded in November 2011 to increase
the overall capacity to 56 m3 or 112% of the mixing tank. A diagram of works completed is provided in
Figure 8. The backfill plant is now compliant and the likelihood of uncontrolled spills at the backfill plant
is now greatly reduced.
Spillages at the backfill plant have reduced dramatically from 7 reported in 2010 to 1 reported in 2011.
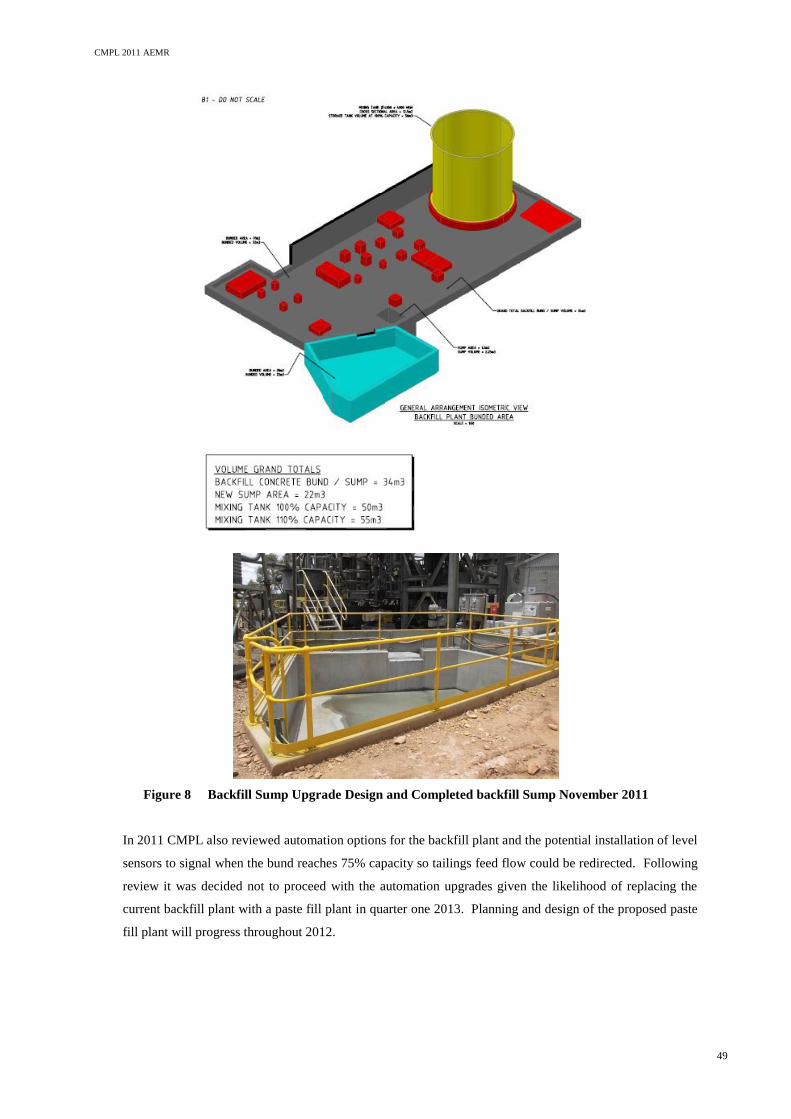
CMPL 2011 AEMR
49
Figure 8 Backfill Sump Upgrade Design and Completed backfill Sump November 2011
In 2011 CMPL also reviewed automation options for the backfill plant and the potential installation of level
sensors to signal when the bund reaches 75% capacity so tailings feed flow could be redirected. Following
review it was decided not to proceed with the automation upgrades given the likelihood of replacing the
current backfill plant with a paste fill plant in quarter one 2013. Planning and design of the proposed paste
fill plant will progress throughout 2012.
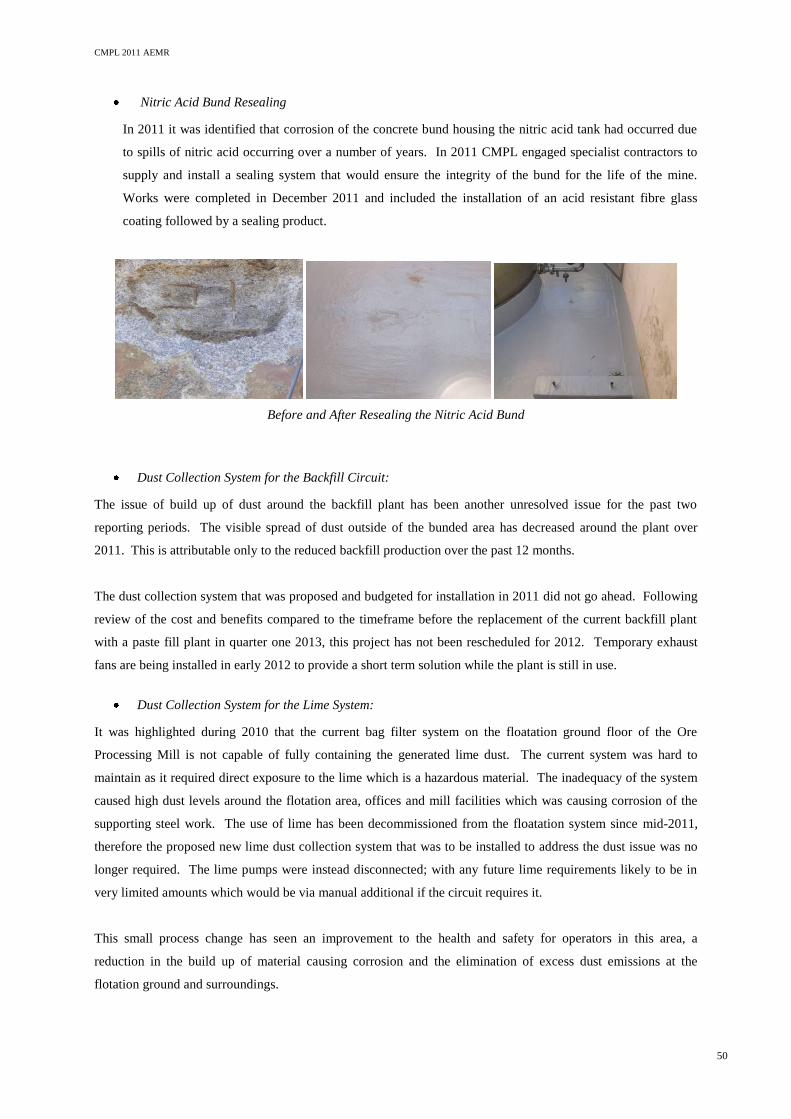
CMPL 2011 AEMR
50
Nitric Acid Bund Resealing
In 2011 it was identified that corrosion of the concrete bund housing the nitric acid tank had occurred due
to spills of nitric acid occurring over a number of years. In 2011 CMPL engaged specialist contractors to
supply and install a sealing system that would ensure the integrity of the bund for the life of the mine.
Works were completed in December 2011 and included the installation of an acid resistant fibre glass
coating followed by a sealing product.
Before and After Resealing the Nitric Acid Bund
Dust Collection System for the Backfill Circuit:
The issue of build up of dust around the backfill plant has been another unresolved issue for the past two
reporting periods. The visible spread of dust outside of the bunded area has decreased around the plant over
2011. This is attributable only to the reduced backfill production over the past 12 months.
The dust collection system that was proposed and budgeted for installation in 2011 did not go ahead. Following
review of the cost and benefits compared to the timeframe before the replacement of the current backfill plant
with a paste fill plant in quarter one 2013, this project has not been rescheduled for 2012. Temporary exhaust
fans are being installed in early 2012 to provide a short term solution while the plant is still in use.
Dust Collection System for the Lime System:
It was highlighted during 2010 that the current bag filter system on the floatation ground floor of the Ore
Processing Mill is not capable of fully containing the generated lime dust. The current system was hard to
maintain as it required direct exposure to the lime which is a hazardous material. The inadequacy of the system
caused high dust levels around the flotation area, offices and mill facilities which was causing corrosion of the
supporting steel work. The use of lime has been decommissioned from the floatation system since mid-2011,
therefore the proposed new lime dust collection system that was to be installed to address the dust issue was no
longer required. The lime pumps were instead disconnected; with any future lime requirements likely to be in
very limited amounts which would be via manual additional if the circuit requires it.
This small process change has seen an improvement to the health and safety for operators in this area, a
reduction in the build up of material causing corrosion and the elimination of excess dust emissions at the
flotation ground and surroundings.
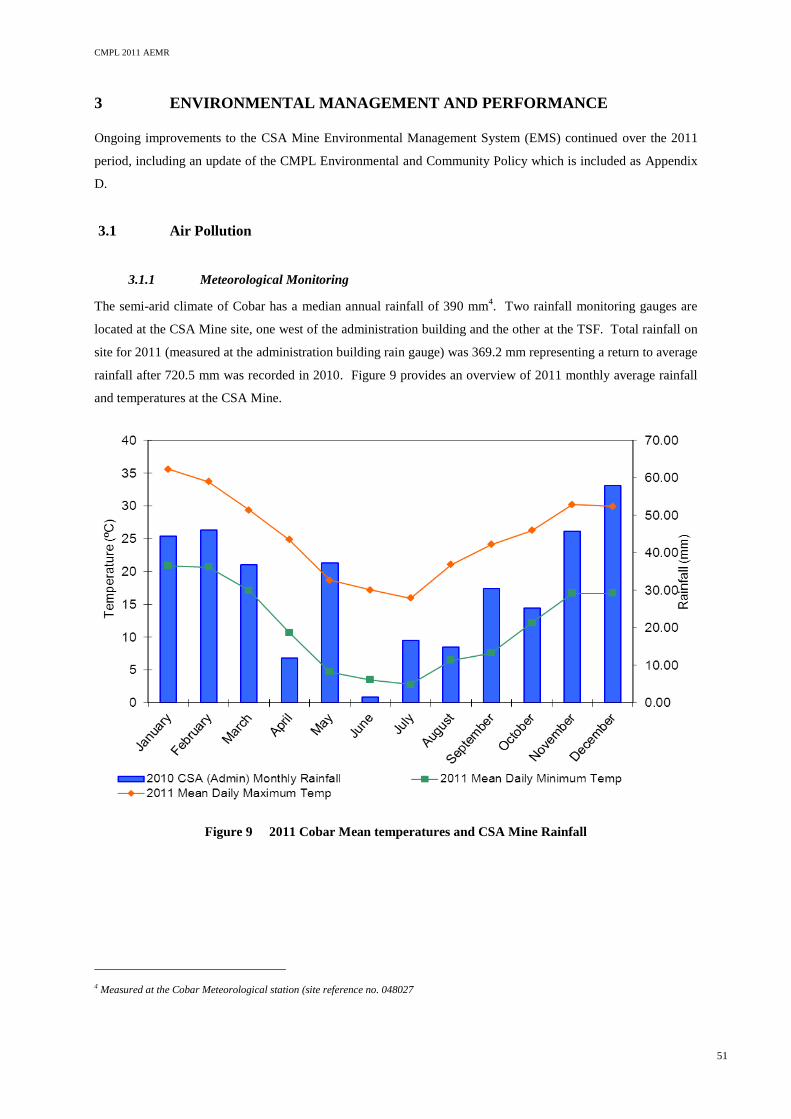
CMPL 2011 AEMR
51
3 ENVIRONMENTAL MANAGEMENT AND PERFORMANCE
Ongoing improvements to the CSA Mine Environmental Management System (EMS) continued over the 2011
period, including an update of the CMPL Environmental and Community Policy which is included as Appendix
D.
3.1 Air Pollution
3.1.1 Meteorological Monitoring
The semi-arid climate of Cobar has a median annual rainfall of 390 mm4. Two rainfall monitoring gauges are
located at the CSA Mine site, one west of the administration building and the other at the TSF. Total rainfall on
site for 2011 (measured at the administration building rain gauge) was 369.2 mm representing a return to average
rainfall after 720.5 mm was recorded in 2010. Figure 9 provides an overview of 2011 monthly average rainfall
and temperatures at the CSA Mine.
Figure 9 2011 Cobar Mean temperatures and CSA Mine Rainfall
4 Measured at the Cobar Meteorological station (site reference no. 048027
CMPL 2011 AEMR
52
3.1.2 Dust Emissions
Operations at the CSA Mine potentially contribute to air pollution through dust emissions generated from the
operation of equipment and other emissions generated from the usage of fuel and explosives.
The principal dust-generating activities associated with the CSA operation include:
Long term drought conditions resulting in minimal groundcover on the lease and surrounding district;
Operation of mobile machinery on unsealed roads and tracks;
Topsoil stripping and spreading;
Exposed stockpiles of waste rock, topsoil and/or additional materials;
Surface exploration drilling operations; and
Underground mine ventilation exhaust.
CMPL is committed to ensuring dust generation is minimised from all operations on site. Water sprays and
water trucks are utilised in the underground mine to supress dust in work areas and hence minimise dust emitted
to the air through the ventilation fans. The exception is after a blast when the ventilation system is designed to
clear the dust from the workings as quickly as possible to mitigate health risks to employees. The amount of
dust reaching the surface vents under these circumstances is limited and for short periods only.
All roads and tracks on the CSA Mine have a restricted speed limit imposed to reduce the amount of dust
generated by traffic. When unsealed roads are being used intensively, the roads are sprayed with a water cart to
suppress dust. Recycled water is used for dust suppression sourced from the Process Water Dam; its suitability
for use is determined using monthly water quality results.
Continuous improvements to minimise dust pollution are investigated and implemented at the CSA where
possible and monthly monitoring is undertaken to assist. A total of ten dust gauges are monitored on the mine
site. The locations of the CSA Mine dust monitors are listed below and also shown in Plan 2:
D1: north-east corner of the STSF;
D2: northern boundary of the NTSF;
D3: 100m north-east of concentrate storage and train loading station;
D4: west of the administration building (undisturbed control site);
D5: beside TSF access road before the booster hopper;
D6: southern corner of STSF Extension;
D7: opposite Railway Dam alongside the TSF access road;
D8: north-west corner of the NTSF (adjacent to the waste rock stockpile site);
D9: Decline access road; and
D10: North of the Backfill Plant.
Samples are collected monthly and are analysed by an external NATA accredited laboratory for determination of
dust composition and metals content. The results of dust deposition from the ten sample sites are summarised in
Figure 10.
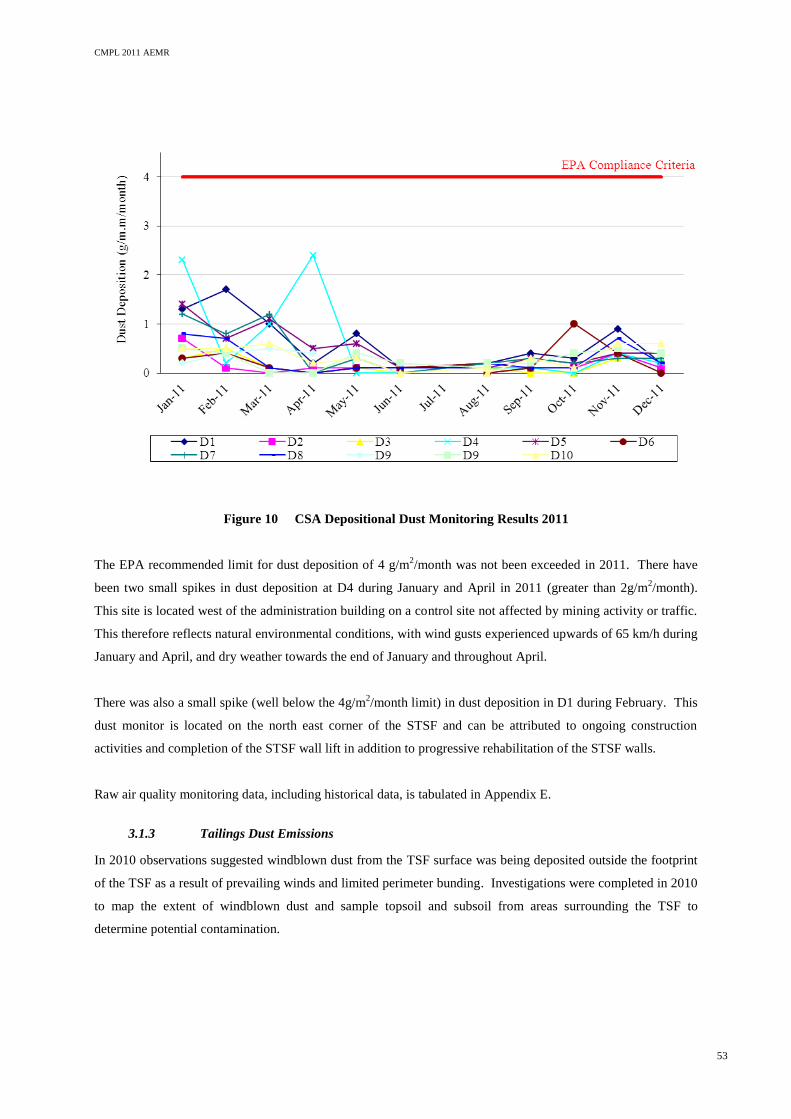
CMPL 2011 AEMR
53
Figure 10 CSA Depositional Dust Monitoring Results 2011
The EPA recommended limit for dust deposition of 4 g/m2/month was not been exceeded in 2011. There have
been two small spikes in dust deposition at D4 during January and April in 2011 (greater than 2g/m2/month).
This site is located west of the administration building on a control site not affected by mining activity or traffic.
This therefore reflects natural environmental conditions, with wind gusts experienced upwards of 65 km/h during
January and April, and dry weather towards the end of January and throughout April.
There was also a small spike (well below the 4g/m2/month limit) in dust deposition in D1 during February. This
dust monitor is located on the north east corner of the STSF and can be attributed to ongoing construction
activities and completion of the STSF wall lift in addition to progressive rehabilitation of the STSF walls.
Raw air quality monitoring data, including historical data, is tabulated in Appendix E.
3.1.3 Tailings Dust Emissions
In 2010 observations suggested windblown dust from the TSF surface was being deposited outside the footprint
of the TSF as a result of prevailing winds and limited perimeter bunding. Investigations were completed in 2010
to map the extent of windblown dust and sample topsoil and subsoil from areas surrounding the TSF to
determine potential contamination.
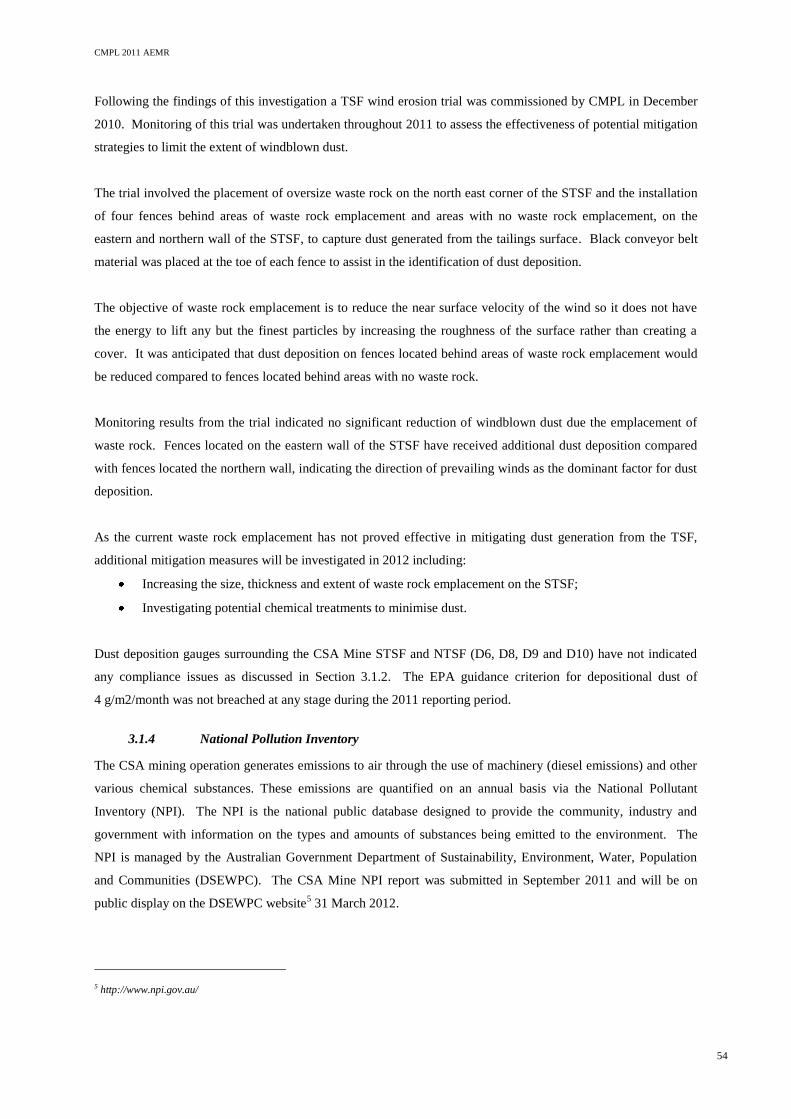
CMPL 2011 AEMR
54
Following the findings of this investigation a TSF wind erosion trial was commissioned by CMPL in December
2010. Monitoring of this trial was undertaken throughout 2011 to assess the effectiveness of potential mitigation
strategies to limit the extent of windblown dust.
The trial involved the placement of oversize waste rock on the north east corner of the STSF and the installation
of four fences behind areas of waste rock emplacement and areas with no waste rock emplacement, on the
eastern and northern wall of the STSF, to capture dust generated from the tailings surface. Black conveyor belt
material was placed at the toe of each fence to assist in the identification of dust deposition.
The objective of waste rock emplacement is to reduce the near surface velocity of the wind so it does not have
the energy to lift any but the finest particles by increasing the roughness of the surface rather than creating a
cover. It was anticipated that dust deposition on fences located behind areas of waste rock emplacement would
be reduced compared to fences located behind areas with no waste rock.
Monitoring results from the trial indicated no significant reduction of windblown dust due the emplacement of
waste rock. Fences located on the eastern wall of the STSF have received additional dust deposition compared
with fences located the northern wall, indicating the direction of prevailing winds as the dominant factor for dust
deposition.
As the current waste rock emplacement has not proved effective in mitigating dust generation from the TSF,
additional mitigation measures will be investigated in 2012 including:
Increasing the size, thickness and extent of waste rock emplacement on the STSF;
Investigating potential chemical treatments to minimise dust.
Dust deposition gauges surrounding the CSA Mine STSF and NTSF (D6, D8, D9 and D10) have not indicated
any compliance issues as discussed in Section 3.1.2. The EPA guidance criterion for depositional dust of
4 g/m2/month was not breached at any stage during the 2011 reporting period.
3.1.4 National Pollution Inventory
The CSA mining operation generates emissions to air through the use of machinery (diesel emissions) and other
various chemical substances. These emissions are quantified on an annual basis via the National Pollutant
Inventory (NPI). The NPI is the national public database designed to provide the community, industry and
government with information on the types and amounts of substances being emitted to the environment. The
NPI is managed by the Australian Government Department of Sustainability, Environment, Water, Population
and Communities (DSEWPC). The CSA Mine NPI report was submitted in September 2011 and will be on
public display on the DSEWPC website5 31 March 2012.
5 http://www.npi.gov.au/
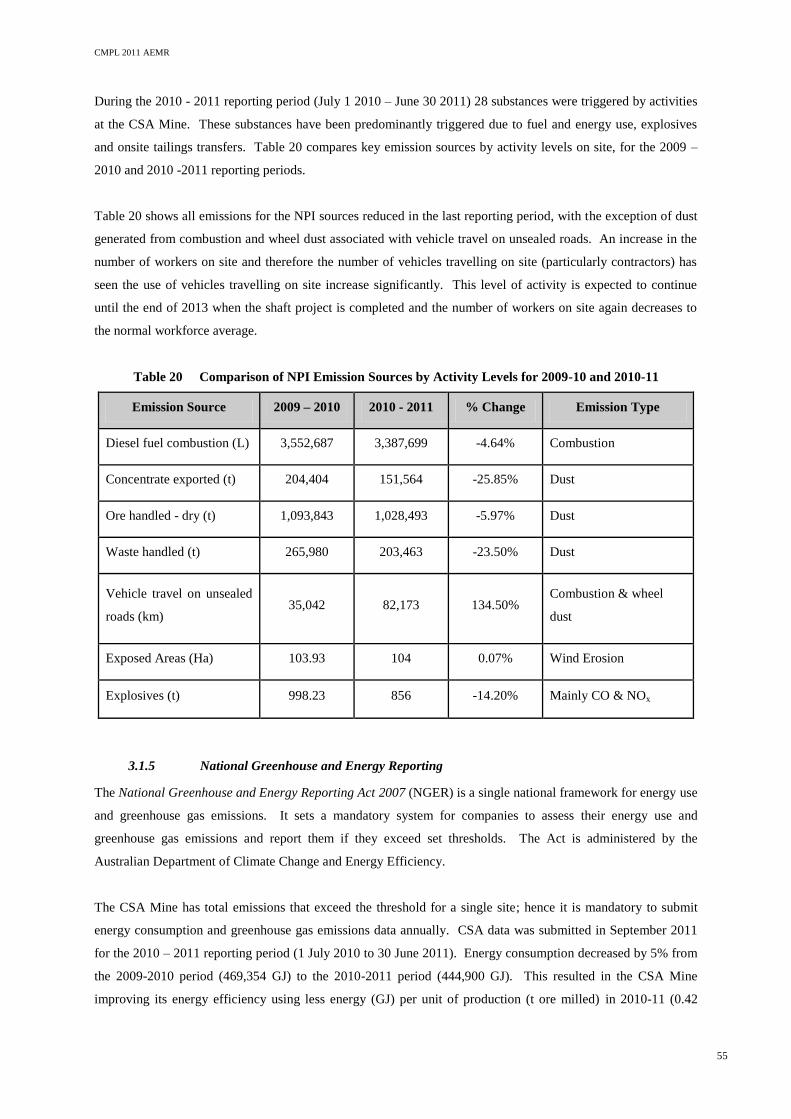
CMPL 2011 AEMR
55
During the 2010 - 2011 reporting period (July 1 2010 – June 30 2011) 28 substances were triggered by activities
at the CSA Mine. These substances have been predominantly triggered due to fuel and energy use, explosives
and onsite tailings transfers. Table 20 compares key emission sources by activity levels on site, for the 2009 –
2010 and 2010 -2011 reporting periods.
Table 20 shows all emissions for the NPI sources reduced in the last reporting period, with the exception of dust
generated from combustion and wheel dust associated with vehicle travel on unsealed roads. An increase in the
number of workers on site and therefore the number of vehicles travelling on site (particularly contractors) has
seen the use of vehicles travelling on site increase significantly. This level of activity is expected to continue
until the end of 2013 when the shaft project is completed and the number of workers on site again decreases to
the normal workforce average.
Table 20 Comparison of NPI Emission Sources by Activity Levels for 2009-10 and 2010-11
Emission Source 2009 – 2010 2010 - 2011 % Change Emission Type
Diesel fuel combustion (L) 3,552,687 3,387,699 -4.64% Combustion
Concentrate exported (t) 204,404 151,564 -25.85% Dust
Ore handled - dry (t) 1,093,843 1,028,493 -5.97% Dust
Waste handled (t) 265,980 203,463 -23.50% Dust
Vehicle travel on unsealed
roads (km) 35,042 82,173 134.50%
Combustion & wheel
dust
Exposed Areas (Ha) 103.93 104 0.07% Wind Erosion
Explosives (t) 998.23 856 -14.20% Mainly CO & NOx
3.1.5 National Greenhouse and Energy Reporting
The National Greenhouse and Energy Reporting Act 2007 (NGER) is a single national framework for energy use
and greenhouse gas emissions. It sets a mandatory system for companies to assess their energy use and
greenhouse gas emissions and report them if they exceed set thresholds. The Act is administered by the
Australian Department of Climate Change and Energy Efficiency.
The CSA Mine has total emissions that exceed the threshold for a single site; hence it is mandatory to submit
energy consumption and greenhouse gas emissions data annually. CSA data was submitted in September 2011
for the 2010 – 2011 reporting period (1 July 2010 to 30 June 2011). Energy consumption decreased by 5% from
the 2009-2010 period (469,354 GJ) to the 2010-2011 period (444,900 GJ). This resulted in the CSA Mine
improving its energy efficiency using less energy (GJ) per unit of production (t ore milled) in 2010-11 (0.42
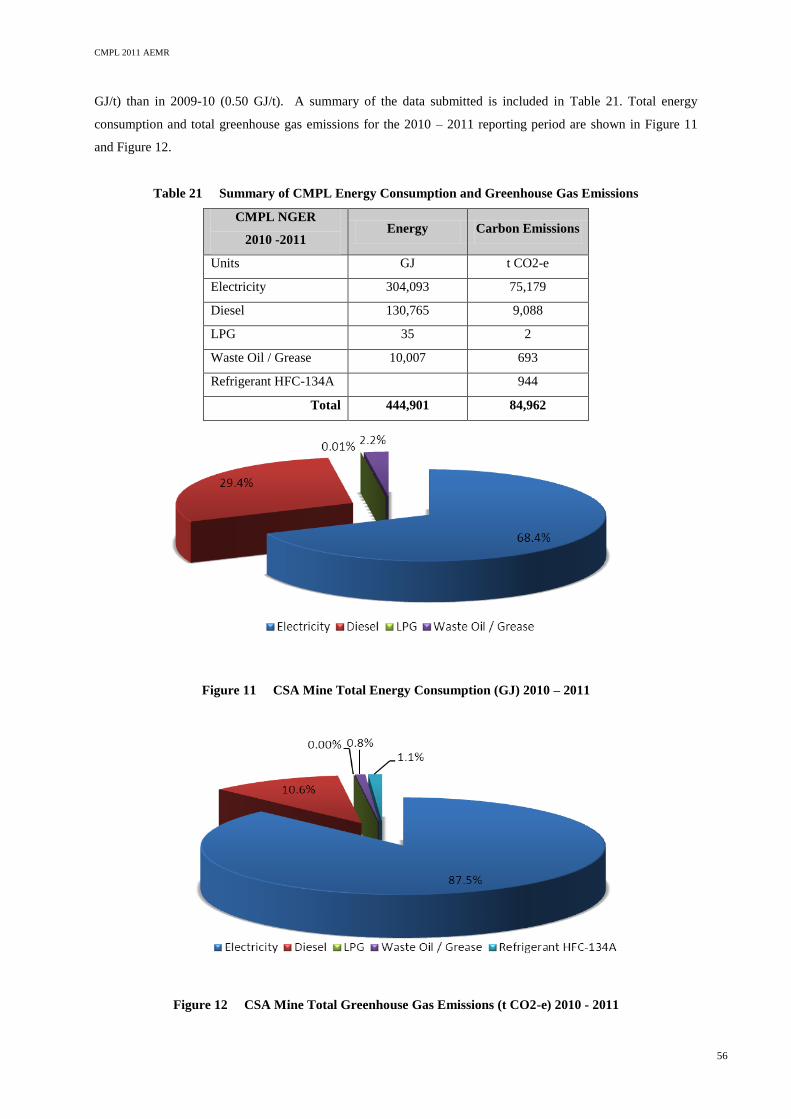
CMPL 2011 AEMR
56
GJ/t) than in 2009-10 (0.50 GJ/t). A summary of the data submitted is included in Table 21. Total energy
consumption and total greenhouse gas emissions for the 2010 – 2011 reporting period are shown in Figure 11
and Figure 12.
Table 21 Summary of CMPL Energy Consumption and Greenhouse Gas Emissions
CMPL NGER
2010 -2011 Energy Carbon Emissions
Units GJ t CO2-e
Electricity 304,093 75,179
Diesel 130,765 9,088
LPG 35 2
Waste Oil / Grease 10,007 693
Refrigerant HFC-134A 944
Total 444,901 84,962
Figure 11 CSA Mine Total Energy Consumption (GJ) 2010 – 2011
Figure 12 CSA Mine Total Greenhouse Gas Emissions (t CO2-e) 2010 - 2011
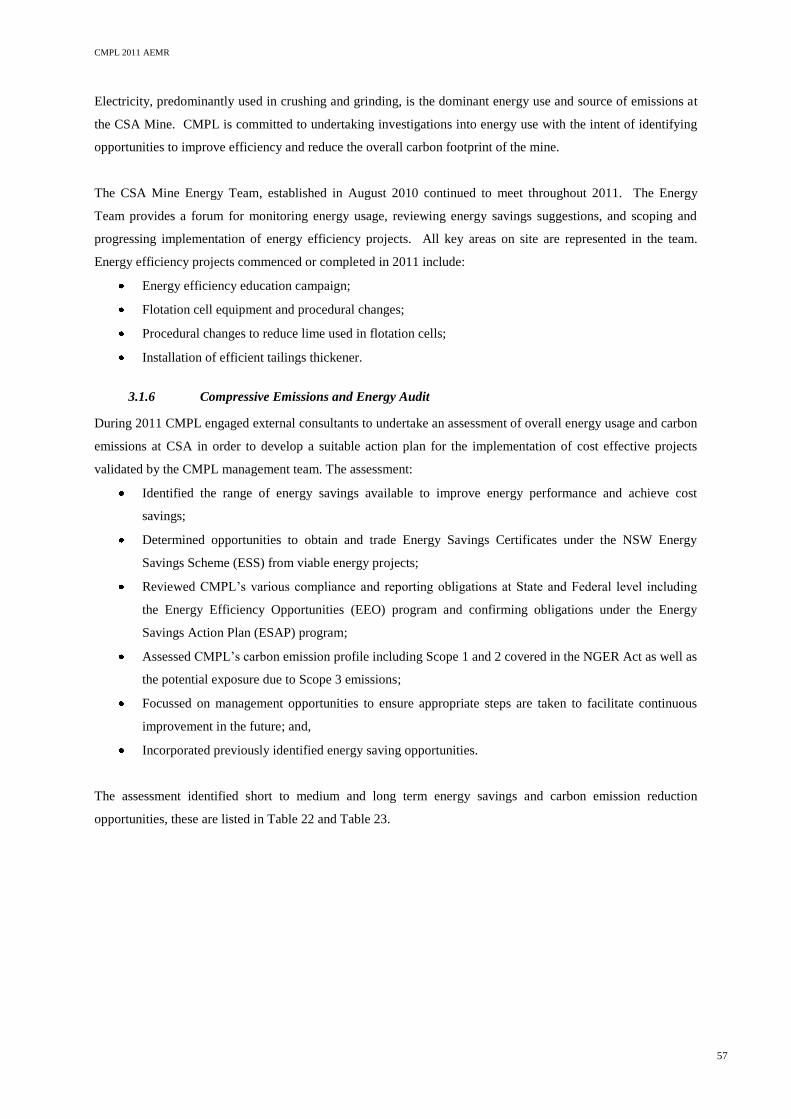
CMPL 2011 AEMR
57
Electricity, predominantly used in crushing and grinding, is the dominant energy use and source of emissions at
the CSA Mine. CMPL is committed to undertaking investigations into energy use with the intent of identifying
opportunities to improve efficiency and reduce the overall carbon footprint of the mine.
The CSA Mine Energy Team, established in August 2010 continued to meet throughout 2011. The Energy
Team provides a forum for monitoring energy usage, reviewing energy savings suggestions, and scoping and
progressing implementation of energy efficiency projects. All key areas on site are represented in the team.
Energy efficiency projects commenced or completed in 2011 include:
Energy efficiency education campaign;
Flotation cell equipment and procedural changes;
Procedural changes to reduce lime used in flotation cells;
Installation of efficient tailings thickener.
3.1.6 Compressive Emissions and Energy Audit
During 2011 CMPL engaged external consultants to undertake an assessment of overall energy usage and carbon
emissions at CSA in order to develop a suitable action plan for the implementation of cost effective projects
validated by the CMPL management team. The assessment:
Identified the range of energy savings available to improve energy performance and achieve cost
savings;
Determined opportunities to obtain and trade Energy Savings Certificates under the NSW Energy
Savings Scheme (ESS) from viable energy projects;
Reviewed CMPL’s various compliance and reporting obligations at State and Federal level including
the Energy Efficiency Opportunities (EEO) program and confirming obligations under the Energy
Savings Action Plan (ESAP) program;
Assessed CMPL’s carbon emission profile including Scope 1 and 2 covered in the NGER Act as well as
the potential exposure due to Scope 3 emissions;
Focussed on management opportunities to ensure appropriate steps are taken to facilitate continuous
improvement in the future; and,
Incorporated previously identified energy saving opportunities.
The assessment identified short to medium and long term energy savings and carbon emission reduction
opportunities, these are listed in Table 22 and Table 23.
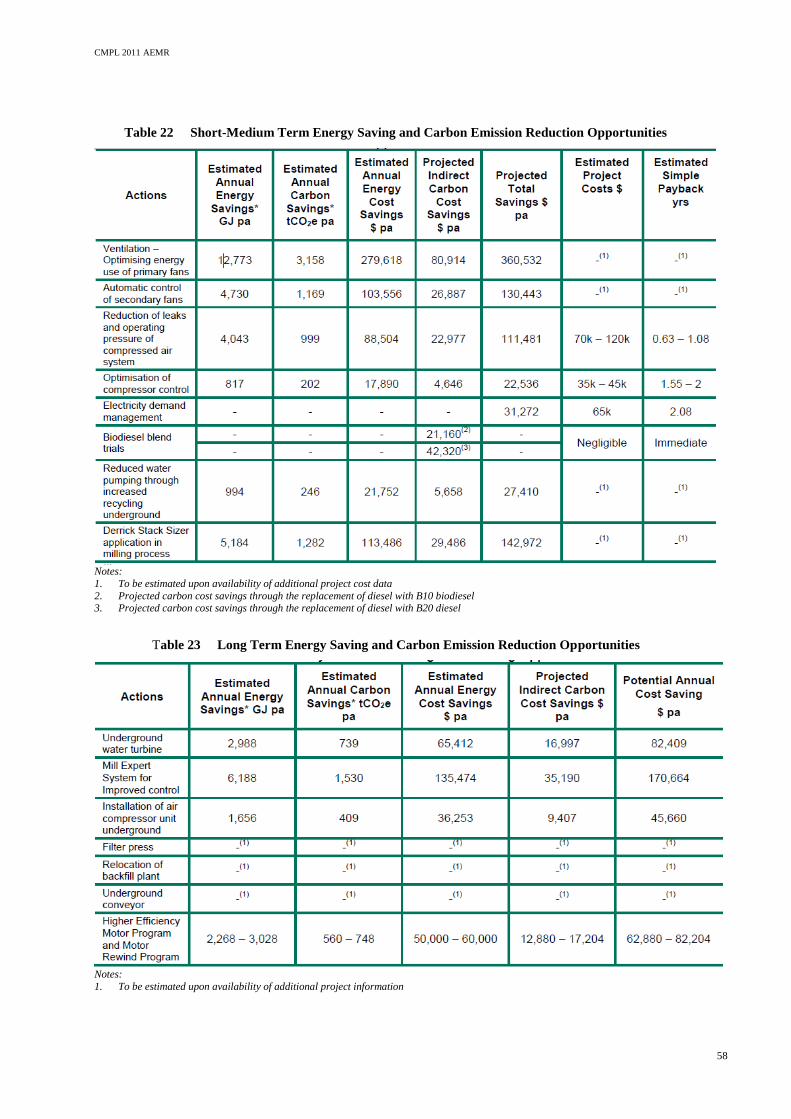
CMPL 2011 AEMR
58
Table 22 Short-Medium Term Energy Saving and Carbon Emission Reduction Opportunities
Notes:
1. To be estimated upon availability of additional project cost data
2. Projected carbon cost savings through the replacement of diesel with B10 biodiesel 3. Projected carbon cost savings through the replacement of diesel with B20 diesel
Table 23 Long Term Energy Saving and Carbon Emission Reduction Opportunities
Notes:
1. To be estimated upon availability of additional project information
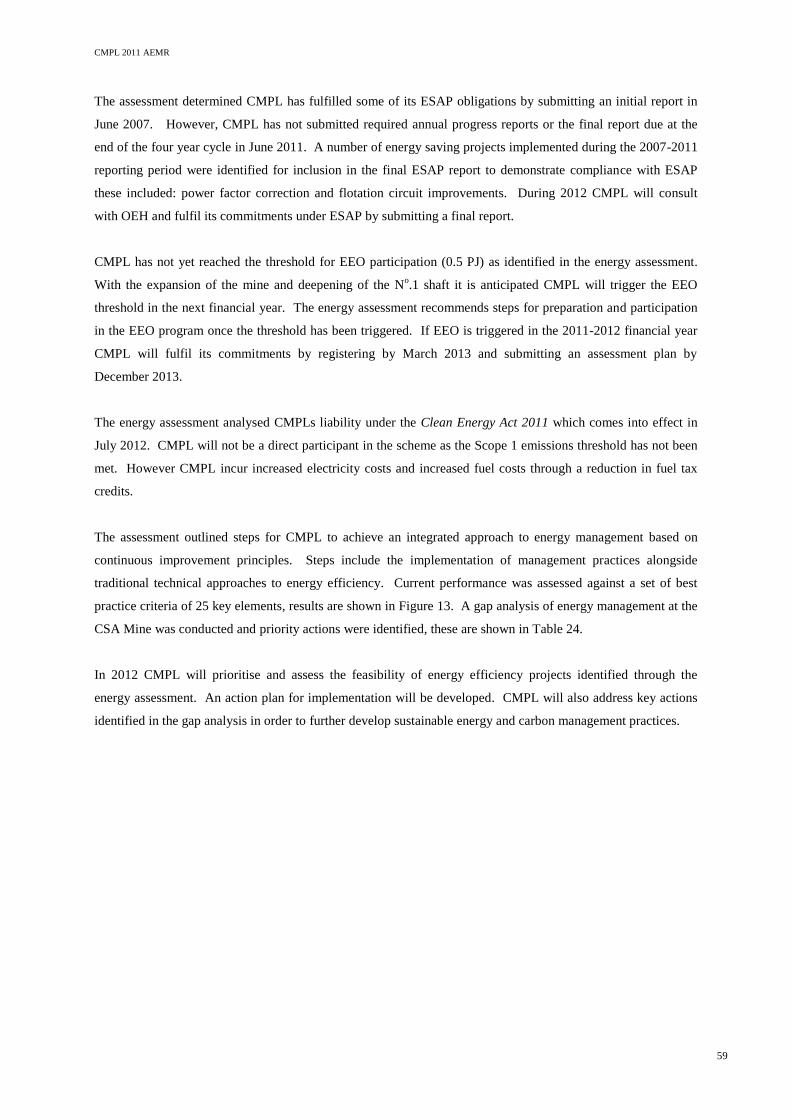
CMPL 2011 AEMR
59
The assessment determined CMPL has fulfilled some of its ESAP obligations by submitting an initial report in
June 2007. However, CMPL has not submitted required annual progress reports or the final report due at the
end of the four year cycle in June 2011. A number of energy saving projects implemented during the 2007-2011
reporting period were identified for inclusion in the final ESAP report to demonstrate compliance with ESAP
these included: power factor correction and flotation circuit improvements. During 2012 CMPL will consult
with OEH and fulfil its commitments under ESAP by submitting a final report.
CMPL has not yet reached the threshold for EEO participation (0.5 PJ) as identified in the energy assessment.
With the expansion of the mine and deepening of the No.1 shaft it is anticipated CMPL will trigger the EEO
threshold in the next financial year. The energy assessment recommends steps for preparation and participation
in the EEO program once the threshold has been triggered. If EEO is triggered in the 2011-2012 financial year
CMPL will fulfil its commitments by registering by March 2013 and submitting an assessment plan by
December 2013.
The energy assessment analysed CMPLs liability under the Clean Energy Act 2011 which comes into effect in
July 2012. CMPL will not be a direct participant in the scheme as the Scope 1 emissions threshold has not been
met. However CMPL incur increased electricity costs and increased fuel costs through a reduction in fuel tax
credits.
The assessment outlined steps for CMPL to achieve an integrated approach to energy management based on
continuous improvement principles. Steps include the implementation of management practices alongside
traditional technical approaches to energy efficiency. Current performance was assessed against a set of best
practice criteria of 25 key elements, results are shown in Figure 13. A gap analysis of energy management at the
CSA Mine was conducted and priority actions were identified, these are shown in Table 24.
In 2012 CMPL will prioritise and assess the feasibility of energy efficiency projects identified through the
energy assessment. An action plan for implementation will be developed. CMPL will also address key actions
identified in the gap analysis in order to further develop sustainable energy and carbon management practices.
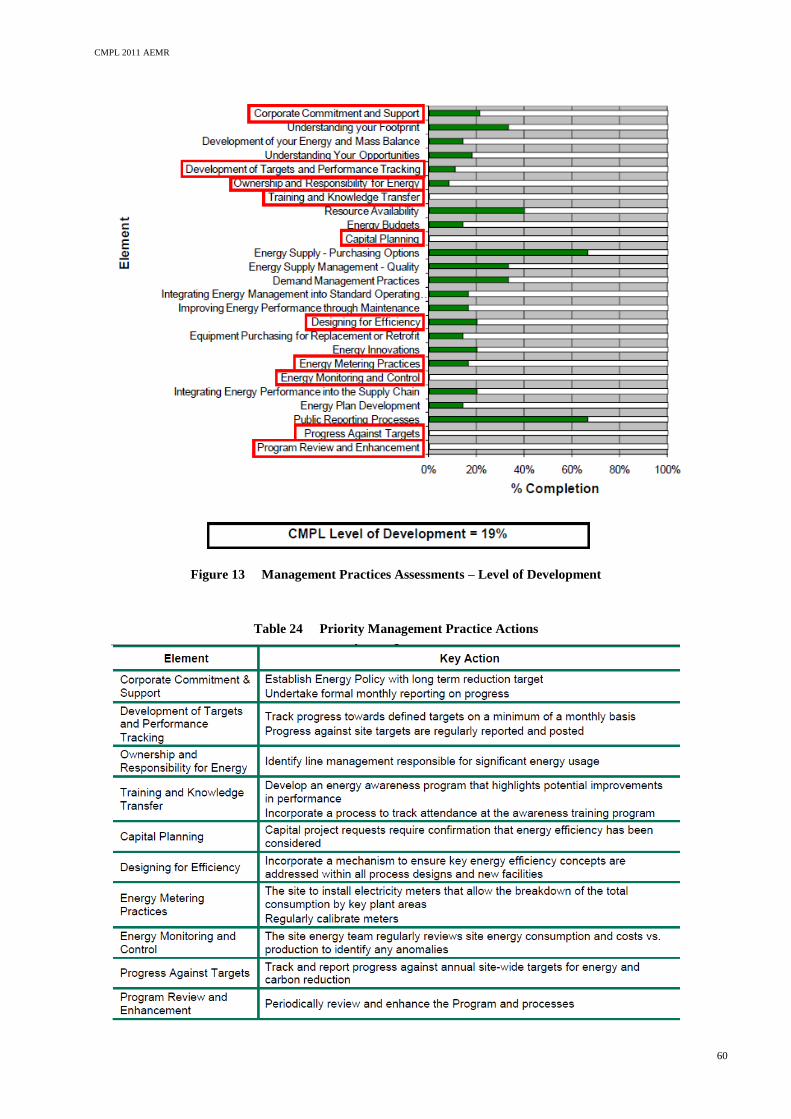
CMPL 2011 AEMR
60
Figure 13 Management Practices Assessments – Level of Development
Table 24 Priority Management Practice Actions
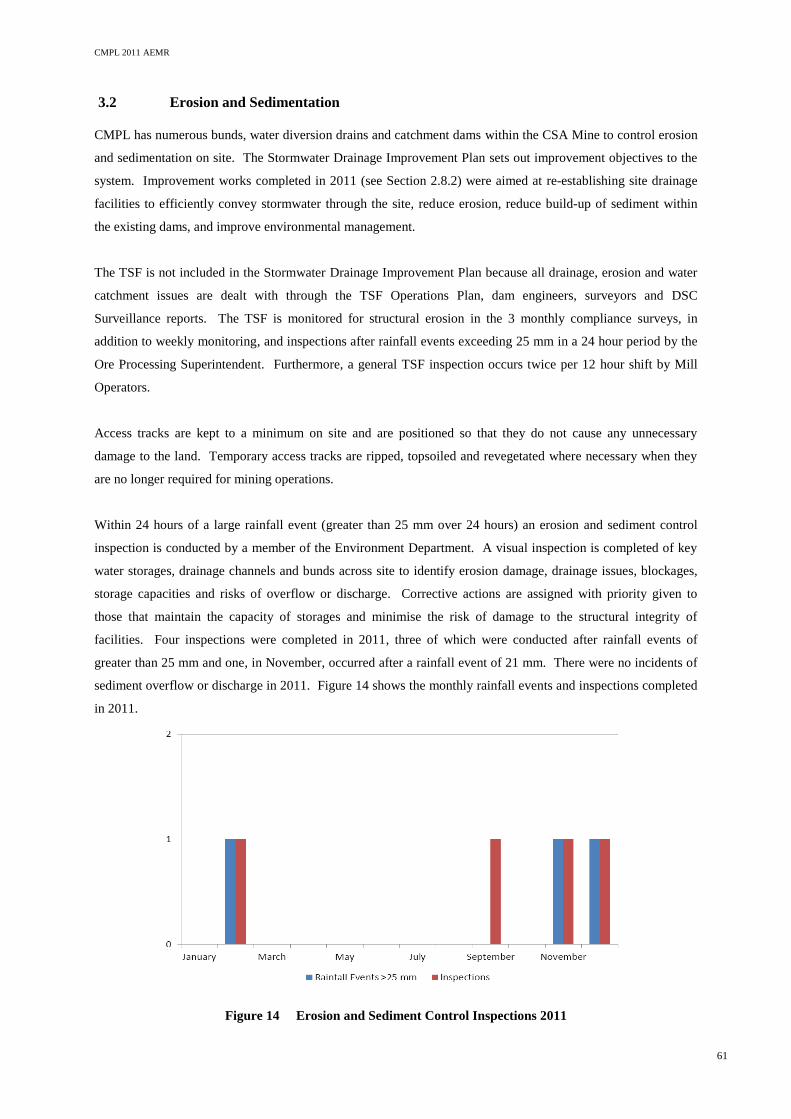
CMPL 2011 AEMR
61
3.2 Erosion and Sedimentation
CMPL has numerous bunds, water diversion drains and catchment dams within the CSA Mine to control erosion
and sedimentation on site. The Stormwater Drainage Improvement Plan sets out improvement objectives to the
system. Improvement works completed in 2011 (see Section 2.8.2) were aimed at re-establishing site drainage
facilities to efficiently convey stormwater through the site, reduce erosion, reduce build-up of sediment within
the existing dams, and improve environmental management.
The TSF is not included in the Stormwater Drainage Improvement Plan because all drainage, erosion and water
catchment issues are dealt with through the TSF Operations Plan, dam engineers, surveyors and DSC
Surveillance reports. The TSF is monitored for structural erosion in the 3 monthly compliance surveys, in
addition to weekly monitoring, and inspections after rainfall events exceeding 25 mm in a 24 hour period by the
Ore Processing Superintendent. Furthermore, a general TSF inspection occurs twice per 12 hour shift by Mill
Operators.
Access tracks are kept to a minimum on site and are positioned so that they do not cause any unnecessary
damage to the land. Temporary access tracks are ripped, topsoiled and revegetated where necessary when they
are no longer required for mining operations.
Within 24 hours of a large rainfall event (greater than 25 mm over 24 hours) an erosion and sediment control
inspection is conducted by a member of the Environment Department. A visual inspection is completed of key
water storages, drainage channels and bunds across site to identify erosion damage, drainage issues, blockages,
storage capacities and risks of overflow or discharge. Corrective actions are assigned with priority given to
those that maintain the capacity of storages and minimise the risk of damage to the structural integrity of
facilities. Four inspections were completed in 2011, three of which were conducted after rainfall events of
greater than 25 mm and one, in November, occurred after a rainfall event of 21 mm. There were no incidents of
sediment overflow or discharge in 2011. Figure 14 shows the monthly rainfall events and inspections completed
in 2011.
Figure 14 Erosion and Sediment Control Inspections 2011
CMPL 2011 AEMR
62
3.3 Surface Water Quality
Surface water quality samples are collected monthly from active water storage structures around the site (Plan 2).
Many parts of the site and associated dams only become wet immediately after large rainfall events therefore the
number of water quality samples for each catchment varies. All samples are tested for pH and electrical
conductivity in the on-site laboratory before sending off site to a NATA approved laboratory for determination
of Cu, iron, lead, zinc, and sulphate concentrations. Water quality is compared to the Australian and New
Zealand Conservation Council (ANZECC) guidelines for irrigation and general use water. Stock is not
permitted on the mine site, and the only use for these catchment dams is currently either reclaim back to the plant
for use as process water, or simple evaporation, hence the comparison with general use water guidelines. In the
absence of ANZECC general water use guidelines, ANZECC stock water guidelines have been used.
The locations of surface water quality monitoring sites are shown in Plan 2. The surface water quality results for
2010 and 2011 are summarised in Table 25. Raw data is included in Appendix E.
Sampling sites S1, S10, S13 and S9 surround the base of the catchments associated with the excised old
Subsidence Area and the old Smelter Area. Therefore these locations often show signs of contamination.
Samples collected from site S2 are taken directly from the Raw Water Tank. This is CMPL’s incoming external
water supply from the Cobar Water Board, and therefore provides a comparative analysis for surface water
catchment samples collected from other dams around the mine site. Any exceedances detected in these S2
samples are therefore assumed to be the naturally occurring levels in the uncontaminated water supply.
Sample site S4, the Borrow Pit Dam, generally receives clean rainfall runoff, but can also receive surface runoff
from the mine site in cases of overflows and spills. It is therefore expected to show levels indicative of
contaminated water. Pork Pie dam (S14) is the process water dam and receives the water from Borrow Pit and
the new operational water dam, thus is likely to show similar water quality characteristics.
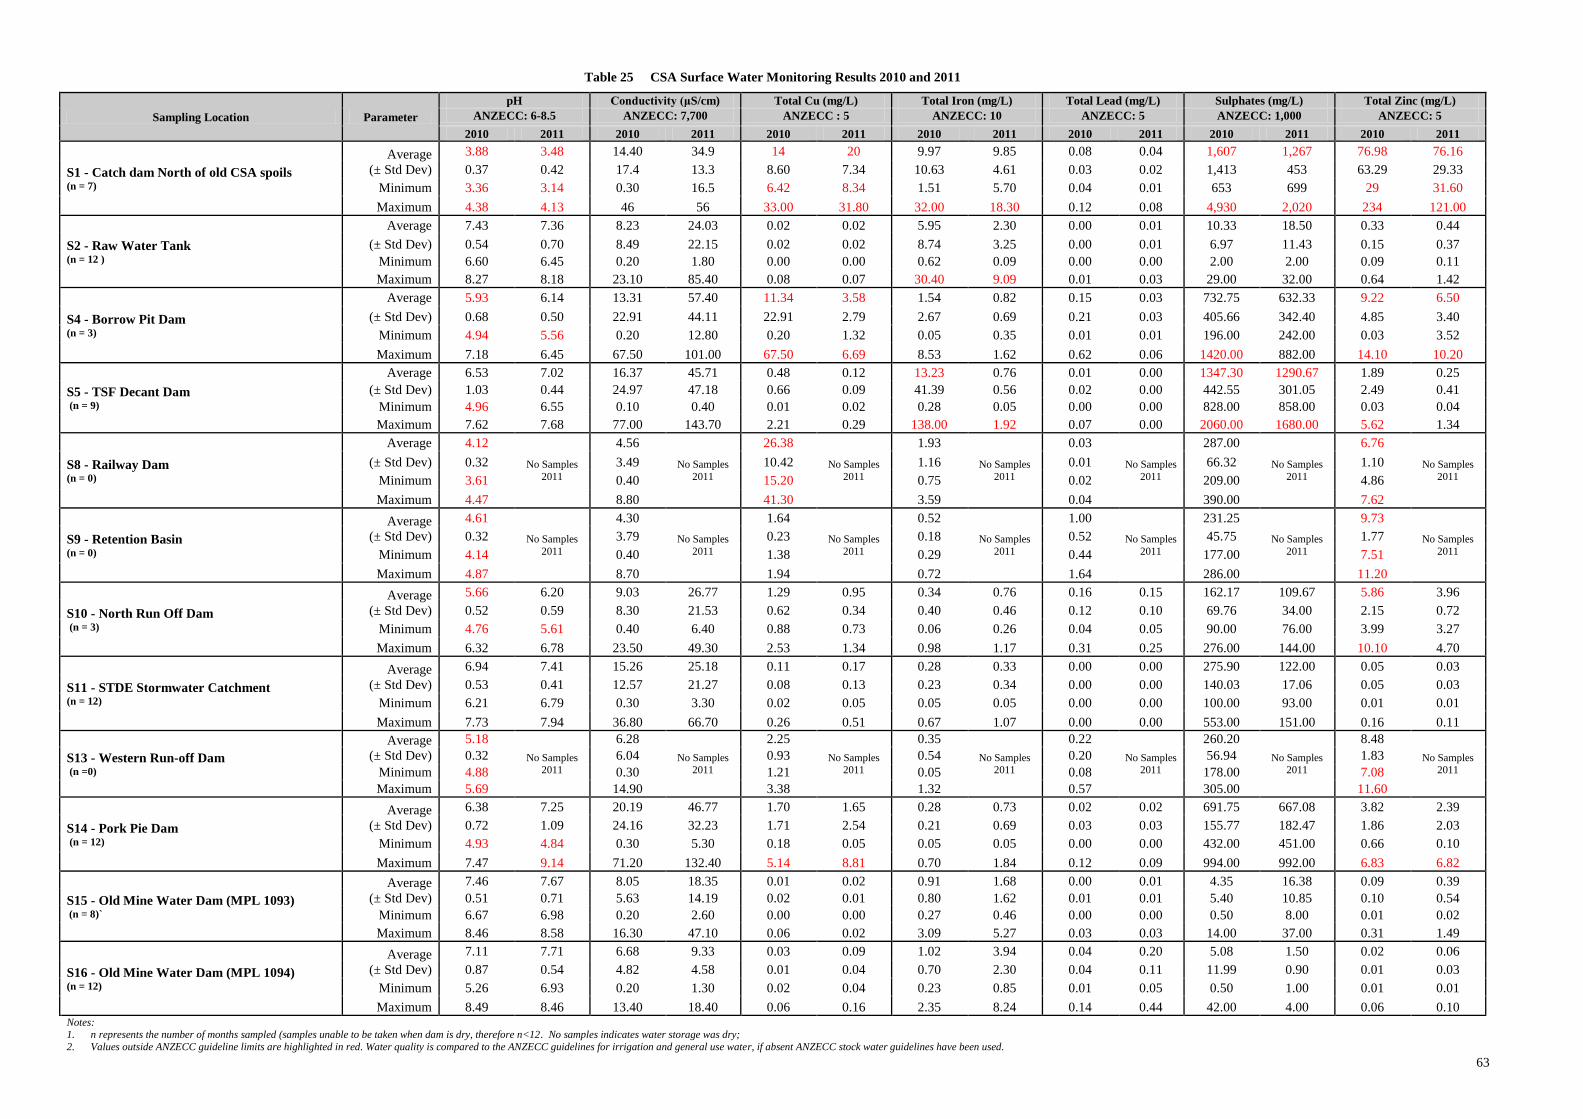
63
Table 25 CSA Surface Water Monitoring Results 2010 and 2011
Sampling Location Parameter
pH Conductivity (μS/cm) Total Cu (mg/L) Total Iron (mg/L) Total Lead (mg/L) Sulphates (mg/L) Total Zinc (mg/L)
ANZECC: 6-8.5 ANZECC: 7,700 ANZECC : 5 ANZECC: 10 ANZECC: 5 ANZECC: 1,000 ANZECC: 5
2010 2011 2010 2011 2010 2011 2010 2011 2010 2011 2010 2011 2010 2011
S1 - Catch dam North of old CSA spoils
(n = 7)
Average
(± Std Dev)
3.88 3.48 14.40 34.9 14 20 9.97 9.85 0.08 0.04 1,607 1,267 76.98 76.16
0.37 0.42 17.4 13.3 8.60 7.34 10.63 4.61 0.03 0.02 1,413 453 63.29 29.33
Minimum 3.36 3.14 0.30 16.5 6.42 8.34 1.51 5.70 0.04 0.01 653 699 29 31.60
Maximum 4.38 4.13 46 56 33.00 31.80 32.00 18.30 0.12 0.08 4,930 2,020 234 121.00
S2 - Raw Water Tank (n = 12 )
Average 7.43 7.36 8.23 24.03 0.02 0.02 5.95 2.30 0.00 0.01 10.33 18.50 0.33 0.44
(± Std Dev) 0.54 0.70 8.49 22.15 0.02 0.02 8.74 3.25 0.00 0.01 6.97 11.43 0.15 0.37
Minimum 6.60 6.45 0.20 1.80 0.00 0.00 0.62 0.09 0.00 0.00 2.00 2.00 0.09 0.11
Maximum 8.27 8.18 23.10 85.40 0.08 0.07 30.40 9.09 0.01 0.03 29.00 32.00 0.64 1.42
S4 - Borrow Pit Dam (n = 3)
Average 5.93 6.14 13.31 57.40 11.34 3.58 1.54 0.82 0.15 0.03 732.75 632.33 9.22 6.50
(± Std Dev) 0.68 0.50 22.91 44.11 22.91 2.79 2.67 0.69 0.21 0.03 405.66 342.40 4.85 3.40
Minimum 4.94 5.56 0.20 12.80 0.20 1.32 0.05 0.35 0.01 0.01 196.00 242.00 0.03 3.52
Maximum 7.18 6.45 67.50 101.00 67.50 6.69 8.53 1.62 0.62 0.06 1420.00 882.00 14.10 10.20
S5 - TSF Decant Dam (n = 9)
Average 6.53 7.02 16.37 45.71 0.48 0.12 13.23 0.76 0.01 0.00 1347.30 1290.67 1.89 0.25
(± Std Dev) 1.03 0.44 24.97 47.18 0.66 0.09 41.39 0.56 0.02 0.00 442.55 301.05 2.49 0.41
Minimum 4.96 6.55 0.10 0.40 0.01 0.02 0.28 0.05 0.00 0.00 828.00 858.00 0.03 0.04
Maximum 7.62 7.68 77.00 143.70 2.21 0.29 138.00 1.92 0.07 0.00 2060.00 1680.00 5.62 1.34
S8 - Railway Dam (n = 0)
Average 4.12
No Samples
2011
4.56
No Samples
2011
26.38
No Samples
2011
1.93
No Samples
2011
0.03
No Samples
2011
287.00
No Samples
2011
6.76
No Samples
2011
(± Std Dev) 0.32 3.49 10.42 1.16 0.01 66.32 1.10
Minimum 3.61 0.40 15.20 0.75 0.02 209.00 4.86
Maximum 4.47 8.80 41.30 3.59 0.04 390.00 7.62
S9 - Retention Basin (n = 0)
Average
(± Std Dev)
4.61
No Samples
2011
4.30
No Samples
2011
1.64
No Samples
2011
0.52
No Samples
2011
1.00
No Samples
2011
231.25
No Samples
2011
9.73
No Samples
2011 0.32 3.79 0.23 0.18 0.52 45.75 1.77
Minimum 4.14 0.40 1.38 0.29 0.44 177.00 7.51
Maximum 4.87 8.70 1.94 0.72 1.64 286.00 11.20
S10 - North Run Off Dam (n = 3)
Average
(± Std Dev)
5.66 6.20 9.03 26.77 1.29 0.95 0.34 0.76 0.16 0.15 162.17 109.67 5.86 3.96
0.52 0.59 8.30 21.53 0.62 0.34 0.40 0.46 0.12 0.10 69.76 34.00 2.15 0.72
Minimum 4.76 5.61 0.40 6.40 0.88 0.73 0.06 0.26 0.04 0.05 90.00 76.00 3.99 3.27
Maximum 6.32 6.78 23.50 49.30 2.53 1.34 0.98 1.17 0.31 0.25 276.00 144.00 10.10 4.70
S11 - STDE Stormwater Catchment
(n = 12)
Average
(± Std Dev)
6.94 7.41 15.26 25.18 0.11 0.17 0.28 0.33 0.00 0.00 275.90 122.00 0.05 0.03
0.53 0.41 12.57 21.27 0.08 0.13 0.23 0.34 0.00 0.00 140.03 17.06 0.05 0.03
Minimum 6.21 6.79 0.30 3.30 0.02 0.05 0.05 0.05 0.00 0.00 100.00 93.00 0.01 0.01
Maximum 7.73 7.94 36.80 66.70 0.26 0.51 0.67 1.07 0.00 0.00 553.00 151.00 0.16 0.11
S13 - Western Run-off Dam
(n =0)
Average
(± Std Dev)
5.18
No Samples 2011
6.28
No Samples 2011
2.25
No Samples 2011
0.35
No Samples 2011
0.22
No Samples 2011
260.20
No Samples 2011
8.48
No Samples 2011
0.32 6.04 0.93 0.54 0.20 56.94 1.83
Minimum 4.88 0.30 1.21 0.05 0.08 178.00 7.08
Maximum 5.69 14.90 3.38 1.32 0.57 305.00 11.60
S14 - Pork Pie Dam (n = 12)
Average
(± Std Dev)
6.38 7.25 20.19 46.77 1.70 1.65 0.28 0.73 0.02 0.02 691.75 667.08 3.82 2.39
0.72 1.09 24.16 32.23 1.71 2.54 0.21 0.69 0.03 0.03 155.77 182.47 1.86 2.03
Minimum 4.93 4.84 0.30 5.30 0.18 0.05 0.05 0.05 0.00 0.00 432.00 451.00 0.66 0.10
Maximum 7.47 9.14 71.20 132.40 5.14 8.81 0.70 1.84 0.12 0.09 994.00 992.00 6.83 6.82
S15 - Old Mine Water Dam (MPL 1093)
(n = 8)`
Average
(± Std Dev)
7.46 7.67 8.05 18.35 0.01 0.02 0.91 1.68 0.00 0.01 4.35 16.38 0.09 0.39
0.51 0.71 5.63 14.19 0.02 0.01 0.80 1.62 0.01 0.01 5.40 10.85 0.10 0.54
Minimum 6.67 6.98 0.20 2.60 0.00 0.00 0.27 0.46 0.00 0.00 0.50 8.00 0.01 0.02
Maximum 8.46 8.58 16.30 47.10 0.06 0.02 3.09 5.27 0.03 0.03 14.00 37.00 0.31 1.49
S16 - Old Mine Water Dam (MPL 1094)
(n = 12)
Average
(± Std Dev)
7.11 7.71 6.68 9.33 0.03 0.09 1.02 3.94 0.04 0.20 5.08 1.50 0.02 0.06
0.87 0.54 4.82 4.58 0.01 0.04 0.70 2.30 0.04 0.11 11.99 0.90 0.01 0.03
Minimum 5.26 6.93 0.20 1.30 0.02 0.04 0.23 0.85 0.01 0.05 0.50 1.00 0.01 0.01
Maximum 8.49 8.46 13.40 18.40 0.06 0.16 2.35 8.24 0.14 0.44 42.00 4.00 0.06 0.10 Notes: 1. n represents the number of months sampled (samples unable to be taken when dam is dry, therefore n<12. No samples indicates water storage was dry;
2. Values outside ANZECC guideline limits are highlighted in red. Water quality is compared to the ANZECC guidelines for irrigation and general use water, if absent ANZECC stock water guidelines have been used.
64
Each parameter of surface water quality summarised in Table 25 is briefly discussed below in terms of the
potential effects if an overflow or runoff was to occur onto uncontaminated vegetated areas.
3.3.1 pH
The pH of water is a measure of its acidity or alkalinity and should be maintained between 6 and 9 for surface
waters. Generally, pH itself is not a water quality issue of concern, but it can indicate the presence of a number
of related problems. Soil and animal health will not generally be affected by water with pH in the range 4 – 9.
All sampling locations recorded an average pH within upper and lower guidance limits, with the exception of S1.
Samples from S1 had an average pH reading (pH 3.48) lower than the guidance lower limit of pH 6. The 2011
average (pH 3.48) was also slightly below the 2010 average (pH 3.88). This dam is within a known
contaminated catchment (excised old subsidence zone and smelter site), therefore it is essential that runoff is
captured on site and allowed to evaporate. The S1 dam is closely monitored during wet weather periods, as it
has been known to overflow in past times of heavy rainfall. All overflows are contained within the CML5
boundaries, and have not shown any negative impacts on the surrounding vegetation as a result of such runoff in
the past.
Improvements in pH have been recorded in catchment dams S4 (Borrow Pit) and S10 (North Run Off Dam).
The average pH recorded has increased at both sample sites to be within the stock and general water guideline
limits. Improvement in water quality at the Borrow Pit is a likely indication of the improvement of the site water
drainage system and construction of the new Operational Water Storage Dam capturing the majority of
contaminated run-off (discussed in Section 2.8.3).
3.3.2 Electrical Conductivity (Salinity)
Salinity is the presence of soluble salts in soils or waters. High salinity levels in soils may result in reduced plant
productivity, development of salt scald areas, and in extreme cases, and the elimination of native vegetation.
The surface water salinity concentrations for surface water catchment dams within the CSA Mine site were
consistently below the ANZECC guideline value of 7,700 uS/cm in 2011 and are therefore unlikely to negatively
impact if an overflow was to occur.
3.3.3 Copper
Cu is an essential trace element for vegetation with an ANZECC guideline for irrigation and general water of
5 mg/L. Cu is an enzyme activator, therefore a lack of this element leads to vegetation mottling and yellowing in
leaves. Only S1 recorded elevated Cu concentrations in 2011. The average Cu concentration of 20 mg/L
recorded in S1 was higher than the irrigation and general water guideline limit of 5 mg/L and higher than the
average of 14 mg/L recorded in 2010. Given S1 captures contaminated runoff from the contaminated old
subsidence zone (as explained above) this is not surprising, and all water captured is evaporated.
Improvements in water quality were recorded in S4 (Borrow Pit), with the average Cu concentration showing a
marked reduction from 11.34 mg/L recorded in 2010 to 3.58 mg/L in 2011, below the irrigation and general
water guideline of 5 mg/L.
CMPL 2011 AEMR
65
3.3.4 Iron
Iron (Fe) is also an essential trace element of vegetation and must be present in small quantities for plant
formation. The recommended Fe concentration for irrigation and general use water supplies should remain
below 10 mg/L. There were no exceedences of Fe during 2011.
3.3.5 Lead
The ANZECC irrigation and general water guideline for Lead (Pb) concentration is 5 mg/L. No surface water
monitoring results exceeded this limit in 2011.
3.3.6 Sulphates
ANZECC guidelines for irrigation and general use water do not have a recommended value for sulphates. The
guideline for stock drinking water states that no adverse effects to soil and animal health are expected if the
concentration of sulphate does not exceed 1,000 mg/L. The average concentration of sulphates for only two
sampling sites at the CSA mine were over this recommended value in 2011. S1 recorded sulphate levels above
the ANZECC guideline, with an average concentration of 1,267mg/L. This average concentration was less than
the average recorded in 2010 (1,607 mg/L) indicating an improvement in water quality. Elevated sulphates levels
are a typical component of mine run-off (ANZECC, 2000). All runoff from this area is captured and evaporated;
no runoff leaves the immediate area and is very well contained.
S5 also showed elevated levels of sulphate (1,260 mg/L) over the stock drinking water trigger. S5 is the STSF
Decant Dam and receives run-off from the STSF. S5 is lined and fenced to prevent animal access, therefore is
not used for stock drinking water. The 2011 data (1, 260mg/L) indicates a small improvement on 2010 data
(1,347mg/L).
3.3.7 Zinc
Zinc (Zn) is an essential trace element that acts as an enzyme activator for vegetation growth, and therefore a
lack of this element leads to leaf mottling and yellowing in younger leaves. The ANZECC guidelines low risk
trigger value for zinc concentrations (5 mg/L) was used to compare CSA surface water results. Catchment dam
S1 is again high in concentration (76.16 mg/L); however has remained stable compared to 2010 results (76.98
mg/L). This average concentration is significantly reduced from 125 mg/L recorded in 2008. Catchment Dam
S10 also located in this same contaminated catchment (excised subsidence zone and old smelter site) has
recorded an improvement in 2011, now with averages below the guideline (3.96 mg/L).
Borrow Pit Dam (S4) recorded an average slightly above the guideline (6.50 mg/L), however indicates an
improvement in water quality compared with 2010 results (9.22 mg/L). This improvement can be contributed to
the improvements in surface water drainage and construction of the operational water dam intercepting a
majority of contaminated water from the Ore Processing Plant.
Elevated Zn concentrations do not cause any major health problems when taken up by plants or consumed by
stock, however it does contribute to cosmetic and aesthetic effects on water quality. Therefore, while it is not
ideal to have concentrations exceeding guideline values, it is not detrimental.
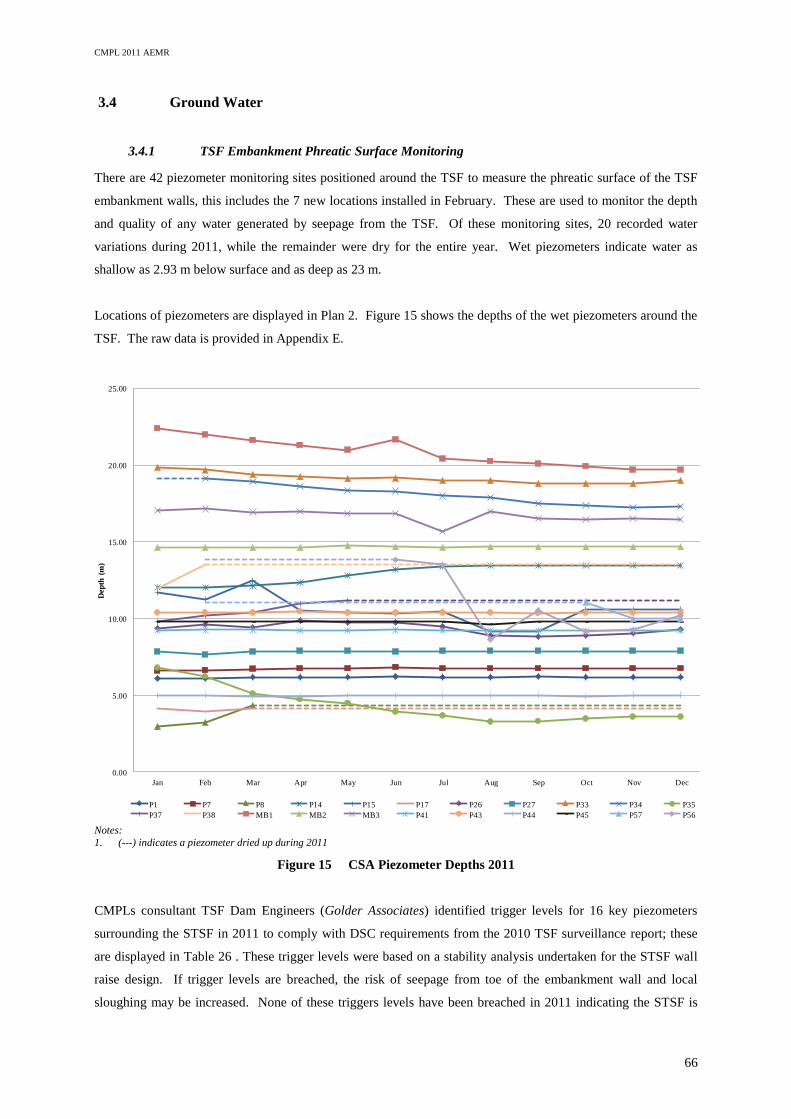
CMPL 2011 AEMR
66
3.4 Ground Water
3.4.1 TSF Embankment Phreatic Surface Monitoring
There are 42 piezometer monitoring sites positioned around the TSF to measure the phreatic surface of the TSF
embankment walls, this includes the 7 new locations installed in February. These are used to monitor the depth
and quality of any water generated by seepage from the TSF. Of these monitoring sites, 20 recorded water
variations during 2011, while the remainder were dry for the entire year. Wet piezometers indicate water as
shallow as 2.93 m below surface and as deep as 23 m.
Locations of piezometers are displayed in Plan 2. Figure 15 shows the depths of the wet piezometers around the
TSF. The raw data is provided in Appendix E.
0.00
5.00
10.00
15.00
20.00
25.00
Jan Feb Mar Apr May Jun Jul Aug Sep Oct Nov Dec
Dep
th (
m)
P1 P7 P8 P14 P15 P17 P26 P27 P33 P34 P35
P37 P38 MB1 MB2 MB3 P41 P43 P44 P45 P57 P56
Notes:
1. (---) indicates a piezometer dried up during 2011
Figure 15 CSA Piezometer Depths 2011
CMPLs consultant TSF Dam Engineers (Golder Associates) identified trigger levels for 16 key piezometers
surrounding the STSF in 2011 to comply with DSC requirements from the 2010 TSF surveillance report; these
are displayed in Table 26 . These trigger levels were based on a stability analysis undertaken for the STSF wall
raise design. If trigger levels are breached, the risk of seepage from toe of the embankment wall and local
sloughing may be increased. None of these triggers levels have been breached in 2011 indicating the STSF is
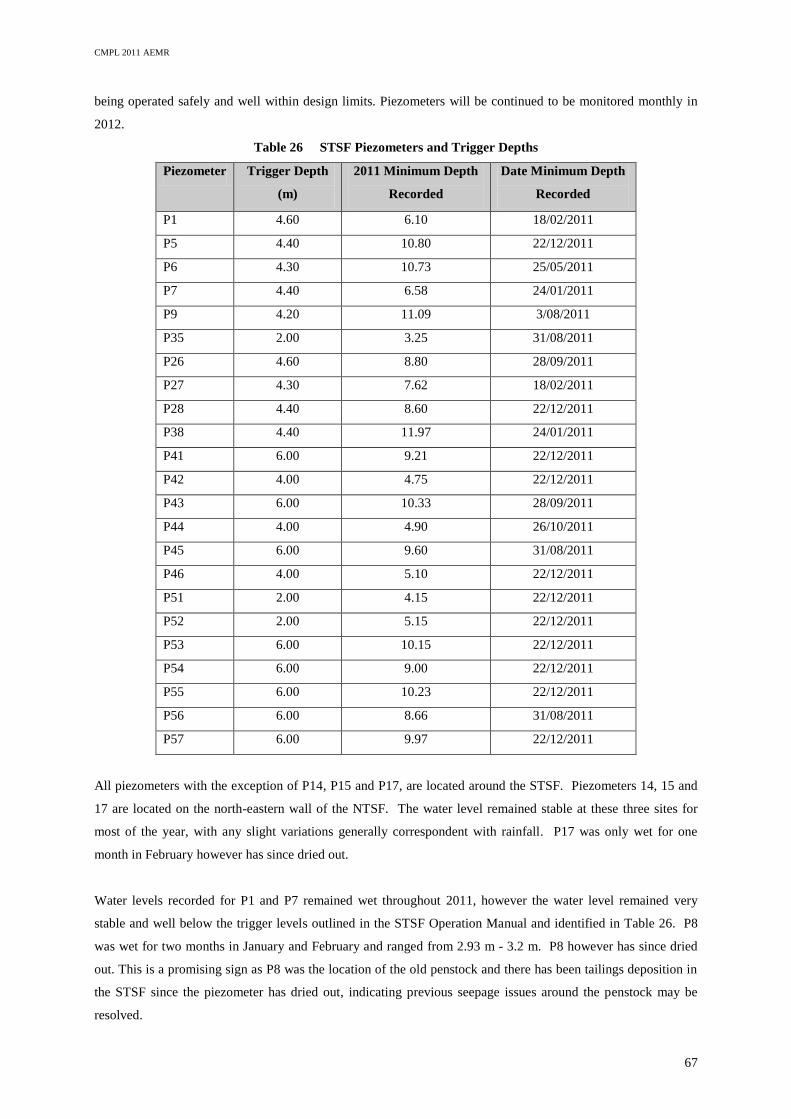
CMPL 2011 AEMR
67
being operated safely and well within design limits. Piezometers will be continued to be monitored monthly in
2012.
Table 26 STSF Piezometers and Trigger Depths
Piezometer Trigger Depth
(m)
2011 Minimum Depth
Recorded
Date Minimum Depth
Recorded
P1 4.60 6.10 18/02/2011
P5 4.40 10.80 22/12/2011
P6 4.30 10.73 25/05/2011
P7 4.40 6.58 24/01/2011
P9 4.20 11.09 3/08/2011
P35 2.00 3.25 31/08/2011
P26 4.60 8.80 28/09/2011
P27 4.30 7.62 18/02/2011
P28 4.40 8.60 22/12/2011
P38 4.40 11.97 24/01/2011
P41 6.00 9.21 22/12/2011
P42 4.00 4.75 22/12/2011
P43 6.00 10.33 28/09/2011
P44 4.00 4.90 26/10/2011
P45 6.00 9.60 31/08/2011
P46 4.00 5.10 22/12/2011
P51 2.00 4.15 22/12/2011
P52 2.00 5.15 22/12/2011
P53 6.00 10.15 22/12/2011
P54 6.00 9.00 22/12/2011
P55 6.00 10.23 22/12/2011
P56 6.00 8.66 31/08/2011
P57 6.00 9.97 22/12/2011
All piezometers with the exception of P14, P15 and P17, are located around the STSF. Piezometers 14, 15 and
17 are located on the north-eastern wall of the NTSF. The water level remained stable at these three sites for
most of the year, with any slight variations generally correspondent with rainfall. P17 was only wet for one
month in February however has since dried out.
Water levels recorded for P1 and P7 remained wet throughout 2011, however the water level remained very
stable and well below the trigger levels outlined in the STSF Operation Manual and identified in Table 26. P8
was wet for two months in January and February and ranged from 2.93 m - 3.2 m. P8 however has since dried
out. This is a promising sign as P8 was the location of the old penstock and there has been tailings deposition in
the STSF since the piezometer has dried out, indicating previous seepage issues around the penstock may be
resolved.
CMPL 2011 AEMR
68
Piezometers 26 (variation 1.05 m) and 27 (variation 0.05 m) increased in 2011 and is likely due to the
corresponding rainfall and storm events.
Piezometer 35 has varied throughout 2011, fluctuating between levels of 3.25 m to 6.78 m and has risen
consistently since 2009. An investigation was commissioned by CMPL to investigate the fluctuation in the
piezometer depths and complete a stability analysis of the South Slope Embankment of the STSF. The
investigation completed by Golders’ Engineers established a trigger level of 1 m for the piezometer which when
breached, may increase the risk of seepage from the toe of the embankment wall. Piezometer P35 is located at
the downstream toe of the southern embankment of the STSF. The increase in water level can be attributed to
water ponding at the toe of the embankment with limited drainage. The depth of P35 has remained steady at 3.5
m well below the trigger level and will continue to be monitored monthly to ensure the trigger level is not
breached.
Piezometer 37 slightly varied during the year, fluctuating between levels of 9.84 m and 10.7 m, and drying out
during May 2011. This site is located on the wall between the STSF and the dam extension. Water level
fluctuations are therefore explained by discharge of wet tailings along this wall and subsequent drying out since
the construction of the new wall lift completed in 2010. Monitoring of P37 was ceased from October 2011 on
the recommendation of the TSF dam engineers in the STSF Annual Surveillance Report.
Piezometer 38 was wet in January, however subsequently dried out for the remaining months of 2011. The
minimum depth of piezometer 38 (11.74 m) was recorded in January, however was significantly below the
trigger depth (4.4 m) set in the STSF operations plan and is also likely associated with the pooling of water
stormwater during the construction of the TSF wall lift.
Piezometer 41, 43, 44, 45 and 46 (surrounding the STSFE) fluctuated very little in 2011 and remained
significantly below trigger levels set in the STSF operations manual.
Fluctuations in piezometers MB1, MB2 and MB3 are minor (less than 2.7 m) and likely due to rainfall as these
are located well away from the TSF embankment and are very deep bores (92 m, 54 m and 14.8 m respectively)
thought to be associated with separate water fractures or aquifers as discussed in Section 2.8.4. Water quality
results from MB3 also show no connection with seepage water recorded in TSF wall piezometers and were
within ANZECC water quality guidelines as outlined above.
Figure 16 shows a cross-sectional drawing of the typical set up of piezometers around the TSF illustrating how
piezometer readings can be influenced by the discharge of wet tailings material and periods of rainfall. As
indicated in Figure 16, the position of a wet piezometer on the tailings embankment assist with an assessment
whether water detected is due to moisture in the tailings material below or if it is moisture below ground level.
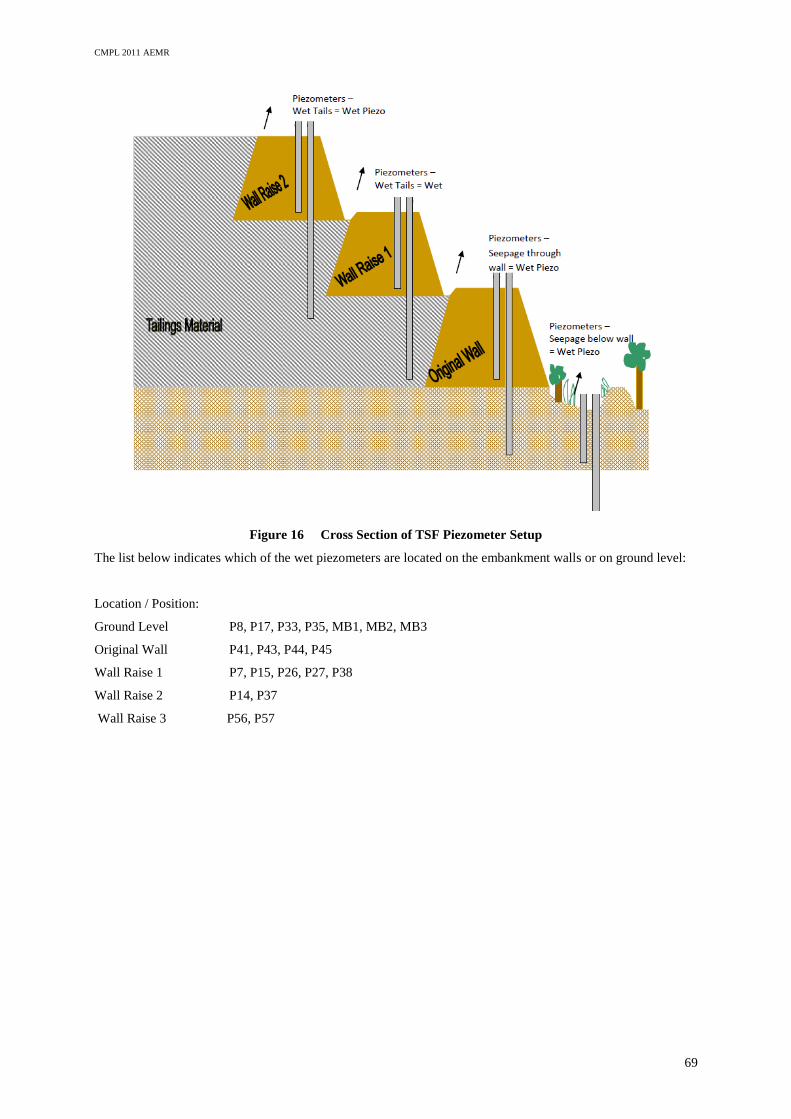
CMPL 2011 AEMR
69
Figure 16 Cross Section of TSF Piezometer Setup
The list below indicates which of the wet piezometers are located on the embankment walls or on ground level:
Location / Position:
Ground Level P8, P17, P33, P35, MB1, MB2, MB3
Original Wall P41, P43, P44, P45
Wall Raise 1 P7, P15, P26, P27, P38
Wall Raise 2 P14, P37
Wall Raise 3 P56, P57
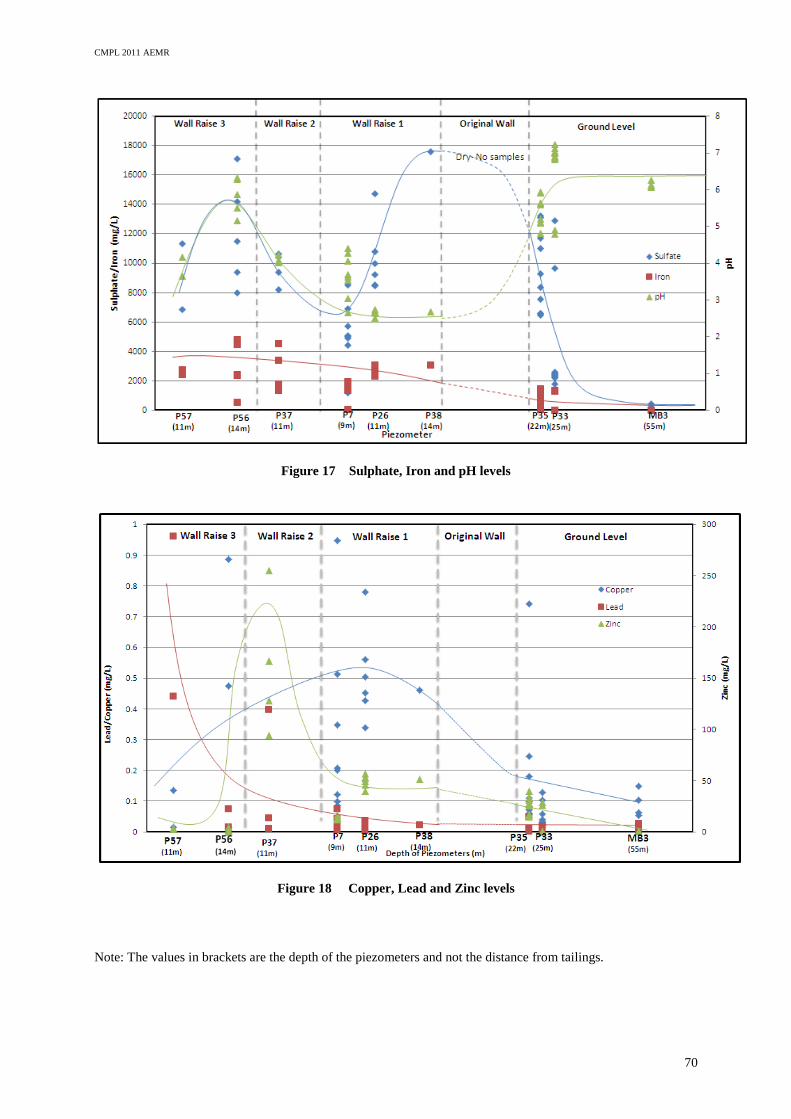
CMPL 2011 AEMR
70
Figure 17 Sulphate, Iron and pH levels
Figure 18 Copper, Lead and Zinc levels
Note: The values in brackets are the depth of the piezometers and not the distance from tailings.
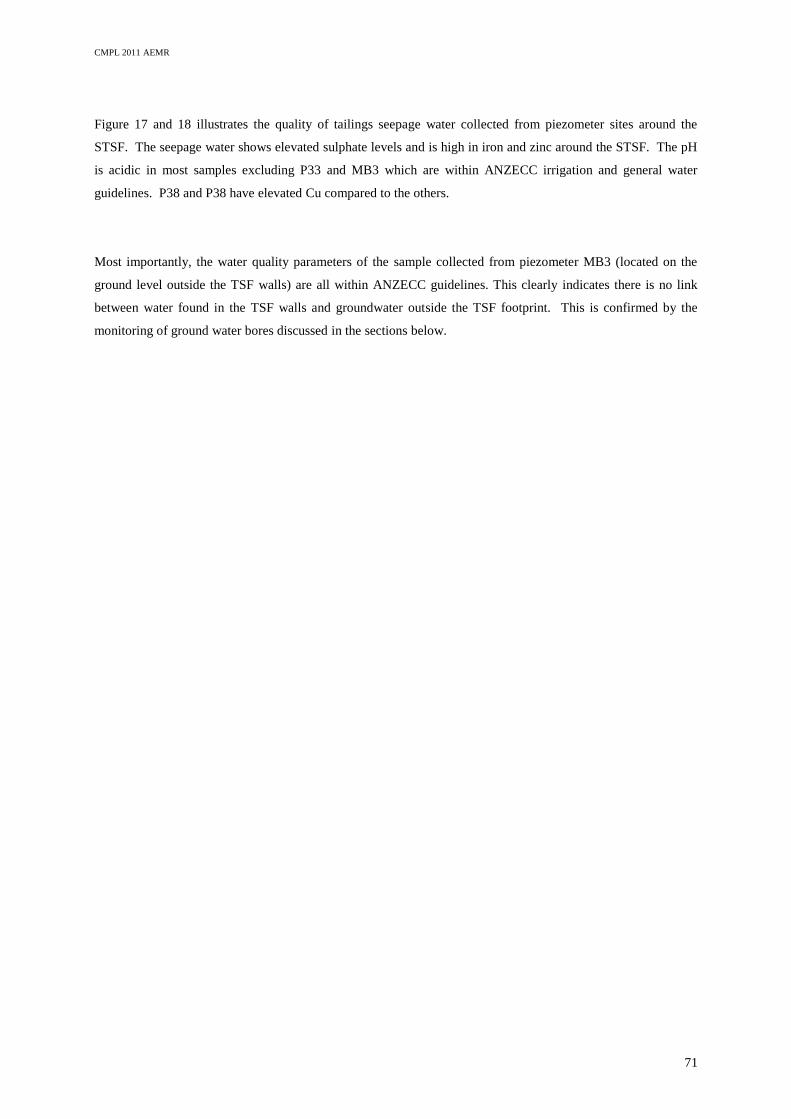
CMPL 2011 AEMR
71
Figure 17 and 18 illustrates the quality of tailings seepage water collected from piezometer sites around the
STSF. The seepage water shows elevated sulphate levels and is high in iron and zinc around the STSF. The pH
is acidic in most samples excluding P33 and MB3 which are within ANZECC irrigation and general water
guidelines. P38 and P38 have elevated Cu compared to the others.
Most importantly, the water quality parameters of the sample collected from piezometer MB3 (located on the
ground level outside the TSF walls) are all within ANZECC guidelines. This clearly indicates there is no link
between water found in the TSF walls and groundwater outside the TSF footprint. This is confirmed by the
monitoring of ground water bores discussed in the sections below.
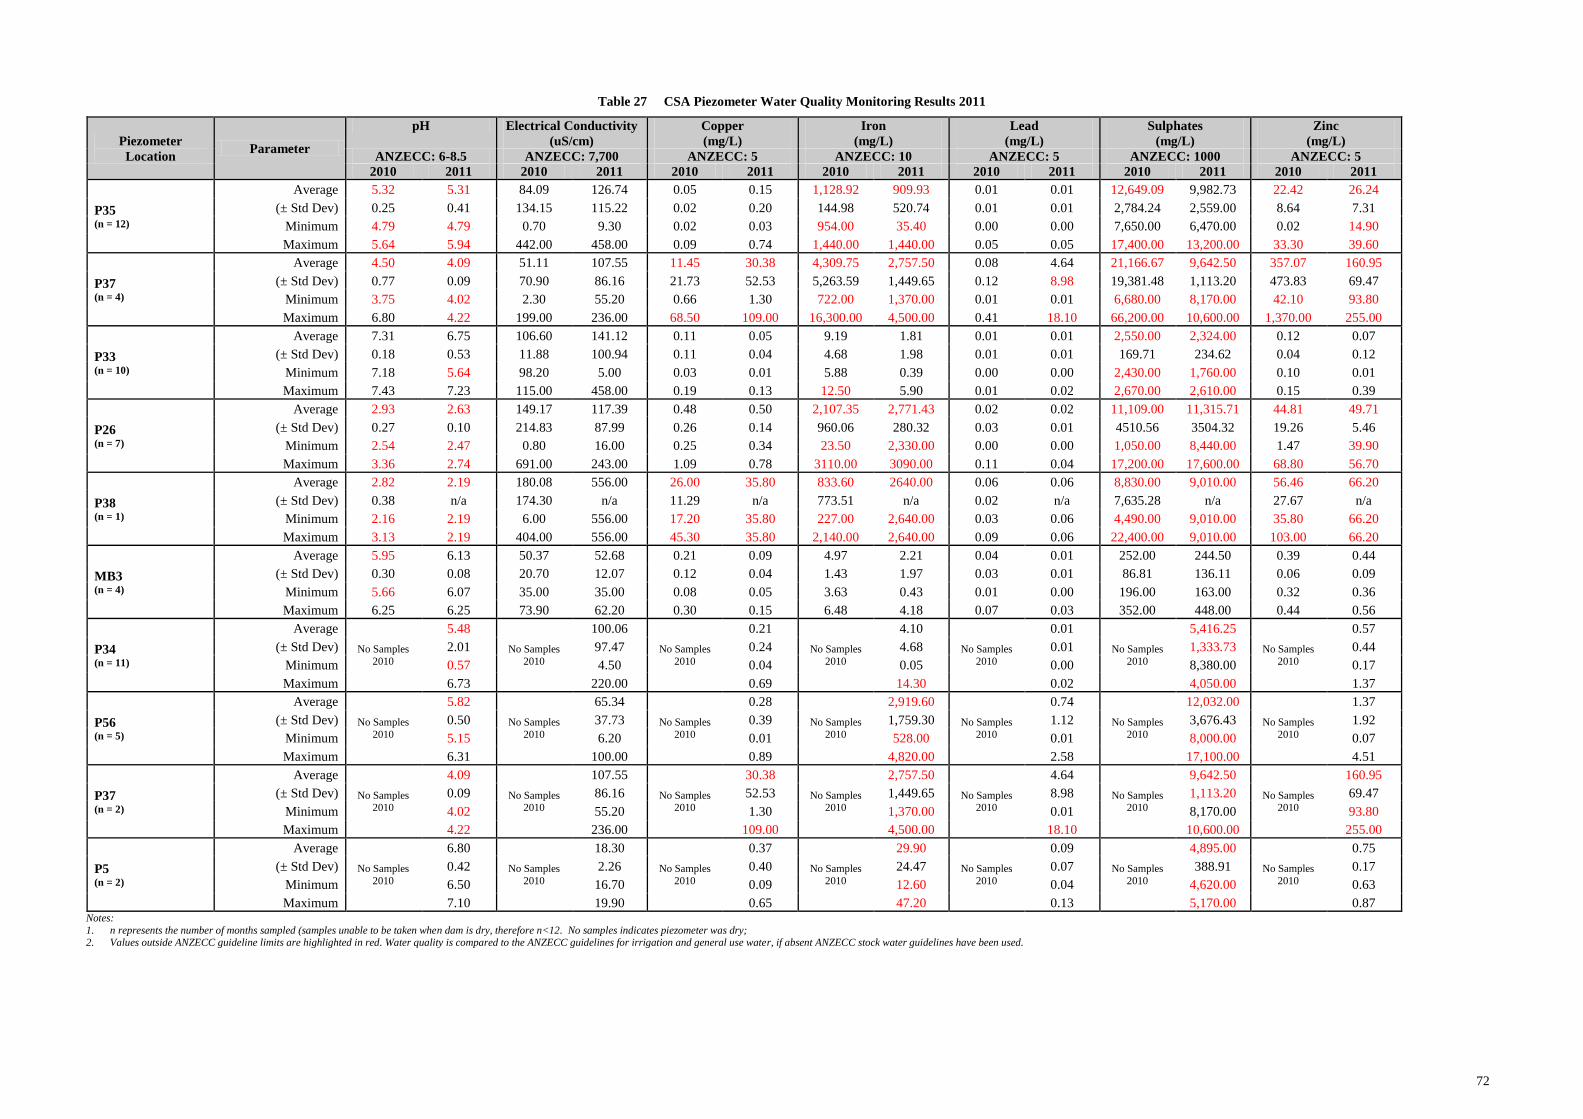
72
Table 27 CSA Piezometer Water Quality Monitoring Results 2011
Piezometer
Location Parameter
pH Electrical Conductivity
(uS/cm)
Copper
(mg/L)
Iron
(mg/L)
Lead
(mg/L)
Sulphates
(mg/L)
Zinc
(mg/L)
ANZECC: 6-8.5 ANZECC: 7,700 ANZECC: 5 ANZECC: 10 ANZECC: 5 ANZECC: 1000 ANZECC: 5
2010 2011 2010 2011 2010 2011 2010 2011 2010 2011 2010 2011 2010 2011
P35 (n = 12)
Average 5.32 5.31 84.09 126.74 0.05 0.15 1,128.92 909.93 0.01 0.01 12,649.09 9,982.73 22.42 26.24
(± Std Dev) 0.25 0.41 134.15 115.22 0.02 0.20 144.98 520.74 0.01 0.01 2,784.24 2,559.00 8.64 7.31
Minimum 4.79 4.79 0.70 9.30 0.02 0.03 954.00 35.40 0.00 0.00 7,650.00 6,470.00 0.02 14.90
Maximum 5.64 5.94 442.00 458.00 0.09 0.74 1,440.00 1,440.00 0.05 0.05 17,400.00 13,200.00 33.30 39.60
P37 (n = 4)
Average 4.50 4.09 51.11 107.55 11.45 30.38 4,309.75 2,757.50 0.08 4.64 21,166.67 9,642.50 357.07 160.95
(± Std Dev) 0.77 0.09 70.90 86.16 21.73 52.53 5,263.59 1,449.65 0.12 8.98 19,381.48 1,113.20 473.83 69.47
Minimum 3.75 4.02 2.30 55.20 0.66 1.30 722.00 1,370.00 0.01 0.01 6,680.00 8,170.00 42.10 93.80
Maximum 6.80 4.22 199.00 236.00 68.50 109.00 16,300.00 4,500.00 0.41 18.10 66,200.00 10,600.00 1,370.00 255.00
P33 (n = 10)
Average 7.31 6.75 106.60 141.12 0.11 0.05 9.19 1.81 0.01 0.01 2,550.00 2,324.00 0.12 0.07
(± Std Dev) 0.18 0.53 11.88 100.94 0.11 0.04 4.68 1.98 0.01 0.01 169.71 234.62 0.04 0.12
Minimum 7.18 5.64 98.20 5.00 0.03 0.01 5.88 0.39 0.00 0.00 2,430.00 1,760.00 0.10 0.01
Maximum 7.43 7.23 115.00 458.00 0.19 0.13 12.50 5.90 0.01 0.02 2,670.00 2,610.00 0.15 0.39
P26 (n = 7)
Average 2.93 2.63 149.17 117.39 0.48 0.50 2,107.35 2,771.43 0.02 0.02 11,109.00 11,315.71 44.81 49.71
(± Std Dev) 0.27 0.10 214.83 87.99 0.26 0.14 960.06 280.32 0.03 0.01 4510.56 3504.32 19.26 5.46
Minimum 2.54 2.47 0.80 16.00 0.25 0.34 23.50 2,330.00 0.00 0.00 1,050.00 8,440.00 1.47 39.90
Maximum 3.36 2.74 691.00 243.00 1.09 0.78 3110.00 3090.00 0.11 0.04 17,200.00 17,600.00 68.80 56.70
P38 (n = 1)
Average 2.82 2.19 180.08 556.00 26.00 35.80 833.60 2640.00 0.06 0.06 8,830.00 9,010.00 56.46 66.20
(± Std Dev) 0.38 n/a 174.30 n/a 11.29 n/a 773.51 n/a 0.02 n/a 7,635.28 n/a 27.67 n/a
Minimum 2.16 2.19 6.00 556.00 17.20 35.80 227.00 2,640.00 0.03 0.06 4,490.00 9,010.00 35.80 66.20
Maximum 3.13 2.19 404.00 556.00 45.30 35.80 2,140.00 2,640.00 0.09 0.06 22,400.00 9,010.00 103.00 66.20
MB3 (n = 4)
Average 5.95 6.13 50.37 52.68 0.21 0.09 4.97 2.21 0.04 0.01 252.00 244.50 0.39 0.44
(± Std Dev) 0.30 0.08 20.70 12.07 0.12 0.04 1.43 1.97 0.03 0.01 86.81 136.11 0.06 0.09
Minimum 5.66 6.07 35.00 35.00 0.08 0.05 3.63 0.43 0.01 0.00 196.00 163.00 0.32 0.36
Maximum 6.25 6.25 73.90 62.20 0.30 0.15 6.48 4.18 0.07 0.03 352.00 448.00 0.44 0.56
P34 (n = 11)
Average
No Samples
2010
5.48
No Samples
2010
100.06
No Samples
2010
0.21
No Samples
2010
4.10
No Samples
2010
0.01
No Samples
2010
5,416.25
No Samples
2010
0.57
(± Std Dev) 2.01 97.47 0.24 4.68 0.01 1,333.73 0.44
Minimum 0.57 4.50 0.04 0.05 0.00 8,380.00 0.17
Maximum 6.73 220.00 0.69 14.30 0.02 4,050.00 1.37
P56 (n = 5)
Average
No Samples
2010
5.82
No Samples
2010
65.34
No Samples
2010
0.28
No Samples
2010
2,919.60
No Samples
2010
0.74
No Samples
2010
12,032.00
No Samples
2010
1.37
(± Std Dev) 0.50 37.73 0.39 1,759.30 1.12 3,676.43 1.92
Minimum 5.15 6.20 0.01 528.00 0.01 8,000.00 0.07
Maximum 6.31 100.00 0.89 4,820.00 2.58 17,100.00 4.51
P37 (n = 2)
Average
No Samples 2010
4.09
No Samples 2010
107.55
No Samples 2010
30.38
No Samples 2010
2,757.50
No Samples 2010
4.64
No Samples 2010
9,642.50
No Samples 2010
160.95
(± Std Dev) 0.09 86.16 52.53 1,449.65 8.98 1,113.20 69.47
Minimum 4.02 55.20 1.30 1,370.00 0.01 8,170.00 93.80
Maximum 4.22 236.00 109.00 4,500.00 18.10 10,600.00 255.00
P5 (n = 2)
Average
No Samples
2010
6.80
No Samples
2010
18.30
No Samples
2010
0.37
No Samples
2010
29.90
No Samples
2010
0.09
No Samples
2010
4,895.00
No Samples
2010
0.75
(± Std Dev) 0.42 2.26 0.40 24.47 0.07 388.91 0.17
Minimum 6.50 16.70 0.09 12.60 0.04 4,620.00 0.63
Maximum 7.10 19.90 0.65 47.20 0.13 5,170.00 0.87 Notes:
1. n represents the number of months sampled (samples unable to be taken when dam is dry, therefore n<12. No samples indicates piezometer was dry; 2. Values outside ANZECC guideline limits are highlighted in red. Water quality is compared to the ANZECC guidelines for irrigation and general use water, if absent ANZECC stock water guidelines have been used.
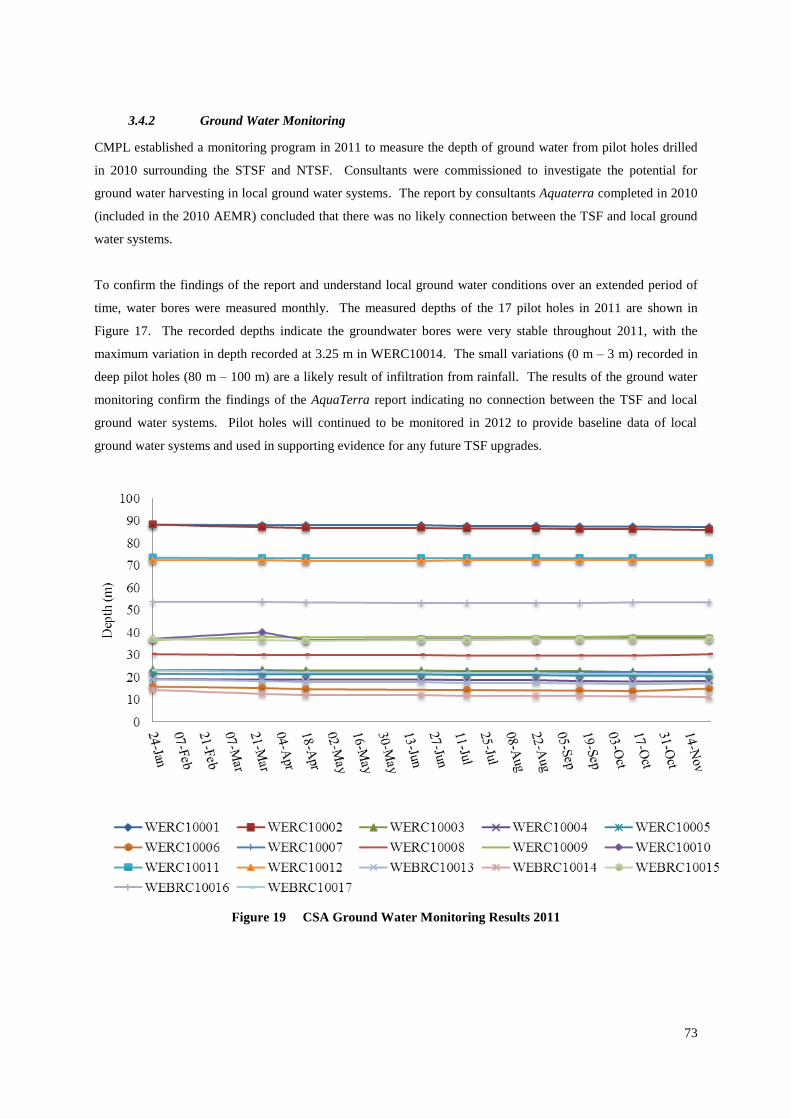
73
3.4.2 Ground Water Monitoring
CMPL established a monitoring program in 2011 to measure the depth of ground water from pilot holes drilled
in 2010 surrounding the STSF and NTSF. Consultants were commissioned to investigate the potential for
ground water harvesting in local ground water systems. The report by consultants Aquaterra completed in 2010
(included in the 2010 AEMR) concluded that there was no likely connection between the TSF and local ground
water systems.
To confirm the findings of the report and understand local ground water conditions over an extended period of
time, water bores were measured monthly. The measured depths of the 17 pilot holes in 2011 are shown in
Figure 17. The recorded depths indicate the groundwater bores were very stable throughout 2011, with the
maximum variation in depth recorded at 3.25 m in WERC10014. The small variations (0 m – 3 m) recorded in
deep pilot holes (80 m – 100 m) are a likely result of infiltration from rainfall. The results of the ground water
monitoring confirm the findings of the AquaTerra report indicating no connection between the TSF and local
ground water systems. Pilot holes will continued to be monitored in 2012 to provide baseline data of local
ground water systems and used in supporting evidence for any future TSF upgrades.
Figure 19 CSA Ground Water Monitoring Results 2011
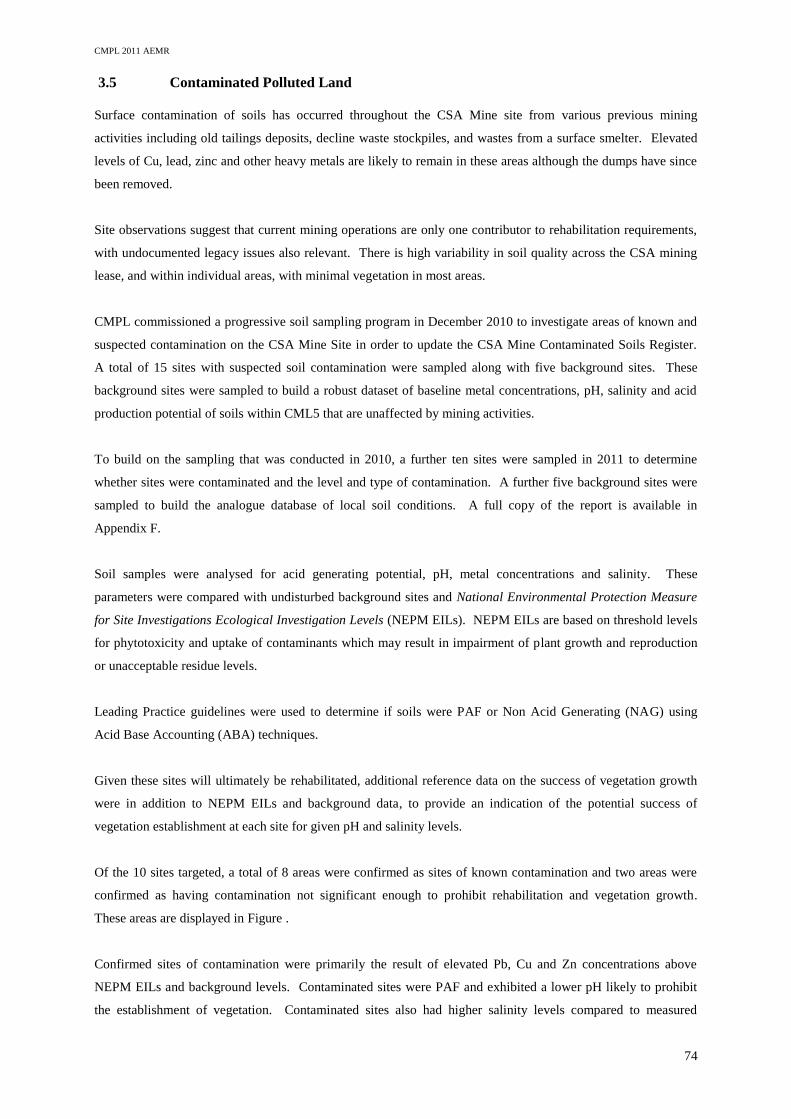
CMPL 2011 AEMR
74
3.5 Contaminated Polluted Land
Surface contamination of soils has occurred throughout the CSA Mine site from various previous mining
activities including old tailings deposits, decline waste stockpiles, and wastes from a surface smelter. Elevated
levels of Cu, lead, zinc and other heavy metals are likely to remain in these areas although the dumps have since
been removed.
Site observations suggest that current mining operations are only one contributor to rehabilitation requirements,
with undocumented legacy issues also relevant. There is high variability in soil quality across the CSA mining
lease, and within individual areas, with minimal vegetation in most areas.
CMPL commissioned a progressive soil sampling program in December 2010 to investigate areas of known and
suspected contamination on the CSA Mine Site in order to update the CSA Mine Contaminated Soils Register.
A total of 15 sites with suspected soil contamination were sampled along with five background sites. These
background sites were sampled to build a robust dataset of baseline metal concentrations, pH, salinity and acid
production potential of soils within CML5 that are unaffected by mining activities.
To build on the sampling that was conducted in 2010, a further ten sites were sampled in 2011 to determine
whether sites were contaminated and the level and type of contamination. A further five background sites were
sampled to build the analogue database of local soil conditions. A full copy of the report is available in
Appendix F.
Soil samples were analysed for acid generating potential, pH, metal concentrations and salinity. These
parameters were compared with undisturbed background sites and National Environmental Protection Measure
for Site Investigations Ecological Investigation Levels (NEPM EILs). NEPM EILs are based on threshold levels
for phytotoxicity and uptake of contaminants which may result in impairment of plant growth and reproduction
or unacceptable residue levels.
Leading Practice guidelines were used to determine if soils were PAF or Non Acid Generating (NAG) using
Acid Base Accounting (ABA) techniques.
Given these sites will ultimately be rehabilitated, additional reference data on the success of vegetation growth
were in addition to NEPM EILs and background data, to provide an indication of the potential success of
vegetation establishment at each site for given pH and salinity levels.
Of the 10 sites targeted, a total of 8 areas were confirmed as sites of known contamination and two areas were
confirmed as having contamination not significant enough to prohibit rehabilitation and vegetation growth.
These areas are displayed in Figure .
Confirmed sites of contamination were primarily the result of elevated Pb, Cu and Zn concentrations above
NEPM EILs and background levels. Contaminated sites were PAF and exhibited a lower pH likely to prohibit
the establishment of vegetation. Contaminated sites also had higher salinity levels compared to measured
CMPL 2011 AEMR
75
background levels; however in the majority of contaminated sites salinity levels were not high enough to be a
limiting factor in rehabilitation.
Figure 20 CSA Contaminated Sites Register (as of 31/12/11)
In 2012, the remaining 4 areas on site suspected of contamination will be further investigated. In addition,
background sites will continue to be sampled in order to capture local baseline conditions not affected by mining
activities. Data on the nature and level of contamination of sites will assist in progressive rehabilitation to meet
performance and closure criteria set out in CMPL’s Rehabilitation Monitoring Methodology and Determination
of Completion Criteria for Rehabilitation Ecosystems report (Appendix K).
3.6 Threatened Flora
The CSA mine is situated within the Cobar Peneplain Bioregion which extends from just south of Bourke to
north of Griffith. It has a total area of 7,334,664 ha and occupies 9.2% of the state.
The Cobar bioregion is characterised by an undulating to hilly landscape with shallow, red earth soils where the
vegetation is mainly open woodlands dominated by bimble box (Eucalyptus populnea), red box (Eucalyptus
intertexta) and white cypress (Callitris glaucophylla). The woodlands of the Cobar Peneplain Bioregion are the
most extensive woodland communities to remain in western NSW.
No threatened flora species have been observed during flora surveys at the CSA Mine (Parsons Brinckerhoff
2006 or Roderick et al 1999); the habitats within the site may however, provide suitable habitat for the following
four threatened species:
Western Goodenia – Goodenia occidentalis;
Pine Dondey Orchid – Diuris tricolour;
CMPL 2011 AEMR
76
Large-leafed Monotaxis – Monotaxis macrophylla;
Greenhood Orchid – Pterostylis cobarensis.
Employees of the CSA Mine undertaking surface exploration activities are provided with information to allow
them to recognise relevant flora and fauna species. All proposed drill sites, roads and tracks are inspected prior
to any exploration activity taking place. The inspections include an assessment of potential risks to flora, fauna
and cultural heritage. CMPL employees and contractors are instructed to notify the Environment Team of the
presence of any species or sites of potential importance so that they may be further examined and appropriate
controls or actions put in place. Details of the inspection are documented including identified species, the
appropriate department is notified of management conditions required. If exploration personnel have any doubt
they are instructed not to proceed with the exploration activities until clearance is received.
No vegetative cover within the lease area is permitted to be cut, destroyed, ringbarked or removed except if such
vegetation directly obstructs or prevents the carrying on of operations (as per CML5 lease conditions). Any
clearing not authorized under the Mining Act 1992 must comply with the provisions of the Native Vegetation Act
2003 and shall occur only following advice and authorisation from the Environmental Department.
3.7 Threatened Fauna
Public database searches indicate that a total of 50 listed threatened animal species have been either previously
recorded or have potential habitat with the CML5 mining lease area. These include three species of reptile, 36
species of bird and 11 species of mammal. A total of 68 different animal species have been recorded within the
mining lease, only four of which are listed as threatened species. They are the Grey-crowned Babbler, Major
Mitchell’s Cockatoo, Yellow-bellied Sheathtail Bat and the Little Pied Bat.
Flora and fauna surveys conducted before CMPL began operations in 1999 concluded that the re-opening of the
mine and continuation of works would have negligible impact on the surrounding fauna and flora habitat on the
greater lease area. The immediate area up to 5 km in radius from the mine and beyond is covered by the original
Bimble Box woodland providing adequate refuge for ranging species.
The 2006 CSA Mine Biodiversity Study identified the key threatening processes applying to the management of
biodiversity at the CSA Mine as:
Clearing of native vegetation/land clearance;
Competition and grazing by feral rabbits and goats; and
Predation by feral cats and foxes.
CMPL’s environmental objectives aim to ensure the clearing of native vegetation is minimised where possible.
The mine understands the value of connectivity and is fortunate to be within the Cobar Peneplain Bioregion,
which is the most extensive woodland community to remain in western NSW.
Competition, grazing and predation by feral animals on the CML5 lease are addressed in the CSA Mine Pest
Animal Management Plan. This management plan was first implemented in 2007, and is updated annually. This
CMPL 2011 AEMR
77
management plan will continue in to be implemented in the future in order to keep identified feral animals under
control. No fox baiting took place during 2011, however fox baiting is anticipated in 2012 in conjunction with
the surrounding landholders.
During 2011, a total of 1,218 goats were removed from CMPL managed lands. All goats removed from site are
recorded through a Livestock Production Assurance National Vendor Declaration (NVD). A goat cannot be sold
without an NVD which is used to document numbers and locations of goats harvested, provide assurance
landholder access was granted and more importantly to declare information about the food safety status of the
livestock. This compulsory process is managed by Meat and Livestock Australia (MLA).
Feral goat management is expected to improve with the appointment of a new feral pest control contractor in
2012. Additional personnel and resources will be invested into the management of feral goats by the new
contractor.
CMPL maintains a register of reptile sightings and management at the CSA Mine. A total of 14 snakes were
recorded in 2011. Of those that were identified, all were reported as the common Eastern Brown Snake
(Pseudonaja textilis) ranging in length between 0.3 – 1.5 m (average 1.0 m). Sightings were reported from the
mill, the administration building, the surface washbay and the shaft and the maintenance offices. Snake capture
and relocation was only required on four occasions. All other sightings were just reports, with no further action
taken due to no harm being posed to the work area.
3.8 Weeds
A total of 82 flora species were recorded on site during the 2006 biodiversity surveys, of which 84% were native.
Of the remaining 16%, the diversity and density of exotic species was highest in disturbed areas such as along
tracks, around dams and in previously cleared areas. All 13 exotic species recorded were herbs, none of which
are listed noxious weeds under the Noxious Weeds Act 1993 for the CSC noxious weeds control area.
Noxious weeds known to be in the area include the Galvanised Burr (Sclerolaena birchii) and the Common
Prickly Pear (Opuntia stricta). The galvanised burr is a native of Australia and is one of only very few species
that thrive in the dry hot conditions of Cobar. There are no plans to manage this species on the CSA Mine site,
as they are viewed as a positive establishing species that assist in revegetation succession. A prickly pear
infestation was discovered in mid 2008 in the disturbed area associated with the old housing estate to the south
west of the administration building. The Common Thornapple (Datura stramonium) and Wild Tobacco
(Solanum mauritianum) are also known to occur in the area. These weeds are not listed as noxious; however
pose a threat to human and livestock health.
The CSC Weeds Officer conducted the annual Noxious Weeds Inspection of the CSA Mine site during
December 2011. The weeds officer inspected the site focusing on the most likely locations for weed
establishment including topsoil stockpiles and newly disturbed areas. The CSC Weeds Officer concluded that
the CMPL owned property Red Tank was compliant with Local, State and Federal statutory requirements in
regards to the control of listed noxious weeds. The old housing estate behind administration was also inspected
to observe the known Prickly Pear infestation. This infested area has been closely monitored by CMPL since it
CMPL 2011 AEMR
78
was originally discovered in mid 2008. Some cochineal infected segments were released in the infested area in
August 2008 as an attempt to biologically control this outbreak. Unfortunately the infested segments did not
take to the shrub and died off. CMPL environmental staff and the CSC Weeds Officer investigated other options
for biological control over 2009, before resorting to spraying the area with herbicide in November 2009. This
herbicide treatment proved effective in wilting the plant and preventing flowering during 2010. The plant was
given a follow up spray in November 2010 to prevent regrowth. It was determined by the weeds officer that the
prickly pear population had been sufficiently controlled by previous spraying and will be assessed again in 2012,
with the possibility of reintroducing cochineal infected segments.
There were small populations of Bathurst Burr sighted during the inspection on topsoil stockpiles and battered
STSF Walls. No controls (i.e. spraying) were deemed necessary at the time of inspection; populations will
continue to be monitored for new growth during 2012 and any necessary actions will be taken to ensure the
population is controlled.
Wild Tobacco plants were found during the inspection in the former EDMS yard colonising disturbed ground.
Control measures were not considered necessary given the small population and the low risk which the weed
posed. Wild Tobacco will be monitored during 2012 to prevent further infestations occurring. Should further
weed infestations be encountered in the future, CMPL will employ species specific management strategies as
outlined in the CSA Mine Weed Management Plan and Handbook.
3.9 Blasting
All blasting and air blasting is confined to the underground mine workings at a depth greater than 1 km. The
mining method adopted at CSA uses bulk emulsion and ANFO initiated by the use of electronic detonation, less
than 500 kg of explosives are consumed per delay. While this method remains in use, no surface monitoring for
vibration is required.
3.10 Operational Noise
Blasting and crushing are the two noisiest operations at the CSA mine site. Both occur more than 700 m
underground and are not audible at the surface. The grinding circuit, adjacent to the concentrator, is the loudest
operation on the mines surface. Various pieces of mobile plant equipment are occasionally used for surface
projects, such as for TSF construction works. Such surface activities are typical operations of a mine site, and
thus do not require noise monitoring. The distance of the CSA mine site from the township of Cobar (11 km)
and from residential properties on surrounding land (minimum 3 km) contributes to a lack of operational noise
complaints.
3.11 Visual, Stray Light
Stray light pollution does not impact on surrounding neighbours due to lighted area on surface being restricted
to a small operational area, and the location of the mine over 3 km from the nearest residence and 11 km from
the township of Cobar. CMPL has never received a complaint in regard to light, and as such has no impetus to
amend current practices.
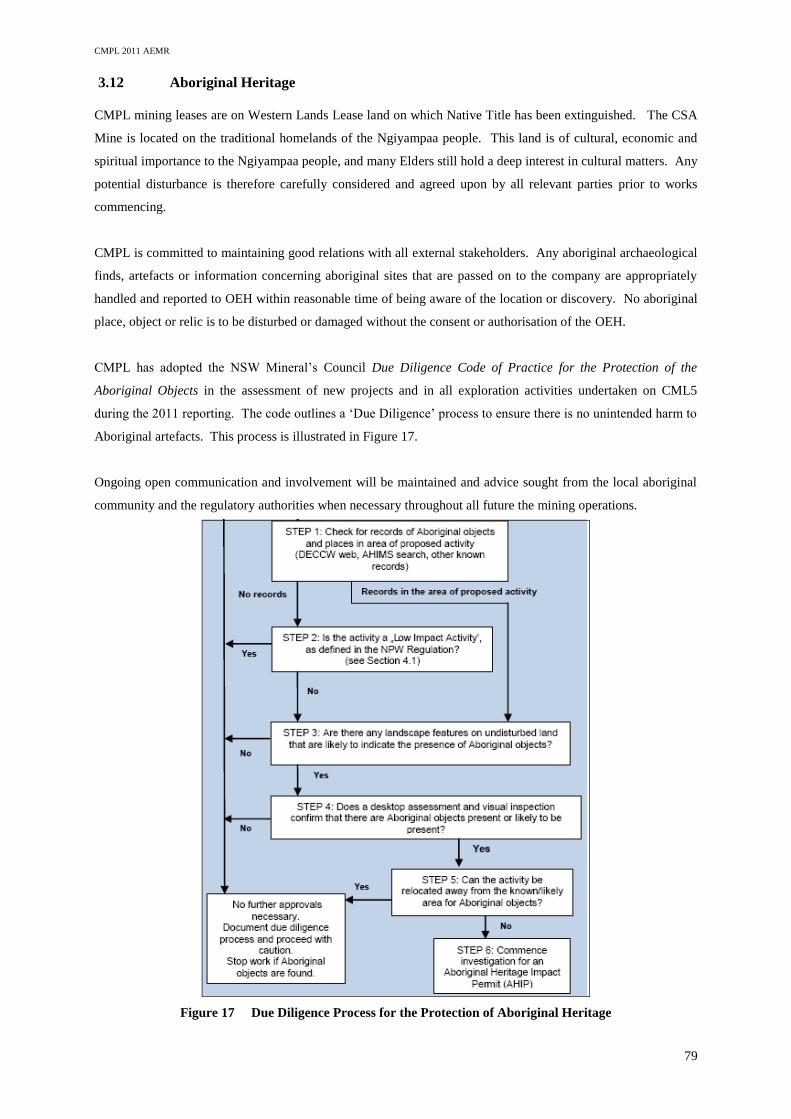
CMPL 2011 AEMR
79
3.12 Aboriginal Heritage
CMPL mining leases are on Western Lands Lease land on which Native Title has been extinguished. The CSA
Mine is located on the traditional homelands of the Ngiyampaa people. This land is of cultural, economic and
spiritual importance to the Ngiyampaa people, and many Elders still hold a deep interest in cultural matters. Any
potential disturbance is therefore carefully considered and agreed upon by all relevant parties prior to works
commencing.
CMPL is committed to maintaining good relations with all external stakeholders. Any aboriginal archaeological
finds, artefacts or information concerning aboriginal sites that are passed on to the company are appropriately
handled and reported to OEH within reasonable time of being aware of the location or discovery. No aboriginal
place, object or relic is to be disturbed or damaged without the consent or authorisation of the OEH.
CMPL has adopted the NSW Mineral’s Council Due Diligence Code of Practice for the Protection of the
Aboriginal Objects in the assessment of new projects and in all exploration activities undertaken on CML5
during the 2011 reporting. The code outlines a ‘Due Diligence’ process to ensure there is no unintended harm to
Aboriginal artefacts. This process is illustrated in Figure 17.
Ongoing open communication and involvement will be maintained and advice sought from the local aboriginal
community and the regulatory authorities when necessary throughout all future the mining operations.
Figure 17 Due Diligence Process for the Protection of Aboriginal Heritage
CMPL 2011 AEMR
80
3.13 Natural and European Heritage
Heritage items within CML5 are managed according to the relevant legislation and guidelines, namely the three
pieces of legislation governing the conservation of environmental heritage in NSW: the National Parks and
Wildlife Act 1974, the Heritage Act 1977, and the Environmental Planning and Assessment Act 1979. Any
heritage assessments required will be conducted in line with the CSC Local Environmental Plan (LEP).
There are no identified species, habitats or ecosystems within CML5 that require particular attention or
management with regards to natural heritage. No significant geological and physiographical features have been
identified on sites that are not common throughout the district.
European heritage sites on CML5 include:
Mining Quarters
The site of a miner’s quarters which was erected in the 1960’s is located on CML5 approximately 400 m
south-west of the administration building. The site once contained five houses and one swimming pool;
these were removed after mine closure in 1998. The only remaining remnants are the bitumen road, some
cleared areas with stockpiles of topsoil, and some garden beds that continue to grow exotic garden species.
“Eloura”
The “Eloura” site is located 1.5 km from the CSA Mine site. This area shows remnants of old rock
gardens and buildings. It is understood that most of the older buildings were removed during mine
upgrades in the 1950s and 1960s.
CSA Power House
The CSA powerhouse contains five HSF8 Mirrlees diesel engines, manufactured in 1951 by Mirrlees,
Bickerton and Day in Stockport, England. These engines provided the main power supply for CSA Mine
from the early 1960’s, when they were relocated to Cobar from Kempsey, until Cobar was connected to the
State power grid in 1966. The five engines represent excellent examples of medium sized stationary
engines of the mid-20th century and combined with the brush alternators they are an increasingly rare
example of turbocharged technology fitted to diesel engines, a technology previously used to provide
power in rural Australia.
The powerhouse building and engines are not listed on any statutory heritage registers (NSW State Heritage
Register, CSC LEP or the Commonwealth Heritage List). However, recognising their heritage significance
CMPL engaged specialist consultants Godden Mackay Logan (GML) in February 2011 to complete an
archival recording of both the powerhouse and the engines consistent with OEH Guidelines6. The Mirrlees
diesel engines were subsequently placed on the National Trust of NSW Heritage Register in July 2011.
6 NSW Heritage Office, June 1998, How to Prepare Archival Records of Heritage Items, Department of Urban Affairs and Planning, Sydney.
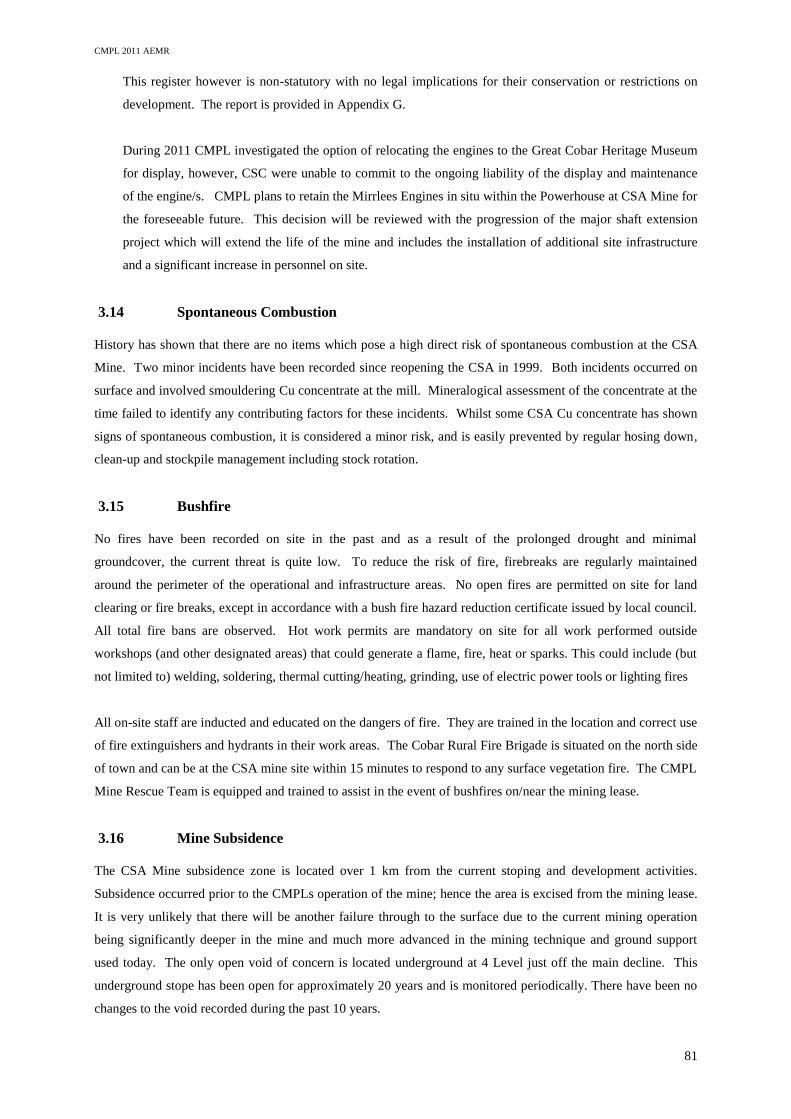
CMPL 2011 AEMR
81
This register however is non-statutory with no legal implications for their conservation or restrictions on
development. The report is provided in Appendix G.
During 2011 CMPL investigated the option of relocating the engines to the Great Cobar Heritage Museum
for display, however, CSC were unable to commit to the ongoing liability of the display and maintenance
of the engine/s. CMPL plans to retain the Mirrlees Engines in situ within the Powerhouse at CSA Mine for
the foreseeable future. This decision will be reviewed with the progression of the major shaft extension
project which will extend the life of the mine and includes the installation of additional site infrastructure
and a significant increase in personnel on site.
3.14 Spontaneous Combustion
History has shown that there are no items which pose a high direct risk of spontaneous combustion at the CSA
Mine. Two minor incidents have been recorded since reopening the CSA in 1999. Both incidents occurred on
surface and involved smouldering Cu concentrate at the mill. Mineralogical assessment of the concentrate at the
time failed to identify any contributing factors for these incidents. Whilst some CSA Cu concentrate has shown
signs of spontaneous combustion, it is considered a minor risk, and is easily prevented by regular hosing down,
clean-up and stockpile management including stock rotation.
3.15 Bushfire
No fires have been recorded on site in the past and as a result of the prolonged drought and minimal
groundcover, the current threat is quite low. To reduce the risk of fire, firebreaks are regularly maintained
around the perimeter of the operational and infrastructure areas. No open fires are permitted on site for land
clearing or fire breaks, except in accordance with a bush fire hazard reduction certificate issued by local council.
All total fire bans are observed. Hot work permits are mandatory on site for all work performed outside
workshops (and other designated areas) that could generate a flame, fire, heat or sparks. This could include (but
not limited to) welding, soldering, thermal cutting/heating, grinding, use of electric power tools or lighting fires
All on-site staff are inducted and educated on the dangers of fire. They are trained in the location and correct use
of fire extinguishers and hydrants in their work areas. The Cobar Rural Fire Brigade is situated on the north side
of town and can be at the CSA mine site within 15 minutes to respond to any surface vegetation fire. The CMPL
Mine Rescue Team is equipped and trained to assist in the event of bushfires on/near the mining lease.
3.16 Mine Subsidence
The CSA Mine subsidence zone is located over 1 km from the current stoping and development activities.
Subsidence occurred prior to the CMPLs operation of the mine; hence the area is excised from the mining lease.
It is very unlikely that there will be another failure through to the surface due to the current mining operation
being significantly deeper in the mine and much more advanced in the mining technique and ground support
used today. The only open void of concern is located underground at 4 Level just off the main decline. This
underground stope has been open for approximately 20 years and is monitored periodically. There have been no
changes to the void recorded during the past 10 years.
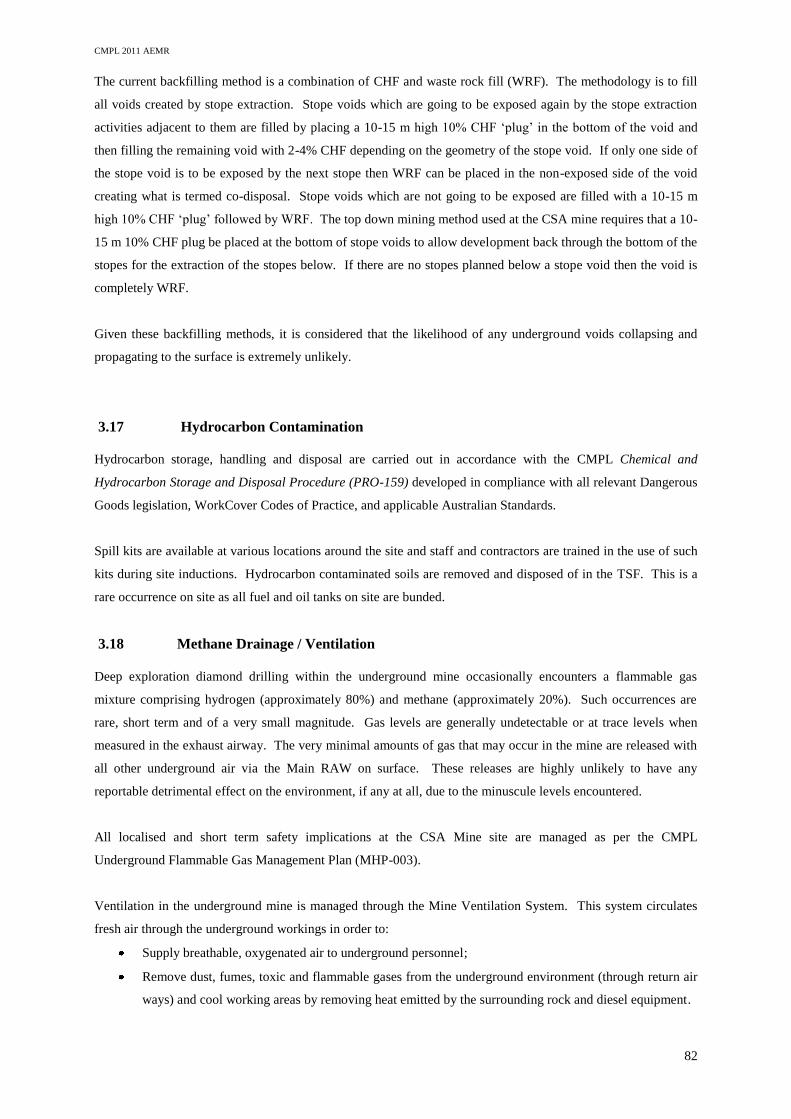
CMPL 2011 AEMR
82
The current backfilling method is a combination of CHF and waste rock fill (WRF). The methodology is to fill
all voids created by stope extraction. Stope voids which are going to be exposed again by the stope extraction
activities adjacent to them are filled by placing a 10-15 m high 10% CHF ‘plug’ in the bottom of the void and
then filling the remaining void with 2-4% CHF depending on the geometry of the stope void. If only one side of
the stope void is to be exposed by the next stope then WRF can be placed in the non-exposed side of the void
creating what is termed co-disposal. Stope voids which are not going to be exposed are filled with a 10-15 m
high 10% CHF ‘plug’ followed by WRF. The top down mining method used at the CSA mine requires that a 10-
15 m 10% CHF plug be placed at the bottom of stope voids to allow development back through the bottom of the
stopes for the extraction of the stopes below. If there are no stopes planned below a stope void then the void is
completely WRF.
Given these backfilling methods, it is considered that the likelihood of any underground voids collapsing and
propagating to the surface is extremely unlikely.
3.17 Hydrocarbon Contamination
Hydrocarbon storage, handling and disposal are carried out in accordance with the CMPL Chemical and
Hydrocarbon Storage and Disposal Procedure (PRO-159) developed in compliance with all relevant Dangerous
Goods legislation, WorkCover Codes of Practice, and applicable Australian Standards.
Spill kits are available at various locations around the site and staff and contractors are trained in the use of such
kits during site inductions. Hydrocarbon contaminated soils are removed and disposed of in the TSF. This is a
rare occurrence on site as all fuel and oil tanks on site are bunded.
3.18 Methane Drainage / Ventilation
Deep exploration diamond drilling within the underground mine occasionally encounters a flammable gas
mixture comprising hydrogen (approximately 80%) and methane (approximately 20%). Such occurrences are
rare, short term and of a very small magnitude. Gas levels are generally undetectable or at trace levels when
measured in the exhaust airway. The very minimal amounts of gas that may occur in the mine are released with
all other underground air via the Main RAW on surface. These releases are highly unlikely to have any
reportable detrimental effect on the environment, if any at all, due to the minuscule levels encountered.
All localised and short term safety implications at the CSA Mine site are managed as per the CMPL
Underground Flammable Gas Management Plan (MHP-003).
Ventilation in the underground mine is managed through the Mine Ventilation System. This system circulates
fresh air through the underground workings in order to:
Supply breathable, oxygenated air to underground personnel;
Remove dust, fumes, toxic and flammable gases from the underground environment (through return air
ways) and cool working areas by removing heat emitted by the surrounding rock and diesel equipment.
CMPL 2011 AEMR
83
3.19 Public Safety
The CSA Mine site is clearly signposted on the main access road and is fenced to prevent accidental entry. The
main entry area is subject to high security gates and an electronic tag entry system. CMPL ensures all activities
permitted on the lease do not interfere with or damage fences and that all gates within the lease areas are closed
or left open in accordance with the requirements of the landholder. The boundary fences are signposted and
monitored regularly for damage or any sign of intrusion. A perimeter inspection of the site is carried out on a
monthly basis.
All persons entering the site must undergo a site induction. Employees and contractors complete (at a minimum)
a general surface induction, with additional inductions also completed for specific work areas (e.g.
underground). All visitors, delivery drivers or short term contractors are inducted through the CMPL visitor
induction program. They are required to conform to site PPE requirements and are accompanied on site at all
times by a fully inducted CMPL or contracted employee.
3.20 Other Issues and Risks
3.20.1 NSW Dam Safety Committee Surveillance Report
Tailings Dam Surveillance Inspection reports are completed annually by qualified Dam Engineers (Golder
Associates) for submission to the NSW Dam Safety Committee (DCS). In 2011 the Surveillance Inspection took
place on the 15 February 2011 and the Annual Inspection Report was finalised for submission to the DSC in
June 2011. A copy of the full report is attached as Appendix H. A letter of acceptance of the Surveillance
Report and the proposed remediation actions was issued by the DSC in June 2011. The next annual inspection is
scheduled for February 2012.
The 2011 Surveillance Report includes 17 recommendations, listed below along with an update on works
commissioned:
1. Establish trigger levels for the new piezometers installed along the crest of the STSF perimeter
embankment:
Piezometers P51 to P57 were installed in February 2011 to monitor any changes in the phreatic surface of
the newly constructed perimeter embankment. The final construction depths and details of these
piezometers were reviewed by the Golder dam engineers and the recommended trigger levels were
determined. These are now integrated into the existing monthly monitoring program as detailed in Section
3.4.1.
2. Erosion protection should be placed on the slope at the junction between the deposition causeway and the
new perimeter embankment:
Erosion protection, including geotextile material, was placed on the slope of the junction between the
deposition causeway and the new perimeter embankment in May 2011. Ongoing monitoring of erosion has
CMPL 2011 AEMR
84
revealed the protection has withstood the 279 mm of rainfall which fell on the dam from May to December
2011.
Erosion Protection at the Junction of the Deposition Causeway and the New Perimeter Embankment
3. Erosion protection should be placed over the gully that has formed on the slope near the crest of the
intermediate berm at the STSF east embankment:
Erosion protection was placed over this area on 30 April 2011. Monitoring results to date indicate these
works are withstanding further erosion damage.
4. Future causeway raises should be constructed by placing rock fill in layers of maximum 400 mm thickness.
This should limit seepage through the causeway, the development of cracks on the causeway crest and the
potential for slumping of the slopes. The cracks on the current causeway should be managed by placement
of a rock fill or tailings buttress against each slope. Cracks should be continually monitored during the
daily inspections, and vehicular access should continue to be prohibited onto the causeway until buttressing
works are complete:
Repair works to the causeway were completed 30 April 2011 with additional rock fill material placed with a
dozer and roller. Monitoring for erosion has shown the repair works were successful, although vehicle
access is still limited as a precautionary measure. Daily monitoring will continue in 2012 and all future
causeway raises will be undertaken in accordance with the recommended construction method.
Repair Works to Causeway
5. Hairline cracks on the STSF and STSFE spillways should be repaired by a suitably experienced contractor:
These works were completed in March 2011. No further issues have been observed since.
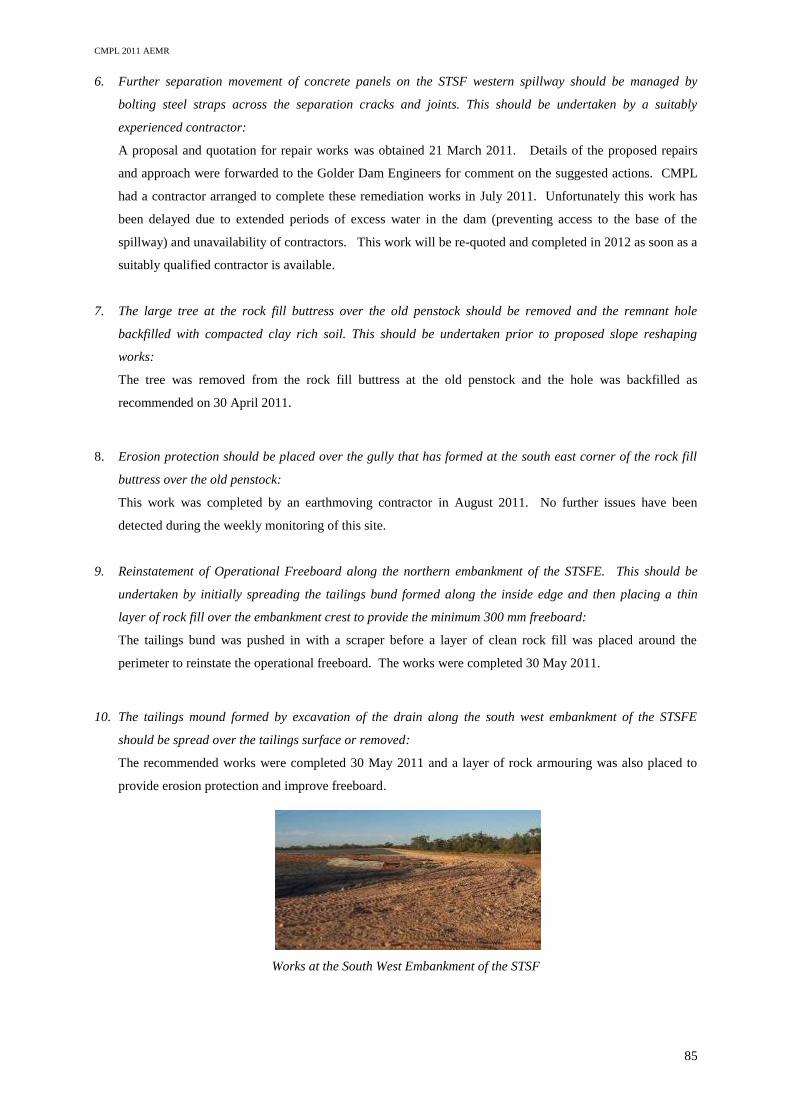
CMPL 2011 AEMR
85
6. Further separation movement of concrete panels on the STSF western spillway should be managed by
bolting steel straps across the separation cracks and joints. This should be undertaken by a suitably
experienced contractor:
A proposal and quotation for repair works was obtained 21 March 2011. Details of the proposed repairs
and approach were forwarded to the Golder Dam Engineers for comment on the suggested actions. CMPL
had a contractor arranged to complete these remediation works in July 2011. Unfortunately this work has
been delayed due to extended periods of excess water in the dam (preventing access to the base of the
spillway) and unavailability of contractors. This work will be re-quoted and completed in 2012 as soon as a
suitably qualified contractor is available.
7. The large tree at the rock fill buttress over the old penstock should be removed and the remnant hole
backfilled with compacted clay rich soil. This should be undertaken prior to proposed slope reshaping
works:
The tree was removed from the rock fill buttress at the old penstock and the hole was backfilled as
recommended on 30 April 2011.
8. Erosion protection should be placed over the gully that has formed at the south east corner of the rock fill
buttress over the old penstock:
This work was completed by an earthmoving contractor in August 2011. No further issues have been
detected during the weekly monitoring of this site.
9. Reinstatement of Operational Freeboard along the northern embankment of the STSFE. This should be
undertaken by initially spreading the tailings bund formed along the inside edge and then placing a thin
layer of rock fill over the embankment crest to provide the minimum 300 mm freeboard:
The tailings bund was pushed in with a scraper before a layer of clean rock fill was placed around the
perimeter to reinstate the operational freeboard. The works were completed 30 May 2011.
10. The tailings mound formed by excavation of the drain along the south west embankment of the STSFE
should be spread over the tailings surface or removed:
The recommended works were completed 30 May 2011 and a layer of rock armouring was also placed to
provide erosion protection and improve freeboard.
Works at the South West Embankment of the STSF
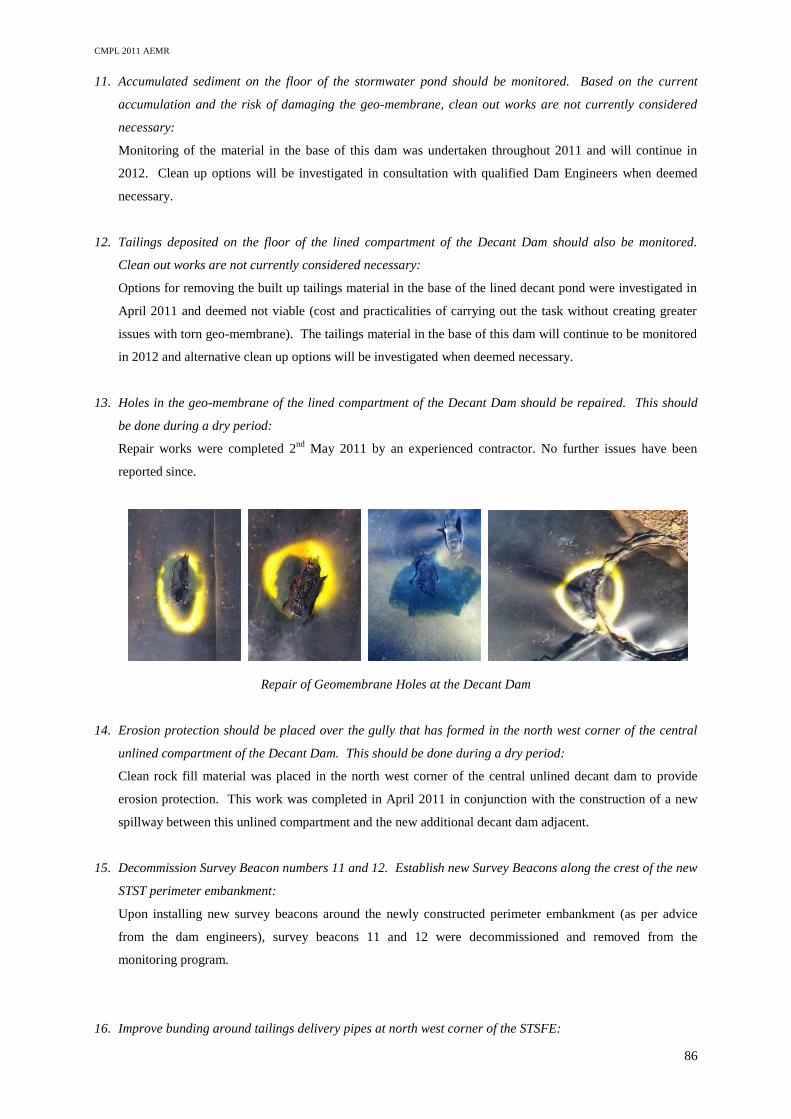
CMPL 2011 AEMR
86
11. Accumulated sediment on the floor of the stormwater pond should be monitored. Based on the current
accumulation and the risk of damaging the geo-membrane, clean out works are not currently considered
necessary:
Monitoring of the material in the base of this dam was undertaken throughout 2011 and will continue in
2012. Clean up options will be investigated in consultation with qualified Dam Engineers when deemed
necessary.
12. Tailings deposited on the floor of the lined compartment of the Decant Dam should also be monitored.
Clean out works are not currently considered necessary:
Options for removing the built up tailings material in the base of the lined decant pond were investigated in
April 2011 and deemed not viable (cost and practicalities of carrying out the task without creating greater
issues with torn geo-membrane). The tailings material in the base of this dam will continue to be monitored
in 2012 and alternative clean up options will be investigated when deemed necessary.
13. Holes in the geo-membrane of the lined compartment of the Decant Dam should be repaired. This should
be done during a dry period:
Repair works were completed 2nd
May 2011 by an experienced contractor. No further issues have been
reported since.
Repair of Geomembrane Holes at the Decant Dam
14. Erosion protection should be placed over the gully that has formed in the north west corner of the central
unlined compartment of the Decant Dam. This should be done during a dry period:
Clean rock fill material was placed in the north west corner of the central unlined decant dam to provide
erosion protection. This work was completed in April 2011 in conjunction with the construction of a new
spillway between this unlined compartment and the new additional decant dam adjacent.
15. Decommission Survey Beacon numbers 11 and 12. Establish new Survey Beacons along the crest of the new
STST perimeter embankment:
Upon installing new survey beacons around the newly constructed perimeter embankment (as per advice
from the dam engineers), survey beacons 11 and 12 were decommissioned and removed from the
monitoring program.
16. Improve bunding around tailings delivery pipes at north west corner of the STSFE:
CMPL 2011 AEMR
87
These bunding improvements were completed in July 2011 by an earthworks contractor.
17. Review survey of Booster Station area and design and implement drainage system to manage water in this
area:
This work is in progress following the survey of the Booster Station surrounding area in May 2011.
Drainage options are to be determined in discussion with the Golder Dam Engineers as part of the current
Life of Mine design for the site. This will ensure any drainage plans are consistent with future modifications
to the tailings storage perimeter embankments.
The next Annual STSF Surveillance Inspection is due on the 24 January 2012 by the Golders Dam Engineers.
3.20.2 Annual Return
The CMPL 2010-2011 Annual Return was submitted to the EPA in July 2011. For the sixth consecutive year the
CSA Mine had no EPL non-compliances. A copy of the Annual Return in provided in Appendix I.
3.20.3 Environmental Incidents
CMPL maintains a detailed internal incident database for the recording of all incidents reported on site. All
CMPL employees and contractors are trained in incident reporting as part of the site induction program. An
online event report must be submitted for any unplanned incident or event that occurs at the CSA Mine. This
includes environmental incidents, as well as any personal injury, property loss or damage, hazards and near
misses.
CMPL use the online database internal event management system InControl INX. This is an effective form of
communicating any issues or incidents on site. The degree of reporting is much greater than is statutorily
required, the general culture at the CSA to report everything is preferred over under reporting. The majority of
environmental incidents generally involve leaks and spills, which are reported regardless of whether they are
contained in a bund or not, and regardless of the material spilt (e.g. tailings, process water, backfill).
Major incidents that occur on site and therefore require notification to the Environmental Pollution Hotline
(EPA) are those involving the death or injury to fauna on or associated with the TSF, and/or incidents causing or
threatening material harm to the environment. In the event of such an incident, the EPA is notified verbally
within 24 hours, and by written report within 7 days, of the incident occurring. During 2011 four EPA
reportable incidents occurred, all related to kangaroo miring’s in the STSF.
Overall there was a rise in fauna deaths from 2010 (5) to 2011 (7). Two of these incidents resulted from bats
becoming entangled in a fence and a belt. One incident involved the drowning of a goat after it became stuck in
a sump whilst attempting to access water, and four were considered reportable incidents involving the death of a
kangaroo in the TSF. Verbal and written reports were provided as per CMPLs EPL requirements to the OEH
(EPA).
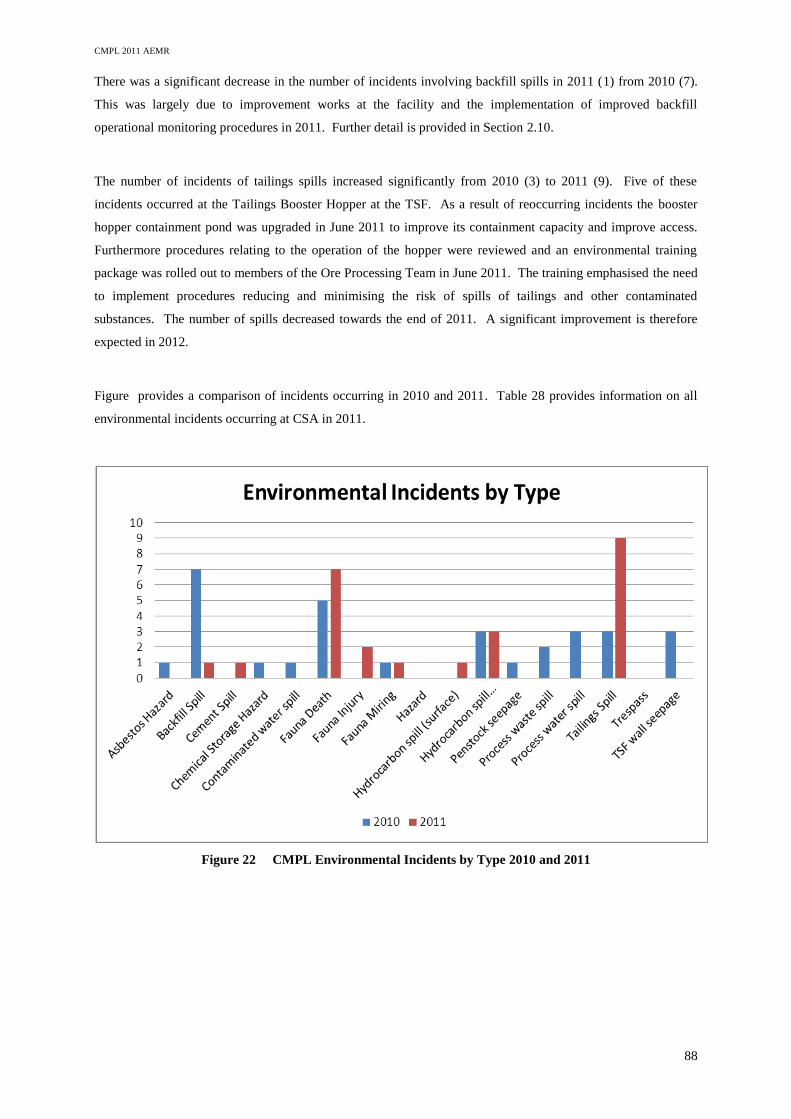
CMPL 2011 AEMR
88
There was a significant decrease in the number of incidents involving backfill spills in 2011 (1) from 2010 (7).
This was largely due to improvement works at the facility and the implementation of improved backfill
operational monitoring procedures in 2011. Further detail is provided in Section 2.10.
The number of incidents of tailings spills increased significantly from 2010 (3) to 2011 (9). Five of these
incidents occurred at the Tailings Booster Hopper at the TSF. As a result of reoccurring incidents the booster
hopper containment pond was upgraded in June 2011 to improve its containment capacity and improve access.
Furthermore procedures relating to the operation of the hopper were reviewed and an environmental training
package was rolled out to members of the Ore Processing Team in June 2011. The training emphasised the need
to implement procedures reducing and minimising the risk of spills of tailings and other contaminated
substances. The number of spills decreased towards the end of 2011. A significant improvement is therefore
expected in 2012.
Figure provides a comparison of incidents occurring in 2010 and 2011. Table 28 provides information on all
environmental incidents occurring at CSA in 2011.
Figure 22 CMPL Environmental Incidents by Type 2010 and 2011
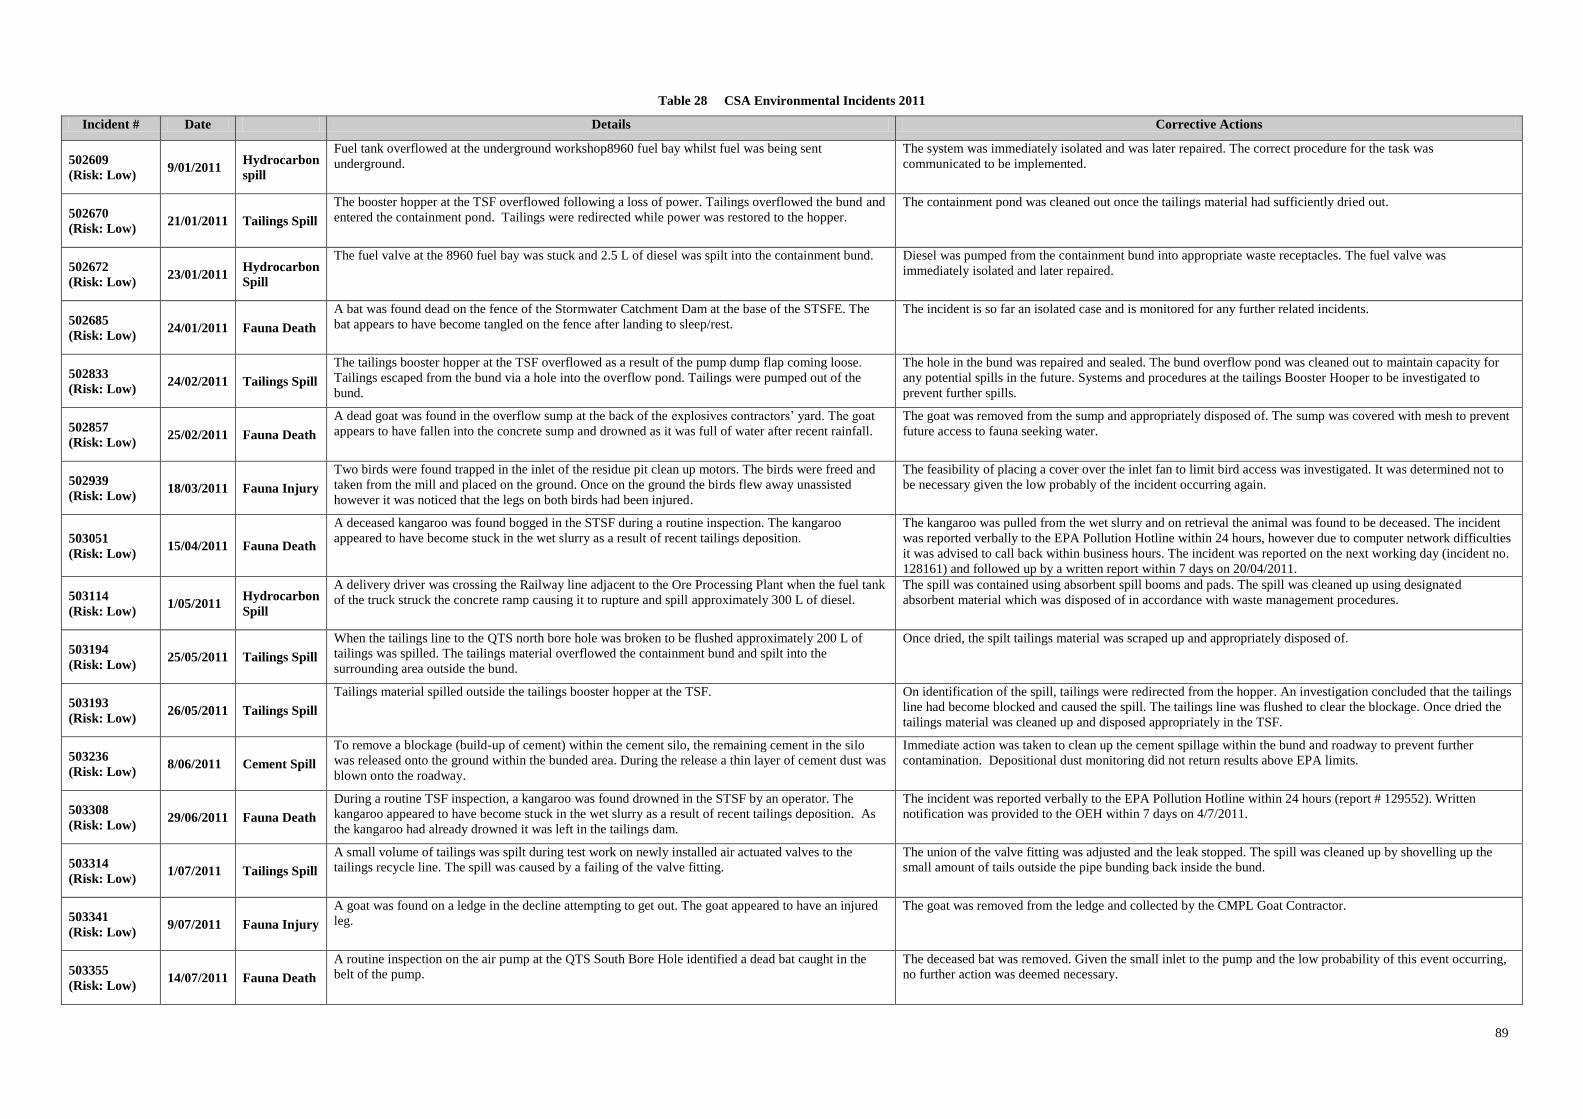
89
Table 28 CSA Environmental Incidents 2011
Incident # Date Details Corrective Actions
502609
(Risk: Low) 9/01/2011
Hydrocarbon
spill
Fuel tank overflowed at the underground workshop8960 fuel bay whilst fuel was being sent
underground.
The system was immediately isolated and was later repaired. The correct procedure for the task was
communicated to be implemented.
502670
(Risk: Low) 21/01/2011 Tailings Spill
The booster hopper at the TSF overflowed following a loss of power. Tailings overflowed the bund and
entered the containment pond. Tailings were redirected while power was restored to the hopper.
The containment pond was cleaned out once the tailings material had sufficiently dried out.
502672
(Risk: Low) 23/01/2011
Hydrocarbon
Spill
The fuel valve at the 8960 fuel bay was stuck and 2.5 L of diesel was spilt into the containment bund. Diesel was pumped from the containment bund into appropriate waste receptacles. The fuel valve was
immediately isolated and later repaired.
502685
(Risk: Low) 24/01/2011 Fauna Death
A bat was found dead on the fence of the Stormwater Catchment Dam at the base of the STSFE. The
bat appears to have become tangled on the fence after landing to sleep/rest.
The incident is so far an isolated case and is monitored for any further related incidents.
502833
(Risk: Low) 24/02/2011 Tailings Spill
The tailings booster hopper at the TSF overflowed as a result of the pump dump flap coming loose.
Tailings escaped from the bund via a hole into the overflow pond. Tailings were pumped out of the
bund.
The hole in the bund was repaired and sealed. The bund overflow pond was cleaned out to maintain capacity for
any potential spills in the future. Systems and procedures at the tailings Booster Hooper to be investigated to
prevent further spills.
502857
(Risk: Low) 25/02/2011 Fauna Death
A dead goat was found in the overflow sump at the back of the explosives contractors’ yard. The goat
appears to have fallen into the concrete sump and drowned as it was full of water after recent rainfall.
The goat was removed from the sump and appropriately disposed of. The sump was covered with mesh to prevent
future access to fauna seeking water.
502939
(Risk: Low) 18/03/2011 Fauna Injury
Two birds were found trapped in the inlet of the residue pit clean up motors. The birds were freed and
taken from the mill and placed on the ground. Once on the ground the birds flew away unassisted
however it was noticed that the legs on both birds had been injured.
The feasibility of placing a cover over the inlet fan to limit bird access was investigated. It was determined not to
be necessary given the low probably of the incident occurring again.
503051
(Risk: Low) 15/04/2011 Fauna Death
A deceased kangaroo was found bogged in the STSF during a routine inspection. The kangaroo
appeared to have become stuck in the wet slurry as a result of recent tailings deposition.
The kangaroo was pulled from the wet slurry and on retrieval the animal was found to be deceased. The incident
was reported verbally to the EPA Pollution Hotline within 24 hours, however due to computer network difficulties
it was advised to call back within business hours. The incident was reported on the next working day (incident no.
128161) and followed up by a written report within 7 days on 20/04/2011.
503114
(Risk: Low) 1/05/2011
Hydrocarbon
Spill
A delivery driver was crossing the Railway line adjacent to the Ore Processing Plant when the fuel tank
of the truck struck the concrete ramp causing it to rupture and spill approximately 300 L of diesel.
The spill was contained using absorbent spill booms and pads. The spill was cleaned up using designated
absorbent material which was disposed of in accordance with waste management procedures.
503194
(Risk: Low) 25/05/2011 Tailings Spill
When the tailings line to the QTS north bore hole was broken to be flushed approximately 200 L of
tailings was spilled. The tailings material overflowed the containment bund and spilt into the
surrounding area outside the bund.
Once dried, the spilt tailings material was scraped up and appropriately disposed of.
503193
(Risk: Low) 26/05/2011 Tailings Spill
Tailings material spilled outside the tailings booster hopper at the TSF. On identification of the spill, tailings were redirected from the hopper. An investigation concluded that the tailings
line had become blocked and caused the spill. The tailings line was flushed to clear the blockage. Once dried the
tailings material was cleaned up and disposed appropriately in the TSF.
503236
(Risk: Low) 8/06/2011 Cement Spill
To remove a blockage (build-up of cement) within the cement silo, the remaining cement in the silo
was released onto the ground within the bunded area. During the release a thin layer of cement dust was
blown onto the roadway.
Immediate action was taken to clean up the cement spillage within the bund and roadway to prevent further
contamination. Depositional dust monitoring did not return results above EPA limits.
503308
(Risk: Low) 29/06/2011 Fauna Death
During a routine TSF inspection, a kangaroo was found drowned in the STSF by an operator. The
kangaroo appeared to have become stuck in the wet slurry as a result of recent tailings deposition. As
the kangaroo had already drowned it was left in the tailings dam.
The incident was reported verbally to the EPA Pollution Hotline within 24 hours (report # 129552). Written
notification was provided to the OEH within 7 days on 4/7/2011.
503314
(Risk: Low) 1/07/2011 Tailings Spill
A small volume of tailings was spilt during test work on newly installed air actuated valves to the
tailings recycle line. The spill was caused by a failing of the valve fitting.
The union of the valve fitting was adjusted and the leak stopped. The spill was cleaned up by shovelling up the
small amount of tails outside the pipe bunding back inside the bund.
503341
(Risk: Low) 9/07/2011 Fauna Injury
A goat was found on a ledge in the decline attempting to get out. The goat appeared to have an injured
leg.
The goat was removed from the ledge and collected by the CMPL Goat Contractor.
503355
(Risk: Low) 14/07/2011 Fauna Death
A routine inspection on the air pump at the QTS South Bore Hole identified a dead bat caught in the
belt of the pump.
The deceased bat was removed. Given the small inlet to the pump and the low probability of this event occurring,
no further action was deemed necessary.
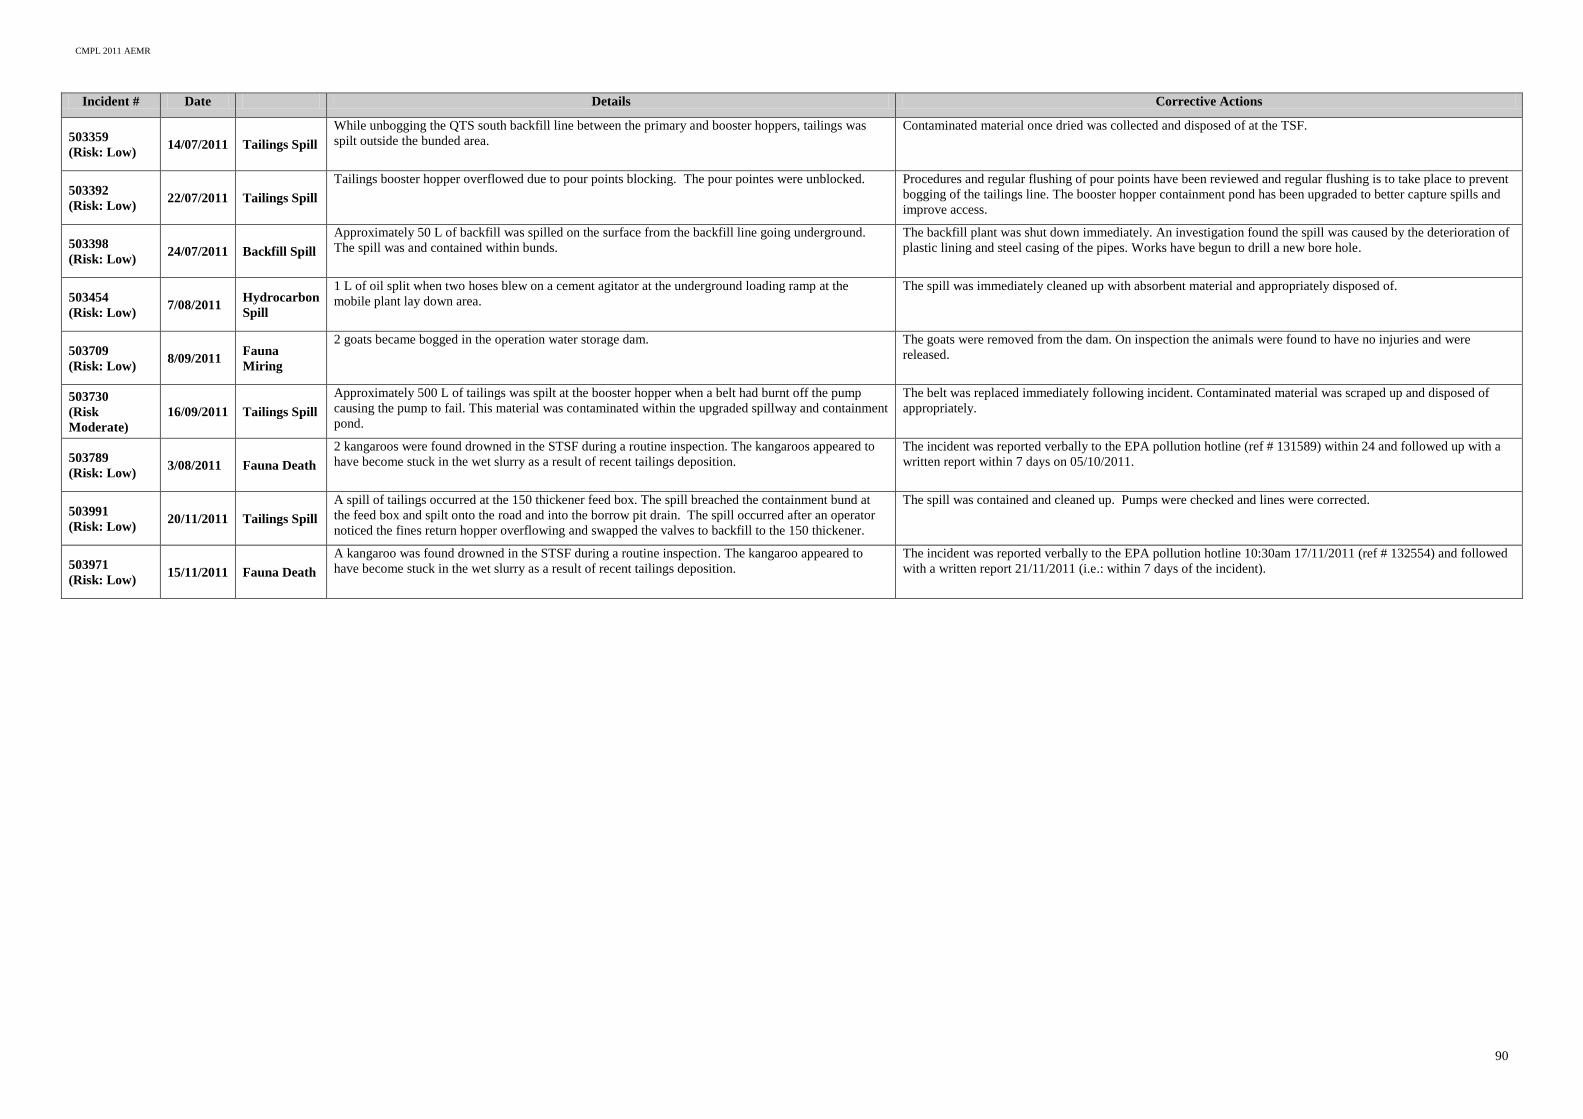
CMPL 2011 AEMR
90
Incident # Date Details Corrective Actions
503359
(Risk: Low) 14/07/2011 Tailings Spill
While unbogging the QTS south backfill line between the primary and booster hoppers, tailings was
spilt outside the bunded area.
Contaminated material once dried was collected and disposed of at the TSF.
503392
(Risk: Low) 22/07/2011 Tailings Spill
Tailings booster hopper overflowed due to pour points blocking. The pour pointes were unblocked. Procedures and regular flushing of pour points have been reviewed and regular flushing is to take place to prevent
bogging of the tailings line. The booster hopper containment pond has been upgraded to better capture spills and
improve access.
503398
(Risk: Low) 24/07/2011 Backfill Spill
Approximately 50 L of backfill was spilled on the surface from the backfill line going underground.
The spill was and contained within bunds.
The backfill plant was shut down immediately. An investigation found the spill was caused by the deterioration of
plastic lining and steel casing of the pipes. Works have begun to drill a new bore hole.
503454
(Risk: Low) 7/08/2011
Hydrocarbon
Spill
1 L of oil split when two hoses blew on a cement agitator at the underground loading ramp at the
mobile plant lay down area.
The spill was immediately cleaned up with absorbent material and appropriately disposed of.
503709
(Risk: Low) 8/09/2011
Fauna
Miring
2 goats became bogged in the operation water storage dam. The goats were removed from the dam. On inspection the animals were found to have no injuries and were
released.
503730
(Risk
Moderate)
16/09/2011 Tailings Spill
Approximately 500 L of tailings was spilt at the booster hopper when a belt had burnt off the pump
causing the pump to fail. This material was contaminated within the upgraded spillway and containment
pond.
The belt was replaced immediately following incident. Contaminated material was scraped up and disposed of
appropriately.
503789
(Risk: Low) 3/08/2011 Fauna Death
2 kangaroos were found drowned in the STSF during a routine inspection. The kangaroos appeared to
have become stuck in the wet slurry as a result of recent tailings deposition.
The incident was reported verbally to the EPA pollution hotline (ref # 131589) within 24 and followed up with a
written report within 7 days on 05/10/2011.
503991
(Risk: Low) 20/11/2011 Tailings Spill
A spill of tailings occurred at the 150 thickener feed box. The spill breached the containment bund at
the feed box and spilt onto the road and into the borrow pit drain. The spill occurred after an operator
noticed the fines return hopper overflowing and swapped the valves to backfill to the 150 thickener.
The spill was contained and cleaned up. Pumps were checked and lines were corrected.
503971
(Risk: Low) 15/11/2011 Fauna Death
A kangaroo was found drowned in the STSF during a routine inspection. The kangaroo appeared to
have become stuck in the wet slurry as a result of recent tailings deposition.
The incident was reported verbally to the EPA pollution hotline 10:30am 17/11/2011 (ref # 132554) and followed
with a written report 21/11/2011 (i.e.: within 7 days of the incident).
91
4 COMMUNITY RELATIONS
The CSA Mine is an owner operated mine currently employing 349 permanent staff (including apprentices) and
on average 99 contractors. The mine is operated on a 24 hour basis, 365 days a year. The majority of
underground and mill employees do shift work on a four-on four-off roster system, whilst day staff
(management, administration, maintenance) work 5 days per week. The bulk of the CSA workforce lives within
the Cobar Township, contributing a considerable flow on economic benefit to the local community and local
economy.
The CSA Mine apprenticeship scheme continued into 2011 with 10 apprentices employed at the end of the
reporting period. Two apprentices successfully completed their apprenticeships at the end of 2011.
In addition to this program, a number of years ago CMPL provided a scholarship in Mining Engineering to two
local school students. In November 2010 the first of the two students graduated from the University of
Wollongong with a Bachelor Degree in Mining Engineering. He commenced full time employment with CMPL
as a Graduate Mining Engineer at the end of 2010. The second student completed his degree in November 2011
and has since commenced work as a full time Graduate Mining Engineer at CSA Mine. The CSA Mine also
hosts visitors from several universities for vocational work experience and major projects, during 2011 a total of
8 students were employed at the CSA Mine.
CMPL continued its partnership with the University of Tasmania during 2011. A project by a Geology PhD
student titled “Controls on mineralization, including sulphide mineralogy, at the CSA Mine, Cobar NSW”
commenced in 2010 and was continued throughout 2011. The PhD student and the CSA Geology team are
attempting to improve the success rate from drilling within and around the mine and regional exploration. The
main aim of the project is to deliver an enhanced and more predictive model of the CSA Mine via understanding
the controls on mineralization (including the development of an understanding of the spatial variability of
sulphide mineralogy and the dependence of sulphide mineralogy on mineralization controls). The project will
continue in 2012.
4.1 Environmental Complaints
In compliance with the CSA Mine’s EPL conditions, CMPL maintains a 24 hour telephone pollution complaints
line through the CMPL reception switchboard. The phone number is advertised to the local community via the
local newspapers and the White Pages. All environmental complaints are directed to the Health, Safety &
Environment Team, and are recorded as per the CMPL Environmental Complaints Procedure and Record Form.
No complaints were received from the public during 2011.
4.2 Community Liaison
Community support is essential in maintaining the CSA Mine’s future operations in Cobar. To secure ongoing
links with the community, CSA Mine regularly communicates its operational plans to the local community. This
is undertaken through:
Ongoing liaison with CSC;
CMPL 2011 AEMR
92
Providing open and honest feedback to the workforce and contracting companies;
Local newspaper media releases;
Involvement with key community groups and projects.
Examples of CMPL’s involvement in the community are detailed in the following sections.
4.2.1 Expanding Cobar’s Airline Service
CMPL participated as members of a working group with CSC, Peak Gold Mine and Endeavor Mine to establish
a regular air service to and from Cobar. The Cobar community lost its previous airline service in December
2008 after the service provider retired its Cobar to Dubbo route.
The local mines in partnership with CSC were successful in securing Brindabella Airlines to conduct an initial 4
month feasibility trial in September 2010. This resulted in Brindabella Airlines providing return Sydney to
Cobar flights 3 days per week since September 2010 through to September 2011. From October 2011 and
continuing in 2012 the air service flies twice per day Monday to Friday. This service is not only essential to the
local mining industry but it also provides the opportunity to have specialist health professionals service the
Cobar Community on a regular basis.
4.2.2 CSA Mine Rehabilitation Environment Management Plan (REMP) Community
Consultation Meeting
In July 2011 CMPL engaged an external consultant from AECOM to assist in the consultation process for the
development of the first CSA Mine Rehabilitation and Environmental Management Plan (REMP)
To underpin the REMP and consultation process CMPL developed land use objectives with the aim to:
Reach a point where the land can be relinquished in a timely fashion;
Minimise closure costs to CMPL;
Maximise potential return on the land;
Minimise environmental impact;
Minimise the risk to public safety to the satisfaction of relevant stakeholders; and
Meet current regulatory requirements (as a minimum).
Following the regulator consultation process, CMPL commissioned AECOM to assist with the engagement of
external stakeholders. The focus of the external stakeholder engagement program was to collect and collate
stakeholder ideas regarding final land use of operational and nonoperational lands owned or managed by CMPL.
To achieve this all stakeholders were informed in writing of CMPL’s intention to develop a REMP, and were
requested to provide comments and suggestions regarding the future of the mine. In addition, community
members were invited to a meeting held by CMPL in August 2011 to discuss the future of the mine. Invites were
distributed via an advertisement in the local paper and individual written and verbal invitations to specific
stakeholder groups such as local councillors, the Cobar Business Association, local high and primary schools,
environmental and social groups, local government departments (such as the Western Catchment Management
Authority), local aboriginal groups, other surrounding mines, and rural landholders and neighbours. Stakeholders
in attendance at the meeting included:
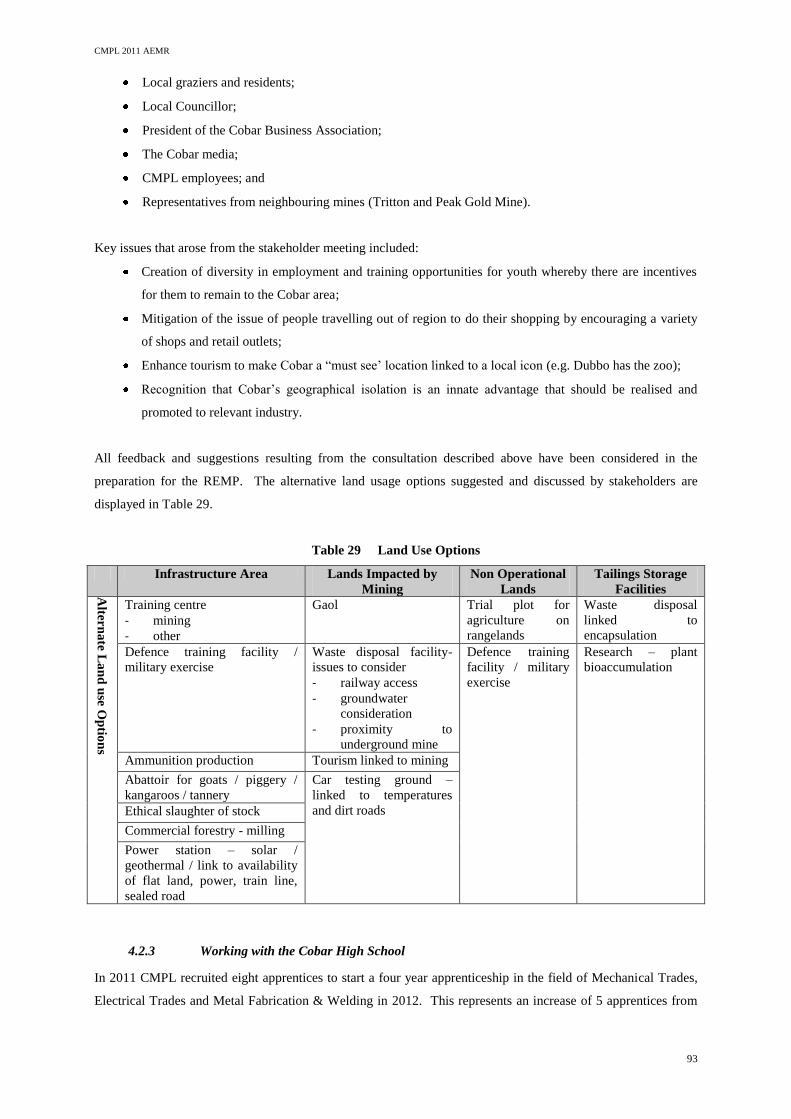
CMPL 2011 AEMR
93
Local graziers and residents;
Local Councillor;
President of the Cobar Business Association;
The Cobar media;
CMPL employees; and
Representatives from neighbouring mines (Tritton and Peak Gold Mine).
Key issues that arose from the stakeholder meeting included:
Creation of diversity in employment and training opportunities for youth whereby there are incentives
for them to remain to the Cobar area;
Mitigation of the issue of people travelling out of region to do their shopping by encouraging a variety
of shops and retail outlets;
Enhance tourism to make Cobar a “must see’ location linked to a local icon (e.g. Dubbo has the zoo);
Recognition that Cobar’s geographical isolation is an innate advantage that should be realised and
promoted to relevant industry.
All feedback and suggestions resulting from the consultation described above have been considered in the
preparation for the REMP. The alternative land usage options suggested and discussed by stakeholders are
displayed in Table 29.
Table 29 Land Use Options
Infrastructure Area Lands Impacted by
Mining
Non Operational
Lands
Tailings Storage
Facilities Alter
na
te La
nd
use
Op
tion
s
Training centre
- mining
- other
Gaol Trial plot for
agriculture on
rangelands
Waste disposal
linked to
encapsulation
Defence training facility /
military exercise
Waste disposal facility-
issues to consider
- railway access
- groundwater
consideration
- proximity to
underground mine
Defence training
facility / military
exercise
Research – plant
bioaccumulation
Ammunition production Tourism linked to mining
Abattoir for goats / piggery /
kangaroos / tannery
Car testing ground –
linked to temperatures
and dirt roads Ethical slaughter of stock
Commercial forestry - milling
Power station – solar /
geothermal / link to availability
of flat land, power, train line,
sealed road
4.2.3 Working with the Cobar High School
In 2011 CMPL recruited eight apprentices to start a four year apprenticeship in the field of Mechanical Trades,
Electrical Trades and Metal Fabrication & Welding in 2012. This represents an increase of 5 apprentices from
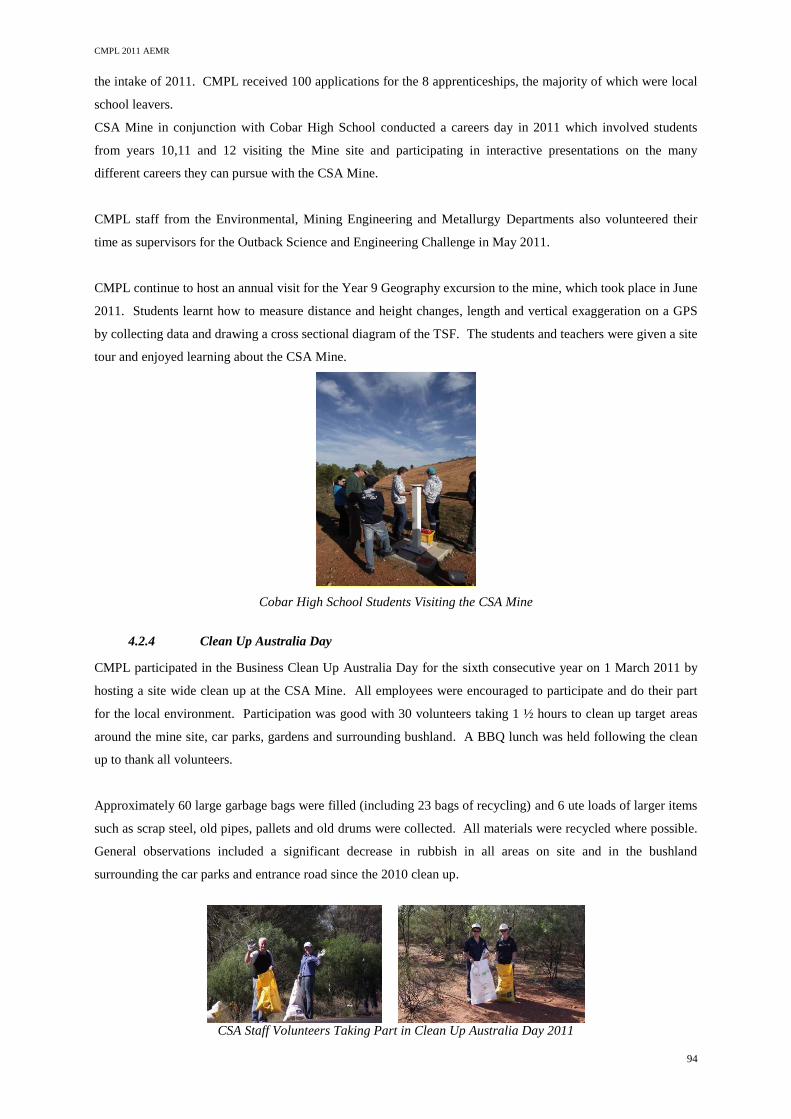
CMPL 2011 AEMR
94
the intake of 2011. CMPL received 100 applications for the 8 apprenticeships, the majority of which were local
school leavers.
CSA Mine in conjunction with Cobar High School conducted a careers day in 2011 which involved students
from years 10,11 and 12 visiting the Mine site and participating in interactive presentations on the many
different careers they can pursue with the CSA Mine.
CMPL staff from the Environmental, Mining Engineering and Metallurgy Departments also volunteered their
time as supervisors for the Outback Science and Engineering Challenge in May 2011.
CMPL continue to host an annual visit for the Year 9 Geography excursion to the mine, which took place in June
2011. Students learnt how to measure distance and height changes, length and vertical exaggeration on a GPS
by collecting data and drawing a cross sectional diagram of the TSF. The students and teachers were given a site
tour and enjoyed learning about the CSA Mine.
Cobar High School Students Visiting the CSA Mine
4.2.4 Clean Up Australia Day
CMPL participated in the Business Clean Up Australia Day for the sixth consecutive year on 1 March 2011 by
hosting a site wide clean up at the CSA Mine. All employees were encouraged to participate and do their part
for the local environment. Participation was good with 30 volunteers taking 1 ½ hours to clean up target areas
around the mine site, car parks, gardens and surrounding bushland. A BBQ lunch was held following the clean
up to thank all volunteers.
Approximately 60 large garbage bags were filled (including 23 bags of recycling) and 6 ute loads of larger items
such as scrap steel, old pipes, pallets and old drums were collected. All materials were recycled where possible.
General observations included a significant decrease in rubbish in all areas on site and in the bushland
surrounding the car parks and entrance road since the 2010 clean up.
CSA Staff Volunteers Taking Part in Clean Up Australia Day 2011
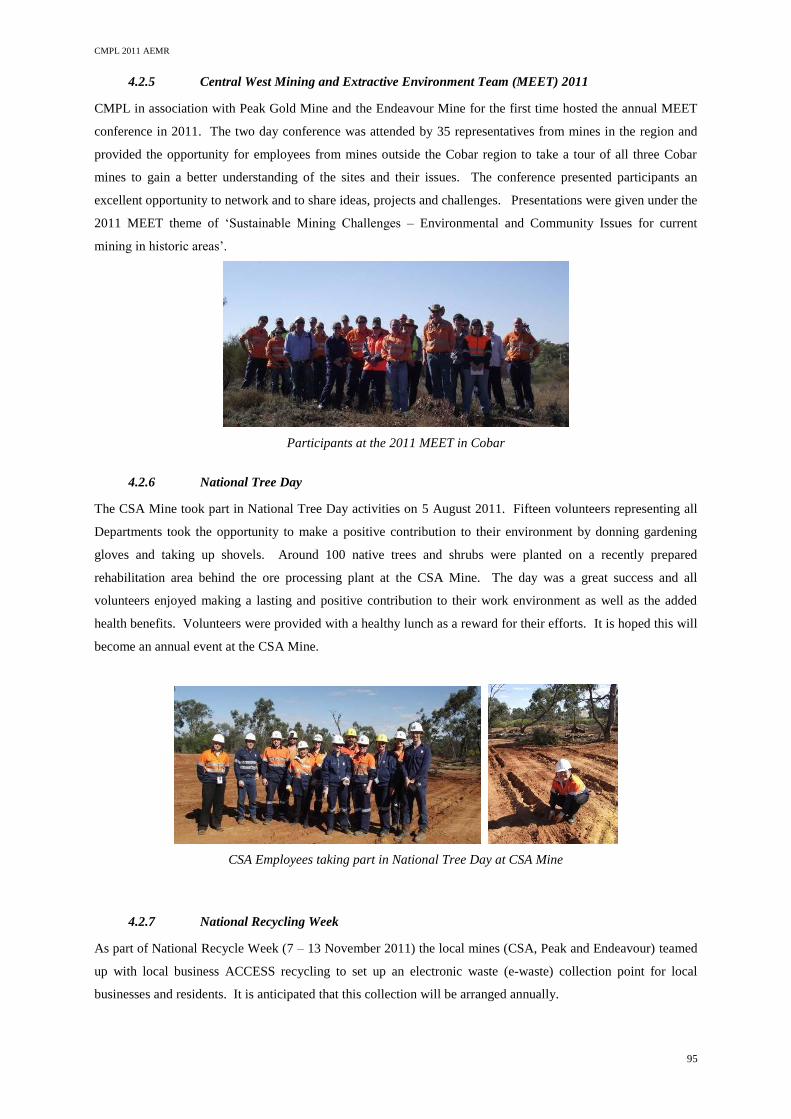
CMPL 2011 AEMR
95
4.2.5 Central West Mining and Extractive Environment Team (MEET) 2011
CMPL in association with Peak Gold Mine and the Endeavour Mine for the first time hosted the annual MEET
conference in 2011. The two day conference was attended by 35 representatives from mines in the region and
provided the opportunity for employees from mines outside the Cobar region to take a tour of all three Cobar
mines to gain a better understanding of the sites and their issues. The conference presented participants an
excellent opportunity to network and to share ideas, projects and challenges. Presentations were given under the
2011 MEET theme of ‘Sustainable Mining Challenges – Environmental and Community Issues for current
mining in historic areas’.
Participants at the 2011 MEET in Cobar
4.2.6 National Tree Day
The CSA Mine took part in National Tree Day activities on 5 August 2011. Fifteen volunteers representing all
Departments took the opportunity to make a positive contribution to their environment by donning gardening
gloves and taking up shovels. Around 100 native trees and shrubs were planted on a recently prepared
rehabilitation area behind the ore processing plant at the CSA Mine. The day was a great success and all
volunteers enjoyed making a lasting and positive contribution to their work environment as well as the added
health benefits. Volunteers were provided with a healthy lunch as a reward for their efforts. It is hoped this will
become an annual event at the CSA Mine.
CSA Employees taking part in National Tree Day at CSA Mine
4.2.7 National Recycling Week
As part of National Recycle Week (7 – 13 November 2011) the local mines (CSA, Peak and Endeavour) teamed
up with local business ACCESS recycling to set up an electronic waste (e-waste) collection point for local
businesses and residents. It is anticipated that this collection will be arranged annually.
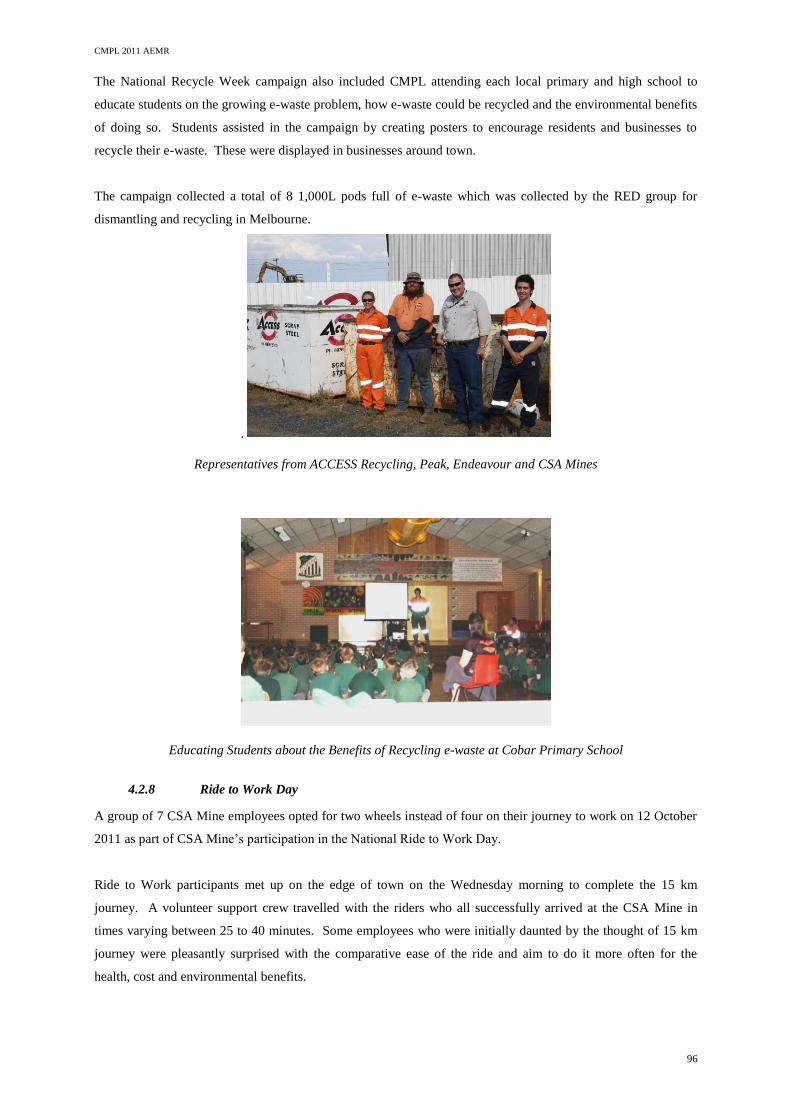
CMPL 2011 AEMR
96
The National Recycle Week campaign also included CMPL attending each local primary and high school to
educate students on the growing e-waste problem, how e-waste could be recycled and the environmental benefits
of doing so. Students assisted in the campaign by creating posters to encourage residents and businesses to
recycle their e-waste. These were displayed in businesses around town.
The campaign collected a total of 8 1,000L pods full of e-waste which was collected by the RED group for
dismantling and recycling in Melbourne.
.
Representatives from ACCESS Recycling, Peak, Endeavour and CSA Mines
Educating Students about the Benefits of Recycling e-waste at Cobar Primary School
4.2.8 Ride to Work Day
A group of 7 CSA Mine employees opted for two wheels instead of four on their journey to work on 12 October
2011 as part of CSA Mine’s participation in the National Ride to Work Day.
Ride to Work participants met up on the edge of town on the Wednesday morning to complete the 15 km
journey. A volunteer support crew travelled with the riders who all successfully arrived at the CSA Mine in
times varying between 25 to 40 minutes. Some employees who were initially daunted by the thought of 15 km
journey were pleasantly surprised with the comparative ease of the ride and aim to do it more often for the
health, cost and environmental benefits.
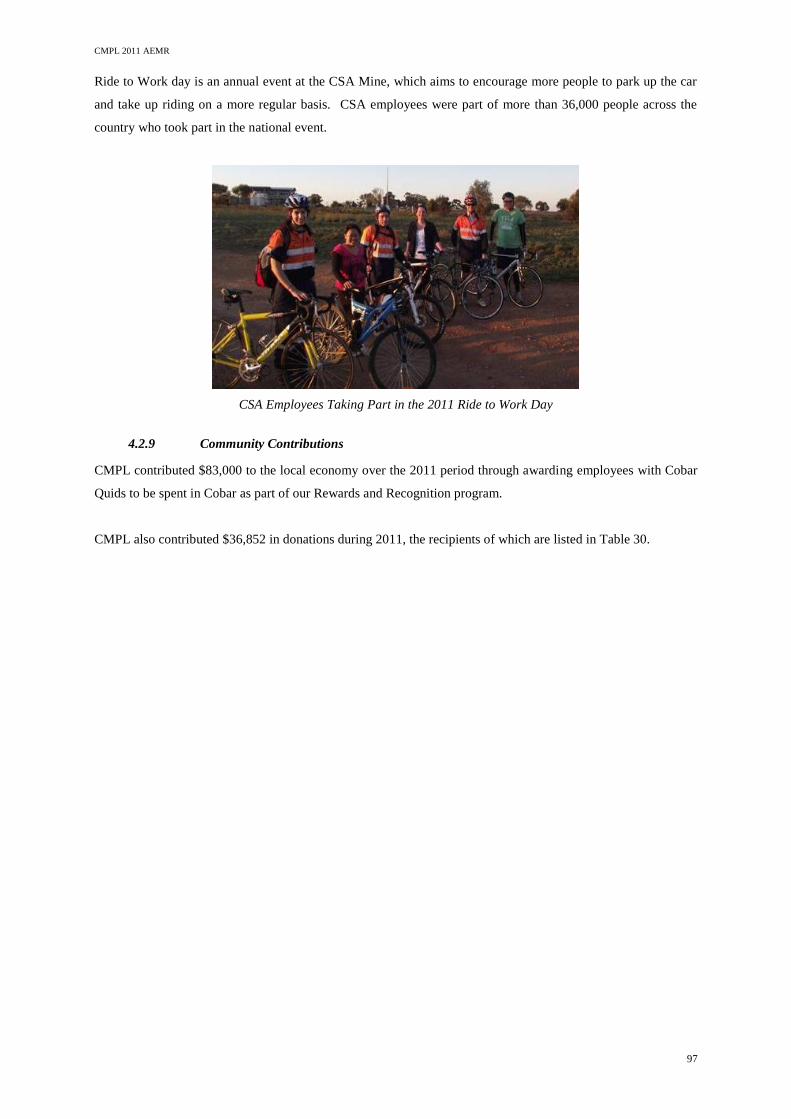
CMPL 2011 AEMR
97
Ride to Work day is an annual event at the CSA Mine, which aims to encourage more people to park up the car
and take up riding on a more regular basis. CSA employees were part of more than 36,000 people across the
country who took part in the national event.
CSA Employees Taking Part in the 2011 Ride to Work Day
4.2.9 Community Contributions
CMPL contributed $83,000 to the local economy over the 2011 period through awarding employees with Cobar
Quids to be spent in Cobar as part of our Rewards and Recognition program.
CMPL also contributed $36,852 in donations during 2011, the recipients of which are listed in Table 30.
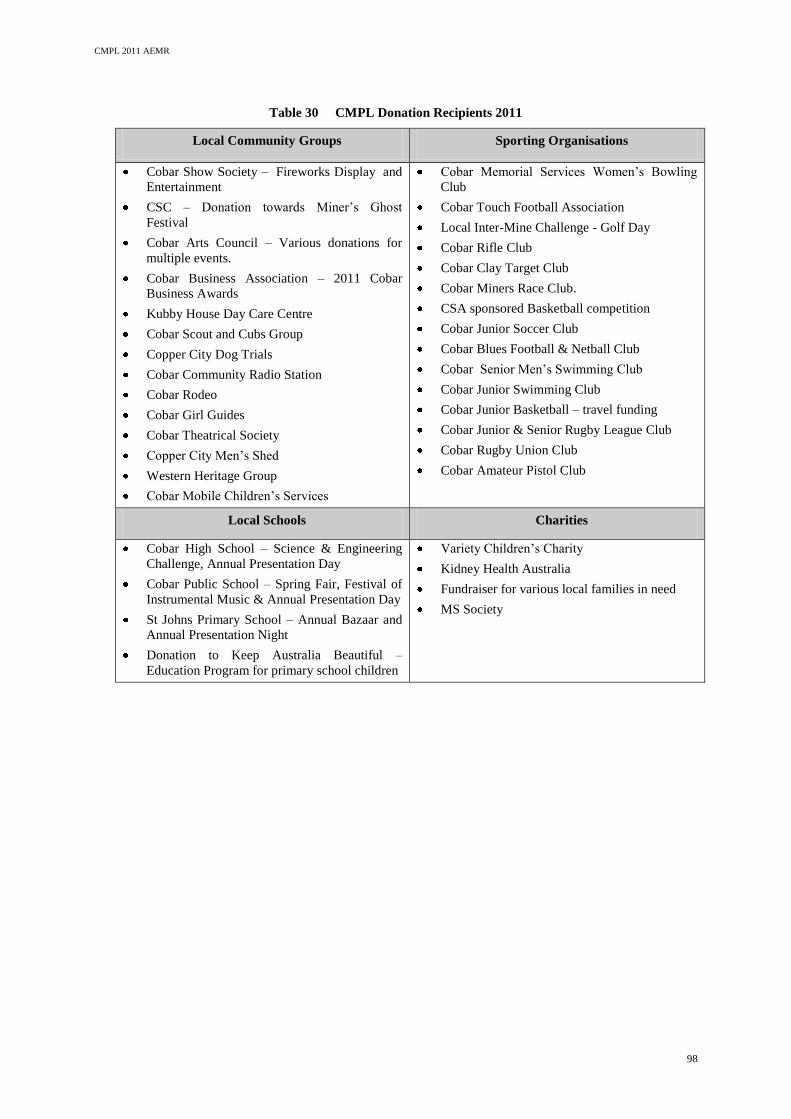
CMPL 2011 AEMR
98
Table 30 CMPL Donation Recipients 2011
Local Community Groups Sporting Organisations
Cobar Show Society – Fireworks Display and
Entertainment
CSC – Donation towards Miner’s Ghost
Festival
Cobar Arts Council – Various donations for
multiple events.
Cobar Business Association – 2011 Cobar
Business Awards
Kubby House Day Care Centre
Cobar Scout and Cubs Group
Copper City Dog Trials
Cobar Community Radio Station
Cobar Rodeo
Cobar Girl Guides
Cobar Theatrical Society
Copper City Men’s Shed
Western Heritage Group
Cobar Mobile Children’s Services
Cobar Memorial Services Women’s Bowling
Club
Cobar Touch Football Association
Local Inter-Mine Challenge - Golf Day
Cobar Rifle Club
Cobar Clay Target Club
Cobar Miners Race Club.
CSA sponsored Basketball competition
Cobar Junior Soccer Club
Cobar Blues Football & Netball Club
Cobar Senior Men’s Swimming Club
Cobar Junior Swimming Club
Cobar Junior Basketball – travel funding
Cobar Junior & Senior Rugby League Club
Cobar Rugby Union Club
Cobar Amateur Pistol Club
Local Schools Charities
Cobar High School – Science & Engineering
Challenge, Annual Presentation Day
Cobar Public School – Spring Fair, Festival of
Instrumental Music & Annual Presentation Day
St Johns Primary School – Annual Bazaar and
Annual Presentation Night
Donation to Keep Australia Beautiful –
Education Program for primary school children
Variety Children’s Charity
Kidney Health Australia
Fundraiser for various local families in need
MS Society
CMPL 2011 AEMR
99
5 REHABILITATION
CMPL Mining Lease conditions state that land disturbed must be rehabilitated to a stable and permanent form
suitable for a subsequent land use that is compatible with the surrounding land and land use requirements.
CSA Mine is currently in the operational stage of mining with most surface disturbance already taken place and
the mine in steady production. All of the planned expansion and upgrade works that are due to take place over
2012 and 2013 at the CSA Mine are simply replacements which will not generate any significant additional
disturbance. The sections below detail what CMPL is doing to ensure the Mining Lease rehabilitation
requirements are met.
5.1 Buildings
Significant clean up works were carried out over 2011 with the removal of a number of redundant buildings and
infrastructure from the surface working areas. An experienced demolition and scrap steel contractor was
commissioned over a 2 month period and removed the following items from site:
Ore Processing Area:
Concentrate thickener;
Old storage tank;
No 4 mill plinth;
Two 7 ft float columns;
Nine empty concentrate containers.
No. 1 Shaft and Winder area:
Old electrical control room – including concrete slabs;
Ventilation fans and motors, ducting and mounting plinth foundations;
Old storage tank;
No 4 mill plinth;
Two 7 ft float columns;
Nine empty concentrate containers;
Two 3.3 kV transformers;
Three winders and ropes.
Powerhouse area:
Six alternator transformers and associated platforms.
5.2 Rehabilitation of Disturbed Land
The total area of the CML5 mining lease is 2,474 ha. Approximately 243 ha of the Mining Lease is currently
subject to disturbance associated with the CSA Mine, 190 ha of which is covered by disturbance associated with
the TSF. The excised areas total approximately 118 ha, thus leaving 125 ha of land requiring rehabilitation by
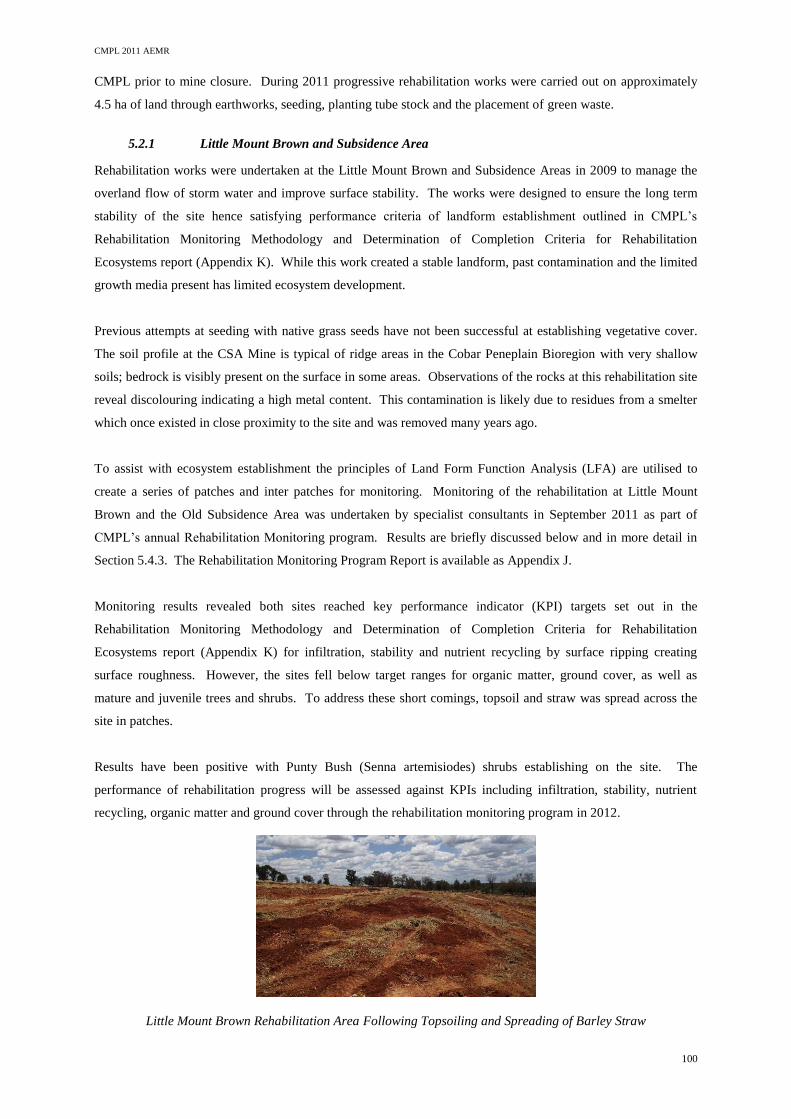
CMPL 2011 AEMR
100
CMPL prior to mine closure. During 2011 progressive rehabilitation works were carried out on approximately
4.5 ha of land through earthworks, seeding, planting tube stock and the placement of green waste.
5.2.1 Little Mount Brown and Subsidence Area
Rehabilitation works were undertaken at the Little Mount Brown and Subsidence Areas in 2009 to manage the
overland flow of storm water and improve surface stability. The works were designed to ensure the long term
stability of the site hence satisfying performance criteria of landform establishment outlined in CMPL’s
Rehabilitation Monitoring Methodology and Determination of Completion Criteria for Rehabilitation
Ecosystems report (Appendix K). While this work created a stable landform, past contamination and the limited
growth media present has limited ecosystem development.
Previous attempts at seeding with native grass seeds have not been successful at establishing vegetative cover.
The soil profile at the CSA Mine is typical of ridge areas in the Cobar Peneplain Bioregion with very shallow
soils; bedrock is visibly present on the surface in some areas. Observations of the rocks at this rehabilitation site
reveal discolouring indicating a high metal content. This contamination is likely due to residues from a smelter
which once existed in close proximity to the site and was removed many years ago.
To assist with ecosystem establishment the principles of Land Form Function Analysis (LFA) are utilised to
create a series of patches and inter patches for monitoring. Monitoring of the rehabilitation at Little Mount
Brown and the Old Subsidence Area was undertaken by specialist consultants in September 2011 as part of
CMPL’s annual Rehabilitation Monitoring program. Results are briefly discussed below and in more detail in
Section 5.4.3. The Rehabilitation Monitoring Program Report is available as Appendix J.
Monitoring results revealed both sites reached key performance indicator (KPI) targets set out in the
Rehabilitation Monitoring Methodology and Determination of Completion Criteria for Rehabilitation
Ecosystems report (Appendix K) for infiltration, stability and nutrient recycling by surface ripping creating
surface roughness. However, the sites fell below target ranges for organic matter, ground cover, as well as
mature and juvenile trees and shrubs. To address these short comings, topsoil and straw was spread across the
site in patches.
Results have been positive with Punty Bush (Senna artemisiodes) shrubs establishing on the site. The
performance of rehabilitation progress will be assessed against KPIs including infiltration, stability, nutrient
recycling, organic matter and ground cover through the rehabilitation monitoring program in 2012.
Little Mount Brown Rehabilitation Area Following Topsoiling and Spreading of Barley Straw
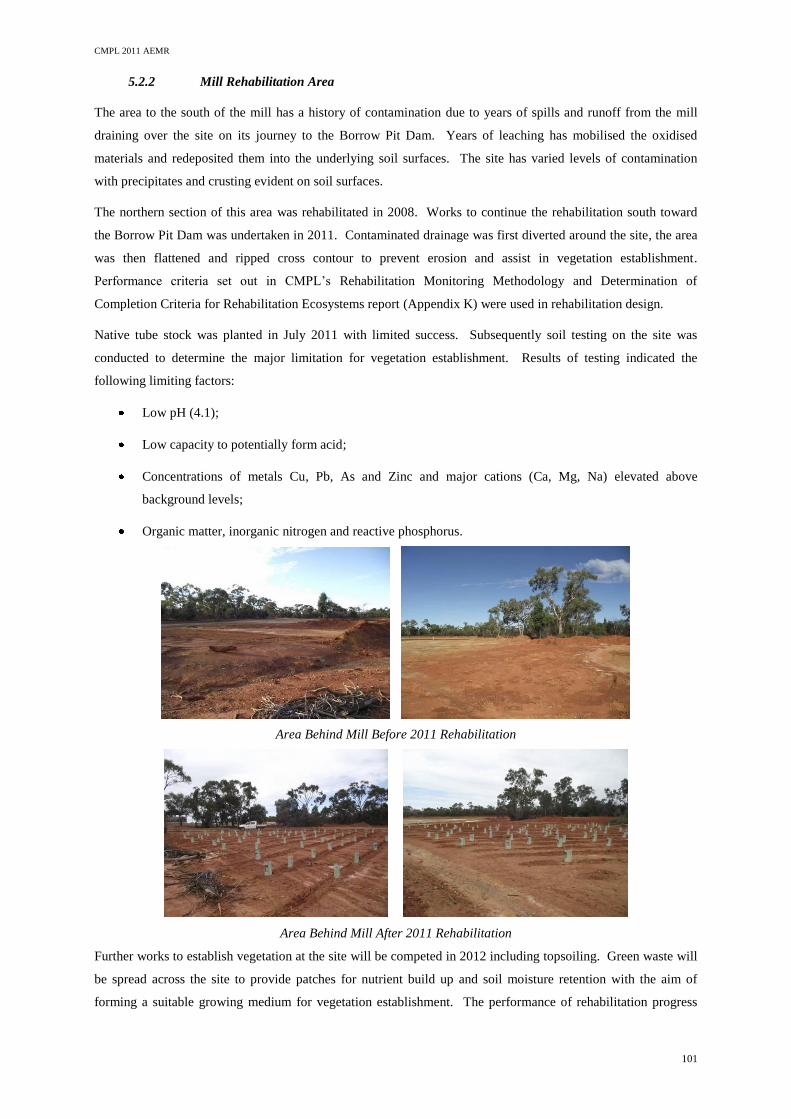
CMPL 2011 AEMR
101
5.2.2 Mill Rehabilitation Area
The area to the south of the mill has a history of contamination due to years of spills and runoff from the mill
draining over the site on its journey to the Borrow Pit Dam. Years of leaching has mobilised the oxidised
materials and redeposited them into the underlying soil surfaces. The site has varied levels of contamination
with precipitates and crusting evident on soil surfaces.
The northern section of this area was rehabilitated in 2008. Works to continue the rehabilitation south toward
the Borrow Pit Dam was undertaken in 2011. Contaminated drainage was first diverted around the site, the area
was then flattened and ripped cross contour to prevent erosion and assist in vegetation establishment.
Performance criteria set out in CMPL’s Rehabilitation Monitoring Methodology and Determination of
Completion Criteria for Rehabilitation Ecosystems report (Appendix K) were used in rehabilitation design.
Native tube stock was planted in July 2011 with limited success. Subsequently soil testing on the site was
conducted to determine the major limitation for vegetation establishment. Results of testing indicated the
following limiting factors:
Low pH (4.1);
Low capacity to potentially form acid;
Concentrations of metals Cu, Pb, As and Zinc and major cations (Ca, Mg, Na) elevated above
background levels;
Organic matter, inorganic nitrogen and reactive phosphorus.
Area Behind Mill Before 2011 Rehabilitation
Area Behind Mill After 2011 Rehabilitation
Further works to establish vegetation at the site will be competed in 2012 including topsoiling. Green waste will
be spread across the site to provide patches for nutrient build up and soil moisture retention with the aim of
forming a suitable growing medium for vegetation establishment. The performance of rehabilitation progress
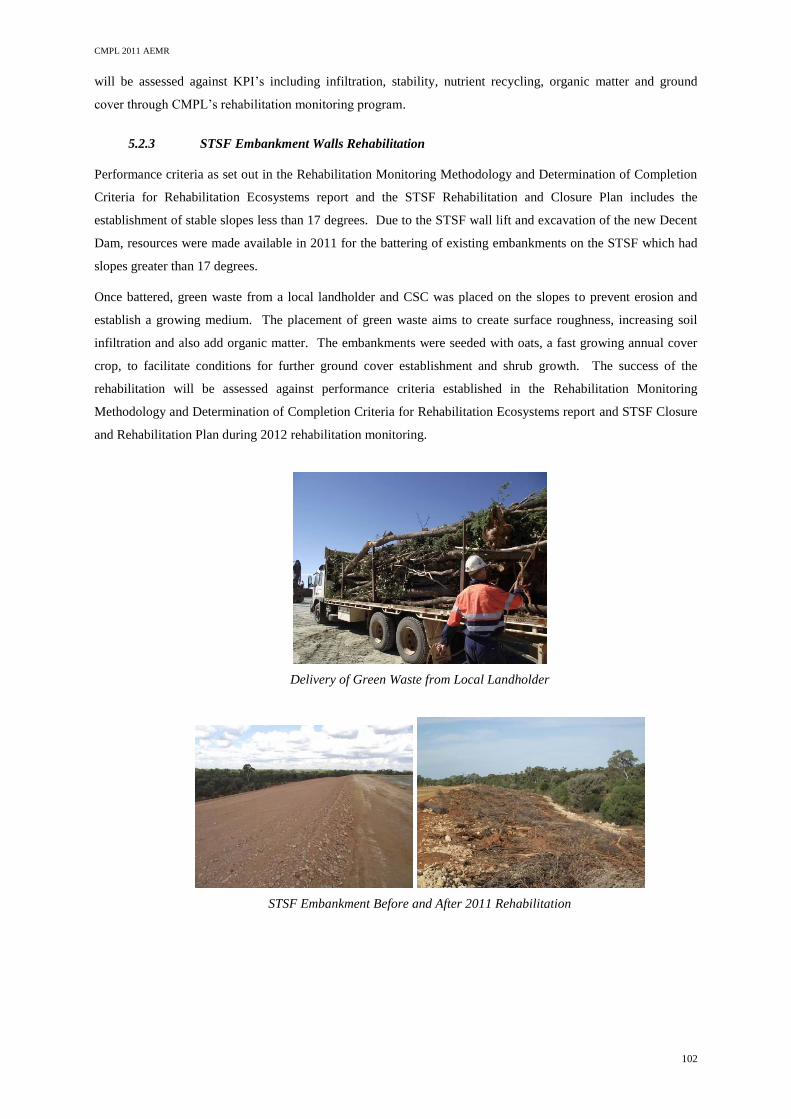
CMPL 2011 AEMR
102
will be assessed against KPI’s including infiltration, stability, nutrient recycling, organic matter and ground
cover through CMPL’s rehabilitation monitoring program.
5.2.3 STSF Embankment Walls Rehabilitation
Performance criteria as set out in the Rehabilitation Monitoring Methodology and Determination of Completion
Criteria for Rehabilitation Ecosystems report and the STSF Rehabilitation and Closure Plan includes the
establishment of stable slopes less than 17 degrees. Due to the STSF wall lift and excavation of the new Decent
Dam, resources were made available in 2011 for the battering of existing embankments on the STSF which had
slopes greater than 17 degrees.
Once battered, green waste from a local landholder and CSC was placed on the slopes to prevent erosion and
establish a growing medium. The placement of green waste aims to create surface roughness, increasing soil
infiltration and also add organic matter. The embankments were seeded with oats, a fast growing annual cover
crop, to facilitate conditions for further ground cover establishment and shrub growth. The success of the
rehabilitation will be assessed against performance criteria established in the Rehabilitation Monitoring
Methodology and Determination of Completion Criteria for Rehabilitation Ecosystems report and STSF Closure
and Rehabilitation Plan during 2012 rehabilitation monitoring.
Delivery of Green Waste from Local Landholder
STSF Embankment Before and After 2011 Rehabilitation
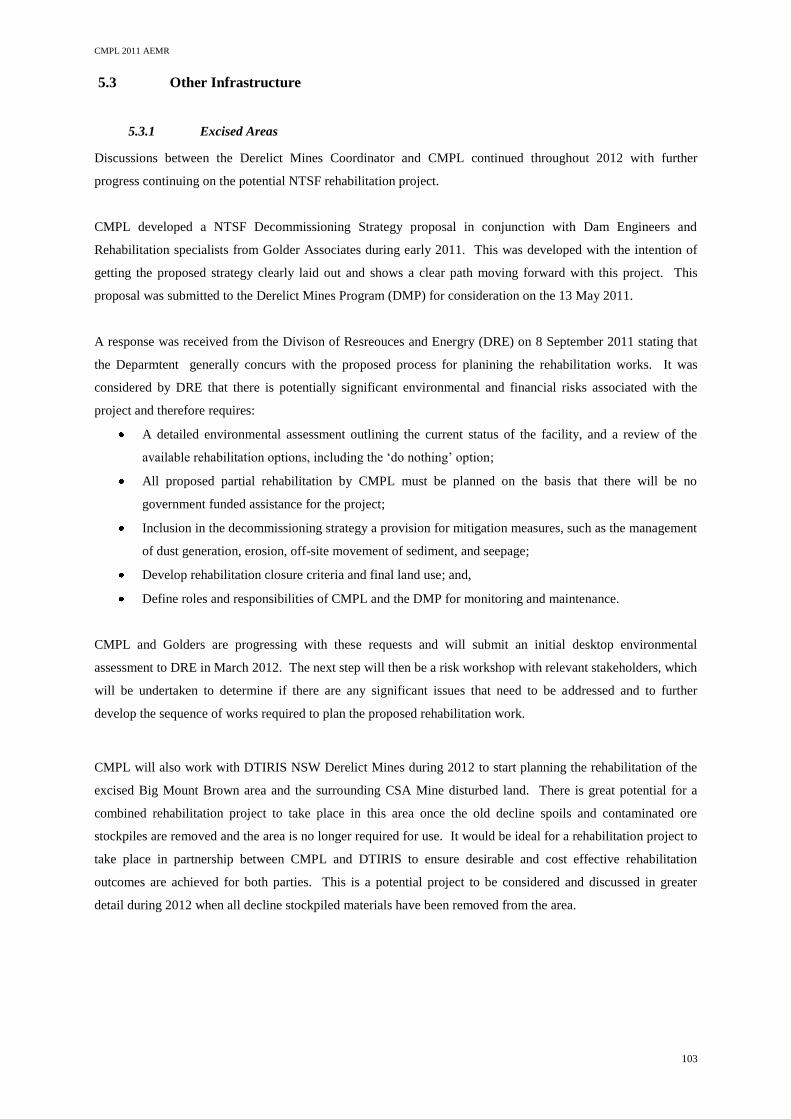
CMPL 2011 AEMR
103
5.3 Other Infrastructure
5.3.1 Excised Areas
Discussions between the Derelict Mines Coordinator and CMPL continued throughout 2012 with further
progress continuing on the potential NTSF rehabilitation project.
CMPL developed a NTSF Decommissioning Strategy proposal in conjunction with Dam Engineers and
Rehabilitation specialists from Golder Associates during early 2011. This was developed with the intention of
getting the proposed strategy clearly laid out and shows a clear path moving forward with this project. This
proposal was submitted to the Derelict Mines Program (DMP) for consideration on the 13 May 2011.
A response was received from the Divison of Resreouces and Energry (DRE) on 8 September 2011 stating that
the Deparmtent generally concurs with the proposed process for planining the rehabilitation works. It was
considered by DRE that there is potentially significant environmental and financial risks associated with the
project and therefore requires:
A detailed environmental assessment outlining the current status of the facility, and a review of the
available rehabilitation options, including the ‘do nothing’ option;
All proposed partial rehabilitation by CMPL must be planned on the basis that there will be no
government funded assistance for the project;
Inclusion in the decommissioning strategy a provision for mitigation measures, such as the management
of dust generation, erosion, off-site movement of sediment, and seepage;
Develop rehabilitation closure criteria and final land use; and,
Define roles and responsibilities of CMPL and the DMP for monitoring and maintenance.
CMPL and Golders are progressing with these requests and will submit an initial desktop environmental
assessment to DRE in March 2012. The next step will then be a risk workshop with relevant stakeholders, which
will be undertaken to determine if there are any significant issues that need to be addressed and to further
develop the sequence of works required to plan the proposed rehabilitation work.
CMPL will also work with DTIRIS NSW Derelict Mines during 2012 to start planning the rehabilitation of the
excised Big Mount Brown area and the surrounding CSA Mine disturbed land. There is great potential for a
combined rehabilitation project to take place in this area once the old decline spoils and contaminated ore
stockpiles are removed and the area is no longer required for use. It would be ideal for a rehabilitation project to
take place in partnership between CMPL and DTIRIS to ensure desirable and cost effective rehabilitation
outcomes are achieved for both parties. This is a potential project to be considered and discussed in greater
detail during 2012 when all decline stockpiled materials have been removed from the area.
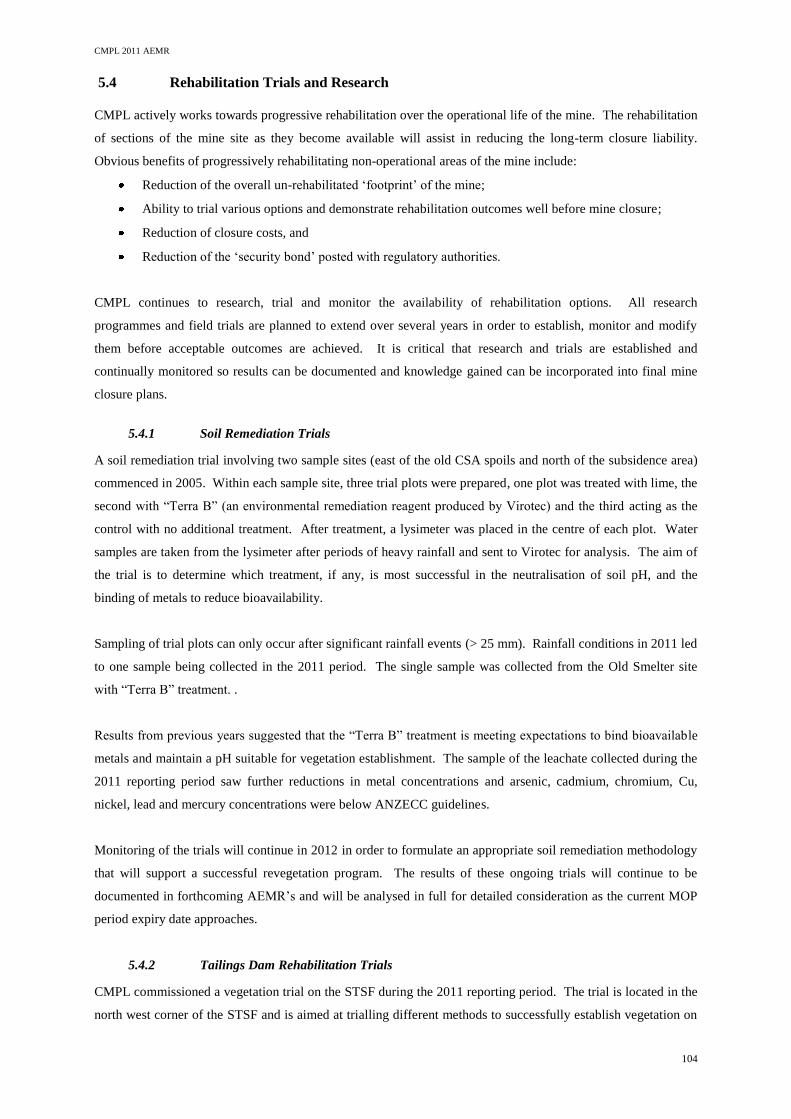
CMPL 2011 AEMR
104
5.4 Rehabilitation Trials and Research
CMPL actively works towards progressive rehabilitation over the operational life of the mine. The rehabilitation
of sections of the mine site as they become available will assist in reducing the long-term closure liability.
Obvious benefits of progressively rehabilitating non-operational areas of the mine include:
Reduction of the overall un-rehabilitated ‘footprint’ of the mine;
Ability to trial various options and demonstrate rehabilitation outcomes well before mine closure;
Reduction of closure costs, and
Reduction of the ‘security bond’ posted with regulatory authorities.
CMPL continues to research, trial and monitor the availability of rehabilitation options. All research
programmes and field trials are planned to extend over several years in order to establish, monitor and modify
them before acceptable outcomes are achieved. It is critical that research and trials are established and
continually monitored so results can be documented and knowledge gained can be incorporated into final mine
closure plans.
5.4.1 Soil Remediation Trials
A soil remediation trial involving two sample sites (east of the old CSA spoils and north of the subsidence area)
commenced in 2005. Within each sample site, three trial plots were prepared, one plot was treated with lime, the
second with “Terra B” (an environmental remediation reagent produced by Virotec) and the third acting as the
control with no additional treatment. After treatment, a lysimeter was placed in the centre of each plot. Water
samples are taken from the lysimeter after periods of heavy rainfall and sent to Virotec for analysis. The aim of
the trial is to determine which treatment, if any, is most successful in the neutralisation of soil pH, and the
binding of metals to reduce bioavailability.
Sampling of trial plots can only occur after significant rainfall events (> 25 mm). Rainfall conditions in 2011 led
to one sample being collected in the 2011 period. The single sample was collected from the Old Smelter site
with “Terra B” treatment. .
Results from previous years suggested that the “Terra B” treatment is meeting expectations to bind bioavailable
metals and maintain a pH suitable for vegetation establishment. The sample of the leachate collected during the
2011 reporting period saw further reductions in metal concentrations and arsenic, cadmium, chromium, Cu,
nickel, lead and mercury concentrations were below ANZECC guidelines.
Monitoring of the trials will continue in 2012 in order to formulate an appropriate soil remediation methodology
that will support a successful revegetation program. The results of these ongoing trials will continue to be
documented in forthcoming AEMR’s and will be analysed in full for detailed consideration as the current MOP
period expiry date approaches.
5.4.2 Tailings Dam Rehabilitation Trials
CMPL commissioned a vegetation trial on the STSF during the 2011 reporting period. The trial is located in the
north west corner of the STSF and is aimed at trialling different methods to successfully establish vegetation on
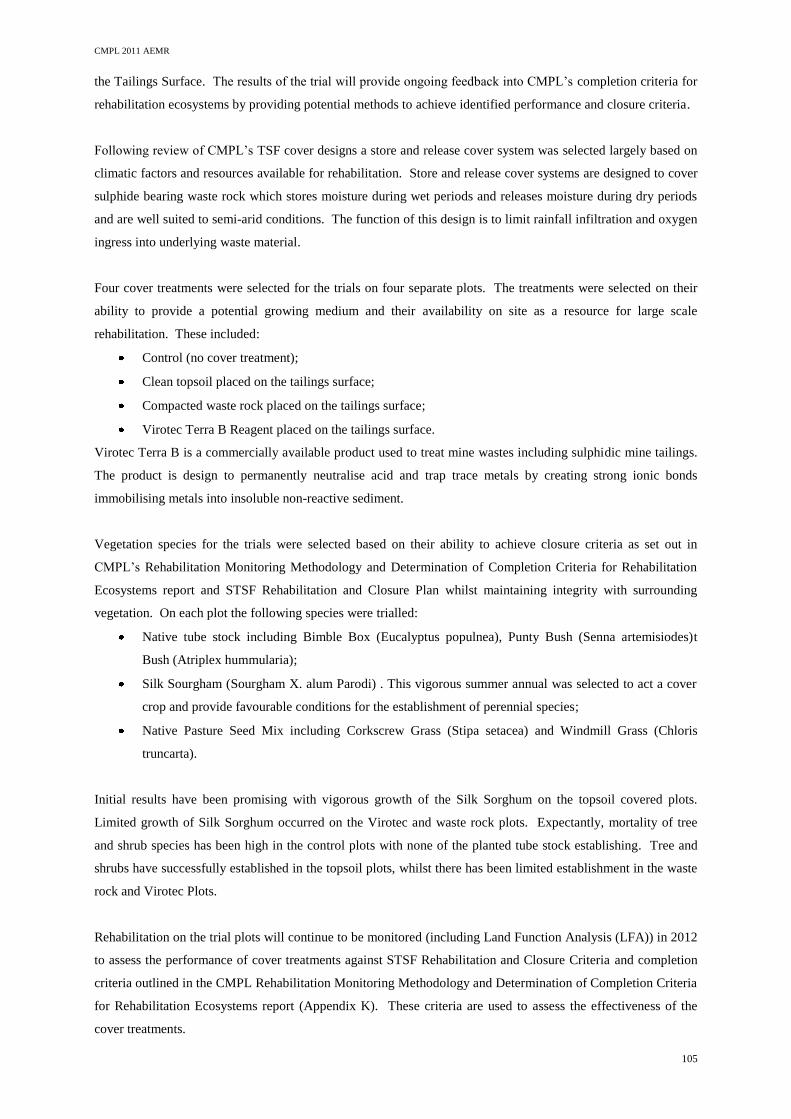
CMPL 2011 AEMR
105
the Tailings Surface. The results of the trial will provide ongoing feedback into CMPL’s completion criteria for
rehabilitation ecosystems by providing potential methods to achieve identified performance and closure criteria.
Following review of CMPL’s TSF cover designs a store and release cover system was selected largely based on
climatic factors and resources available for rehabilitation. Store and release cover systems are designed to cover
sulphide bearing waste rock which stores moisture during wet periods and releases moisture during dry periods
and are well suited to semi-arid conditions. The function of this design is to limit rainfall infiltration and oxygen
ingress into underlying waste material.
Four cover treatments were selected for the trials on four separate plots. The treatments were selected on their
ability to provide a potential growing medium and their availability on site as a resource for large scale
rehabilitation. These included:
Control (no cover treatment);
Clean topsoil placed on the tailings surface;
Compacted waste rock placed on the tailings surface;
Virotec Terra B Reagent placed on the tailings surface.
Virotec Terra B is a commercially available product used to treat mine wastes including sulphidic mine tailings.
The product is design to permanently neutralise acid and trap trace metals by creating strong ionic bonds
immobilising metals into insoluble non-reactive sediment.
Vegetation species for the trials were selected based on their ability to achieve closure criteria as set out in
CMPL’s Rehabilitation Monitoring Methodology and Determination of Completion Criteria for Rehabilitation
Ecosystems report and STSF Rehabilitation and Closure Plan whilst maintaining integrity with surrounding
vegetation. On each plot the following species were trialled:
Native tube stock including Bimble Box (Eucalyptus populnea), Punty Bush (Senna artemisiodes)t
Bush (Atriplex hummularia);
Silk Sourgham (Sourgham X. alum Parodi) . This vigorous summer annual was selected to act a cover
crop and provide favourable conditions for the establishment of perennial species;
Native Pasture Seed Mix including Corkscrew Grass (Stipa setacea) and Windmill Grass (Chloris
truncarta).
Initial results have been promising with vigorous growth of the Silk Sorghum on the topsoil covered plots.
Limited growth of Silk Sorghum occurred on the Virotec and waste rock plots. Expectantly, mortality of tree
and shrub species has been high in the control plots with none of the planted tube stock establishing. Tree and
shrubs have successfully established in the topsoil plots, whilst there has been limited establishment in the waste
rock and Virotec Plots.
Rehabilitation on the trial plots will continue to be monitored (including Land Function Analysis (LFA)) in 2012
to assess the performance of cover treatments against STSF Rehabilitation and Closure Criteria and completion
criteria outlined in the CMPL Rehabilitation Monitoring Methodology and Determination of Completion Criteria
for Rehabilitation Ecosystems report (Appendix K). These criteria are used to assess the effectiveness of the
cover treatments.
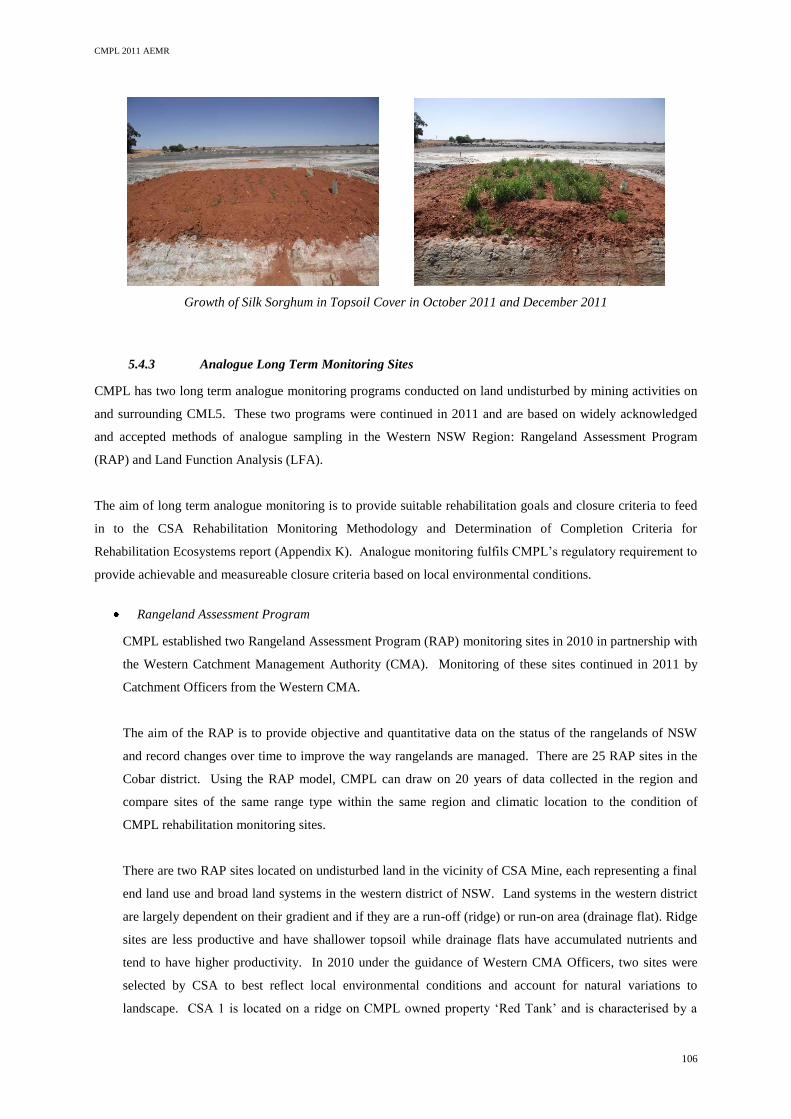
CMPL 2011 AEMR
106
Growth of Silk Sorghum in Topsoil Cover in October 2011 and December 2011
5.4.3 Analogue Long Term Monitoring Sites
CMPL has two long term analogue monitoring programs conducted on land undisturbed by mining activities on
and surrounding CML5. These two programs were continued in 2011 and are based on widely acknowledged
and accepted methods of analogue sampling in the Western NSW Region: Rangeland Assessment Program
(RAP) and Land Function Analysis (LFA).
The aim of long term analogue monitoring is to provide suitable rehabilitation goals and closure criteria to feed
in to the CSA Rehabilitation Monitoring Methodology and Determination of Completion Criteria for
Rehabilitation Ecosystems report (Appendix K). Analogue monitoring fulfils CMPL’s regulatory requirement to
provide achievable and measureable closure criteria based on local environmental conditions.
Rangeland Assessment Program
CMPL established two Rangeland Assessment Program (RAP) monitoring sites in 2010 in partnership with
the Western Catchment Management Authority (CMA). Monitoring of these sites continued in 2011 by
Catchment Officers from the Western CMA.
The aim of the RAP is to provide objective and quantitative data on the status of the rangelands of NSW
and record changes over time to improve the way rangelands are managed. There are 25 RAP sites in the
Cobar district. Using the RAP model, CMPL can draw on 20 years of data collected in the region and
compare sites of the same range type within the same region and climatic location to the condition of
CMPL rehabilitation monitoring sites.
There are two RAP sites located on undisturbed land in the vicinity of CSA Mine, each representing a final
end land use and broad land systems in the western district of NSW. Land systems in the western district
are largely dependent on their gradient and if they are a run-off (ridge) or run-on area (drainage flat). Ridge
sites are less productive and have shallower topsoil while drainage flats have accumulated nutrients and
tend to have higher productivity. In 2010 under the guidance of Western CMA Officers, two sites were
selected by CSA to best reflect local environmental conditions and account for natural variations to
landscape. CSA 1 is located on a ridge on CMPL owned property ‘Red Tank’ and is characterised by a
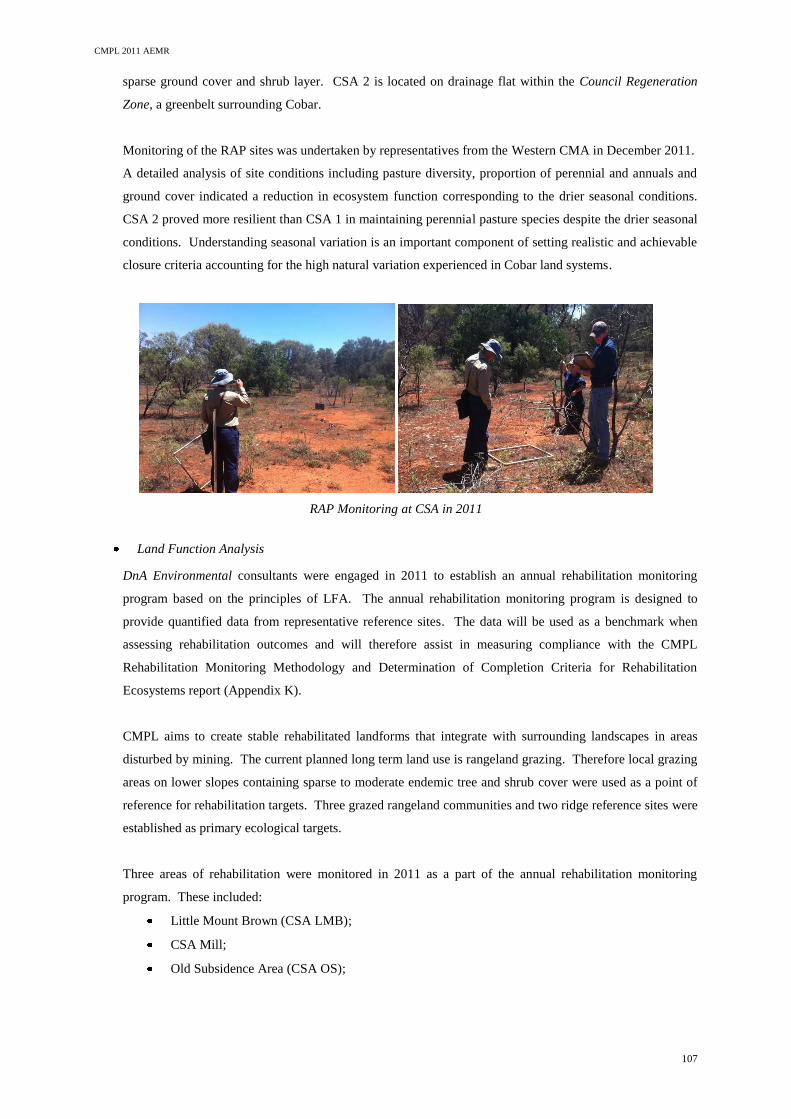
CMPL 2011 AEMR
107
sparse ground cover and shrub layer. CSA 2 is located on drainage flat within the Council Regeneration
Zone, a greenbelt surrounding Cobar.
Monitoring of the RAP sites was undertaken by representatives from the Western CMA in December 2011.
A detailed analysis of site conditions including pasture diversity, proportion of perennial and annuals and
ground cover indicated a reduction in ecosystem function corresponding to the drier seasonal conditions.
CSA 2 proved more resilient than CSA 1 in maintaining perennial pasture species despite the drier seasonal
conditions. Understanding seasonal variation is an important component of setting realistic and achievable
closure criteria accounting for the high natural variation experienced in Cobar land systems.
RAP Monitoring at CSA in 2011
Land Function Analysis
DnA Environmental consultants were engaged in 2011 to establish an annual rehabilitation monitoring
program based on the principles of LFA. The annual rehabilitation monitoring program is designed to
provide quantified data from representative reference sites. The data will be used as a benchmark when
assessing rehabilitation outcomes and will therefore assist in measuring compliance with the CMPL
Rehabilitation Monitoring Methodology and Determination of Completion Criteria for Rehabilitation
Ecosystems report (Appendix K).
CMPL aims to create stable rehabilitated landforms that integrate with surrounding landscapes in areas
disturbed by mining. The current planned long term land use is rangeland grazing. Therefore local grazing
areas on lower slopes containing sparse to moderate endemic tree and shrub cover were used as a point of
reference for rehabilitation targets. Three grazed rangeland communities and two ridge reference sites were
established as primary ecological targets.
Three areas of rehabilitation were monitored in 2011 as a part of the annual rehabilitation monitoring
program. These included:
Little Mount Brown (CSA LMB);
CSA Mill;
Old Subsidence Area (CSA OS);
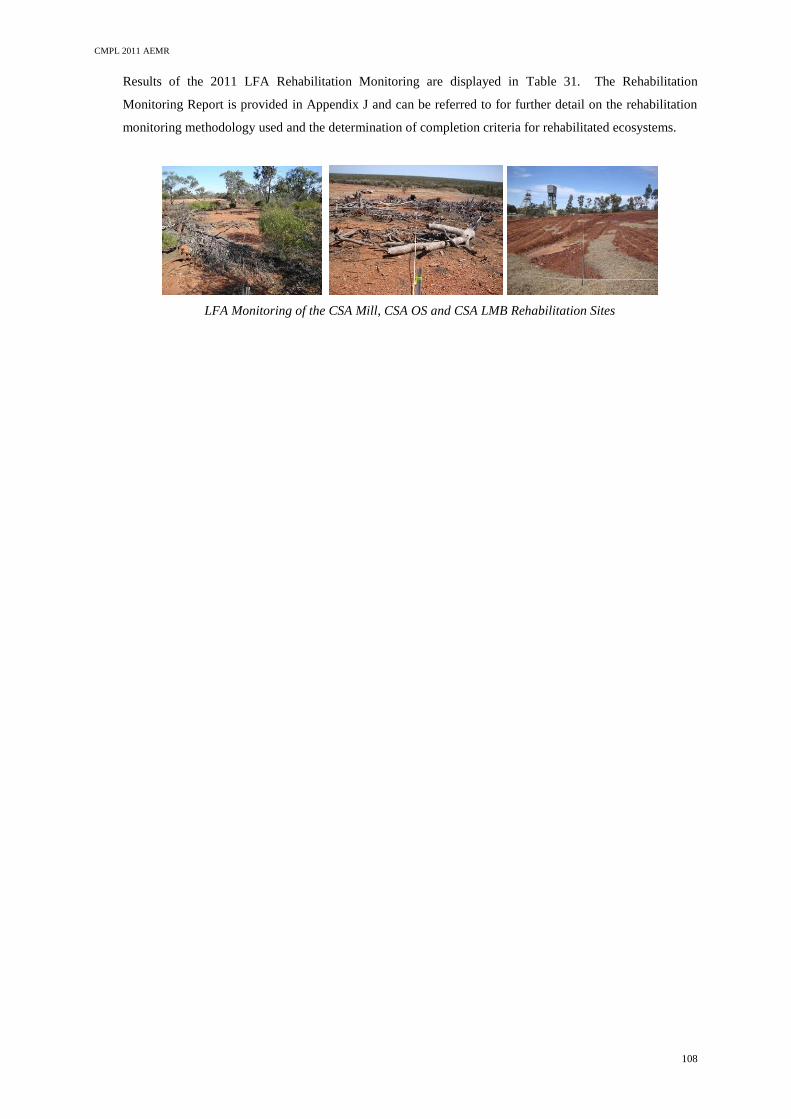
CMPL 2011 AEMR
108
Results of the 2011 LFA Rehabilitation Monitoring are displayed in Table 31. The Rehabilitation
Monitoring Report is provided in Appendix J and can be referred to for further detail on the rehabilitation
monitoring methodology used and the determination of completion criteria for rehabilitated ecosystems.
LFA Monitoring of the CSA Mill, CSA OS and CSA LMB Rehabilitation Sites
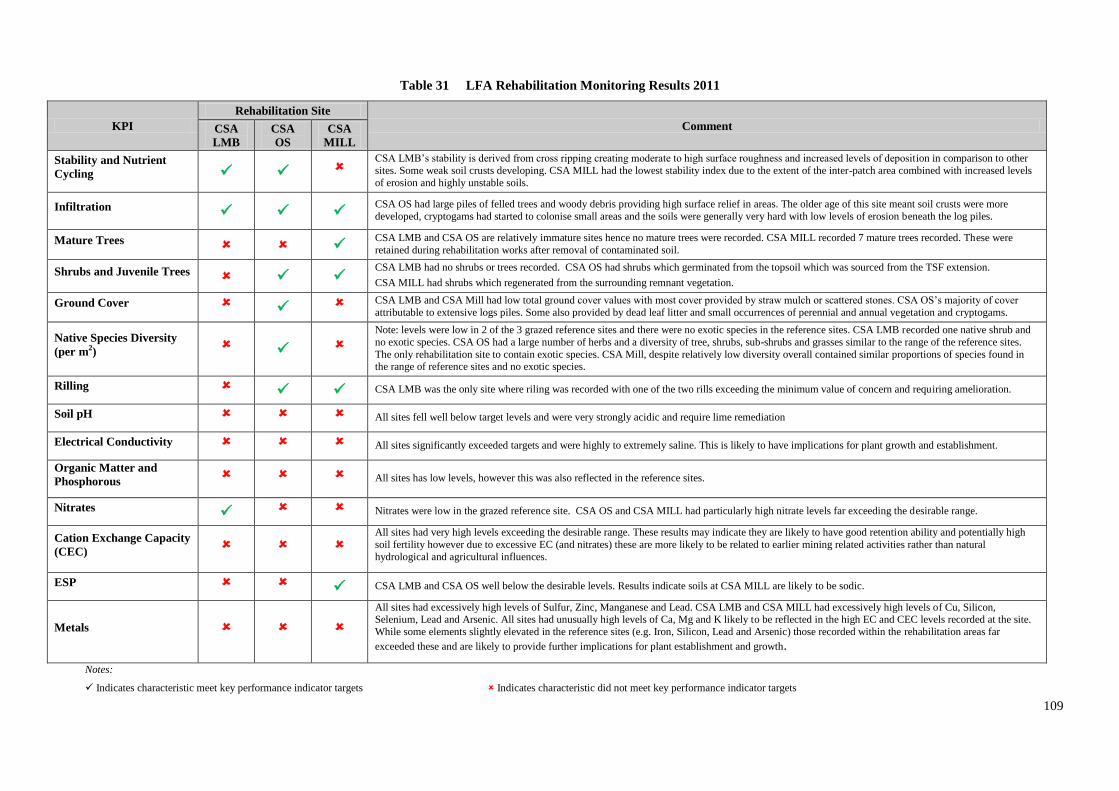
109
Table 31 LFA Rehabilitation Monitoring Results 2011
KPI
Rehabilitation Site
Comment CSA
LMB
CSA
OS
CSA
MILL
Stability and Nutrient
Cycling CSA LMB’s stability is derived from cross ripping creating moderate to high surface roughness and increased levels of deposition in comparison to other
sites. Some weak soil crusts developing. CSA MILL had the lowest stability index due to the extent of the inter-patch area combined with increased levels
of erosion and highly unstable soils.
Infiltration
CSA OS had large piles of felled trees and woody debris providing high surface relief in areas. The older age of this site meant soil crusts were more
developed, cryptogams had started to colonise small areas and the soils were generally very hard with low levels of erosion beneath the log piles.
Mature Trees
CSA LMB and CSA OS are relatively immature sites hence no mature trees were recorded. CSA MILL recorded 7 mature trees recorded. These were
retained during rehabilitation works after removal of contaminated soil.
Shrubs and Juvenile Trees
CSA LMB had no shrubs or trees recorded. CSA OS had shrubs which germinated from the topsoil which was sourced from the TSF extension.
CSA MILL had shrubs which regenerated from the surrounding remnant vegetation.
Ground Cover CSA LMB and CSA Mill had low total ground cover values with most cover provided by straw mulch or scattered stones. CSA OS’s majority of cover
attributable to extensive logs piles. Some also provided by dead leaf litter and small occurrences of perennial and annual vegetation and cryptogams.
Native Species Diversity
(per m2)
Note: levels were low in 2 of the 3 grazed reference sites and there were no exotic species in the reference sites. CSA LMB recorded one native shrub and
no exotic species. CSA OS had a large number of herbs and a diversity of tree, shrubs, sub-shrubs and grasses similar to the range of the reference sites.
The only rehabilitation site to contain exotic species. CSA Mill, despite relatively low diversity overall contained similar proportions of species found in the range of reference sites and no exotic species.
Rilling CSA LMB was the only site where riling was recorded with one of the two rills exceeding the minimum value of concern and requiring amelioration.
Soil pH All sites fell well below target levels and were very strongly acidic and require lime remediation
Electrical Conductivity All sites significantly exceeded targets and were highly to extremely saline. This is likely to have implications for plant growth and establishment.
Organic Matter and
Phosphorous All sites has low levels, however this was also reflected in the reference sites.
Nitrates Nitrates were low in the grazed reference site. CSA OS and CSA MILL had particularly high nitrate levels far exceeding the desirable range.
Cation Exchange Capacity
(CEC)
All sites had very high levels exceeding the desirable range. These results may indicate they are likely to have good retention ability and potentially high
soil fertility however due to excessive EC (and nitrates) these are more likely to be related to earlier mining related activities rather than natural
hydrological and agricultural influences.
ESP CSA LMB and CSA OS well below the desirable levels. Results indicate soils at CSA MILL are likely to be sodic.
Metals
All sites had excessively high levels of Sulfur, Zinc, Manganese and Lead. CSA LMB and CSA MILL had excessively high levels of Cu, Silicon, Selenium, Lead and Arsenic. All sites had unusually high levels of Ca, Mg and K likely to be reflected in the high EC and CEC levels recorded at the site.
While some elements slightly elevated in the reference sites (e.g. Iron, Silicon, Lead and Arsenic) those recorded within the rehabilitation areas far
exceeded these and are likely to provide further implications for plant establishment and growth.
Notes:
Indicates characteristic meet key performance indicator targets Indicates characteristic did not meet key performance indicator targets
110
5.5 Further Development of the Final Rehabilitation Plan
In 2011 CMPL engaged consultants AECOM to develop a Rehabilitation and Environmental Management Plan
(REMP) to address commitments made in the 2010 AEMR and support the renewal of the CSA MOP which is
due for renewal at the end of 2012. The purpose of the REMP is to create a framework for mine closure which
has measurable performance and closure criteria to achieve sustainable ecosystem development. The REMP is
due to be finalised in early 2012.
The performance measures and indicators in the REMP are designed to form the basis of the Closure Criteria.
They provide the ability to track progress towards final land use and development of sustainable ecosystems
through a series of conceptual stages shown in Figure 2 and described as:
Stage 1 Decommissioning: Removal, where relevant, of hard stand areas, buildings, contaminated
materials, hazardous materials;
Stage 2 Landform Establishment: Incorporates gradient, slope, aspect, drainage, substrate material
characterisation and morphology;
Stage 3 Growing Media Development: Incorporates physical, chemical and biological components of
the growing media and ameliorants that are used to optimise the potential of the media in terms of the
preferred vegetative cover;
Stage 4 Ecosystem and Land use Establishment: Incorporates operational and non-operational lands,
revegetated lands and habitat augmentation; management and establishment of flora, retained
infrastructure and adjoining predicted land use;
Stage 5 Ecosystem and Land use Sustainability: Incorporates components of floristic structure, nutrient
cycling recruitment and recovery, community structure and function which are the key elements of a
sustainable landscape, together with economic and social impact or benefit.
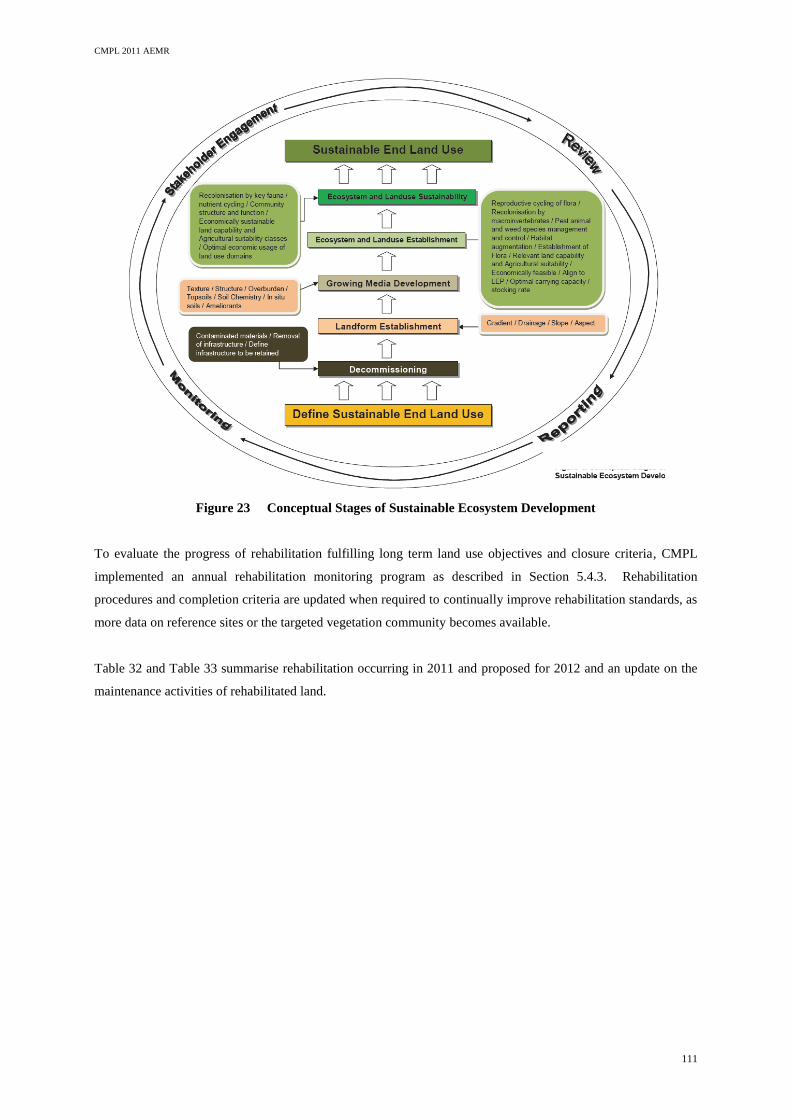
CMPL 2011 AEMR
111
Figure 23 Conceptual Stages of Sustainable Ecosystem Development
To evaluate the progress of rehabilitation fulfilling long term land use objectives and closure criteria, CMPL
implemented an annual rehabilitation monitoring program as described in Section 5.4.3. Rehabilitation
procedures and completion criteria are updated when required to continually improve rehabilitation standards, as
more data on reference sites or the targeted vegetation community becomes available.
Table 32 and Table 33 summarise rehabilitation occurring in 2011 and proposed for 2012 and an update on the
maintenance activities of rehabilitated land.
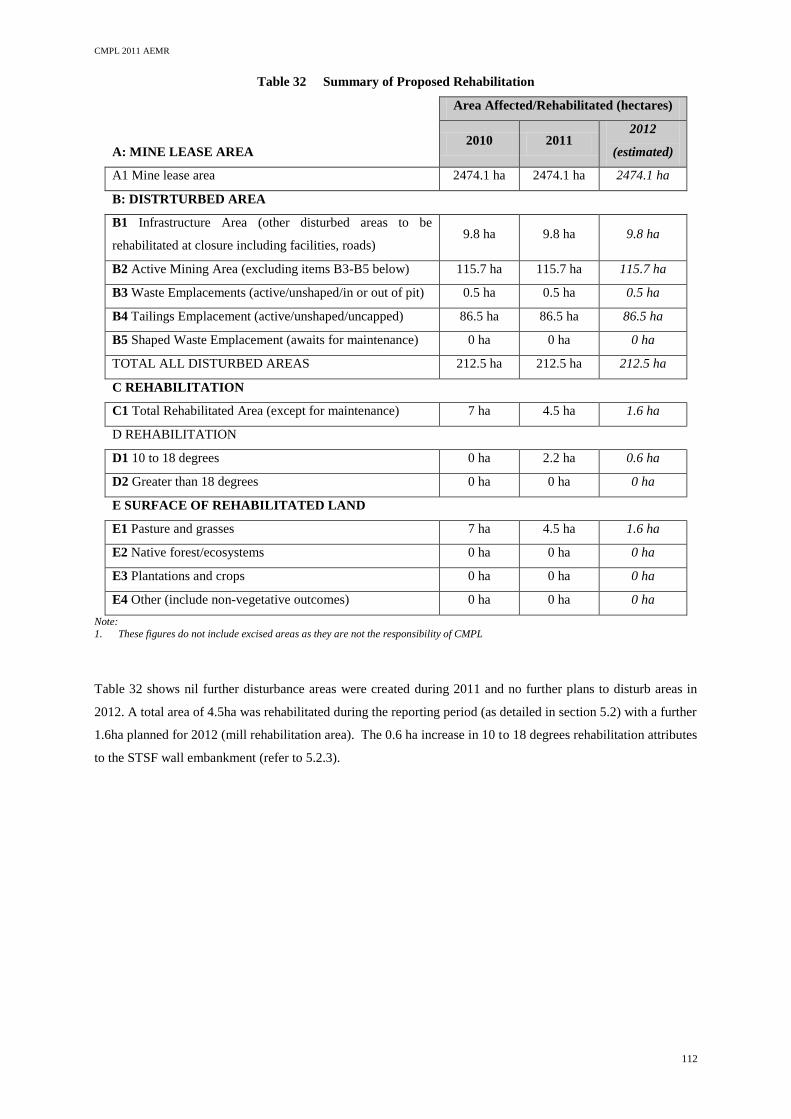
CMPL 2011 AEMR
112
Table 32 Summary of Proposed Rehabilitation
A: MINE LEASE AREA
Area Affected/Rehabilitated (hectares)
2010 2011 2012
(estimated)
A1 Mine lease area 2474.1 ha 2474.1 ha 2474.1 ha
B: DISTRTURBED AREA
B1 Infrastructure Area (other disturbed areas to be
rehabilitated at closure including facilities, roads) 9.8 ha 9.8 ha 9.8 ha
B2 Active Mining Area (excluding items B3-B5 below) 115.7 ha 115.7 ha 115.7 ha
B3 Waste Emplacements (active/unshaped/in or out of pit) 0.5 ha 0.5 ha 0.5 ha
B4 Tailings Emplacement (active/unshaped/uncapped) 86.5 ha 86.5 ha 86.5 ha
B5 Shaped Waste Emplacement (awaits for maintenance) 0 ha 0 ha 0 ha
TOTAL ALL DISTURBED AREAS 212.5 ha 212.5 ha 212.5 ha
C REHABILITATION
C1 Total Rehabilitated Area (except for maintenance) 7 ha 4.5 ha 1.6 ha
D REHABILITATION
D1 10 to 18 degrees 0 ha 2.2 ha 0.6 ha
D2 Greater than 18 degrees 0 ha 0 ha 0 ha
E SURFACE OF REHABILITATED LAND
E1 Pasture and grasses 7 ha 4.5 ha 1.6 ha
E2 Native forest/ecosystems 0 ha 0 ha 0 ha
E3 Plantations and crops 0 ha 0 ha 0 ha
E4 Other (include non-vegetative outcomes) 0 ha 0 ha 0 ha
Note:
1. These figures do not include excised areas as they are not the responsibility of CMPL
Table 32 shows nil further disturbance areas were created during 2011 and no further plans to disturb areas in
2012. A total area of 4.5ha was rehabilitated during the reporting period (as detailed in section 5.2) with a further
1.6ha planned for 2012 (mill rehabilitation area). The 0.6 ha increase in 10 to 18 degrees rehabilitation attributes
to the STSF wall embankment (refer to 5.2.3).
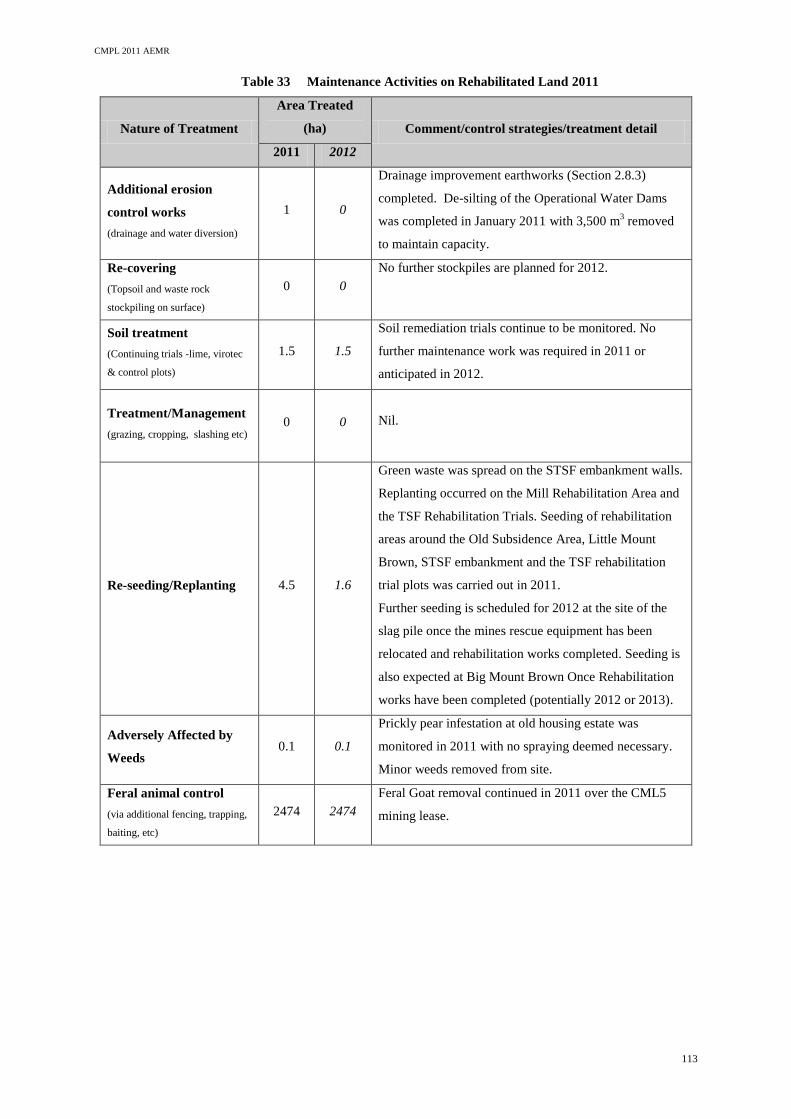
CMPL 2011 AEMR
113
Table 33 Maintenance Activities on Rehabilitated Land 2011
Nature of Treatment
Area Treated
(ha) Comment/control strategies/treatment detail
2011 2012
Additional erosion
control works
(drainage and water diversion)
1 0
Drainage improvement earthworks (Section 2.8.3)
completed. De-silting of the Operational Water Dams
was completed in January 2011 with 3,500 m3 removed
to maintain capacity.
Re-covering
(Topsoil and waste rock
stockpiling on surface)
0 0
No further stockpiles are planned for 2012.
Soil treatment
(Continuing trials -lime, virotec
& control plots)
1.5 1.5
Soil remediation trials continue to be monitored. No
further maintenance work was required in 2011 or
anticipated in 2012.
Treatment/Management
(grazing, cropping, slashing etc) 0 0
Nil.
Re-seeding/Replanting 4.5 1.6
Green waste was spread on the STSF embankment walls.
Replanting occurred on the Mill Rehabilitation Area and
the TSF Rehabilitation Trials. Seeding of rehabilitation
areas around the Old Subsidence Area, Little Mount
Brown, STSF embankment and the TSF rehabilitation
trial plots was carried out in 2011.
Further seeding is scheduled for 2012 at the site of the
slag pile once the mines rescue equipment has been
relocated and rehabilitation works completed. Seeding is
also expected at Big Mount Brown Once Rehabilitation
works have been completed (potentially 2012 or 2013).
Adversely Affected by
Weeds 0.1 0.1
Prickly pear infestation at old housing estate was
monitored in 2011 with no spraying deemed necessary.
Minor weeds removed from site.
Feral animal control
(via additional fencing, trapping,
baiting, etc)
2474 2474
Feral Goat removal continued in 2011 over the CML5
mining lease.
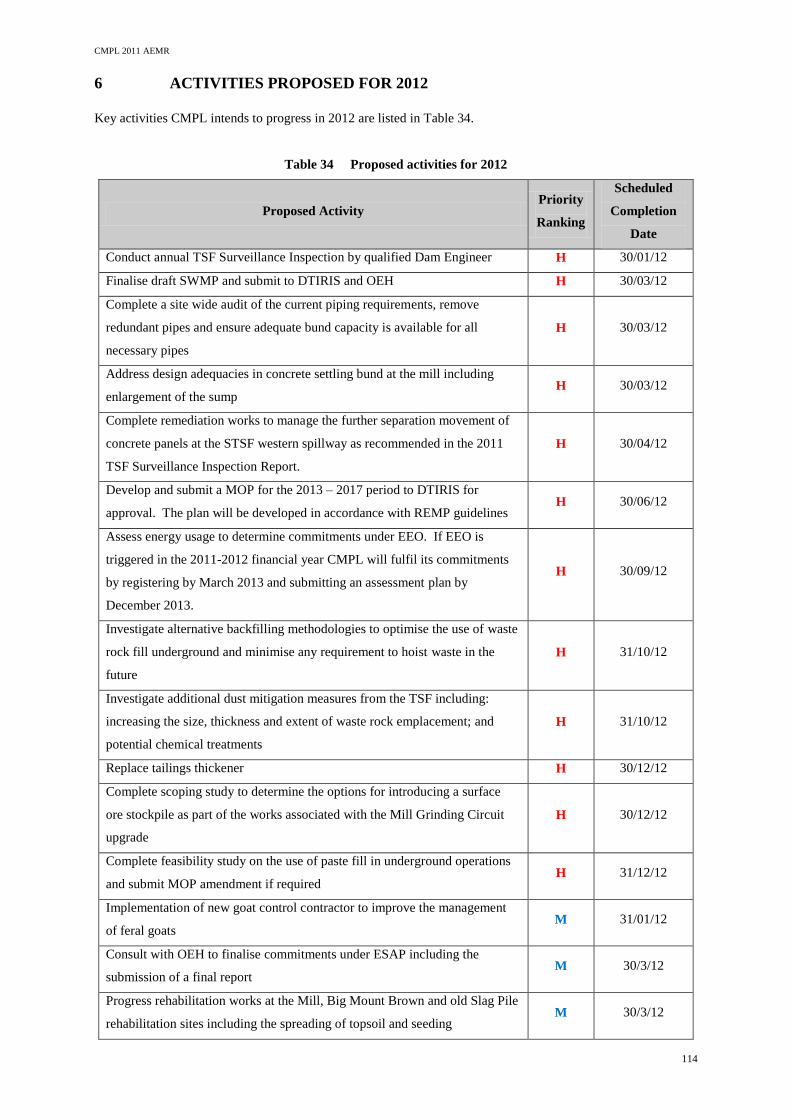
CMPL 2011 AEMR
114
6 ACTIVITIES PROPOSED FOR 2012
Key activities CMPL intends to progress in 2012 are listed in Table 34.
Table 34 Proposed activities for 2012
Proposed Activity Priority
Ranking
Scheduled
Completion
Date
Conduct annual TSF Surveillance Inspection by qualified Dam Engineer H 30/01/12
Finalise draft SWMP and submit to DTIRIS and OEH H 30/03/12
Complete a site wide audit of the current piping requirements, remove
redundant pipes and ensure adequate bund capacity is available for all
necessary pipes
H 30/03/12
Address design adequacies in concrete settling bund at the mill including
enlargement of the sump H 30/03/12
Complete remediation works to manage the further separation movement of
concrete panels at the STSF western spillway as recommended in the 2011
TSF Surveillance Inspection Report.
H 30/04/12
Develop and submit a MOP for the 2013 – 2017 period to DTIRIS for
approval. The plan will be developed in accordance with REMP guidelines H 30/06/12
Assess energy usage to determine commitments under EEO. If EEO is
triggered in the 2011-2012 financial year CMPL will fulfil its commitments
by registering by March 2013 and submitting an assessment plan by
December 2013.
H 30/09/12
Investigate alternative backfilling methodologies to optimise the use of waste
rock fill underground and minimise any requirement to hoist waste in the
future
H 31/10/12
Investigate additional dust mitigation measures from the TSF including:
increasing the size, thickness and extent of waste rock emplacement; and
potential chemical treatments
H 31/10/12
Replace tailings thickener H 30/12/12
Complete scoping study to determine the options for introducing a surface
ore stockpile as part of the works associated with the Mill Grinding Circuit
upgrade
H 30/12/12
Complete feasibility study on the use of paste fill in underground operations
and submit MOP amendment if required H 31/12/12
Implementation of new goat control contractor to improve the management
of feral goats M 31/01/12
Consult with OEH to finalise commitments under ESAP including the
submission of a final report M 30/3/12
Progress rehabilitation works at the Mill, Big Mount Brown and old Slag Pile
rehabilitation sites including the spreading of topsoil and seeding M 30/3/12
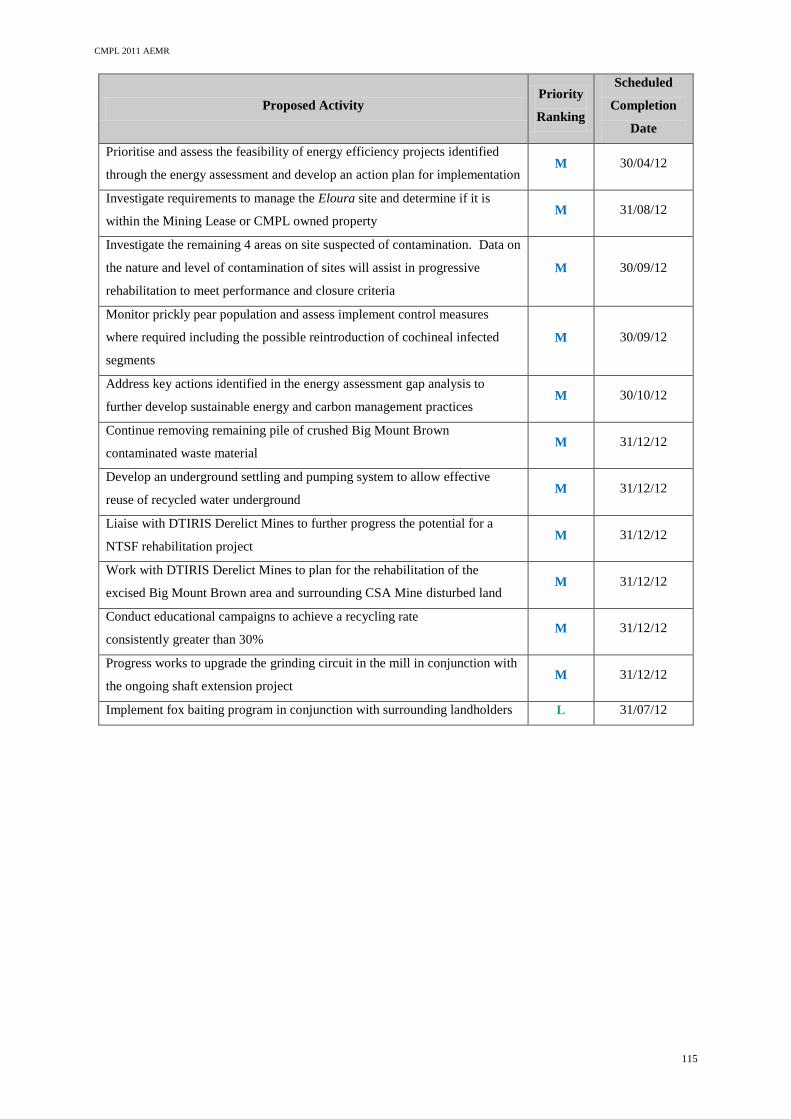
CMPL 2011 AEMR
115
Proposed Activity Priority
Ranking
Scheduled
Completion
Date
Prioritise and assess the feasibility of energy efficiency projects identified
through the energy assessment and develop an action plan for implementation M 30/04/12
Investigate requirements to manage the Eloura site and determine if it is
within the Mining Lease or CMPL owned property M 31/08/12
Investigate the remaining 4 areas on site suspected of contamination. Data on
the nature and level of contamination of sites will assist in progressive
rehabilitation to meet performance and closure criteria
M 30/09/12
Monitor prickly pear population and assess implement control measures
where required including the possible reintroduction of cochineal infected
segments
M 30/09/12
Address key actions identified in the energy assessment gap analysis to
further develop sustainable energy and carbon management practices M 30/10/12
Continue removing remaining pile of crushed Big Mount Brown
contaminated waste material M 31/12/12
Develop an underground settling and pumping system to allow effective
reuse of recycled water underground M 31/12/12
Liaise with DTIRIS Derelict Mines to further progress the potential for a
NTSF rehabilitation project M 31/12/12
Work with DTIRIS Derelict Mines to plan for the rehabilitation of the
excised Big Mount Brown area and surrounding CSA Mine disturbed land M 31/12/12
Conduct educational campaigns to achieve a recycling rate
consistently greater than 30% M 31/12/12
Progress works to upgrade the grinding circuit in the mill in conjunction with
the ongoing shaft extension project M 31/12/12
Implement fox baiting program in conjunction with surrounding landholders L 31/07/12
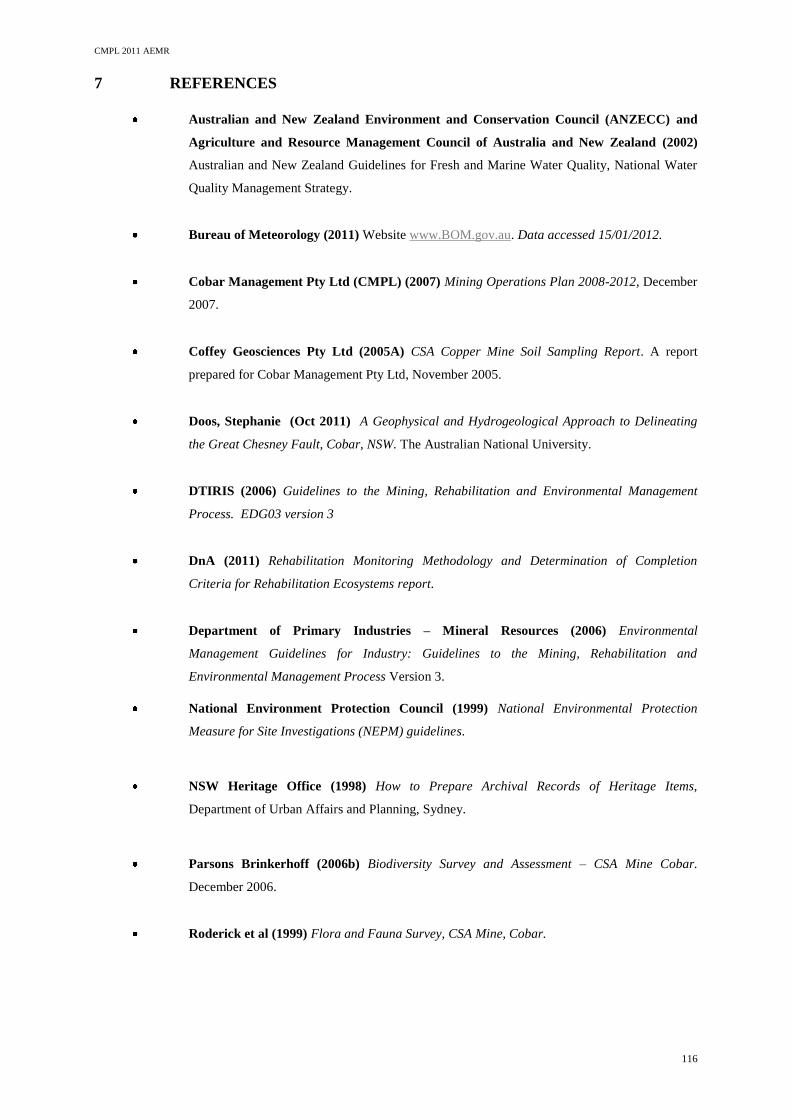
CMPL 2011 AEMR
116
7 REFERENCES
Australian and New Zealand Environment and Conservation Council (ANZECC) and
Agriculture and Resource Management Council of Australia and New Zealand (2002)
Australian and New Zealand Guidelines for Fresh and Marine Water Quality, National Water
Quality Management Strategy.
Bureau of Meteorology (2011) Website www.BOM.gov.au. Data accessed 15/01/2012.
Cobar Management Pty Ltd (CMPL) (2007) Mining Operations Plan 2008-2012, December
2007.
Coffey Geosciences Pty Ltd (2005A) CSA Copper Mine Soil Sampling Report. A report
prepared for Cobar Management Pty Ltd, November 2005.
Doos, Stephanie (Oct 2011) A Geophysical and Hydrogeological Approach to Delineating
the Great Chesney Fault, Cobar, NSW. The Australian National University.
DTIRIS (2006) Guidelines to the Mining, Rehabilitation and Environmental Management
Process. EDG03 version 3
DnA (2011) Rehabilitation Monitoring Methodology and Determination of Completion
Criteria for Rehabilitation Ecosystems report.
Department of Primary Industries – Mineral Resources (2006) Environmental
Management Guidelines for Industry: Guidelines to the Mining, Rehabilitation and
Environmental Management Process Version 3.
National Environment Protection Council (1999) National Environmental Protection
Measure for Site Investigations (NEPM) guidelines.
NSW Heritage Office (1998) How to Prepare Archival Records of Heritage Items,
Department of Urban Affairs and Planning, Sydney.
Parsons Brinkerhoff (2006b) Biodiversity Survey and Assessment – CSA Mine Cobar.
December 2006.
Roderick et al (1999) Flora and Fauna Survey, CSA Mine, Cobar.
CMPL 2011 AEMR
117
7.1 Plans
1 Mine Context
2 Land Preparation and Mining Activities
3 Rehabilitation
4 Mining Plan - Vertical Section
5 Site Layout
7.2 Appendices
A Environmental Protection License 1864
B 2010 AEMR Review Meeting Minutes
C Stormwater Drainage Improvement Works Report
D CMPL Environment and Community Policy
E CSA Air and Water Quality Monitoring Data 2011
F Contaminated Sites Sampling Report 2011
G Industrial Heritage Site Listing Report
H STSF Surveillance Report 2010
I 2011 Annual Return EPL 1864
J 2011CSA Rehabilitation Monitoring Report
K Rehabilitation Monitoring Methodology and Determination of Completion Criteria for
Rehabilitation Ecosystems report