Coastal profile of the Erongo Region - the-eis.com profile of the Erongo... · Coastal Profile of...
214
Coastal profile of the Erongo Region LIST OF ABBREVIATIONS: ......................................................................................................... 4 1.0 INTRODUCTION ...................................................................................................................... 6 1.1 OBJECTIVE .......................................................................................................................... 6 1.2 APPROACH, METHODS ......................................................................................................... 6 1.3 DEFINITION OF THE COASTAL ZONE....................................................................................... 7 2.0 SUMMARY........................................................................................................................... 9 3.0 PHYSICAL/CHEMICAL SETTINGS ............................................................................... 10 3.1 CLIMATIC CONDITIONS....................................................................................................... 10 3.1.1 General setting................................................................................................................. 10 3.1.2 Climatic Zones ................................................................................................................. 11 3.1.3 Climatic Parameters......................................................................................................... 12 3.1.4 Rainfall ............................................................................................................................ 14 3.1.5 Climate Change ............................................................................................................... 14 3.1.6 Implications for People .................................................................................................... 14 3.2 GEOLOGY .......................................................................................................................... 17 3.2.1 Onshore Geology ............................................................................................................. 17 3.2.2 Offshore Geology ............................................................................................................. 19 3.3 GEOPHYSICS ............................................................................................................................ 20 3.4 GEOMORPHOLOGY ................................................................................................................... 21 3.5 SOILS ...................................................................................................................................... 21 3.6 MINERAL RESOURCES .............................................................................................................. 21 3.6.1 Salt .................................................................................................................................. 21 3.6.2 Heavy minerals ................................................................................................................ 23 3.6.3 Marine Minerals .............................................................................................................. 24 3.6.4 Gypsum............................................................................................................................ 25 3.6.5 Dimension stone ............................................................................................................... 27 3.6.6 Guano harvesting ............................................................................................................. 27 3.6.7 Tin, Tungsten, Niobium-Tantalum..................................................................................... 27 3.6.8 Copper, Lead, Zinc........................................................................................................... 28 3.6.9 Lithium, Beryllium............................................................................................................ 28 3.6.10 Uranium......................................................................................................................... 28 3.6.11 Semi-precious stones ...................................................................................................... 30 3.6.12 Graphite......................................................................................................................... 30 3.6.13 Rare Earth Elements....................................................................................................... 30 3.6.14 Diamonds....................................................................................................................... 30 3.6.15 Gold............................................................................................................................... 30 3.6.16 Hydrocarbon Potential ................................................................................................... 31 3.5 GROUND WATER RESOURCES .............................................................................................. 31 3.6 THE COASTLINE AND THE SEA ................................................................................... 36 3.6.1 Coastline and Bathymetry................................................................................................. 36 4.0 BIOLOGICAL SETTINGS ................................................................................................ 41 4.1 VEGETATION, TERRESTRIAL FLORA..................................................................................... 41 4.1.1 Major Habitats................................................................................................................. 41 4.1.2 Plant communities ............................................................................................................ 41 4.1.3 Inselbergs ........................................................................................................................ 42 4.1.4 Special Plants .................................................................................................................. 43 4.1.5 Potential .......................................................................................................................... 45 4.1.6 Threats............................................................................................................................. 45 4.2 FARMLANDS (SWAKOP & KUISEB RIVERS) ................................................................................ 46 4.3 TERRESTRIAL FAUNA, WILDLIFE......................................................................................... 47 4.3.1 General ............................................................................................................................ 47 4.3.2 Fauna .............................................................................................................................. 47 PDF created with pdfFactory trial version www.pdffactory.com
Transcript of Coastal profile of the Erongo Region - the-eis.com profile of the Erongo... · Coastal Profile of...
Coastal profile of the Erongo Region LIST OF ABBREVIATIONS: ......................................................................................................... 4
1.0 INTRODUCTION ...................................................................................................................... 6
1.1 OBJECTIVE .......................................................................................................................... 6 1.2 APPROACH, METHODS ......................................................................................................... 6 1.3 DEFINITION OF THE COASTAL ZONE....................................................................................... 7
2.0 SUMMARY........................................................................................................................... 9
3.0 PHYSICAL/CHEMICAL SETTINGS ............................................................................... 10
3.1 CLIMATIC CONDITIONS....................................................................................................... 10 3.1.1 General setting................................................................................................................. 10 3.1.2 Climatic Zones ................................................................................................................. 11 3.1.3 Climatic Parameters......................................................................................................... 12 3.1.4 Rainfall ............................................................................................................................ 14 3.1.5 Climate Change ............................................................................................................... 14 3.1.6 Implications for People .................................................................................................... 14
3.2 GEOLOGY .......................................................................................................................... 17 3.2.1 Onshore Geology ............................................................................................................. 17 3.2.2 Offshore Geology ............................................................................................................. 19
3.3 GEOPHYSICS............................................................................................................................ 20 3.4 GEOMORPHOLOGY ................................................................................................................... 21 3.5 SOILS ...................................................................................................................................... 21 3.6 MINERAL RESOURCES .............................................................................................................. 21
3.6.1 Salt .................................................................................................................................. 21 3.6.2 Heavy minerals ................................................................................................................ 23 3.6.3 Marine Minerals .............................................................................................................. 24 3.6.4 Gypsum............................................................................................................................ 25 3.6.5 Dimension stone............................................................................................................... 27 3.6.6 Guano harvesting............................................................................................................. 27 3.6.7 Tin, Tungsten, Niobium-Tantalum..................................................................................... 27 3.6.8 Copper, Lead, Zinc........................................................................................................... 28 3.6.9 Lithium, Beryllium............................................................................................................ 28 3.6.10 Uranium......................................................................................................................... 28 3.6.11 Semi-precious stones ...................................................................................................... 30 3.6.12 Graphite......................................................................................................................... 30 3.6.13 Rare Earth Elements....................................................................................................... 30 3.6.14 Diamonds....................................................................................................................... 30 3.6.15 Gold............................................................................................................................... 30 3.6.16 Hydrocarbon Potential ................................................................................................... 31
3.5 GROUND WATER RESOURCES .............................................................................................. 31 3.6 THE COASTLINE AND THE SEA................................................................................... 36
3.6.1 Coastline and Bathymetry................................................................................................. 36
4.0 BIOLOGICAL SETTINGS ................................................................................................ 41
4.1 VEGETATION, TERRESTRIAL FLORA..................................................................................... 41 4.1.1 Major Habitats................................................................................................................. 41 4.1.2 Plant communities............................................................................................................ 41 4.1.3 Inselbergs ........................................................................................................................ 42 4.1.4 Special Plants .................................................................................................................. 43 4.1.5 Potential .......................................................................................................................... 45 4.1.6 Threats............................................................................................................................. 45
4.2 FARMLANDS (SWAKOP & KUISEB RIVERS) ................................................................................ 46 4.3 TERRESTRIAL FAUNA, WILDLIFE......................................................................................... 47
4.3.1 General............................................................................................................................ 47 4.3.2 Fauna .............................................................................................................................. 47
PDF created with pdfFactory trial version www.pdffactory.com
Coastal Profile of the Erongo Region - August 1999 2
Namib endemic birds [4]........................................................................................................... 50 Namibian endemic birds [10].................................................................................................... 50 Namibian endemics................................................................................................................... 51 4.3.3 Potential .......................................................................................................................... 52 4.3.4 Threats............................................................................................................................. 53
4.4 MARINE COMMUNITIES ...................................................................................................... 53 4.4.1 Plankton.................................................................................................................... 53 4.4.2 Commercial fishery resources.................................................................................... 54
4.5 ESTUARINE FAUNA............................................................................................................. 58 4.5 PROTECTED AREAS/AREAS NEEDING PROTECTION............................................................... 59
4.5.1 Cape Cross, Cape fur seal colony .............................................................................. 59 4.5.2 Lichen Fields............................................................................................................. 60 4.5.3 Damara terns ............................................................................................................ 61 4.5.4 Brandberg ................................................................................................................. 62 4.5.5 National Monuments ........................................................................................................ 64
4.6 COASTAL WETLANDS ........................................................................................................ 65 4.6.1 Sandwich Harbour ........................................................................................................... 65 4.6.2 Walvis Bay Lagoon........................................................................................................... 66 4.6.3 Swakopmund Saltworks ............................................................................................. 73
5.0 SOCIO-ECONOMIC SETTINGS...................................................................................... 74
5.1 DEMOGRAPHY ................................................................................................................... 74 5.2 HOUSING ........................................................................................................................... 78 5.3 LIVELIHOOD ...................................................................................................................... 81 5.4 HEALTH AND WELFARE ..................................................................................................... 82 5.4 EDUCATION ....................................................................................................................... 85
6.0 ECONOMIC SETTINGS ................................................................................................... 87
6.1 DESERT DEVELOPMENT.............................................................................................. 87 6.2 ECONOMIC ELEMENTS: ECONOMICALLY ACTIVE BY SECTOR .................................. 89
6.2.1 Agriculture & Aquaculture ............................................................................................... 89 6.2.2 Mining and Exploitation................................................................................................... 90 6.2.3 Manufacturing ............................................................................................................... 115 6.2.4 Electricity and Water...................................................................................................... 116 6.2.5 Construction .................................................................................................................. 117 6.2.6 Accommodation And Catering ........................................................................................ 117 6.2.7 Transport And Communications ..................................................................................... 117 6.2.8 Communications............................................................................................................. 118 6.2.9 Finance And Commerce ................................................................................................ 118 6.2.10 Community Services ..................................................................................................... 120 6.2.11 Undefined..................................................................................................................... 120 6.2.11 Tourism........................................................................................................................ 121 6.2.12 Transport: Goods Handled .......................................................................................... 121 6.2.13 Industrial Water Consumption...................................................................................... 121 6.2.14 Employment Data: Economically Active Population.................................................... 122 6.2.15 The Contribution of the Region to the Gross Domestic Product of Namibia ................... 124
6.3 BUSINESS SERVICES:.............................................................................................................. 126 6.3.1 Desalination Plant ......................................................................................................... 126 6.3.2 Bulk Water Supply.......................................................................................................... 126 6.3.3 Export Processing Zone.................................................................................................. 126
6.4 TRANSPORT ........................................................................................................................... 127 6.4.1 Road transport ............................................................................................................... 127 6.4.2 Air transport .................................................................................................................. 129 6.4.3 Sea transport.................................................................................................................. 130 6.4.4 Rail Transport................................................................................................................ 130
7.0 INSTITUTIONAL AND LEGAL FRAMEWORK.......................................................... 134
7.1 EXISTING INSTITUTIONAL STRUCTURES FOR ENVIRONMENTAL MANAGEMENT .................... 134 7.1.1 Physical and economic planning.............................................................................. 134 7.1.2 Nature conservation................................................................................................. 138
PDF created with pdfFactory trial version www.pdffactory.com

Coastal Profile of the Erongo Region - August 1999 3
7.1.3 Marine resource depletion ....................................................................................... 142 7.1.4 Groundwater abstraction......................................................................................... 145 7.1.5 Mineral extraction................................................................................................... 146
7.2 INTERNATIONAL CONVENTIONS ........................................................................................ 148 7.2.1 Ramsar .......................................................................................................................... 149 7.2.2 The Marpol Convention:................................................................................................. 149
7.3 LEGISLATION ................................................................................................................... 149 7.4 ENFORCEMENT PROCEDURES ............................................................................................ 159
7.4.1 Background............................................................................................................. 159 7.4.2 National West Coast Tourist Recreation Area (WCRA)............................................. 161 7.4.3 The area south of Walvis Bay and north to Swakopmund .......................................... 164 7.4.4 The Nature Reserves: Sandwich Harbour, Namib Naukluft Park, Cape Cross. .......... 167 7.4.5 The Inland............................................................................................................... 168 7.4.6 The Coastal shoreline .............................................................................................. 170
8.0 POTENTIAL COASTAL POLLUTION SOURCES....................................................... 174
8.1 WALVIS BAY ................................................................................................................... 174 8.1.1 General level, pollution from municipality ............................................................... 174 8.1.2 Fish processing industry .......................................................................................... 180 8.1.3 Pollution from harbour. ........................................................................................... 181 8.1.4 Dredging operations (water turbidity)...................................................................... 183 8.1.5 Dredge spoil dumping ground.................................................................................. 183 8.1.6 Ships outside harbour area ...................................................................................... 183
8.2 OTHER COASTAL MUNICIPALITIES..................................................................................... 184 8.2.1 Swakopmund ........................................................................................................... 184
9.0 DEVELOPMENT PLANS IN THE ERONGO REGION................................................ 185
9.1 ERONGO REGION DEVELOPMENT PLAN YEAR 2000 ........................................................... 185 9.2 WALVIS BAY ACTION PLAN YEAR 1998 - 2001 ............................................................... 185 9.3 OTHER DEVELOPMENT PLANS WITHIN THE REGION ........................................................... 186
9.3.1 Swakopmund Long Term Development Plan ................................................................... 186 9.3.2 Swakopmund River Bridge Policy Plan........................................................................... 187 9.3.3 Long Beach – Dolphin Beach Structure Plan. ................................................................. 188
10.0 ENVIRONMENTAL MANAGEMENT ISSUES............................................................. 190
10.1 PHYSICAL ISSUES; DATA COLLECTION, MONITORING, DATA PROCESSING ................................ 190 10.1.1 Local Institutions with Environmental Monitoring Sites ................................................ 190 10.1.2 Weather Stations .......................................................................................................... 190 10.1.3 Environmental Monitoring and Data Availability.......................................................... 191
10.2 CONSERVATION ISSUES .................................................................................................... 194 10.3 RECREATION ISSUES......................................................................................................... 195 10.4 SOCIO-ECONOMIC ISSUES ................................................................................................. 197 10.5 ENFORCEMENT AND AWARENESS ISSUES........................................................................ 198 10.6 LEGAL ISSUES .................................................................................................................. 198 10.8 ENVIRONMENTAL ASSESSMENT (EIA) PROCEDURES ......................................................... 199
11.0 REFERENCES ................................................................................................................. 201
PDF created with pdfFactory trial version www.pdffactory.com

Coastal Profile of the Erongo Region - August 1999 4
LIST OF ABBREVIATIONS:
AEC Atomic Energy Corporation BMA Brandberg Monument Area BTP Build Together Programme CBD Central Business District CCSR Cape Cross Seal Reserve COD Chemical Oxygen Demand CSIR Council for Scientific and Industrial Research CSO Central Statistics Office CZM Coastal Zone Management DEA Department of Environmental Affairs DRFN Desert Research Foundation of Namibia DWA Department of Water Affairs EA Environmental Assessment EEAN Environmental Evaluation Associates of Namibia EEZ Exclusive Economic Zone EIA Environmental Impact Assessment EMS Environmental Management Study EPZ Export Processing Zone GDP Gross Domestic Product GPS Global Positioning System IAEA International Atomic Energy Agency ICZM Integrated Coastal Zone Management IRD Initial Rate of Deposition IRDNC Integrated Rural Development and Nature
Conservation MAWRD Ministry of Agriculture, Water Affairs and Rural
Development MET Ministry of Environment and Tourism MFMR Ministry of Fisheries and Marine Resources MLRR Ministry of Lands, Resettlement and Rehabilitation MME Ministry of Mines and Energy MOHSS Ministry of Health and Social Services MRD Maximum Rate of Deposition MRLGH Ministry of Regional and Local Government and
Housing MSY Maximum Sustainable Yield MWTC Ministry of Works, Transport and Communication NACOBTA Namibian Community Based Tourism Association NAMPAB Namibia Planning Advisory Board NAMPOL Namibian Police Force NATH Namibian Association of Tourism and Hospitality NATMIRC National Marine Information and Research Centre NGO Non Governmental Organisation NHE National Housing Enterprise NHIES Namibia Household Income and Expenditure Survey NMC National Monuments Council ORV Off-road vehicle SACU Southern African Customs Union
PDF created with pdfFactory trial version www.pdffactory.com

Coastal Profile of the Erongo Region - August 1999 5
SADC Southern African Development Community SEPN Shell Exploration and Production Namibia SQ Single Quarters SRT Save the Rhino Trust TAC Total Allowable Catch TASA Tourism Association of Southern Africa TDS Total dissolved solids TPS Town Planning Scheme TRP Tedd Rudd Planning Associates UCT University of Cape Town UNAM University of Namibia WBEAG Walvis Bay Environmental Action Group WBM Municipality of Walvis Bay WCRA West Coast Recreation Area
PDF created with pdfFactory trial version www.pdffactory.com
Coastal Profile of the Erongo Region - August 1999 6
1.0 INTRODUCTION
1.1 OBJECTIVE The coastal profile presented in this report, reviews the physical/chemical settings together with the biological-, the socio-economic-, as well as the economic settings in the coastal part of the Erongo Region. The institutional structures, the legislation, the present enforcement systems, the awareness building and the human resources for Coastal Zone Management in the project area, is also reviewed. The exact boundaries of area covered by the Integrated Coastal Zone Management Project (ICZM), is presented in section 1.3 and at map no.1. The coastal profile has been prepared in order to: • Establish quantitative as well as qualitative baseline information on the settings
and issues referred to above. • Identify present environmental management issues, which need to be addressed. • Support management decisions in the municipalities, in the line Ministries and the
Erongo Regional Council. The information in the coastal profile can be used as a basis when the policies for development in the coastal zone of the Erongo Region are formulated. This could be channelled through Strategic Planning, which implies that the feasibility and the potential impact of proposed developments are evaluated through Environmental Impact Assessment procedures. Based on planning strategies, for example the integration of the structure plans for the municipalities in the Region, a management plan for the coastal zone of the Erongo Region can be formulated in writing by the Erongo Region Development Co-ordinated Committee. 1.2 APPROACH, METHODS The preparation of the coastal profile has been undertaken by the stakeholders to the project supported by consultants in their various fields of expertise. The stakeholders have been involved in every aspect of the process i.e. by providing information, by contributions in writing, by participation in working groups etc. Within the field of socio-economy a special task force has been convened. This Committee meets on a regular basis in order to discuss socio-economic issues related to the input to the Coastal Profile. The following are members of the Committee: Ms. G. Andersen, CZM project; Ms. U Bruiners, Head Rössing Foundation; Ms. A. Butkus-Ndazapo, Regional Chief Community Liaison Officer; Ms. A Gases, Erongo Regional Council (Chairman of the Committee); Mr. M. Jimmy, Ministry of Agriculture; Mr. J. Korrubel, CZM project; Mr. L Linnemann, CZM project; Dr. D Rush, CZM project; Dr. I El-Saidy, Regional Head, Ministry of Health. Very substantial inputs to the Coastal Profile has been provided by Ms. B. Currie, Ministry of Fisheries and Marine Resources; by Rössing Uranium Limited and by Ms G.I.C Schneider, Geological Survey of Namibia, Ministry of Mines and Energy.
PDF created with pdfFactory trial version www.pdffactory.com
Coastal Profile of the Erongo Region - August 1999 7
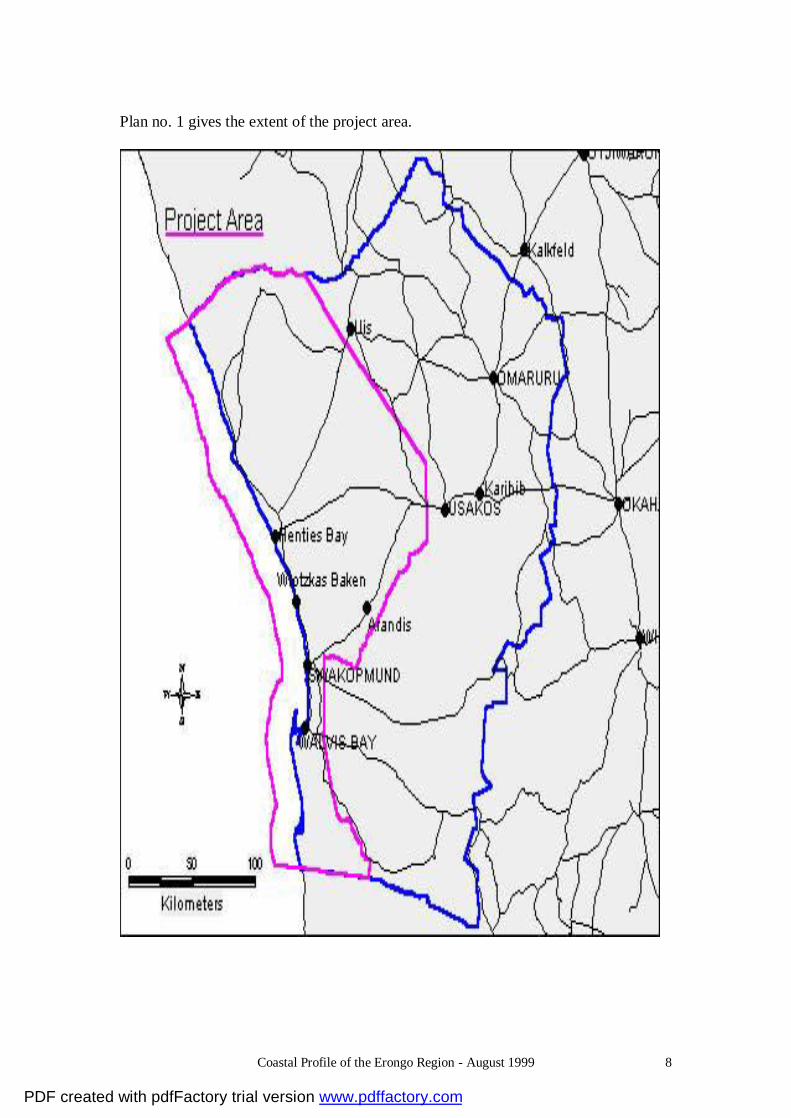
The total team who participated in the preparation of the coastal profile is presented below: Ms. G. Andersen, CZM project; Mr. K. Bender, CZM project; Mr. J. Billetoft, CZM project; Mr. R. Braby, Ministry of Environment and Tourism; Ms. U Bruinners, Head Rössing Foundation; Ms. A. Butkus-Ndazapo, Regional Chief Community Liaison Officer; Ms B. Currie, Ministry of Fisheries and Marine Resources; Mr. P.C. Eia, CZM project; Mr. M. Evert, Rössing Uranium Limited; Ms. A. Gases, Erongo Regional Council; Mr. T.D.!Gonteb, Erongo Regional Council; Mr. J. Henschel, Desert Research Foundation of Namibia; Ms. M. Jeppesen, CZM project; Mr. M. Jimmy, Ministry of Agriculture; Mr. J. Korrubel, CZM project; Mr. A. Legnani, Geological Survey of Namibia, Ministry of Mines and Energy; Mr K. Lester, Swakopmund Municipality; Mr. J. Liebenberg, Cleaner Technology project; Mr. L. Linnemann, CZM project; Mr. Mwapangasha, Arandis Town; Mr. T. Nielsen, CZM project; Mr. J. Pretorius, Rössing Uranium Limited; Mr. A.J. Raw, Namport; Ms. S. Richter, CZM project; Dr. Rush, CZM project; Dr. I. El-Saidy, Regional Head, Ministry of Health; Mr. H. Skovhus, Aalborg University, Denmark, Mr. B. Stewart, Walvis Bay Municipality; Ms. S. Vendelsoe, CZM project; Mr. K Wearne, Walvis Bay Environmental Trust; Mr. F. v.d. Westhuizen, Henties Bay Municipality and Mr. J. S. de Wet, Ministry of Agriculture, Water & Rural Development; The contributions to the Coastal Profile have been edited by Mr. K. Bender, Mr. R. Braby and Mr. J. Korrubel The Project Management Group would hereby like to express is sincere gratitude to all of the persons who participated in the production of the Coastal Profile. 1.3 DEFINITION OF THE COASTAL ZONE The seawards boundary of the project area is following the 12 nautical miles limit of the coastline of the Erongo Region e.g. the outer territorial waters of Namibia. To the north the project area is following the Erongo Regional boundary in Ugab River to the Kunene Region to a point north-west of Uis. From there the boundary is running to the south-east to an area west of Usakos, in order for Brandberg Monument Area to be included in the project area. From this area the border is following a line, which include Spitzkoppe and Arandis Town down to the north-eastern point of the old Walvis Bay enclave. The landwards border of the project area is from here following the old border of the Walvis Bay enclave down to the Erongo Regional boundary to Hardap Region to include Sandwich Harbour.
PDF created with pdfFactory trial version www.pdffactory.com
Coastal Profile of the Erongo Region - August 1999 8
Plan no. 1 gives the extent of the project area.
PDF created with pdfFactory trial version www.pdffactory.com
Coastal Profile of the Erongo Region - August 1999 9
2.0 SUMMARY
The contents of the chapters within this Coastal Profile could be summarised as follows: Chapter 1 deals with the objective of the Coastal Zone Management Study, the approach followed, the methods used for data collection and a detailed description of the coastal zone under investigation. Chapter 3 is devoted to the physical and chemical settings of the coastal zone. The climatic conditions, geology, geophysics and geomorphology are discussed in detail as well as the soils, mineral resources, ground water resources and the characteristics of the coastline and the sea. Chapter 4 focuses on the biological settings of the coastal zone. The vegetation, terrestrial flora, farmlands, terrestrial fauna and wildlife are discussed as well as marine fauna communities, estuarine fauna, protected areas within the coastal zone. The coastal wetlands are discussed in detail. Chapter 5 contains detailed evaluations of the demography, housing, livelihood of the coastal towns and people as well as the health and welfare and education facilities and standards. Chapter 6 reflects the detailed study done into the economic setting of the coastal zone. The chapter focuses on the various economic sectors within the region, business services and the extensive transport system active within the region. Chapter 7 deals with the exiting institutional structures for environmental management, the international conventions active in the coastal zone and a description of the Ramsar and Marpol conventions are included. The various laws and regulations active within the region are discussed in detail as well as the enforcement procedures recommended for the environmental sensitive areas with in the coastal zone. Chapter 8 focuses on potential pollution sources within the Municipalities of Walvis Bay and Swakopmund The existing and proposed development plans active within the coastal zone are discussed in Chapter 9 with the focus being on the Long Term Development Plans or Structure Plans being prepared for the Municipalities of Walvis Bay and Swakopmund. Chapter 10 is devoted to the environmental management issues such as physical, conservation, recreation, socio-economic as well as enforcement, legal and environmental assessment issues and procedures. A complete list of reference sources used during the compilation of this coastal profile is listed in Chapter 11.
PDF created with pdfFactory trial version www.pdffactory.com

Coastal Profile of the Erongo Region - August 1999 10
3.0 PHYSICAL/CHEMICAL SETTINGS
3.1 CLIMATIC CONDITIONS 3.1.1 General setting The western Erongo region falls entirely within the Namib Desert, the coastal lowland lying west of the Great Escarpment. The area in question forms part of the Central Namib. The climate of this area is well-documented (Walter, 1936; Jackson, 1941; Schulze, 1969; Besler, 1972; Goudie, 1972; Robinson, 1976; Seely & Stuart, 1976; Taljaard, 1979; Tyson & Seely, 1980; Lancaster et al., 1984; Walter & Breckle, 1984; Walter, 1985; Lancaster, 1989; Lindesay & Tyson, 1990; Hachfeld, 1996; Jürgens, unpubl.; Loris, unpubl.). Many of the patterns reported below were derived from measurements made south of the Swakop river, but should be broadly applicable to the area north of the Swakop river as well. Four features have a dominant effect on the climate of the Namib and enhance its aridity. These are the South Atlantic Anticyclonic Cell, the Benguela Upwelling System, the Great Escarpment, and the absence of major topographical features on the 150-km wide plains. These prevalent features make the Namib one of the more climatically stable places in the world (Ward et al., 1983; Lancaster, 1989; Rust, 1991; Besler et al., 1994; Heine & Walter, 1996; Heine, 1998). This is re-enforced by the climatic characteristics in general of the western part of southern Africa, particularly in winter when high pressure systems dominate (Tyson, 1986; Preston-Whyte & Tyson, 1988; Tyson & Lindesay, 1992). The Namib Desert is believed to be 25-80 million years old with the present hyperarid phase being some 5 million years (Ward et al., 1983). An anticyclonic, high-pressure cell overlying the South Atlantic Ocean normally drives west winds up to the escarpment that prevents moist air masses that come from the east from penetrating the Namib. As a coastal desert, the Namib is strongly influenced by the Benguela current, which is characterised by cool, upwelling water. The water cools the overlying atmosphere, resulting in a stable temperature inversion layer. This layer prevents moist air that originates from the Atlantic Ocean from rising and forming rain clouds, although they do form fog clouds at lower levels. Only when the westerly winds and the temperature inversion subside can rain clouds that have managed to cross this far across the continent from the Indian Ocean penetrate the desert to bring patchy thundershowers. During winter, the influence of the Atlantic high-pressure cell weakens and east winds (also called “berg winds”) reach the Namib, but during this time of year its atmosphere is extremely dry and it rarely bears any rain due to effect of the strong high pressure system on the continent. The Central Namib is essentially a flat plain with a gradual 1% gradient in elevation from the coast up to the foot of the escarpment. Despite several river valleys, Inselbergs, and dunes, there are no major landscape features that would influence the macro-climate between the ocean and escarpment. This plain topography makes the Namib unique among deserts of the world (Taljaard, 1979). The relative featurelessness allows steady gradients to develop across the Namib from west to east affecting rainfall, fog, humidity, temperature, and wind patterns, as well as daily
PDF created with pdfFactory trial version www.pdffactory.com
Coastal Profile of the Erongo Region - August 1999 11
variations in these parameters. The iso-lines of these parameters run parallel to the coast. Some of the gradients are in opposite directions so that the climatic characteristics change from the coast inland (e.g. temperature increases and humidity decreases with distance from the coast; rainfall increases while variability of rainfall decreases with distance). Accordingly, the Central Namib has been divided into several zones that run parallel to the coastline, namely the cool foggy coastal zone, the foggy interior zone, the middle zone, and the eastern zone (see below), with a fifth zone, the Pro-Namib situated east of the Project Area. These zones facilitate analyses of vegetation, soil processes, and land use. Seasonality is not strongly developed in the Namib and the average temperature and humidity do not differ markedly in the course of the year. Summer and winter rainfall areas of southern Africa overlap in the southern part of the Central Namib, so that rain, rare and unpredictable as it may be, can occur at any time of year; in the northern part, summer rainfalls predominate. Seasons are, however, expressed in terms of changing wind patterns, and the occurrence of fog. Soil temperatures in the top 30 cm layer change by about 10oC between mid-summer and mid-winter as the sunshine hours and the angle of incidence of the sun’s rays change. 3.1.2 Climatic Zones Based on climate and features that reflect long-term climatic conditions (such as geomorphology & vegetation), the Central Namib has been divided into several zones that lie parallel to the coast (Besler, 1972; Hachfeld, 1996; Henschel et al., 1998a). This zonation facilitates biological and geomorphological analyses and is important for environmental planning. Following Henschel et al. (1998) it is proposed to split the middle area situated adjacent to the coastal zone (which Besler, 1972, termed alternating foggy zone, and Hachfeld, 1996, called minimum zone) into two zones, namely inland foggy zone and middle zone. These separate at the peak fog isohyet beyond which there is a strong decline in fog precipitation. Figure 3.1 shows the approximate locations of the boundaries. The Coastal Foggy Zone at the coast (eastern boundary about 20 km from the coast, widening around Wlotzkasbaken): generally cool and humid with very frequent occurrences of fog in the late afternoon, night and early morning, coming from a southerly direction. Cloud cover is rare besides fog. The annual mean temperature is around 16oC, increasing from coast, while the annual mean humidity is 87%, decreasing from the coast. Fog precipitation is over double the annual rainfall of 15 mm. The potential evaporation exceeds rainfall by a factor of 87 and fog by 39. The Interior Foggy Zone (20-60 km from the coast): high daily ranges in temperature and humidity with frequent, heavily precipitating fog at night, coming from a northerly direction. Evaporation exceeds rainfall by over 100-fold, but fog by only 10-fold. Except for precipitation and evaporation, the climate is similar to the adjacent inland zone. The Middle Zone (40-90 km from the coast with the eastern boundary only 60 km from the coast at Arandis): high daily ranges in temperature and humidity with occasional fog or dew in the early morning. Clouds occur rarely and average annual rainfall is 27 mm with the average annual fog precipitation being of a similar
PDF created with pdfFactory trial version www.pdffactory.com
Coastal Profile of the Erongo Region - August 1999 12
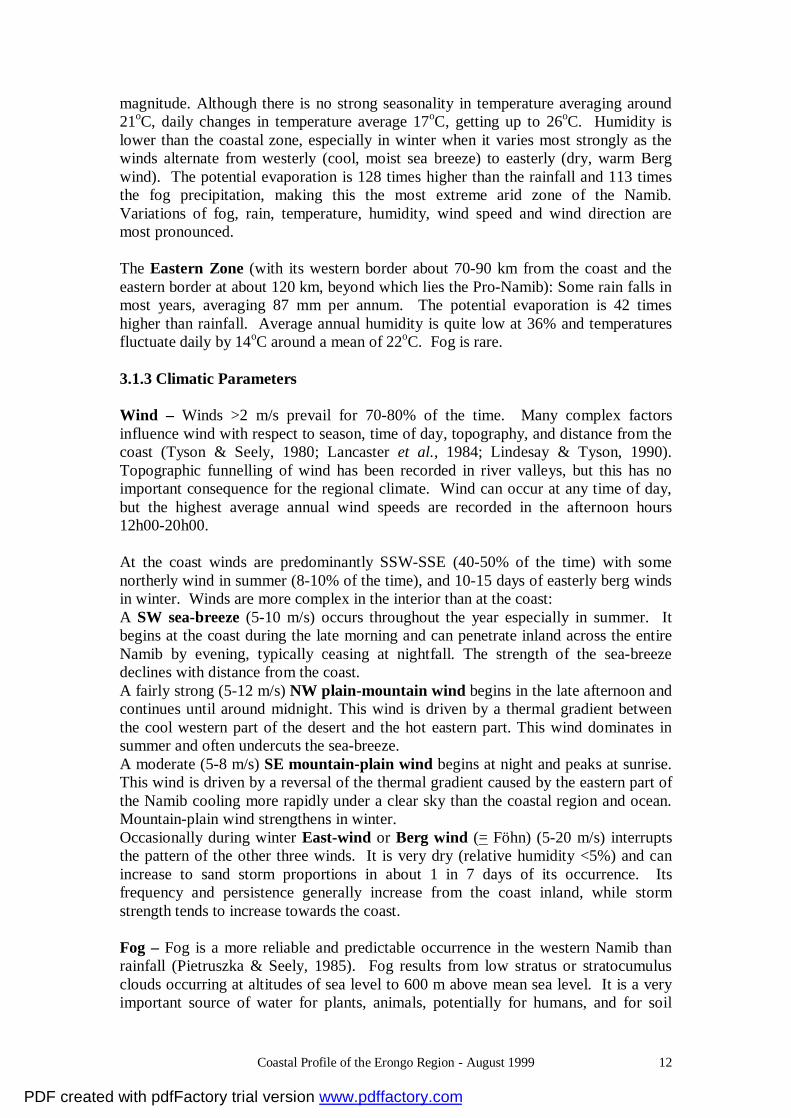
magnitude. Although there is no strong seasonality in temperature averaging around 21oC, daily changes in temperature average 17oC, getting up to 26oC. Humidity is lower than the coastal zone, especially in winter when it varies most strongly as the winds alternate from westerly (cool, moist sea breeze) to easterly (dry, warm Berg wind). The potential evaporation is 128 times higher than the rainfall and 113 times the fog precipitation, making this the most extreme arid zone of the Namib. Variations of fog, rain, temperature, humidity, wind speed and wind direction are most pronounced. The Eastern Zone (with its western border about 70-90 km from the coast and the eastern border at about 120 km, beyond which lies the Pro-Namib): Some rain falls in most years, averaging 87 mm per annum. The potential evaporation is 42 times higher than rainfall. Average annual humidity is quite low at 36% and temperatures fluctuate daily by 14oC around a mean of 22oC. Fog is rare. 3.1.3 Climatic Parameters Wind – Winds >2 m/s prevail for 70-80% of the time. Many complex factors influence wind with respect to season, time of day, topography, and distance from the coast (Tyson & Seely, 1980; Lancaster et al., 1984; Lindesay & Tyson, 1990). Topographic funnelling of wind has been recorded in river valleys, but this has no important consequence for the regional climate. Wind can occur at any time of day, but the highest average annual wind speeds are recorded in the afternoon hours 12h00-20h00. At the coast winds are predominantly SSW-SSE (40-50% of the time) with some northerly wind in summer (8-10% of the time), and 10-15 days of easterly berg winds in winter. Winds are more complex in the interior than at the coast: A SW sea-breeze (5-10 m/s) occurs throughout the year especially in summer. It begins at the coast during the late morning and can penetrate inland across the entire Namib by evening, typically ceasing at nightfall. The strength of the sea-breeze declines with distance from the coast. A fairly strong (5-12 m/s) NW plain-mountain wind begins in the late afternoon and continues until around midnight. This wind is driven by a thermal gradient between the cool western part of the desert and the hot eastern part. This wind dominates in summer and often undercuts the sea-breeze. A moderate (5-8 m/s) SE mountain-plain wind begins at night and peaks at sunrise. This wind is driven by a reversal of the thermal gradient caused by the eastern part of the Namib cooling more rapidly under a clear sky than the coastal region and ocean. Mountain-plain wind strengthens in winter. Occasionally during winter East-wind or Berg wind (= Föhn) (5-20 m/s) interrupts the pattern of the other three winds. It is very dry (relative humidity <5%) and can increase to sand storm proportions in about 1 in 7 days of its occurrence. Its frequency and persistence generally increase from the coast inland, while storm strength tends to increase towards the coast. Fog – Fog is a more reliable and predictable occurrence in the western Namib than rainfall (Pietruszka & Seely, 1985). Fog results from low stratus or stratocumulus clouds occurring at altitudes of sea level to 600 m above mean sea level. It is a very important source of water for plants, animals, potentially for humans, and for soil
PDF created with pdfFactory trial version www.pdffactory.com

Coastal Profile of the Erongo Region - August 1999 13
formation and rock weathering processes. Furthermore, it affects visibility for traffic at sea, on roads, and in the air. Fog precipitation increases from the coast inland, up to some 30-60 km away from the coast, and beyond this it declines strongly, although it does occasionally penetrate up to the escarpment. The seasonal distribution of fog differs between the coastal and inland foggy zones (Nieman et al., 1978; Lancaster et al., 1984; Henschel et al., 1998a). At the coast, the peak months are May - September, while inland the peak months are around August - October with a secondary peak around March. Fog precipitation varies between years, evidently following a cyclical pattern of 9 years (Henschel et al., 1998b). The trend is currently declining. Several kinds of fog occur in the Namib: Advective fog arrives at the coast during the afternoon with the southwesterly sea breeze at an altitude of <200m. It rarely penetrates further inland than 20 km and is the principal fog type of the Coastal Zone. High fog or Garua Fog is a low stratus or strato-cumulus cloud situated at 100-600m height below the inversion layer. It is transported from the ocean inland by a northwesterly wind and normally intercepts the land at 30-60 km inland at altitudes of 200-500 m above mean sea level in the Inland Foggy Zone. The interception front of this cloud traverses the land at speeds >10 m/s in a southerly direction, creating a wet band of 10-30 km width. This is the principal fog of the Inland Foggy Zone. Frontal fog with drizzle occasionally accompanies cold fronts for some distance across the Namib coast. Radiation fog develops when clear, moist coastal air meets the cool easterly mountain-plain wind, mixes, and forms a cloud at ground level with low wind speeds. Potential Evaporation – This factor increases steadily from the coast (1300 mm per annum) inland (3700 mm). In all zones it exceeds precipitation by 10-60 times. Temperature – Average annual air temperature increases from the coast (15oC) to the escarpment (22oC) without strong seasonal variation. On a daily basis, air temperature fluctuates only little at the coast (6oC), with extreme fluctuations of 17oC further inland, declining slightly near the escarpment. The maximum daily surface temperatures in mid-afternoon do change with season from 60oC in summer to 48oC in winter, a seasonal trend that can be traced down to 30 cm depth into the soil (31 vs. 25oC). Sunshine – The sun shines for 84% of all daytime hours in the interior, compared to 47% at the coast. The coastal sky is often obscured by an approaching fog bank. Solar radiation varies from 24 MJ.m-2 in summer to 14 MJ.m-2 in winter. Microclimate – Climatic parameters vary locally with habitat. For instance, river valleys, dunes, and mountains such as the Brandberg deflect or funnel winds. The opposite banks or slopes of these features heat up and cool down at different rates and times. Moisture that condenses on stones accumulates beneath them and evaporates
PDF created with pdfFactory trial version www.pdffactory.com
Coastal Profile of the Erongo Region - August 1999 14
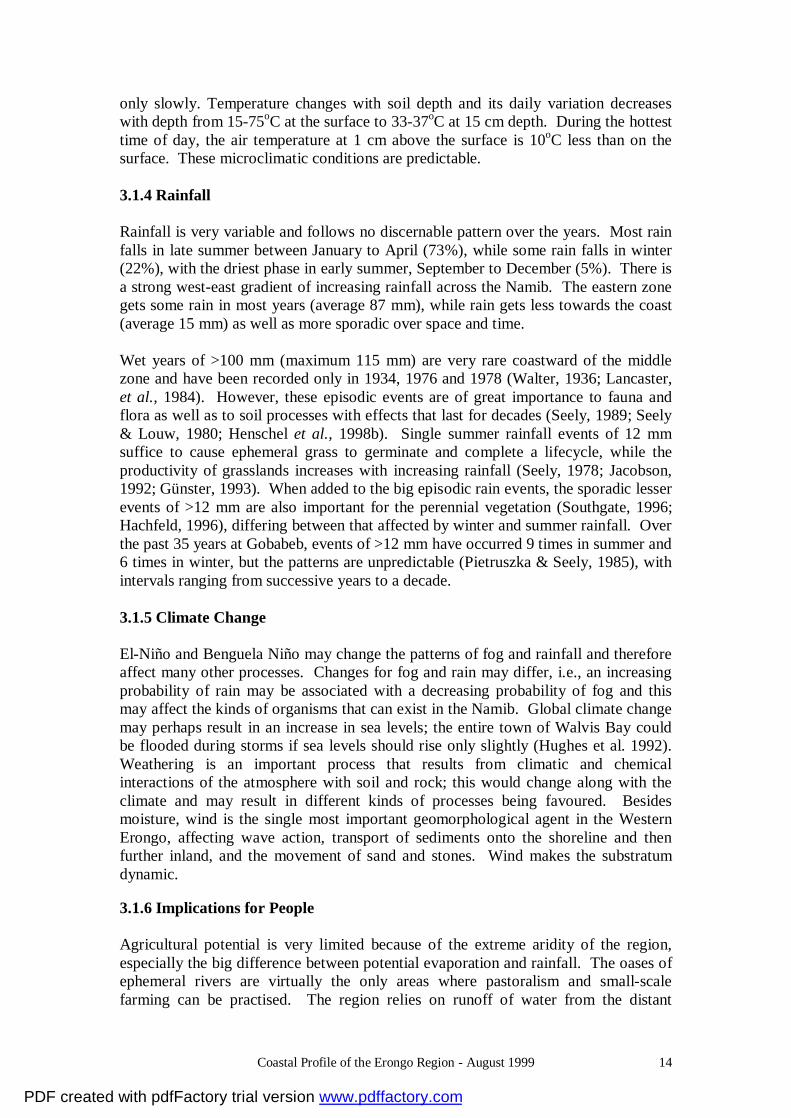
only slowly. Temperature changes with soil depth and its daily variation decreases with depth from 15-75oC at the surface to 33-37oC at 15 cm depth. During the hottest time of day, the air temperature at 1 cm above the surface is 10oC less than on the surface. These microclimatic conditions are predictable. 3.1.4 Rainfall Rainfall is very variable and follows no discernable pattern over the years. Most rain falls in late summer between January to April (73%), while some rain falls in winter (22%), with the driest phase in early summer, September to December (5%). There is a strong west-east gradient of increasing rainfall across the Namib. The eastern zone gets some rain in most years (average 87 mm), while rain gets less towards the coast (average 15 mm) as well as more sporadic over space and time. Wet years of >100 mm (maximum 115 mm) are very rare coastward of the middle zone and have been recorded only in 1934, 1976 and 1978 (Walter, 1936; Lancaster, et al., 1984). However, these episodic events are of great importance to fauna and flora as well as to soil processes with effects that last for decades (Seely, 1989; Seely & Louw, 1980; Henschel et al., 1998b). Single summer rainfall events of 12 mm suffice to cause ephemeral grass to germinate and complete a lifecycle, while the productivity of grasslands increases with increasing rainfall (Seely, 1978; Jacobson, 1992; Günster, 1993). When added to the big episodic rain events, the sporadic lesser events of >12 mm are also important for the perennial vegetation (Southgate, 1996; Hachfeld, 1996), differing between that affected by winter and summer rainfall. Over the past 35 years at Gobabeb, events of >12 mm have occurred 9 times in summer and 6 times in winter, but the patterns are unpredictable (Pietruszka & Seely, 1985), with intervals ranging from successive years to a decade. 3.1.5 Climate Change El-Niño and Benguela Niño may change the patterns of fog and rainfall and therefore affect many other processes. Changes for fog and rain may differ, i.e., an increasing probability of rain may be associated with a decreasing probability of fog and this may affect the kinds of organisms that can exist in the Namib. Global climate change may perhaps result in an increase in sea levels; the entire town of Walvis Bay could be flooded during storms if sea levels should rise only slightly (Hughes et al. 1992). Weathering is an important process that results from climatic and chemical interactions of the atmosphere with soil and rock; this would change along with the climate and may result in different kinds of processes being favoured. Besides moisture, wind is the single most important geomorphological agent in the Western Erongo, affecting wave action, transport of sediments onto the shoreline and then further inland, and the movement of sand and stones. Wind makes the substratum dynamic. 3.1.6 Implications for People Agricultural potential is very limited because of the extreme aridity of the region, especially the big difference between potential evaporation and rainfall. The oases of ephemeral rivers are virtually the only areas where pastoralism and small-scale farming can be practised. The region relies on runoff of water from the distant
PDF created with pdfFactory trial version www.pdffactory.com
Coastal Profile of the Erongo Region - August 1999 15
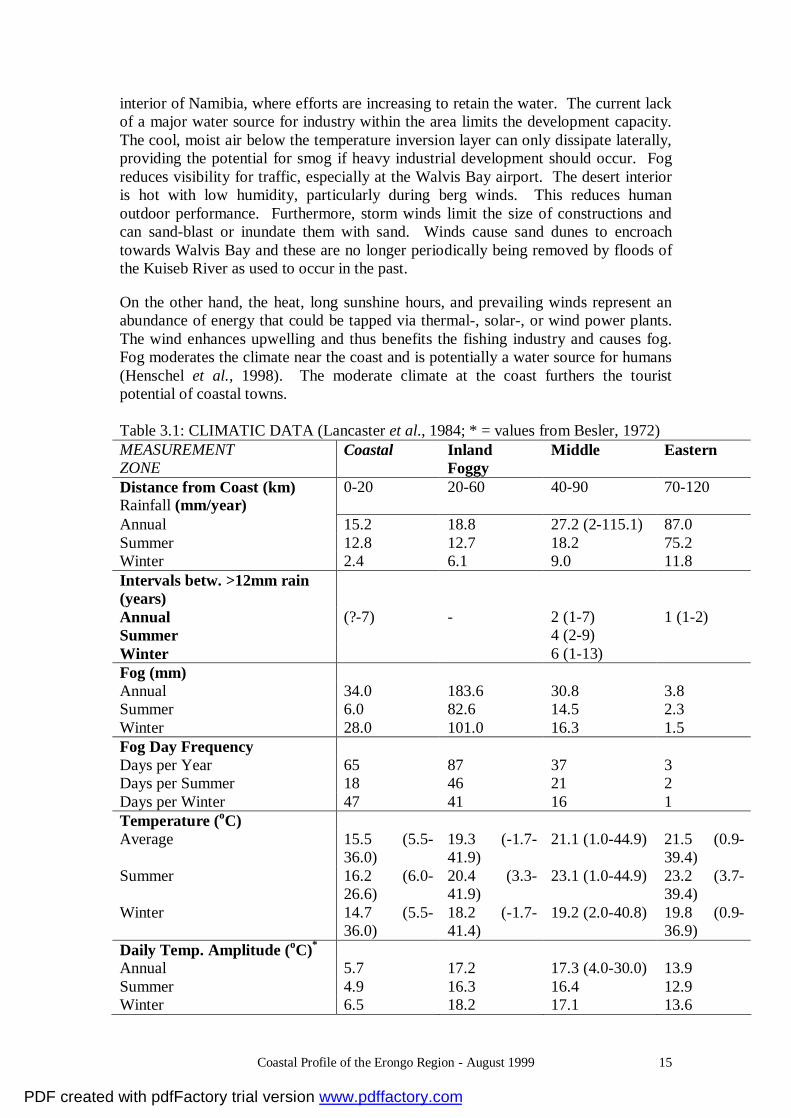
interior of Namibia, where efforts are increasing to retain the water. The current lack of a major water source for industry within the area limits the development capacity. The cool, moist air below the temperature inversion layer can only dissipate laterally, providing the potential for smog if heavy industrial development should occur. Fog reduces visibility for traffic, especially at the Walvis Bay airport. The desert interior is hot with low humidity, particularly during berg winds. This reduces human outdoor performance. Furthermore, storm winds limit the size of constructions and can sand-blast or inundate them with sand. Winds cause sand dunes to encroach towards Walvis Bay and these are no longer periodically being removed by floods of the Kuiseb River as used to occur in the past. On the other hand, the heat, long sunshine hours, and prevailing winds represent an abundance of energy that could be tapped via thermal-, solar-, or wind power plants. The wind enhances upwelling and thus benefits the fishing industry and causes fog. Fog moderates the climate near the coast and is potentially a water source for humans (Henschel et al., 1998). The moderate climate at the coast furthers the tourist potential of coastal towns. Table 3.1: CLIMATIC DATA (Lancaster et al., 1984; * = values from Besler, 1972) MEASUREMENT ZONE
Coastal Inland Foggy
Middle Eastern
Distance from Coast (km) Rainfall (mm/year)
0-20 20-60 40-90 70-120
Annual 15.2 18.8 27.2 (2-115.1) 87.0 Summer 12.8 12.7 18.2 75.2 Winter 2.4 6.1 9.0 11.8 Intervals betw. >12mm rain (years)
Annual (?-7) - 2 (1-7) 1 (1-2) Summer 4 (2-9) Winter 6 (1-13) Fog (mm) Annual 34.0 183.6 30.8 3.8 Summer 6.0 82.6 14.5 2.3 Winter 28.0 101.0 16.3 1.5 Fog Day Frequency Days per Year 65 87 37 3 Days per Summer 18 46 21 2 Days per Winter 47 41 16 1 Temperature (oC) Average 15.5 (5.5-
36.0) 19.3 (-1.7-41.9)
21.1 (1.0-44.9) 21.5 (0.9-39.4)
Summer 16.2 (6.0-26.6)
20.4 (3.3-41.9)
23.1 (1.0-44.9) 23.2 (3.7-39.4)
Winter 14.7 (5.5-36.0)
18.2 (-1.7-41.4)
19.2 (2.0-40.8) 19.8 (0.9-36.9)
Daily Temp. Amplitude (oC)* Annual 5.7 17.2 17.3 (4.0-30.0) 13.9 Summer 4.9 16.3 16.4 12.9 Winter 6.5 18.2 17.1 13.6
PDF created with pdfFactory trial version www.pdffactory.com
Coastal Profile of the Erongo Region - August 1999 16
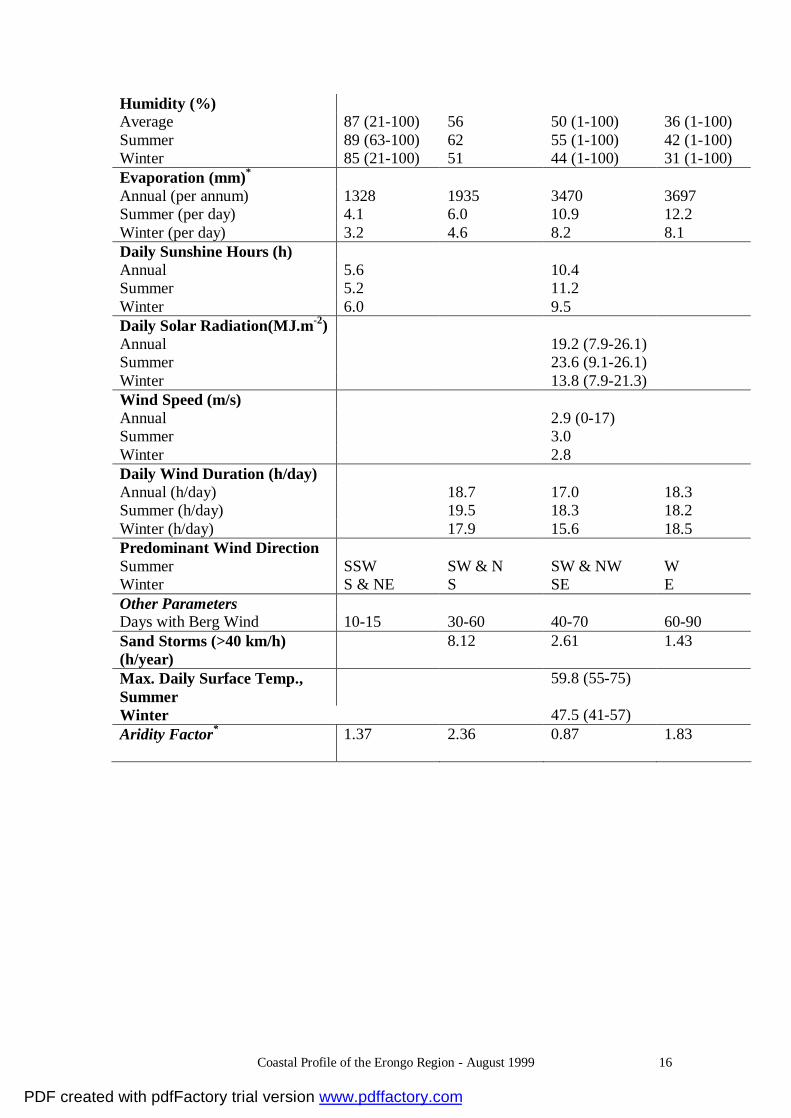
Humidity (%) Average 87 (21-100) 56 50 (1-100) 36 (1-100) Summer 89 (63-100) 62 55 (1-100) 42 (1-100) Winter 85 (21-100) 51 44 (1-100) 31 (1-100) Evaporation (mm)* Annual (per annum) 1328 1935 3470 3697 Summer (per day) 4.1 6.0 10.9 12.2 Winter (per day) 3.2 4.6 8.2 8.1 Daily Sunshine Hours (h) Annual 5.6 10.4 Summer 5.2 11.2 Winter 6.0 9.5 Daily Solar Radiation(MJ.m-2) Annual 19.2 (7.9-26.1) Summer 23.6 (9.1-26.1) Winter 13.8 (7.9-21.3) Wind Speed (m/s) Annual 2.9 (0-17) Summer 3.0 Winter 2.8 Daily Wind Duration (h/day) Annual (h/day) 18.7 17.0 18.3 Summer (h/day) 19.5 18.3 18.2 Winter (h/day) 17.9 15.6 18.5 Predominant Wind Direction Summer SSW SW & N SW & NW W Winter S & NE S SE E Other Parameters Days with Berg Wind 10-15 30-60 40-70 60-90 Sand Storms (>40 km/h) (h/year)
8.12 2.61 1.43
Max. Daily Surface Temp., Summer
59.8 (55-75)
Winter 47.5 (41-57) Aridity Factor* 1.37 2.36 0.87 1.83
PDF created with pdfFactory trial version www.pdffactory.com

Coastal Profile of the Erongo Region - August 1999 17
3.2 GEOLOGY 3.2.1 Onshore Geology The onshore coastal succession in Erongo Region consists of old crystalline rocks that form the basement to the Permo-Triassic Karoo Sequence and the young deposits of the Namib Desert. About 130 million years ago, several large and scattered magmatic complexes, now deeply eroded, were emplaced in central Namibia in a broad zone extending from the coastal area of the Erongo Region in a northeasterly direction. The crystalline basement in the Erongo region is represented by rocks of Abbabis Complex and the Nosib and Swakop Groups of the Damara Sequence. The Abbabis Complex forms the oldest stratigraphic unit in the area and outcrops in domes and anticlines. It consists of meta-sedimentary rocks (Schreiber, 1996). The Damara Sequence comprises a thick pile of metasedimentary rocks which were deposited in the period from about 900 to 700 million years ago along an old continental margin in two branches of an old ocean which extend in a northeasterly direction through central Namibia and a northwesterly direction along the Namibian coast. Based on stratigraphy. structure and metamorphic grade, the Damara Orogen is subdivided into zones, of which the Central Zone, the Northern Zone and the Southern Kaoko Zone are represented in the study area. The Nosib Group is predominantly siliciclastic. It is subdivided into the lower Etusis and upper Khan Formation, which generally have an interfingering relationship. The Etusis Formation consists predominantly of pinkish to buff-coloured, medium- to coarse grained meta-arkoses and micaceous to feldspathic quartzites and paragneisses. Conglomerate, mica schist, calc-silicate bearing quartzite and marble occur locally. The Khan Formation is predominantly made up of massive to bedded, greyish-green calc-silicate rocks. Layers of meta-conglomerate occur locally. A unit of interbedded amphibolite and biotite schist is present near the Rössing Dome (Schreiber, 1996). Just north of the Omaruru River due east of Cape Cross, quartzites of the Naauwpoort Formation occur. The Swakop Group in the southern part of the study area (Central Zone) is subdivided into the Rössing, Chuos, Arandis, Karibib and Kuiseb Formations. The Rössing Formation comprises bluish-grey dolomitic marble, minor quartzite, metaconglomerates, schist, gneiss and calc-silicate rocks. The bulk of the Chuos Formation consists of dark-grey to greenish-grey diamictites. Subordinate interbedded quartzite and marble occur within pebble-bearing schists. The Arandis Formation contains schists, calc-silicate rocks and marbles. The marble-dominated Karibib Formation is widely distributed in the study area and underlies large parts of the flat, poorly exposed coastal region. The Kuiseb Formation is the youngest lithostratigraphic unit of the Swakop Group, and the major rock type is mica schist (Schreiber, 1996). In the northern part of the study area (Northern Zone and Southern Kaoko Zone) the Swakop Group is mainly represented by mica-schists and quartzites of the Kuiseb Formation and meta-greywacke and meta-pelite of the Amis Formation, as well as
PDF created with pdfFactory trial version www.pdffactory.com

Coastal Profile of the Erongo Region - August 1999 18
meta-greywackes and pelites of the Brak River Formation and marbles and pelites of the Gemsbok River Formation. The Brak River, Gemsbok River and Amis Formations belong to the Zerrissene Group, a turbiditic equivalent to the rocks of the Karibib Formation consisting of a thick sequence of schist with two interbedded limestone marker horizons (Miller, 1983). The Damaran intrusive rocks are dominated by granites of syn- to post-tectonic age. Locally, alaskites occur. They intruded about 560 million years ago. The Karoo Sequence is represented in the northern part of the study area and comprises siltstones, quartzites, shales and mudstones of the Verbrande Berg, Huab and Gai-As Formations. These are overlain conformably by the Etendeka Formation volcanics in the Goboboseb Berge area. The volcanics include basalts and quartz-latites. Karoo volcanics also intruded as dykes that now form the prominent long black ridges in the desert. The magmatic complexes present in the study area are the Brandberg, Messum Crater, the Cape Cross Complex and the Spitzkoppe. The Brandberg Complex represents an anorogenic ring complex emplaced during Jurassic-Cretaceous times at a high level in the crust. At the present level of erosion the complex exhibits a number of subvolcanic, magmatic centres which are entirely granitic in composition. Granitic and quartz-monzonitic rocks were emplaced as cone sheets outside the caldera or as thick, ring-shaped sheets. Several types of post-magmatic, hydrothermal alteration processes can be recognised (Diehl, 1990). The Messum Crater is entirely surrounded by the lava succession of the Goboboseb Berge. Messum comprises two petrological and structural entities: a wide outer ring of gabbroic and intermediate to acid intrusive rocks and a core of agglomerates and breccias intruded by syenites, nepheline syenites and acid rocks. It is believed that the two are separated by a major ring fault, which is largely occupied by syenitic ring dykes (Milner et al., 1988). Inward dipping basaltic volcanics form the eastern margin of the Cape Cross Complex, but their relation to the complex itself is not clear. Early sills of olivine gabbro that intrude the lavas were followed by the emplacement of voluminous alkali granite. Small bodies and dykes of foyaites, syenodiorite, hercynite syenite, essexite and tinguaite predate and postdate the granite. It was in a pegmatite associated with the complex that light blue crystals of Jeremejevite, up to 10 cm long, were found. This is only the third known locality in the world, the other two having sugar-sized crystal fragments only (Milner et al., 1988). The Grosse and Kleine Spitzkuppe consist of well-jointed, homogenous biotite-granite. The Kleine Spitzkoppe contains numerous drusy pegmatites in which the walls of the cavities are lined with euhedral crystals of microcline, accompanied in places by amazonite, topaz and light blue aquamarine. The young sediments of the Kalahari Group were formed as a result of a combination of fluctuating sea levels through time and the strong long-shore drift which transported marine sediments northwards to form sandy beaches. Under the influence
PDF created with pdfFactory trial version www.pdffactory.com

Coastal Profile of the Erongo Region - August 1999 19
of the strong southwesterly winds the sand on these beaches was picked up and blown inland to form the dune belts of the Namib Desert represented in the southern part of the project area. The westerly flowing rivers are flooding periodically. The Kuiseb River flows strongly almost every year, and although it rarely reaches the sea, there is sufficient flow for it to transport all the dune sand blown into the river bed downstream to its delta. This regular flooding has prevented the dunes of the main Namib Sand Sea from migrating across the Kuiseb and covering the desert plains to the north. Also in the Erongo Region, the Swakop, Omaruru and Ugab Rivers reach the sea during good summer rainy seasons and are depositing alluvial sediments. 3.2.2 Offshore Geology Only 20 km seaward from the coast are included in the study area. However, to understand the offshore geology, a description of a wider part of the continental shelf is necessary, and therefore given below. A sedimentary basin occurs offshore the Erongo Region, namely the Walvis Basin. The offshore sedimentary succession consists of four main units. From oldest to youngest, these are: a) Pre-rift rocks, deposited between 280 and 133 million years ago and lithified before the supercontinent, Gondwanaland, broke up into new continental fragments; b) Syn-rift rocks, deposited between about 133 and 117 million in deep rift valleys which formed as Gondwanaland was beginning to break up; c) A transitional succession deposited between about 117 and 110 million years ago as a narrow Atlantic Ocean began to flow into the gap between the newly formed African and South American continents and they started to drift away from each other; d) A thermal sag or drift succession, itself divided into several major units, which was deposited from 110 million years ago onwards on the subsiding western edge of the African continent as Africa and South America moved further and further apart. The Permo-Cretaceous Karoo Sequence, known from the adjacent onshore, forms the pre-rift succession, referred to as Basin and Range, and is probably only intermittently present offshore. The Sequence contains shales and siltstones, as well as fluviatile and regionally extensive aeolian sandstones. The lower Cretaceous syn-rift succession fills a large almost continuous half graben up to 100ÿkm wide and possibly as much as 10 km deep that extends from the Walvis Ridge southwards into South African waters. The syn-rift succession, although not penetrated by drilling, is believed to contain both volcanic and sedimentary rocks. In the Namibe Basin, syn-rift half grabens are small and shallow. Based on seismic expression, they appear to be filled mainly by sedimentary rocks that are possibly slightly younger than the syn-rift rocks south of the Walvis Ridge.
PDF created with pdfFactory trial version www.pdffactory.com

Coastal Profile of the Erongo Region - August 1999 20
The transitional succession is thin and marks the transition from rift conditions to the onset of marine conditions. In the Walvis Basin, where the transitional succession may be lower to middle Cretaceous in age, drilling has intersected lavas, sandstone and limestones. Deeper water equivalents appear to contain shales. The drift succession consists of middle Cretaceous to Tertiary sediments with some associated middle to upper Cretaceous volcanic rocks on and near the Walvis Ridge. South of the Walvis Ridge, the Cretaceous succession is thick and the Tertiary thin. The upper Cretaceous and lower Tertiary parts of the drift succession are characterised by channelling on the continental shelf and slope and associated abundant channel, fan and turbidite deposits on the slope, lower slope, base of the slope and even beyond the base of the continental slope. These fan deposits could be sand rich (Schneider & Miller, 1998). 3.3 GEOPHYSICS The magnetic and radiometric signature of mineral deposits is often distinctive from that of the rocks that enclose such deposits and airborne geophysics has therefore become a powerful tool and major incentive for mineral exploration. In the late 1960's and early 1970's regional airborne surveys were conducted over the Erongo Region primarily to support the uranium exploration being conducted at the time. These surveys were the precursor for a programme of annual surveys which by 1990 resulted in 85% coverage of Namibia. Recent advances in geophysical instrumentation, computer processing and improved navigation through global satellite positioning systems (GPS) have enabled high resolution airborne surveys to be undertaken along closely spaced survey lines. These high resolution surveys result in maps and digital products which, though used primarily for mineral exploration, are being increasingly used for the development and exploitation of underground water resources, and in a variety of critical areas such as land use planning and the environment. In 1994-1996, as part of the European Union Sysmin programme, a high-resolution airborne geophysical survey was conducted over parts of the Erongo region. The resultant magnetic map reveals valuable information on the bedrock geology, often concealed by surficial sands and gravels. The magnetic highs (white and red areas) are indicative of intrusions or basement inliers which may host mineralisation. The numerous linear magnetic dykes are also clearly seen from the magnetic map and these may host semi-precious stones of interest to small scale mining operations. These structural linears can also assist in the location of small aquifers able to support small developments such as tourist camps. A radiometric map clearly represents the near surface geology and soils as well as indicating areas of enhanced uranium. The radiometric maps also provide baseline information for monitoring the effects of mining and waste disposal on the environment. To provide calibration of the radiometric instrumentation a 12 km test grid has been established at Henties Bay. This world class facility is being used by
PDF created with pdfFactory trial version www.pdffactory.com

Coastal Profile of the Erongo Region - August 1999 21
survey aircraft operating surveys throughout southern Africa (D Hutchins, pers. comm.). 3.4 GEOMORPHOLOGY The geomorphology of the study area is characterised by the approximately 100 km wide coastal plain of the Namib Desert, which covers the entire western area of the Erongo Region. To the east, in a line approximately from Usakos to Uis, the Great Escarpment divides the coastal plains from the central plateau. Nevertheless, the Great Escarpment is not very well developed in the study area. The study area is furthermore characterised by the presence of inselbergs such as Gross and Klein Spitzkoppe and the Brandberg, as well as the large ephemeral river systems of the Ugab, Omaruru, Swakop and Kuiseb Rivers. The Kuiseb River forms the northern boundary of the Namib Sand Sea, since regular flooods have so far prevented the sand dunes from travelling further north. There is, however, one exception in the form of the narrow dune belt between Walvis Bay and Swakopmund. North of the Swakop River, the rocky plains of the Namib prevail. 3.5 SOILS The formation of soils under arid conditions is dominated by exogenetic processes such as physical weathering and transportation. In the Namib, such transport is dominantly aeolian. Chemical weathering is limited by the availability of water. Nevertheless, fog in the coastal Namib contributes to the weathering process, in particular since it contains marine salts. Along the coast from Walvis Bay to Ugabmund, halomorphic soils such as solonchaks prevail. Solonchaks are soils with a high content of soluble salts; they are usually of light colour and have no structure. As a consequence, solochaks only develop under salt-tolerant vegetation; they are characterised by poor drainage and seepage from the sea. South of Walvis Bay, in the domain of the Namib Sand Sea, soil formation is extremely limited to littoral sands representing arenosols. They have a low water-retaining capacity and are extremely sensitive to wind erosion. Further inland, in the area characterised by extremely little rainfall but out of the reach of the coastal fog, fersialitic sands and minor loams are developed. They are derived from the weathering of the country rock and aeolian redistribution; and are characterised by a low water-retaining capacity. In the eastern part of the study area, thin lithosols are developed in places on the marbles and schists comprising the bedrocks. They are, however, confined in extend due to the morphology of the area (Schneider, 1990). 3.6 MINERAL RESOURCES 3.6.1 Salt In the Erongo Region, two types of salt occurrences can be distinguished. These are salt formed by solar evaporation in coastal pans and fossil rock salt in coastal pans. With evaporation by far exceeding precipitation, the windy, arid climate along the west coast of Namibia is ideal for cheap production of salt by solar evaporation. Sea
PDF created with pdfFactory trial version www.pdffactory.com

Coastal Profile of the Erongo Region - August 1999 22
water provides an unlimited source of brine. Numerous natural pans occur close to the sea while vast, flat-lying areas adjoining them are also available for future expansion. Prior to 1914 salt had been produced on a small scale in the Panther Beacon Pan 9 km north of Swakopmund. Between 1920 and 1930 more pans were exploited and according to available figures, production rose continuously from 1924 to 1950. During this period practically all the salt was consumed locally, mainly as cattle feed. Since 1951, however, the development of chemical industries in South Africa increased the demand for salt, creating the first export market for coarse salt from the Panther Beacon Pan. Except for a small quantity of salt recovered in three small pans situated in the tributaries of the Kuiseb River southeast of Walvis Bay, all other coastal pans harvested at that time were situated between Swakopmund and the Ugab River, the Panther Beacon Pan yielding the bulk of the production. With the salt industry as the main economic activity in the Swakopmund area during the 1950s, over-production and price-cutting ensued. In order to prevent economic collapse, ten of the twelve main producers reached an agreement during 1958 to establish Swakopmund Salt (Pty) Ltd, through which all the salt could be marketed. This agreement gave the necessary stability to the industry and the majority of producers today supply salt to Swakopmund Salt (Pty) Ltd. Until 1951 trenches and pits were dug in rows across salt pans. The brine seeping into the pans was then allowed to concentrate through solar evaporation and the salt that eventually crystallised was scraped together and removed. The bitterns were washed away with brine. In this way salt of varying purity was obtained. Since 1951 sea water has been used as a direct source of brine and salt of consistently high purity has been produced. Numerous pans are scattered along the west coast from the Orange River in the south to the Kunene River in the north. The sedimentary sequence in the floors of these pans shows little variation. The following section obtained from a hole near the northeastern edge of the pan at Torra Bay is a typical example: 0-10 cm brown sand with gypsum and salt 10-15 cm Fine to medium-grained sand 15-20 cm brown clayey sand 20-28 cm sand 28-38 cm brown clayey sand 38-123 cm fine sand The water level is 46 cm below surface. Coastal pans may be subdivided into shoreline pans and pans located away from the shoreline. Pans elongated parallel to the coast and situated near the high water mark range in size from less than 10 000 m² to over 60 km²; more than 30 are larger than 70 000 m². The pans are commonly separated from the sea by sand or rocky bars or a
PDF created with pdfFactory trial version www.pdffactory.com
Coastal Profile of the Erongo Region - August 1999 23
combination thereof. Because the west coast is an emerging shoreline affected by the Benguela Current flowing northwards, sandspits grow northwards from headlands across embayments, giving rise to lagoons. Pelican Point to the west of Walvis Bay is a typical example of this process in progress. The lagoons become silted up with sediments supplied by the sea and wind, and occasionally by torrential rivers as well as by salt precipitated by solar evaporation. The pans thus formed usually have a brown, virtually flat surface, generally situated only a few centimetres to one metre above mean sea level. Brine in the pans is replenished by sea water washing in during spring tides or percolating through the sand bars. In some pans tidal fluctuations also have an effect on the brine level. The major concentration of pans occurs between Meob Bay in the south and 18o south latitude. The larger ones in the Erongo Region, from south to north, are located at Walvis Bay, Panther Beacon, Cape Cross and at the Ugab River mouth. Today, salt is produced at the Panther Beacon, Cape Cross and Walvis Bay pans. 3.6.2 Heavy minerals Heavy minerals such as ilmenite, rutile, monazite and zircon, derived from metamorphic rocks and pegmatites of the Damara Sequence in the hinterland, are present in the sand dunes of the Namib sand sea and are typically concentrated on their lee side. While pure ilmenite and rutile grains are abundant, ilmenite can also contain exsolution lamellae of hematite. Rutile frequently contains inclusions of ilmenorutile and ilmenite. An investigation of the shifting sand dune belt between Walvis Bay and Swakopmund, the most accessible part of the Namib sand sea, revealed an average content of 4.8% ilmenite, 0.08% rutile and 0.22% zircon, and, on the basis of 85% recovery, reserves of 36 million t of ilmenite, 575 000 t of rutile and 1.65 million t of zircon (Miller, 1980). Recent sediments within the storm-beach section of the Namibian coast, approximately 1.5 to 3ÿm above sea level, contain layers of heavy minerals composed of ilmenite, rutile, magnetite, garnet, staurolite, zircon and monazite. On average, the coastal sands contain 7% heavy minerals. The composition of the heavy mineral component depends on the rocks which outcrop in the vicinity. Heavy mineral concentrations associated with metamorphic rocks of the Damara Sequence occur north of Swakopmund, north of the Panther beacon Pan, 5km south of Henties Bay and 45km south of Ugabmund. Heavy mineral layers, believed to be derived from granite, are found 26 and 32km south of Ugabmund and 35km south of Cape Cross. A placer deposit 6km north of Cape Cross is related to the decomposition of basalt of the Karoo Sequence. The amount of heavy minerals occurring in these various deposits is listed in the following Table (Hugo, 1968). Ilmenite (%) Rutile(%) Zircon(%) Garnet (%) 5-30 km north of Swakopmund 8.6 0.15 0.23 27 50-60 km north of Swakopmund 8.7 0.43 1.07 25 70-130 km north of Swakopmund 2.45 0.32 0.85 60
PDF created with pdfFactory trial version www.pdffactory.com
Coastal Profile of the Erongo Region - August 1999 24
3.6.3 Marine Minerals 3.6.3.1 Diatomite A diatomaceous mud belt occurs off the coast of Namibia. This 740 km-long body stretches from Rocky Point in the north to Sylvia Hill, about 250 km south of Walvis Bay. The average thickness is 5.1 m while the mean breadth is 33 km with a maximum of 76 km off Walvis Bay, giving a total volume of 127 km3. A maximum of 88 % opal in mud was found in the broad embayment of Walvis Bay. Near Pelican Point, the mud is under 1 m of water, whereas the average depth for the body is 83 m. Budget calculations indicate that approximately 5 million t of silica are deposited annually. Terrigenous detritus, mainly quartz and mica, contaminate the landward flank of the diatomaceous mud belt, and CaCO3 and organic matter are the most common dilutants along the seaward flank. Diatoms have the greatest species diversity of phytoplankton of the Namibian shelf, with 184 different species identified. The assemblage is dominated by Chaetoceros sp., Actinocyclus ehrenbergii, Coscinodiscus sp., Fragilaria karstenii, Thalassionema nitzchioidea and Raphoneis surirelliodes (Bremner, 1979; 1983). 3.6.3.2 Phosphate Research on superficial shelf sediments off the Namibian coast has led to the discovery of anomalous phosphate concentrations. The continental margin of Namibia has long been recognized as one of the most biologically productive regions of the world's oceans. The width of the Namibian shelf varies from 40 km off the mouth of the Kunene River to about 160 km off both Walvis Bay and the Orange River mouth area. The physicogeographical conditions of the coastal and shelf areas are exceptional in that they consist of a relatively smooth depositional plain interrupted in places by major scarps, depressions and banks, whereas the continental hinterland is characterized by expressive topography. The supply of terrigenous material is at present confined to the areas off the perennial Orange and Kunene Rivers as the hinterland is arid to semi-arid. There is a slow accumulation of sand and silt on the rest of the shelf. Of great importance is the continuous upwelling of deep waters into the photosynthesis zone which is caused by the northward flow of the Benguela Current and by the driving effect of the trade winds. This upwelling of deep waters leads to changes in the physical and chemical characteristics of the shelf waters, such as lowering of the water temperature, decrease in salinity and oxygen content, increase in the concentration of biogenic components (phosphates, silica) and lowering of pH. All these factors lead to exceptionally high biological activity and plankton density in the photosynthesis zone. High phosphorus concentrations (up to 14.9 % P2O5) are mainly associated with biogenic calcareous and siliceous sediments, which together with fine- and medium-grained, terrigenous phosphorite sands, contain up to 23 % P2O5. Pelitic material is less favourable for concentrations of phosphorus.
PDF created with pdfFactory trial version www.pdffactory.com

Coastal Profile of the Erongo Region - August 1999 25
The following modes of phosphate occurrences have been observed on the shelf: i.) Rounded to spherical phosphate grains, 0.1 to 0.25 mm in diametre, occur in all types of sediments. The origin of these grains with an average phosphate content of 22 % is uncertain. They could either be phosphatized coprolites, phosphatized casts of foraminifera or products precipitated from solutions oversaturated with phosphorus. ii.) Recognizable phosphatized organic remains such as coprolites, material filling the voids of foraminifera and their casts, phosphatic bones, teeth and fish scales. iii.) Phosphate nodules and concretions as well as straw-yellow unconsolidated phosphorite which usually occur in diatomaceous sediments and oozes and are often contaminated with hydrogen sulphide. In some of these nodule-bearing formations the P2O5 content can be as high as 30 %. There is a definite pattern to the distribution of phosphate in the shelf sediments. The greater part of all sediments contains 0.5 to 0.7 % P2O5 which can therefore be regarded as the background value. Sediments with high P2O5 concentrations are concentrated in two areas along the Namibian coast, namely south of the Kunene River mouth off Cape Fria and between Walvis Bay and Lüderitz Deposits between Walvis Bay and Lüderitz contain 1430 Million t of P2O5 and grade more than 4.6 % (maximum 23 % P2O5) at depths of 200 to 350ÿm. It has been found that the regions of maximum phosphorus concentration in sediments coincide well with regions of persistent upwelling of deep water. In addition, maximum phosphorus concentrations coincide mainly with water depths of 150 to 215 m. It has been proven that neither the diatomaceous mud belt nor the upwelled waters of the Benguela Current are environments conducive to the inorganic precipitation of carbonate fluorapatite" and therefore upwelling of cold, nutrient-rich water can only be an indirect agent in the eventual precipitation of phosphate from supersaturated interstitial fluids, mainly along the landward side of muddy sediments. The origin of these deposits is associated with upwelling of nutrient-rich water onto the shelf and the resultant high biological productivity. Mass mortality of marine organisms and rapid biogenic sedimentation enriches the bottom sediment in organic material and elements required for glauconite and phosphorite mineralisation (Bremner, 1980; Senin, 1970; Birch et al., 1978). 3.6.4 Gypsum Gypsum is a widespread material cementing recent superficial sand and gravel in the coastal Namib belt, particularly north of the Kuiseb River and south of Cape Cross in an area covering at least 1000 km². The gypsum is an alteration product of Tertiary and Pleistocene calcretes, with the sulphur derived from anaerobic zones in the Atlantic ocean. Hydrogen sulphide precipitates during misty conditions and reacts with calcrete to form CaSO4. Several million tons of gypsum-bearing sediment grading more than 90% have been located within a radius of about 50 km of Swakopmund and Walvis Bay.
PDF created with pdfFactory trial version www.pdffactory.com
Coastal Profile of the Erongo Region - August 1999 26
Approximately 40 km east-northeast of Walvis Bay slightly elevated Pleistocene river terraces comprising gypsiferous material occur near the dry watercourse of the Tumas River. The best gypsum is found as a solid surface layer which varies from 30 to 90 cm in thickness and is almost devoid of overburden. The grade of this hard, tough and massive brownish-white gypsum is generally more than 90% and reserves are estimated at more than 4 millionÿt. The gypsiferous material lower down varies considerably in extent and quality. In some places the layers are thin and contain less than 20% gypsum, while elsewhere they reach thicknesses of more than 3.5 m and average over 80% gypsum. A total of 2600 t of gypsum was produced during the period from 1967 to 1970 by Elspe Mining Co. in the Tumas area. During 1963, prospecting operations in an area situated 20 to 25 km east-southeast of Walvis Bay outlined gypsum deposits. Covering an area of approximately 85 ha, the Draaihoek deposit lies 20 km east of Walvis Bay. Hidden under 8 cm of sand cover, the deposit consists of buff-coloured rosettes with tabular crystals of selenite and, in places, satin spar, all adhering to form a highly porous layer with an average thickness of 35 cm. The interstices are filled by varying amounts of sand and pebbles. Isolated patches of finer-grained, solidified gypsum of a higher grade are found within the more friable material. Reserves are estimated at about 315 000 t. Grades are between 66 and 77% gypsum. The Bos deposit comprises two types of gypsum, viz. an alabaster variety and a more friable, coarsely crystalline type. The former occurs as an irregular body extending over some 95 ha within the latter. The gypsum layer varies in thickness from 25 to 35 cm and is concealed by 5 cm of sand and pebbles. Reserves of the alabaster type are estimated at approximately 408 000 t averaging more than 80% gypsum, whereas the remaining reserve is estimated at 900 000 t with a grade varying from 30 to 87% gypsum. The Klip deposit lies to the northwest and west of the Bos and Draaihoek deposits respectively, and covers an area of approximately 230 ha. The entire area along the Atlantic coast between the Swakop River and Cape Cross has been investigated for gypsum. Gypsum was found to occur in two layers. The surface or "A" layer contains well-crystallized brown crystals and small lenses of gypsum in sand and poorly sorted pebbles. It is 50 cm to 1 m thick. This surface layer is underlain by a "B" horizon which consists of massive impure gypsum mixed with poorly-sorted sediment. It has a thickness of 50 cm to 3 m. The greatest development of gypsum layers coincides with the mist belt which extends eastwards from the coastal road to some 5 km inland. From 15 to 32 km east-southeast of Swakopmund, large tracts are covered by gypsiferous material. Analyses of samples indicate that these deposits contain up to 93% gypsum. The White Lady Salt Pan 40 km north of Henties Bay contains a large deposit of rock salt overlain over much of its area by a surface layer of fine-grained gypsum. The pan is 15 by 3.5 km in size, and the gypsum layer attains its greatest thickness of 1.5 m along its western, seaward margin. It decreases progressively eastwards. The gypsum layer has a friable, sandy texture, and apart from a less than 1 cm thick sandy surface layer, appears to be free of impurities. The contact between the gympsum and the underlying salt is sharp.
PDF created with pdfFactory trial version www.pdffactory.com

Coastal Profile of the Erongo Region - August 1999 27
In an area about 45 km southeast of Walvis Bay, prospecting revealed flat river terraces of gypsiferous material consisting of gypsum-cemented sand, gravel and conglomerate. A total of 43 pits sunk in this area revealed that concentrations of very pure crystalline gypsum form irregular dome-shaped shells about 1 m in diameter and up to 30 cm thick. Grades vary from 10% to over 90 % CaSO4. Minor gypsiferous deposits are found in the salt pans of the coastal belt north of Swakopmund (Schneider & Genis, 1992b). 3.6.5 Dimension stone Virtually the full spectrum of rock types used in the dimension stone industry is present in Namibia. Some of them are quarried in the coastal area. 3.6.6 Guano harvesting Thirteen small guano islands are spread out along the west coast between Walvis Bay and the Orange River mouth. They are Hollamsbird Island, Ichaboe Island, Seal Island, Penguin Island, Halifax Island, North Long Island, South Long Island, Albatross Island, Pomona Island, Plumpudding Island and Sinclair's Island. The first occurrence of guano on Ichaboe Island was reported in 1828 by the captain of an American schooner, and between 1844 and 1845 the island was scraped, during which time some 250 000 t were removed. This fossil guano contained high amounts of nitrogen and phosphate. Guano scraped in the later years of the last century assayed only 3.7 to 8.5% nitrogen and 8.5 to 11.5% phosphate and in addition contained impurities of sand, clay and gravel. Onshore at Cape Cross, a rich deposit of guano was completely worked out by the Damaraland Guano Company some years before World War I. In 1930 about 196 t and in 1934 about 15 t of guano were again produced from this locality. From 1939 to 1943, another 1542 t of guano were produced. Today, guano is produced intermittently from the islands, but more importantly from platforms in the Erongo Region. From 1844 to 1991 a total of 869 332 t of bird guano was recovered, averaging almost 6000 t per annum. Half of this total amount was recovered during the early guano boom between 1844 and 1851. 3.6.7 Tin, Tungsten, Niobium-Tantalum Tin and tungsten has been produced at the now defunct Brandberg West Mine, which is described in detail under the section on abandoned mines. Likewise, the closed tin mine of Uis is described in that section. A number of other occurrences of tin and niobium-tantalum is related to pegmatites of the Cape Cross - Uis pegmatite belt in the project area. These are mainly small occurrences, that have been worked on an intermittent basis. They are listed in the attached table.
PDF created with pdfFactory trial version www.pdffactory.com

Coastal Profile of the Erongo Region - August 1999 28
3.6.8 Copper, Lead, Zinc A once important producer of copper was the Khan Mine, which is described in detail under the section on abandoned mines. During the late 1970s and early 1980 extensive sampling and drilling located a copper anomaly at the so-called Arandis Grant. Approximately 5 km east of Arandis Siding, copper is present in a skarn zone of a pegmatite emplaced in biotite schist of the Khan Formation. North and east of the Rössing Mountain, widespread limonite outcrops and gossans of ferruginous siliceous and manganiferous material were investigated in the 1970s. Very sparse dissemination of native copper and copper minerals disseminated in lava flows of the Etendeka Formation occur at Copper Valley north of Messum (Schneider & Seeger, 1992a). The most important occurrence of lead and zinc is the Namib Lead Mine described under the section of large scale mining. The occurrence of zinc in quartz-mica schist and marble of the Rössing Formation has been reported from a site about 10 km southwest of Rössing Siding. Geochemical surveys on the eastern side of Rössing Mountain also show anomalous zinc values (Wartha & Genis, 1992). Other, smaller occurrences are listed in the attached table. 3.6.9 Lithium, Beryllium Occurrences of lithium and beryllium minerals are, similar to tin and niobium-tantalum, associated with the pegmatites of the Cape Cross - Uis Pegmatite Belt. They have only been mined intermittently and on a small scale and are listed in the attached table. 3.6.10 Uranium The area's world class uranium producer, Rössing Uranium Mine, is dealt with in the section on large scale mining. The project area comprises a uranium province with a number of occurrences of different genetic types. The GP Louw prospecting grant area surrounds the Rössing Mine grant and was first examined after an airborne geophysical survey in 1968 indicated a number of radiometric anomalies. Reconnaissance ground radiometric surveying, geological mapping and limited test drilling was completed in 1970. The GP Louw area is underlain by the same rock types as the Rössing Uranium deposit, and the stratigraphy, structure and metamorphism are broadly similar. Uranium mineralisation is closely associated with alaskitic granites and pegmatites. Uraninite is the predominant hypogene radioactive mineral. A large number of radiometric anomalies have been located immediately to the south and west of the Rössing Mountain located over lithologies of the Nosib and Swakop Groups and over red gneissic granite. The surface extent of the anomalous area measures 100 by 185 m, with the southern portion being covered by desert scree.
PDF created with pdfFactory trial version www.pdffactory.com

Coastal Profile of the Erongo Region - August 1999 29
The Mile 72 uranium occurrences are situated immediately east of the coastal road approximately 100 km north of Swakopmund. The basement rocks consist of marbles, quartzites and schists, into which various granites and alaskites intruded. Primary uraniferous mineralization such as uraninite and betafite as well as monazite occur mainly in alaskite. A ground radiometric survey indicated that anomalous radiation is confined to a granite area. Estimated ore reserves of the best-mineralised zones are 90 t uranium oxide. An airborne radiometric survey located the Klein Trekkopje uranium deposit, some 17 km northwest of Trekkopje Siding. The main uranium mineralisation is associated with a palaeochannel that extends from an area immediately west of the farm Trekkopje 120, towards the farm Hakskeen 89 in the east. A crust of gypcrete, less than 3 m thick, covers an extensive area underlain by calcrete. The mineralsation is present as a 16 km long and 2 km wide tabular sheet, which occurs at depths ranging between 2 and 17 m below the present surface. The ore zone does not occur at a constant level or horizon, the thickness ranges between 1 and 2 m. Carnotite is the major ore mineral, the ore reserves amount to 40 t of uranium oxide. At the eastern extension of the Klein Trekkopje deposit, the Hakskeen deposit is comprised of carnotite mineralisation confined to the northern side of a wide calcrete basin. A fair proportion of the mineralization occurs in gypcrete which accounts for a prominent surface radiometric anomaly. The proven ore reserves are 120 t of uranium oxide. During 1968 an airborne radiometric survey indicated anomalous radioactivity on the farm Klein Spitzkoppe 70. The anomaly is situated over calcretes to the southeast of Klein Spitzkoppe. The regional geology of the area consists of Damaran granites, marbles and schists and the Cretaceous Spitzkoppe granite. These rocks occur as inliers in younger calcrete. The calcretes are believed to be of fluvial origin and occur in a palaeochannel. The mineralisation within the main anomaly zone consists of carnotite-enriched calcrete. It has an average depth of 10 m, with a maximum of 20 m. Total ore reserves calculated for the area amount to some 1100 t uranium oxide. The Marinica Grant is situated about 70 km west of Usakos on the gravel road towards Henties Bay. The regional geology of this area consists of basin-and-dome tectonic features, where massive marbles of the Karibib Formation form three domal structures, while steeply dipping biotite schists form the basins. Four uranium anomalies are associated with the domal structures, and this indicates that these structures have extended a considerable influence over the deposition of secondary uranium minerals. Two distinctly different types of mineralisation occur. In the northwestern portion of the grant mineralisation is present in weathered schist, granite and pegmatites. The second type of mineralisation is associated with the calcrete filling of a palaeo-channel. Prospecting in the area 20 km north of Henties Bay was directed at secondary uranium mineralisation associated with palaeo-channels. Radiometric surveys as well as a regional T-cup survey located a number of anomalies. Similar anomalies were also found at Cape Cross. Regional scintillometer surveys also isolated eight uranium anomalies at Namib Rock, some 150 km southeast of Swakopmund. Finally,
PDF created with pdfFactory trial version www.pdffactory.com

Coastal Profile of the Erongo Region - August 1999 30
anomalous uranium values were detected in an area south of the Kuiseb River (Roesener & Schreuder, 1992). 3.6.11 Semi-precious stones The production of rose quartz and pyrophyllite is described in the section on quarrying. Tourmaline occurs in pegmatites of the Cape Cross - Uis Pegmatite Belt, while the gemstone variety of cordierite, iolite, occurs in alluvial sediments between Walvis Bay and Rooibank, and in an area between Swakopmund and Henties Bay. 3.6.12 Graphite A bedded, syngenetic, low-grade and bulk-tonnage flake graphite deposit was found on the farm Black Range 72 in 1987. The farm is located 40 km west of Usakos and the deposit straddles the road to henties Bay. A small portion of the deposit was examined in detail. Geological reserves with a cut-off grade of 2% carbon as graphite amount to 13.8 million t at an average grade of 4.5 % (K Hart, pers. comm.). 3.6.13 Rare Earth Elements Monazite-bearing carbonatite dykes occur on the farm Eureka 99, about 38 km west of Usakos and some 2 km north of the Usakos-Swakopmund road. Drilling results presented by Dunai (1989) established proven reserves of 30 000 t of ore to a depth of 20 m, containing 1900 t of rare earth elements. 3.6.14 Diamonds The first account of diamonds in the project area was made in 1910, when a land surveyor of the German Schutztruppe allegedly found a 2.5 carat diamond at Cape Cross. A 3.75 carat yellow diamond was also found south of the Omaruru River mouth in 1910. An extensive investigation of the beach gravels between Swakopmund and the Kunene River mouth was undertaken between 1943 and 1947, it located the deposits of Terrace Bay, but failed to find any diamonds south of the Ugab River mouth. More recently, the area has received renewed interest, and some exploration licences have been taken out (see section on exploration). 3.6.15 Gold Mineralisation on the farm Sandamap Noord 115, 30 km west of Usakos was first described in 1942, however, the potential for gold has only recently been recognised. Gold occurs in a highly altered shear zone hosted by high-grade meta-sediments. Ore minerals are native gold, loellingite, arsenopyrite, pyrrhotite, pyrite and galena. Reserves are estimated as 240 000 million ton grading 5 g/t gold (R. Burnett, pers. comm).
PDF created with pdfFactory trial version www.pdffactory.com
Coastal Profile of the Erongo Region - August 1999 31
3.6.16 Hydrocarbon Potential The offshore is the best studied area from a petroleum point of view with over 60 000 km of modern seismic covering it and nine wells drilled in three of the four basins. The evolution of Namibia's offshore basins is related to the breakup of the supercontinent Gondwanaland, which led to the formation of the Atlantic Ocean. Initially, deep north-south trending rift valleys formed. From drilling just south of the Namibian border in South Africa it is known that these valleys were filled with lavas and sediments that were deposited in fresh-water or brackish lakes. These sediments have yielded small amounts of oil. Towards the end of this rifting phase, dunes formed along the southern Namibian coast and these aeolianites now form the reservoir rocks for the Kudu gas. Only when the two future continental fragments of Africa and South America first split apart along one of the boundary faults to the early rift valleys, the first evidence of marine conditions can be found. The early Atlantic Ocean might have been narrow and shallow but as the two continents moved apart, the ocean deepened and widened. Erosion of the continental masses of Africa and South America dumped vast amounts of sediments into the widening ocean along the margins of these continents. During times of slow erosion, deposition was equally slow, and as long as there was abundant organic activity in the ocean at the same time, good source rocks for oil formed. At least two such source rock zones are known. At times when sediment transport rates were low, limestones were also able to form in shallow water. During periods of particularly rapid erosion, abundant sands were deposited. These occur at various levels in the succession and are the main targets for exploration since they serve as reservoirs for oil and gas. Between about 50 and 90 million years ago, large amounts of sand were funnelled into very deep water through submarine canyons, cut into the shallow, near-shore continental shelf along the whole west coast of Africa. The seismic sections offshore Namibia show many good examples of these sands and canyons. The interest in these sands lies in the fact that several of them in the deep water between Angola and the Ivory Coast have recently been shown to contain vast quantities of oil (Schneider & Miller, 1998). 3.5 GROUND WATER RESOURCES A study to safeguard the future fresh water supply for the whole Central Namib Area was launched by the Department of Water Affairs. The objective of the study was to estimate future demand and identify the most feasible source of fresh water up to the year 2020. Socio economic situation and water supply: The socio economic finding of the above mentioned study revealed the following: • Walvis Bay showed the largest growth along the coast with 55% in the low-
income area, 19% in the middle income area and 25% in the high-income area. • 25% of the inhabitants of Kuisebmond were housed in shacks • The SQ and informal houses have situations where there were 20 people per
shower and 3.5 persons per tap
PDF created with pdfFactory trial version www.pdffactory.com

Coastal Profile of the Erongo Region - August 1999 32
• The high income area used 58% of fresh water with 48% of the water connection while the low income area used 19 % of the water through 31% of the connections.
• 79 % of the large trees and shrubs and 94% of the lawns in Walvis Bay are in the high income area.
• Only 5% of the households said that the water bill could not be paid. 24% said an increase would cause a financial burden on the household
• water bills made up 2.5% of household income • 30% of households felt that water is wasted in general • Nearly all households had working water meters, which delivered accurate
readings. Complaints regarding faulty water meters were received from the low income areas.
• 255 supported voluntary reduction methods, 25% supported restrictions on household consumption and 50% preferred an increase in water tariffs as a consumption reduction method.
• 20% of all businesses could not decrease their water consumption even with the strictest of reductions methods in place.
Water demand projections: Various assumptions were used to determine the high, medium and low growth projection. The first method of projection was based on an analysis of the past demand and the consumption trends. The second method was based on the influence of economic and socio economic changes over time. The second method is seen as the primary method. Table 3.2. Demand for the major urban centres in Erongo Region: Demand Million m3/ annum 1995 2000 2005 2010 2015 Swakopmund 2.323 2.291 2.551 2.889 3.264 Walvis Bay 4.781 4.855 5.554 6.507 7.525 Arandis 0.5 0.531 0.573 0.661 0.668 Henties Bay 0.332 0.362 0.444 0.532 0.633 Rössing Mine 2.1 2.7 2.7 3.3 3.3 10.036 10.739 11.822 13.889 15.39 Projections Target Analysis 8.98 11.346 12.284 14.201 15.561 No tariff increase Demand projection 11.202 14.801 16.351 18.521 20.195 Population projection
10.465 13.398 15.225 17.693 19.632
3x tariff increase Demand projection 11.202 12.719 13.971 15.833 17.178 Population projection
10.465 11.785 12.911 15.026 16.577
5x tariff increase Demand projection 11.202 10.97 11.972 13.567 14.678 Population projection
10.465 10.507 11.099 12.932 14.18
PDF created with pdfFactory trial version www.pdffactory.com
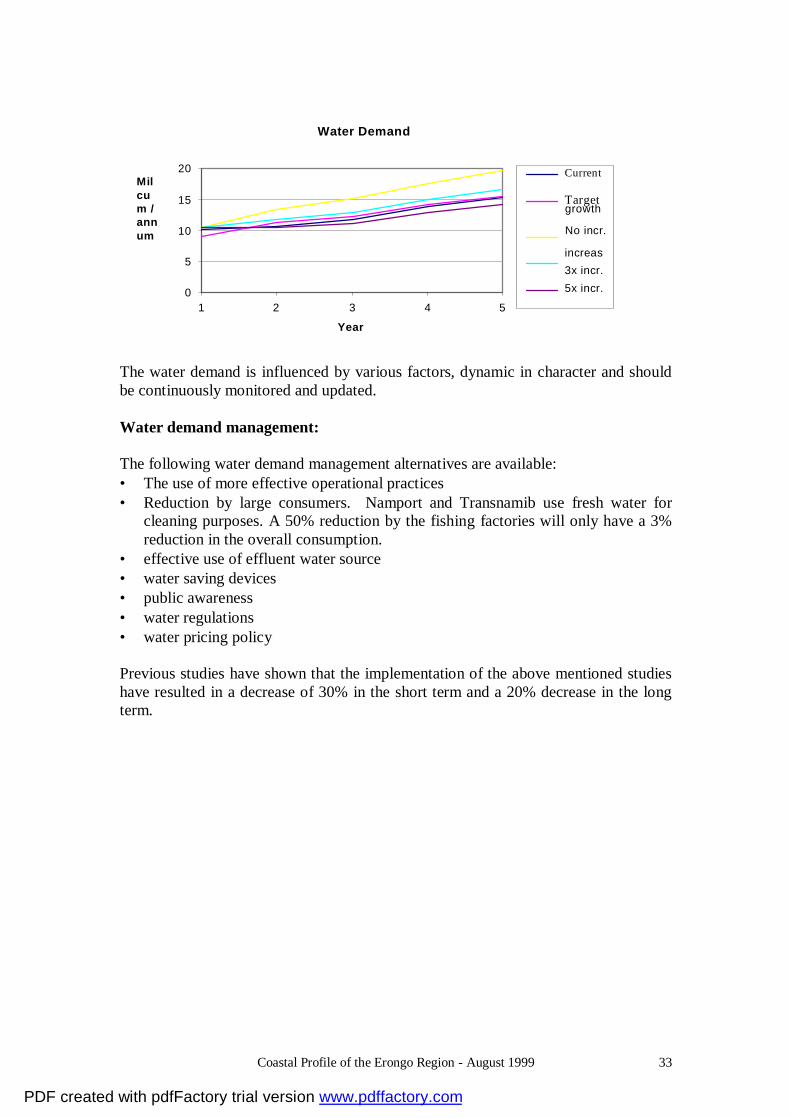
Coastal Profile of the Erongo Region - August 1999 33
Water Demand
0
5
10
15
20
1 2 3 4 5
Year
Milcum /annum
Current
growthTarget
No incr.
increas3x incr.5x incr.
The water demand is influenced by various factors, dynamic in character and should be continuously monitored and updated. Water demand management: The following water demand management alternatives are available: • The use of more effective operational practices • Reduction by large consumers. Namport and Transnamib use fresh water for
cleaning purposes. A 50% reduction by the fishing factories will only have a 3% reduction in the overall consumption.
• effective use of effluent water source • water saving devices • public awareness • water regulations • water pricing policy Previous studies have shown that the implementation of the above mentioned studies have resulted in a decrease of 30% in the short term and a 20% decrease in the long term.
PDF created with pdfFactory trial version www.pdffactory.com

Coastal Profile of the Erongo Region - August 1999 34
Table 3.3 Existing fresh water resources: Aquifer Component Reserves Abstractable Recharge Sustainable TDS Mil m3 Mil m3 Mil m3 Mil m3 Mil m3 mg/l Dune area south of Kuiseb
500 0.937 0.937
Active Kuiseb Klipneus 15.21 11 1440 Swartbank 26.88 19 2 2 600 Rooibank A 30.26 21 1.2 1.2 950 72.35 51 3.2 Rooibank B 11 800 Dorop South 144 1.163 1100 Dorop North 128 Kuiseb channel 22.5 Interspatial B 238.5 544 43 1.163 616.35 94 4.363 Omdel Scheme Main channel 150 80 4.7 4.7 with recharge dam 150 80 8.2 8.2 150 80 4.7 Lower Swakop River Horebis - Nabas 22 1.9 Nabas -
Palmenhorst 14.8 0.6
Palmen - Coast 23.3 0.2 60.1 2.7 Khan River / Rössing 1.5 1.1 0.64 0.64 4310 TOTAL 1327.95 175.1 13.34 with Omdel
recharge 16.84
The above table indicating the projected demand and the sustainable water sources indicates that the demand will reach the sustainable yield within the next 5 - 10 years with the current growth in demand or within the next 20 - 25 years with an 500% tariff increase. Existing water supply infrastructure The Rooibank reservoir currently collects all the produced water and feeds it to the Mile 7 reservoir from where it gavitates to the town of Walvis Bay. The total abstraction capability of the Kuiseb River boreholes is 14.3 mil m³/ annum which is much higher than the sustainable yield of 3.2 mil m³/ annum. The current storage capacity is sufficient with only the pipeline from Quarry to Mile 7 that must be upgraded. The bulk water distribution network is indicated on the attached plan. Waste water situation and potential The Walvis Bay sewage works is a conventional treatment plant with a 5000m³/day capacity. The capacity will be increased to 8000m³/day within 1999.
PDF created with pdfFactory trial version www.pdffactory.com
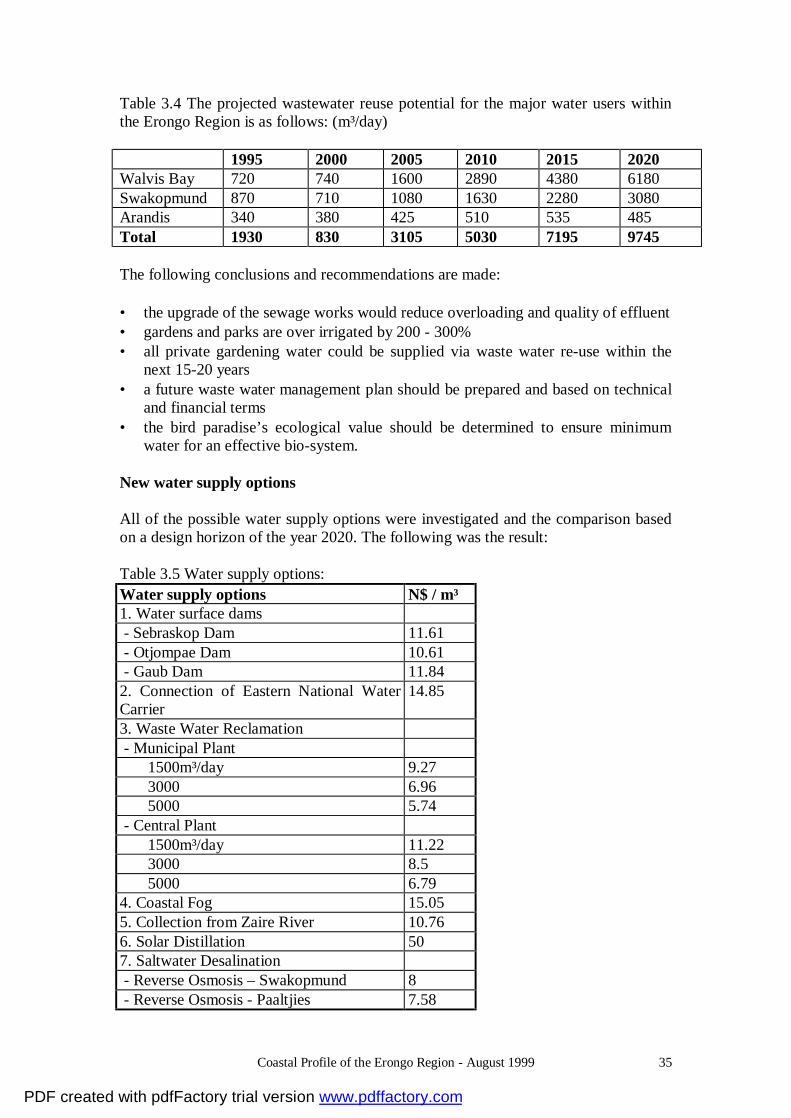
Coastal Profile of the Erongo Region - August 1999 35
Table 3.4 The projected wastewater reuse potential for the major water users within the Erongo Region is as follows: (m³/day) 1995 2000 2005 2010 2015 2020 Walvis Bay 720 740 1600 2890 4380 6180 Swakopmund 870 710 1080 1630 2280 3080 Arandis 340 380 425 510 535 485 Total 1930 830 3105 5030 7195 9745 The following conclusions and recommendations are made: • the upgrade of the sewage works would reduce overloading and quality of effluent • gardens and parks are over irrigated by 200 - 300% • all private gardening water could be supplied via waste water re-use within the
next 15-20 years • a future waste water management plan should be prepared and based on technical
and financial terms • the bird paradise’s ecological value should be determined to ensure minimum
water for an effective bio-system. New water supply options All of the possible water supply options were investigated and the comparison based on a design horizon of the year 2020. The following was the result: Table 3.5 Water supply options: Water supply options N$ / m³ 1. Water surface dams - Sebraskop Dam 11.61 - Otjompae Dam 10.61 - Gaub Dam 11.84 2. Connection of Eastern National Water Carrier
14.85
3. Waste Water Reclamation - Municipal Plant 1500m³/day 9.27 3000 6.96 5000 5.74 - Central Plant 1500m³/day 11.22 3000 8.5 5000 6.79 4. Coastal Fog 15.05 5. Collection from Zaire River 10.76 6. Solar Distillation 50 7. Saltwater Desalination - Reverse Osmosis – Swakopmund 8 - Reverse Osmosis - Paaltjies 7.58
PDF created with pdfFactory trial version www.pdffactory.com
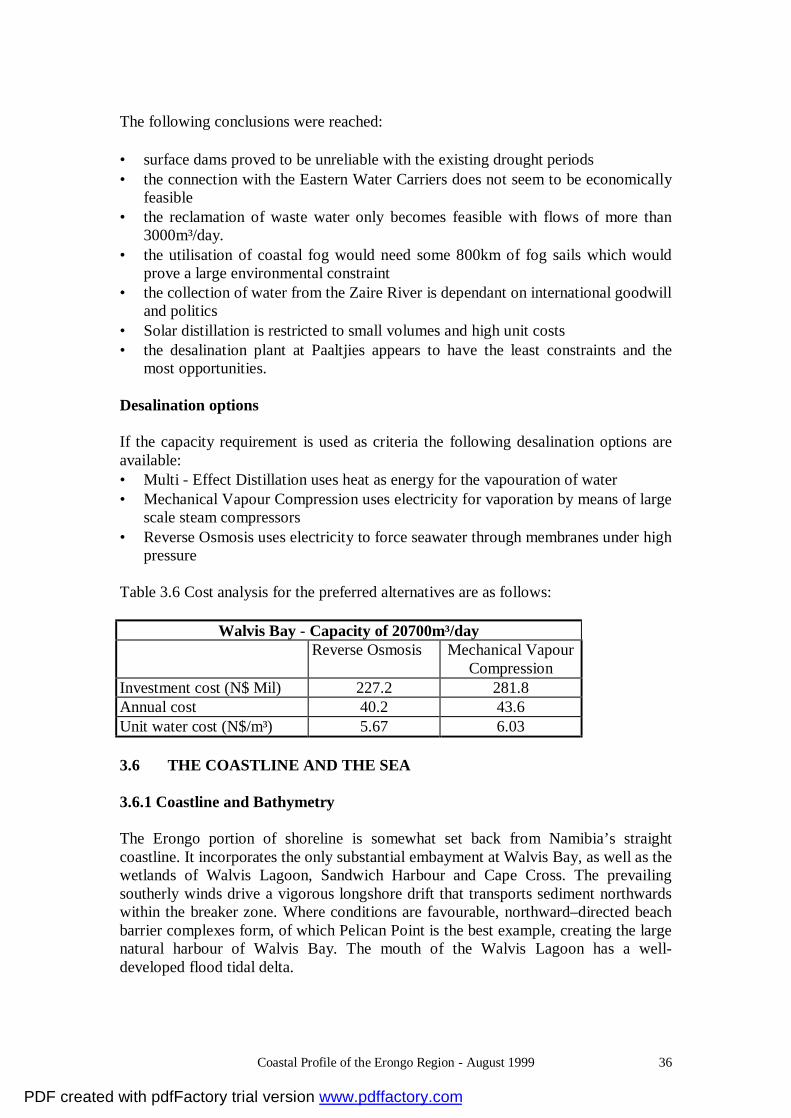
Coastal Profile of the Erongo Region - August 1999 36
The following conclusions were reached: • surface dams proved to be unreliable with the existing drought periods • the connection with the Eastern Water Carriers does not seem to be economically
feasible • the reclamation of waste water only becomes feasible with flows of more than
3000m³/day. • the utilisation of coastal fog would need some 800km of fog sails which would
prove a large environmental constraint • the collection of water from the Zaire River is dependant on international goodwill
and politics • Solar distillation is restricted to small volumes and high unit costs • the desalination plant at Paaltjies appears to have the least constraints and the
most opportunities. Desalination options If the capacity requirement is used as criteria the following desalination options are available: • Multi - Effect Distillation uses heat as energy for the vapouration of water • Mechanical Vapour Compression uses electricity for vaporation by means of large
scale steam compressors • Reverse Osmosis uses electricity to force seawater through membranes under high
pressure Table 3.6 Cost analysis for the preferred alternatives are as follows:
Walvis Bay - Capacity of 20700m³/day Reverse Osmosis Mechanical Vapour
Compression Investment cost (N$ Mil) 227.2 281.8 Annual cost 40.2 43.6 Unit water cost (N$/m³) 5.67 6.03 3.6 THE COASTLINE AND THE SEA 3.6.1 Coastline and Bathymetry The Erongo portion of shoreline is somewhat set back from Namibia’s straight coastline. It incorporates the only substantial embayment at Walvis Bay, as well as the wetlands of Walvis Lagoon, Sandwich Harbour and Cape Cross. The prevailing southerly winds drive a vigorous longshore drift that transports sediment northwards within the breaker zone. Where conditions are favourable, northward–directed beach barrier complexes form, of which Pelican Point is the best example, creating the large natural harbour of Walvis Bay. The mouth of the Walvis Lagoon has a well-developed flood tidal delta.
PDF created with pdfFactory trial version www.pdffactory.com

Coastal Profile of the Erongo Region - August 1999 37
A broad continental shelf extends some 100 km offshore, bounded by the 200m isobath. Shallow water along the coast deepens gradually to 50m at a distance of 10 -15km offshore. 3.6.1.1 Sediments Nearshore sediments are mainly quartose sand and biogenic mud. The central coastal shelf bottom is mostly soft, consisting of biogenic, diatomaceous ooze of high organic content, exceeding 10% in places. This is a result of the high primary production of this area, and is typically accompanied by low oxygen values of the water and the production of hydrogen sulphide. Surface sediments in the Walvis Bay area have been found to contain high heavy metal content, markedly of cadmium, copper and lead (Henry 1983). High levels of anaerobic decomposition were found in the sediment. 3.6.1.2 Tides Tides along the Namibian coast are semi-diurnal with a maximal tidal range of 2m. Main tidal movement is offshore-onshore. The resultant tidal currents are small and negligible compared to the dominant northerly movement of the Benguela. 3.6.1.3 Winds Whilst offshore winds are characterized by homogeneous SSE winds blowing parallel to the coast at speeds of 5 – 8 m sec-1, the inshore winds are more variable, mainly in the north-south component. This is thought to reflect the influence of coastal low pressure cells which regularly move past the south of Africa, causing the longshore winds to reverse in direction for 1 – 2 days at a time. SSE marine wind is frictionally turned SSW at the coast, and temperature contrasts between land and sea enhance the rotation of the nearshore winds through the development of sea breezes which may extend 10 – 15 km seawards. The land-sea breezes resulting from different temperatures of the land and sea are known to have significant effect near the shore. This is noticed on a daily basis, as wind direction switches towards the shore in the afternoon as the land heats up. Analysis of wind directions and strengths reveals a predominance of surface wind flow from S to SSW. Wind speeds over 8m sec –1 have a 17% probability at Walvis Bay. Westerly winds are light with mean speeds of about 2m sec –1. A relatively high component (56%) of onshore surface flow occurs between Walvis Bay and Cape Cross (Jury 1993). The E-W (U) wind standard deviation peaks at 14,5 0E, with the greatest frequency of onshore winds occurring in the summer. A typical 24-hour wind pattern in undisturbed weather conditions in Walvis Bay : • Weak northerly flow as fog sets in during early morning; • 4-5 hours after sunrise the westerly winds pick up and establish a sea breeze; • the southwesterly winds gradually increase in speed and rotate counter-clockwise
in an internal oscillation (Boyd 1981); • near sunset, winds are southerly and of maximal speed;
PDF created with pdfFactory trial version www.pdffactory.com
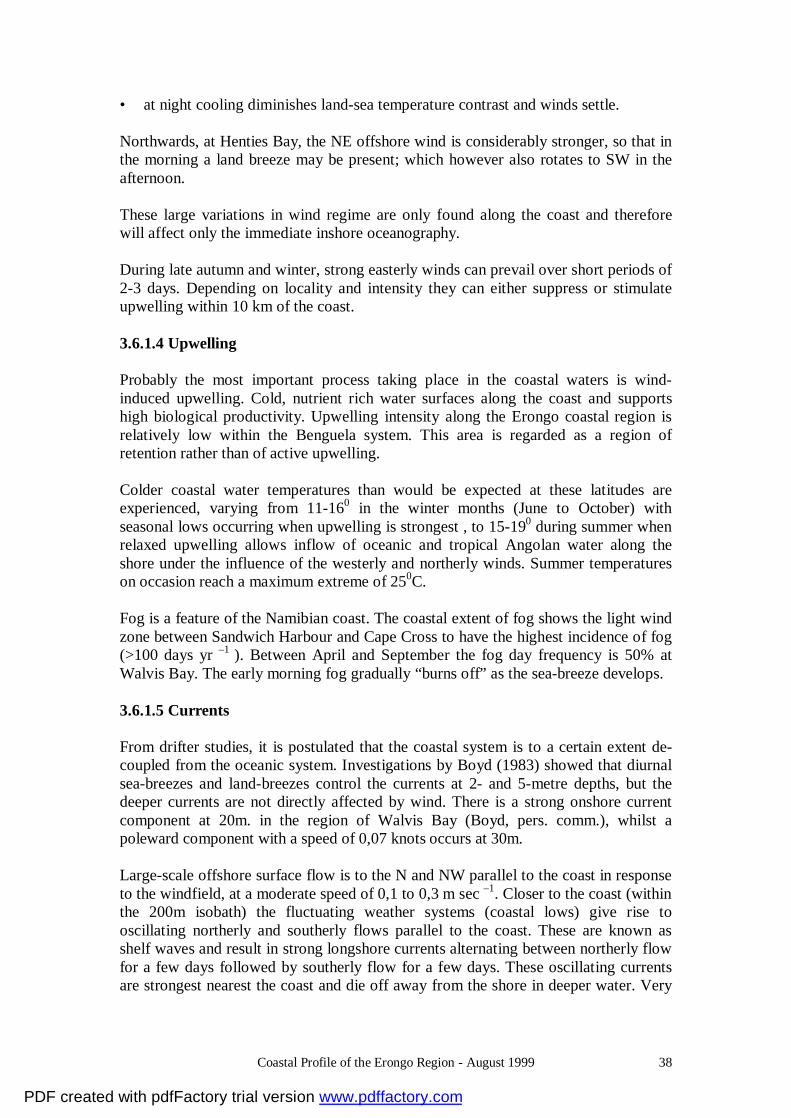
Coastal Profile of the Erongo Region - August 1999 38
• at night cooling diminishes land-sea temperature contrast and winds settle. Northwards, at Henties Bay, the NE offshore wind is considerably stronger, so that in the morning a land breeze may be present; which however also rotates to SW in the afternoon. These large variations in wind regime are only found along the coast and therefore will affect only the immediate inshore oceanography. During late autumn and winter, strong easterly winds can prevail over short periods of 2-3 days. Depending on locality and intensity they can either suppress or stimulate upwelling within 10 km of the coast. 3.6.1.4 Upwelling Probably the most important process taking place in the coastal waters is wind-induced upwelling. Cold, nutrient rich water surfaces along the coast and supports high biological productivity. Upwelling intensity along the Erongo coastal region is relatively low within the Benguela system. This area is regarded as a region of retention rather than of active upwelling. Colder coastal water temperatures than would be expected at these latitudes are experienced, varying from 11-160 in the winter months (June to October) with seasonal lows occurring when upwelling is strongest , to 15-190 during summer when relaxed upwelling allows inflow of oceanic and tropical Angolan water along the shore under the influence of the westerly and northerly winds. Summer temperatures on occasion reach a maximum extreme of 250C. Fog is a feature of the Namibian coast. The coastal extent of fog shows the light wind zone between Sandwich Harbour and Cape Cross to have the highest incidence of fog (>100 days yr –1 ). Between April and September the fog day frequency is 50% at Walvis Bay. The early morning fog gradually “burns off” as the sea-breeze develops. 3.6.1.5 Currents From drifter studies, it is postulated that the coastal system is to a certain extent de-coupled from the oceanic system. Investigations by Boyd (1983) showed that diurnal sea-breezes and land-breezes control the currents at 2- and 5-metre depths, but the deeper currents are not directly affected by wind. There is a strong onshore current component at 20m. in the region of Walvis Bay (Boyd, pers. comm.), whilst a poleward component with a speed of 0,07 knots occurs at 30m. Large-scale offshore surface flow is to the N and NW parallel to the coast in response to the windfield, at a moderate speed of 0,1 to 0,3 m sec –1. Closer to the coast (within the 200m isobath) the fluctuating weather systems (coastal lows) give rise to oscillating northerly and southerly flows parallel to the coast. These are known as shelf waves and result in strong longshore currents alternating between northerly flow for a few days followed by southerly flow for a few days. These oscillating currents are strongest nearest the coast and die off away from the shore in deeper water. Very
PDF created with pdfFactory trial version www.pdffactory.com
Coastal Profile of the Erongo Region - August 1999 39
little is known about tidal currents off Namibia; these are likely to be small, in the cross-shelf direction. In summary, nearshore surface currents along the Erongo shoreline show considerable variability, with frequent reversals and onshore flow. 3.6.1.6 Waves Waverider data collected at Walvis Bay indicates small seasonal variation in wave height. The predominant wave direction off Namibia is from the south, modulated on a synoptic scale of a few days to a week by the transient weather systems that pass from W to E past the southern tip of Africa. 3.6.1.7 Water masses Cold upwelled water characteristically has salinities of 34,8 to 35,2 ppt. The warmer oceanic water found inshore in summer is more saline: 35,3 to 35,6 ppt. During winter and spring the vertical distribution indicates well-mixed cool low salinity water inshore, whilst in summer conditions become more stable and strong thermoclines develop in the upper layers. Upwelling brings the store of nutrients from deeper layers to the surface where they can be utilized for phytoplankton growth. Thus essential nutrient concentrations in the coastal water is high and supports heavy primary production. The warm higher salinity Angolan Current water which periodically moves southwards as far as Walvis Bay is poor in nutrients. In certain years prolonged intrusions (6+ weeks) of warm water (200 C +) occur in the late summer, the most recent being in 1995. This occurrence is extreme and recognized as a warm-water event or “Benguela-Nino. Low oxygen levels are a feature of the central region, with near-zero values close to the seabed. The vertical distribution of deoxygenated water (<0,5mg.l –1 ) can vary in thickness from <20m inshore to over 250m along the edge of the continental shelf. Oxygen deficiency in the central region results mainly from local phytoplankton decay. Research data indicates that oxygen values can remain low for extended periods, depending on seasonal environmental conditions. In the immediate coastal area off Walvis Bay and Swakopmund, zero to near-zero oxygen is a permanent feature in bottom water, from depths of 15m. Naturally-occurring sulphide eruptions take place close inshore along the central Namibian coastline, most commonly in the vicinity of Walvis Bay, This phenomenon was described as way back as 1837. Anaerobic decomposition results in the formation of hydrogen sulphide in the dark black-green organic ooze which covers the seabed in this region. Eruptions of this noxious, toxic gas erupt in the nearshore water, most commonly between December and April, and frequently cause deaths or “walk-outs” of shore invertebrates and juvenile fish.
PDF created with pdfFactory trial version www.pdffactory.com
Coastal Profile of the Erongo Region - August 1999 40
3.6.1.8 Water quality Upwelling brings nutrients to the surface where they are taken up by phytoplankton for growth. Concentrations of nutrients fluctuates significantly off the coast depending on the season, the intensity of upwelling, the rate of utilization by phytoplankton and the depth. A complete review of the chemistry and related processes of the Benguela ecosystem including the components off Namibia is given by Chapman and Shannon (1985). Intense upwelling activity can considerably increase the supply of nutrients into the euphotic zone and lead to concentrations of 25 to 30 uM of nitrates, 2.0 to 2.5uM of phosphate and 20 to 20 uM of silicates. The warm, higher salinity water which moves in during late summer is usually poor in nutrients. The water quality along the Erongo coastal area is generally good, apart from periodic low oxygen values, red-tide occurrence and localized sulphide eruptions. However within Walvis Bay water quality can deteriorate especially when anthropogenic and natural causes are compounded : • harbour pollution includes hydrocarbons, sewage, coal dust, chemical washings
and paint residues from the synchrolift servicing; • during summer and autumn, when peak production by the fish factories results in
heavy output of organic waste, the natural environment adds detrimentally with conditions of warm sea temperatures, phytoplankton blooms, low oxygen water, sulphur eruptions, and onshore winds.
PDF created with pdfFactory trial version www.pdffactory.com

Coastal Profile of the Erongo Region - August 1999 41
4.0 BIOLOGICAL SETTINGS
4.1 VEGETATION, TERRESTRIAL FLORA 4.1.1 Major Habitats The composition of plant communities depends on numerous factors including soil types, climate and habitat. The seven major habitats in the region are gravel plains, coastal hummocks, sand dunes, washes, river beds, rocky ridges, and inselberg including the Brandberg and Spitzkoppe. Four ephemeral rivers fall into the project area, namely, the Ugab, Omaruru, Swakop (and the Khan tributary) and the Kuiseb River. These as well as the dunes between Swakopmund and Walvis Bay and S/SE of Walvis Bay bear distinct plant communities. Within the project area, the plant communities of dunes and rivers are to some extent independent of the climatic zones and will be treated as units. For all other habitats, including the major washes Messum and Tumas, the plant communities change with distance from the coast. 4.1.2 Plant communities Floristically, the western part of the project area falls into the Succulent Karoo Region (Namaqualand-Namib Domain) and the east into the Nama Karoo Region (Namaland Domain, Namib Subdomain, Namib District), with areas around the Brandberg mountain being allied to the Kaoko elements (Jürgens, 1991). The distribution of plant communities has been described by Robinson (1976) for the area between the Swakop and Kuiseb Rivers and by Hachfeld (1996) for the area between the Swakop and Omaruru Rivers, while other reports are of more general character (e.g. Walter, 1936, 1985; Giess, 1962, 1966, 1981; Robinson, 1978; Wetschnig, 1992). The characteristics of the vegetation changes from the coast inland (Hachfeld, 1996). On the plains, ground cover decreases from some 5% near the coast to <1% beyond 40 km inland, then increases to >13% beyond 80 km and >30% beyond 120 km. Over the same distances, species richness (number of species present in a plant community) increases from 2-5 near the coast to >30 in the east. Six vegetation units and 14 types of plant communities have been identified on the plains north of the Swakop River (Hachfeld, 1996). These units are here arranged into the climatic zones that run parallel to the coast (see section 3.1; Figure 4.1). The vegetation units are named after their dominant plant or lichen species out of >150 species that they contain in total. The Coastal Zone comprises the coastal hummocks (the succulent shrubs Arthraerua leubnitziae-Salsola nollothensis), and the lichen fields of Teloschistes capensis and Lecidella-Combea mollusca with the shrub Arthraerua leubnitziae. The Inland Foggy Zone contains a shrub community (Arthaerua leubnitziae) and lichen fields (Caloplaca elegantissima-Xanthoparmelia walteri). Fensteralgen are common under transparent stones such as quartz and may play a major role in the fixation of minerals and soil formation, including gypsum. The Middle Zone contains a shrub community (Zygophyllum stapffii-Commiphora saxicola) a grass community (Stipagrostis uniplumis-Stipagrostis obtusa) and a shrub-grass community (Zygophyllum cylindrifolium-Stipagrostis hochstetteriana).
PDF created with pdfFactory trial version www.pdffactory.com

Coastal Profile of the Erongo Region - August 1999 42
The Eastern Zone comprises a Euphorbia damarana-Zygophyllum stapffii community in the west, while in the east, the community is dominated by the dwarf shrub Calicorema capitata, with the grass Eragrostis nindensis and the small tree Boscia foetida. A similar distribution of plant communities occurs in the washes, except that they tend to be more dense along the banks and that the plant units are shifted somewhat westwards and contain the tree Acacia reficiens. During exceptionally long dry spells, plant communities are more enduring in the washes and these can serve as sources for recolonisation of the plains. The plains communities continue south of the Swakop River (Robinson, 1976; Hachfeld, pers.comm.), but the middle and eastern zones become more complex. The project area contains coastal hummocks (Salsola nollothensis) west of the dunes and a large lichen field east of the Swakopmund-Walvis Bay dune field. Other notable plant communities are in the: Dune Fields between Swakopmund and Walvis Bay and south of Walvis Bay, where spiny dune grass Stipagrostis sabulicola and the succulent dwarf shrub Trianthema hereroensis dominate. Both of these can take up fog water, either through shallow roots (S.sabulicola; Louw & Seely, 1980), or through the leaves (T.hereroensis; Seely et al., 1977). Ugab, Swakop and Kuiseb Rivers that support riparian forests with trees such as Acacia erioloba, Faidherbia albida, Tamarix usneoides and Euclea pseudebenus and various grasses, shrubs and herbs, including invasive aliens. It is here that many plants of medicinal or nutritional value are found (Van den Eynden et al., 1992). Omaruru Delta, with the shrub Salsola nollothensis and lichen Caloplaca elegantissima Kuiseb Delta, with Nara Fields, Acanthosicyos horridus, southeast of Walvis Bay between Wortel and Rooibank (see below) 4.1.3 Inselbergs Isolated mountains, or inselbergs, are important, as they form favourable habitats in an arid surrounding and often support a rich biota that differs from the plains. Inselbergs often receive more precipitation than their surroundings and clouds either intercept them, as fog, or gather over them, as rain. Run-off on these largely rocky habitats is channelled to soil pockets and rock crevices and thus stored for long periods. Rocky crevices also protect from the stressful effects of Berg winds. The role of inselberg vegetation as food source and habitat for wildlife, its function as a potential seed pool for re-colonising degraded areas and its tourism potential, strengthens the need for appropriate protection and management of inselberg habitats. Inselbergs in the area between Brandberg and Erongo Mountains are recognised as of special conservation value due to the high number of endemic biota (Barnard 1998), i.e. many plant species occur only here and nowhere else in the world (Nordenstam 1974, 1982; Maggs et al. 1994). The flora of inselbergs in the western Erongo Region depends on distance from the coast, inselberg size and geological substrate. There are three main types:
PDF created with pdfFactory trial version www.pdffactory.com

Coastal Profile of the Erongo Region - August 1999 43
Low ridges (or dykes) oriented southwest to northeast, and other outcrops of dolerite, marble, or other rock include the Swartbankberg, Rössing mountain, and Laguneberg, as well as numerous smaller ridges. They contain plant communities comprising 9-17 species that often differ from those of the surrounding plains. Near the coast, lichens and succulents are very common, including some of conservation importance such as aloes (Aloe asperifolia & A. namibensis), stone plants (Lithops gracilidelineata & L. ruschiorum), and the stem succulent Trichocaulon pedicellatum. Plant community composition on the ridges changes with distance inland. Coastal outcrops are dominated by Pelargonium otaviense, Arthraerua leubnitziae and Lycium cinereum, followed progressively further from the coast by Euphorbia virosa-Zygophyllum stapffii, Helichrysum roseo-niveum-Psilocaulon salicornioides, up to Boscia foetida-Commiphora glaucesens-C.virgata-Petalidium variabile in the Spitzkoppe area (Hachfeld, 1996; Burke pers.comm.). Granite domes are characterised by a large amount of bare rock surface, and plants are concentrated around and beneath boulders, in channels, and in temporary pools. A low cover of shrubs dominated by various Commiphora species (e.g. C.glaucescens, C.tenuinervis and C.virgata) and Barleria lancifolia is characteristic for the inselbergs of the Spitzkoppe area. Remarkably richer than their surroundings, over 200 plant species were recorded during a recent survey on granite domes in this area (Burke, pers.comm.). Species of conservation importance are Adenia pechuelii, Aloe dichotoma and Othonna brandbergensis. Due to its size, the Brandberg may be regarded as a mountain range (Jürgens & Burke, 1999). It has a very high species richness (>350 species known so far; Nordenstam, 1974, 1982; Giess, 1982; Moisel, 1982; Bruyns, 1988, 1990; Craven, 1989a, b, 1997). A strong altitudinal gradient has been observed in the vegetation of the Brandberg with elements of higher rainfall regions becoming more prominent towards the summits. Seven endemic plant species occur only on the Brandberg (herbs Nicorella nordenstamii and Hermannia merxmuelleri, the succulent Lithops gracilidelineata brandbergensis, and shrubs Pentzia tomentosa, Plumbago wissii, Ruellia brandbergensis, and Felicia guneliae. Five further endemics are confined to the Brandberg and its immediate surroundings or nearby inselbergs: Othonna brandbergensis, Cucumella clavipetiola, Eragrostis aristida, Nicotiana africana, Euphorbia monteiroi brandbergensis. Altogether, the Brandberg harbours 90 of 136 (66%) Namibian endemics (Craven, 1997; Maggs et al., 1998). 4.1.4 Special Plants Welwitschia. As the only member of the family Welwitschiaceae (which, in turn, belongs to the very unusual gymnosperm group Gnetales), Welwitschia mirabilis is a botanical curiosity (Cooper-Driver, 1994; von Willert, 1994) and the most studied Namib plant (bibliography of >200 papers; Henschel & Seely, 1999). It is a widespread endemic of the central and northern Namib (Kers, 1967; Bornman, 1978). In the project area, isolated populations occur on the Welwitschia Flats in the Khan-Swakop triangle, east of Strathmore Mine, Messum crater, and around the base of the Brandberg. Welwitschia plants are known for their great longevity (500-2000 years; Herre, 1961; Jürgens et al., 1997). The plant grows and develops continuously, with growth rate depending on rainfall and groundwater, but not fog (Henschel & Seely, 1999). Welwitschia can withstand grazing and abrasion by sand storms, but it cannot
PDF created with pdfFactory trial version www.pdffactory.com

Coastal Profile of the Erongo Region - August 1999 44
recover from heavy damage caused by humans, especially vehicles (Brinckman & von Willert, 1987). Vehicles can also damage seeds and change the delicate properties of the soil, so that Welwitschia recruitment is reduced. Conditions suitable for recruitment are so rare that any reduction of its potential may be a serious problem for the population. Welwitschias are protected. Nara. The Nara Acanthosicyos horridus (Cucurbitaceae) is endemic to the Namib desert, with high densities in the lower Kuiseb valley, particularly in the area some 10 km south-east of Walvis Bay in the Kuiseb Delta (Budack 1977). The Nara requires ground water (Herre, 1974; Pfeifer, 1979), tapped with long roots (Kutschera et al. 1997). Naras grow 5-10 m high and 10-40 m in diameter. Like the Welwitschia, Nara is dioecious (sexes separate) and have a long lifespan of centuries. Female Naras annually produce 20-500 fruits of 10-20 cm diameter that each weigh 0.5-1.0 kg and contain 200-300 seeds (Klopatek & Stock, 1994). The fruits, seeds, growing tips and flowers are highly nutritious, and the canopies shelter many animals, making this a very important plant for the ecology of the Namib (Klopatek & Stock 1994). People have harvested the Nara fruit for over eight millennia (Sandelowsky 1977). This practise continues today with the Topnaar people, who live in small villages along the Kuiseb River (Dentlinger 1977; van den Eynden et al. 1992). There have been recent efforts to co-ordinate the harvesting, processing and marketing of the fruits (Grasveld & Gabriel 1993; Topnaar Community Foundation, pers.comm.; Directorate of Rural Planning, pers.comm.) in order to improve the socio-economic value of this traditional resource to the rural Topnaar community. The Topnaars attribute a decline in fruit production in recent years to receding groundwater levels, heavy browsing by herbivores, as well as to non-traditional harvesting methods (Shilomboleni 1998). Vandalism by off-road vehicles is a growing concern. Furthermore, the legal status of the Topnaars concerning the management of this plant requires attention. Lichens. This symbiont of fungi and algae occurs commonly throughout the Coastal Zone and the Inland Foggy Zone, where fog affects its growth (Schieferstein, 1990; Schieferstein & Loris, 1992). It is characterised by surprisingly high numbers of species (far exceeding 100, perhaps well over 200; Wessels, 1987, 1989; EEAN, 1991; Craven, 1998) and at least one endemic genus and many endemic species, in fact, most lichen species appear to be Namibian endemics. Among the most common taxa, 20 species and 10 further genera have been identified (Schieferstein, 1990). Lichens decrease wind erosion, increase soil nitrogen, may act as pioneer species (the first species to settle in a newly available habitat), provide protection to insects, mites and Damara tern nests, and food to beetles and springbok (Wessels et al., 1979; Joubert et al., 1982). Some are of medicinal value and dyes are extracted. Lichens contribute highly to the aesthetic and tourism potential of the Namib. They are useful to determine the age of rock surfaces and of rock art. However, they are very sensitive to damage and climatic change and thus require attention (Daneel, 1992). Places with high densities and species richness of lichens, such as the 7 lichen fields found in the project area, deserve special protection
PDF created with pdfFactory trial version www.pdffactory.com
Coastal Profile of the Erongo Region - August 1999 45
4.1.5 Potential Vegetation of the West Erongo Region is important for its uniqueness (high degree of endemicity), and its resource potential, including medicinal. Inselbergs, in particular, harbour many unusual and valuable plants with the Brandberg being outstanding in this respect. The role of inselberg vegetation as food source and habitat for wildlife, its function as a seed pool for re-colonising degraded areas and its tourism potential, strengthens the need for appropriate protection and management of inselberg habitats. The riparian forests of ephemeral rivers are a resource for browsing livestock and game, and a source of wood for residents. The lichen fields, Welwitschias, and Naras are famous for their unusual and aesthetic characteristics, which are, for instance, valuable for promoting the tourism potential of the area. Fog plants, such as the pencilbush Arthraerua leubnitziae, the dune succulent shrub Trianthema hereroensis, and the spiny dune grass Stipagrostis sabulicola, illustrate important principles of this living desert. 4.1.6 Threats Several plant communities, particularly the coastal hummocks, the lichen fields in the coastal and foggy zones, as well as the dolerite ridges, are vulnerable to mechanical damage, e.g., by off-road vehicles, and take a very long time to recover. Some of the plant communities found on inselbergs are unique to them and are vulnerable to extinction. Threats include mining, trampling and removal to gardens. Inselberg vegetation harbours many species treasured by collectors, such as Commiphora species, stem-succulents like Adenia pechuelii, Aloe dichotoma and Cyphostemma currori and plants of medicinal value such as Nicotiana africana. Without effective control and management, illegal plant collecting could become a real threat to inselberg flora. Welwitschia and Nara are threatened by vandalism. In addition, the Nara field in the Kuiseb Delta may suffer from inadequate law to enable the Topnaars to practise traditional, sustainable resource management. Declining groundwater levels in the ephemeral riverbeds also affect the riparian forests. Although only a marginal farming area, the western Erongo has in the past few years experienced an influx of livestock and people far beyond the capacity of the land. With grazing resources diminishing rapidly, inselberg vegetation may in future provide the only grazing resource, especially in years of low rainfall. However, inselbergs harbour important seed banks that can replenish depleted surrounding areas, and are thus key resources that should be used very carefully. Uncontrolled tourism could also influence inselberg vegetation negatively through habitat destruction (e.g. trampling), littering and collecting of firewood and plant specimens. In particular, the Brandberg with its high concentration of endemics warrants attention and better protection with well-controlled access. Microflora, including lichen, Fensteralgae and mycorrhiza (fungus), are important for soil processes and to facilitate essential ecological processes and should not be overlooked when planning disturbance or rehabilitation.
PDF created with pdfFactory trial version www.pdffactory.com
Coastal Profile of the Erongo Region - August 1999 46
4.2 FARMLANDS (SWAKOP & KUISEB RIVERS) Very little farming activity occurs in the Western Erongo Region. There are a few pastoralists near the Brandberg and Spitzkoppe and in the Omaruru River above the Omdel dam, as well as in the lower Swakop and Kuiseb rivers. In addition, some commercial farming occurs on small-holdings in the Lower Swakop River, where asparagus, other vegetables, milk and meat are produced. Most products are for local consumption, but asparagus also trade outside the region. Farming in this region depends on the availability of groundwater. In the Kuiseb and Swakop rivers the groundwater levels are declining because of bulk water extraction (Kuiseb) and damming (Swakop). Operators of smallholdings in the Swakop River have expressed their concern about the reduced availability of ground water and have suggested various ways of countering it. This includes the removal of alien vegetation, including Prosopis glandulosa trees where these are not required for fodder. It has been estimated that the removal of the indigenous Tamarisk usenoides trees, which are viewed as invasive, could save as much as 1 Mm3 of water annually and make this available for other purposes in the Lower Swakop River (CSIR 1997). Tree removal is, however, not practical, not economically viable (too labour-intensive), and would bare the Swakop riverbed to wind erosion and would free the space for aggressively invasive alien plants such as Wild Tobacco (Nicotiana glauca), Castor-Oil Plant (Ricinus communis) and Thorn Apple (Datura innoxia). The elimination of indigenous species is thus not encouraged and would reduce a natural green belt that is important for many other plants and animals occurring in the desert. Since the water quality declines along with the quantity, it has been suggested that salt-tolerant asparagus cultivation be practiced in preference to the less tolerant lucerne. Topnaar pastoralists in the Kuiseb and Swakop rivers keep goats, cattle and donkeys, which feed on the natural vegetation of the riverbed. Grazing is most intense near the well points and this has become a permanent feature since the government established wind pumps or diesel pumps at some of the settlements in the early 1980s. The operation of traditional, hand-dug wells is hardly feasible anymore because of the receding groundwater levels, while the water quality is declining and the cost of operating pumps is increasing. The Topnaars are currently exploring alternative sources of water, such as fog-water harvesting (Henschel et al. 1998). The community is also trying to reduce its dependency on livestock by investigating whether sustainable harvesting of Nara fruit can supplement their livelihood, based on their previous experience with this (Henschel et al. 1997). Water for farming needs to be planned at the level of the region as well as the catchments, as was done for the planned Kars dam (CSIR 1997), the West Coast Water Scheme (GTZ 1993) and the ephemeral rivers of the Namibian west coast in general (Jacobson et al. 1995).
PDF created with pdfFactory trial version www.pdffactory.com

Coastal Profile of the Erongo Region - August 1999 47
4.3 TERRESTRIAL FAUNA, WILDLIFE 4.3.1 General Major habitats of importance for the terrestrial fauna are the plains, river beds, washes, sand dunes, inselbergs, and beach (see flora). The availability of water, food, and shelter differs between these habitats, as well as from west to east. Some animals, particularly many of the terrestrial mammals and birds, are dependent on the regular availability of free water, and this affects their distribution and seasonal movements. No comprehensive lists of the fauna of the project area exists, but there are numerous accounts for part of the area and part of the fauna, while accounts for immediately adjacent areas (e.g. the Namib-Naukluft Park) are largely applicable to the project area. The westernmost distributions of some animals of the Namibian interior extend into the desert margins of the western Erongo, particularly along the linear oases of the ephemeral rivers, Kuiseb, Swakop, Omaruru and Ugab. Others, including a few vertebrates, are true desert animals. Only one vertebrate, the Brandberg gecko Pachydactylus gaiasensis, is endemic to the project area, although several other lizards and geckos are near-endemics (also occur in Kunene Region). By contrast, there may be many invertebrates that are endemic to western Erongo, but, in general, less information is available on invertebrates despite much research by the Desert Research Foundation of Namibia and the National Museum of Namibia. There are several recent general reviews of the fauna of the western Erongo (Griffin, 1997; Barnard, 1998; special issue of the journal Biodiversity and Conservation, volume 7, number 4 (1998)). 4.3.2 Fauna Three of four frog species that occur in the project area (Appendix 4.3) are endemic to Namibia. The endemics, including the rather special marbled rubber frog (Phrynomantus annectans), occur in rock pools on inselbergs, while another frog species occurs in pools in the riverbed (Channing, 1974; Griffin, 1998). When pools dry up, Namib frogs dig themselves into the substratum below the pools, but they are vulnerable to any processes that reduce the water levels for longer periods than their tolerance limit. Such factors could be climate change (reduced rainfall), or damming of rivers, or water extraction from pools, such as by numerous visitors to inselbergs. Disturbance during hibernation can kill frogs. At least 33 of the >100 reptile species in the project area are Namibian endemics, 10 lizards, 10 snakes, and 13 geckos. One gecko is endemic to the Brandberg. Degree of endemism of lizards, geckos, and snakes is higher in the eastern Central and Northern Namib and the adjacent escarpment than in most other areas of Namibia (Berger-Dell’mour, 1985; Griffin, 1998); much of the project area lies in this region. Reptiles are remarkably species rich in the area, despite the desert conditions; in the Walvis Bay district alone, there are 30 lizard and 15 snake species. The dunes between Walvis Bay and Swakopmund are the northernmost tip of the distribution of several dune reptiles, including the Palmatogecko (Palmatogecko rangei), the Southern Slipface Lizard (Meroles anchietae), and the Southern Namib Sand Adder (Bitis peringueyi). The three mentioned species can be of value for tourism because of their
PDF created with pdfFactory trial version www.pdffactory.com

Coastal Profile of the Erongo Region - August 1999 48
famous behaviours of licking fog water off themselves, sand diving, foot-lifting, and side-winding. Their populations are, however, susceptible to disturbance by ORVs. Fourteen terrestrial birds in western Erongo are Namibian endemics, and of these, four are Namib endemics. The project area includes the most important breeding areas for the Damara tern Sterna balaenarum, which is classified as endangered. The other six endangered species are also seabirds. Terrestrial birds are most common around inselbergs, such as Brandberg, and in riverbeds, such as the Kuiseb, Swakop and Ugab. The eastern part of the project area around the Brandberg, Spitzkoppe and south of it contains about 97 species of birds (Molyneux, 1976) with with relatively many endemics of Namibia and of the Southwest Arid Zone (Brown et al., 1998). Rare sightings of Cape Eagle Owls Bubo capensis (a vulnerable species) have been made in this area, and Lappetfaced Vultures Torgos tracheliotus (vulnerable) and Herero Chat (low risk) occur there. Several coastal wetlands are classified as Important Bird Areas. These are Sandwich Harbour, Walvis Bay Lagoon and Bird Sanctuary, Swakopmund Mile 4 saltworks, and Cape Cross Lagoon. Breeding of sea birds is confined to guano platforms or islands on salt pans, except for some species, for example Damara terns which breed on the mainland. These wetlands have a very high value for conservation and tourism. The project area has a relatively low species richness of mammals (Griffin, 1998b, c), which is especially expressed in the relatively low numbers of ungulate species (indigenous hoofed animals). Still, there are 47 mammal species listed for the Walvis Bay district alone, most of them being bats, rodents, or carnivores. Nearly all of the 80 mammal species found in the Namib-Naukluft Park (Stuart, 1974; Withers, 1979; Griffin, 1998b, c) can be expected to occur in the project area, but there may be additional species in the Brandberg area. Ten of the species known to occur in the project area are Namibian endemics, and one (the Dassie Rat Petromus typicus) belongs to a family unique to Namibia. The endangered Brown Hyaena Hyaena brunnea occurs very rarely in the vicinity of Cape Cross and special care is needed to keep its very tenuous population in the region. Seals are the most abundant large mammal species in the area; gemsbok or springbok on the dry gravel plains are the most spectacular. The Namib has an extraordinary high diversity of darkling beetles (Tenebrionidae), amounting to well over 200 species (Koch, 1962; Endödy-Younga, 1982; Penrith, 1986; Irish, 1990; Henschel et al., 1999). It is estimated that the project area contains about 50% of the species. This high diversity could be due to the mobility and changing configuration of present and past sand dunes that cause populations to become geographically isolated on islands of dune habitat surrounded by gravel or on islands of gravel surrounded by dunes. Tenebrionids are abundant, conspicuous, and flightless, and it is therefore not surprising that they are the best studied large group of insects in the region. They can serve as good indicators of environmental conditions because their populations integrate several environmental factors, namely, detritus, leaves and dung on which they feed, vegetation cover under which they shelter, the hardness, moisture and stability of the soil, and the availability of water from rain, fog, and runoff. Fog-basking by Onymacris unguicularis and fog-trench-building by several Lepidochora beetles are famous, as is the fastest running insect in the world Onymacris plana (Nicolson et al., 1984). The project area contains the northern-most areas where these behaviours can be seen (dunes between Walvis Bay and
PDF created with pdfFactory trial version www.pdffactory.com

Coastal Profile of the Erongo Region - August 1999 49
Swakopmund) and the tourist potential of these remarkable features should be preserved in this area. Fog also explains the presence of a terrestrial pulmonate snail Xerocerastus minutus. It lives under stones on the gravel plains and inselbergs/rocky outcrops in the foggy zones of the Namib and its reproductive activity is correlated with fog precipitation (Hodgons et al., 1994). It may feed on lichen or Fensteralgen occurring respectively on or under the stones they inhabit. These unexpected desert creatures should be considered vulnerable to human interference such as permanently turning stones over, which leaves the snails exposed to dehydration while they are incapable of moving. Other major groups of insects in the area include dung beetles (Scarabaeidae), fishmoths (Thysanura), termites (Isoptera), grasshoppers (Orthoptera), bugs (Hemiptera), flies (Diptera), moths (Lepidoptera), ants and wasps (Hymenoptera) (Marais, 1998). Quite a number of the species found in the area are new to science. Many insects, especially termites, play key roles for essential soil processes and can also serve as bio indicators of soil condition. Some Namib insects exhibit a remarkable endurance without freely available water, and fishmoths and beetle larvae can even absorb water moisture from unsaturated air. Some, such as ants and tenebrionid beetles, are thermopiles (heat-loving) and can tolerate 51-55oC, enabling them to move about on the hot desert surface at 60-70oC (Hamilton, 1975; Marsh, 1985; Curtis, 1985; Robertson et al., 1991). Several insects, such as flies and beetles, are very abundant on the beach, especially on or under kelp and other algae and these represent a most important component of the desert food web, as they are consumed by lizards and spiders on or near the beach (McLachlan, 1985; Polis & Hurd, 1996). Removal of kelp destroys this connection of resources between the rich ocean and the comparatively poor land. One of the interesting predators affected by this abundance of insects on the beach is the medium-sized solifugid, or sun-spider, Cerome inerme. Like most of Namibia, the project area has relatively many species of solifugids, with 28 being endemic to the Namib (Wharton, 1981; Griffin, 1990, 1998d, e). Most solifugids are nocturnal, while one of the attractive species, Metasolpuga picta, is diurnal. There are about 25 scorpion species in the area, and they are usually specialised to live in a particular kind of substratum (sand, gravel, rocks) (Lamoral, 1979). While all buthids have a painful sting, only Parabuthus villosus and P. granulatus are of medical importance (Prins & Leroux, 1986). Several pseudoscorpions occupy silken igloos under rocks and overturned rocks should be returned to their original position (Beier, 1962). At least 90 spiders occur in the project area, many of which are substrate specialists (sand, gravel, rocks) and 13 are Namib endemics (Griffin, 1988; Henschel, 1997; Griffin, 1998d, e). Most are wandering spiders and the desert is not suitable for the majority of web spiders. The large huntsman spiders (Heteropodidae), such as the white lady Leucorchestris, are particularly diverse and conspicuous in this area, and although particular species are habitat specialists, different species are found in many different desert habitats (Lawrence, 1962, 1965, 1966; Griffin & Dippenaar-Schoeman, 1991; Henschel, 1997). Some extraordinary features of Namib spiders are the ability to cartwheel by the wheel spider Carparachne (Henschel, 1990b), which also occurs in the Walvis Bay-Swakopmund dunes, the ability of the spoor spider Seothyra to kill its prey by heat shock during the day (Lubin & Henschel, 1990), and
PDF created with pdfFactory trial version www.pdffactory.com

Coastal Profile of the Erongo Region - August 1999 50
use of stones as foraging tools by the corolla spider Ariadna on the gravel plains (Costa et al., 1995; Henschel, 1995). The ability of Namib dune spider to construct stable burrows into unconsolidated sand (Lawrence, 1962; Henschel, 1990a, b, 1997) may demonstrate invaluable mechanisms for mining engineers. Only three spiders are of medical importance; these include the black widow Latrodectus cinctus, occurring under dwarf shrubs and particularly in coastal hummocks, the six-eyed crab spider Sicarius albospinosus in shaded sand under overhangs, and the violin spider Loxosceles under stones and logs (Prins & Leroux, 1986). As most spiders burrow or shelter in crevices, they are fairly resistant to disturbance. However, the unconsolidated burrows of dune spiders are easily damaged and are replaced at a high energy expenditure to the spiders, and can precipitate their demise (Henschel & Lubin, 1992; Henschel, 1997). In this way, species like the spoor spider Seothyra, can serve as indicators of environmental disturbance. Microfauna is an important component of the soil (André et al., 1997). This includes disturbance to the substrata on the dunes, gravel plains, beneath rocks, in rivers and washes and on the beach. The microfauna includes such animals as mites and nematode worms. Along with the microflora and mycorrhiza (fungus), microfaunal communities are crucial for facilitating nutrient cycling and soil formation and this, in turn enables other organisms to occur at a site. The integrity of the entire micro-community is most important and should not be overlooked when assessing damage or rehabilitation of an area. TABLE 4.1: ENDEMIC VERTEBRATES IN WESTERN ERONGO REGION BIRDS: Namib endemic birds [4] Rüppel’s korhaan Eupodotis rueppellii (gravel plains & interdune plains) Dune lark Certhilauda erythrochlamys (dunes) Damara tern Sterna balaenarum Gray’s lark Ammomanes grayi (gravel plains & interdune plains) Namibian endemic birds [10] Hartlaub’s francolin Francolinus hartlaubii Rüppel’s parrot Poicephalus ruepelli Monteiro’s hornbill Tockus monteiri Barecheeked babbler Turdoides gymnogenys Violet woodhoopoe Phoeniculus damarensis Herero chat Namibornis herero Rockrunner Achaetops pycnopygius Short-toed rock thrush Monticola breviceps Whitetailed shrike Lanioturdus torquatus
PDF created with pdfFactory trial version www.pdffactory.com
Coastal Profile of the Erongo Region - August 1999 51
Endangered birds White pelican Pelecanus onocrotalus Pinkbacked pelican Pelecanus rufescens (rare vagrant) Cape gannet Morus capensis Crowned cormorant Phalacrocorax coronatus Greater flamingo Phoenicopterus ruber Lesser flamingo Phoeniconaias minor Vulnerable birds Lappetfaced vulture Torgos tracheliotus Black eagle Aguila verreuxii African black oystercatcher Haematopus moquini Chestnutbanded plover Charadrius pallidus Hartlaub’s gull Larus hartlaubii Caspian tern Hydroprogne caspia Swift tern Sterna bergii Cape eagle owl Bubo capensis MAMMALS: Namibian endemics Angola hairy bat Myotis seabrai: inselbergs, Brandberg Black mongoose Galarella nigrita: rocks Golden mole Eremitalpa granti namibensis: dunes Hartmann’s mountain zebra Equus zebra hartmannae: eastern plains & inselbergs Mountain ground squirrel Xerus princeps: inselbergs Dassie rat Petromus typicus: inselbergs Namib bush-tailed gerbil Gerbillurus setzeri: plains Namib dune gerbil Gerbillurus tytonis: dunes Namibian rock mouse Petromyscus collinus: inselbergs FROGS: Damara dwarf toad Bufo hoeschi: pools on inselberg [endemic] Dombe dwarf toad Bufo dombensis: pools on inselberg [endemic] Marbled rubber frog Phrynomantus annectens: pools on inselberg [endemic] Tremolo pyxie Tomopterna cryptotis: pools in riverbed [not endemic] REPTILES: Namibian endemic lizards [10] Slender blind legless skink Typhlosaurus braini: dunes Wedge-snouted skink Mabuya acutilabris: grass tufts on sand Namibian tree skink Mabuya spilogaster: Acacia trees in dry river courses Southern slipface lizard Meroles anchietae: dune slipfaces Wedge-snouted desert lizard Meroles cuneirostris: dune vegetation
PDF created with pdfFactory trial version www.pdffactory.com
Coastal Profile of the Erongo Region - August 1999 52
Small-scaled desert lizard Meroles microphilodotus: course coastal dune sand Reticulated desert lizard Meroles reticulatus: plains Short-headed sand lizard Pedioplanis breviceps: plains and washes Dwarf plated lizard Cordylosaurus subtessellatus: near succulents on inselbergs Small-legged burrowing skink Typhlacontias brevipes: coastal hummocks Namibian endemic snakes [10] Damara worm snake Leptotyphlops labialis: plains Western worm snake Leptotyphlops occidentalis: plains Beaked blind snake Typhlops schinzi: plains Namibian dwarf python Python anchietae: rocks & washes Namibian wolf snake Lycophidion namibianum: plains & washes Western keeled snake Pythonodipsas carinata: rocks Namibian shovel-snout Prosymna frontalis: rocks Damaraland tiger snake Telescopus crf. semiannulatus polystictus: trees Western spitting cobra Naja nigricincta: rocks, washes, trees Southern Namib sand adder Bitis peringueyi: dunes Namibian endemic geckos [13] Palmatogecko Palmatogecko rangei: dunes Banded barking gecko Ptenopus carpi: plains Koch’s barking gecko Ptenopus kochi: interdune plains Coastal Namib day gecko Rhoptropus afer: rocks and inselbergs Lesser Namib day gecko Rhoptropus barnardi: rocks Damara Namib day gecko Rhoptropus bradfieldi: rocks and inselbergs African flat gecko Afroedura africana: granite outcrops Festive gecko Narudasia festiva: diurnal on rocks and inselbergs Velvety gecko Pachydactylus bicolor: rocky outcrops Damaraland banded gecko Pachydactylus fasciatus Brandberg gecko Pachydactylus gaiasensis: shelters in sandstone, forages on sand Namib ghost gecko Pachydactylus kochi: rocks on sandy plain (near Cape Cross) Smooth button-scale gecko Pachydactylus laevigatus: rocky outcrops 4.3.3 Potential Small animals, mostly arthropods, are of major importance for the maintenance of essential processes, such as soil formation, nutrient recycling, and facilitation of the establishment of larger plants and animals. Some of these are good bioindicators of ecosystem condition. Animals add to the tourist potential of the area, e.g. great diversity of coastal birds and desert beetles, masses of seals, fog-collecting beetles, wheeling spiders, stone-tool spiders, hot-footing ants. Some animals, such as frogs or snails are best left alone, as their amazing ability to exist in a hyperarid area is subject to not being exposed unnecessarily to the dry atmosphere. Similarly, rare birds, mammals, and reptiles may be of high tourist value, but should be treated with utmost care to avoid their demise.
PDF created with pdfFactory trial version www.pdffactory.com
Coastal Profile of the Erongo Region - August 1999 53
4.3.4 Threats Microfauna and other arthropods and snails, etc., are often overlooked in planning disturbances and rehabilitation. Although they can tolerate the apparently hostile desert conditions, they are very vulnerable to even slight disturbances. Not only these particular species may be threatened, but with them, also other essential ecological processes that they facilitate. The vulnerable population of Damara terns may serve as a flagship of conservation concerns as the protection of this species may also help to protect its environment and all the other less known animals. Although there are several venomous snakes, scorpions and spiders in the area, these can easily be avoided or moved without destroying, because some of these animals are important to the ecological functioning of the Namib. 4.4 MARINE COMMUNITIES 4.4.1 Plankton 4.4.1.1 Phytoplankton Reviews for the Benguela system off Namibia have been carried out by Shannon et al (1984) and Shannon and Pillar (1986). Diatoms dominate the phytoplankton flora in the coastal waters off Walvis Bay outnumbering dinoflagellates by one or two orders of magnitude, with species belonging to the genera Chaetoceros, Rhizosolenia and Coscinodiscus being the most common. Typical values of phytoplankton standing crop recorded off the Erongo coast are >10 million cells per litre. The standing stock of phytoplankton carbon in the neritic zone of the northern Benguela region has been estimated at between 4 and 12g carbon m-2. Seasonal distribution of phytoplankton indicates that during late autumn, moderate to high levels of chlorophyll-a occur along the coast in a narrow coastal band. With the approach of autumn, phytoplankton in the Walvis Bay area and further south often shows a dramatic increase in abundance. Maximum phytoplankton concentrations appear to occur south of Cape Cross within 80 to 120 km of the coast. 4.4.1.1.1 Red tides Intense blooms of phytoplankton or “red tides” are unusually high concentrations of unicellular algae or protozoans, which cause discolouration of the water. A red tide may be any colour from red to brown or merely darkly shaded water. Blooms occur when the multiplication rate of the causative organism is stimulated to increase rapidly by complex chemical and biological factors taking place in response to favourable meteorological and hydrological conditions. These blooms can sometimes be responsible for mass mortalities of fish and other marine organisms, either through physically clogging the gills or by producing neuro-toxins. Other conditions associated with phytoplankton blooms, such as their subsequent decomposition which strips oxygen from the water and results in hypoxia, anoxia and
PDF created with pdfFactory trial version www.pdffactory.com

Coastal Profile of the Erongo Region - August 1999 54
in extreme conditions the formation of hydrogen sulphide, can also lead to mass mortalities. The occurrence of red tides and fish mortalities has been widely reported and documented off the coast of Namibia for many years and especially in the vicinity of Walvis Bay (Brongersma-Sanders (1948), Copenhagen (1953), Kollmer (1958), Pieterse and van der Post (1967)). These blooms generally occur during summer and autumn when upwelling is suppressed and calm, warm conditions prevail. Normal numbers of dinoflagellates off Walvis Bay fluctuate between 100 000 and 3 million cells l-1 (Pieterse and van der Post, 1967). Under bloom conditions however, densities can reach >30 million cells l-1. 4.4.1.2 Zooplankton Kollmer(1963), Shannon and Pillar (1986), and Crawford et al(1987) have reviewed the occurrence, seasonal distribution and abundance of zooplankton off the central Namibian coast. Whilst the phytoplankton maxima occur close inshore, the zooplankton are further offshore. Copepods are numerically dominant, with a high biomass found on the wide shelf region to the west and south of Walvis Bay (Olivar and Barange, 1990; Timonin et al, 1992). Euphausids are also an ecologically important component, being dominated by the species Nyctiphanes capensis and Euphausia hanseni. Studies have shown that the former can reach very high densities in the shallow coastal waters between Cape Cross and Conception Bay. Other groups present in the zooplankton include coelenterates, chaetognaths, tunicates, amphipods and various invertebrate larvae. Ichthyoplankton form an important component. Hutchings et al (1991) estimated production off Walvis Bay to be 34 - 46g.C m-2 yr-1 with a population doubling time of about 35 days. Barange et al (1991) estimated the total standing stock of particulate organic carbon in the 0 -100m layer at 1.2g-atCm-2 for active upwelling and 3g-atCm-2 during abated upwelling. Zooplankton carbon was given as 0.22 and 0.27 g-atCm-2. 4.4.2 Commercial fishery resources • Pilchard Sardinops ocellata and horse mackerel Trachurus trachurus capensis
currently form the most important pelagic fisheries off Namibia, occurring within 20 – 30 km of the coast. Pilchard and Anchovy Engraulis japonicus occur in dense shoals very close to the shore, especially between Walvis Bay and Henties Bay.
• Hake Merluccius capensis larvae and juveniles congregate in inshore nursery areas. Larvae tend to concentrate in the Walvis Bay region in midsummer. Juvenile 0-year old hake shoal inshore, in small but very dense aggregations between Cape Cross and Conception Bay. This area in an important recruitment area for a large part of the Namibian hake stocks.
PDF created with pdfFactory trial version www.pdffactory.com
Coastal Profile of the Erongo Region - August 1999 55
• Pelagic and demersal fish spawn throughout the year along the shelf and in the coastal waters from Cape Frio to Conception Bay. The area between Walvis Bay and Cape Cross appears to be the main area of high spawning activity.
• Pelagic goby Sufflogobius bibarbatus spawn along the entire Namibian coastline with concentrations of larvae occurring in a narrow coastal band, some 20km wide. They are important food for species such as hake.
• Round herring Etrumeus whiteheadii are widespread within the 100m isobath. • The nearshore area around Sandwich Harbour and South of Cape Cross appear to
be the main area of spawning activity of West coast sole Austroglossus microlepis.
Linefish species are kob Argyrosomus inodorus , west coast steenbras Lithognathus aureti, galjoen Coracinus capensis and blacktail Diplodus sargus. The main species targeted by linefish boats in the area are snoek Thyrsites atun and kob. Skiboats catch mainly snoek, kob, barbel Galeichthys feliceps and west coast steenbras. Although rock lobster Jasus lalandii are not caught commercially along this portion of coast, they provide an important recreational fishery during the season (November to March). 4.4.2.3 Marine mammals From the 34 spp of marine mammals recorded in Namibian waters, several occur close inshore: the Cape fur seal Arctocephalus pusillus pusillus, Humpback whale Megaptera novaengliae, Southern Right Whale Lissodelphis peronii, Dusky dolphin Lagenorhynchus obscurus and Heaviside dolphin Cephalorhynchus heavisidii. The Cape Cross seal colony accounts for 19 % of the total pup production of the species and is the northernmost breeding colony. Furthermore, Cape Cross is the only breeding colony accessible to the public, and as such an important public attraction. 24 species of cetaceans are recorded off the Namibian coast. 4.4.2.4 Intertidal and shallow benthic fauna Zoogeographically the Erongo coastline fits into the north temperate province of the southern African west coast (Emanuel et al 1992) which extends from Sylvia Hill in the south to the Kunene River. The fauna is distinctly depauperate in the temperate forms found in the southern temperate province which extends from Luderitz southwards. It however includes a few tropical forms from the Angolan tropical zone. All shore types are represented : sandy shores predominate; rocky as well as mixed rock and sand are typical of the Swakopmund area, and sheltered estuarine areas are found at the Walvis Lagoon, Sandwich Harbour and Cape Cross. Artificially created marine wetlands, not essentially part of the coastline, have been created by the salt works at Walvis Bay and just north of Swakopmund. The intertidal and shallow benthic fauna is of low diversity but high density. The shore invertebrates are predominantly filter feeders, exploiting the high concentrations of organic particulate matter – diatoms form the bulk of the phytoplankton and benthic microalgae. Mussels dominate the faunal biomass on both rocky and sandy
PDF created with pdfFactory trial version www.pdffactory.com
Coastal Profile of the Erongo Region - August 1999 56
shores, with the intertidal rocky mytilid biomass per unit area higher than elsewhere on southern African shores. The sandy shore fauna is dominated by the burrowing white mussel Donax serra. 4.4.2.4.1 Rocky fauna The rocky areas, exposed to both heavy wave action and sand scour, are offset by shallow kelp (Laminaria schinzii) beds, which do not extend beyond depths of 10m. The intertidal mussel beds form a solid belt extending from the balanoid zone (midwater mark) to the infratidal fringe. Maximal density occurs at the low water mark, where layering frequently results in hummock formation. Three mussel species are present : the endemic species Perna perna and Semimytilus algosus, and the alien black mussel Mytilus galloprovincialis. Vertical zonation of intertidal fauna differs from the southern temperate Benguela, with 4 recognizable zones : 1. Littorina zone characterised by the high shore pulmonate Nodlittorina africana
knynsaensis. 2. Balanoid zone characterized by the barnacle Chthamalus dentatus and the limpet
Patella granularis 3. Mussel belt characterized by 3 mytilid species : Perna perna, Semimytilus
algosus and the alien Mytilus galloprovincialis; and banks of the large sandy anemone Bunodactis reynaudi.
4. The Infratidal fringe characterized by the growth of a variety of macroalgae, including kelp Laminaria schinzii, defining the intertidal limit. Subtidally algae and mussels continue to a depth of 8m. Shallow wave-zone benthic fauna include abundant occurrence of the large solitary ascidian or “red-bait” Pyura stolonifera, sea urchins Parechinus angulosus, a variety of sponges, and whelks Thais haemostoma.
Sublittoral fauna includes the Cape spiny rock lobster Jasus lalandii . Very little macroalgae is found deeper than 10m. probably owing to the highly turbid waters with poor light penetration. Deeper rocky areas are markedly low in species, dominated by the brachiopod Discinisca tenuis, starfish Patriella stellifera and various tubeworms. It can be assumed that the benthic fuana is largely regilated by hypoxia, anoxia and sulphide. The surf zone provides habitat and nursery areas for several species of fish. Rockfish (most commonly belonging to the families Cliniidae, Blennidae and Gobiesocidae) are found intertidally, whilst shysharks Haploblepharus pictus, and schools of blacktail Diplodus sargus frequent the kelp beds. Within and beyond the surf zone several sought-after linefish species occur: kob, steenbras, dassie/blacktail, galjoen and barbel. Less common and rare fish found along this stretch of coast include Red Roman Chrysoblephus laticeps, Piggy Pomadasys olivaceum, Panga Pterogymnus laniarus, black seabream Spondyliosoma cantharus, shad Pomatomus saltatrix and white stumpnose Rhabdosargus globiceps. Various sharks, skates and rays are frequently encountered.
PDF created with pdfFactory trial version www.pdffactory.com
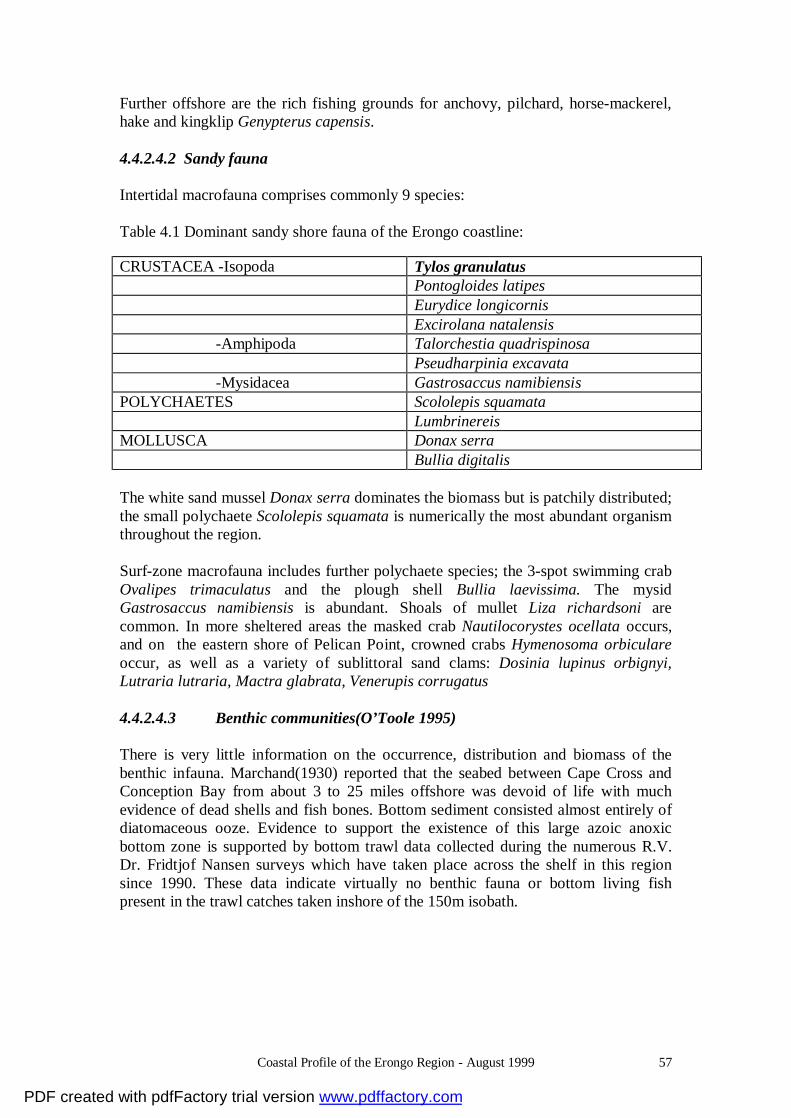
Coastal Profile of the Erongo Region - August 1999 57
Further offshore are the rich fishing grounds for anchovy, pilchard, horse-mackerel, hake and kingklip Genypterus capensis. 4.4.2.4.2 Sandy fauna Intertidal macrofauna comprises commonly 9 species: Table 4.1 Dominant sandy shore fauna of the Erongo coastline: CRUSTACEA -Isopoda Tylos granulatus Pontogloides latipes Eurydice longicornis Excirolana natalensis -Amphipoda Talorchestia quadrispinosa Pseudharpinia excavata -Mysidacea Gastrosaccus namibiensis POLYCHAETES Scololepis squamata Lumbrinereis MOLLUSCA Donax serra Bullia digitalis The white sand mussel Donax serra dominates the biomass but is patchily distributed; the small polychaete Scololepis squamata is numerically the most abundant organism throughout the region. Surf-zone macrofauna includes further polychaete species; the 3-spot swimming crab Ovalipes trimaculatus and the plough shell Bullia laevissima. The mysid Gastrosaccus namibiensis is abundant. Shoals of mullet Liza richardsoni are common. In more sheltered areas the masked crab Nautilocorystes ocellata occurs, and on the eastern shore of Pelican Point, crowned crabs Hymenosoma orbiculare occur, as well as a variety of sublittoral sand clams: Dosinia lupinus orbignyi, Lutraria lutraria, Mactra glabrata, Venerupis corrugatus 4.4.2.4.3 Benthic communities(O’Toole 1995) There is very little information on the occurrence, distribution and biomass of the benthic infauna. Marchand(1930) reported that the seabed between Cape Cross and Conception Bay from about 3 to 25 miles offshore was devoid of life with much evidence of dead shells and fish bones. Bottom sediment consisted almost entirely of diatomaceous ooze. Evidence to support the existence of this large azoic anoxic bottom zone is supported by bottom trawl data collected during the numerous R.V. Dr. Fridtjof Nansen surveys which have taken place across the shelf in this region since 1990. These data indicate virtually no benthic fauna or bottom living fish present in the trawl catches taken inshore of the 150m isobath.
PDF created with pdfFactory trial version www.pdffactory.com
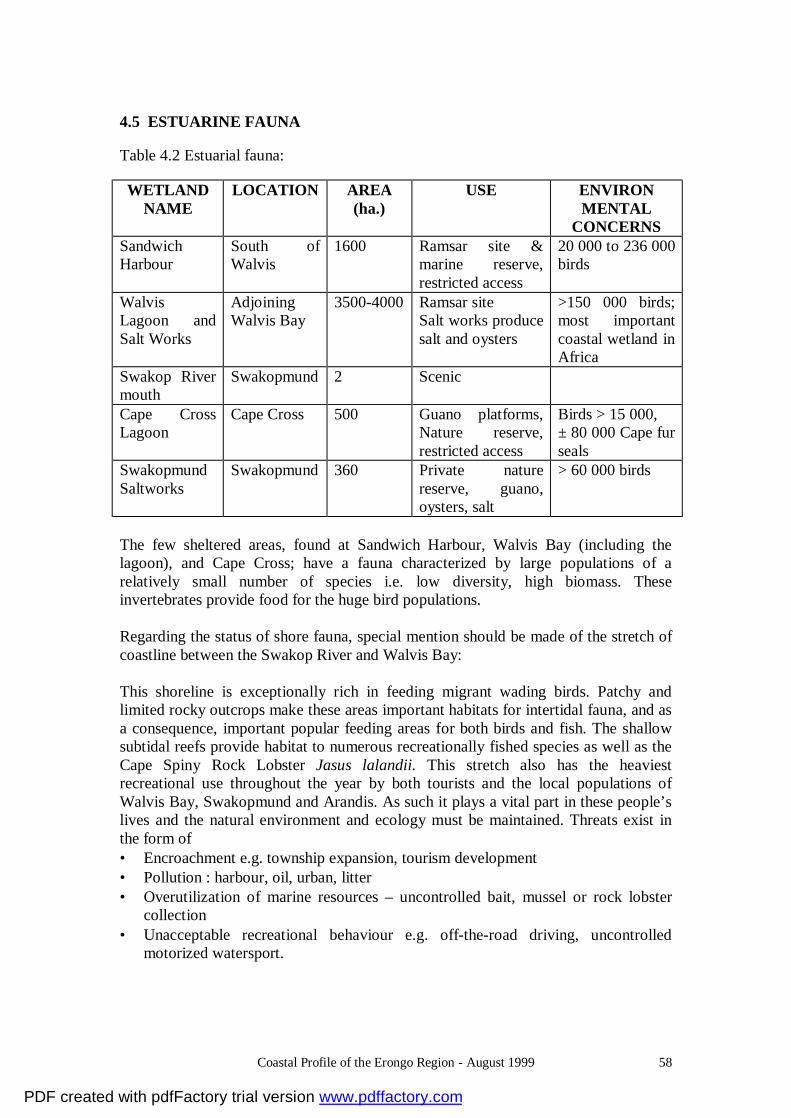
Coastal Profile of the Erongo Region - August 1999 58
4.5 ESTUARINE FAUNA Table 4.2 Estuarial fauna: WETLAND
NAME LOCATION AREA
(ha.) USE ENVIRON
MENTAL CONCERNS
Sandwich Harbour
South of Walvis
1600 Ramsar site & marine reserve, restricted access
20 000 to 236 000 birds
Walvis Lagoon and Salt Works
Adjoining Walvis Bay
3500-4000 Ramsar site Salt works produce salt and oysters
>150 000 birds; most important coastal wetland in Africa
Swakop River mouth
Swakopmund 2 Scenic
Cape Cross Lagoon
Cape Cross 500 Guano platforms, Nature reserve, restricted access
Birds > 15 000, ± 80 000 Cape fur seals
Swakopmund Saltworks
Swakopmund 360 Private nature reserve, guano, oysters, salt
> 60 000 birds
The few sheltered areas, found at Sandwich Harbour, Walvis Bay (including the lagoon), and Cape Cross; have a fauna characterized by large populations of a relatively small number of species i.e. low diversity, high biomass. These invertebrates provide food for the huge bird populations. Regarding the status of shore fauna, special mention should be made of the stretch of coastline between the Swakop River and Walvis Bay: This shoreline is exceptionally rich in feeding migrant wading birds. Patchy and limited rocky outcrops make these areas important habitats for intertidal fauna, and as a consequence, important popular feeding areas for both birds and fish. The shallow subtidal reefs provide habitat to numerous recreationally fished species as well as the Cape Spiny Rock Lobster Jasus lalandii. This stretch also has the heaviest recreational use throughout the year by both tourists and the local populations of Walvis Bay, Swakopmund and Arandis. As such it plays a vital part in these people’s lives and the natural environment and ecology must be maintained. Threats exist in the form of • Encroachment e.g. township expansion, tourism development • Pollution : harbour, oil, urban, litter • Overutilization of marine resources – uncontrolled bait, mussel or rock lobster
collection • Unacceptable recreational behaviour e.g. off-the-road driving, uncontrolled
motorized watersport.
PDF created with pdfFactory trial version www.pdffactory.com

Coastal Profile of the Erongo Region - August 1999 59
4.5 PROTECTED AREAS/AREAS NEEDING PROTECTION 4.5.1 Cape Cross, Cape fur seal colony
The Cape Cross Seal Reserve (CCSR) is a park to which access is controlled by MET, but the Ministry of Fisheries and Marine Resources control the utilisation of resources. This makes close collaboration necessary. CCSR harbours one of the largest colonies of Cape fur seals Arctocephalus pusillus pusillus, and is the northernmost breeding colony of this species (Shaughnessy, 1982; David, 1989). The cape is rocky. The stone cross at Cape Cross is a national monument. It is an 1895 replica of the original one placed there by the Portuguese Diago Câo in 1484. Inland and south of CCSR there is a 15-km long salt pan at <1 m amsl (above mean sea level), with 5 m thick layers of rock salt (30-35 cm pure salt on top). Many birds associate with the guano platform on the salt pan. The Cape Cross seal population increased from 80 000 to 90000 in 1980 to 108000 in 1986 (David, 1987) in accord with a general increase in numbers of this species as its exploitation eased slightly (David, 1989). There was a population crash in 1994, following starvation due to environmental change, and the numbers are slow to recover. The seals give birth in late November to early December (Zur Strassen, 1971). In the 1980’s each year some 5000-10000 pups were culled by clubbing for the fur trade; an average harvest rate of 8600 was estimated to be sustainable at Cape Cross. This figure was revised after the population crash, but maximum sustainable yield is being sought, although a moratorium may be necessary to allow the population to recover. Besides the culling of pups, some bulls are being shot and killed to remove their genitalia as a reputed aphrodisiac. Cape Cross seals move between colonies and can arrive there from as far away as Cape Town. In the 1980s the Cape Cross seals were estimated to consume some 50000 tons of fish per annum (David, 1987), of which >52% of the diet are non-commercial fish species (David, 1989). Seals are therefore no serious threat to fisheries even during their population peak, and they are only one of many fish predators affecting the Namibian fish populations (David, 1989). The rocks at Cape Cross where seals haul out are not a major breeding site for seabirds, i.e. there is no competition for space between birds and seals as may occur elsewhere (most birds are on the salt lagoon south of the rocks; Crawford et al., 1989). Numerous jackals move in and out of the seal colony; there are 22 jackals/km2 and they tend to stay <1 km from the coast (Hiscocks & Perrin, 1988). These jackals have home ranges of up to 11.5 km along the beach and onto the salt pan. Some brown hyaenas still frequent the area and occasionally feed on seal pups. Not only the seal products are of economic importance, although the harvesting is probably illegal, but the tourist potential is enormous, as nowhere else in Namibia are tourists able to see such great numbers of seals together, and able to come so close to them. This makes CCSR the best source of income for MET in the western Erongo.
PDF created with pdfFactory trial version www.pdffactory.com
Coastal Profile of the Erongo Region - August 1999 60
Salt is being mined in the Lagoon south of the CCSR, and this company is competing with salt companies at Swakopmund and Walvis Bay. To avoid costs and to reduce the current degrading the main road by lorries, the mining company has requested that a jetty be established to load salt onto ships; geographically, the CCSR is the best site to build a jetty. The salt mine itself is encroaching onto the CCSR from the east. The seal factory that processes the culled animals is encroaching onto CCSR from the north. All stakeholders need to negotiate to avoid conflict and environmental damage. 4.5.2 Lichen Fields Lichens are a special characteristic of nearly the entire area of the western Erongo within 30 km of the ocean, especially north of Swakopmund. Presently no areas are specifically formally protected for the lichens, although lichens in general are protected. One of the major threats to Namib lichens are off-road vehicles (Daneel, 1992), road developments, and other construction (EEAN, 1991). A fresh ORV track destroys 80% of the lichens; tracks reduce the microtopography and stones with lichen are pushed into the soil, thereby reducing surfaces for lichens to grow on and impeding their recovery. Namib lichens should be protected formally. They have a high value for the maintenance of ecological processes, including their key role for biodiversity (Craven, 1998), as well as the value to people, e.g., aesthetics of the desert landscape (recreation and tourism), medicine, and age determination of substrata, as well as being indicators of air pollution. Hale (1986) recommended that in the Namib: a) lichen areas should be identified and inventoried b) important lichen areas should be protected and signs posted near them to
increase public awareness c) access by vehicles should be severely restricted d) a specialist should be appointed to conduct and co-ordinate research, educate
various sectors, and ensure that the recommendations are carried out e) any development in lichen-field areas must be preceded by an environmental
assessment, and entry to parks by all persons must be carefully controlled. To date, only recommendation (a) has been partly met and (b) is being done. The project area has at least 7 major lichen fields where lichens are abundant and in addition contain exceptionally high numbers of lichen taxa. Although Namib lichen is not confined to these areas and occurs in many areas between these fields (plains as well as inselbergs), protection efforts should concentrate on these small main fields on the gravel plains. The fields mostly differ in their species composition and physical structure, so that each field needs to be looked at separately (Schieferstein, 1990): 1. 15 km SE of Swakopmund, 15km E of Walvis Bay (20o40’S; 14o34’E): south
of the Swakop river north of Swartbankberg, east of small dune field, west of Welwitschia Plains (~800 km2): encrusting Caloplaca spp. (C. elegantissima, C. namibensis, C. volkii) and Lecidella crystallina and the wandering Xanthomaculina convoluta.
PDF created with pdfFactory trial version www.pdffactory.com
Coastal Profile of the Erongo Region - August 1999 61
2. 20 km N of Swakopmund: surrounded by washes, main road on W border, high power line on E border, 1.5km N-S, 3km W-E (4.5km2). Tufts of Teloschistes capensis, encrusting Caloplaca, leaf-lichen Xanthoparmelia walteri
3. 24 km N of Swakopmund: between main road and power line, 2km N-S, 4km W-E (8km2); lichens similar to (2)
4. 3 km N of Wlotzkasbaken (22o21’S; 14o27’E): wash forms N border, 200 m E of beach, 5km N-S, 32km W-E, (150 km2). Thick tufts of Teloschistes capensis.
5. Jakkalsputz, 6 km S of Henties Bay (22o07’S; 14o17’E): surrounded by washes with salt pan on E border, 5.5km N-S, 0.5-1.5 W-E (10km2); thick tufts of Teloschistes capensis, Alectoria sp. & Ramalina sp.
6. Mile 88-97, 13 km NE of Cape Cross (21o35’S; 13o56’E): main road at S, opposite Horingbaai in N, 600 m from beach, Messum Crater at E, 20km N-S, 8.5 km W-E (250 km2): leaf-lichen Xanthomaculina hottentotta, tufts T. capensis
7. Mile 99, Brandberg-West road: 4km N-S, 6km W-E: leaf-lichen Xanthomaculina hottentotta, tufts T. capensis.
Beside in these fields, lichens are often found in the general area 1-30 km from the coast, with highest densities several kilometres from the ocean. Damage by ORVs is heaviest west of the existing salt road and it has been suggested that in future most vehicle activity (including the possible construction of a new road) focus on the area west of the existing salt road; it is difficult to keep fishermen from driving over this area. The inselbergs such as Brandberg, Spitzkoppe, Swartbank, and Laguneberg also bear many lichens. Of these, the Laguneberg deserves special protection due to the aesthetic aspects and high diversity of this raised, visible lichen field (dominated by Xanthoparmelia spp.). MET is planning to actively discourage off-road driving in the lichen fields and distribute information brochures and boards on lichens so as to inform people camping in the area. Maps on the pamphlets show the location of routes in the area east of the main road so that off-road vehicles that need to pass through the area will adhere to these. Especially sensitive areas have not been advertised due to the lack of staff to protect such areas from wanton vandalism. 4.5.3 Damara terns The Damara tern Sterna balaenarum is classified in the Red Data Book as “rare and near-threatened” (Collar & Stuart, 1985). This seabird nests on land, but forages in and behind the surf zone (Braby et al., 1992). It is most abundant along the Namibian coast during summer and most birds migrate to Cameroon-Ghana in winter (Clinning, 1978; Brooke, 1984). Breeding occurs in Namibia between October-April with a peak in December-January and there are some 12000 birds between Kunene River and Sandwich Harbour during this period (Simmons et al., 1998). The main nesting grounds for this species are situated in the project area, although some nests also occur in surrounding areas, in South Africa and perhaps Angola (Berutti, 1989; Crawford & Simmons, 1997). Most nests are situated 1.7-3.2 km away from the ocean (Simmons 1993) at sites where visibility is good (Clinning,
PDF created with pdfFactory trial version www.pdffactory.com

Coastal Profile of the Erongo Region - August 1999 62
1978), often in lichen fields (Frost & Schaugnessey, 1976). The nests are simple: only one egg is laid on bare ground or in a shallow scrape on the gravel plains, dry salt plan, or rocky ledge. Pairs of birds tend only one egg and care for the chick for an extended period of time. The nests are in loose colonies of 1-8 nests.km-2. A large concentration of 110-120 nests is situated at Caution-Reef, 8-11 km S of Swakopmund on both sides of the main road and this colony may be declining. This is the only site where Damara terns nest also on the beach, as they use all available space between the ocean and the dunes. Another large colony is at two large salt pans spanning several kilometers at Durissa Bay/Hoist Point, S of Ugabmond (Simmons et al., 1998; Simmons pers.comm.). Of the other smaller colonies, one along the eastern edge of the Jakkalsputz salt pan, 54 km N of Swakopmund, and another next to Mile 72 salt pan, are notable. Off-road vehicles are a particular danger, as they destroy nests and disturb the breeding birds; strict control of vehicles is recommended in the breeding areas. Information boards/displays and sign posts would increase public awareness. Protection efforts should focus on Caution Reef, Jakkalsputz, Mile 72, and Durissa Bay, particularly during the summer school holidays (December-January). No formal protection or law against damaging Damara tern nesting areas currently exist. Tourism into Damara tern nesting areas disturbs the birds and results in increased risk of predation of the egg or chick. As with lichens, information pamphlets in conjunction with keeping the most sensitive areas unkown to the public, are methods employed by MET to reduce disturbance. 4.5.4 Brandberg Namibia’s highest mountain (2573 m amsl) is an inselberg that covers 65 000 ha and is situated in the Brandberg Monument Area (BMA) of 111 226 ha (approximately 21o00’-21o17’S; 14o21’-14o45’E; see Map 4.5.4.1). Protection and management of the BMA should get attention urgently. It is very valuable for its: • rock paintings, being one of the richest sites on earth (with >40 000 in the upper
Brandberg); it is thus one of the most important historical and cultural heritages of Namibia
• biodiversity hotspot, containing many species, some of which are special and many of which are endemic to Namibia and some to the Brandberg, i.e., they exist only on the Brandberg. For example, besides 8 plant species endemic to the Brandberg, 66% of the Namibian endemics occur on this mountain, and there are 41 protected and 14 Red Data plant species (see sections 4.1 and 4.3).
• aesthetics, beautiful scenery of the mountain and its surroundings • tourism/recreation, hiking/mountaineering, and associated income generation
(over 6500 tourists annually visit the White Lady rock painting alone) • small scale mining of rocks and minerals • water sources for pastoralists and visitors.
PDF created with pdfFactory trial version www.pdffactory.com
Coastal Profile of the Erongo Region - August 1999 63
There are many problems and threats currently facing BMA (Loutit, pers.comm.): • lack of a management plan to guide current and future use • insufficient information on human endeavours, including population, all tourism,
environmental issues, cultural issues, and socio-economic potential • increasing uncontrolled tourism (increasing at some 15-40% per annum) • insufficient control over small mining • water extraction reduces water table • increased grazing causing land degradation • increased poaching • uncontrolled developments of roads and ORV tracks • vandalism of rock paintings • conflicts over BMA boundaries and water points near its boundaries. The National Monuments Council (NMC of the Ministry of Basic Education and Culture) controls the area since 1964, but lacks the resources to manage recent developments and has thus requested MET to draft a management plan and to formulate Terms of Reference for an environmental evaluation (Loutit, 1997). The situation is complex and there are many issues and organisations involved. While all parties agree that the issues are pressing, there are conflicts between various government departments, private entrepreneurs and NGO’s, small mining companies, and the local communities, e.g., over land-use, development of infrastructure, existing or applicant concession-holders, research, and protection status of the area. Given the escalation in the uncontrolled use of the area in recent years, degradation of this unique and invaluable area will be inevitable, unless a full management plan comes into operation and policy guidelines have been accepted. It has been proposed that the BMA become a World Heritage Site, and Man & Biosphere Reserve, incorporated into a People’s / Contractual Park. The BMA should be the core area of a larger management area including Cape Cross, Messum, Spitzkoppe, Brandberg, middle Ugab River, Doros, Twyfelfontein, and Petrified Forest (Loutit, 1997) (the latter three places lie outside the project area). Ideally, this should be placed under the jurisdiction of one administrative body. The Brandberg epitomises the need for good co-ordination and agreement between many organisations and departments that control, influence, or are stakeholders in the area. Besides many of the ministries, headed by NMC and MET, stakeholders include the local communities, Brandberg Trust, University of Namibia (UNAM), Southern African Rock Art Association (SARARA), Save the Rhino Trust (SRT), Integrated Rural Development and Nature Conservation (IRDNC), Tourism Association of Southern Africa (TASA), Namib-i, Namibian Community-Based Tourism Association (NACOBTA), Namibian Association of Tourism and Hospitality (NATH) and several tourism and small mining companies. Co-ordination would also be necessary between the Erongo and Kunene Regional Governments. It was proposed (Kolberg, 1997) to establish a task group that would draft a concept plan, obtain cabinet approval, compile relevant information and identify relevant issues in consultation with stakeholders, and to guide the development of a management plan until its finalisation. There have been initiatives by the Brandberg Trust to take this process forward, but these have been stalled until the decision has been taken of whether the Brandberg is a National Monument or part of a Conservancy.
PDF created with pdfFactory trial version www.pdffactory.com
Coastal Profile of the Erongo Region - August 1999 64
Government also needs to decide to whom it will devolve responsibility. These matters need to be urgently addressed to avoid further deterioration through lack of control. 4.5.5 National Monuments Swakopmund: • Woermann Haus • Evangelical Lutheran Church • Marine Monument • Haus Hohenzollern • Scultetus House • Prinzessin Ruprecht Heim • Alte Bahnhof (old railway station) • Martin Luther Locomotive • Altes Gefängnis (old prison) • Omeg House Walvis Bay: • Altes Missionshaus (old mission house) • locomotive in front of the railway station • part of old railway line near Dune 7 Rural: • original border beacon near Ururas (along the Kuiseb River) • Cape Cross Monument • Rössing Mountain and its southern slope up to the tar road • Regimental Badges (near Arandis) • Brandberg (see below) Archaeological sites: They are protected by law and include: • rock paintings, stone tools and remains of ancient settlements, especially
numerous on and around Brandberg & Greater Spitzkoppe • elephant footprints in Kuiseb Delta • shell middens in Kuiseb Delta and around Cape Cross • stone tools in the dune field • horse burial ground of World War I behind Walvis dunes • ancient whale bones • ship wrecks
PDF created with pdfFactory trial version www.pdffactory.com
Coastal Profile of the Erongo Region - August 1999 65
4.6 COASTAL WETLANDS 4.6.1 Sandwich Harbour Sandwich Harbour is one of a series of natural lagoons located along the Namib coast and is located only 40 km S of Walvis Bay. It has been designated as a Ramsar Site. These lagoons are dynamic and they can close to become salt pans (Gevers & van der Westhuyzen, 1931) or remain open for centuries, such as Sandwich Harbour. Processes of a dynamic ocean as well as seepage of fresh water through the dunes has kept this lagoon open and it was used as a harbour for whalers and other ships over a period of some 150 years (mid 1700s to 1930s). Sandwich Harbour has an important wetland that is used by many birds as well as marine animals. Its fringes of reeds and vegetated banks provide different habitats than are available at the Walvis Bay Lagoon. Much of the bird life moves between the two lagoons. The lagoon at Sandwich Harbour is considerably smaller than that of Walvis Bay, but it is less disturbed and therefore an important haven. Sandwich Harbour falls into the Namib Naukluft Park and access to it is limited. A special permit is required to cross the boundary that lies immediately north of the lagoon. The lagoon and the ocean opposite it are a marine reserve. Fishermen nevertheless encroach on the area from the adjacent beach, disturbing the birds and churning up the sand. The attraction is the tranquil scenery of dunes next to the green-fringed lagoon with its rich bird life. The shape and size of the lagoon has always been dynamic. The mouth is intermittently closed by a sand spit, e.g. in the late 1950s and early 1960s. It sometimes remains wide open for extended periods, e.g. 1960s to late 1980s. The wide open mouth midway along the lagoon caused some of the water-borne sediments to enter the lagoon in an eddy and to be deposited in its southern part until the two parts were separated. Simultaneously, the northern sand spit received less sand, causing it to drift landwards (east) at a rate of 40 m per year. It is possible that the extraction of fresh water in the Kuiseb reduces the seepage of fresh water into the lagoon, as a paleo-channel links the two water bodies. Planned extraction of water from this paleo-channel would further aggravate the situation. Natural processes and extraction have led to the steady elimination of the vegetated salt marsh and the open fresh-to-brack water pools, which were a valuable feeding ground for birds. This is considered to be a loss of a valuable area for conservation and tourism. While the oceanic changes around Sandwich Harbour are natural, requiring no management, the extraction of fresh water requires urgent attention and should involve an environmental impact assessment. The future dynamics of the southern part of the lagoon and its interaction with fresh water seepage may determine the further existence of this wetland.
PDF created with pdfFactory trial version www.pdffactory.com
Coastal Profile of the Erongo Region - August 1999 66
4.6.2 Walvis Bay Lagoon The Walvis Bay Lagoon is the richest coastal wetland on the west coast of southern Africa and, as such, has been designated as a Ramsar site ‘Wetland of International Importance’ (Convention of Wetlands, Ramsar 1971). The lagoon and its adjacent bay is one of Namibia’s very few sheltered, shallow areas connected to the sea. Here a community of animals can usually be found that either do not occur or occur less plentifully on the open shore. The lagoon is bordered by Namibia’s largest harbour, a sandy peninsula, salt pans, dunes, an ephemeral river delta, a bird sanctuary, as well as an urban area. Industrial and recreational activities influence the lagoon and its surroundings. In order to facilitate the management of human uses and influences of the sensitive environment of the lagoon and its surroundings, the Municipality of Walvis Bay is planning to incorporate the lagoon and some of its surroundings into a Nature Reserve following a previous proclamation by the Cape Provincial Administration (1991-1994). This area is not only of conservation importance, but has high economic and tourism potential. Due to the sensitivity of the environment, it warrants special attention. The process is being guided by an environmental management plan (Burger 1998). Zones The lagoon and the area surrounding and influencing it has been delineated into eight zones of different habitat (Burger 1998): Pelican Point – The tip a 7-km long, sandy peninsula (altitude 3 m above MSL) shelters the bay from the dynamic waves of the Benguela current. The peninsula is growing in a north-easterly direction at a rate of 17.4 m (1.5 ha) per annum (CSIR 1996). Pelican Point will become an island if the peninsula should breach at Donkey Bay. There is no vegetation on Pelican Point. Mammals include jackals and a non-breeding colony of 100-15000 seals, while Heavy-side Dolphins and Common Dolphins frequent the surrounding waters. White-fronted and Chestnut-banded Plovers nest on the point and numerous terns roost here. White mussels occur in the surf zone. Walvis Bay Lagoon – At the south-east corner of the bay is a 7-km long lagoon. This is a relatively old feature that appears to have formed 3000 years BP as a result of the interplay of wind and tidal effects (Ward 1997). It is shallow, with depth ranging from 2.5 m at high tide to a minimum of 0.7 m at extreme spring low tides. Progressive siltation has increased the intertidal flats and decreased subtidal areas (Currie 1997). Temperature and salinity differ in different parts of the lagoon and at different times, ranging from bay water at the mouth to warm, saline water in the southern tip (30°C, 46‰). Near the mouth, the sand contains coarse and medium sand fractions, while the central and upper reaches contain finer sediments with substantial levels of clay and organic mud. High levels of nutrients that are generated and imported into the lagoon enable the production of abundant phytoplankton, which supports rich zooplankton and
PDF created with pdfFactory trial version www.pdffactory.com
Coastal Profile of the Erongo Region - August 1999 67
numerous soft-bottom animals (benthic fauna), which, in turn, provides food for many birds and fish. Besides the high density of larger invertebrates, their diversity is low, and there are no species known to be rare or endangered. Density and diversity of invertebrates is highest in the middle sub-tidal reaches, although polychaete worms occur in huge numbers on the intertidal flats. The lagoon used to contain very high densities of coastal fish species, but these have now been reduced to mullets, skates and rays. Bottle-nosed Dolphins frequently enter the Lagoon and jackals patrol its beaches. Birds are the most conspicuous component of the fauna. There are three categories based on seasonal movements and breeding. Resident wetland birds, such as Pelicans, breed along the Namib coast and are present all year long. Intra-African migrants, including Greater and Lesser Flamingos, breed elsewhere in Africa but feed in the Walvis Bay wetlands, particularly during the winter months. Some Intra-African migrants may breed at Walvis Bay when rains fail elsewhere. Palaearctic migrants breed in the northern hemisphere and migrate to southern Africa, where they spend most of September to April, while young birds may remain in Africa for their first year. Over 50000 waders and 23000 terns use the Walvis Bay wetlands each year. Second Lagoon – The Second Lagoon lies off the coastline that extends west from the mouth of the Lagoon and northward along the peninsula to the southern boundary of Pelican Point. It comprises extensive inter-tidal areas and deeper sub-tidal areas towards the bay (up to 5 m deep, with a tidal range of up to 2 m). The former shares many faunal characteristics with the Lagoon, and the latter with the Harbour. Walvis Bay Harbour – The bay north and east of the Second Lagoon, west of the shore and commercial harbour, and south of the Namport limits, is sheltered from strong currents and winds by the Pelican Point peninsula. The harbour has a sandy bottom with depths up to 15 metres. Rich plankton and fish populations of the Benguela system extend into the area and their debris deposits as organic mud, causing toxic sulphur eruptions during summer. The harbour wall is a substratum for the attachment of indigenous sessile marine invertebrates such as mussels, barnacles, tube worms, sea squirts and lace-animals. A high diversity of marine mammals (33) uses the sheltered waters, including whales (Southern Bottle-nosed Whale, False Killer Whale, Pigmy Right Whale) and dolphins (Bottle-nosed Dolphin, Heavy-sides Dolphin, Common Dolphin). Resident sea birds include numerous Cape Cormorants and Kelp Gulls. A guano platform in the northeastern corner of the area supports the only breeding population of Eastern White Pelican in Namibia and up to 4% of the world’s population of Crowned Cormorants (Williams, 1993). Coast – A long, sandy beach and a strip of coastal dunes and salt flats extends along the Pelican Point peninsula across Paaltjies to the Namib-Naukluft Park. Wind and currents move some 2 million cubic meters of sand onto and across the peninsula into the harbour and lagoon. A very narrow section of the peninsula at Donkey Bay is vulnerable to breaching, which would change the patterns of currents, sediment transport, and sedimentation in the Second Lagoon, the Harbour and the Lagoon (CSIR 1996). South of Donkey Bay, the coast is growing westwards at a rate of 5-10m/yr. South of the Second Lagoon, there are 2-km wide Salt Flats that are flooded occasionally by spring high tides and have in the past (e.g. 1974) been inundated by
PDF created with pdfFactory trial version www.pdffactory.com

Coastal Profile of the Erongo Region - August 1999 68
strong Kuiseb River floods. The fauna and flora of this area resembles that of the surrounding coastline (see section 4.3). Salt Works – Artificial salt pans, an oyster culture, salt mounds and buildings of the Salt Works cover an area of 3000 ha southwest of the Lagoon. Expansion of pans has been planned with in a southwesterly direction. The salt pans trap wind-blown sand and reduce the sedimentation rate of the Lagoon. Excess salinity is causing vegetation to die around the pans (Ward 1989). Birds, including many flamingos, like to feed in the shallow pans and some roost on the pan walls. Kuiseb Delta – In the south-east corner of the Walvis Bay district, an area extending from Paaltjies, the Salt Works, and the Bird Sanctuary, to the Namib Naukluft Park, encompasses part of a dune field, sand flats, gravel plains, riparian forest and the delta of the ephemeral Kuiseb River. This area is a major source of sediments moving into the lagoon, as wind erosion causes flaking of silt plates in the Kuiseb pans and dunes to move north at a rate of 1-6 m per year. Sand movement control fences, as well as hummocks of Nara and Salsola hummocks help to stabilise the sand and but may enhance dune growth in this area. The Kuiseb flows into the delta with an average annual volume of 4.3 x 10⁶ m3, but dams in the upper catchments are causing river flow to decrease. The delta used to have two river channels, a northern one running past Narraville and Kuisebmond, and a southern one that occasionally flushed through the lagoon or through the Salt Flats south of it. Since 1963, a flood diversion wall has been blocking the northern river channel while a large barrier dune blocks the southern arm. Although the river has reached the sea 15 times in the 160 years prior to 1963, it has failed to so since (CSIR, 1984). This failure implies that the accumulated sand is no longer being flushed out to sea. This facilitates the encroachment of the dune sea on Walvis Bay. If the river should break open the southern channel, it could flood the salt flats or Salt Works, while a break in the northern wall would result in the flooding of urban and industrial areas of Walvis Bay. The Kuiseb Delta is extensively vegetated. The riparian forest contains camelthorn, anaboom, wild ebony and tamarisk trees and invading plants, such as Ricinus, Datura, and Prosopis, which may be replacing indigenous species. It also contains the largest of all Nara fields, although over half of this has receded following the construction of the flood diversion wall that cut off of the water supply to the northern delta. Nevertheless, the Topnaar community still practises traditional harvesting of Nara fruit in the southern delta and uses the wood of the riparian forest. Namwater extracts bulk water near the main channel of the Kuiseb river between Swartbank and Rooibank and at Dorob. Bird Sanctuary – The sewage works divert much of the pre-cleaned water into open ponds situated east of Walvis Bay, next to Wortel and north of the lagoon. This area is densely overgrown with reeds. The sheltered, food-rich ponds and the reeds facilitate the concentration of a diverse and rich fauna, especially birds, including many of the species also found on the other nearby wetlands where they may be more prone to disturbance.
PDF created with pdfFactory trial version www.pdffactory.com

Coastal Profile of the Erongo Region - August 1999 69
Relationships between Zones – There is considerable influence and interdependence between the various zones around the lagoon. Pelican Point, Second Lagoon, Walvis Bay Harbour and the Coast are important to the lagoon in terms of their influence on sediment transport by wind and by wave action. Some of the fauna of the lagoon, particularly birds, extend their ranges into these zones or arrive at the lagoon via these zones, for example dolphins. Creation of the Salt Works has reduced the size of the lagoon, but provides shallow water feeding habitat for birds and traps wind-borne sediments. The Kuiseb Delta is a source of wind-blown sand. The town of Walvis Bay greatly reduced the size of the lagoon as the town was established and is the support base of people using the lagoon and its surrounding areas for recreation and tourism and dependent on the harbour for industry and shipping. Table 4.3: Sources of positive and negative influences on the Walvis Bay Lagoon from surrounding zones (after Burger 1998) Zone Landscape influences Main use & use level Relationship to lagoon Pelican Point Wind & waves Low tourist use; lighthouse Shared bird population Lagoon Man, sediment dynamics High use: tourism &
recreation -
2nd Lagoon Wind & tides Medium use: recreation Shared recreation venue Harbour Wind & tides High use: shipping Pollution & sediment source Coast Wind & waves Medium use: recreation Sediment source Salt works Man-made High use: salt production Reduced size, sediment trap Kuiseb Delta Wind & river flow Medium use: recreation, water
abstraction & Nara harvesting Sediment source
Bird Sanctuary Man-made Medium use: tourism Shared bird population Birds An abundant and diverse bird community epitomises the special features of the lagoon and its surroundings. Some 90 000 non-breeding birds regularly use the wetlands, with eighteen species being present at times in numbers greater than 1% of their world population. Only 5% are resident species, while 50% are intra-African migrants, 45% are Palearctic migrants (Appendix 4.6.2.A). The nearby beaches hold greater densities of shorebirds than elsewhere in southern Africa. Various areas surrounding the Lagoon augment bird life in the Lagoon. Birds travel back and forth between the Second Lagoon Zone, the Coastal Zone, the Harbour with its Guano Platform and the ‘Bird Paradise’ where fresh water from the Sewage Works supports a variety of plants and birds. Of particular note is the Salt Works where the evaporation ponds serve as an extension of feeding grounds for many of the birds using the Lagoon itself. Marine mammals and fish that frequent the Lagoon must enter via the Second Lagoon and the Harbour. The abundance of birds in the Lagoon, many spending at least part of their time elsewhere, contributes to the enrichment of nutrients in the Lagoon. This organic mud contributes to the presence of hydrogen sulphide and causes the occasional ‘sulphur eruption’ that may kill fish and other marine life. Birds of the lagoon have great conservation value, locally and internationally, economic value as they draw tourists and bird watchers, and evocative value as they help to define the identity of the town of Walvis Bay. Walvis Bay Lagoon is the best flamingo viewing locality in the world, yet to date its value as a tourist attraction is
PDF created with pdfFactory trial version www.pdffactory.com
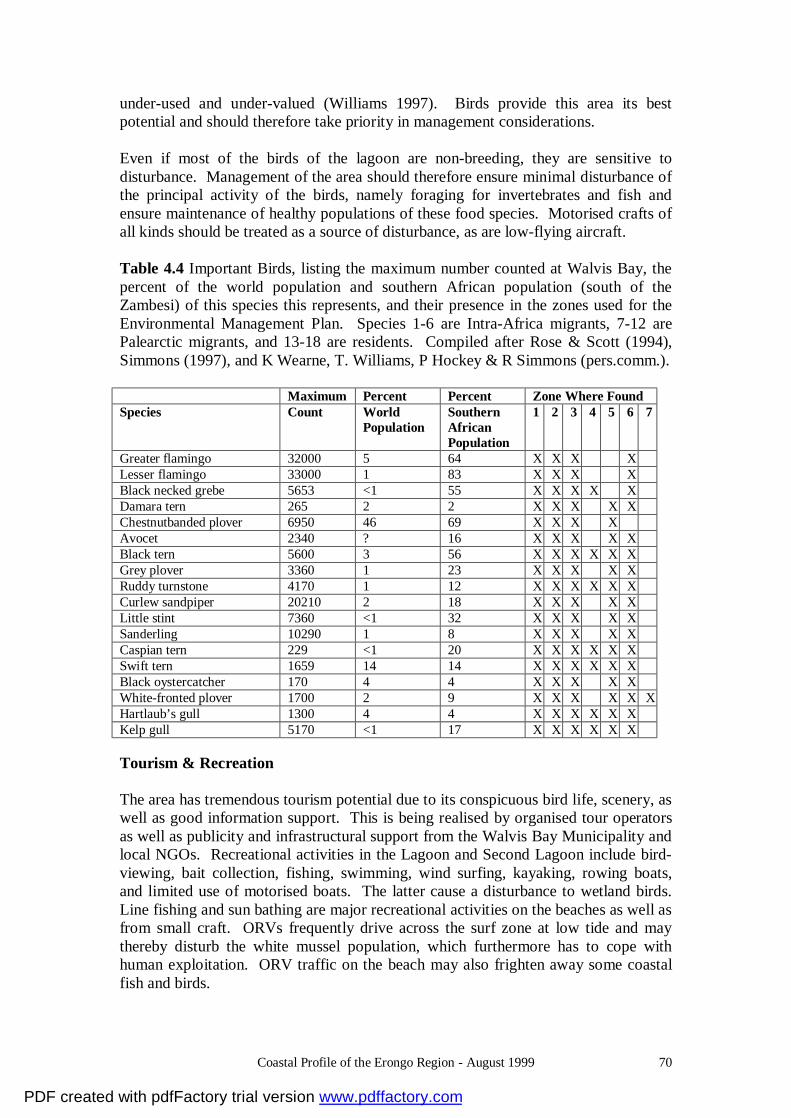
Coastal Profile of the Erongo Region - August 1999 70
under-used and under-valued (Williams 1997). Birds provide this area its best potential and should therefore take priority in management considerations. Even if most of the birds of the lagoon are non-breeding, they are sensitive to disturbance. Management of the area should therefore ensure minimal disturbance of the principal activity of the birds, namely foraging for invertebrates and fish and ensure maintenance of healthy populations of these food species. Motorised crafts of all kinds should be treated as a source of disturbance, as are low-flying aircraft. Table 4.4 Important Birds, listing the maximum number counted at Walvis Bay, the percent of the world population and southern African population (south of the Zambesi) of this species this represents, and their presence in the zones used for the Environmental Management Plan. Species 1-6 are Intra-Africa migrants, 7-12 are Palearctic migrants, and 13-18 are residents. Compiled after Rose & Scott (1994), Simmons (1997), and K Wearne, T. Williams, P Hockey & R Simmons (pers.comm.). Maximum Percent Percent Zone Where Found Species Count World
Population Southern African Population
1 2 3 4 5 6 7
Greater flamingo 32000 5 64 X X X X Lesser flamingo 33000 1 83 X X X X Black necked grebe 5653 <1 55 X X X X X Damara tern 265 2 2 X X X X X Chestnutbanded plover 6950 46 69 X X X X Avocet 2340 ? 16 X X X X X Black tern 5600 3 56 X X X X X X Grey plover 3360 1 23 X X X X X Ruddy turnstone 4170 1 12 X X X X X X Curlew sandpiper 20210 2 18 X X X X X Little stint 7360 <1 32 X X X X X Sanderling 10290 1 8 X X X X X Caspian tern 229 <1 20 X X X X X X Swift tern 1659 14 14 X X X X X X Black oystercatcher 170 4 4 X X X X X White-fronted plover 1700 2 9 X X X X X X Hartlaub’s gull 1300 4 4 X X X X X X Kelp gull 5170 <1 17 X X X X X X Tourism & Recreation The area has tremendous tourism potential due to its conspicuous bird life, scenery, as well as good information support. This is being realised by organised tour operators as well as publicity and infrastructural support from the Walvis Bay Municipality and local NGOs. Recreational activities in the Lagoon and Second Lagoon include bird-viewing, bait collection, fishing, swimming, wind surfing, kayaking, rowing boats, and limited use of motorised boats. The latter cause a disturbance to wetland birds. Line fishing and sun bathing are major recreational activities on the beaches as well as from small craft. ORVs frequently drive across the surf zone at low tide and may thereby disturb the white mussel population, which furthermore has to cope with human exploitation. ORV traffic on the beach may also frighten away some coastal fish and birds.
PDF created with pdfFactory trial version www.pdffactory.com
Coastal Profile of the Erongo Region - August 1999 71
Utilisation of Natural Resources The evaporation pans of the Salt Works support rich biotic communities – benthic and planktonic animals and plants as well as birds – while yielding commercial products: salt, oysters and mussels. By contrast, strip mining of salt, if this were initiated, would be a serious disruption of the biota. The Walvis Bay Salt Works are the first industry on the Namibian coast to follow the guidelines of ISO 14000. The residents of the Kuiseb Delta include Topnaars who still depend on natural products. This includes the fruit of the Nara, camelthorn firewood, and browsing for their goats and donkeys. Traditional, subsistence farming combined with supporting ecotourism by a limited population of rural Topnaars would benefit the sustainability of these natural resources. Traditional methods of water extraction combined with planned fog water harvesting (Henschel et al. 1998) would support this endeavour. Human Impact Walvis Bay, the Lagoon and attendant tidal flats have been subject to considerable development, notably over the past 30 years, resulting in major modifications such as a substantial reduction in size. Residential areas, fixed roads and the Salt Works have foreshortened the lagoon and prevent tidal inundation into adjacent areas. The resulting interruption of ancient dynamic processes has led to widespread concern about the sustainability of the Lagoon. A raised road along the eastern and southern sides of the Lagoon gives easy access from Walvis Bay to areas situated beyond the Lagoon, namely Sandwich Harbour, Paaltjies, Pelican Point, and the Salt Works. The result is relatively heavy traffic by lorries, ORVs and sedan cars (Morris, 1980). Construction of the road effectively truncated the southern Lagoon and reduced seasonal inundation by water toward the south and east. ORVs often drive across the surf zone at low tide and may thereby disturb the white mussel population, which furthermore has to cope with human exploitation. Traffic around the lagoon and on the beach also disturbs nesting or feeding birds thereby reducing their potential productivity. NamWater is extracting large quantities of groundwater, especially at Dorob and upriver of Rooibank. A network of pipelines, reservoirs and roads runs through the Delta. Water extraction exceeds recharge and groundwater levels have declined by 11m in 20 years (DWA). Excessive extraction (>4000 m3/day) from the Kuiseb aquifer will allow a saline wedge to migrate landwards, and reduce the quality of the groundwater. Sand Movements Sediments are steadily accumulating in the lagoon and bay. Water-borne sediment loads tend to be deposited at the Lagoon mouth and this is apparently being augmented by dredging in the harbour. Furthermore, the prevailing southerly winds drive sand northwards onto barchanoid dunes which flank the eastern side of the Lagoon. In summer, sands from these dunes enter the Lagoon between Lover’s Hill and Meersig urban housing development. In winter, large quantities of sand and dust
PDF created with pdfFactory trial version www.pdffactory.com
Coastal Profile of the Erongo Region - August 1999 72
are blown from these dunes into the Lagoon along the entire eastern shore (Ward 1997). Sand movement is being aggravated by the activities of ORVs that churn it up. Similarly, vehicular traffic destabilises the stone pavement surfaces on the gravel plains which, in turn, enhances wind erosion and disturbs soil surface properties for a long period of time (Daneel, 1992; Eckardt & White, 1997). Furthermore, the loose substratum is no longer being bound in areas where the vegetation has disappeared, such as the Salsola hummocks around the Salt Works due to high salinity, and Nara hummocks in the northern Kuiseb Delta due to the reduction of ground water levels. The Directorate of Forestry and the Municipality have attempted to stabilise the dunes near Walvis Bay with trees, but with the entire Great Sand Sea as a source immediately to the south, stabilisation of this sand without removing the accumulation can only remain a temporary measure. The flood diversion wall currently prevents the Kuiseb River from flushing the accumulated sand out to sea. Pollution Water pollution from activities in the Walvis Bay Harbour has a high impact on the bay and the lagoon areas. Air and ground pollutants are of minor importance in the area, but litter from recreational activities is a problem, particularly on the beaches. Pollutants affecting the water column have been identified as: petroleum products, fish processing waste, ore dust, cargo packaging waste, heavy metal waste, paint, bilge, galley waste, sewage, and dredged material (van der Meer 1997). Because it is a high energy system, wave action and water exchange reduce the impact of many of the pollution types on the ocean side. On the other hand, currents enhance the distribution of pollutants into the quiet waters of the Lagoon and Second Lagoon, where they can cause mass mortalities of birds, fish, and invertebrates. NamPort is responsible for the oil spill contingency plan by the Ministry of Transport and Communication, which makes provision that oil be cleaned from this area at all times, except where this may cause further damage (DEA 1989). In the case of an oil spill, floating barriers, sand bags and straw bags should be used to block the mouth of the Lagoon. If an oil spill should enter the Lagoon, cleaning specialists need to be brought in. Environmental Management Plan The very special features of the Walvis Bay Lagoon as well as concern about its future has been expressed over the past 25 years (Aubroeck 1972; Burger 1972; Zwambourn 1972; Berry 1973; Hockey & Bosman 1983; CSIR 1984, 1989; Williams 1987; Ward 1989). The efforts of the Environmental Action Group, spearheaded by Mr K Wearne, culminated in a workshop during July 1997 (WBEAC 1997; DRFN 1997). Subsequent developments led to the compilation of information, plans and concerns by the Municipality, various Government ministries, and numerous NGOs and private stakeholders. This process is planned to culminate in the declaration of the area to a municipal reserve, to clarify legislation, and to develop the necessary support, including staff to oversee the implementation, and to guide the management of future uses and developments of the area.
PDF created with pdfFactory trial version www.pdffactory.com
Coastal Profile of the Erongo Region - August 1999 73
The Saltworks at Swakopmund can be regarded as an artificial nature reserve (Williams, 1993). These artificial pans are located on a natural salt pan (Gevers & van der Westhuyzen, 1931), and salt has been mined there for most of this century. It consists of a series of pans into which seawater is pumped to evaporate over a time period of 12-18 months. Oysters are farmed in one of the first pans. Before their final, most saline stages, these pans represent nutrient-laden, plankton-enriched shallows that feed numerous seabirds. The different pans are regarded as diverse micro-habitats: various bird species utilise different pans at different times of day, depending on the availability of food elsewhere on nearby beaches or the Walvis Bay Lagoon and Sandwich Bay. 4.6.3 Swakopmund Saltworks The saltworks are partly fenced in to protect the seabirds from domestic dogs and Blackbacked jackals, but birds are additionally protected by roosting and sometimes breeding on inter-pan embankments and islands in the pans, and especially on a large, wooden guano platform, the largest such platform in the project area (others are located near Walvis Bay). The platform is home to a quarter of a million Cape Cormorants, and is the single most important breeding locality for this species. The guano is harvested off the platform outside of the breeding season of the cormorants. Conditions at the salt works favour a high bird diversity and such rare visitors as the Great crested grebe Podiceps cristatus have been recorded (Williams, 1993), while Bank cormorants have recently attempted breeding. Chestnut banded plovers frequent the ocean-ward side of the salt pans. Greater and Lesser flamingos attempted to breed on mud islands in the salt pans during 1997 and established 120 nests. However, jackals destroyed all nests and efforts should be made to specifically protect the embankments. Given the potential physical changes of several of the other coastal wetlands in the region, the Swakopmund Saltworks are very valuable. Income from the salt, oyster and guano harvest ensures the sustainability of this important haven for seabirds.
PDF created with pdfFactory trial version www.pdffactory.com

Coastal Profile of the Erongo Region - August 1999 74
5.0 SOCIO-ECONOMIC SETTINGS
This chapter of the profile outlines the demographic and socio-economic characteristics, which have important implications for the development of the Coastal Zone of the Erongo Region. This includes the issues related to housing, municipal services, livelihood and health. 5.1 DEMOGRAPHY The Coastal Zone of the Erongo Region is predominantly urban, because of the unique character of the landscape, which precludes agriculture. The population is thus concentrated in the urban areas of Walvis Bay, Swakopmund, Arandis and Henties Bay and a few small settlements such as Langstrand and Wlotzkasbaken. The rural population in the coastal area includes a group of Topnaars (approx. 500 persons) residing along the Kuiseb River. The dispersed rural communities around Brandberg Mountain and Spitzkoppe have also been included in the ICZM project area, because of their importance with regard to the coastal tourism. Recent surveys estimate the total population of the coastal towns to be around 70,000 persons compared to 44,000 in 1991 census. The recent estimates are based on two studies carried out in 1995 (GKW1) and 1997 (TRP2). An Inter-censal Demographic Survey was undertaken in 1996, but figures are not yet available. Discrepancies between the two available surveys and seasonal fluctuations in the population call for caution in planning with demographic data. Table 5.1. Population in the Coastal Towns of the Erongo Region, 1991–1997 Town Population Seasonal Difference 19951
1991 19951 19972 Peak (Jan.) Low (Sept.) % Walvis Bay: 21,249 34,066 36,974 33,412 32,391 3.2 Town 7,977 6,642 10,223 7,706 32.7 North, incl. Kuisebmond 20,941 23,313 17,785 19,537 -9.0 East, incl. Narraville 5,147 7,019 5,404 5,147 5.0 Swakopmund: 17,670 21,631 25,461 23,102 20,936 10.3 Town 6,251 6,416 8,680 5,721 51.7 Mondesa 9,079 12,569 11,644 12,569 -7.4 Tamariskia 2,340 2,647 2,779 2,647 5.0 Arandis: 4,313 4,382 3,698 3,238 3,858 -16.1 Henties Bay: 1,602 3,214 4,227 7,878 2,202 257.8 Town 439 1,460 5,476 624 777.6 Omdel 1,163 1,754 1,929 1,578 22.2 Wlotzkasbaken: 473 47 906.4 Total 44,834 63,293 70,360 70,931 61,034 16.2
1 Housing Demand and Affordability Study for the Municipality of Walvis Bay carried out by TRP Associates in May 1997. The study included interviews with a random sample of 20% of the households in Walvis Bay. 2 Feasibility Study on Water Supply for the Central Namib Area of Namibia: Socio-economic Background completed in June-July 1995 by GKW Consult Germany, BICON Namibia and PARKMAN Namibia. This survey covered all residential suburbs of the four coastal towns, except the Walvis Bay Hostel and the Swakopmund single quarters, where conditions were considered too risky for the interviewers.
PDF created with pdfFactory trial version www.pdffactory.com

Coastal Profile of the Erongo Region - August 1999 75
Seasonal fluctuations in the populations of town centres of Swakopmund, Henties Bay and Wlotzkasbaken are noticeable in the holiday season of December-January. Especially the latter two experience short periods of extreme influx of tourists. Walvis Bay is less affected by tourism, but 3-4 months later (March-June) thousands of short-term contract workers are engaged in the pelagic fishing and fish-processing season. An unknown number of workers and fishermen return to their families during off-season periods, where they may assist during the farming season in other parts of the country. A social survey in Walvis Bay found that 17% of the households in Kuisebmond have members who live elsewhere for part of the year, primarily in the Oshana Region (Walvis Bay Municipality, 1997). The demand of the fishing industry for workers is heavily dependent on the fishing quotas, which then adds to the fluctuations in population size. The age and gender distribution of the population underline the seasonal character of the employment situation. The surveys indicate a distinct male predominance in Walvis Bay North (including Kuisebmond), Mondesa and in Omdel.
27% of the overall population are under 14 years, which is below the national average for urban areas. Narraville had the highest ratio of children (31%), while older suburbs of central Mondesa and Western Kuisebmond had fairly low ratios (28% and 24%). The majority of the migratory workforce from the northern regions, Windhoek and Erongo Region occupies the temporary housing facilities in Mondesa and Kuisebmond such as single quarters and the Kuisebmond Hostel, where more than 5,000 men resides in dormitories. Parts of Swakopmund Town and Henties Bay have a high ratio of retired people reflecting an older age profile.
Gender Structure in the Erongo Coastal Zone
0% 10% 20% 30% 40% 50% 60% 70% 80% 90% 100%
Walvis Bay Central
Walvis Bay South
North incl. Kuisebmond
East, incl. Narraville
Swakopmund Town
Mondesa
Tamariskia
Henties Bay Town
Omdel
Arandis
Male FemaleSource: TRP, 1997 (Walvis Bay); CSO, 1991 (others)
PDF created with pdfFactory trial version www.pdffactory.com
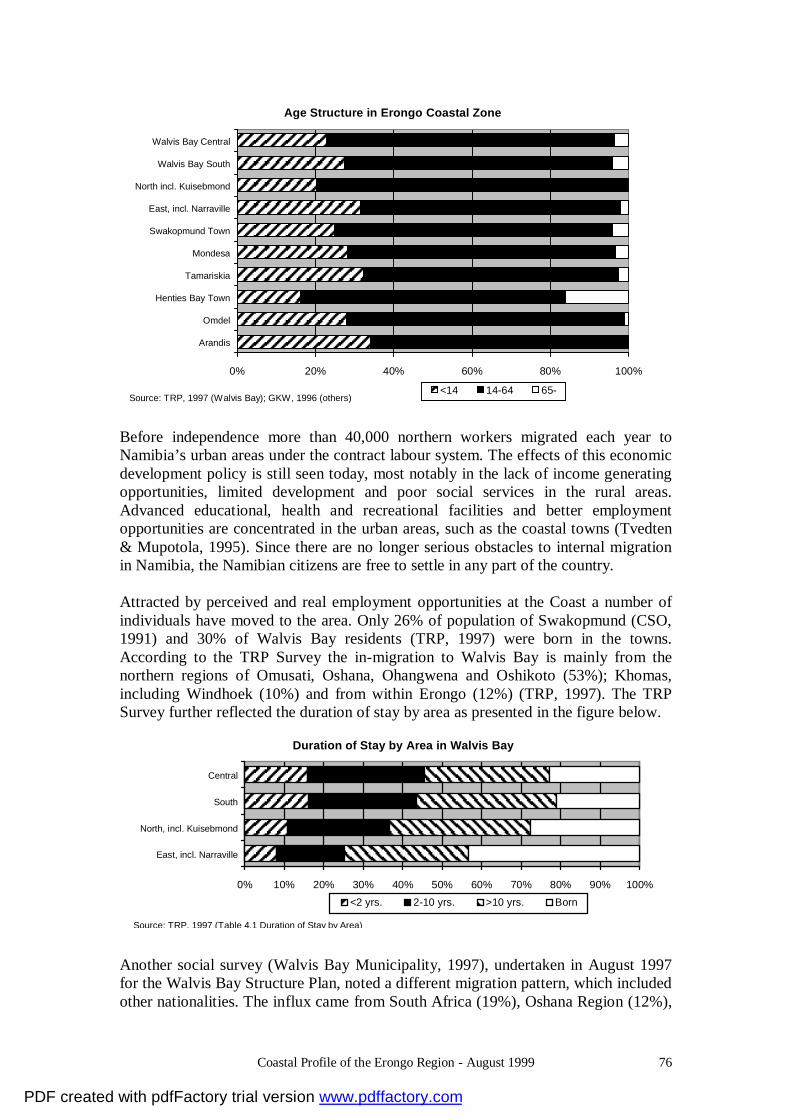
Coastal Profile of the Erongo Region - August 1999 76
Before independence more than 40,000 northern workers migrated each year to Namibia’s urban areas under the contract labour system. The effects of this economic development policy is still seen today, most notably in the lack of income generating opportunities, limited development and poor social services in the rural areas. Advanced educational, health and recreational facilities and better employment opportunities are concentrated in the urban areas, such as the coastal towns (Tvedten & Mupotola, 1995). Since there are no longer serious obstacles to internal migration in Namibia, the Namibian citizens are free to settle in any part of the country. Attracted by perceived and real employment opportunities at the Coast a number of individuals have moved to the area. Only 26% of population of Swakopmund (CSO, 1991) and 30% of Walvis Bay residents (TRP, 1997) were born in the towns. According to the TRP Survey the in-migration to Walvis Bay is mainly from the northern regions of Omusati, Oshana, Ohangwena and Oshikoto (53%); Khomas, including Windhoek (10%) and from within Erongo (12%) (TRP, 1997). The TRP Survey further reflected the duration of stay by area as presented in the figure below.
Another social survey (Walvis Bay Municipality, 1997), undertaken in August 1997 for the Walvis Bay Structure Plan, noted a different migration pattern, which included other nationalities. The influx came from South Africa (19%), Oshana Region (12%),
Age Structure in Erongo Coastal Zone
0% 20% 40% 60% 80% 100%
Walvis Bay Central
Walvis Bay South
North incl. Kuisebmond
East, incl. Narraville
Swakopmund Town
Mondesa
Tamariskia
Henties Bay Town
Omdel
Arandis
<14 14-64 65-Source: TRP, 1997 (Walvis Bay); GKW, 1996 (others)
Duration of Stay by Area in Walvis Bay
0% 10% 20% 30% 40% 50% 60% 70% 80% 90% 100%
Central
South
North, incl. Kuisebmond
East, incl. Narraville
<2 yrs. 2-10 yrs. >10 yrs. Born
Source: TRP, 1997 (Table 4.1 Duration of Stay by Area)
PDF created with pdfFactory trial version www.pdffactory.com
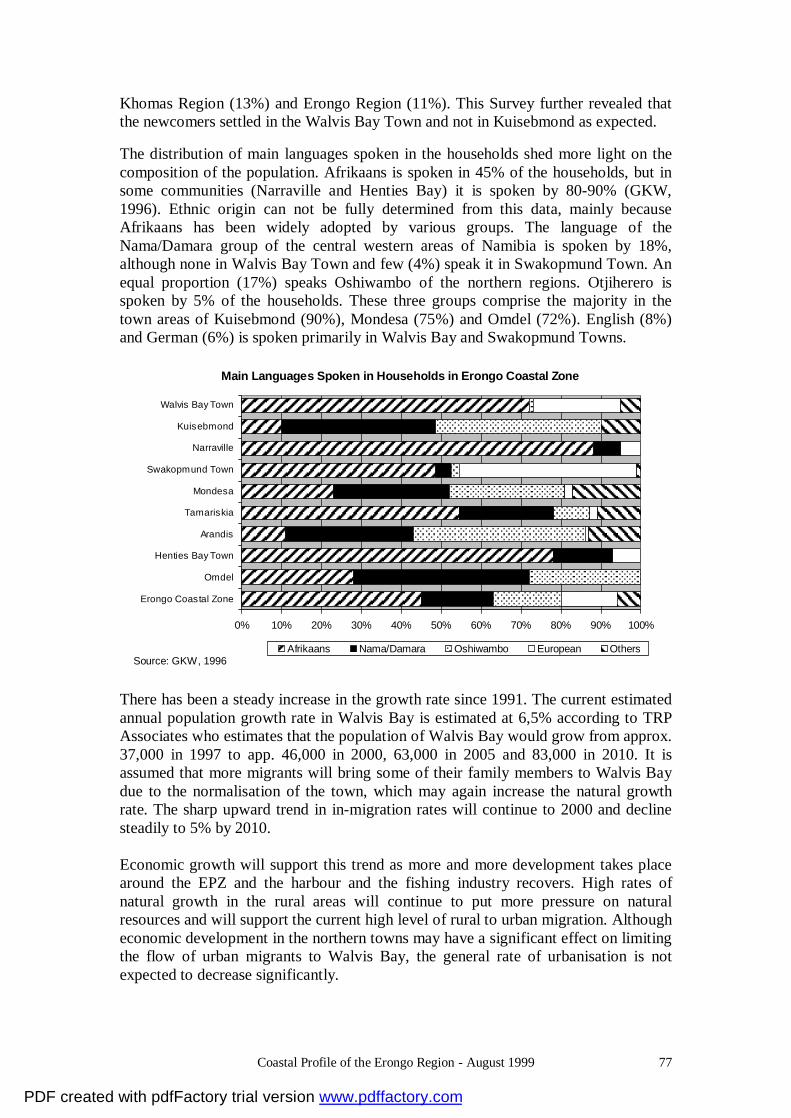
Coastal Profile of the Erongo Region - August 1999 77
Khomas Region (13%) and Erongo Region (11%). This Survey further revealed that the newcomers settled in the Walvis Bay Town and not in Kuisebmond as expected. The distribution of main languages spoken in the households shed more light on the composition of the population. Afrikaans is spoken in 45% of the households, but in some communities (Narraville and Henties Bay) it is spoken by 80-90% (GKW, 1996). Ethnic origin can not be fully determined from this data, mainly because Afrikaans has been widely adopted by various groups. The language of the Nama/Damara group of the central western areas of Namibia is spoken by 18%, although none in Walvis Bay Town and few (4%) speak it in Swakopmund Town. An equal proportion (17%) speaks Oshiwambo of the northern regions. Otjiherero is spoken by 5% of the households. These three groups comprise the majority in the town areas of Kuisebmond (90%), Mondesa (75%) and Omdel (72%). English (8%) and German (6%) is spoken primarily in Walvis Bay and Swakopmund Towns.
There has been a steady increase in the growth rate since 1991. The current estimated annual population growth rate in Walvis Bay is estimated at 6,5% according to TRP Associates who estimates that the population of Walvis Bay would grow from approx. 37,000 in 1997 to app. 46,000 in 2000, 63,000 in 2005 and 83,000 in 2010. It is assumed that more migrants will bring some of their family members to Walvis Bay due to the normalisation of the town, which may again increase the natural growth rate. The sharp upward trend in in-migration rates will continue to 2000 and decline steadily to 5% by 2010. Economic growth will support this trend as more and more development takes place around the EPZ and the harbour and the fishing industry recovers. High rates of natural growth in the rural areas will continue to put more pressure on natural resources and will support the current high level of rural to urban migration. Although economic development in the northern towns may have a significant effect on limiting the flow of urban migrants to Walvis Bay, the general rate of urbanisation is not expected to decrease significantly.
Main Languages Spoken in Households in Erongo Coastal Zone
0% 10% 20% 30% 40% 50% 60% 70% 80% 90% 100%
Walvis Bay Town
Kuisebmond
Narraville
Swakopmund Town
Mondesa
Tamariskia
Arandis
Henties Bay Town
Omdel
Erongo Coastal Zone
Afrikaans Nama/Damara Oshiwambo European OthersSource: GKW, 1996
PDF created with pdfFactory trial version www.pdffactory.com

Coastal Profile of the Erongo Region - August 1999 78
5.2 HOUSING The recent ‘Survey of Housing Demand and Affordability’ (TRP, 1997) provides an overview of the housing situation in Walvis Bay, which is largely comparable to the situation in Swakopmund. Generally, the housing stock is found to be of good quality and is serviced with the necessary municipal services. However, the housing situation is poor in certain areas, especially the Hostel, single quarters and the backyard shacks in Kuisebmond, Mondesa and Omdel. There is a significant level of overcrowding in Kuisebmond, where more than three people occupy each habitable room in 20% of the households. 13,2% of the households in Walvis Bay reside in backyard shacks, which are constructed of all sorts of material available (boards, sheets, etc.) (TRP, 1997). Single quarters in Walvis Bay intended for unmarried migrant workers house whole families. The Kuisebmond Hostel comprises dormitories of 15-20 men in each room, which amounts to a total of 5,380 men or 14.6% of Walvis Bay’s population. The current need for housing in Walvis Bay has been estimated at 2,300 units, most of which (77.8%) is required in the Walvis Bay North area. The main problem of the housing demand is the low level of affordability. “Only 25% of all would be purchasers in this area can afford to pay for a 15 m2 core house costing N$20,000” (TRP, 1997, p.85). In Kuisebmond, each household has in average two lodgers, who pay N$0-100, compared to N$100-800 in Narraville. Housing is seen as one of the biggest problems and an important priority. The crowded living conditions oversubscribe the sanitary facilities and cause serious health problems. In many cases three families reside on each erf, leading to a severe under-capacity of the sewer system. Up to 48 persons share one water tap and toilet facilities (GKW, 1996). Mondesa, Kuisebmond and Omdel are particularly poorly serviced. Table 5.2. Housing Conditions in the Erongo Region Coastal Towns Town Persons per room Persons per tap Persons per
facility Main
house Outside Whole
plot Cold Hot Toilet Bath
Walvis Bay: 1.8 1.8 1.8 0.8 2.3 3.3 4.4 Town 1.1 0.7 1.1 0.4 0.9 1.6 2.1 Kuisebmond 3.2 2.3 3.0 2.1 15.3 7.1 10.3 Narraville 1.9 2.6 1.9 0.9 2.5 4.4 5.1 Swakopmund: 1.7 1.9 1.7 0.6 1.6 3.0 3.7 Town 1.2 0.6 1.1 0.3 0.7 1.6 2.0 Mondesa 2.7 3.3 2.9 2.7 17.7 9.5 10.9 Tamariskia 2.0 2.5 2.0 0.9 2.2 4.1 5.2 Arandis 1.7 2.0 1.7 0.8 1.8 5.1 5.8 Henties Bay: 1.7 1.0 1.6 0.9 2.6 2.6 4.1 Town 0.8 1.0 0.8 0.3 0.7 0.9 1.5 Omdel 2.5 1.0 2.4 2.7 20.0 6.7 10.0 Total 1.7 1.8 1.7 0.7 2.0 3.2 4.2 Source: GKW, 1996
PDF created with pdfFactory trial version www.pdffactory.com
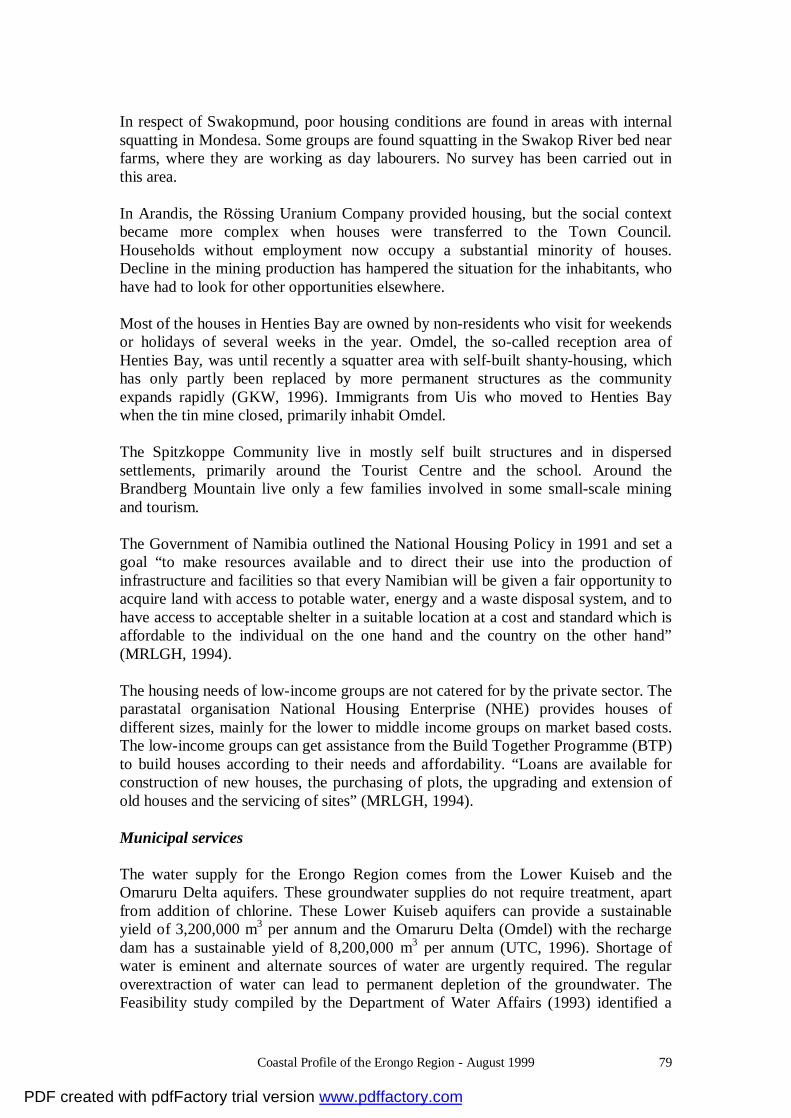
Coastal Profile of the Erongo Region - August 1999 79
In respect of Swakopmund, poor housing conditions are found in areas with internal squatting in Mondesa. Some groups are found squatting in the Swakop River bed near farms, where they are working as day labourers. No survey has been carried out in this area. In Arandis, the Rössing Uranium Company provided housing, but the social context became more complex when houses were transferred to the Town Council. Households without employment now occupy a substantial minority of houses. Decline in the mining production has hampered the situation for the inhabitants, who have had to look for other opportunities elsewhere. Most of the houses in Henties Bay are owned by non-residents who visit for weekends or holidays of several weeks in the year. Omdel, the so-called reception area of Henties Bay, was until recently a squatter area with self-built shanty-housing, which has only partly been replaced by more permanent structures as the community expands rapidly (GKW, 1996). Immigrants from Uis who moved to Henties Bay when the tin mine closed, primarily inhabit Omdel. The Spitzkoppe Community live in mostly self built structures and in dispersed settlements, primarily around the Tourist Centre and the school. Around the Brandberg Mountain live only a few families involved in some small-scale mining and tourism. The Government of Namibia outlined the National Housing Policy in 1991 and set a goal “to make resources available and to direct their use into the production of infrastructure and facilities so that every Namibian will be given a fair opportunity to acquire land with access to potable water, energy and a waste disposal system, and to have access to acceptable shelter in a suitable location at a cost and standard which is affordable to the individual on the one hand and the country on the other hand” (MRLGH, 1994). The housing needs of low-income groups are not catered for by the private sector. The parastatal organisation National Housing Enterprise (NHE) provides houses of different sizes, mainly for the lower to middle income groups on market based costs. The low-income groups can get assistance from the Build Together Programme (BTP) to build houses according to their needs and affordability. “Loans are available for construction of new houses, the purchasing of plots, the upgrading and extension of old houses and the servicing of sites” (MRLGH, 1994). Municipal services The water supply for the Erongo Region comes from the Lower Kuiseb and the Omaruru Delta aquifers. These groundwater supplies do not require treatment, apart from addition of chlorine. These Lower Kuiseb aquifers can provide a sustainable yield of 3,200,000 m3 per annum and the Omaruru Delta (Omdel) with the recharge dam has a sustainable yield of 8,200,000 m3 per annum (UTC, 1996). Shortage of water is eminent and alternate sources of water are urgently required. The regular overextraction of water can lead to permanent depletion of the groundwater. The Feasibility study compiled by the Department of Water Affairs (1993) identified a
PDF created with pdfFactory trial version www.pdffactory.com
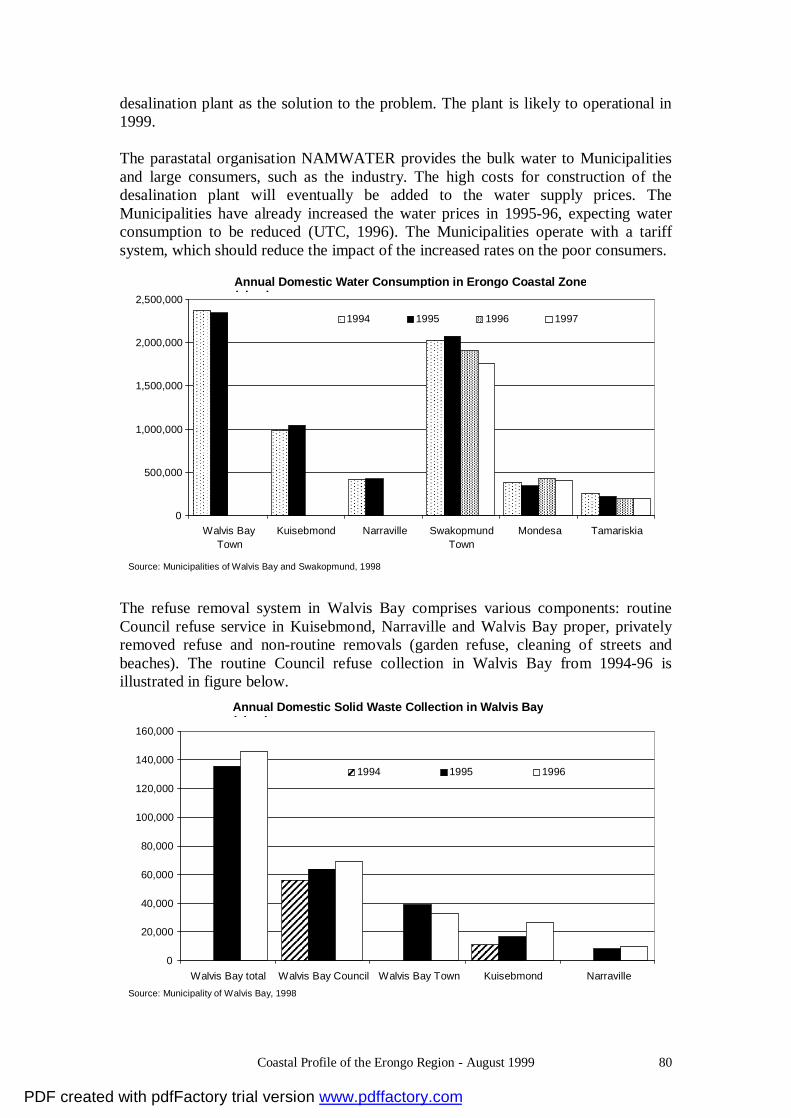
Coastal Profile of the Erongo Region - August 1999 80
desalination plant as the solution to the problem. The plant is likely to operational in 1999. The parastatal organisation NAMWATER provides the bulk water to Municipalities and large consumers, such as the industry. The high costs for construction of the desalination plant will eventually be added to the water supply prices. The Municipalities have already increased the water prices in 1995-96, expecting water consumption to be reduced (UTC, 1996). The Municipalities operate with a tariff system, which should reduce the impact of the increased rates on the poor consumers.
Annual Domestic Water Consumption in Erongo Coastal Zone(cbm.)
0
500,000
1,000,000
1,500,000
2,000,000
2,500,000
Walvis BayTown
Kuisebmond Narraville SwakopmundTown
Mondesa Tamariskia
1994 1995 1996 1997
Source: Municipalities of Walvis Bay and Swakopmund, 1998
The refuse removal system in Walvis Bay comprises various components: routine Council refuse service in Kuisebmond, Narraville and Walvis Bay proper, privately removed refuse and non-routine removals (garden refuse, cleaning of streets and beaches). The routine Council refuse collection in Walvis Bay from 1994-96 is illustrated in figure below.
Annual Domestic Solid Waste Collection in Walvis Bay(cbm.)
0
20,000
40,000
60,000
80,000
100,000
120,000
140,000
160,000
Walvis Bay total Walvis Bay Council Walvis Bay Town Kuisebmond Narraville
1994 1995 1996
Source: Municipality of Walvis Bay, 1998
PDF created with pdfFactory trial version www.pdffactory.com
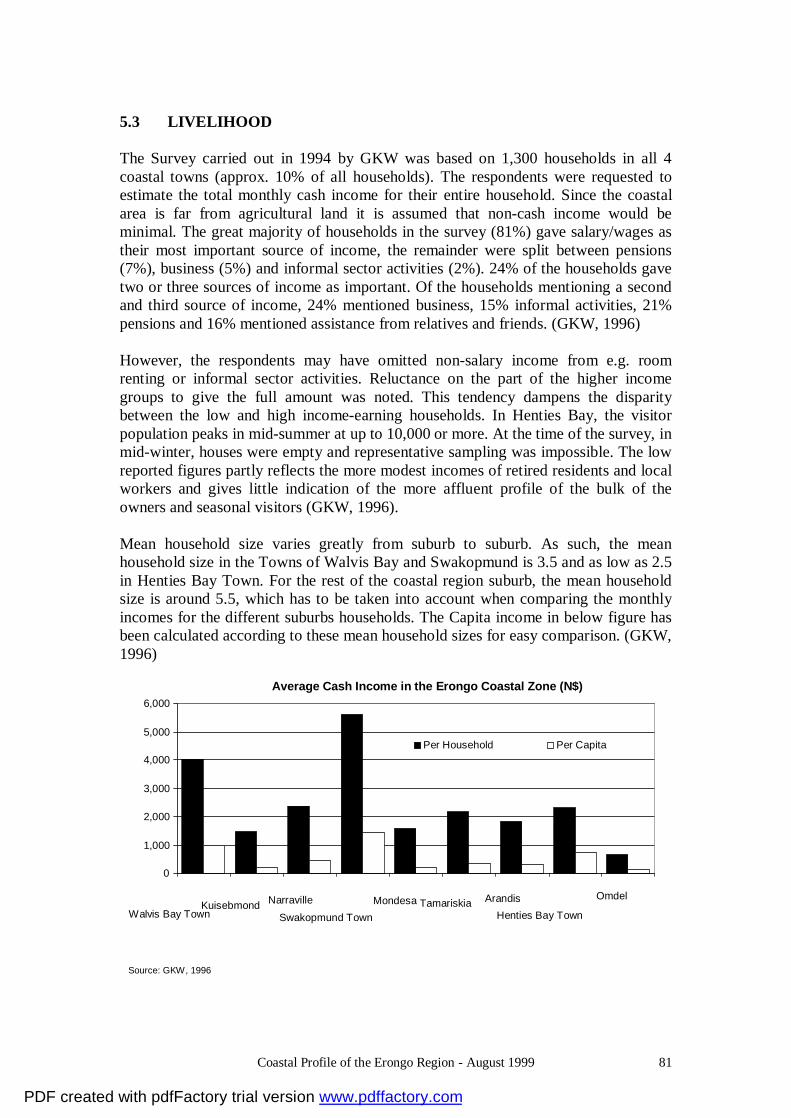
Coastal Profile of the Erongo Region - August 1999 81
5.3 LIVELIHOOD The Survey carried out in 1994 by GKW was based on 1,300 households in all 4 coastal towns (approx. 10% of all households). The respondents were requested to estimate the total monthly cash income for their entire household. Since the coastal area is far from agricultural land it is assumed that non-cash income would be minimal. The great majority of households in the survey (81%) gave salary/wages as their most important source of income, the remainder were split between pensions (7%), business (5%) and informal sector activities (2%). 24% of the households gave two or three sources of income as important. Of the households mentioning a second and third source of income, 24% mentioned business, 15% informal activities, 21% pensions and 16% mentioned assistance from relatives and friends. (GKW, 1996) However, the respondents may have omitted non-salary income from e.g. room renting or informal sector activities. Reluctance on the part of the higher income groups to give the full amount was noted. This tendency dampens the disparity between the low and high income-earning households. In Henties Bay, the visitor population peaks in mid-summer at up to 10,000 or more. At the time of the survey, in mid-winter, houses were empty and representative sampling was impossible. The low reported figures partly reflects the more modest incomes of retired residents and local workers and gives little indication of the more affluent profile of the bulk of the owners and seasonal visitors (GKW, 1996). Mean household size varies greatly from suburb to suburb. As such, the mean household size in the Towns of Walvis Bay and Swakopmund is 3.5 and as low as 2.5 in Henties Bay Town. For the rest of the coastal region suburb, the mean household size is around 5.5, which has to be taken into account when comparing the monthly incomes for the different suburbs households. The Capita income in below figure has been calculated according to these mean household sizes for easy comparison. (GKW, 1996)
Average Cash Income in the Erongo Coastal Zone (N$)
0
1,000
2,000
3,000
4,000
5,000
6,000
Walvis Bay TownKuisebmond Narraville
Swakopmund TownMondesa Tamariskia Arandis
Henties Bay Town
Omdel
Per Household Per Capita
Source: GKW, 1996
PDF created with pdfFactory trial version www.pdffactory.com

Coastal Profile of the Erongo Region - August 1999 82
It is clear that the monthly mean income for the high-income suburbs of Swakopmund is higher than for Walvis Bay, but both are well above the middle income areas of Tamariskia, Narraville and Arandis. Mondesa, Kuisebmond and Omdel form the low-income group of this distinct pattern of three separate income groups. More than half of the population of the Erongo Coast resides in low-income areas of Kuisebmond (32%), Mondesa (19%) and Omdel (3%). These 54% of the coastal households account for less than 16% of total residential cash income. In the low-income suburbs, 79% of households receive less than N$ 2,000 per month, and 23% of all households in the low-income suburbs reported incomes below N$ 500 per month. Omdel stands out as the poorest suburb on the coast with a mean monthly income per household of around N$ 630, and 38% of the respondents here reported monthly household income below N$ 500. (GKW, 1996) Poverty can be determined on the basis of a number of parameters. The 1993/1994 Namibia Household Income and Expenditure Survey (NHIES) (CSO, 1994), establishes the food consumption rate as a poverty indicator, where households having a food consumption rate of 60% or more are defined as poor. If the food consumption rate is 80% or more, poverty is considered severe. In the Erongo Region as a whole about 30% of the households have a food consumption rate of 60% or more. In the Walvis Bay suburb, Kuisebmond, 29% of the households have a food consumption rate of 60% or more and 32% of the households have a food consumption rate of 40-59%. The corresponding percentages for Narraville is 21 and 39 and for Walvis Bay Town 6 and 18%. (CSO, 1994) The correlation between educational attainment of the head of the household and the consumption pattern is very strong i.e. the higher the formal education of the head of household, the lower the percentage of households having a high food consumption rate. The poorest households are to be found among female headed households with little or no education (CSO, 1994). Community development programmes in the urban areas should be strengthened to cater for the needs of poorest and most disadvantaged groups. 5.4 HEALTH AND WELFARE Medical services are provided at three state hospitals and two private hospitals in the two Health Districts of the Coastal Zone and at 6 health clinics in Walvis Bay Town, Kuisebmond, Narraville, Swakopmund, Tamariskia, Henties Bay and Arandis. Health Centres are found in Swakopmund and Arandis and Outreach Units provide services to communities in Brandberg, Swakopmund and Henties Bay. The health coverage is above the national average. The Walvis Bay Social Survey, however, identified a need for additional health services. The majority of the respondents expressed a need for a new private hospital and more clinics (Walvis Bay Municipality, 1997). The Annual Report of the Erongo Regional Medical Office (MOHSS, 1997) emphasises that tuberculosis and HIV/AIDS are the most serious health problems in the region, but other diseases such as respiratory diseases are of concern.
PDF created with pdfFactory trial version www.pdffactory.com

Coastal Profile of the Erongo Region - August 1999 83
The number of new tuberculosis cases continues to increase. “The situation is worst in Walvis Bay where treatment is currently provided to 480 cases on a daily basis. The emerging multi-drug-resistance in 31 cases in Walvis Bay district is an issue of great concern” (MOHSS, 1997). The detection rate was in 1997 1.4% in Walvis Bay, 1.2% in Swakopmund and 0.8% in the region as a whole. The increase of tuberculosis cases in Walvis Bay from 1989-95 is evident from the figure below. A study of the social background of the patients showed that they were not immigrants, but residents of Walvis Bay. The disease is related to social conditions, such as poverty, poor nutrition, overcrowded housing and alcohol abuse. AIDS can be a causative factor, which must be considered during diagnosis, in order to apply the appropriate treatment. Diagnostic and treatment of tuberculosis takes place at the Walvis Bay North Hospital and in the Kuisebmond, Narraville and Walvis Bay Clinics.
Tuberculosis Cases in Walvis Bay
0
100
200
300
400
500
600
700
800
1989 1990 1991 1992 1993 1994 1995
Source: Univ. of Cape Town, 1996, Baseline Report: Coastal Zone Management Plan for the Erongo Region
HIV/AIDS is increasing dramatically and new initiatives are under preparation to counter the rapid spread of this dreadful disease. The number of persons tested HIV-positive in Swakopmund has increased from 2% of all tested in 1992 to 37% in 1997. 785 persons were tested positive in 1997, which brings the total of HIV-positive tested from 1992-97 to 2,056 persons or 8% of the population. The Epidemiological Report on HIV and AIDS in Namibia (MOHSS, 1997) estimates that 22% of the pregnant women in Swakopmund are HIV-positive with serious consequences for the future generation.
PDF created with pdfFactory trial version www.pdffactory.com
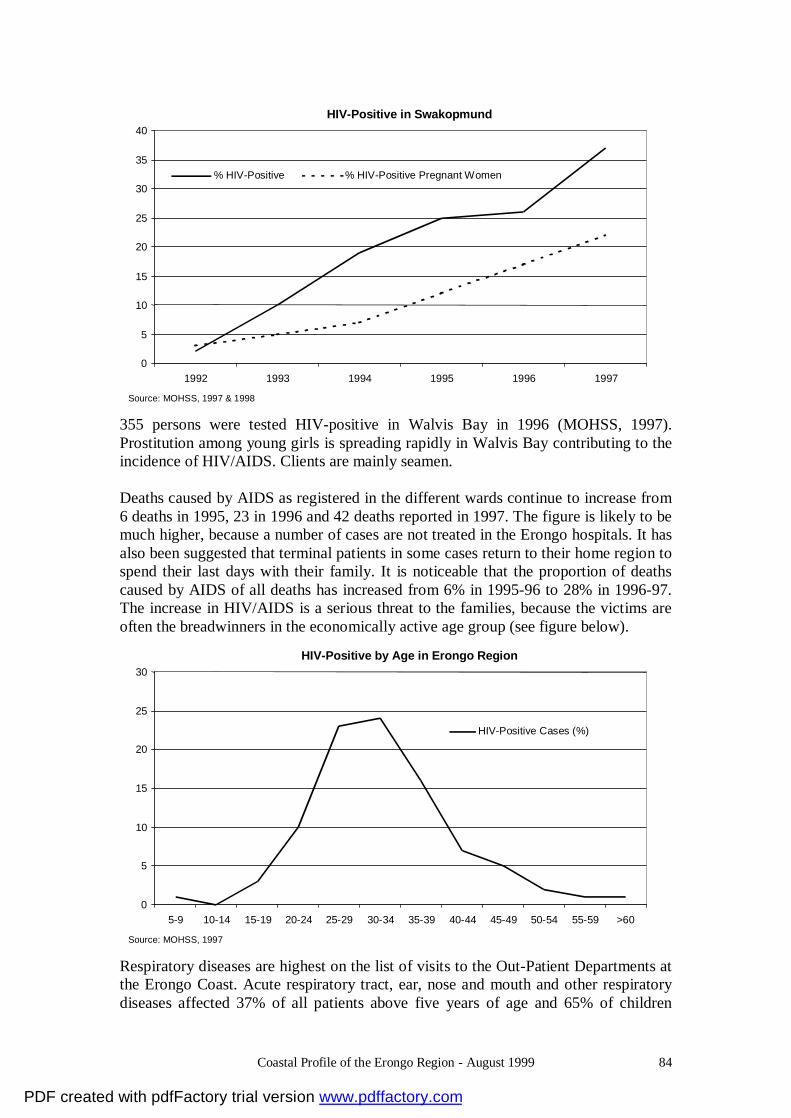
Coastal Profile of the Erongo Region - August 1999 84
HIV-Positive in Swakopmund
0
5
10
15
20
25
30
35
40
1992 1993 1994 1995 1996 1997
% HIV-Positive % HIV-Positive Pregnant Women
Source: MOHSS, 1997 & 1998
355 persons were tested HIV-positive in Walvis Bay in 1996 (MOHSS, 1997). Prostitution among young girls is spreading rapidly in Walvis Bay contributing to the incidence of HIV/AIDS. Clients are mainly seamen. Deaths caused by AIDS as registered in the different wards continue to increase from 6 deaths in 1995, 23 in 1996 and 42 deaths reported in 1997. The figure is likely to be much higher, because a number of cases are not treated in the Erongo hospitals. It has also been suggested that terminal patients in some cases return to their home region to spend their last days with their family. It is noticeable that the proportion of deaths caused by AIDS of all deaths has increased from 6% in 1995-96 to 28% in 1996-97. The increase in HIV/AIDS is a serious threat to the families, because the victims are often the breadwinners in the economically active age group (see figure below).
HIV-Positive by Age in Erongo Region
0
5
10
15
20
25
30
5-9 10-14 15-19 20-24 25-29 30-34 35-39 40-44 45-49 50-54 55-59 >60
HIV-Positive Cases (%)
Source: MOHSS, 1997
Respiratory diseases are highest on the list of visits to the Out-Patient Departments at the Erongo Coast. Acute respiratory tract, ear, nose and mouth and other respiratory diseases affected 37% of all patients above five years of age and 65% of children
PDF created with pdfFactory trial version www.pdffactory.com

Coastal Profile of the Erongo Region - August 1999 85
below 5 years (MOHSS, 1997). The prevalence of respiratory diseases is most likely related to the humid conditions at the coast, combined with poor housing conditions. Overcrowding in small rooms with inadequate water and sanitary facilities makes a terrifying breeding ground for these diseases. The relatively cold climate and poor heating facilities prevent proper ventilation of houses, which further adds to the spread of both tuberculosis and respiratory diseases. Malnutrition indicated by the level of underweight children is below the national average. The percentage of moderately underweight children of all children weighed for Walvis Bay and Swakopmund are 1.8% and 2.1% respectively compared to 2.2% and 3.6% in 1995-96. Severe underweight was found among 0.3% of all children weighed in both towns compared to 0.2% in Walvis Bay and 0.9% in Swakopmund in the previous year (MOHSS, 1997). The significance of poverty in the area is evident in the housing situation and the related health and social problems. Among the major social problems in the region are absent fathers or parents who do not support their children and families, child neglect, and marriage problems. The desperate social situation for some groups may also lead to a rise in criminal offences. The increase in thefts of all types in the Coastal zone from 765 cases in 1994 to 2,053 cases in 1997 (NAMPOL, 1998) suggests that more attention should be given to the social conditions of the disadvantaged groups, who may seek to remedy their economy in this way. Additional resources to the Namibian Police (NAMPOL) may not be sufficient to reverse this trend. The underlying causes of the problem should be addressed by combined efforts of NAMPOL and local authorities.
Number of Theft Cases (All Types) in the Erongo Coastal Zone
0
200
400
600
800
1000
1200
1994 1995 1996 1997
Swakopmund
Walvis Bay
Henties Bay
Arandis
Source: NAMPOL, 1998
5.4 EDUCATION The Regional Office of the Ministry of Basic Education and Culture compiles educational statistics. Population figures estimated on the basis of the Census figures of 1991 are used for planning of basic education and health services. The uncertainty of these figures has not been compensated by surveys on educational aspects.
PDF created with pdfFactory trial version www.pdffactory.com
Coastal Profile of the Erongo Region - August 1999 86
Education is a high priority among the population, but the Region has no higher education institutions, so higher degrees must be obtained in Windhoek or in South Africa. The Namibian Institute of Mining and Technology is among the few possibilities for skills development in the Region. The Institute in Arandis offers classes to both full-time and day-release students in the technical skills required by mining, engineering and other industries. Over the period 1994-97 668 candidates have been trained in different trades (diesel mechanics, boilermaker, electrician, fitter and turner, instrumentation and welder). Of these 327 were apprentices and 341 received skills upgrading. 14,5% of the adult Walvis Bay population may be considered illiterate according to normal criteria (TRP, 1997). An adult literacy and various adult learning programmes are available in the area. Training in business skills and personal development are offered at various institutions.
PDF created with pdfFactory trial version www.pdffactory.com

Coastal Profile of the Erongo Region - August 1999 87
6.0 ECONOMIC SETTINGS
Data as presented below, in common with nearly all developing countries, is very sparse and the sources are generally unreliable. For example, published population data for Namibia is variant and inconclusive. It was simply not possible to rely on this data without some form of checking mechanism being implemented.
It was felt that the quantities of economically active persons in the project area could provide a reasonable control against which the extant population data could be measured. For that reason, much time was spent in gathering data from as many primary sources as were able to be reached. Even using direct sources, certain unreliable elements were encountered such as insufficient and/or incomplete data records being held by the various organisations which were visited. Although this could be viewed as diminishing the worth of the data collected, it was nevertheless regarded as a useful starting point for the creation of a data base which will be able to be updated/corrected and revised as more and better data become available. More to the point however, given the need for data upon which management decisions can and will be made, it was decided that the data which was obtained, whatever shortcomings might exist therein, were at least the beginnings of a usable data base.
6.1 DESERT DEVELOPMENT Development in desert regions has several inherent limiting factors:
a. what the region can support in the total number of permanently settled inhabitants
b. what can be done under permanent water limitations c. what can be achieved with sparsely settled and widely dispersed settlements d. what can be sustained in the form of desert agriculture, either pastoral or
sedentary e. given the limited income generation of desert regions, from whence would
sufficient development funds come? Desert regions are by their nature, fragile and sometimes ephemeral environments and economic development in such regions will often conflict directly with the preservation of such environments for posterity. Often ignored and usually taken for granted where apparently secure water resources exist, the basic limitation of arid regions is the deficiency in moisture, rendering water a scarce commodity both in quantity and availability. Because of the lack of water so essential to activate processes of soil formation, , there is little soil fauna or even none at all, and therefore in fully arid areas, an absence of soil in the agricultural sense of the term. A no less critical limitation is the sparse, widely dispersed population of a generally low economic level with often a low level of education hardly adequate for the
PDF created with pdfFactory trial version www.pdffactory.com
Coastal Profile of the Erongo Region - August 1999 88
demands of modern technology. Also, standards of managerial competence are insufficient for the needs of arid zone development. The result of these is an inadequate infrastructure. It must always be remembered that the constraints outlined above present formidable obstacles to growth and development. Those obstacles are added to by a concern for the fragile environment in which the growth and development would take place and which sensibly, should allow for the construction of development plans which would not conflict with environmental preservation. All of these obstacles are evident in the Erongo Region. For example, the risks of zone habitation, both environmental and economic, would be expected to limit population increase but this has not happened in the Erongo coastal zone. Population increase, apart from natural causes, would appear to have been caused primarily by the inwards migration of numbers of unskilled people in search of mythical employment in coastal factories involved in the fishing industry. The positive side, there are various directions of development, most of which nevertheless, still involve certain elements of risk or instability under the conditions inherent in aridity. Some arid areas have fairly rich mineral resources and exploitation has brought some prosperity to arid regions. However, all mining towns, whether in arid regions or non-arid areas, have an inherent quality of instability. On the negative side, regressive development i.e. the exploitation of wasting assets, can have a particularly harsh impact on arid areas because of their monolithic economy i.e. they create few spill-over effects and alternatives are usually lacking.
Additionally and in general, the resource base of arid lands is usually limited and the focus on the exploitation of a single resource potential arises most often from a non- or extra-regional demand which the project is geared to supply from the start. Under modern conditions, this involves sophisticated technology and marketing methods and financing at an above-average risk level. The net result of this type of arid zone development is spatial discontinuity with isolated settlements or isolated clusters of settlement producing highly specialised products for which there is no domestic demand. The "empty" non-productive interstices between these productive nuclei are a heavy drain on the regional infrastructure. The non-productive area does not generate demand for traffic but requires the same outlay per kilometre for all items of its linear infrastructure as does a commensurate length of infrastructure in densely productive areas elsewhere. Scant and often not particularly skilled populations, isolation and a lack of regional infrastructure are disadvantageous for any kind of development in arid areas, including that of industry. However, two factors can be important locational incentives for industry and have in fact, acted as such in many instances. Arid regions are particularly suitable to product-specific industries which require great space for their operations and/or the least corrosive climate possible.
PDF created with pdfFactory trial version www.pdffactory.com
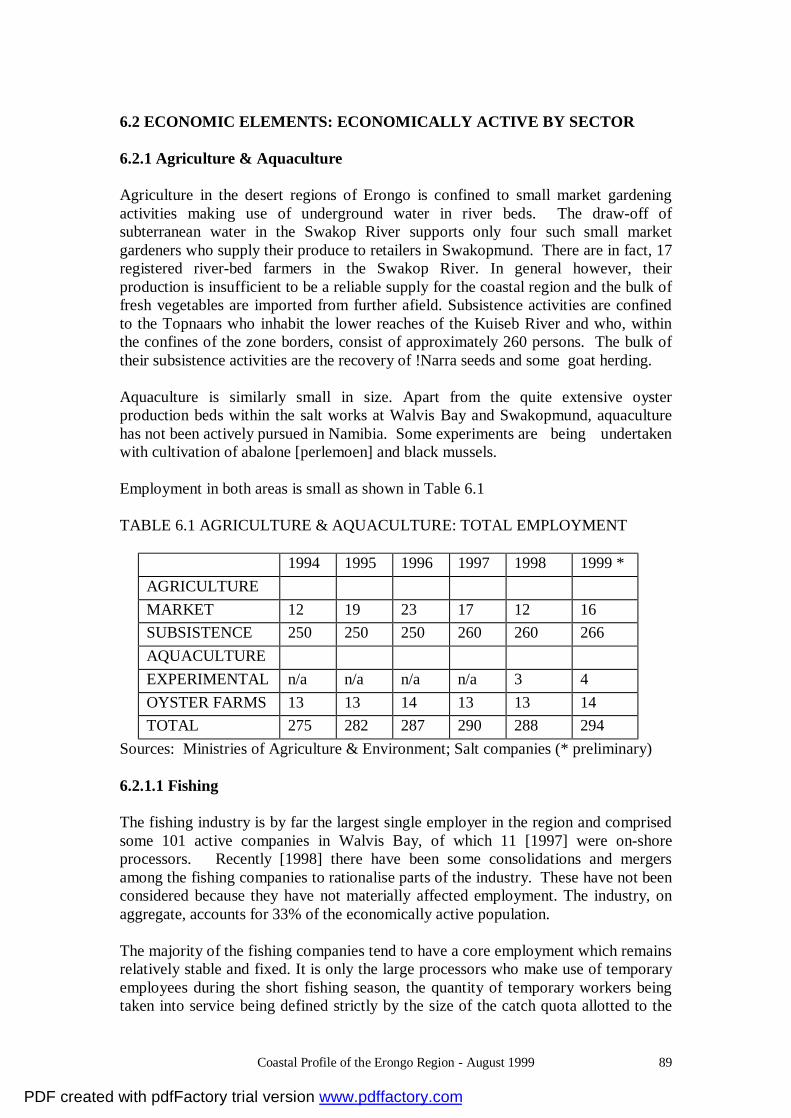
Coastal Profile of the Erongo Region - August 1999 89
6.2 ECONOMIC ELEMENTS: ECONOMICALLY ACTIVE BY SECTOR 6.2.1 Agriculture & Aquaculture Agriculture in the desert regions of Erongo is confined to small market gardening activities making use of underground water in river beds. The draw-off of subterranean water in the Swakop River supports only four such small market gardeners who supply their produce to retailers in Swakopmund. There are in fact, 17 registered river-bed farmers in the Swakop River. In general however, their production is insufficient to be a reliable supply for the coastal region and the bulk of fresh vegetables are imported from further afield. Subsistence activities are confined to the Topnaars who inhabit the lower reaches of the Kuiseb River and who, within the confines of the zone borders, consist of approximately 260 persons. The bulk of their subsistence activities are the recovery of !Narra seeds and some goat herding. Aquaculture is similarly small in size. Apart from the quite extensive oyster production beds within the salt works at Walvis Bay and Swakopmund, aquaculture has not been actively pursued in Namibia. Some experiments are being undertaken with cultivation of abalone [perlemoen] and black mussels.
Employment in both areas is small as shown in Table 6.1 TABLE 6.1 AGRICULTURE & AQUACULTURE: TOTAL EMPLOYMENT
1994 1995 1996 1997 1998 1999 * AGRICULTURE MARKET 12 19 23 17 12 16 SUBSISTENCE 250 250 250 260 260 266 AQUACULTURE EXPERIMENTAL n/a n/a n/a n/a 3 4 OYSTER FARMS 13 13 14 13 13 14 TOTAL 275 282 287 290 288 294
Sources: Ministries of Agriculture & Environment; Salt companies (* preliminary) 6.2.1.1 Fishing The fishing industry is by far the largest single employer in the region and comprised some 101 active companies in Walvis Bay, of which 11 [1997] were on-shore processors. Recently [1998] there have been some consolidations and mergers among the fishing companies to rationalise parts of the industry. These have not been considered because they have not materially affected employment. The industry, on aggregate, accounts for 33% of the economically active population. The majority of the fishing companies tend to have a core employment which remains relatively stable and fixed. It is only the large processors who make use of temporary employees during the short fishing season, the quantity of temporary workers being taken into service being defined strictly by the size of the catch quota allotted to the
PDF created with pdfFactory trial version www.pdffactory.com
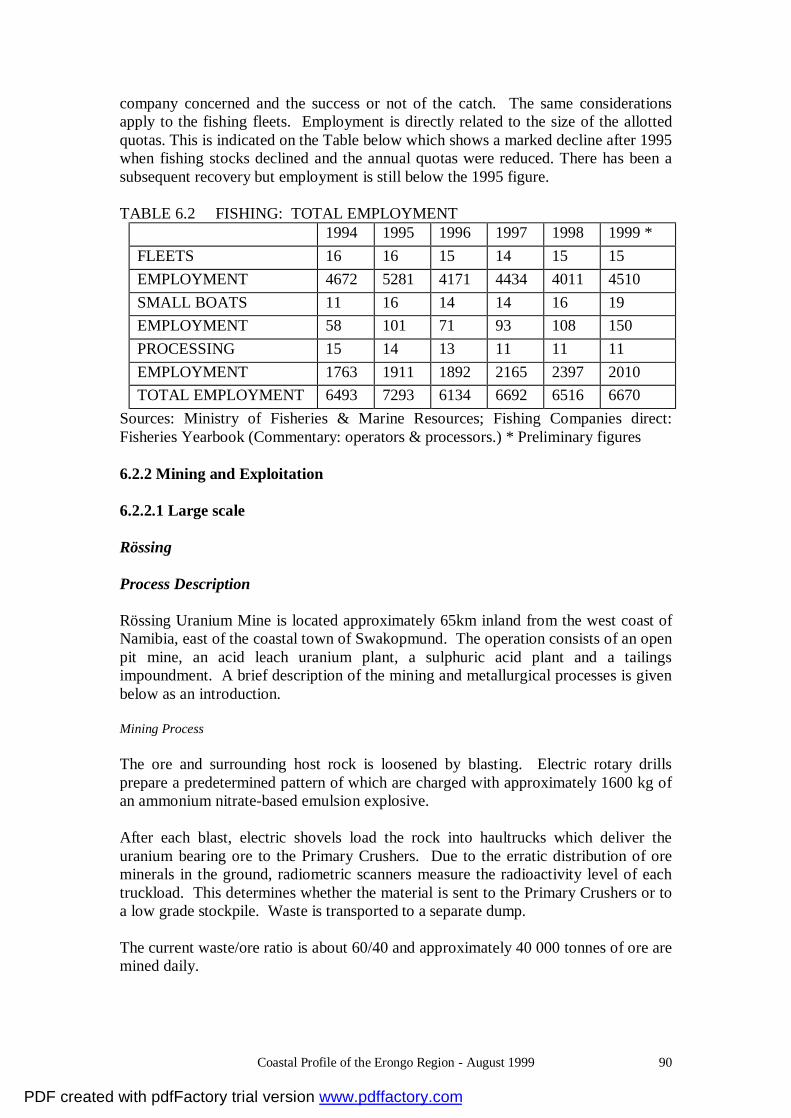
Coastal Profile of the Erongo Region - August 1999 90
company concerned and the success or not of the catch. The same considerations apply to the fishing fleets. Employment is directly related to the size of the allotted quotas. This is indicated on the Table below which shows a marked decline after 1995 when fishing stocks declined and the annual quotas were reduced. There has been a subsequent recovery but employment is still below the 1995 figure. TABLE 6.2 FISHING: TOTAL EMPLOYMENT
1994 1995 1996 1997 1998 1999 * FLEETS 16 16 15 14 15 15 EMPLOYMENT 4672 5281 4171 4434 4011 4510 SMALL BOATS 11 16 14 14 16 19 EMPLOYMENT 58 101 71 93 108 150 PROCESSING 15 14 13 11 11 11 EMPLOYMENT 1763 1911 1892 2165 2397 2010 TOTAL EMPLOYMENT 6493 7293 6134 6692 6516 6670
Sources: Ministry of Fisheries & Marine Resources; Fishing Companies direct: Fisheries Yearbook (Commentary: operators & processors.) * Preliminary figures 6.2.2 Mining and Exploitation 6.2.2.1 Large scale Rössing Process Description Rössing Uranium Mine is located approximately 65km inland from the west coast of Namibia, east of the coastal town of Swakopmund. The operation consists of an open pit mine, an acid leach uranium plant, a sulphuric acid plant and a tailings impoundment. A brief description of the mining and metallurgical processes is given below as an introduction. Mining Process The ore and surrounding host rock is loosened by blasting. Electric rotary drills prepare a predetermined pattern of which are charged with approximately 1600 kg of an ammonium nitrate-based emulsion explosive. After each blast, electric shovels load the rock into haultrucks which deliver the uranium bearing ore to the Primary Crushers. Due to the erratic distribution of ore minerals in the ground, radiometric scanners measure the radioactivity level of each truckload. This determines whether the material is sent to the Primary Crushers or to a low grade stockpile. Waste is transported to a separate dump. The current waste/ore ratio is about 60/40 and approximately 40 000 tonnes of ore are mined daily.
PDF created with pdfFactory trial version www.pdffactory.com
Coastal Profile of the Erongo Region - August 1999 91
Ore is delivered to the primary crushers by haultruck and then by conveyor to the coarse ore stockpile. It passes through a further series of crushers and screens until the particles are smaller than 19 mm. After weighing, this ore is stored at the fine ore stockpile. Metallurgical Processing Wet grinding of the crushed ore by means of steel rods (rodmills) reduces the ore further to a slurry with the consistency of mud. The four rodmills are utilised as required by production levels and operate in parallel. Solution recycled from the tailings impoundment is used to produce an ore slurry which is processed further in the following stages. A combined leaching and oxidation process takes place in large mechanically agitated tanks. The uranium content of the pulped ore is oxidised by ferric sulphate and manganese oxide and dissolved in a sulphuric acid solution. The product of leaching is a pulp containing suspended sand and slime. Cyclones separate these components and, after washing in rotoscoops to remove traces of uranium bearing solution, the sand is pumped to the tailings disposal area. Currently about 62 000 tons of slurry are deposited on the dam per day. The slurry is made up of 40% water and 60% solids by weight. Counter-current decantation thickeners wash the slimes from previous stages. A clear uranium bearing solution (pregnant solution) is produced by the thickeners, while the washed slimes are mixed with the sands and pumped to the tailings area. The clear pregnant solution is now brought into contact with beads of specially formulated resin (continuous ion exchange, CIX). Uranium ions are adsorbed onto the resin and are preferentially extracted from the solution. Beads are removed periodically to elution columns where a strong acid wash removes the uranium from the beads. The resulting eluate is a purified into a more concentrated uranium solution. The barren solution from this process is returned to the thickeners for slimes washing. The acidic eluate from the CIX plant is mixed with an organic solvent which takes up the uranium bearing component (solvent extraction, SX). In a second stage, the organic solution is mixed with a neutral aqueous ammonium sulphate solution which takes up the uranium rich “OK liquor”. The acidic barren aqueous solution is returned to the elution columns. The addition of gaseous anhydrous ammonia to the “OK liquor” raises the solution pH, resulting in precipitation of ammonium diuranate which is then thickened to a yellow slurry. The ammonium diuranate is recovered on rotating drumfilters as yellow paste, “yellow cake”. Final calcining drives off the ammonia leaving uranium oxide. The
PDF created with pdfFactory trial version www.pdffactory.com
Coastal Profile of the Erongo Region - August 1999 92
product is then packed into metal drums. The drums of uranium oxide are loaded and exported to overseas customers for further processing. The Acid Plant Sulphuric acid is produced on site by roasting pyrite or by burning elemental sulphur. During the roasting process, pyrite is ignited in a fluidised bed at high temperatures and SO2 as well as calcine (Fe2O3 and Fe3O4) are formed. The calcine slurry is a waste product that is further used as oxidant in the metallurgical process. During sulphur burning, no waste products are generated. The SO2 is cleaned from calcine particles and cooled in various stages. During cooling, the water content of the gas increases and in a subsequent drying stage, sulphuric acid removes the water. Cleaned, cooled and dried SO2 is blown through a converter containing a vanadium pentoxide catalyst to produce SO3 gas. The SO3 gas is contacted with weak sulphuric acid to produce sulphuric acid at a concentration of 99.2% at a rate of 30 tons/day. Water used for cooling purposes is recycled.
The management of environmental impacts at Rössing Uranium Limited Introduction The Rössing policy statement on health, safety and the environment (HSE) commits the company in complying with HSE legislation and in adopting the principle of best available practice to all HSE concerns. Furthermore, this policy commits the company in identifying and controlling environmental impacts as well as providing all employees with protection from potential health hazards associated with the operations of the company. In order to assure itself of its conformance with its stated environmental policy and to demonstrate such conformance to others, Rössing Uranium is in the process of implementing an Environmental Management System (EMS) on site following the standards laid down in the ISO 14001 International Standard. An EMS forms part of an overall management system; the objective of which is to develop, implement, review and maintain an environmental policy. In this report, a number of environmental impacts arising from mining activities, are discussed. These issues are discussed within the framework of an EMS, where the extent of the impact at present is presented and management programmes to ensure continual improvement in each of these impacts, presented. Air Quality In Namibia, the Atmospheric Pollution Prevention Ordinance of 1976 regulates atmospheric pollution by noxious gases, dust, smoke and vehicle emissions within areas that have been declared to be controlled areas. Rössing operates a
PDF created with pdfFactory trial version www.pdffactory.com
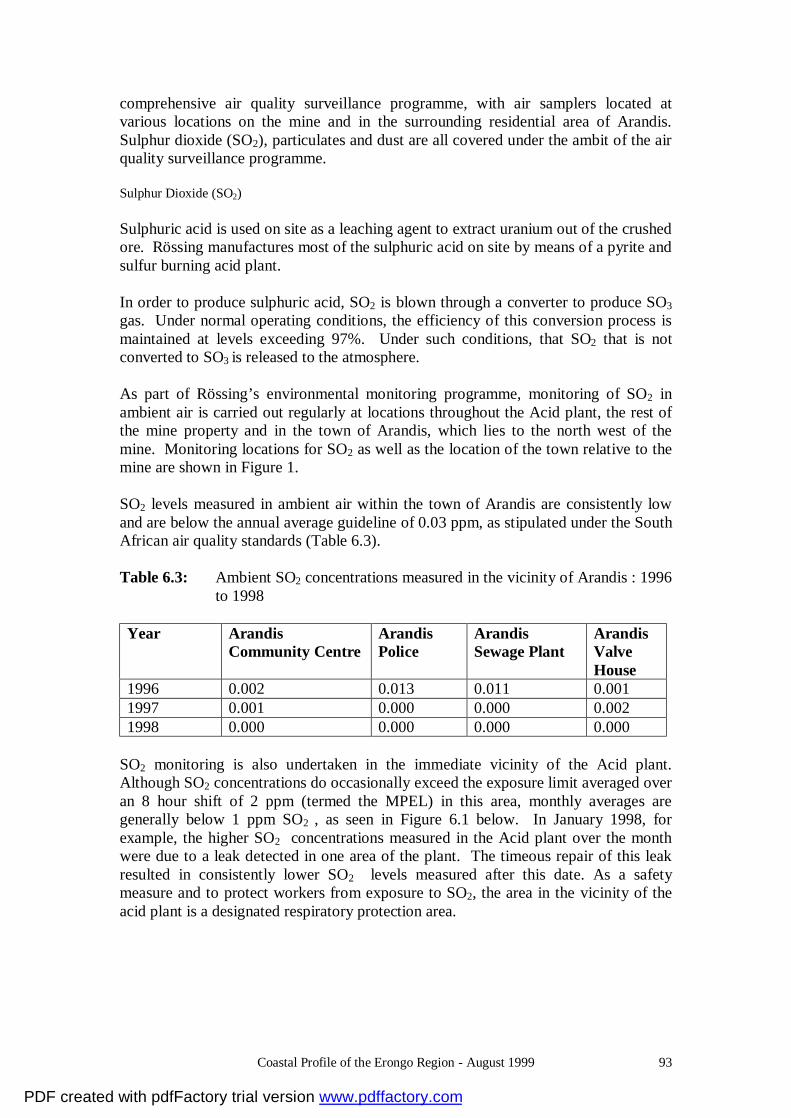
Coastal Profile of the Erongo Region - August 1999 93
comprehensive air quality surveillance programme, with air samplers located at various locations on the mine and in the surrounding residential area of Arandis. Sulphur dioxide (SO2), particulates and dust are all covered under the ambit of the air quality surveillance programme. Sulphur Dioxide (SO2)
Sulphuric acid is used on site as a leaching agent to extract uranium out of the crushed ore. Rössing manufactures most of the sulphuric acid on site by means of a pyrite and sulfur burning acid plant.
In order to produce sulphuric acid, SO2 is blown through a converter to produce SO3 gas. Under normal operating conditions, the efficiency of this conversion process is maintained at levels exceeding 97%. Under such conditions, that SO2 that is not converted to SO3 is released to the atmosphere.
As part of Rössing’s environmental monitoring programme, monitoring of SO2 in ambient air is carried out regularly at locations throughout the Acid plant, the rest of the mine property and in the town of Arandis, which lies to the north west of the mine. Monitoring locations for SO2 as well as the location of the town relative to the mine are shown in Figure 1.
SO2 levels measured in ambient air within the town of Arandis are consistently low and are below the annual average guideline of 0.03 ppm, as stipulated under the South African air quality standards (Table 6.3).
Table 6.3: Ambient SO2 concentrations measured in the vicinity of Arandis : 1996
to 1998
Year Arandis Community Centre
Arandis Police
Arandis Sewage Plant
Arandis Valve House
1996 0.002 0.013 0.011 0.001 1997 0.001 0.000 0.000 0.002 1998 0.000 0.000 0.000 0.000
SO2 monitoring is also undertaken in the immediate vicinity of the Acid plant. Although SO2 concentrations do occasionally exceed the exposure limit averaged over an 8 hour shift of 2 ppm (termed the MPEL) in this area, monthly averages are generally below 1 ppm SO2 , as seen in Figure 6.1 below. In January 1998, for example, the higher SO2 concentrations measured in the Acid plant over the month were due to a leak detected in one area of the plant. The timeous repair of this leak resulted in consistently lower SO2 levels measured after this date. As a safety measure and to protect workers from exposure to SO2, the area in the vicinity of the acid plant is a designated respiratory protection area.
PDF created with pdfFactory trial version www.pdffactory.com
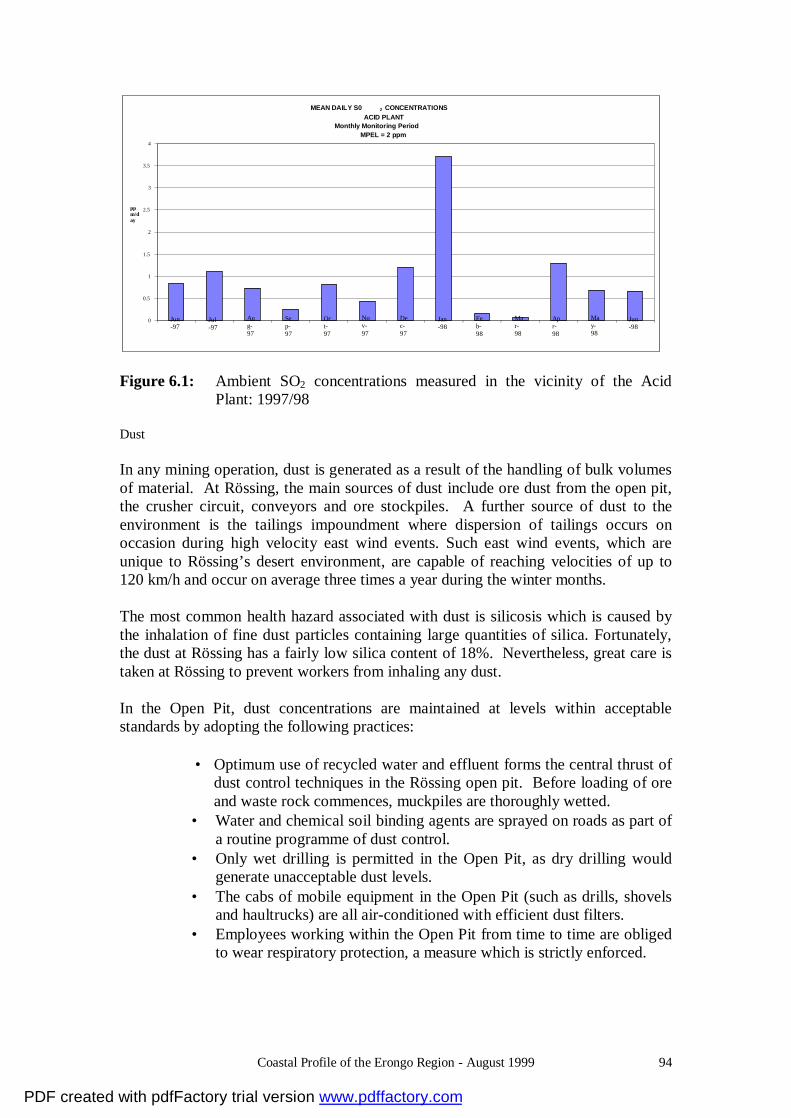
Coastal Profile of the Erongo Region - August 1999 94
MEAN DAILY S0 2 CONCENTRATIONSACID PLANT
Monthly Monitoring PeriodMPEL = 2 ppm
0
0.5
1
1.5
2
2.5
3
3.5
4
Jun-97
Jul-97
Aug-97
Sep-97
Oct-97
Nov-97
Dec-97
Jan-98
Feb-98
Mar-98
Apr-98
May-98
Jun-98
ppm/day
Figure 6.1: Ambient SO2 concentrations measured in the vicinity of the Acid Plant: 1997/98
Dust
In any mining operation, dust is generated as a result of the handling of bulk volumes of material. At Rössing, the main sources of dust include ore dust from the open pit, the crusher circuit, conveyors and ore stockpiles. A further source of dust to the environment is the tailings impoundment where dispersion of tailings occurs on occasion during high velocity east wind events. Such east wind events, which are unique to Rössing’s desert environment, are capable of reaching velocities of up to 120 km/h and occur on average three times a year during the winter months.
The most common health hazard associated with dust is silicosis which is caused by the inhalation of fine dust particles containing large quantities of silica. Fortunately, the dust at Rössing has a fairly low silica content of 18%. Nevertheless, great care is taken at Rössing to prevent workers from inhaling any dust.
In the Open Pit, dust concentrations are maintained at levels within acceptable standards by adopting the following practices:
• Optimum use of recycled water and effluent forms the central thrust of
dust control techniques in the Rössing open pit. Before loading of ore and waste rock commences, muckpiles are thoroughly wetted.
• Water and chemical soil binding agents are sprayed on roads as part of a routine programme of dust control.
• Only wet drilling is permitted in the Open Pit, as dry drilling would generate unacceptable dust levels.
• The cabs of mobile equipment in the Open Pit (such as drills, shovels and haultrucks) are all air-conditioned with efficient dust filters.
• Employees working within the Open Pit from time to time are obliged to wear respiratory protection, a measure which is strictly enforced.
PDF created with pdfFactory trial version www.pdffactory.com
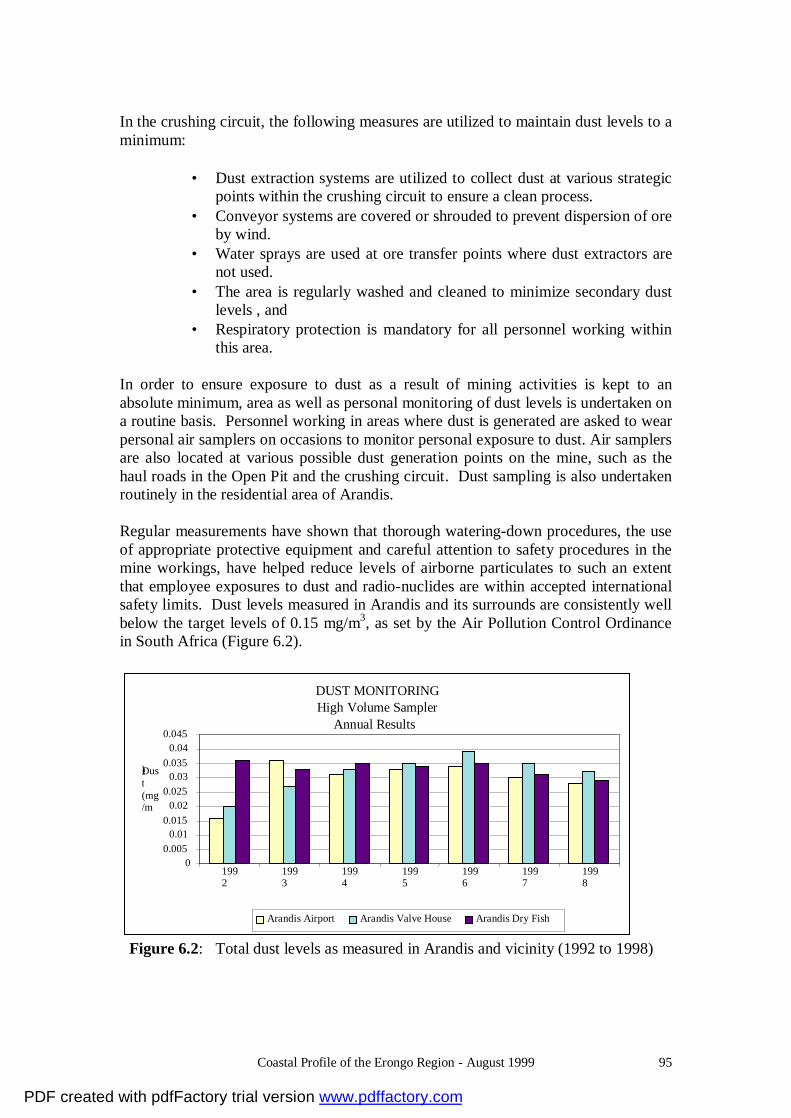
Coastal Profile of the Erongo Region - August 1999 95
In the crushing circuit, the following measures are utilized to maintain dust levels to a minimum:
• Dust extraction systems are utilized to collect dust at various strategic
points within the crushing circuit to ensure a clean process. • Conveyor systems are covered or shrouded to prevent dispersion of ore
by wind. • Water sprays are used at ore transfer points where dust extractors are
not used. • The area is regularly washed and cleaned to minimize secondary dust
levels , and • Respiratory protection is mandatory for all personnel working within
this area.
In order to ensure exposure to dust as a result of mining activities is kept to an absolute minimum, area as well as personal monitoring of dust levels is undertaken on a routine basis. Personnel working in areas where dust is generated are asked to wear personal air samplers on occasions to monitor personal exposure to dust. Air samplers are also located at various possible dust generation points on the mine, such as the haul roads in the Open Pit and the crushing circuit. Dust sampling is also undertaken routinely in the residential area of Arandis.
Regular measurements have shown that thorough watering-down procedures, the use of appropriate protective equipment and careful attention to safety procedures in the mine workings, have helped reduce levels of airborne particulates to such an extent that employee exposures to dust and radio-nuclides are within accepted international safety limits. Dust levels measured in Arandis and its surrounds are consistently well below the target levels of 0.15 mg/m3, as set by the Air Pollution Control Ordinance in South Africa (Figure 6.2).
DUST MONITORINGHigh Volume Sampler
Annual Results
00.005
0.010.015
0.020.025
0.030.035
0.040.045
1992
1993
1994
1995
1996
1997
1998
Dust(mg/m
3)
Arandis Airport Arandis Valve House Arandis Dry Fish
Figure 6.2: Total dust levels as measured in Arandis and vicinity (1992 to 1998)
PDF created with pdfFactory trial version www.pdffactory.com

Coastal Profile of the Erongo Region - August 1999 96
Every attempt is made to reduce the effects of wind erosion on the tailings impoundment during high velocity east wind events. Monitoring results have shown that the implemented measures, outlined below have been very effective in reducing wind erosion during the east wind season. Measures to minimize wind erosion include the following:
• A series of sand berms, termed windrows, have been graded on all dry
areas on the tailings impoundment in a direction perpendicular to the east wind direction. These windrows have the effect of reducing the wind velocity, and hence wind erosion, on the surface of the tailings dam.
• Waste rock berms have also been constructed on inactive paddies on the tailings dam at set intervals, and work in a manner similar to the windrows.
• The upwind crest of the tailings dam has been covered in a layer of waste rock which reduces the effects of saltation in this area.
• Experiments to determine the optimum tailings surface are conducted on a series of plots on the tailings dam in order to further improve or minimize erosion from the tailings dam surface.
As a result of the erosion of tailings from the tailings impoundment during strong east wind events, a tailings plume has formed to the south west of the tailings impoundment. Monitoring results have shown that the quantities of deposited tailings dust diminishes dramatically with increasing distance from the tailings dam. More than 90% of tailings material mobilized off the perimeter of the tailings impoundment is deposited within the first one hundred metres of the tailings impoundment perimeter. Wind blown tailings will be cleaned up upon mine closure and transported back to the tailings dam for final disposal. The control measures in place will, however ensure that the extent of such clean up measures are kept to a minimum.
Particulates
In the Final Product Recovery plant, yellow cake (uranium diurthanate) is roasted to uranium dioxide. During this process, a very limited amount of particulate is released into ambient air via two wet scrubber stacks. In order to monitor the emissions of particulate into ambient air as well as check on the efficiency of the two wet scrubbers, isokinetic stack sampling is carried out on a quarterly basis. Sampling the stacks under isokinetic conditions is essential to ensure a representative sample of particulate is obtained under varying pressure and air-flow conditions. Monitoring results as well as measurements of uranium in dust concentrations surrounding the Final Product Recovery plant indicate that, even under conditions of full production, uranium concentrations in ambient air remain well within international guidelines.
Radiation The grade of the Rössing uranium ore deposit is extremely low. Typically 350g of uranium is present in every one ton of ore that is mined. As a result of this low
PDF created with pdfFactory trial version www.pdffactory.com
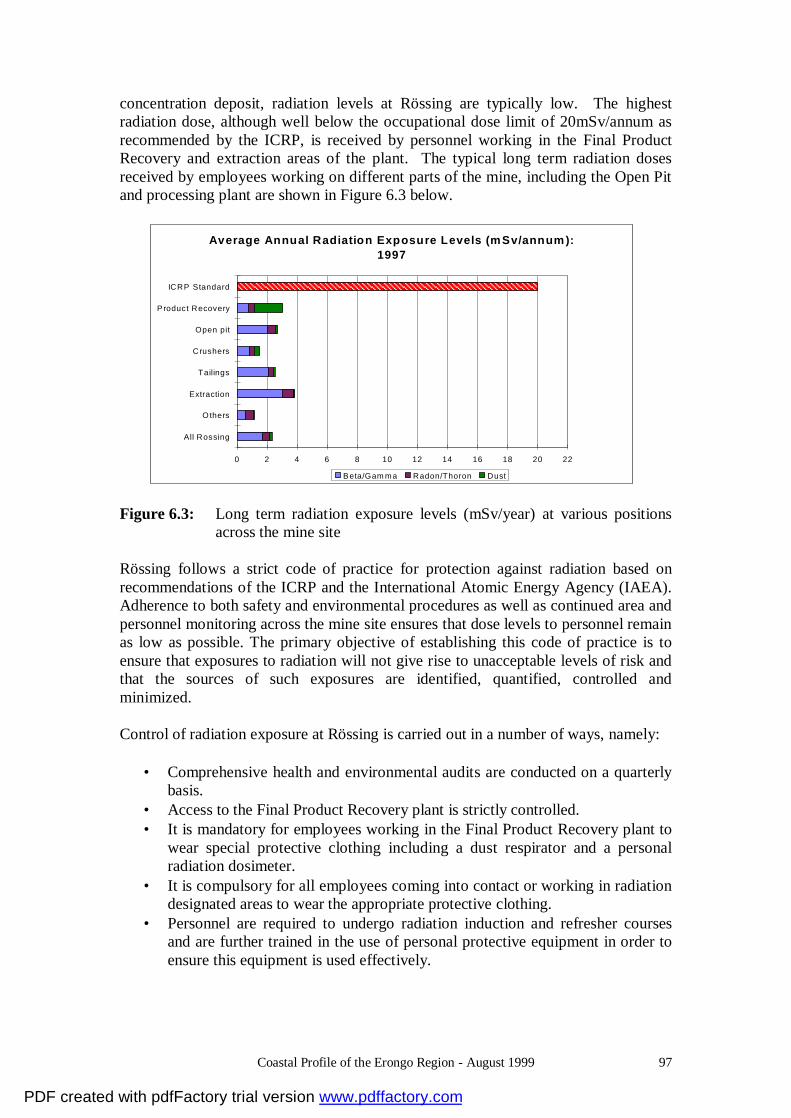
Coastal Profile of the Erongo Region - August 1999 97
concentration deposit, radiation levels at Rössing are typically low. The highest radiation dose, although well below the occupational dose limit of 20mSv/annum as recommended by the ICRP, is received by personnel working in the Final Product Recovery and extraction areas of the plant. The typical long term radiation doses received by employees working on different parts of the mine, including the Open Pit and processing plant are shown in Figure 6.3 below.
Average Annual Radiation Exposure Levels (mSv/annum): 1997
0 2 4 6 8 10 12 14 16 18 20 22
All Rossing
O thers
Extraction
Tailings
Crushers
Open pit
P roduct Recovery
ICRP Standard
Beta/Gam ma Radon/Thoron Dust Figure 6.3: Long term radiation exposure levels (mSv/year) at various positions
across the mine site Rössing follows a strict code of practice for protection against radiation based on recommendations of the ICRP and the International Atomic Energy Agency (IAEA). Adherence to both safety and environmental procedures as well as continued area and personnel monitoring across the mine site ensures that dose levels to personnel remain as low as possible. The primary objective of establishing this code of practice is to ensure that exposures to radiation will not give rise to unacceptable levels of risk and that the sources of such exposures are identified, quantified, controlled and minimized.
Control of radiation exposure at Rössing is carried out in a number of ways, namely:
• Comprehensive health and environmental audits are conducted on a quarterly
basis. • Access to the Final Product Recovery plant is strictly controlled. • It is mandatory for employees working in the Final Product Recovery plant to
wear special protective clothing including a dust respirator and a personal radiation dosimeter.
• It is compulsory for all employees coming into contact or working in radiation designated areas to wear the appropriate protective clothing.
• Personnel are required to undergo radiation induction and refresher courses and are further trained in the use of personal protective equipment in order to ensure this equipment is used effectively.
PDF created with pdfFactory trial version www.pdffactory.com
Coastal Profile of the Erongo Region - August 1999 98
Monitoring of radiation levels is routinely undertaken to ensure the exposure to employees are kept to a minimum, and includes:
• Biological sampling, where each employee working in radiation designated
areas, provides a urine sample at least once a month, which is analyzed by the Atomic Energy Corporation (AEC) in South Africa, for traces of uranium as a check for possible internal exposure.
• All employees leaving the Final Product Recovery plant are monitored with a radiation scanner to ensure that they are free from any contamination.
• Scientific studies by independent outside consultants such as the AEC are conducted.
• Area and personal respirable dust and radiation monitoring mine wide is carried out as scheduled in the environmental monitoring programme.
• Radon and thoron concentrations are regularly measured at the mine site and background (natural) radon concentrations are measured in the surrounding areas and in the town of Arandis.
Waste Waste Rock
The complex nature and low uranium content of the main uranium-bearing ore-body at the Rössing Uranium Mine necessitates the mining and processing of large tonnages of rock each year, throughout the life of the mine. In a mining operation of this size, the efficient and safe disposal of waste rock and tailings have presented, and will continue to present, problems of scale.
At the Rössing Uranium Mine, waste rock comprises approximately 70% (some 111000 tonnes) of the 150000 tonnes of rock mined each day. This consists of barren country rock and of sub-economic uranium ore. The waste rock, which varies in consistency from large boulders to finer sands and gravel-sized particles, is removed from the Rössing open pit each day and dumped onto designated rock dumps located around the periphery of the Open Pit. Since the start of open-pit mining activities in 1976, approximately 960 million tonnes of waste rock has been moved and dumped in the twenty one year period up to 1997. The predicted cumulative total tonnages of waste rock and the different ore grades to be mined during the predicted life-span of the Rössing Uranium Mine are shown in Table 6.4. Table 6.4: Predicted cumulative total tonnages of waste rock (given in millions of
tonnes) and different ore grades that will be mined during the future mining operations at Rössing Uranium Mine
Year Waste Rock Low Grade High Calc Ore Total 2000 2005 2010 2015 2018
743.7 879.5 1019.3 1114.3 1143.2
74.5 89.7 104.7 122.0 128.4
14.6 17.8 25.0 61.4 78.9
316.4 378.5 440.5 502.6 539.8
1149.2 1365.5 1589.5 1800.3 1890.3
PDF created with pdfFactory trial version www.pdffactory.com

Coastal Profile of the Erongo Region - August 1999 99
The waste rock is hard and durable and the waste rock dumps are expected to remain stable without significant slumping. At mine closure, the waste rock dumps are expected to fill much of Dome and Pinnacle Gorges and the level of radio-activity is expected to be approximately equal to background levels. No re-contouring or re-shaping of the waste rock dumps is therefore deemed necessary upon mine closure. Stock piles of high calc, unused high grade ore and other marginal grades of ore will be covered with waste rock. Waste rock will also be used for reclamation and stabilization of much of the tailings dam surface upon mine closure in order to minimize the erosion of tailings by wind and water.
Tailings
At Rössing Uranium Mine, all of the waste solids (tailings) from the uranium extraction process are pumped to a large tailings dam. Due to the low uranium content of the ore, the tailings consist of virtually the entire mass of input ore (40000 metric tonnes per day) plus waste process liquids and the calcine residue from pyrite used in acid making.
The tailings dam covers a surface area of approximately 750 hectares and stands 55m at its highest point above the surrounding terrain. Since the start of mining operations, approximately 220 million tonnes of tailings have been disposed of whichs amounts to an approximate volume of 132 million m3. The bulk of the budget for the decommissioning of the mine has been set aside for the reclamation of the tailings impoundment at mine closure. As mentioned, it is envisaged that the majority of the tailings dam surface will be covered with waste rock upon decommissioning to minimize the erosion of tailings by wind and water. Industrial Refuse
Rössing operates a domestic waste disposal facility on site. This disposal facility complies with the minimum requirements for waste disposal by landfill, as stipulated under South African legislation. Recycling programmes for items such as metals, wood and paper are in place at Rössing which minimizes the volumes of wastes disposed of. A hazardous waste plan at Rössing is also in place to ensure best practice methods for hazardous waste disposal is adhered to. Water Management
Introduction Potable water is supplied to the coastal towns of Walvis Bay and Swakopmund, as well as Arandis and the mine, from aquifers at the Kuiseb and Omaruru river deltas. As population and industries on the west coast increase, these limited water resources are put under increasing pressure. Rössing, as a major consumer of water on the west coast, thus has a vested interest in ensuring the reliability of water supply to the west coast of Namibia. Due to the desert environment of the mine site and the nature and size of the process, considerable attention is paid to water management. The principle objectives are the
PDF created with pdfFactory trial version www.pdffactory.com

Coastal Profile of the Erongo Region - August 1999 100
sustainable management of the available water resources as well as the prevention of groundwater contamination by seepage from the tailings impoundment. In recent years, new tailings deposition methods have been developed by the mine to achieve the two main objectives. Firstly, by minimising the amount of water which is lost on the tailings impoundment due to high evaporation rates experienced in this area, and secondly, by utilising the neutralisation capacity of the carbonate rich tailings solids to prevent acid mine drainage in the form of tailings seepage. Both objectives have been achieved. Rössing's water consumption has been drastically reduced since 1980. Tailings seepage is under control since start-up, and seepage fronts have now retreated back towards the tailings impoundment as a result of water conservation measures. Integrated management of water usage and environmental impacts resulted not only in financial benefits but also in substantially reduced environmental impacts. Water Usage Fresh water is supplied to the mine by the Central Namib State Water Scheme operated by NamWater. In 1997, about 8000 m3/day was used on average resulting in a total consumption of about 3Mm3/a. Uranium production is currently below capacity but a return to full production is foreseen for the year 2003. Estimated demand for the period after the year 2003 is 4.5 Mm3/a. Specific water addition per tonne of ore milled will be around 0.3 m3, a rate which can be achieved with high confidence.
Brakwater is pumped from the Khan River by private boreholes and the production rates have been reduced from 1200 m3/day to 650 m3/day in recent years. Rössing is assessing the groundwater reserves on a continuous basis and, should substantial recharge occur, would apply to the DWA to abstract an increased rate if appropriate.
PDF created with pdfFactory trial version www.pdffactory.com
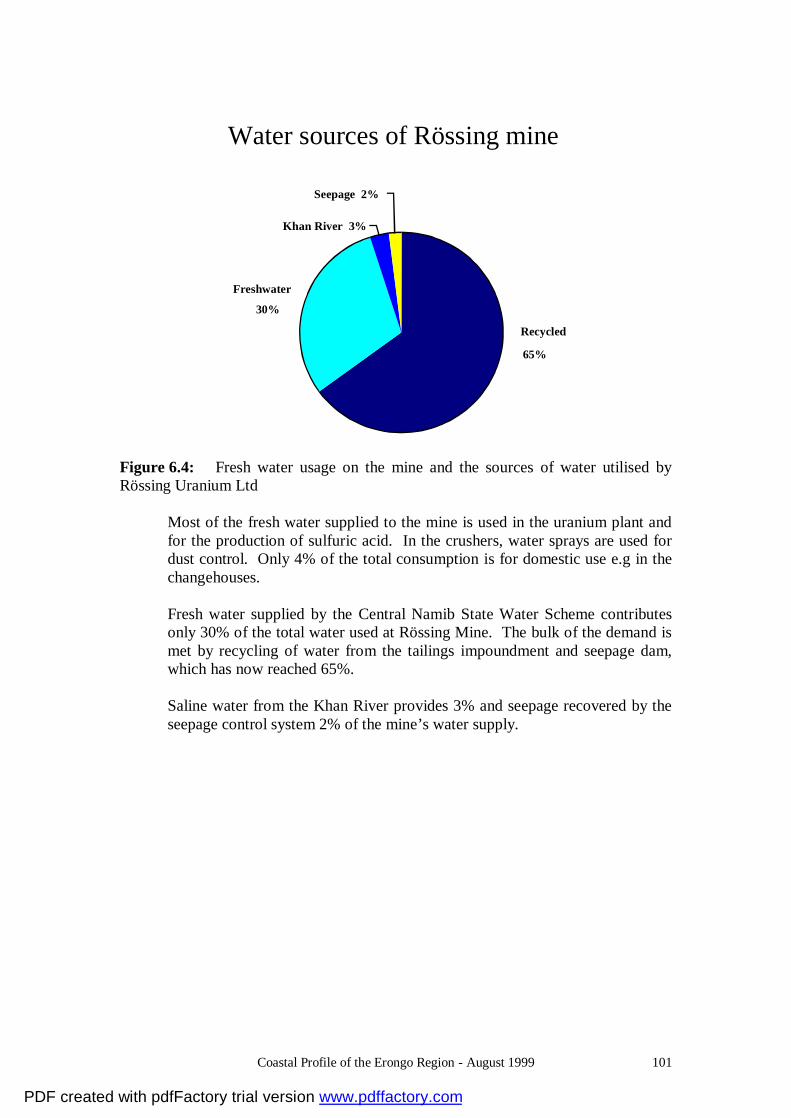
Coastal Profile of the Erongo Region - August 1999 101
Figure 6.4: Fresh water usage on the mine and the sources of water utilised by Rössing Uranium Ltd
Most of the fresh water supplied to the mine is used in the uranium plant and for the production of sulfuric acid. In the crushers, water sprays are used for dust control. Only 4% of the total consumption is for domestic use e.g in the changehouses.
Fresh water supplied by the Central Namib State Water Scheme contributes only 30% of the total water used at Rössing Mine. The bulk of the demand is met by recycling of water from the tailings impoundment and seepage dam, which has now reached 65%.
Saline water from the Khan River provides 3% and seepage recovered by the seepage control system 2% of the mine’s water supply.
Water sources of Rössing mine
Recycled
65%
Freshwater
30%
Khan River 3%
Seepage 2%
PDF created with pdfFactory trial version www.pdffactory.com

Coastal Profile of the Erongo Region - August 1999 102
Rössing historical water consumptionRössing historical water consumption
0
2
4
6
8
10
12
1977
1979
1981
1983
1985
1987
1989
1991
1993
1995
1997
Mill
ion
cubi
c m
etre
s pe
r ye
ar Khan WaterFresh Water
Figure 6.5: Rössing’s fresh water consumption from 1977 to 1997. During the early years of operation, very little water was re-used in the production process. But over the past 10 years, the unit water consumption has been reduced by over 60% due to improved water management and increasing use of recycled water. Total fresh water demand at Rössing Mine is currently about 3 million cubic metres per year compared 8 to 10 million cubic metres in the early years of mine development. Rössing’s aim is to keep the fresh water used per tonne of ore milled as low as possible even at increased uranium production levels. Local geography and geohydrology The hyper arid area in which the mine is situated, receives an annual rainfall of about 30 mm and only dry rivers are found in this region. However, these rivers are sources for groundwater. The mine is located close to the northern bank of one of these rivers, the Khan river, which is one of the major drainage systems draining via the larger Swakop river into the sea. The groundwater of the Swakop river is used as a source for irrigation water at a number of small farms along its banks closer to Swakopmund. The groundwater of the Khan river is only used by the mine. Figure 6.6 illustrates the extent of the Rössing operation on a local scale. The open pit is 3 km long by 1 km wide while the tailings impoundment is 4 km long and covers approximately 700 hectares. The tailings impoundment elevation is 250 m above the Khan river elevation. Three gorges, Panner, Pinnacle and Dome Gorges are situated within the area and drain into the Khan river. These three gorges are dry washes, filled with alluvium and are of primary importance when consideration is given to the potential escape of seepage water from the tailings impoundment to the Khan river.
PDF created with pdfFactory trial version www.pdffactory.com

Coastal Profile of the Erongo Region - August 1999 103
Tailings Impoundment
Open Pit
Plant
Khan River
PannerGorge
Dome Gorge
PinnacleGorge
N
5 km
SeepageDam
Waste Dumps
Figure 6.6: The extent of the Rössing Uranium operation Groundwater recharge in the catchment areas around Rössing takes place through infiltration of rainwater into the secondary bedrock aquifers and to a lesser extent, through infiltration of surface run-off into the primary aquifers. Due to slow flow rates, extensive leaching of salts from the natural bedrock takes place before water is discharged via the gorges into the Khan river. For this reason, the natural groundwater quality is characterised by high concentrations of nitrates, chlorides and sulphates which makes it unfit for human consumption or livestock watering. However, Khan river groundwater quality is substantially better as this aquifer is recharged annually by surface run-off from further inland. It is this aquifer which receives great attention in Rössing's groundwater protection programme. The tailings impoundment An artificial hydrological system is imposed on the natural groundwater system in form of the tailings impoundment. In the early 1970's, the impoundment was designed as a seep away and evaporation structure, and is therefore unlined. It directly overlays the country rock and the Pinnacle Gorge channel.
PDF created with pdfFactory trial version www.pdffactory.com
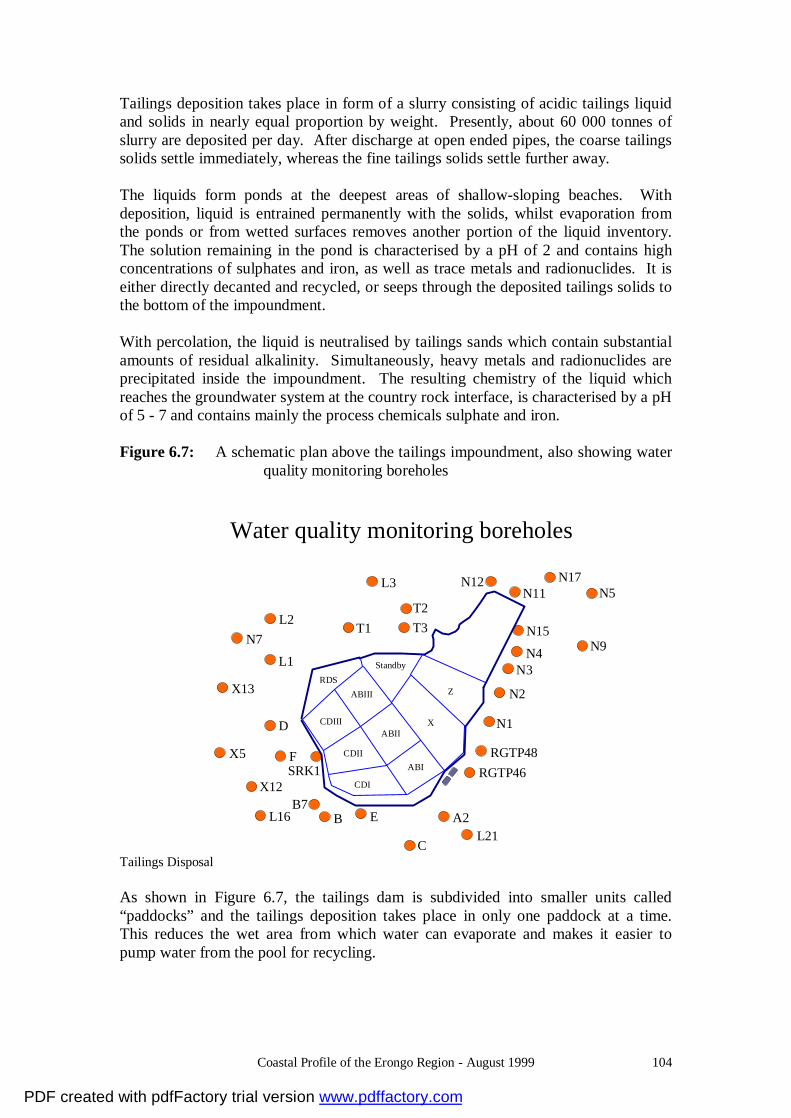
Coastal Profile of the Erongo Region - August 1999 104
Tailings deposition takes place in form of a slurry consisting of acidic tailings liquid and solids in nearly equal proportion by weight. Presently, about 60 000 tonnes of slurry are deposited per day. After discharge at open ended pipes, the coarse tailings solids settle immediately, whereas the fine tailings solids settle further away. The liquids form ponds at the deepest areas of shallow-sloping beaches. With deposition, liquid is entrained permanently with the solids, whilst evaporation from the ponds or from wetted surfaces removes another portion of the liquid inventory. The solution remaining in the pond is characterised by a pH of 2 and contains high concentrations of sulphates and iron, as well as trace metals and radionuclides. It is either directly decanted and recycled, or seeps through the deposited tailings solids to the bottom of the impoundment. With percolation, the liquid is neutralised by tailings sands which contain substantial amounts of residual alkalinity. Simultaneously, heavy metals and radionuclides are precipitated inside the impoundment. The resulting chemistry of the liquid which reaches the groundwater system at the country rock interface, is characterised by a pH of 5 - 7 and contains mainly the process chemicals sulphate and iron. Figure 6.7: A schematic plan above the tailings impoundment, also showing water
quality monitoring boreholes
Tailings Disposal As shown in Figure 6.7, the tailings dam is subdivided into smaller units called “paddocks” and the tailings deposition takes place in only one paddock at a time. This reduces the wet area from which water can evaporate and makes it easier to pump water from the pool for recycling.
Water quality monitoring boreholes
N17N5
N9N4
N15
N3
N2
N1
N11N12
RGTP48RGTP46
L21A2E
T1 T3T2
SRK1
L2
L3
N7
L1
X13
X12
D
F
BB7
L16
C
X5
Z
X
ABI
ABII
ABIII
CDI
CDII
CDIII
StandbyRDS
PDF created with pdfFactory trial version www.pdffactory.com
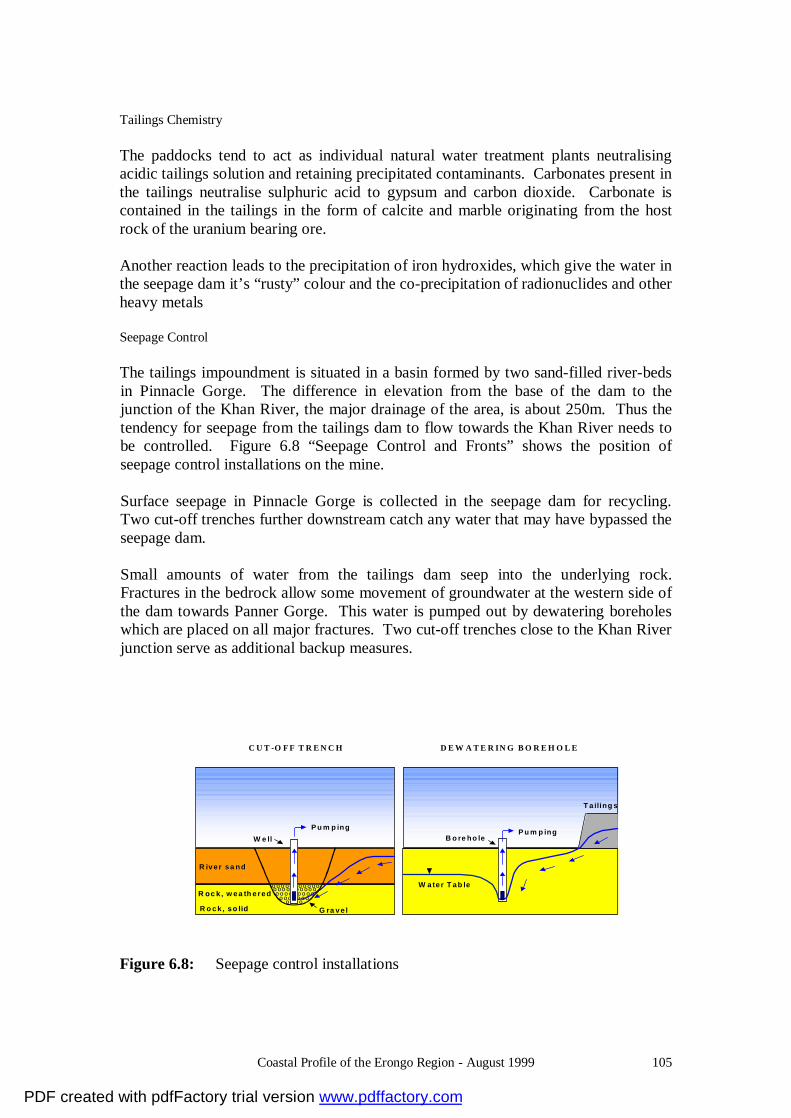
Coastal Profile of the Erongo Region - August 1999 105
Tailings Chemistry The paddocks tend to act as individual natural water treatment plants neutralising acidic tailings solution and retaining precipitated contaminants. Carbonates present in the tailings neutralise sulphuric acid to gypsum and carbon dioxide. Carbonate is contained in the tailings in the form of calcite and marble originating from the host rock of the uranium bearing ore. Another reaction leads to the precipitation of iron hydroxides, which give the water in the seepage dam it’s “rusty” colour and the co-precipitation of radionuclides and other heavy metals Seepage Control The tailings impoundment is situated in a basin formed by two sand-filled river-beds in Pinnacle Gorge. The difference in elevation from the base of the dam to the junction of the Khan River, the major drainage of the area, is about 250m. Thus the tendency for seepage from the tailings dam to flow towards the Khan River needs to be controlled. Figure 6.8 “Seepage Control and Fronts” shows the position of seepage control installations on the mine. Surface seepage in Pinnacle Gorge is collected in the seepage dam for recycling. Two cut-off trenches further downstream catch any water that may have bypassed the seepage dam. Small amounts of water from the tailings dam seep into the underlying rock. Fractures in the bedrock allow some movement of groundwater at the western side of the dam towards Panner Gorge. This water is pumped out by dewatering boreholes which are placed on all major fractures. Two cut-off trenches close to the Khan River junction serve as additional backup measures.
C U T -O F F T R E N C H D E W A T E R IN G B O R E H O L E
o o o oo o o o o ooo o o oo o o o o ooo oo oo o o oo oo oo o o o o oo oo o o oo o o o oo o o oo o o o o
o oo o o ooo oo o o ooo o o oo oo o
P u m p ing
R iv e r s a nd s a nd
R oc k , R oc k , w e a th e re d
R o c k , s o lid, s o lid G ra v e l
W e llP u m p ing
T a iling s
B o re ho le
W a te r T a b le
Figure 6.8: Seepage control installations
PDF created with pdfFactory trial version www.pdffactory.com
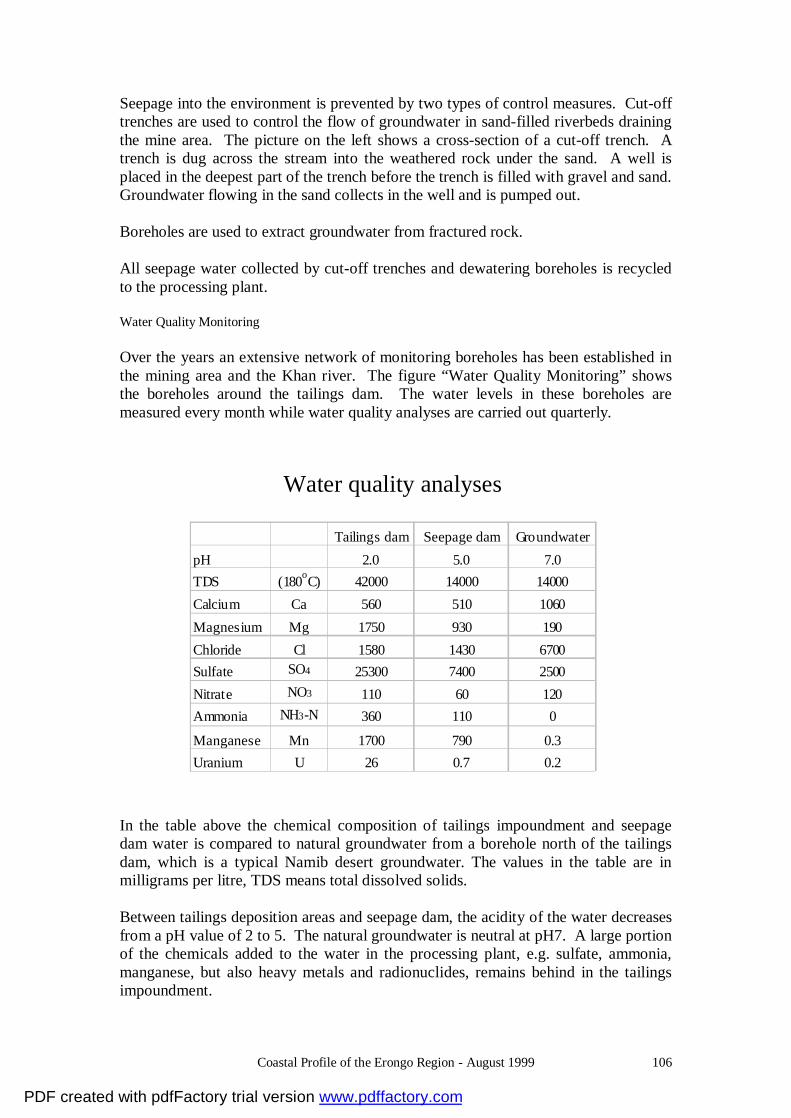
Coastal Profile of the Erongo Region - August 1999 106
Seepage into the environment is prevented by two types of control measures. Cut-off trenches are used to control the flow of groundwater in sand-filled riverbeds draining the mine area. The picture on the left shows a cross-section of a cut-off trench. A trench is dug across the stream into the weathered rock under the sand. A well is placed in the deepest part of the trench before the trench is filled with gravel and sand. Groundwater flowing in the sand collects in the well and is pumped out. Boreholes are used to extract groundwater from fractured rock. All seepage water collected by cut-off trenches and dewatering boreholes is recycled to the processing plant.
Water Quality Monitoring Over the years an extensive network of monitoring boreholes has been established in the mining area and the Khan river. The figure “Water Quality Monitoring” shows the boreholes around the tailings dam. The water levels in these boreholes are measured every month while water quality analyses are carried out quarterly.
In the table above the chemical composition of tailings impoundment and seepage dam water is compared to natural groundwater from a borehole north of the tailings dam, which is a typical Namib desert groundwater. The values in the table are in milligrams per litre, TDS means total dissolved solids. Between tailings deposition areas and seepage dam, the acidity of the water decreases from a pH value of 2 to 5. The natural groundwater is neutral at pH7. A large portion of the chemicals added to the water in the processing plant, e.g. sulfate, ammonia, manganese, but also heavy metals and radionuclides, remains behind in the tailings impoundment.
Water quality analyses
Tailings dam Seepage dam GroundwaterpH 2.0 5.0 7.0TDS (180oC) 42000 14000 14000Calcium Ca 560 510 1060Magnesium Mg 1750 930 190Chloride Cl 1580 1430 6700Sulfate SO4 25300 7400 2500Nitrate NO3 110 60 120Ammonia NH3-N 360 110 0
Manganese Mn 1700 790 0.3Uranium U 26 0.7 0.2
PDF created with pdfFactory trial version www.pdffactory.com

Coastal Profile of the Erongo Region - August 1999 107
Sulphate being the most conservative constituent in seepage (which means sulphate is not being retained during flow through the aquifers and moves furthest) is used to indicate the extent of seepage around the tailings impoundment. Sulphate concentrations of 3000 milligrams per litre (slightly above natural sulphate concentrations in groundwater) are found along the line indicated as “seepage fronts” on the figure “Seepage Control and Fronts”. Conclusions Due to Rössing’s environmental and economic commitment to an overall water management strategy, it has shown that by developing site specific water conservation and environmental protection techniques, it is possible to continue operating a large uranium mine in a dry desert environment without impacting negatively on the environment outside the mining lease area. Namib Lead Situated at the western foot of the Rössing Mountain, 7.5 km northeast of the Namib siding, this deposit, also known as Deblin Mine was discovered during a prospecting campaign in 1932-34. During the first period of exploration and development, three shafts, between 33 and 41 m deep, were sunk, and 10 diamond drill holes completed, intersecting the ore body to a maximum depth of 125 m. A geophysical survey was carried out over the ground during 1934 and 1944, followed by a drilling programme in the 1960s. The mine has been operating since 1965, with only lead concentrates produced initially, but since 1974 zinc concentrates have also been recovered. In 1988 the zinc concentrate output was about 4 times higher than the lead concentrate production. The silver content averages about 23 g/t. The mine is currently on care and maintenance. The area is underlain by folded marble and subordinate quartz-mica schist of the karibib Formation, intruded by small bodies of granite and pegmatite. The mineralised zone strikes north-northwest parallel to the layering of the marble, although there are places where the ore body cross-cut the host rocks. Four major bodies have been identified of which two, the South and the Junction Ore Body have been extensively mined. The North Ore Body was developed until 1992, while the N20 Ore Body is located along another horizon further north. In 1990, ore reserves amounted to 300 000 t at 5.5% zinc and 1.5% lead with 23 g/t silver at a 4% cut-off, lead and zinc combined. On surface, the mineralised zone which lies between two thin phyllite seams intercalated in limestone, is generally marked by well-developed gossans of ferruginous material containing sporadic galena, cerrussite and smithsonite. The gossan extends to a depth of 10 m and the ore is oxidised to a depth of about 16 m, below which it is sulphidic. The fresh ore consists mainly of sphalerite, galena, pyrrhotite and pyrite intergrown with sparry carbonate; fluorite is abundant in the hanging wall of the southern body. The sphalerite is iron-rich. The deposit includes irregular lenses and pockets of massive sulphides grading over 20% lead and zinc, but
PDF created with pdfFactory trial version www.pdffactory.com
Coastal Profile of the Erongo Region - August 1999 108
generally it occurs in the form of a network of stringers (Williams, 1989; Wartha & Genis, 1992). 6.2.2.2 Salt Production Panther Beacon Pan The Panther Beacon Salt Pan, belonging to Salt Co. (Pty) Ltd, is situated about 9 km north of Swakopmund in a depression separated from the sea by a rock and sand bar some 300ÿm wide. Altogether 3.70 km² of the depression, which measures some 4.4 km², are covered by constructed salt pans, with an area ratio of concentration to crystallisation pans of 5:1 . Since 1952 salt has been produced directly from sea water by means of solar evaporation. Sea water is pumped with two turbines at a rate of 8.8ÿmillionÿm3 per year (+ 1000 m3/h) into a pre-evaporation pond where all organic matter is allowed to settle. Upon reaching a concentration of 6% NaCl, the brine is channeled into a series of ten in-line evaporation pans where gypsum is allowed to crystallise. When a concentration of 25% NaCl is reached, the brine flows through a brine channel into ten crystallisation pans. The flow of the brine is entirely controlled by gravity. The crystallisation pans are harvested in turn within a two year cycle. After 15 months the thickness of the salt layer is between 30 and 40cm. The pans are drained once during the process to remove the bitterns that stay in solution. The final product fluctuation is 99.4 to 99.6% NaCl. After reaping with a scoop, the salt is transported to a plant where it is washed in a brine of 25% NaCl concentration. It is then separated from the brine in a gravity circuit consisting of a cyclone, two screens and a centrifuge, and is subsequently mechanically separated into coarse and fine grades. The salt is transported to Swakopmund by truck for bagging, where a small part of it is also milled into table salt. At maximum capacity, the pans at Panther Beacon are capable of producing 150 000 t of salt per annum. The site also accommodates a 40 000 m2 guano platform erected in a pan not used for salt production and an oyster farm which makes use of the first evaporation pan (Schneider & Genis, 1992a). Cape Cross Salt Pan Covering an area of about 41 km², the Cape Cross Salt pan is located some 130 km north of Swakopmund. Part of the pan is held under claim, but not all of this is productive. Most of the claims are situated in the eastern half of the pan where the increase in salinity of the brine is 25%, compared to 9% in the lagoon near the shore. This increase is caused by the presence of fossil rock salt on the eastern side. The brine level is about 60 cm below the pan's surface. The production procedure is simple. Trenches and pits are dug in rows and allowed to fill with brine; after crystallisation, the salt is harvested. It has been estimated that the Cape Cross salt pan, if fully utilised, has a potential of about 1.3ÿmillionÿt per annum. At present it is the third-most important producing pan in Namibia.
PDF created with pdfFactory trial version www.pdffactory.com
Coastal Profile of the Erongo Region - August 1999 109
Fossil rock salt has been mined in several of the pans mentioned above, but the Cape Cross pan is the main one still in production. The pan is bordered on its southern, eastern and northern margin by low hills of gently dipping Etendeka Formation basalt, and in places by alkaline igneous rocks of the Cape Cross Complex. Its western margin is separated from the sea by a sand bar 300 to 400 m wide; seawater reaches the pan by seepage. Marine terraces, as well as alluvial fans caused by occasional rain showers, occur along the eastern margin of the pan. Along the western margin where its floor lies between low- and high-water mark, lagoons have formed parallel to the coast. Fossil rock salt is well developed in the eastern half of the pan, whereas towards the west it thins and alternates with sand and clayey layers, the latter in places smelling strongly of hydrogen sulphide. Varying in thickness from 30 cm to 5 m, fossil rock salt occurs over an area of 15 km². With the water level at about 60 cm below surface, halite was commonly removed to a depth of 50cm with the aid of jackhammers and crowbars. The reserves of the top 45 cm of rock salt were estimated at approximately 7.7 million ton, while other researchers calculated that the deposit contained more than 350 million ton down to an average depth of 3.8m. The thicker rock salt in the eastern part of the pan provides a good floor and the rate of seepage is much lower than further westwards. When rock salt is partially dissolved in brine, a brine of higher concentration is obtained which can be used directly in the production of salt by solar evaporation. The market for rock salt is limited. The product is consumed mainly by the local cattle farming industry (Schneider & Genis, 1992a). Walvis Bay Salt Pan The Walvis Bay Salt Pans are situated some 6 km south of the town, immediately south and southwest of the lagoon. Prior to 1970, the amount of salt produced in this area was insignificant. Walvis Bay has since become one of the major salt producing centres on the coast of Namibia. The industry started in 1966 when brine with a concentration of about 15% NaCl was initially pumped from boreholes in the vicinity of the pans. The concentration and crystallisation pans, which covered an area of 80 ha, were lined with a polythene membrane to prevent seepage. By 1970 the average salt yield from these pans was 24000 t per annum, increasing to 56000 t by 1974. During 1976 an extension program was implemented and additional concentration pans were built to provide for the increased output from crystallisation pans. However, the supply of brine from underground resources was insufficient to support full treatment capacity, and sea water became the main source for producing brine. Larger solar evaporation pans were constructed on low-lying terrain, flooded by the natural flow of water at high tide. The supply was augmented by sea water pumped through large-capacity diesel-driven pumps.
PDF created with pdfFactory trial version www.pdffactory.com

Coastal Profile of the Erongo Region - August 1999 110
Initially, seepage from pans constructed on clayey alluvium was fairly high, being about 4 cm per day. The rate, however, dropped drastically after lime was used to seal off the pan floors, and the sealing process was completed by the rapid growth the algae halophytes. Today, the Walvis Bay salt pans cover an area of 35 km², 31 km² of which consist of evaporation and concentration pans. Salt is harvested from 16 crystallisation pans covering 220000 m2 each. Seawater is pumped at rate of 235 m3/min for 23 h/day into the evaporation pans. The salt produced at Walvis Bay amounts to approximately 480000 t per year. It is of the coarse type, grades 99.2 % NaCl and is shipped in bulk to the chemical industries in South Africa (Schneider & Genis, 1992a). Ugab Salt Pan The Ugab pans were productive from 1954 to 1958. They consist of a series of pans situated some 50 km north of Cape Cross and some 35 km south of the Ugab River mouth, covering an area of approximately 17 km². The pans are separated from each other as well as from the sea by dolerite dykes. Rock salt as well as solar evaporation salt has been produced. Fossil rock salt also occurs in the Ugab Pans. The country rock and floor of the pans consist of granite pervasively intruded by dolerite dykes of Karoo age. Fossil rock salt occurs in the two southernmost pans. In pan no. 4 a layer of fossil rock salt some 150 cm thick occurs over the greater part of the pan, overlain by 5 to 10ÿcm of black clay; the surface is covered by a crust of salt, 1 to 5 cm thick. The water level lies very close to the surface of the pan (Schneider & Genis, 1992a). 6.2.2.3 Guano Harvesting Platforms for the roosting and breeding of sea birds have been erected in the Panther Beacon Pan north of Swakopmund, in the Cape Cross area and offshore in the sheltered harbour of Walvis Bay. Guano is recovered annually from these artificial islands. Erection of the roosting platforms along the coast, which started in 1931, assured a considerable artificial yield. Total production from these artificial islands amounted to some 140000 t until 1997. 6.2.2.4 Abandoned Mines Brandberg West The Brandberg West deposit is located in the lower Ugab River area, about 45 km north-northwest of the Brandberg Complex. Tin-tungsten mineralised quartz veins occur in northeast-trending, foliated, turbiditic metasedimentary rocks of the Ugab Group of the Damara Sequence. The mineralisation is associated with a sheeted vein system which covers an area of about 900 by 300 m, mainly in quartz biotite schist.
PDF created with pdfFactory trial version www.pdffactory.com

Coastal Profile of the Erongo Region - August 1999 111
From 1946 to 1980, the tin-tungsten bearing vein deposit was mined in an open-cast operation. During this period some 14 000 t of concentrate grading between 32 and 56% tin oxide and between 14 and 19% tungsten oxide were produced (Diehl, 1992b). Uis The Uis deposit, located at the northern extremity of the Cape Cross - Uis Pegmatite Belt, and about 28 km east of the Brandberg Complex, represents the most extensive and regularly mineralised pegmatite swarm in the entire belt. Since the discovery of the deposit in 1911, both alluvial and hard-rock mining has occurred. In 1989, the open cast mine produced about 140 t tin concentrate grading 68% tin per month from 85 000 t of ore mined from eight large pegmatite bodies. The mine was at the time the largest hard-rock tin mine in the world, mining a low-grade deposit with average concentrations of 1200 ppm tin and proven reserves of 72 million t to a depth of 75 m. Due to the low tin price and the extremely low grades, the mine had to close down in 1990 (Diehl, 1992c). Khan Mine Situated about 60 km east-northeast of Swakopmund and 6 km south of Arandis Siding, this mine at one stage ranked second only to Tsumeb as a producer of copper in Namibia. The deposit was discovered in 1905 and in 1908 the Khan Kupfergrube Gesellschaft started underground development, having obtained title over the area from the Deutsche Kolonialgesellschaft. It took six years to erect a crushing and concentration plant with a capacity of 50 t per day. Production began in May 1914, but was suspended at the outbreak of World War I in August that same year. By November 1915 the mine recommenced production and operated until 1918, when work finally stopped as the venture was running at a consistent loss. Small-scale production took place again from 1964 to 1975, when the mine finally closed due to the almost depletion of ore reserves. The copper occurred in a pegmatite with an average width of one meter, a strike length of 300 m, and a down dip extension exceeding 200m. The pegmatite has been emplaced within the upper portion of the Khan Formation (Schneider & Seeger, 1992). 6.2.2.5 Quarrying Marble Quarries A variety of marbles, including white, grey, brownish and greenish types occur in the area between Rössingberg and Swakopmund and in the area southeast of Walvis Bay. The Nonidas marble quarry near Swakopmund is the only developed marble quarry in the area. It operates on a green marble restricted to an area extending about 20ÿkm eastwards from Swakopmund and 10 km northwards from the Swakop River. The dolomitic marble horizon forms narrow ridges. Since 1990, the deposit has been worked on a large scale using diamond-wire saw techniques and wedging methods. The attractive rock is composed of light to dark green, rounded grains of serpentinite within a white to cream-coloured carbonate matrix. Accessory corundum adds
PDF created with pdfFactory trial version www.pdffactory.com

Coastal Profile of the Erongo Region - August 1999 112
yellowish spots, and the lively colours gave the material the material the name "Namib Harlequin". Furthermore, aragonite is quarried east of Swakopmund. It is related to occurrences of dolomite and marble and occurs as lenses, bands and cavity fillings, as well as in the form of replacement of dolomitic marble. The beautiful material finds use in the manufacture of table tops and ornaments (Diehl, 1992a). Granite Quarries Rough blocks of granite, 11 to 25 t in weight, are quarried at Rooikop, about 15ÿkm east of Walvis Bay using jet-channelling methods. The granite is medium grained and has an attractive yellowish-grey colour. It is nearly free of fractures, however, schlieren and veins of black biotite cross-cut the granite in places. Test blocks of yellowish-grey granites were removed from a dimension stone claim area near the Goanikontes turn-off from the main road to Swakopmund. The colour and the mineralogy of the granite is very similar to that of the Rooikop granite. Just west of the Arandis airport, a test quarry was opened up and a few test blocks removed. Again, it is very similar to the Rooikop granites. A light granite was pegged on the farm Vergenoeg 92, some 5 km southeast of the main Okahandja-Swakopmund road. The fine- to medium-grained granite is greyish-white to slightly yellowish and has a granular texture. No quarry has been developed so far. At Klein Spitskoppe, a yellowish to light brown granite is quarried. Fresh material is greyish-white. Blocks of export size are produced using jet-burner techniques. The equigranular granite is medium- to coarse-grained and represents an anorogenic alkaline granite of Cretaceous age. The material is marketed as "Tropical Sun", "Kalahari Sands" and "Namibian Pearl" to local and overseas destinations. Test blocks of troctolite, a gabbroic rock, have been removed from a site about 5ÿkm northeast of Wlotzkasbaken, halfway between Swakopmund and Henties Bay. The material displays a spotted effect with typical iridescence that also gives this type of rock the name "troutstone" (Diehl, 1992a). 6.2.2.6. Wollastonite The Doppelgipfel wollastonite quarry lies some 5 km northeast of the Rössing Mine and some 12 km from the railway siding at Arandis. The wollastonite body overlies a pegmatite and forms two small circular hills some 35 m apart. The ore is not covered by overburden, and ore reserves are estimated at 7000 t. No production occurs at present (Schneider & Schreuder, 1992). 6.2.2.7 Semi-precious Stones Rose quartz frequently occurs in the core zones of pegmatites forming prominent hills in the area around the Rössing Siding. Much of the rose quartz displays a rich colour,
PDF created with pdfFactory trial version www.pdffactory.com
Coastal Profile of the Erongo Region - August 1999 113
but it is partly fractured. At present, rose quartz is quarried at the Hoffnungsstrahl Mine and the Roselis Mine due east of Rössing Mountain. A rock containing pyrophyllite in the Amis Valley on the western slopes of the Brandberg is occasionally quarried. The pyrophyllite is associated with Karoo sediments adjacent to the Brandberg granite. Alteration along the contact of the rocks produced a mosaic of light coloured, angular zones within a deep reddish-brown matrix. The rock is used as a carving stone (Schneider & Seeger, 1992b) 6.2.2.8 Industrial rocks Directly east of Rössing Mountain, quartzite of the Khan Formation was quarried and crushed at Rössing Stone Crushers. The coarse aggregate of 75 mm, 37 mm, 19 mm, 13 mm, 9.5 mm and 4.75 mm grades is used for railroad ballast, concrete aggregate and for bituminous paving and slurries in road construction. Finer aggregate was produced and used as filler for concrete masonry units (Schneider & Diehl, 1992). 6.2.2.9 Sand Mining Sand for use in concrete and mortar, and for the production of concrete masonry units is extracted on a regular basis from the ephemeral river beds of the project area. The most active areas of extraction are located near the mouths of the Swakop and Omaruru Rivers. Since building materials are excluded from the provisions of the Minerals (Prospecting and Mining) Act, 1992, by section 1 (1) of that same act, no licences are required under this act for extraction activities. 6.2.2.10 Exploration Mineral Exploration At present there are 22 valid mineral licences in the project area. They are covering the following groups of minerals: • All commodities: 2357 • Base, rare and precious metals; industrial minerals: 2189, 2506 • Base and rare metals, industrial minerals: 2135, 2172, 2351, 2352, 2354 • Base, rare and precious metals: 1951, 2003, 2375, 2512 • Base metals; industrial minerals: 2386 • Precious stones: 2087, 2305, 2324, 2327, 2339, 2540 • Industrial minerals: 2385 • Dimension stone: 2186 • Nuclear fuels: 2218 Hydrocarbon Exploration Namibia's first petroleum licensing round opened in 1991 and attracted 19 bids for 14 licence areas. Up to six bids were received for specific areas. The first exploration licence was awarded by the Government of the Republic of Namibia in April 1992 to a consortium of Norwegian companies headed by Norsk Hydro Namibia. Shell Exploration and Production Namibia (SEPN) and its partner Eagle Energy (now
PDF created with pdfFactory trial version www.pdffactory.com
Coastal Profile of the Erongo Region - August 1999 114
Energy Africa) were awarded a licence over the Kudu Gas field. Ranger Oil, Sasol Mining and Chevron Overseas (Namibia) and their various partners were also awarded licences during the first round. Three more licences were awarded subsequent to Namibia's second licensing round in 1994, namely one to Shell and a second to Norsk Hydro and its partners. All licences awarded so far have been for offshore areas within the Namibian Exclusive Economic Zone. Since the award of the first licence, over 28 000 km of new 2D seismic data and 700 km² of 3D seismic data, the first in Namibia, have been acquired, processed and interpreted by exploration companies and the data lodged with NAMCOR. In addition, seven widely spaced wells, some up to 4 500 m deep, have been drilled between 40 and 120 km offshore in water depths ranging from 170 m to almost 700 m. During this same period, NAMCOR through various agents, have acquired 14 500 km of 2 D seismic data which has been used to promote the potential of the Namibia offshore and to attract investment. A further 5 000 km will be acquired during 1998. 6.2.2.11 Claims There are currently 136 current claims pegged in the project area. A claim entitles the holder to prospect and to mine, and, for example, marble mining at Nonidas is conducted under a claim. The greater part of all sediments contains 0.5 to 0.7 % P2O5 which can therefore be regarded as the background high P2O5 concentrations are concentrated in two areas along the Namibian coast, namely south of the more than 4.6 % (maximum 23 % P2O5) at depths of 200 to 350ÿm. It has been found that the regions 5/20/98 4/22/98 ents coincide well with regions of persistent upwelling of deep water. In addition, maximum phosphorus concentrations coincide mainly with water depths of 150 to 215 m. It has been proven that neither the diatomaceous mud belt nor the upwelled waters of the Benguela Current are environments conducive to the inorganic precipitation of carbonate fluorapatite" and therefore upwelling of cold, nutrient-rich water can only be an indirect agent in the eventual precipita. 6.2.2.12 Mining and Quarrying Employment Interestingly, mining is not a large employer in the region, with the uranium mine at Rössing being the biggest. Mining accounts for merely 8% of the economically active population.
The salt recovery pans in Walvis Bay and north of Swakopmund employ a fixed quantity of workers which does not fluctuate as the economy cycles because the bulk of the production is for export against specific contracts.
The numbers of small miners of the Brandberg/Uis area who recover tin by hand from registered claims and the few semi-precious stone miners from the Spitzkoppe area are difficult to quantify because even though there are registered claims in these two places, mining tends to be sporadic and only undertaken when an income is desperately needed.
PDF created with pdfFactory trial version www.pdffactory.com
Coastal Profile of the Erongo Region - August 1999 115
Changing world market conditions for uranium has led to the expectation that the mine will downsize its personnel complement sometime after 1998.
Other mining and quarrying activities within the study area show depressed fortunes - the lead mine outside Swakopmund has been closed for the past four years; the stone quarrying and crushing plant operated by Rössing at Rössing mountain has long been defunct and the marble quarry near Nonidas has not operated for years. TABLE 6.5 MINING: TOTAL EMPLOYMENT
1994 1995 1996 1997 1998 1999 * URANIUM 1279 1254 1200 1262 1248 Not
known SALT 110 110 110 110 110 110 SAND 7 11 16 11 9 9 SMALL MINERS 191 192 191 190 187 180 TOTAL 1587 1567 1517 1573 1554 299
Sources: Ministry of Mines & Energy: Salt companies: Rössing uranium * Preliminary figures 6.2.3 Manufacturing 6.2.3.1 Food Processing There is little actual food processing done in the coastal region. Being a desert region with minimal agricultural production, not more than is shown in Table 6.6 can be expected. Labour layoffs [seasonal or because of reduced annual quotas] from the fishing industry tend to reduce overall consumption ability within the region, even upon survival goods. The reduced demand is reflected in layoffs from the few industries which exist. TABLE 6.6 FOOD PROCESSING: TOTAL EMPLOYMENT
1994 1995 1996 1997 1998 1999 * DAIRYING 19 19 19 15 12 16 MEAT PROC 13 14 16 12 9 12 BAKING 19 19 20 17 15 15 BREWING 150 150 150 150 150 150 TOTALS 201 202 205 194 186 193
Sources: Companies direct (* preliminary figures) 6.2.3.2 The Export Processing Zone In some quarters, the EPZ is regarded as a success but economically speaking, it is yielding less than some people might have been expected by way of employment generation. However, there is indeed, a growth tendency as evidenced by the figures below.
PDF created with pdfFactory trial version www.pdffactory.com

Coastal Profile of the Erongo Region - August 1999 116
TABLE 6.7 EPZ ZONE: TOTAL EMPLOYMENT
No. of Companies 1995 1996 1997 1998 1999 * 5 [in 1998] n/a 350 550 780 660
Source: EPZ Management Company (* preliminary figures) 6.2.3.3 Other Manufacturing It is clear that three factors have militated against extensive industrialisation and manufacturing in the coastal region of Namibia. Firstly, there is the perennial problem of water, the current supplies of which cannot now and could not in the past, support an extensive industrialisation programme (this problem might be overcome in the future though with the construction of the desalination plant in Swakopmund); secondly, the market is far away even considering the close proximity of Walvis Bay and Swakopmund to the major shipping lines; thirdly, there has been an excessive development and labour focus upon the fishing industry with only a minimal focus on other types of industrialisation. By far the greater part of the industries which do exist at the coast are either secondary or tertiary suppliers to the fishing industry. TABLE 6.8 OTHER MANUFACTURING: TOTAL EMPLOYMENT
1994 1995 1996 1997 1998 TANNING 60 60 60 60 60 CLOTHING 23 15 23 17 19 PACKAGING 31 9 43 38 35 CAN FACTORY 96 127 119 121 128 TOTAL 210 253 244 236 242
Sources: Companies direct TABLE 6.9 TOTAL MANUFACTURING: TOTAL EMPLOYMENT
1994 1995 1996 1997 1998 FOOD 201 202 201 194 186 OTHER 210 253 244 236 242 EPZ n/a n/a 350 550 780 TOTAL 411 455 795 980 1208
Source: Derived from Tables (iv)(a), (iv)(b) and (iv)(c). 6.2.4 Electricity and Water The primary distribution of electricity within the Region is done by NAMPOWER and that of water by NAMWATER - both of which are semi-state corporations. After the primary distribution, the further reticulation of both electricity and water is the responsibility of Municipalities which provide and maintain the distribution networks.
PDF created with pdfFactory trial version www.pdffactory.com

Coastal Profile of the Erongo Region - August 1999 117
TABLE 6.10 ELECTRICITY & WATER: TOTAL EMPLOYMENT
1994 1995 1996 1997 1998 TOTAL ELECTRIC 72 77 79 86 87 TOTAL WATER 90 98 102 110 106
Source: Municipalities of Walvis Bay; Swakopmund; Henties Bay and Arandis 6.2.5 Construction The construction industry is one of the better indicators of economic fluctuations and of economic well- being and is also one of the first to react to changing economic conditions. Construction, whether of physical infrastructure or urban expansion, also has direct implications for environmental management. TABLE 6.11 CONSTRUCTION: TOTAL EMPLOYMENT
1994 1995 1996 1997 1998 SWAKOPMUND 179 188 171 165 168 WALVIS BAY 216 222 223 216 206 TOTAL 395 410 394 381 374
Source: Construction companies direct 6.2.6 Accommodation And Catering Accommodation is the third biggest employer in the coastal region, accounting for some 10% of the employment of economically active people.
Data obtained from the Hospitality Association of Namibia reveals that there are 6 hotels in Walvis Bay; 14 in Swakopmund and 1 in Henties Bay. In Walvis Bay there are few bed & breakfast establishments but in Swakopmund, there are 16. There are 10 restaurants in Walvis Bay; 11 in Swakopmund and 5 in Henties Bay. Only those in Swakopmund report a steady demand throughout the year for this service. TABLE 6.12 ACCOMMODATION & CATERING: TOTAL EMPLOYMENT
1994 1995 1996 1997 1998 1999 * Hospitality Assoc. 1970 2050 2140 2040 2098 2066 Bed & Breakfast Assoc. n/a 25 32 32 34 Restaurants etc 55 59 51 55 77 89 TOTALS 2025 2109 2216 2127 2207 2189
Sources: As noted above. (* preliminary figures) 6.2.7 Transport And Communications Transport has been included simply because of the assumed effect which large numbers of heavy carriers which have begun to use the Walvis Bay/Swakopmund corridor since the opening of the Trans-Kalahari highway. The effect of the increase
PDF created with pdfFactory trial version www.pdffactory.com
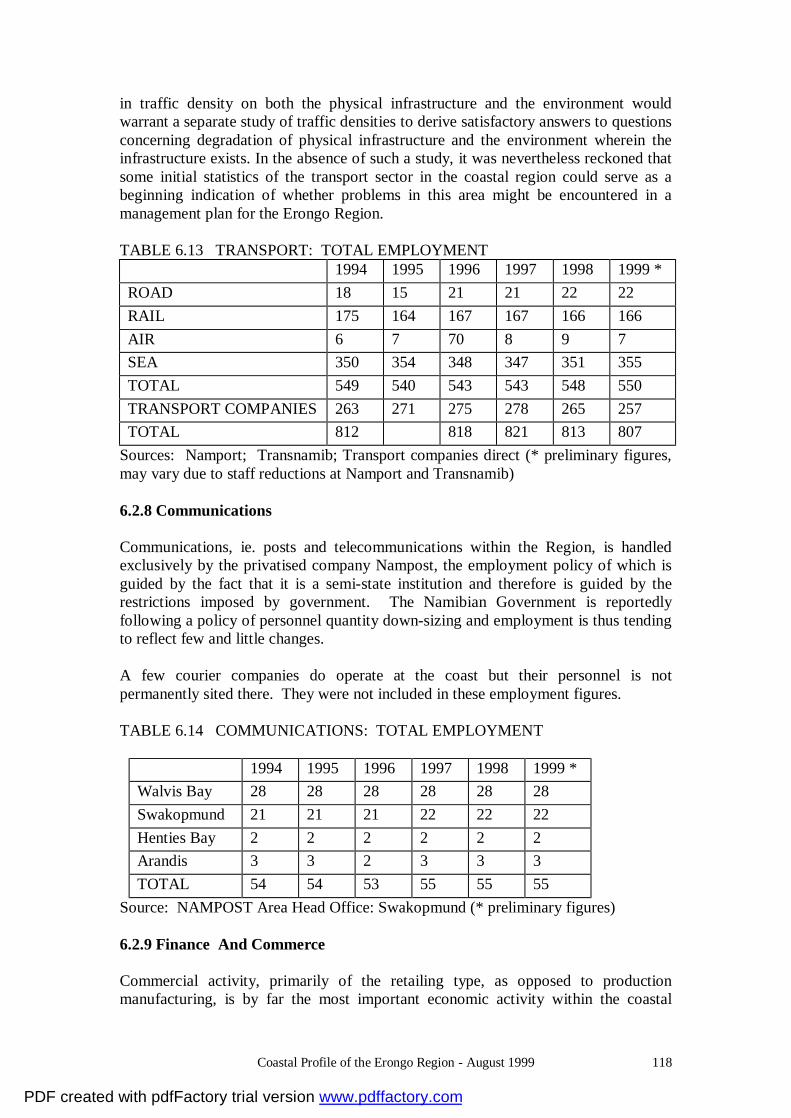
Coastal Profile of the Erongo Region - August 1999 118
in traffic density on both the physical infrastructure and the environment would warrant a separate study of traffic densities to derive satisfactory answers to questions concerning degradation of physical infrastructure and the environment wherein the infrastructure exists. In the absence of such a study, it was nevertheless reckoned that some initial statistics of the transport sector in the coastal region could serve as a beginning indication of whether problems in this area might be encountered in a management plan for the Erongo Region. TABLE 6.13 TRANSPORT: TOTAL EMPLOYMENT 1994 1995 1996 1997 1998 1999 * ROAD 18 15 21 21 22 22 RAIL 175 164 167 167 166 166 AIR 6 7 70 8 9 7 SEA 350 354 348 347 351 355 TOTAL 549 540 543 543 548 550 TRANSPORT COMPANIES 263 271 275 278 265 257 TOTAL 812 818 821 813 807
Sources: Namport; Transnamib; Transport companies direct (* preliminary figures, may vary due to staff reductions at Namport and Transnamib) 6.2.8 Communications Communications, ie. posts and telecommunications within the Region, is handled exclusively by the privatised company Nampost, the employment policy of which is guided by the fact that it is a semi-state institution and therefore is guided by the restrictions imposed by government. The Namibian Government is reportedly following a policy of personnel quantity down-sizing and employment is thus tending to reflect few and little changes.
A few courier companies do operate at the coast but their personnel is not permanently sited there. They were not included in these employment figures. TABLE 6.14 COMMUNICATIONS: TOTAL EMPLOYMENT
1994 1995 1996 1997 1998 1999 * Walvis Bay 28 28 28 28 28 28 Swakopmund 21 21 21 22 22 22 Henties Bay 2 2 2 2 2 2 Arandis 3 3 2 3 3 3 TOTAL 54 54 53 55 55 55
Source: NAMPOST Area Head Office: Swakopmund (* preliminary figures) 6.2.9 Finance And Commerce
Commercial activity, primarily of the retailing type, as opposed to production manufacturing, is by far the most important economic activity within the coastal
PDF created with pdfFactory trial version www.pdffactory.com

Coastal Profile of the Erongo Region - August 1999 119
region. It accounts for the second greatest employment of people. In 1997, excluding 101 fishing companies and 8 identifiable manufacturers, there were 2142 registered commercial businesses in Walvis Bay, nearly all of which were retail outlets. Excluding 9 manufacturers, there were 483 businesses registered in Swakopmund and there were 14 businesses in Henties Bay. Arandis had merely 4 retail shops, 1 bottle store and a motor garage [one clothing company registered as an EPZ had closed down, [reportedly because of interference from Customs & Excise]. In order to ascertain the extent of economically active people in commercial and industrial activities within the project area, the information kept by the Walvis Bay and Swakopmund Chambers of Commerce was examined. This data dates from the early 1990's and shows a small annual growth of 3.5% in Walvis Bay until the end of 1995 when a decline of 3.8% per annum set in. Growth in the same period was 1.7% in Swakopmund after which a 1.2% decline was observed.
This data is the most up-to-date available on the physical number of operating businesses and the only usable source of current employment data. The single most significant aspect of commercial activities is the high number of one-man businesses, which employ, including the owner, not more than three persons. An examination of the lists of business registrations in Walvis Bay and Swakopmund revealed that 77% of businesses in the former are one-man and 91% in the latter. One unfortunate aspect of the data was the large number of small one-person businesses which did not keep past records of employment. It was therefore decided to make use of data from only those businesses which did so. This resulted in a sample of 55% from Walvis Bay and 75% from Swakopmund which was considered sufficient to give a good representation of the status of such activity within the region.
An element of the economy of the region which perhaps deserves closer examination is the phenomenon of many companies and businesses reporting fixed employment figures over relatively long periods. Many business people and the Chambers of Commerce attribute this to a lack of expansion potential of industry and commerce in the coastal regions because of the small size of the domestic market; in other cases, it was noted by business people that a secure and stable workforce is a natural counter to trades-union action which is seen as disruptive of business and and the economy. TABLE 6.15 COMMERCE: TOTAL EMPLOYMENT ( * preliminary figures)
1994 1995 1996 1997 1998 1999 * WALVIS BAY 4447 4608 4478 4352 4230 unknown SWAKOPMUND 1273 1270 1267 1264 1103 HENTIES BAY 56 40 41 52 49 44 ARANDIS 86 109 131 34 44 36 TOTAL 5841 6030 5920 5705 5587 1183
Sources: Walvis Bay and Swakopmund Chambers of Commerce Businesses direct
PDF created with pdfFactory trial version www.pdffactory.com
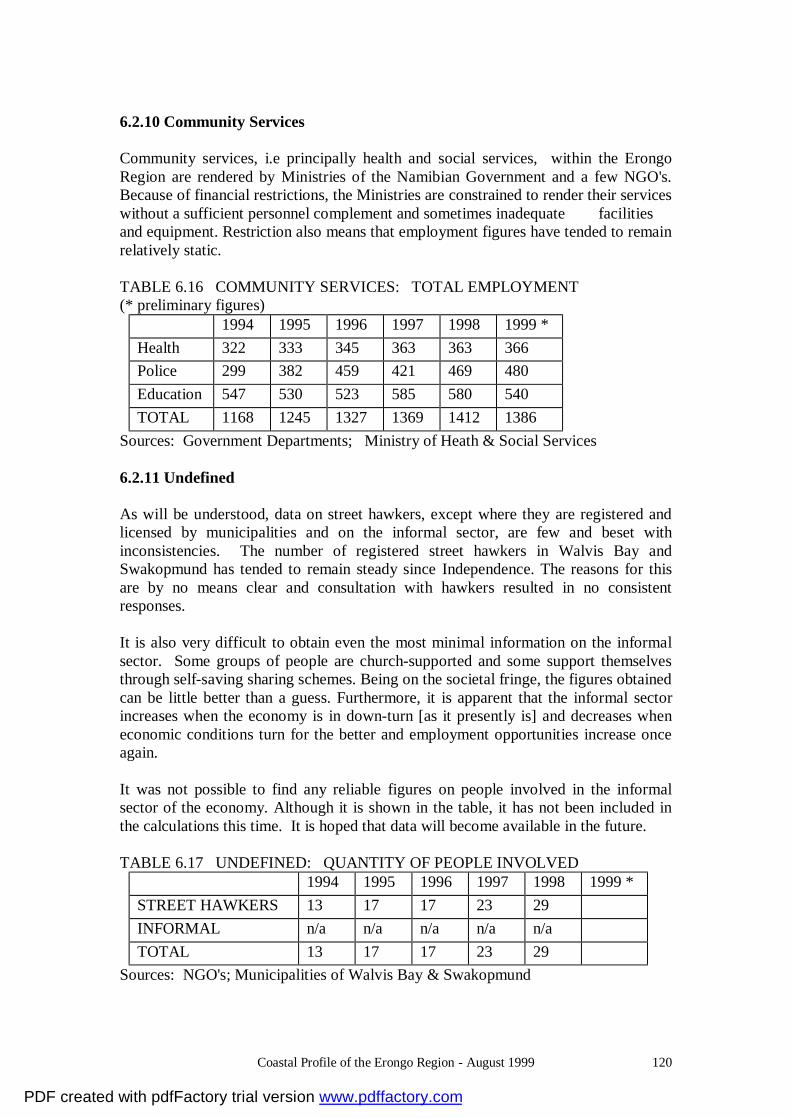
Coastal Profile of the Erongo Region - August 1999 120
6.2.10 Community Services Community services, i.e principally health and social services, within the Erongo Region are rendered by Ministries of the Namibian Government and a few NGO's. Because of financial restrictions, the Ministries are constrained to render their services without a sufficient personnel complement and sometimes inadequate facilities and equipment. Restriction also means that employment figures have tended to remain relatively static.
TABLE 6.16 COMMUNITY SERVICES: TOTAL EMPLOYMENT (* preliminary figures)
1994 1995 1996 1997 1998 1999 * Health 322 333 345 363 363 366 Police 299 382 459 421 469 480 Education 547 530 523 585 580 540 TOTAL 1168 1245 1327 1369 1412 1386
Sources: Government Departments; Ministry of Heath & Social Services 6.2.11 Undefined As will be understood, data on street hawkers, except where they are registered and licensed by municipalities and on the informal sector, are few and beset with inconsistencies. The number of registered street hawkers in Walvis Bay and Swakopmund has tended to remain steady since Independence. The reasons for this are by no means clear and consultation with hawkers resulted in no consistent responses. It is also very difficult to obtain even the most minimal information on the informal sector. Some groups of people are church-supported and some support themselves through self-saving sharing schemes. Being on the societal fringe, the figures obtained can be little better than a guess. Furthermore, it is apparent that the informal sector increases when the economy is in down-turn [as it presently is] and decreases when economic conditions turn for the better and employment opportunities increase once again. It was not possible to find any reliable figures on people involved in the informal sector of the economy. Although it is shown in the table, it has not been included in the calculations this time. It is hoped that data will become available in the future. TABLE 6.17 UNDEFINED: QUANTITY OF PEOPLE INVOLVED
1994 1995 1996 1997 1998 1999 * STREET HAWKERS 13 17 17 23 29 INFORMAL n/a n/a n/a n/a n/a TOTAL 13 17 17 23 29
Sources: NGO's; Municipalities of Walvis Bay & Swakopmund
PDF created with pdfFactory trial version www.pdffactory.com

Coastal Profile of the Erongo Region - August 1999 121
6.2.11 Tourism The tourism industry would seem to be the most viable in the Region and possibly where the greatest growth might take place in the future. Severe declines in the exchange value of the Namibia Dollar has made the region even more attractive than it was in the past and accounts for the increases in foreign tourists between 1994 and 1996. Additionally, Namibia and the Erongo Region has become more attractive to visitors from the Southern African region because visits abroad have become more expensive. TABLE 6.18 TOURISM: VISITORS PER ANNUM
1994 1995 1996 1997 1998 FOREIGN 53016 72735 72808 65225 45986 LOCAL 37500 62658 67714 12922 14517 TOTAL 90516 135393 140522 78147 60503
Source: Ministry of Environment & Tourism 6.2.12 Transport: Goods Handled The reason for the inclusion of this data set is the obvious effect which transport demand and utilisation has upon the transport route format and the traffic density which results from an increasing demand. It is clear that any increase in goods handled will imply a greater utilisation of the particular transport type utilised and vice versa. Rising transport usage also implies a potentially greater impact upon the surrounding environment. In the case of roads for example, it leads to surface degradation and the need for greater maintenance. The effect of increased exhaust gas emissions is beyond the scope of this economic profile but this may point to a need to have such a scientific study undertaken.
TABLE 6.19 GOODS HANDLED (Figure in tonnes)
1994 1995 1996 1997 1998 ROAD RAIL AIR SEA Dry 1 184 292 1 227 487 1 186 528 1 145 699 Petroleum 435 384 580 059 719 414 676 675 Containers 19 369 20 050 23 109 21 370
Sources: Namport; Transnamib; Namib Air. 6.2.13 Industrial Water Consumption Industrial water consumption is a measure of changing demand for the scarce resource of water. It also reflects changing economic conditions in the coastal region and as such, confirms the economic cycle.
PDF created with pdfFactory trial version www.pdffactory.com
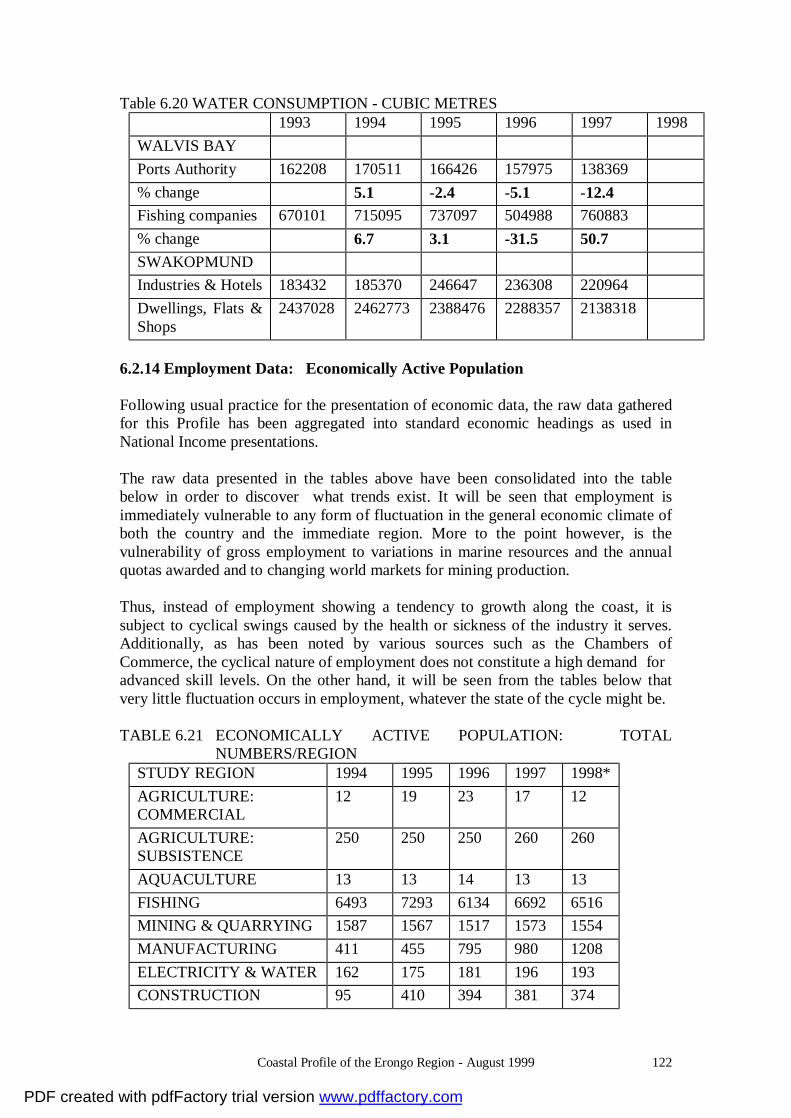
Coastal Profile of the Erongo Region - August 1999 122
Table 6.20 WATER CONSUMPTION - CUBIC METRES 1993 1994 1995 1996 1997 1998 WALVIS BAY Ports Authority 162208 170511 166426 157975 138369 % change 5.1 -2.4 -5.1 -12.4 Fishing companies 670101 715095 737097 504988 760883 % change 6.7 3.1 -31.5 50.7 SWAKOPMUND Industries & Hotels 183432 185370 246647 236308 220964 Dwellings, Flats & Shops
2437028 2462773 2388476 2288357 2138318
6.2.14 Employment Data: Economically Active Population Following usual practice for the presentation of economic data, the raw data gathered for this Profile has been aggregated into standard economic headings as used in National Income presentations.
The raw data presented in the tables above have been consolidated into the table below in order to discover what trends exist. It will be seen that employment is immediately vulnerable to any form of fluctuation in the general economic climate of both the country and the immediate region. More to the point however, is the vulnerability of gross employment to variations in marine resources and the annual quotas awarded and to changing world markets for mining production. Thus, instead of employment showing a tendency to growth along the coast, it is subject to cyclical swings caused by the health or sickness of the industry it serves. Additionally, as has been noted by various sources such as the Chambers of Commerce, the cyclical nature of employment does not constitute a high demand for advanced skill levels. On the other hand, it will be seen from the tables below that very little fluctuation occurs in employment, whatever the state of the cycle might be. TABLE 6.21 ECONOMICALLY ACTIVE POPULATION: TOTAL
NUMBERS/REGION STUDY REGION 1994 1995 1996 1997 1998* AGRICULTURE: COMMERCIAL
12 19 23 17 12
AGRICULTURE: SUBSISTENCE
250 250 250 260 260
AQUACULTURE 13 13 14 13 13 FISHING 6493 7293 6134 6692 6516 MINING & QUARRYING 1587 1567 1517 1573 1554 MANUFACTURING 411 455 795 980 1208 ELECTRICITY & WATER 162 175 181 196 193 CONSTRUCTION 95 410 394 381 374
PDF created with pdfFactory trial version www.pdffactory.com
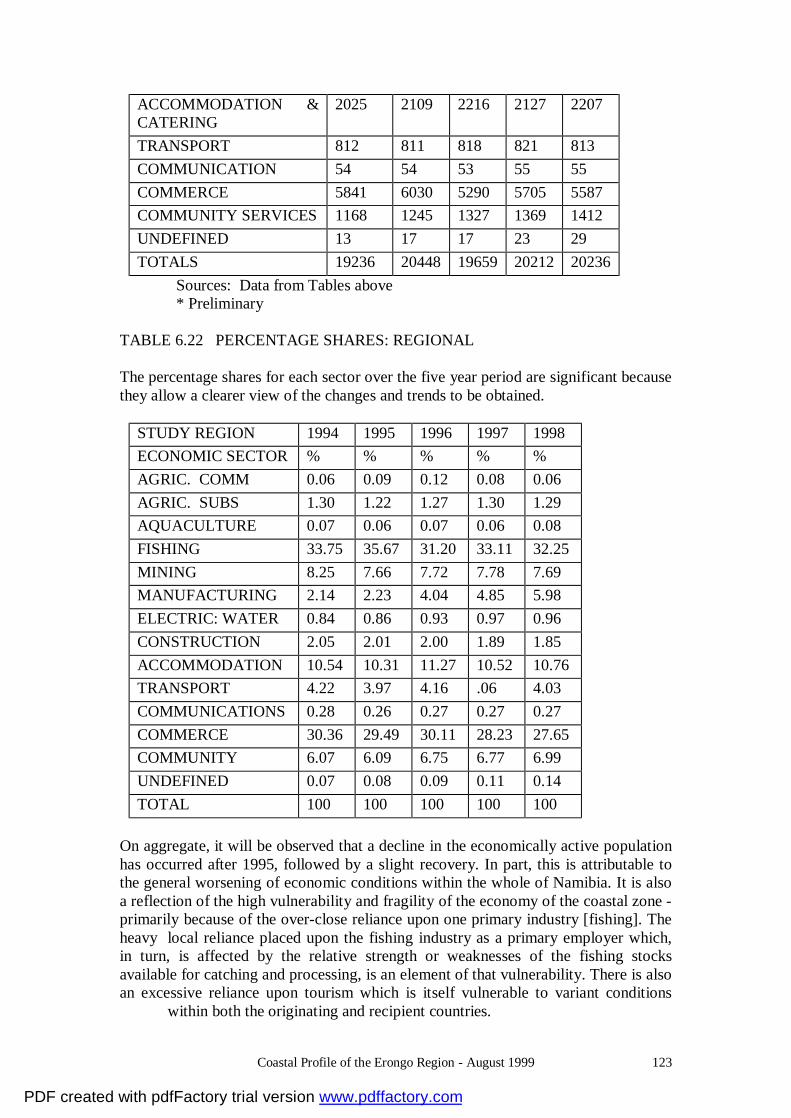
Coastal Profile of the Erongo Region - August 1999 123
ACCOMMODATION & CATERING
2025 2109 2216 2127 2207
TRANSPORT 812 811 818 821 813 COMMUNICATION 54 54 53 55 55 COMMERCE 5841 6030 5290 5705 5587 COMMUNITY SERVICES 1168 1245 1327 1369 1412 UNDEFINED 13 17 17 23 29 TOTALS 19236 20448 19659 20212 20236
Sources: Data from Tables above * Preliminary
TABLE 6.22 PERCENTAGE SHARES: REGIONAL The percentage shares for each sector over the five year period are significant because they allow a clearer view of the changes and trends to be obtained.
STUDY REGION 1994 1995 1996 1997 1998 ECONOMIC SECTOR % % % % % AGRIC. COMM 0.06 0.09 0.12 0.08 0.06 AGRIC. SUBS 1.30 1.22 1.27 1.30 1.29 AQUACULTURE 0.07 0.06 0.07 0.06 0.08 FISHING 33.75 35.67 31.20 33.11 32.25 MINING 8.25 7.66 7.72 7.78 7.69 MANUFACTURING 2.14 2.23 4.04 4.85 5.98 ELECTRIC: WATER 0.84 0.86 0.93 0.97 0.96 CONSTRUCTION 2.05 2.01 2.00 1.89 1.85 ACCOMMODATION 10.54 10.31 11.27 10.52 10.76 TRANSPORT 4.22 3.97 4.16 .06 4.03 COMMUNICATIONS 0.28 0.26 0.27 0.27 0.27 COMMERCE 30.36 29.49 30.11 28.23 27.65 COMMUNITY 6.07 6.09 6.75 6.77 6.99 UNDEFINED 0.07 0.08 0.09 0.11 0.14 TOTAL 100 100 100 100 100
On aggregate, it will be observed that a decline in the economically active population has occurred after 1995, followed by a slight recovery. In part, this is attributable to the general worsening of economic conditions within the whole of Namibia. It is also a reflection of the high vulnerability and fragility of the economy of the coastal zone - primarily because of the over-close reliance upon one primary industry [fishing]. The heavy local reliance placed upon the fishing industry as a primary employer which, in turn, is affected by the relative strength or weaknesses of the fishing stocks available for catching and processing, is an element of that vulnerability. There is also an excessive reliance upon tourism which is itself vulnerable to variant conditions within both the originating and recipient countries.
PDF created with pdfFactory trial version www.pdffactory.com
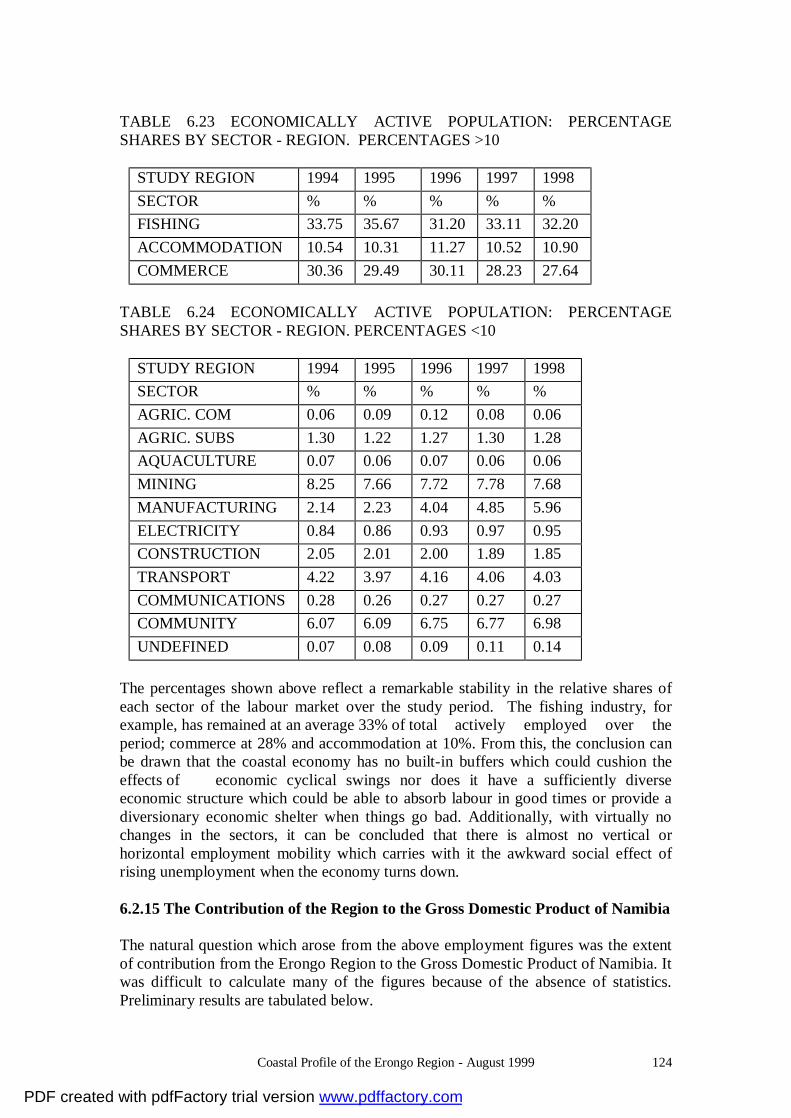
Coastal Profile of the Erongo Region - August 1999 124
TABLE 6.23 ECONOMICALLY ACTIVE POPULATION: PERCENTAGE SHARES BY SECTOR - REGION. PERCENTAGES >10
STUDY REGION 1994 1995 1996 1997 1998 SECTOR % % % % % FISHING 33.75 35.67 31.20 33.11 32.20 ACCOMMODATION 10.54 10.31 11.27 10.52 10.90 COMMERCE 30.36 29.49 30.11 28.23 27.64
TABLE 6.24 ECONOMICALLY ACTIVE POPULATION: PERCENTAGE SHARES BY SECTOR - REGION. PERCENTAGES <10
STUDY REGION 1994 1995 1996 1997 1998 SECTOR % % % % % AGRIC. COM 0.06 0.09 0.12 0.08 0.06 AGRIC. SUBS 1.30 1.22 1.27 1.30 1.28 AQUACULTURE 0.07 0.06 0.07 0.06 0.06 MINING 8.25 7.66 7.72 7.78 7.68 MANUFACTURING 2.14 2.23 4.04 4.85 5.96 ELECTRICITY 0.84 0.86 0.93 0.97 0.95 CONSTRUCTION 2.05 2.01 2.00 1.89 1.85 TRANSPORT 4.22 3.97 4.16 4.06 4.03 COMMUNICATIONS 0.28 0.26 0.27 0.27 0.27 COMMUNITY 6.07 6.09 6.75 6.77 6.98 UNDEFINED 0.07 0.08 0.09 0.11 0.14
The percentages shown above reflect a remarkable stability in the relative shares of each sector of the labour market over the study period. The fishing industry, for example, has remained at an average 33% of total actively employed over the period; commerce at 28% and accommodation at 10%. From this, the conclusion can be drawn that the coastal economy has no built-in buffers which could cushion the effects of economic cyclical swings nor does it have a sufficiently diverse economic structure which could be able to absorb labour in good times or provide a diversionary economic shelter when things go bad. Additionally, with virtually no changes in the sectors, it can be concluded that there is almost no vertical or horizontal employment mobility which carries with it the awkward social effect of rising unemployment when the economy turns down. 6.2.15 The Contribution of the Region to the Gross Domestic Product of Namibia The natural question which arose from the above employment figures was the extent of contribution from the Erongo Region to the Gross Domestic Product of Namibia. It was difficult to calculate many of the figures because of the absence of statistics. Preliminary results are tabulated below.
PDF created with pdfFactory trial version www.pdffactory.com
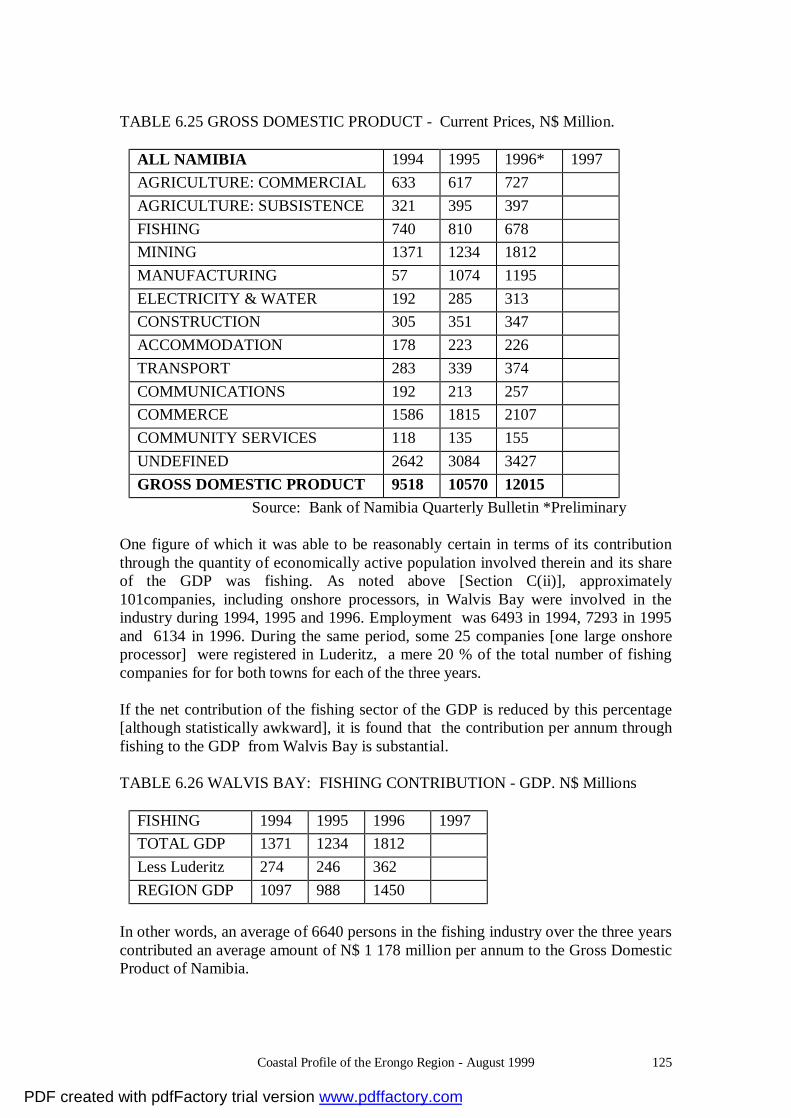
Coastal Profile of the Erongo Region - August 1999 125
TABLE 6.25 GROSS DOMESTIC PRODUCT - Current Prices, N$ Million.
ALL NAMIBIA 1994 1995 1996* 1997 AGRICULTURE: COMMERCIAL 633 617 727 AGRICULTURE: SUBSISTENCE 321 395 397 FISHING 740 810 678 MINING 1371 1234 1812 MANUFACTURING 57 1074 1195 ELECTRICITY & WATER 192 285 313 CONSTRUCTION 305 351 347 ACCOMMODATION 178 223 226 TRANSPORT 283 339 374 COMMUNICATIONS 192 213 257 COMMERCE 1586 1815 2107 COMMUNITY SERVICES 118 135 155 UNDEFINED 2642 3084 3427 GROSS DOMESTIC PRODUCT 9518 10570 12015
Source: Bank of Namibia Quarterly Bulletin *Preliminary One figure of which it was able to be reasonably certain in terms of its contribution through the quantity of economically active population involved therein and its share of the GDP was fishing. As noted above [Section C(ii)], approximately 101companies, including onshore processors, in Walvis Bay were involved in the industry during 1994, 1995 and 1996. Employment was 6493 in 1994, 7293 in 1995 and 6134 in 1996. During the same period, some 25 companies [one large onshore processor] were registered in Luderitz, a mere 20 % of the total number of fishing companies for for both towns for each of the three years. If the net contribution of the fishing sector of the GDP is reduced by this percentage [although statistically awkward], it is found that the contribution per annum through fishing to the GDP from Walvis Bay is substantial. TABLE 6.26 WALVIS BAY: FISHING CONTRIBUTION - GDP. N$ Millions
FISHING 1994 1995 1996 1997 TOTAL GDP 1371 1234 1812 Less Luderitz 274 246 362 REGION GDP 1097 988 1450
In other words, an average of 6640 persons in the fishing industry over the three years contributed an average amount of N$ 1 178 million per annum to the Gross Domestic Product of Namibia.
PDF created with pdfFactory trial version www.pdffactory.com

Coastal Profile of the Erongo Region - August 1999 126
Time constraints did not allow a broader assessment of the contributions made by all regional/coastal sectors to the GDP of Namibia. 6.3 BUSINESS SERVICES: 6.3.1 Desalination Plant A desalination plant is proposed by Namwater at the existing base station ±3 km outside Swakopmund between the airport and the Swakopmund River. The purpose of the desalination plant will be to contribute to the bulk water supply to the coastal towns and therefore limit the extraction from the natural aquifers to sustainable amounts. Namwater has begun with the tendering process as well as with the financial agreements with the various bulk users in the area. Construction should start during the second half of 1999 with the first desalinated water produced by September 2000. During the construction and operational phases local entrepreneurs will be used. 6.3.2 Bulk Water Supply Namwater conducts bulk water supply to the various bulk users in the study area. The Bulk water supply is generated by the Omdel and Kuiseb River aquifers and transported via various reservoirs and pipelines between Henties Bay, Walvis Bay and Arandis. Namwater is a parastatal operating on the principle of full cost recovery. The price increase to the coastal bulk users are therefore expected to increase by ± 150 – 200 % within the next five years due to the high cost incurred in the existing systems and with the proposed desalination plant. The economic implications of this rapid increase in bulk water tariffs has still to be investigated but it could be expected to have a large influence on the various sectors of the economy which are dependant on large amounts of fresh water such as the fishing, building and construction industries. 6.3.3 Export Processing Zone The establishment of the EPZ industries and companies in Namibia are ways in combatting constraints which currently influence the economic development of the industrial sector. Companies in the EPZ receive generous incentives geared towards training of Namibians. In order to qualify for EPZ status a company must export to markets outside the SACU, earn foreign currency and employ Namibians. The various tax incentives are : • corporate tax, • import duties, • sales tax, and • stamp and transfer duties. The non-tax incentives are grants for training costs, companies are allowed to hold foreign currency in local banks and no labour strikes are allowed in the EPZ companies.(Finance Week, Sep 1998, p54)
PDF created with pdfFactory trial version www.pdffactory.com

Coastal Profile of the Erongo Region - August 1999 127
The institutional infrastructure is strengthened by the Offshore Development Company. The major drawbacks are a lack of trained labour and bureaucratic red tape. The expansion of the manufacturing sector is restricted by a small domestic market, high transportation costs, and membership to the Southern African Customs Union. In the Customs Union South African companies have the competitive edge due to subsidies and the economy of scale. The tariffs on imports make it difficult to import from competitive sources. In contrast to other African economies only 12 % of the workers are employed in small enterprises of less than 10 workers. The majority, 66%, are employed in large (50 or more workers) enterprises. (NEPRU, Namibian Economy, 1998, p9) 6.4 TRANSPORT 6.4.1 Road transport 6.4.1.1 Walvis Bay The main accesses to Walvis Bay consist of: • the main bitumen road TR 2/1 (B2) linking Swakopmund and Walvis Bay along
the coast, • the gravel road DR 1982 (C14) linking Windhoek and Walvis Bay via the Khomas
Hochland, • District Road D1984 behind the dunes to the west of the railway line that serves as
a service road to Namwater, Nampower and Transnamib. The Department of Transport has identified the need for a new bitumen surface road behind the dunes and parallel to the railway line. A route to the east of the railway line is preferred to avoid costly road over rail bridges. The road behind the dunes road is listed in the National Development Plan, the five year planning horizon. The construction of the road will depend on the availability of funds from government and foreign donors. The establishment of a road behind the dunes will require the following proclamation actions: • proclamation of the new road as TR 2/1 (B2) with a 60 m road reserve, • district road 1984 must be deproclaimed, • the existing coastal road, TR 2/1 will be reproclaimed as a district road. The new main road behind the dunes will be proclaimed up to the 18th Road circle and will be the through route with DR 1982 linking to the road with a T-junction. The detailed planning of the heavy industrial area behind the dunes must therefore be done in co-operation with the Department of Transport to ensure proper linkages with the main road and the possible new access road to the airport. In order to provide the proposed heavy industrial area with both rail and road access the industries should be located between the existing railway line and the proposed road behind the dunes.
PDF created with pdfFactory trial version www.pdffactory.com

Coastal Profile of the Erongo Region - August 1999 128
External traffic enters Walvis Bay mainly via the coastal road. This road (B2) provides access to Kuisebmond and Narraville. To gain access to the CBD 18th Road, Sam Nujoma Avenue, Union Street or 13th Road must be followed. To reduce the future traffic volumes on the B2 and to provide a more direct access to the CBD the re-opening of the old entrance to Walvis Bay is recommended. This route will start some 3 km from the northern breakwater and follow the abandoned road reserve to link up with Sam Nujoma Avenue. This new access route will link the high density node in Kuisebmond with the CBD. The coastal road will remain the proclaim main access road to Walvis Bay until the road behind the dunes is constructed. The area between Kuisebmond and Narraville could therefore be developed as the main access into Walvis Bay will be the extension of Sam Nujoma Avenue and 18th Road. The Department of Transport has determined a site for a weigh bridge at the traffic circle where the District Road DR 1982 terminates. The proposed extension of Sam Nujoma Avenue will not serve the interest of the Department in the short term until the road behind the dunes in constructed. All heavy vehicles will use the road behind the dunes and will travel past the weigh bridge. 6.4.1.2 Swakopmund The majority of the roads in Swakopmund are gypsum/gravel roads that tend to become very slippery in the moist conditions. As a result of these moist conditions, the condition of the roads are poor in relation to the tarred roads. Since some of these roads (specifically Südring and Nördring Streets) are used by heavy vehicles travelling through to Walvis Bay, their conditions deteriorate even quicker. The municipality of Swakopmund is however in the process of tarring all roads by 2006 (Namib Times 27 March 98). In order to alleviate the problem of heavy vehicle traffic through town, a by-pass is proposed. This by-pass will be on the outskirts of town, behind the suburb of Kramersdorf ton the south where it connects with the road to Walvis Bay and behind Mondesa and Tamariskia in the east where it will connect with the road to Henties Bay (C34). The proposed by-pass will define the edge of the town. Gypsum/gravel cause buildings to erode quicker. Another problem associated with the roads is the large road reserves required for main roads. By de-proclaiming the main road (C34) through town, the land can be used more efficiently to integrate the town. The one-way system that is currently being used in the town centre was introduced during 1989. The reason for the one-way system was that there was parking problems within the town centre as well as problems with the traffic flow. The Town Council then introduced the following one-way streets: - Moltke Street – from north to south between Post and Brücken Street. - Roon Street – from south to north between Brücken and Post Street. - Woermann Street – from west to east.
PDF created with pdfFactory trial version www.pdffactory.com

Coastal Profile of the Erongo Region - August 1999 129
6.4.2 Air transport 6.4.2.1 Walvis Bay Walvis Bay International Airport is situated 11km to the east of town. It was formerly known as Rooikop Airport and was used for military purposes as well. The airport became known as Walvis Bay International Airport with integration. The width of the runway is also to be increased from 30m to 60m. The air traffic at the airport is increasing by 5% per month and passenger handling by 13% per annum (Namib Times 18 November 1997). To date 90 aircraft per week make use of the airport. That amounts to approximately 360 aircraft per month and 4320 per year. The privatisation of the airport has been finalised and it entails the Walvis Bay International Airport falling under the jurisdiction of the Namibian Airports Company which is part of the Ministry of Works, Transport and Communications 2000 project. Officials at the Ministry of Works, Transport and Communication (MWTC) are planning to upgrade the existing aerodrome to accommodate wide-bodied trans-continental aircraft such as the Boeing 747. Some N$ 43 million is to be used to rehabilitate the existing runway, extend and widen it to about 3,440 metres and install landing requirements for Boeing 747-400 aircraft. This would turn Walvis Bay into another international airport in southern Africa. Other improvements include the provision of turning circles at both thresholds as well as an apron with freight handling facilities. A deviation of the airport road, re-location of small aircraft hangers, security fencing and lighting also form part of the extension project. Walvis Bay airport manager, Ben Diergaardt, indicates that once the rehabilitation is completed, the airport will allow fresh fish which presently averages 15,000 tonnes annually, to be exported directly to overseas markets. This will reduce the cost of transporting and preserving the quality of fish. Presently, the fish is transported by road to Windhoek and Johannesburg airports, respectively, from where it is flown to markets in Europe. A DC 8, a medium sized chartered aircraft is currently being used to export about 40 tonnes of fresh fish per week from Walvis Bay airport to Europe. Diergaardt estimates 100 tonnes would be exported per week after the airport's extension. Local authorities expect the upgraded Walvis Bay airport and Namibia Ports Authority (Namport) to serve as a natural gateway for global trade for central and southern Africa. (CNN Interactive, Africa News Service 22/09/98)
PDF created with pdfFactory trial version www.pdffactory.com

Coastal Profile of the Erongo Region - August 1999 130
6.4.2.2 Swakopmund Currently a gravel runway of 1550m (SW; NE) and 900m (SSE;NNW). Used to be regular flights between Swakopmund and Cape Town – was discontinued April 1998 (Namib Times 27 March 1998) due to poor condition of the runway. Council was considering constructing a new runway – not viable at this stage. Fog is problem at airport – reason for directing flights to Walvis Bay instead. Airport currently manned by a municipal employee that is responsible for logging in and collecting landing fees from pilots. He is also responsible for the general administrative duties concerning the airport. Town Council now considering a private caretaker (Namib Times 5 May 98) Sky-diving club at airport as well as small aircraft – private use and tourist flights 6.4.3 Sea transport The Walvis Bay harbour is sheltered from the ocean by the Walvis Bay peninsula and the result is a safe and secure harbour serving the west coast of Africa. The port is a key for the SADC countries to the world markets. The local developments of the Export Processing Zone, the completion of the Trans Kalahari and Trans Caprivi Highways and the establishment of the Walvis Bay Corridor give the harbour great potential. The port is however not deep enough to develop into a viable regional port. The port of Walvis Bay is situated at the south-eastern end of a natural harbour. The port consists of two sections, the Commercial Port and the Fishing Harbour. Approximately 800 ships call at the Port of Walvis Bay per annum, discharging half a million tonnes and loading 650 000 tonnes of dry cargo, while tankers landed in excess of 700 000 tonnes of petroleum products during 1996 (Namport – Feasibility Study for Deepening of Walvis Bay Harbour, October 1997). The turning and harbour basins are both currently dredged to a depth of –10.0m CD. For the port to be developed into a viable regional port, the depth should be –12.8m CD. Consultants for the Namibia Ports Authority conducted a feasibility study for the deepening of the Walvis Bay harbour during 1997 and Namport is currently facilitating the deepening of the harbour. 6.4.4 Rail Transport Construction on the state railway line to Windhoek commenced during September 1897. Goods were transported from the harbour in Swakopmund to Windhoek. In 1903, the Otavi Mine and Railway Company (OMEG) started extracting ore from the copper mine in Tsumeb and needed to provide transport for the ore from the mine to the coast. OMEG decided against making use of the state railway line and preferred to construct their own railway line.
PDF created with pdfFactory trial version www.pdffactory.com

Coastal Profile of the Erongo Region - August 1999 131
The route followed by this railway line was more favourable than the state railway line and the railway was taken over by the government in 1910 (Massmann, 1983). In 1915 the railway line between Walvis Bay and Swakopmund was completed. At first the railway line ran close to the coast with a low bridge across the Swakop River mouth. This bridge was washed away twice until 1935 when a railway bridge was built 5km upstream. With the construction of this bridge, the residents of Swakopmund feared that the traffic would pass directly inland without going through Swakopmund. This dispute was resolved when the System Manager in South West Africa gave his assurance that the train from Walvis Bay to the interior would continue to call at Swakopmund. This explains why Swakopmund has a cul-de-sac station. In 1980 the railway line was moved behind the dunes. The following tables represent the capacity handled by Transnamib in Swakopmund during the past 5 years concerning the imports, exports, local traffic received and local traffic forward. Table 6.27 Imports received at Swakopmund station: Imports (Net Ton) 1993/1994 1994/199
5 1995/1996
1996/1997
1997/1998
Mining: - Coal & Anthracite
33 33
0 0
0 0
0 0
0 0
Building Material: - Cement and slagment - Timber - Misc. building material
12 857 12 448 391 18
12 645 12 544 65 36
12 392 12 315 0 77
10 737 10 680 29 28
8 090 7 694 0 396
Other Traffic: - Explosives - Motor - General
925 125 53 747
435 0 63 372
141 0 15 127
270 1 0 269
274 0 0 274
Container Traffic: - 6-M - 3-M - Mini
433 90 85 258
703 180 213 310
432 88 142 202
287 36 179 72
794 306 170 318
TOTAL IMPORTS (net ton)
14 248 13 783 12 965 11 294 9 158
Container traffic increased since 1993; especially figures of 1996/97 and 1997/98.
Reasons: harbour facilities, roads, and economy
PDF created with pdfFactory trial version www.pdffactory.com
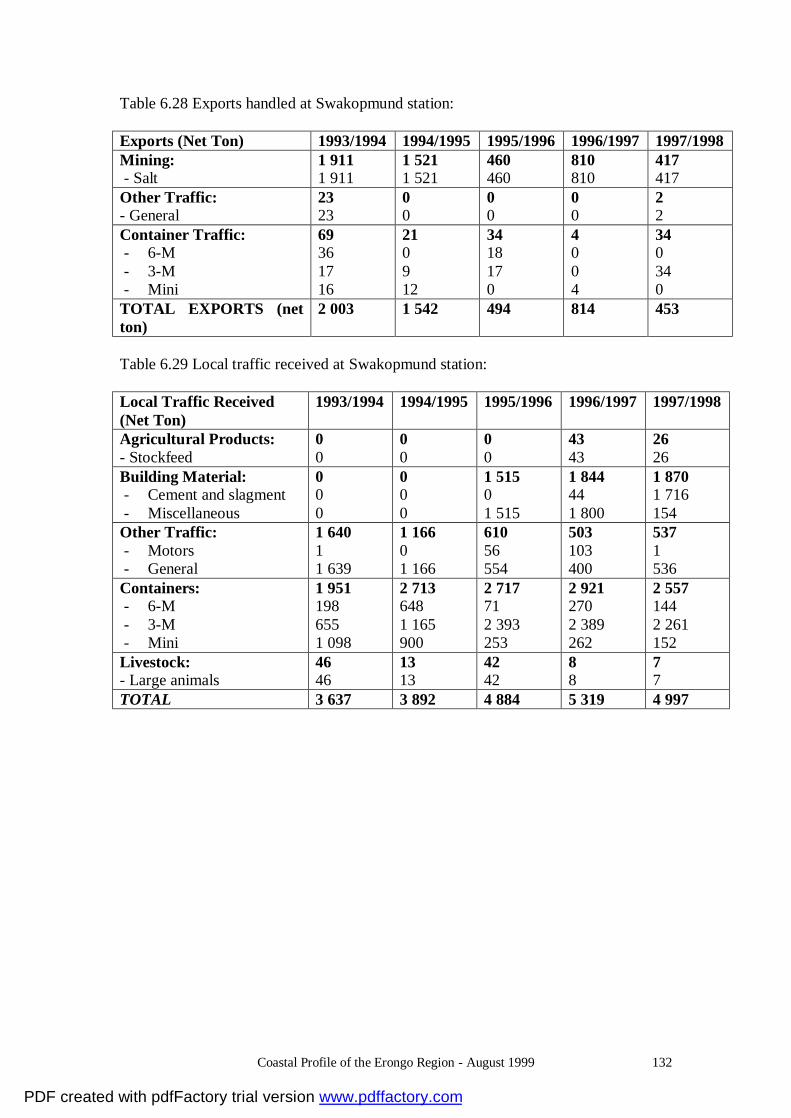
Coastal Profile of the Erongo Region - August 1999 132
Table 6.28 Exports handled at Swakopmund station: Exports (Net Ton) 1993/1994 1994/1995 1995/1996 1996/1997 1997/1998 Mining: - Salt
1 911 1 911
1 521 1 521
460 460
810 810
417 417
Other Traffic: - General
23 23
0 0
0 0
0 0
2 2
Container Traffic: - 6-M - 3-M - Mini
69 36 17 16
21 0 9 12
34 18 17 0
4 0 0 4
34 0 34 0
TOTAL EXPORTS (net ton)
2 003 1 542 494 814 453
Table 6.29 Local traffic received at Swakopmund station: Local Traffic Received (Net Ton)
1993/1994 1994/1995 1995/1996 1996/1997 1997/1998
Agricultural Products: - Stockfeed
0 0
0 0
0 0
43 43
26 26
Building Material: - Cement and slagment - Miscellaneous
0 0 0
0 0 0
1 515 0 1 515
1 844 44 1 800
1 870 1 716 154
Other Traffic: - Motors - General
1 640 1 1 639
1 166 0 1 166
610 56 554
503 103 400
537 1 536
Containers: - 6-M - 3-M - Mini
1 951 198 655 1 098
2 713 648 1 165 900
2 717 71 2 393 253
2 921 270 2 389 262
2 557 144 2 261 152
Livestock: - Large animals
46 46
13 13
42 42
8 8
7 7
TOTAL 3 637 3 892 4 884 5 319 4 997
PDF created with pdfFactory trial version www.pdffactory.com

Coastal Profile of the Erongo Region - August 1999 133
Table 6.30 Local traffic forwarded: Local Traffic Forwarded (Net Ton)
1993/1994 1994/1995 1995/1996 1996/1997 1997/1998
Mining: - Salt to Walvis Bay - Salt to Namibia - Marble
30 924 9 514 21 410 0
41 916 16 567 25 349 0
48 604 15 672 32 933 0
25 186 1 940 23 083 163
39 654 17 461 22 193 0
Building Material: - Miscellaneous
0 0
0 0
27 27
77 77
98 98
Other: - Motors - General
409 3 406
500 1 499
285 4 281
354 0 354
413 0 413
Containers: - 6m - 3m - Mini
1 746 288 272 1 186
3 239 2 016 315 908
3 511 1 819 442 1 250
5 208 2 358 638 2 212
2 771 810 451 1 510
Livestock: - Large animals
18 18
0 0
5 5
3 3
5 5
TOTAL 33 097 45 655 52 433 30 827 42 940
PDF created with pdfFactory trial version www.pdffactory.com
Coastal Profile of the Erongo Region - August 1999 134
7.0 INSTITUTIONAL AND LEGAL FRAMEWORK
7.1 EXISTING INSTITUTIONAL STRUCTURES FOR ENVIRONMENTAL MANAGEMENT The section describes the key institutions which deal with resource, physical planning and environmental management. 7.1.1 Physical and economic planning Integrated physical planning, especially zonation and land-use, is a central instrument in prevention of degradation of landscapes and destruction of habits. Well-known development initiatives in the pipeline in the region are:
• The population of all of the coastal towns is increasing rapidly intensifying the pressure on available resources;
• Industry and transit transport is growing, spurring development especially in the Walvis Bay area;
• Several development projects, including aquaculture farms, are proposed at suitable spots along the entire coast of the Erongo Region;
• Due to expansion of overseas and regional tourism, recreational activities, for instance quad-biking and “dune surfing, are spreading.
• Fish angling along the entire coast of the Erongo Region is increasing. • The construction of the desalination plant is projected to a site either at
Swakopmund or Walvis Bay. The main body dealing with planning at national level is the National Planning Commission. The Commission coordinates and directs national planning, whereas the line ministries are each responsible for own sector planning. Namibia published its first national development plan in 1996: the National Development Plan One (NDP 1: 1995/96-1999/2000). Spatial planning/land use planning at regional level is under the auspices of the Ministry of Regional and Local Government and Housing (MRLGH). Being the administrator of state land, Ministry of Works, Transport and Communication too plays a role in regulating use of government owned land. However, the ministry does not on a regular basis conduct any sort of land-use planning for areas under its administration. Rather, it is consulted by other authorities when these wish to dispose of a certain piece of land. Ministry of Lands, Resettlement & Rehabilitation (MLRR) is in charge of land-use planning for rural areas (communal land), focusing mainly on land reform issues. Ministry of Environment and Tourism has undertaken a few spatial planning exercises, for instance for the Skeleton Coast Park, oriented towards nature conservation. There are two levels of local government: 1 Regional councils, and 2 Local authorities.
PDF created with pdfFactory trial version www.pdffactory.com

Coastal Profile of the Erongo Region - August 1999 135
Regional councils function is twofold: First, through preparation of regional development plans they are co-ordinating central government capital investment in the area. Secondly, regional councils are administering proclaimed settlements which are concentrations of dwellings outside of the boundaries of local authorities. Also here provision is needed for management, control and regulation of “matters pertaining to the welfare of the inhabitants”. Erongo Regional Council administers four settlement areas of which one, Wlotzkasbaken, is situated in the coastal zone. In the ongoing decentralisation thrust, regional councils are intended gradually to play a stronger role in co-ordination and facilitation of public services at regional level. Local authorities, the Namibian Planning Advisory Board (NAMPAB) and the Townships Board are the structures dealing with local planning. The role and autonomy assigned the local authorities depend on their grading in the Local Authorities Act. There are three categories of local authority: 1 Municipalities, 2 Towns, and 3 Villages. Walvis Bay and Swakopmund are part I municipalities, Henties Bay a part II municipality and Arandis is classified as town. Enjoying widespread autonomy, part I municipalities are self-supportive in terms of administration, financing and provision of certain services, although they receive limited financial assistance from the central government for development projects. Most important is establishment and maintenance of infrastructure, including supply of electricity, water and sewage, and development of the erven. Bulk water is bought from Water Affairs (now NamWater), electricity from NamPower etc. Treatment of sewage water and solid waste is the sole responsibility of the municipality too. Provision of education and health facilities is done by the respective ministry, often uncoordinated with locally set priorities. 7.1.1.1 Schemes and plans The legal basis for town planning derives from: The Town Plan Ordinance of 1954, the Townships and Division of Land Ordinance of 1963 and the Local Authorities Act of 1992. While the first prescribe the procedures for Town Planning Schemes (TPS) aimed at securing co-ordinated development of local authority areas, the second gives guidelines for establishment of towns and subdivision of land. The Local Authorities Act determines the powers, functions and duties of the different categories of local authorities. Part II municipalities, towns and villages rely to an increasing degree on the MRLGH for financial support and assistance to carry out planning. For preparation of TPSs, lower level local authorities usually appoint private consultants or depend on the planners of the Ministry. There is no legal provision for a consistent national physical planning practice. Each entity or level of public administration is guided by a separate set of rules and routines applying to their particular area of jurisdiction without any government body assigned
PDF created with pdfFactory trial version www.pdffactory.com
Coastal Profile of the Erongo Region - August 1999 136
the responsibility to incorporate the separate plans into a coherent, national and regional land-use framework. Apart from Town Planning Schemes, local authorities may prepare development and structure plans setting development goals and investment priorities such as plans for upgrading of settlements and townships, and site planning. Merely TPS are statutory. Town Planning Schemes define zoning, land-use, building regulations etc. within proclaimed (surveyed or developed) areas of the town. The main purpose of the TPS is to set aside various parts of the town for specified purposes: industry, residential areas, parks and recreational purposes, schools, hospitals, roads and other infrastructure etc. The Town Ordinance of 1954 provides certain guidelines on open space, recreational areas etc. The schemes are subject to approval by the MRLGH (NAMPAB), and deviations from the designated use, for instance rezoning, can only occur after approval by NAMPAB. Seemingly, it implies a quite protracted procedure to get the TPS recognised. For instance, it took eighteen months before the final endorsement of Swakopmund’s most recent TPS was in place. The plans have a duration of 5 years. Local authorities are bound to ensure that land is not used for purposes other than those stipulated for in the title deed or town planning scheme. All local authorities in the coastal zone of Erongo Region have recently revised TPS’. Structure Plans is a town planning management tool which is more flexible and future oriented than TPSs. The purpose is to provide guidelines for future development of the town and use of non-developed (non-proclaimed) areas or re-development of an existing area in a town/city in comprehensive form. It embodies council policies and indicates the desired direction of development as defined by these policies. The public is usually involved in their preparation through surveys (on how they would like their town to appear) and public hearings. In the case of Swakopmund, urban design, especially use of the beach front, plays an important part in the ongoing structure plan exercise. Although to be revised every five years, the plan for Swakopmund under preparation will have a 15-20 year perspective. Walvis Bay municipality is presently preparing a structure plan for the town. Focus will be on the urban and peri-urban zones, although the protection needs of the Walvis Bay Lagoon is going to be incorporated as a special aspect (the Lagoon is registered as a Ramsar site calling for special regulatory protection due to its richness in wading birds). Also, the plan will set guidelines about land-use between Walvis Bay town and Langstrand, although large trunks of this land is state land. Strategic Plans are wider development plans indicating how the council envisions the town to develop in the coming years. Strategic plans are used to forecast changes of socio-economic factors such as income, migration patterns, water use and industrial growth in the municipality. In the case of Walvis Bay, which recently finalised its first 4-year strategic plan, it is used as a tool for prioritisation of municipal investments and a framework for the annual budget exercise. Swakopmund intends to follow in Walvis Bay’s footsteps and publish a similar plan.
PDF created with pdfFactory trial version www.pdffactory.com

Coastal Profile of the Erongo Region - August 1999 137
Policy plans are prepared to address specific issues in more detail than structure plans. A policy plan will contain information and proposed policies on the future zoning of the area. It may form part of a structure plan or exist independently. The purpose is to provide a detailed policy and statements applicable to a specific procedure of activity, for example regulation of informal trade or Bed and Breakfast businesses. It further provides a detailed framework for policy decisions to guide development in small geographic areas or to regulate procedures for the provision of services by the local authority. In proclaimed settlement areas, regional councils play essentially the same role as do local authorities in their area of jurisdiction. Hence, regional councils are responsible for administering the settlement area, including for physical planning, surveying etc. within the area. Wlotzkasbaken, the only settlement within the coastal zone of Erongo, is at the initiative of the Regional Council in a process of being upgraded to village status. The Council is assisted by MRGLH as well as private planners in its efforts. 7.1.1.2 Environmental considerations in local planning Environmental issues are not included in Town Planning Schemes. According to the existing legislation, it is up to the discretion of the individual local authority whether they want to address these issues in their planning. However, there seems to be a tendency to incorporate environmental and conservation concerns in many plans. In the recent TPS for Walvis Bay, for example, all municipal land outside the urban and peri-urban areas is proclaimed ‘areas of nature conservation’, although there is no specified land-use zoning of the stretch. Yet, all applications for permanent activities in these areas require amendment of the existing zoning. A key element in environmental management is environmental assessment. EA is applied for identifying and evaluating biophysical, social and other impact, including its effects on the sustainability of the resources. Usually, economic and social aspects are addressed as part of the EA. Under the existing legislation, it is to the discretion of the local authority or relevant ministry to decide whether it is deemed necessary to have an environmental assessment carried out, although the government’s environmental assessment policy encourages conduct of such assessments. Hence, it is increasingly common that the local authorities consult environmental expertise if any doubt prevails regarding the environmental effects of a project. Swakopmund municipality requests EA for major projects. Walvis Bay insists on EA for any development that takes place in environmentally sensitive areas, but not if the development application is in line with the erf/portion’s zoning, i.e. not for an industrial project in an zone designated for industry. EA is usually conducted if the land-use of a zone is drastically changed, such as proclamation of a new areas for EPZ. Officially, the Directorate of Environmental Affairs of the MET is supposed to co-ordinate and conduct EA. However, as the directorate does not have field staff at its disposal, much day-to-day EA is done by the nature conservation people of MET. Thus, the regional office of Ministry of Environment & Tourism liaises, formally and
PDF created with pdfFactory trial version www.pdffactory.com
Coastal Profile of the Erongo Region - August 1999 138
informally, closely with the local authorities on the coast. None of the municipalities and towns in the Erongo Region dispose of in-house environmental expertise, but Walvis Bay municipality employs an environment-cum-tourism officer who deals with nature conservation issues. According to the proposed Environmental Management Act, most activities will in the future be subject to environmental assessment:3 erection, construction or upgrading of most physical installations and production facilities; change of status of land-use; resource extraction (mining and quarrying) and husbandry; and groundwater abstraction. The act operates with a very centralised approval system which may cause bottlenecks and tardy handling of applications. 7.1.2 Nature conservation In recent years, much public attention has been drawn to the degradation of landscapes and destruction of habitats resulting from inappropriate tourist behaviour and emergence of recreational activities at environmentally sensitive areas. Also the environmental effect of the proliferation of small-scale mining in some parts of Erongo Region causes concern. Thus, seemingly three factors pose a threat to the quality of the natural surroundings in this context:
• The impact from inappropriate tourist behaviour as, for instance, uncontrolled off-road four wheel driving leading to physical degradation and destruction of unique habitats such as the lichen fields and of breeding areas of the rare Damara tern
• Littering of the sea shore due to the heavy seasonal influx of leisure fishermen from other parts of Namibia and South Africa, in particular.
• The impact from mining operations, in particular small scale mining. Although nature conservation has been high on the government’s agenda both before and after independence, it has in the past tended to be treated as a topic separate from wider environmental protection and resource management. Likewise, environmental protection and physical planning are far from treated as integrated subjects in the legislation although closely inter-linked. The situation is further complicated by the fact that the de facto legal status of the land, i.e. whether state property, private assets or communal land, defines which rules and regulations are applicable. For instance, the West Coast Recreation Area is regulated according to Ordinance 20 of 1973 on Accommodation establishments and Tourism, whereas nature conservation for the rest of the region, whether in areas on private, local authority or communal hands, is carried out in consonance with the Nature Conservation Ordinance 4 of 1975. Since the rules for protection of wild animals and plant life differ according to the holdings’ legal status, enforcement practices are inconsistent and confusing. However, although the legislation is generally outdated and enforcement of the rules is spread between several line-ministries, seemingly the legal framework for
3 Environmental Management Act, Final draft, MET 1998
PDF created with pdfFactory trial version www.pdffactory.com

Coastal Profile of the Erongo Region - August 1999 139
protection of the natural environment is relatively well founded. Rather, the constraining factors are the poor transparency of the laws and ordinances, making them extremely difficult to use for the authorities, the scarcity of human and physical resources, hampering enforcement, and the lack of co-ordination between the bodies involved in enforcement. 7.1.2.1 Ministry of Environment & Tourism: mandate and structure In general, nature conservation is regulated by the Nature Conservation Ordinance of 1975 and administered by the Ministry of Environment and Tourism’s Directorate of Natural Resource Management. The Namibian Government’s policy on environmental protection and nature conservation is clearly spelled out in the mission statement of the Ministry of Environment and Tourism: “…to maintain and rehabilitate essential ecological processes and life-support systems, to conserve biological diversity and to ensure that the utilisation of natural resources is sustainable for the benefit of all Namibians, both present and future, as well as the international community, as provided for in the constitution”. The Ministry is divided into four directorates: Directorate of Environmental Affairs is responsible for environmental planning and coordination, including environmental impact assessment (EIA). It has a staff of about 5, all Windhoek-based. Hence, for field information, the directorate usually draws on the staff of the Natural Resource Management Directorate. Directorate of Forestry in charge of all matters dealing with forest management. Directorate of Tourism and Resorts operates the extensive net of government-owned tourist facilities and provides services to tourists. This directorate has an office in Swakopmund. Recently, the Cabinet has decided to convert parts of the directorate to a parastatal organisation to be operated on commercial terms. Directorate of Resource Management is geographically divided into a Northern and a Southern division. Erongo falls under the Southern Division. The directorate is primarily responsible for the management of national parks and other declared conservation areas. The Ministry has its regional office in Swakopmund although its regional boundaries do not follow the administrative division of MRLGH. The MET region encompasses considerably more than the Erongo Region. It is divided into a northern part, known as Erongo, which comprises the coastal parts of the West Coast Recreation Area, and a southern part covering the Namib-Naukluft Park. The MET regional office is headed by a chief control warden, the two sub-districts by chief wardens. The chief warden for the northern part is based in Swakopmund as the regional head, while the chief warden managing the southern part has his office in Ganab. Each sub-region is further sub-divided into local units headed by senior wardens. One senior warden is located in Walvis Bay.
PDF created with pdfFactory trial version www.pdffactory.com

Coastal Profile of the Erongo Region - August 1999 140
Reflecting the division of work within MET, the regional structures are divided in two strictly separate organisation: a nature conservation section and a tourism section. At present, collaboration between the two sections is limited. Yet, at the Cape Cross seal reserve staff from the tourism section is occasionally undertaking enforcement, as the nature conservation section is short of resources. The regional office of MET Resource Management is nominated to have a total staff of 76. The southern part, Namib-Naukluft Park, is allocated relative more employees than the northern part due to the work required to maintain roads and other tourist facilities there. One-third of the 76 positions is presently vacant. The regional office has the following main areas of intervention:
• Regulation of parks and recreational areas. Although recent years have witnessed a general shift away from wildlife conservation to natural resource management, the regional nature conservation staff still widely concentrate on monitoring of the fauna and flora as well as of wildlife. Especially the destruction of habitats caused by ignorant visitors is prioritised high. However, scarcity of financial and human resources impede the work of MET and especially its legal enforcement capability.
• Nature conservation related to communal areas and national monument. Community-based natural resource management is a key element of MET’s national strategy. In line with what can be observed all over the African continent, protection of wildlife on state land outside of nature conservation areas and proclaimed farmland is granted to local communities. Through establishment of so-called areas of conservancy under the administration of local wildlife councils communities are encouraged to undertake regulation of the wildlife within their territory. MET Nature Conservation in Swakopmund is strongly involved in setting up communal conservancies in Damaraland. The national monuments of (Gross) Spitzkoppe and Brandberg are situated in these areas.
• Nature conservation at commercial farms. As more and more farmland is converted to private game ranches, regulation of wildlife there is becoming increasing important. Combating poaching and resolution of neighbourhood disputes is another field of activity for the environmental officers.
• Liaison with regional and local authorities. Especially Walvis Bay and Swakopmund consult the nature conservation staff of MET frequently on various environmental issues - and vise versa. Besides, MET has seat in several committees established by the local authorities.
While the shore of the seal colony at Cape Cross is protected and managed by MET, it is the Ministry of Fisheries & Marine Resources which determines the size of the seal population and thus the annual harvesting that can be accepted. Ministry of Fisheries & Marine Resources also regulates line fisheries (angling) along the coast.
PDF created with pdfFactory trial version www.pdffactory.com
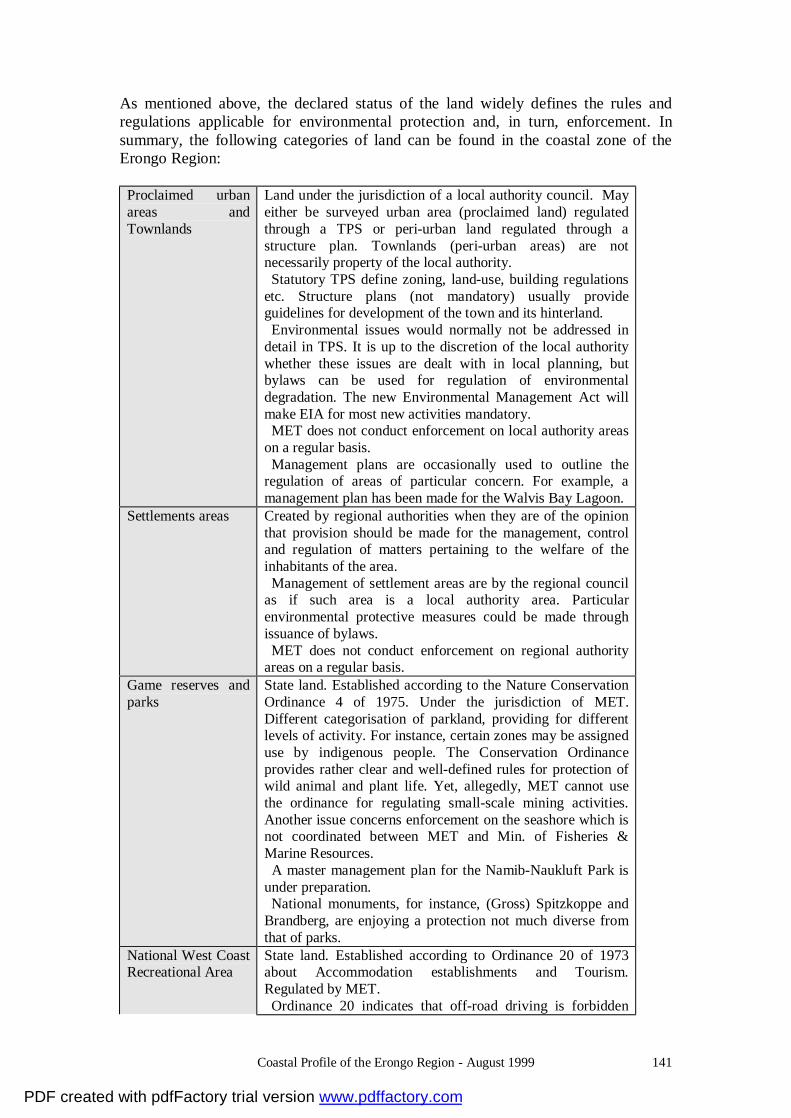
Coastal Profile of the Erongo Region - August 1999 141
As mentioned above, the declared status of the land widely defines the rules and regulations applicable for environmental protection and, in turn, enforcement. In summary, the following categories of land can be found in the coastal zone of the Erongo Region: Proclaimed urban areas and Townlands
Land under the jurisdiction of a local authority council. May either be surveyed urban area (proclaimed land) regulated through a TPS or peri-urban land regulated through a structure plan. Townlands (peri-urban areas) are not necessarily property of the local authority. Statutory TPS define zoning, land-use, building regulations etc. Structure plans (not mandatory) usually provide guidelines for development of the town and its hinterland. Environmental issues would normally not be addressed in detail in TPS. It is up to the discretion of the local authority whether these issues are dealt with in local planning, but bylaws can be used for regulation of environmental degradation. The new Environmental Management Act will make EIA for most new activities mandatory. MET does not conduct enforcement on local authority areas on a regular basis. Management plans are occasionally used to outline the regulation of areas of particular concern. For example, a management plan has been made for the Walvis Bay Lagoon.
Settlements areas Created by regional authorities when they are of the opinion that provision should be made for the management, control and regulation of matters pertaining to the welfare of the inhabitants of the area. Management of settlement areas are by the regional council as if such area is a local authority area. Particular environmental protective measures could be made through issuance of bylaws. MET does not conduct enforcement on regional authority areas on a regular basis.
Game reserves and parks
State land. Established according to the Nature Conservation Ordinance 4 of 1975. Under the jurisdiction of MET. Different categorisation of parkland, providing for different levels of activity. For instance, certain zones may be assigned use by indigenous people. The Conservation Ordinance provides rather clear and well-defined rules for protection of wild animal and plant life. Yet, allegedly, MET cannot use the ordinance for regulating small-scale mining activities. Another issue concerns enforcement on the seashore which is not coordinated between MET and Min. of Fisheries & Marine Resources. A master management plan for the Namib-Naukluft Park is under preparation. National monuments, for instance, (Gross) Spitzkoppe and Brandberg, are enjoying a protection not much diverse from that of parks.
National West Coast Recreational Area
State land. Established according to Ordinance 20 of 1973 about Accommodation establishments and Tourism. Regulated by MET. Ordinance 20 indicates that off-road driving is forbidden
PDF created with pdfFactory trial version www.pdffactory.com

Coastal Profile of the Erongo Region - August 1999 142
when it damages objects of botanical, zoological, geological, archaeological, historical or scientific interest. However, there is no provision for a general regulation of off-road movements, littering or of small-scale mining operations. No recent plan for WCRA. However, overall planning for the area is formally the task of Min. of Works, Transport & Communication, though it is unlikely that any planning would be done without involvement of MET.
Commercial farmland
Comprises all land outside the local authority areas and communal areas which is held on freehold title. According to the Nature Conservation Ordinance of 1975 commercial farmers are having ownership of the wildlife resources found on their land. Unless particular problems occur, MET does not make any enforcement on commercial farmland, but game hunting requires special licence. Usually, commercial farmland is not covered by any form of physical planning practice nor zonation.
Communal areas State land which is leased to rural communities. Regulated by Ministry of Lands, Resettlement & Rehabilitation. Through establishment of so-called areas of conservancy under the administration of local wildlife councils communities are encouraged to undertake regulation of the wildlife within their territory. MET assists in this work. Usually, communal areas would not be covered by any form of physical planning practice nor zonation.
Other state land
All land which is not held on a freehold title. State land can be found within areas under the jurisdiction of local or regional authorities, MET or other government bodies. Administered by Min. of Works, Transport & Communication; or, in the case of communal land, Min. of Lands, Resettlement and Rehabilitation. Some state land is subject to special regulation, viz. game parks and reserves, however, as a basic rule local authorities cannot decide on the use of state land, not even within proclaimed urban areas. The dual status of state land, i.e. being administered by MWTC while at the same time being within areas under the jurisdiction of other government entities, causes considerable confusion and often a regulatory vacuum in terms of environmental protection. This is for example the case for the state land under Walvis Bay Municipality’s jurisdiction.
7.1.3 Marine resource depletion The general state of sea water along the coast is influenced by the Benguela current system. As explained in section 3 this creates an environmental condition with a low content of oxygen in the coastal waters of the Erongo Region. Many times values of 1-2 mg oxygen per litre of seawater is experienced. The pollution of Walvis Bay area caused by discharge of organic loaded waste water from the fish processing industries is highlighted by many observers as a severe problem, mainly because it is adding negatively to a natural situation with the low oxygen content. Also minor oil spills and sewage discharges from vessels anchoring in Walvis Bay is a potential problem.
PDF created with pdfFactory trial version www.pdffactory.com
Coastal Profile of the Erongo Region - August 1999 143
Little actual evidence is available for assessing the severity of these problems since regular monitoring operations of the quality of the sea water outside the Walvis Bay harbour area is carried out only to a limited degree. Similarly, the effects on the fish stocks from angling is little researched leaving managers with limited factual information concerning its de facto importance. Formally, several institutions are, directly or indirectly, involved in monitoring of the marine water quality and the state of the resources in the Erongo Region e.g. Ministry of Fisheries & Marine Resource, NAMPORT (the Port Authority of Namibia), Water Affairs of the Ministry of Agriculture, Water & Rural Development and the local authorities. 7.1.3.1 Ministry of Fisheries and Marine Resources (MFMR) The Ministry is divided into two main divisions: Directorate of Operations deals with operational aspects of fisheries management such as registration and control of fish exploitation, both for marine and fresh water species. It is responsible for enforcement of fisheries legislation and the specific management measures and conditions applicable to fishing licences issued by the Ministry. Surveillance of the Exclusive Economic Zone (EEZ) by the Directorate of Operations is organised at its regional offices in Walvis Bay. This office also patrols the seashore and controls on-shore angling. The Directorate of Resource Management undertakes research to provide advice on the maximum sustainable yield (MSY)of the various marine species. NATMIRC (National Marine Information and Research Centre) in Swakopmund has as one of its objectives the strengthening of the marine research capacity in Namibia. NATMIRC is responsible for applied research into the population dynamics of commercially important species and provides essential input to the annual TAC (Total Allowable Catch). Monitoring of the quality of the sea water is in principle the obligation of the Ministry. However, due to shortage of human resources, especially coastal monitoring data is insufficient e.g. is the station grid far to broad for these data to be used extensively for managerial purposes. It is also the Directorate of Resource Management which advises on appropriate sires for aquaculture on the coast. The Directorate is legally entitled to permit aquaculture farming in consultation with the authority in charge of land-use planning for the area. 7.1.3.2 NAMPORT Namport is the overall authority in relation to the Ports in Namibia. It is a parastatal accountable to the Ministry of Works, Transport & Communication. Namport is in charge of all environmental control in relation to the port, for instance combating of oil spills, handling of solid waste disposal from ships and wastewater
PDF created with pdfFactory trial version www.pdffactory.com

Coastal Profile of the Erongo Region - August 1999 144
disposal from the fishing industry. Controlling waste water effluent on the landward site is the task of Water Affairs. The Port Authority does not have an environmental control unit. However, an oil spill contingency plan and equipment for oil spill combating is in place. Tug crews are trained in handling the equipment and exercises are carried out on a regular basis. Ministry of Works, Transport and Communication also has disposed equipment for oil spill combating at the Walvis Bay Port. Namport is responsible for the operating of this equipment as well. Namport do not have the capability or the equipment to conduct regular analyses of the quality of the water in the harbour. 7.1.3.3 Department of Water Affairs The Water Act (1956) makes provision for the protection of water catchment areas through controlling effluent discharge into surface and groundwater systems. The Department of Water Affairs (DWA) is responsible for the overall management of water resources. Part of this work is done through issuance of wastewater discharge permits. The discharge of wastewater to the marine environment in Walvis Bay, from the fish processing factories and other industries, does not pose an immediate threat to the fresh water resources. However, it is nevertheless DWA’s responsibility to inspect the effluent and prosecute offenders, according to the rules of wastewater discharge permits. Today, DWA is not capable in undertaking this assignment. There are several reasons for that:
• First, the department is short of resources, wherefore it cannot afford to send someone to the coast for that purpose, on a regular basis.
• Secondly, the technical expertise and facilities required for tracing possible pollutants is not readily available in Namibia, implying that enforcement of the rules would inflict extensive practical problems on DWA.
• Thirdly, the level of punishment of offenders provided for by the existing legislation is allegedly ‘ridiculous’ and entirely out of proportion with the economic gains associated with ignoring the law.
Consequently, DWA is opting for a strategy which will place the control and enforcement responsibility on the local authority. Rather than issuing the wastewater discharge permit to individual companies, DWA will in the future insist that wastewater treatment becomes part of a bulk water supply contract between the municipality and the company. By doing so, the burden of control is placed on the municipality’s shoulders. None of the local authorities in the Erongo Region have any in-house expertise enabling them to monitor and check the effect of potential pollution, whether in
PDF created with pdfFactory trial version www.pdffactory.com
Coastal Profile of the Erongo Region - August 1999 145
connection with groundwater, air or sea water. They all rely on self-control and call upon external expertise for spot-checks if any suspicion appears. 7.1.4 Groundwater abstraction Many believe that access to water is the most critical factor determining future development of the coastal zone. With the current rate of increase, the existing resources will last only a few years. Therefore the urgency of building a desalination plant. The plant is intended to supply coastal consumers only as it is not financially viable to send desalinated water to the interior of the country. The main consumers of water are: industries like Rössing Mine, the brewery, the fishing industry and garden watering and domestic use. It seems that the Water Act from 1956 is outdated and not applicable to Namibia of today. Especially in terms of enforcement of pollution control, the act provides little support. A Water Master Plan was made in 1996 and the World Bank is presently conducting a major organisational study of the water distribution system. Department of Water Affairs used to be divided into 3 departments: 1. Bulk water (now NamWater) 2. Rural water supply 3. Water resource management. NamWater: On April 1, 1998 Bulk Water was separated out from the Ministry of Agriculture, Water and Rural Development and converted to a parastatal under the name of NamWater. NamWater will have to operate on market terms, why the existing subsidised water prices gradually will be adjusted to the actual cost of producing the water. It has recently been announced that the bulk water prices will increase with 20% a year during the 5 year period starting from 1999. NamWater sells water to customers in large quantity. Customers are either local authorities, companies, or (rarely) coincidental clients (people living near to a main pipe). It is not mandatory for local authorities to buy their water from NamWater. Some have own facilities, including water treatment facilities. Apart from sale of bulk water, NamWater will also sell water-related services e.g. rent of equipment, consultancies, EIAs, maintenance of water distribution systems etc. Concerning price, bulk customers, such as the municipalities pay the actual cost of abstracting water in their particular area. The local authorities can thereafter freely set their water tariffs4. Thus, at different localities different tariffs are paid. However, in the ICZM area, the price of water tends to be subsidised and therefore below the actual abstraction cost. Rural Water secures water supply to rural communities. The policy is to stimulate self-supply through establishment of local wells and pumps. When water projects are implemented, the communities are encouraged to do as much of the work themselves, while Rural Water assists with technical and financial assistance and training. Only 4 With the present tariff policy, the price consumers pay does not cover the expense of maintaining water as a resource.
PDF created with pdfFactory trial version www.pdffactory.com

Coastal Profile of the Erongo Region - August 1999 146
where groundwater is scarce, piped water is seen as the solution. Rural Water purchases the water it supplies to dry areas from, NamWater. Resource Management deals with pollution control and water abstraction permits. It also issues effluent disposal permits. According to the Water Act, the effluent is supposed to have the same quality as the water had when it was tapped. The resource management department lacks technical expertise and laboratory facilities to carry out regular pollution monitoring. Hence, regarding testing waste water quality the department must rely on NamWater or laboratories in RSA. NamWater monitors the quality and ground water level of existing water resources, on Water Affairs’ behalf. NamWater in co-operation with local authorities conducts frequent consumption investigations and forecasts on that basis future water demand. Neither Water Affairs nor NamWater conduct savings campaigns or provide advice on such issues. As part of the preparations for construction of the desalination plant, a local forum for water planning comprising all local authorities and other major customers has been established on the coast. 7.1.5 Mineral extraction Extensive mineral exploitation takes place in Erongo Region: Uranium by Rössing Mine at Arandis, marble at Karibib, gold at Navachab, lead/zinc near Swakopmund. In addition, small-scale mining operations are common for example in the hinterland of Wlotzkasbaken and north of the Swakopmund-Arandis main road. Salt is produced in salt pans in Walvis Bay and Swakopmund lagoons. Mineral salt is extracted at Cape Cross. Although the Rössing Uranium Mine is a source of potential pollution both as far as groundwater contamination, air pollution and radiation is concerned, the company’s emphasis on environmental protection has given rise to substantial preventive measures by the mine. Thus, most observers and professionals estimate the actual hazards to be very limited (see section 8). Informal mining operate, either in previously abandoned mines or as small open-cast affairs. Informal mining serves predominantly a subsistence purpose, with miners carrying out this activity as their needs dictate. Tin and semi-precious stones which provide a quick return are the commonly mined minerals. Due to the lack of equipment and explosives associated with informal mining, mineral recovery is severely limited and only the top meters of the individual pegmatite bodies is usually removed. Once this soft, brittle weather zone is removed, miners are forced to abandon the site and move on. Apart from damaging the fauna and making more sensitive to erosion, this type of mining scares the landscape.
PDF created with pdfFactory trial version www.pdffactory.com
Coastal Profile of the Erongo Region - August 1999 147
7.1.5.1 Government policies Mining is one of the backbones of the Namibian economy and the government is keen on further stimulating foreign investments in the mining sector, thus the strive is to simplify licensing procedures and other incentives. Although still predominantly a large-scale operation, the government has repeatedly emphasised the importance of small-scale (or micro) mining as a means for reviving and diversifying the mining industry. However, the current low level of technical input to most existing small mines constrains the commercial viability of many small-scale mining projects. Ministry of Mines & Energy attempts to help small-scale miners to ease some of these constraints through provision of geological, mineral benefaction and marketing support services. Small-scale mining includes informal artisanal workings as well as mines and quarries operated by an individual or a few people. Most informal micro mining is economically marginal but provides an important supplementary income for the operator. 7.1.5.2. Environmental aspects Although the new environmental management act is not yet in place, the Minerals Acts of 1992 does set certain criteria for mining activities. For instance, any application for a mining licence must be accompanied by an environmental impact assessment and an environmental management plan. On completion of prospecting and the closure of operations, the Ministry of Mining & Energy requires companies to restore the natural environment to an acceptable state. Several of the mining companies have set up systems for environmental management or involved themselves in nature conservation projects. Small-scale mining is not subject to prior environmental impact assessment of its activities. Allegedly, several small mines in Erongo are operating in environmentally sensitive areas e.g. near to national monuments such as the Brandberg or at the edge of Lichen fields. An ‘environmental contract’ requiring the licence holder to restore the area after the mining operation is finished, is inserted in many of the permits. Nevertheless, MET reports that only a few micro mining operators are restoring the site after completion of their activity. The problem is that the cost involved exceeds the miners financial capacity. Curtailing these operations is very difficult due to the weak legislation pertaining to informal mining and lack of manpower for control and inspection. Besides, MET and Ministry of Mines & Energy have difficulty in reaching a common ground in their approach to small-scale mining. The fact that Ministry of Mining & Energy has no regional representation hampers co-ordination of enforcement efforts.
PDF created with pdfFactory trial version www.pdffactory.com
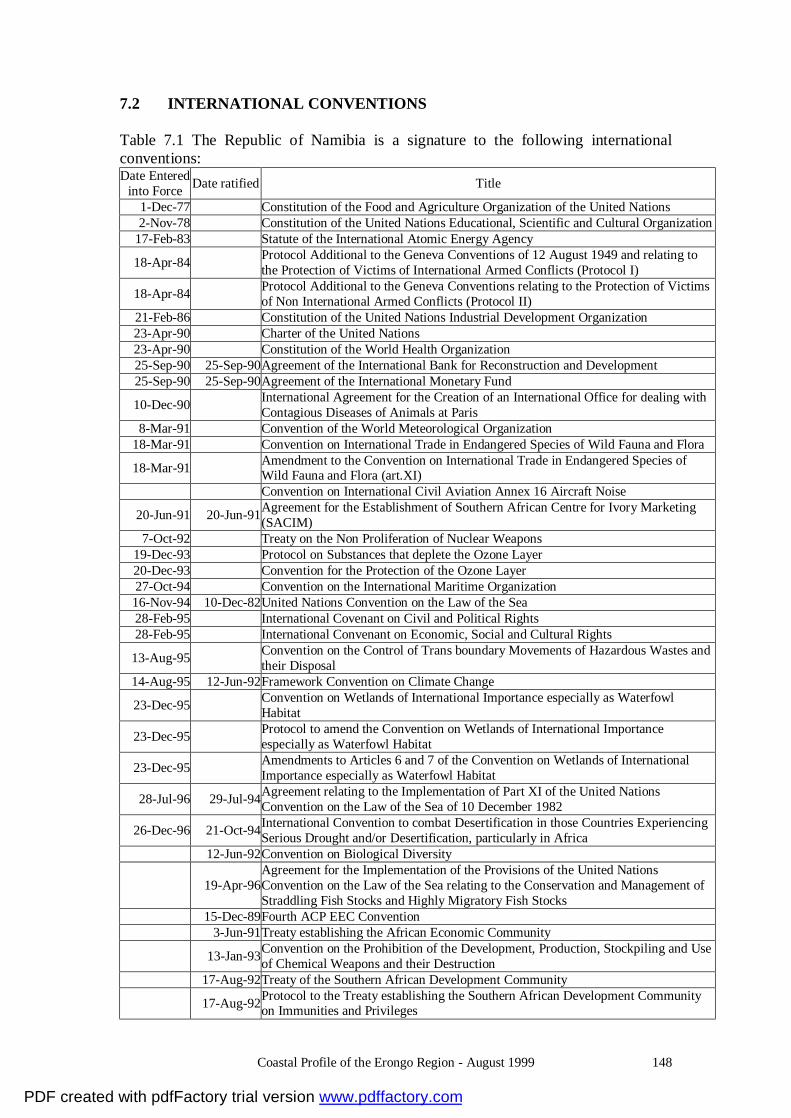
Coastal Profile of the Erongo Region - August 1999 148
7.2 INTERNATIONAL CONVENTIONS Table 7.1 The Republic of Namibia is a signature to the following international conventions: Date Entered
into Force Date ratified Title
1-Dec-77 Constitution of the Food and Agriculture Organization of the United Nations 2-Nov-78 Constitution of the United Nations Educational, Scientific and Cultural Organization
17-Feb-83 Statute of the International Atomic Energy Agency
18-Apr-84 Protocol Additional to the Geneva Conventions of 12 August 1949 and relating to the Protection of Victims of International Armed Conflicts (Protocol I)
18-Apr-84 Protocol Additional to the Geneva Conventions relating to the Protection of Victims of Non International Armed Conflicts (Protocol II)
21-Feb-86 Constitution of the United Nations Industrial Development Organization 23-Apr-90 Charter of the United Nations 23-Apr-90 Constitution of the World Health Organization 25-Sep-90 25-Sep-90Agreement of the International Bank for Reconstruction and Development 25-Sep-90 25-Sep-90Agreement of the International Monetary Fund
10-Dec-90 International Agreement for the Creation of an International Office for dealing with Contagious Diseases of Animals at Paris
8-Mar-91 Convention of the World Meteorological Organization 18-Mar-91 Convention on International Trade in Endangered Species of Wild Fauna and Flora
18-Mar-91 Amendment to the Convention on International Trade in Endangered Species of Wild Fauna and Flora (art.XI) Convention on International Civil Aviation Annex 16 Aircraft Noise
20-Jun-91 20-Jun-91Agreement for the Establishment of Southern African Centre for Ivory Marketing (SACIM)
7-Oct-92 Treaty on the Non Proliferation of Nuclear Weapons 19-Dec-93 Protocol on Substances that deplete the Ozone Layer 20-Dec-93 Convention for the Protection of the Ozone Layer 27-Oct-94 Convention on the International Maritime Organization 16-Nov-94 10-Dec-82United Nations Convention on the Law of the Sea 28-Feb-95 International Covenant on Civil and Political Rights 28-Feb-95 International Convenant on Economic, Social and Cultural Rights
13-Aug-95 Convention on the Control of Trans boundary Movements of Hazardous Wastes and their Disposal
14-Aug-95 12-Jun-92Framework Convention on Climate Change
23-Dec-95 Convention on Wetlands of International Importance especially as Waterfowl Habitat
23-Dec-95 Protocol to amend the Convention on Wetlands of International Importance especially as Waterfowl Habitat
23-Dec-95 Amendments to Articles 6 and 7 of the Convention on Wetlands of International Importance especially as Waterfowl Habitat
28-Jul-96 29-Jul-94Agreement relating to the Implementation of Part XI of the United Nations Convention on the Law of the Sea of 10 December 1982
26-Dec-96 21-Oct-94International Convention to combat Desertification in those Countries Experiencing Serious Drought and/or Desertification, particularly in Africa
12-Jun-92Convention on Biological Diversity
19-Apr-96Agreement for the Implementation of the Provisions of the United Nations Convention on the Law of the Sea relating to the Conservation and Management of Straddling Fish Stocks and Highly Migratory Fish Stocks
15-Dec-89Fourth ACP EEC Convention 3-Jun-91Treaty establishing the African Economic Community
13-Jan-93Convention on the Prohibition of the Development, Production, Stockpiling and Use of Chemical Weapons and their Destruction
17-Aug-92Treaty of the Southern African Development Community
17-Aug-92Protocol to the Treaty establishing the Southern African Development Community on Immunities and Privileges
PDF created with pdfFactory trial version www.pdffactory.com
Coastal Profile of the Erongo Region - August 1999 149
The following two conventions are in particular of importance for the study area and are therefore discussed in some detail. 7.2.1 Ramsar The Walvis Bay lagoon and Sandwich Harbour were declared as Ramsar sites and Ramsar status are proposed for the Myl 4 and Cape Cross wetland areas. The convention could be summarised as follows: The convention basically states that the Contracting Parties have recognising the interdependence of Man and his environment; Considered the fundamental ecological functions of wetlands as regulators of water regimes and as habitats supporting a characteristic flora and fauna, especially waterfowl; was convinced that wetlands constitute a resource of great economic, cultural, scientific, and recreational value, the loss of which would be irreparable; desired to stem the progressive encroachment on and loss of wetlands now and in the future; recognised that waterfowl in their seasonal migrations may transcend frontiers and so should be regarded as an international resource; was confident that the conservation of wetlands and their flora and fauna can be ensured by combining far-sighted national policies with co-ordinated international action. 7.2.2 The Marpol Convention: The Marpol Convention could be summarised to state that the parties to the present protocol, recognized the significant contribution which can be made by the international convention for the prevention of pollution from ships, 1973, to the protection of the marine environment from pollution from ships, recognizing also the need to improve further the prevention and control of marine pollution from ships, particularly oil tankers, recognizing further the need for implementing the regulations for the prevention of pollution by oil contained in annex 1 of that convention as early and as widely as possible, acknowledging however the need to defer the application of annex 11 of that convention until certain technical problems have been satisfactorily resolved, considering that these objectives may best be achieved by the conclusion of a protocol relating to the international convention for the prevention of pollution from ships, 1973, 7.3 LEGISLATION The pieces of legislation referred to below were used in a number of Law Workshops and the commentary and outline were deliberately short. The workshop documented a skeleton structure which facilitated a detailed analyses and commentary of the various pieces of legislation in the actual presentation of the workshops. In considering and evaluating these selected pieces of legislation it must be borne in mind their jurisdiction of application, their focus and intention and their age. Most existing laws fail to reflect modern environmental principles i.e., the polluter pays principle, inter generation equity. Many are deficient and ineffective for the following reasons:
PDF created with pdfFactory trial version www.pdffactory.com
Coastal Profile of the Erongo Region - August 1999 150
• The contents of the legislation fails to address modern environmental issues • Regulations have not been promulgated in relation to environmental
considerations in the project area. The ability to enact regulations either does not exist for specific environmental problems, or the ability to regulate certain activities has been overlooked or ignored.
• Committees, Bodies and Officials have not been created or sustained. • Provisions are outdated and ineffectual and enforcement penalties fail to act as an
effective deterrent. • Lack of skills and certainty in the application of certain laws and conflicting and
overlapping jurisdiction between governmental authorities and ministries. The project area consists of 5 main zones, each having its own main designated piece of legislation. These areas are the National West Coast Recreation Area, the area north of Walvis Bay and south of Swakopmund, the Namib Naukluft Park ands Cape Cross Seal Reserves, the inland area and the coastal shoreline. A short summary of the laws and conventions which are applicable in the area are as follows: United Nations Law of the Sea Convention, 1982. Article 2 deals with the legal status of the territorial sea, of the air space over the territorial sea and of its beds and subsoil. Section 6 of the convention, Articles 213 to 222 deal with the Coastal States ability to enforce anti-pollution measures within and beyond its territory. Territorial Sea and Exclusive Economic Zone of Namibia Act 3 of 1990. This Act undertake to give effect to the United Nations Law of the Sea Convention, 1982. Section 2 states that the territorial waters of Namibia will be 12 nautical miles from the low water mark. The legal status of the territorial waters is that the sovereignty of Namibia extends beyond its land territory to this adjacent belt of the sea. This sovereignty extends to the air space over the territorial sea to the sea bed and the subsoil. Section 4 reflects Articles 55 – 75 of the Convention, and provides that the sea outside the territorial sea of Namibia but within a distance of 200 nm from the low water mark shall constitute the exclusive economic zone of Namibia. Fertilizers, Farm Feeds, Agricultural remedies and Stock Remedies Act 36 of 1947. The act defines an agricultural remedy as any chemical substance or biological remedy, mixture or combination, for the destruction, control, repelling or prevention of any undesired fungus, insect and plant. A fertilizer is defined as any substance which is intended or offered to be used for improving the growth of plants or the productivity of soil.
PDF created with pdfFactory trial version www.pdffactory.com
Coastal Profile of the Erongo Region - August 1999 151
Section 3 of the act deals with the registration of fertilizers, farm feeds, agricultural remedies and stock remedies, the requirements and the periods of registration as contained in the certificate. Section 7 requires that no person may sell any fertilizer or agricultural remedy unless it is registered in terms of the Act, and the container must comply with the prescribed requirements of sealing and labeling. Section 9 states that any person who sells fertilizer, farm feed, agricultural remedies not in a container, shall provide the purchaser an invoice setting out the particulars of such fertilizer or agricultural remedy. Section 12 provides that no person may manufacture or sell any fertilizer or farm feed containing bone or any other substance derived from an animal carcass, unless the bone has been sterilized, or has been imported subject to a permit issued in terms of the Animal Disease and Parasites Act 13 of 1956. The offences and penalties under the act are contained in Section 18, and provides that any person who fails to comply with the provisions of Sections 3, 7, 9 and 12 and who obstructs any official under the Act, tampers with a sample, makes a false statement, shall be guilty of an offence and liable on conviction to a fine of either N$500 or N$1000, and or 12 months or 2 years imprisonment. Section 18(2) gives the court the authority and discretion to forfeit any fertilizer or agricultural remedy in respect of which the offense has been committed. Section 16 gives any officer of Customs and Excise the authority to detain any quantity of farming requisites landed or imported through any port or place in Namibia and may take samples thereof. Regulation Gazette No. 1450, of 28 May 1971, No. 3121, Regulation No. 857 dealt with the registration of stock remedies and labeling - (i) “registered” means registered in terms of the provision of these regulations - (iv) “stock remedy” means a substance intended and offered to be used in connection with domestic animals, live stock, poultry or wild animals for the prevention, treatment or cure of any decease, infection or other unhealthy condition, or for the maintenance or other improvement of health, growth, production or working capacity, or for the lasting capacity of carcasses, but excluding any preparation dispensed on the prescription of a veterinarian. Regulation Gazette No. 1530 of 26 November 1971, No. 3314, Regulation No. 2106 and 2105 deals with the classification, registration and marking of containers and section 15 of Regulation 2105 states that no person shall import any fertilizer which contains bone or any other substance of animal origin, unless (i) it has been sterilized by subjection to saturated steam under pressure of not less than 2.75 bar maintained for a period not less than 2 hours in a suitable digester, (ii) by any other approved method and is free from bacillus anthracis and organisms of the gasgangrene type. It further states that no person shall manufacture or sell any fertilizer containing bone or any other substance derived from an animal carcass unless the bone has been sterilized in the manner subscribed above.
PDF created with pdfFactory trial version www.pdffactory.com
Coastal Profile of the Erongo Region - August 1999 152
Preservation of Trees and Forests Ordinance 37 of 1952. This Ordinance seeks to better protect, preserve and utilize trees and forest produce, and the regulation of veld burning, to regulate the trade in forest produce and to control the exportation and importation thereof. The terms forest means; anything which is produced by trees or is grown in a forest and included timber, wood, firewood, poles, laths, droppers, kraalwood, branchwood and other waste wood, charcoal, plants, grass, reeds, creepers fiber, flowers, fruit, seed, roots, bulbs, bark, rubber, latex, gum and the game, birds, skins, horns, ivory, fish, honey, wax, bees, shells, earth, stone, gravel any anything naturally found in or obtained from a forest. In the Second Schedule of the Ordinance, the following tress, plants and forest produce are listed; Anaboom, Kameeldoring, Nara, Mopane. Section 17 gives the justice of the peace, forest officer and a police officer the authority to seize and detain any forest produce which has, on reasonable suspicion, been wrongfully removed. Such seizures must be reported to the district magistrate, in terms of Section 19, who must make an order with regards the seized articles further retention or disposal. Section 27(3) sets out the offenses under the Ordinance, noting that no person shall, without authority cut, injure, destroy, collect, take or remove any tree, timber or other forest produce or injure , alter, shift, remove or interfere with any beacon, boundary mark, fence or any other notice. Subsection 4 prohibits any person to clear, break up or cultivate land and in any manner hunt, destroy or attempt to hunt or destroy game, birds or other animals or enter with a dog or a gun or rob or attempt to rob a beehive or disturb or remove any swarm of bees. Section 27(1) provides that any person convicted of any of these offenses will be liable to a fine not exceeding one hundred pounds or to imprisonment not exceeding 6 months. Forest Act No. 72 of 1968. The Act does not introduce anything new with regards environmental enforcement, except for the establishment of a Forestry Council and a Forestry Industry Fund and a national hiking way system, and a very closely reflects Ordinance 37 of 1952. It is slightly wider definition of forest produce and while the offenses are substantially similar, the penalties limit the fine N$100 and or imprisonment of not exceeding 6 months. Petroleum (exploration and production) Act No. 2 of 1991. Section 71 of the Act deals with the liability of holders of production licenses for the pollution of the environment or other damages or losses caused. Subsection 1 states that when in the course of production operations carried out under a production
PDF created with pdfFactory trial version www.pdffactory.com
Coastal Profile of the Erongo Region - August 1999 153
license any petroleum or other substances are spilled in the sea or on land or any water or under the surface of any land or the sea or such land or water is otherwise polluted or any plant or animal life, whether in the sea, other water or on , in or under the land is endangered or destroyed or any damage or loss is caused to any person, including the State, by such spilling or pollution, the holder of the production license shall report such spilling, pollution, loss or damage to the Minister, take at its own cost all such steps as may be necessary in accordance with good oilfield practices or otherwise as may be necessary to remedy such spilling, pollution, loss or damage. Section 71(2) states that should the damage not be remedied satisfactory the cost incurred to remedy the spilling, pollution or damage could be recovered in a competent court. Section 73 sets out that should any person obstruct or hinder any designated official, make or provide any false or misleading information, then that person can be liable on conviction to a fine not exceeding N$20 000 and or imprisonment not exceeding 5 years. Section 74 provided that should an offense , as envisaged by the Act, be committed within the jurisdiction of that magisterial court, then notwithstanding the jurisdiction of the High Court, the magistrates court will have the jurisdiction to try any offense under the Act. Minerals (Prospecting and Mining) Act No. 33 of 1992. Section 50 of the act states that in addition to ant term and condition in a mineral agreement and any term and condition contained in any mineral license, it shall be a term and condition of any mineral license that the holder of such license shall prepare for approval by the Commissioner an environmental impact assessment indicating the extent of any pollution of the environment before any prospecting operations or mining operations are being carried out and an estimate of any pollution, if any, likely to be caused by such operations or mining operations. If any pollution is likely to be caused, an environmental management plan indicating the proposed steps to be taken in order to minimize or prevent to the satisfaction of the Commissioner any pollution of the environment in consequence of any prospecting operations or mining operations carried on by virtue of such mineral license. The management plan must be revised from time to time as circumstance change or if required by the Commissioner. Section 128 of the act states that when a prospecting or mining operation has been canceled or has expired, or if the area in which such operation was conducted is abandoned, the Minister may direct the holder of the license to demolish any building or structures and to remove from the area all debris and any other object brought into such area. The holder must take all steps as may be necessary to remedy to the satisfaction of the Minister any damage caused by ant prospecting or mining operations carried on by the license holder to the surface of and the environment in such area. Section 128(3) provides that should the license holder fail to comply with the direction then he will be guilty of an offense and liable to a fine of N$100 000 and or imprisonment of 5 years.
PDF created with pdfFactory trial version www.pdffactory.com
Coastal Profile of the Erongo Region - August 1999 154
The issues of pollution liability and environmental damage in Section 130 are much the same as those contained in the Petroleum Act as handle above. Section 133 deals with the offenses for persons who hinder or obstruct any designated officer, makes or provides misleading information, transgresses boundaries in reconnaissance, prospecting or mining operations, unlawfully destroys or displaces beacons or boundary marks shall be liable to a fine of N$8000 and or imprisonment of 12 months. Section 136 endorse the forfeiture of any objects used in the commission of the offense, including the minerals itself of the convicted persons. Sea Fisheries Act No. 29 of 1992. The Act defines fish as every species of sea animal, whether vertebrate or invertebrate, including the spawn or larvae of such animal, but excluding any seal or bird. The high water mark is defined as the line of highest astronomical tide and the low water mark as the lowest astronomical tide. The sea is defined as the water and the bed of the sea including the sea shore and the water and the bed of ant tidal lagoon, being a lagoon in which a rise and a fall of the water level takes place as a result of the tide. The seashore means the water and land between the low and high water marks. Section 5 of the Act gives the Minister the authority to designate posts, delegate of fishery control officers. These designations can be from the Ministries of Environment, Works, Defense and the Local Authority. Under Section 33(1) any person who catches or kills fish by any means of any firearm, explosives, poison or noxious substance, catches fish with fishing gear other than those allowed in the regulations or catches fish other than the prescribed manner will be guilty of an offense liable to a fine not exceeding N$1000 and or to imprisonment of 15 years. The above mentioned fines also apply for persons who discards in the sea any dead or dying fish or dumps or discharge anything that may cause injury to fish, fish food or aquatic plants or which may disturb or change the ecological balance in any area of the sea or which may detrimentally affect the marketability of fish or aquatic plants or which may hinder the catching of fish. Section 35 of the Act gives the court the jurisdiction to forfeit to the State any fish, fish products, plants, shells, guano, fishing gear, vessel or vehicle used to commit the above mentioned offenses. The Ministry of Fisheries and Marine Resources is in the process of preparing new legislation to amend and replace area of the current fisheries legislation. Atmospheric Pollution Prevention Ordinance No 11 of 1976. The Ordinance define dust as any solid matter in a fine or disintegrated form which is capable of being dispersed or suspended in the atmosphere. The Ordinance is very
PDF created with pdfFactory trial version www.pdffactory.com

Coastal Profile of the Erongo Region - August 1999 155
contained in setting out Scheduled Processes and strict interpretation would have to be followed with regards to a deemed harmful process. Section 1 deals with the establishment of an executive committee and its authority to appoint inspectors. Section 4 – 9 deals with the control of noxious and offense gasses within controlled areas. Sections 10 – 22 deal with pollution by smoke. Section 23 – 31 deals with dust control. Sections 32 – 36 deals with pollution of the atmosphere by gasses emitted by vehicles and is under the jurisdiction of Local authorities. The Executive Committee has under and by virtue of the provisions of section 4(1)(a) of the Ordinance declared the whole Namibia as a controlled area, except the eastern Caprivi, for the purposes of the Ordinance. The ordinance defines a noxious or offensive gas as any of the following groups of compounds when in the form of gas, namely hydrocarbons, alcohol’s, aldehydes, ketones, ethers, esters, phenols, organic, acids, halogens, organic nitrogen, sulphur and halogen compounds, cyanides, cyanogens, ammonia and its compounds, inorganic acids, fumes containing antimony, arsenic, beryllium, chromium, cobalt, uranium, radon, cadmium, copper, lead, manganese, mercury, vanadium or zinc, cement works fumes and odours from purification plants, glue factories, cements works and meat, fish or whale processing factories, fumes containing iron, nickel, aluminium, magnesium, molybdenum, titanium, tungsten, selenium, potasium, sodium, silicon, calsium, phosphorous and its compounds, carbon monoxide, acetylne and benzene, amines, pyridine and its derivatives, polycyclic hydrocarbons, smoke, grit and dust and any other gas, fume or particulate matter which the Executive Committee may declare to be a noxious or offensive gas. Section 43 provided for the conviction of offenders and the issuing of fines of N$1000 or imprisonment of 1 year. Subsequent convictions may entail a fine of N$2000 and 2 years imprisonment. Hazardous Substances Ordinance No 14 of 1974. The Ordinance state that the Executive Committee may declare any substance or mixture to be a Group 1 or Group 2 hazardous substance. The is also Group 3 and 4 hazardous substances. National Monuments Act No 28 of 1969. The Act seeks to provide for the preservation of immovable and movable property as National Monuments and the creation of a National Monuments Council. A monument is defined as any property declared under the act to be a national monument. Section 12 disallows any person , subject to the issuing of a permit, from destroying, damaging, excavating or removing from its original site or export from Namibia any meteorite or fossil, Bushman painting, drawing or painting on stone, implements, ornaments or structure used by people before 1652, the anthropological or archaeological contents of graves, caves, rock shelters, middens, shell mounds or other finds, materials or objects.
PDF created with pdfFactory trial version www.pdffactory.com

Coastal Profile of the Erongo Region - August 1999 156
Section 16 allows for a fine of N$5000 and or 12 months imprisonment and subsection 6 and 7 requires the convicted person to repair the damaged caused. Water Act No 54 of 1956. The act defines public water as any water flowing or found on or derived from the bed of a public stream, whether visible or not. The act defines the right to water and the control and use of public water. Section 23 deals with the prevention of the pollution of water and states that any person who willfully or negligently does any act which pollute any public or private water, including underground water or sea water in such a way to render it less fit for ordinary use by other persons, the propagation of fish or for recreational purposes shall be guilty of an offense. Section 2 states that cost incurred to prevent pollution from mining or industrial areas to the public and private water sources may be redeemed from the person carrying on such operations. Section 23A deals with the pollution of public and private water sources through agricultural operations and allows the Minister to instruct the offender to take the necessary steps to prevent the pollution on his own expense. The fine for offenses against the Water Act are N$50 000 and or 2 years imprisonment. Second offenders could be fined with N$100 000 and or 4 years imprisonment. The fine may also be enlarged in order to be equal to the amount gained by the offender through the pollution operations. Soil Conservation Act No. 76 of 1969 The Act defines a land occupier as any person whom as owner, lessee or otherwise has the management, charge, control or the use of any land, whether he resides on the land or not, and includes any person who has the right of cutting trees or wood on any land or of the removing trees or wood, any person who has a right to remove sand, stone or soil from any land and any person who has the right to carry on prospecting or mining operation on any land in relation to land under control of the Local Authority. Section 3 of the Act gives the Minister the right to declare directions with reference to the land relating to the cultivation of land, the protection, stabilization, the application of crop rotation and the disposal of crop residues, the laying out of lands, the destruction of vegetation, the planting of trees in natural water courses, the drainage of natural water courses, the protection of maintain slopes and water courses which are subject to erosion, the protection of barrier dunes on the coast or other dune where drift sand may occur, the burning of pastures, the number of animals that may be kept on land or any other disturbance of the soil which create any form of pollution or erosion by silt or drift sand. The directions are binding to all owners and occupiers of land and their successors. The fine for contravention is N$1000 and or 2 years imprisonment.
PDF created with pdfFactory trial version www.pdffactory.com
Coastal Profile of the Erongo Region - August 1999 157
Nature Conservation Ordinance No. 4 of 1975. The Environmental Policy contained in Section 14 is fundamental to the mandate of enforcement in a declared area. The section states that the Executive Committee may declare any area a game park or nature reserve for the propagation, protection, study and preservation therein of the wild animal life, fisheries, wild plant life and objects of geological, ethnological, archaeological, historical and other scientific interest and for the benefit and enjoyment of the inhabitants of the Territory and other persons. The Ordinance is mostly concerned with the hunting of huntable game, or the prohibition thereof, restrictions on capturing and firearms, in private and State game parks. Sections 86 and 87 deal with the offenses and penalties. He fine is limited for a first conviction to N$250 and or 3 months imprisonment. None of the many regulations passed in terms of Section 84 of the Ordinance reflect proper environmental principles, conservation, management and or their implementation. In considering the ambit of the Ordinance and in reviewing the objectives of the Ministry through the last 24 years of gazetted regulations, sound environmental management and conservation seems to be of the least concern. Resource exploitation rather than proper conservation and management has been the direction of the ordinance. Under Government Gazette No. 1554, of 12 May 1997, Government Notice No. 83, and in terms of section 84 of the Nature Conservation Ordinance the Minister of Environment and tourism made the following amendments to the regulations to be inserted after Chapter XVII A of the Ordinance. The amendments are known as Chapter XVII B - Conservancies and Wildlife Councils. Section 155B(1) states that an application made to the Minister in terms of section 24A(1) of the ordinance for the declaration of an area as a conservancy shall be made on Form 1, and shall be submitted to the Permanent Secretary. In making an application for a conservancy the following must be set out: • the objectives of the committee as a conservancy committee, including the
sustainable management and utilization of the game within the physical boundaries of the conservancy in accordance with the game management and utilization plan and the equitable distribution of the benefits derived therefrom.
• the procedure for the election and the removal of the members of the conservancy committee
• the powers and responsibilities of the conservancy committee including powers to enter into agreements relating to consumptive and non-consumptive use of the game
• provisions relating to the holding of meetings of the conservancy committee, AGM’s, recordings and proceedings
• criteria and procedures for being recognized as a member of the community, provided that no one may be excluded from membership on the grounds of ethnicity or gender
• the rights and obligations of the community members • policy decision procedure and the equitable distribution of benefits • management of the conservancy committee’s finances.
PDF created with pdfFactory trial version www.pdffactory.com
Coastal Profile of the Erongo Region - August 1999 158
The Ministry of Environment and Tourism is in the process of finalizing the Environmental Management Act. The Act is a continuation of the Environmental Management Policy of the Ministry. Accommodation Establishment and Tourism Ordinance No. 20 of 1973. The Ordinance defines a angling area as a potion of a tourism recreation area situated along the coast of the Atlantic Ocean which measures 1.5km inland from the high water mark. A Secluded Area is defined as a piece of land, within a tourist recreation area set aside by the Executive Committee for a specific purpose. Sections 9 and 10 seek to set out prohibited activities, but no penalties are set out in the Ordinance. Section 9 states that no person may , without the permission of the Executive Committee , in the tourist area: • drive a vehicle on a road if it is in whatsoever way indicated that the road is closed
to the public • drive a vehicle, buzz bike, powerdriven cycle, motor cycle or bicycle on any
portion of the beach which is situated between a secluded area and the sea • enter any secluded area with a buzz bike, power driven cycle or motor cycle • drive a vehicle faster than 20km/h in any place within a secluded area • kill, injure, hunt or disturb any wild animal except fish • pick, collect, mutilate or damage any tree, plant, herb, or any other object of value
or tamper therewith. • collect money from the public • carry on any trade or business Section 2 of the Accommodation Establishment and tourism Amendment Ordinance deals extensively with the appointment of tourism officers and section 55B deals with the power of the tourism officers. Sea birds and Seal Protection Act No 46 of 1973. The Act provided for the control over certain islands and for the protection and control of the capture and killing of sea birds and seals and their disposal. The Criminal Procedure Act No. 51 of 1977. The Act defines a peace officer as any magistrate, justice, police official, member of the prison services and any person who is a peace officer in terms of a notice issued under section 334(1) of the Act. In terms of Section 20 of the Act the State may seize certain articles which is concerned in or is on reasonable grounds believed to be concerned in the commission or suspected commission of an offense, which may afford evidence of the commission or suspected commission of an offense, which is intended to be used or is on reasonable grounds believed to be intended to be used in the commission of an offense.
PDF created with pdfFactory trial version www.pdffactory.com

Coastal Profile of the Erongo Region - August 1999 159
The purpose of this section is to give the State the power to seize certain articles in order to obtain evidence for the institution of a prosecution. Literally, everything may be seized in terms of this section. An article may only be seized under section 20 by virtue of a warrant issued in terms of section 21, with the exception provided for in sections 22, 24 and 25. Section 21(2) states that the search warrant issued under subsection (1) shall require a police official to seize the article in question and shall to that end authorize such police official to search any person identified in the warrant, or to enter and search any person identified in the warrant and to search any person found on or at such premises. Under Section 22, a police official may without a search warrant search any person or container for the purpose of seizing any article referred to in Section 20 if (a) the person consents to the search for and seizure of the article (b) if the police official has reasonable grounds for believing that the search warrant will be issued to him in term of section 21(1)(a) or if the delay in obtaining a warrant would defeat the object of the search. Section 30 and 31 deals with the disposal of articles after its seizure and in circumstances where no criminal proceedings were instituted. Rio De Janeiro Declaration of Environment and Development 1992. Aspects of International Law as binding States to recognize and implement legal procedures and requirements. The Declaration establishes a number of procedural requirements, including public participation in environmental decision making and adequate public access to information. 7.4 ENFORCEMENT PROCEDURES 7.4.1 Background The enforcement issues described in this chapter emphasise particularly the activities that influence the environment in the coastal zone. Enforcement is defined as the application of existing legislation e.g. the methods used by different authorities in order to force the public to keep to the rules. The Authorities responsible for protecting the marine and terrestrial environments in the study area are the regional offices from the following ministries:
• The Ministry of Environment and Tourism (MET) is the body responsible for the protection of the terrestrial environment. The responsibility is covering the area on land down to the low water mark.
• The Ministry of Fisheries and Marine Resources (MFMR) is the body
responsible for the conservation, utilization and control of the marine resources. Their responsibility is covering activities offshore at sea, and inshore to the high water mark.
PDF created with pdfFactory trial version www.pdffactory.com

Coastal Profile of the Erongo Region - August 1999 160
• The Swakopmund and Walvis Bay Municipalities are responsible for some environmental protection in the urban zones, for sewage treatment and waste disposal etc. Enforcement related to this, is due to time constraints not a part of the study.
The enforcement issues described in this chapter have for practical reasons been confined to conservation issues, tourist behaviour in the fragile desert environment and the ski-boat and shore angling fishery. The chapter does not deal with the enforcement of discharge standards in relation to potential pollution problems. The project area has when it comes to enforcement issues been divided into 5 sub-areas, see the following plan no. 2.
The five areas seen on the above shown plan will be described individually in the following. The content of each description will be: a. Regulations relating to the Area. b. Conservation interests. c. Conflicts. d. Existing enforcement procedures. e. Problem identification. f. Recommendations.
PDF created with pdfFactory trial version www.pdffactory.com
Coastal Profile of the Erongo Region - August 1999 161
The recommendations include projects that are launched during the project period and will continue under the auspices of the counterparts. Also the recommendations can be used to indicate the weakness of the existing legislation. The solution to the different legislation questions is closely linked to institutional and legislation issues dealt with in the relevant chapters. 7.4.2 National West Coast Tourist Recreation Area (WCRA). 7.4.2.1 Regulations. The West Coast Area is defined from the point where southern bank of the Ugab River intersects the low-water mark of the Atlantic Ocean and to the south where it intersects the magisterial district of Swakopmund and then east to a point where it intersects the northern boundary of the Namib Naukluft Park. Excluded from the WCRA are Cape Cross Seal Reserve, The Henties Bay Peri Urban Development Area and Wlotzkasbaken. The area is regulated by the West Coast Recreation Area Ordinance 20 of 1973, “Accommodation Establishments And Tourism Ordinance”. The regulations are made mostly for directing tourism, secluded areas at campsites, amount of tariffs etc. Enforcement relies on chapter II, article 9 (a)(i) and 9(e), which roughly indicates that no person may damage any object of botanical, zoological, geological, archaeological, historical or any other scientific interest. There is no article about penalty in the ordinance. MET has asked the Magistrate’s court for guidelines. They have decided a fine limit of a maximum of N$300 per transgression. 7.4.2.2 Conservation interests. • The Lichen fields near Cape Cross, at Lagunenberg and at Wlotzkasbaken. • A Unique assemblages of succulent plants at the Dolorite dikes in the area inland
to the north of Swakopmund. • Important feeding areas for migrating birds e.g. The Swakopmund Salt Works. • Important breeding areas for Damara terns. 7.4.2.3 Conflicts. • Different habitats are damaged by off-road vehicles. • Regarding mining activities: Namsalt pans at Cape Cross have a 39 ha claim and a
further 450 ha mining grant area. In addition many exclusive prospecting licenses have been granted to different firms e.g. small scale mining prospect licences have been issued to individuals or small companies.
PDF created with pdfFactory trial version www.pdffactory.com
Coastal Profile of the Erongo Region - August 1999 162
7.4.2.4 Existing enforcement procedures. There is no routine control in this area to protect conservation interests. It is the MET offices in Swakopmund and Walvis Bay, who are responsible for enforcement. They rather react if they are in the area or are contacted in different ways. When a person is caught, the MET officer will issue a fine and inform on the importance of environmental protection. If the person becomes aggressive, the officer will let him go, note the car registration number and transfer the case to the police. The officer is not allowed to receive revenue, the offender has to pay the fine at the office of a magistrate. If the offender doesn’t pay, the prosecution will come from the Magistrate’s court. The procedure follows The Criminal Procedure Act, Act 51 of 1977. It is also possible for people to contact the police, if they witness offenders damaging the environment. There is good co-operation between the Police station in Henties Bay and the MET. There is a fine register (in both MET offices) including details of the crime, fines and dates. In this area about 50 fines were issued last year. The calculation is dependent on MET activity in the area. If MET officers were patrolling routinely the number of fines would be larger. MET has produced a good ‘one page information’ sheet for the West Coast Recreation Area with a map showing fish spots, camps, sensitive areas etc. on one side and environmental messages on the other. The information is available at all the campsites and in the MET offices. 7.4.2.5 Problem identification. There is no measure or quantification of the impact of the activities in the area. The impacts to the environment are observed and evaluated by MET officers when patrolling the area. The area on both sides of the road from Swakopmund to Cape Cross are criss-crossed with tracks from off-road drivers especially between Mile 14 and 72. According to calculated data from the MET/tourism office in Swakopmund, 1323 persons were visiting Mile 72 and 2161 visited mile 14 in the 3 months period from December to February 1998. The inspectors from MFMR issued 269 fines in the 3-Month period from January to March 1998. So there is a need for routine patrolling , but it is impossible with the present number of human resources especially in MET. Some claim that it is mainly South-African anglers who are breaking the rules. They often leave Namibia without paying their fines. There is no system to prosecute them in their home country. It seems as if they don’t have a basic understanding of what they destroy, and they don’t understand that they have to drive on the roads.
PDF created with pdfFactory trial version www.pdffactory.com

Coastal Profile of the Erongo Region - August 1999 163
Presently enforcement of mining activities is difficult for MET. It is the Ministry of Mines and Energy who are responsible for the permission relating to prospect licenses and mining operations. Also the control of mining activities falls under this ministry. There is co-operation with the MET, central office in Windhoek, because large scale mining activities require an Environmental Impact Assessment. Mining in the West Coast Recreational Area is mainly small scale mining. The Ministry of Mines and Energy (MME) grant the claims. The claims should be followed by an environmental contract supplied by MET. This contract includes provisions for restoring the environment etc. and will be a tool in enforcement for MET. Unfortunately the system of the environmental contract is not yet functioning, because of conflict between MET and MME regarding the content of the contract. The contract may be too difficult to read and understand by the ‘small miner’. It should be simplified, but on the other hand it should also include all the environmental conditions. It would be easier to enforce and to control development if there were clearly designated areas for mining activities rather than allowing it to take place all over the area. The resources of MET/Resource management regionally along the coast are very sparse compared to the MFMR. The tourism section in MET has labourers situated at the campsites from mile 14 to mile 108. If they were allowed to enforce conservation legislation it may help. 7.4.2.6 Recommendations. • The regulations are tourism orientated and are not suitable for the protection of the
ecologically fragile areas. The ordinance should be improved or included in a new nature protection act. Another possibility is to include the area in a new Coastal Zone Management Act for this region.
• The regional coastal zone management committee could recommend the zoning of this area. Areas could be designated for different purposes and development supported by guidelines.
• The layout and placement of the enforcement signs could be improved. • Rehabilitate the area between the road and the beach by erasing the tracks with
rakes and designate access routes to the campsites and the beach. • Fence of the most sensitive areas. • Launch an environmental awareness campaign e.g. a pamphlet explaining the
values and the importance of protection, interpretative signs, radio, television, newspaper etc.
• An awareness campaign targeting anglers. • Integrated enforcement between MET and MFMR, in order to enforce both
conservation on land and protection of the fish stock along the coastline. • Upgrade the campsites with better signs and information. Information should
integrate “Fisheries” and “Tourism”. • Designate specific areas for mining that are environmentally sensitive. • Raise the amount of the fines applicable to environmental damage.
PDF created with pdfFactory trial version www.pdffactory.com

Coastal Profile of the Erongo Region - August 1999 164
7.4.3 The area south of Walvis Bay and north to Swakopmund 7.4.3.1 Regulations. This area was defined as the old RSA boundary of Walvis Bay. It falls under the jurisdiction of Walvis Bay Municipality, but legally the land is a combination of municipal and state land. The Walvis Bay Act, Act No. 1 of 1994, makes provision for the recognition and enforcement of Namibian laws at the time of the transfer of Walvis into Namibia. But because the Act neglects to give reference to South Africa ordinances, they ceased to be applicable. Unfortunately the 1991 declaration of the Walvis Bay Nature Reserve as a multi use nature reserve was not replaced by Namibian legislation. There is uncertainty regarding which authority is in charge of the overall management of the Lagoon. The WB Town Council has only limited management and control functions over the lagoon. The Town Planning Scheme however shows that the land adjacent to the lagoon as a conservation area. The general regulations from the Nature Conservation Ordinance 4 of 1975 make only a few provisions for the protection of wildlife habitat outside of proclaimed areas. None of the areas within Walvis Bay Municipality are proclaimed areas. There are no regulations controlling activities in the sand dunes and Damara tern breeding area. It is not protected at all and is totally unregulated. The protection of fish in the lagoon falls under the Sea Fishery Act. The bathing area defined as the seashore situated within or adjoining the area in which the local authority has jurisdiction, is regulated by a Bylaw. The Walvis Bay Municipality By-Law for the Control of the Seashore and the Sea. In the By-law there are rules that prohibit littering and off-road driving in the bathing area. The regulation is mainly made to protect the bathers. The lagoon, wetlands and Walvis Bay is declared a Ramsar site and is included in the international convention Namibia signed the Ramsar Convention in 1995, but the convention has still not been promulgated as regulations locally. However, the principles and requirements of the convention can be upheld today, because they form part of international customary law. The convention on Biological Diversity was ratified in 1992. It will also give rise to new regulations. 7.4.3.2 Conservation interests. • The Walvis Bay wetlands, including the lagoon and the salt works, have a high
diversity and abundance of birds, including rare and endangered species. • The Walvis Bay tidal lagoon is a nursery area for several fish species, and has a
high concentration of estuarine invertebrates.
PDF created with pdfFactory trial version www.pdffactory.com

Coastal Profile of the Erongo Region - August 1999 165
• The sewage works at Walvis Bay, are a feeding and resting area for many birds. • Important breeding areas for Damara terns are found between Swakop River and
Langstrand. • The coastline in the area is rich in feeding migrant wading birds. • The sand dunes host a unique variety of desert organism specifically adapted to
this environment. 7.4.3.3 Conflicts. • Disturbance and damage by off-road drivers. Uncontrolled tourist activities such
as quad biking, sand boarding, moto-cross etc. • Other tourism activities such as bird watching from small airplanes, micro-lights. • Urban and industrial growth. • Organic pollution from the fish factories. • Future aquaculture sites. • Mining activities. • The extension of the saltworks area. • Motorised marine activities disturbs the birds. 7.4.3.4 Existing enforcement procedures. This area differs from the others by its dense human population, many of whom are concerned about the environment. The responsibility of the Walvis Bay wetlands is today a shared responsibility between MET, Walvis Bay Municipality and MFMR. MET carry out enforcement because the lagoon is a Ramsar site, the Municipality because it is municipal land, and MFMR because the lagoon itself falls under their jurisdiction. The international convention on wetlands is not transferred into national regulation, so MET enforces their own Ordinance 4 of 1974 to protect this area. Environmental transgressions are reported to the MET office in Walvis Bay. The culprit is apprehended and issued with a fine. If it is necessary to take the case to court the MET is responsible for the legal investigation. MET have placed signs in the Damara tern breeding area discouraging off-road driving. There are no enforcement procedures applied to activities in the sand dunes, but MET officers have meetings with the dune tour operators to try to establish some rules on a voluntary basis. Signs are placed at the lagoon by the Walvis Bay municipality stating that littering is not allowed, small boats are not allowed and dogs have to be leashed.
PDF created with pdfFactory trial version www.pdffactory.com
Coastal Profile of the Erongo Region - August 1999 166
7.4.3.5 Problem identification. The quad biking and similar activities in the dunes are the biggest problem. It is also a problem for people out walking in the dunes. Along the coast in the western part of the area, off-road driving is an additional problems. There are probably 4-6 quad bike tour operators. There is no statistical information present of how many bikes they have or how many tourists make use of their services per year. The quad bike tour operators only need a road carrier license from the Ministry of Works, Transport and communication. It is voluntary to register at the MET. People visiting the area on private quad bikes are increasing. In the final draft of The Environmental Bill, there is a list of activities requiring environmental impact assessment. Tourist activities such as quad biking are not on the list. Small airplanes flying over the lagoon are difficult to control as well as the minimum flying height. The main problem is proving in court that an aircraft is flying below a certain height. MFMR gives, at certain occasions, the local angling organisations permission to fish in the lagoon without informing or consulting MET. After a local “Walvis Bay Lagoon workshop” in 1997, presented by The Environmental Action Committee, a new project called; “The way forward – Walvis Bay lagoon” project was launched. It aims to proclaim the lagoon a nature reserve and to give Walvis Bay Municipality the management of the lagoon. 7.4.3.6 Recommendations • Let the regional coastal zone management committee zone this area, designate
areas for different purposes with guidelines, weigh out the interests together in a public hearing process.
• By-laws could regulate quad biking and other uncontrolled activities. • Register the Walvis Bay lagoon as a no fly zone • Apply the WCRA regulations to the coast from Walvis Bay to Swakopmund, and
enhance them or give some parts of the area park status as in the old ordinance. • Include the area in a new proposed Coastal Zone Management Act for this region. • In the Nature Conservation ordinance, provision is made to declare any area as a
nature reserve. The Walvis Bay lagoon and Damara tern breeding areas could thereby obtain park status.
• Quad bike tour operators could be requested to licence their bikes or to pay a green levy and to use demarcated areas in the dunefields.
• For the Walvis Bay wetland, parts of the old RSA legislation could be used as an example for new regulations. The regulations were very clear and provided for the area to be used as a nature reserve/multi use area. One alternative could be to include the wetland/lagoon in the Namib Naukluft Park and enforce according to those regulations.
• Integrated enforcement between Municipality, MET, MFMR.
PDF created with pdfFactory trial version www.pdffactory.com

Coastal Profile of the Erongo Region - August 1999 167
• Fence off the most sensitive areas. • Environmental awareness and enforcement campaign: e.g. a pamphlet explaining
the values and the importance of protection, interpretative signs and different enforcement signs.
• Raise the amount of fines and introduce green levies. • Require environmental impact assessments for quad biking activities. 7.4.4 The Nature Reserves: Sandwich Harbour, Namib Naukluft Park, Cape
Cross. 7.4.4.1 Regulations. Within the project area the Sandwich Harbour Reserve is defined from the southern Erongo Region boundary to the old RSA boundary to north at the Kuiseb River. The area is included in the Namib Naukluft Park and proclaimed as a nature reserve. The regulations at Sandwich and Cape Cross Seal Reserve are administered under the Nature Conservation Ordinance, Ordinance 4 of 1975 and the Regulations relating to the Nature Conservation Ordinance, Ordinance 240 of 1976. The Ordinance and its amendments are focused primarily on the control of consumptive uses, for the protection of game, wild animals and indigenous plants, with special attention to hunting and sales. There are rules for keeping the game and game hunting at commercial farms, the transport of game and wild animal etc. Regulations 240 of 1976 gives a definition of the Namib Desert Park and Cape Cross Seal Reserve. Both Cape Cross Seal Reserve and Namib Naukluft Park are described in this as “game parks” and are regulated according to chapter II article 9. Also, Nature Conservation Ordinance, Ordinance 4 of 1975, Chapter II, Article 18 can be used for this purpose. The powers of nature conservators are well described, as is prosecution and offences in article 85 to 89. 7.4.4.2 The conservation interests
• Sandwich Harbour is a unique site for different bird species. • Cape Cross is one of the largest land based colonies of the Cape fur seal.
7.4.4.3 Conflicts • Disturbance from illegal angling activities e.g. off-road driving and littering. • Disturbance from other tourism activities for example off-road driving • Cape Cross: conflicts with mining activities, possible conflicts regarding future
development an possible conflicts regarding the utilisation of the seals. 7.4.4.4 Existing enforcement procedures. A permit is required to enter the reserves. At Cape Cross the permit is issued at the gate, whereas for Sandwich Harbour permit are obtained at the MET tourism office and some garages in Swakopmund and Walvis Bay. On the permit the different rules relating to the area are listed.
PDF created with pdfFactory trial version www.pdffactory.com
Coastal Profile of the Erongo Region - August 1999 168
If the officers catch people without permits, driving off the road in Cape Cross, (there are no proclaimed roads in Sandwich), and damaging flora or fauna they will be fined. There are prescribed fines for the different ‘crimes’ in the regulations. No vehicles and fishing are allowed in the Sandwich Harbour area. 7.4.4.5 Problems. The entrance on the northern boundary of Sandwich harbour is not clearly demarcated. At Cape Cross anglers enter the reserve illegally. They are often informed by others about the good fishing spot in the reserve. It is not possible to erect a fence at the beach. 7.4.4.6 Recommendation. • The information printed on the Namib Naukluft Park permit should be backed up
with an awareness campaign. • Raise the amount of fines. • Better information at Cape Cross. • Better co-operation between MFMR and MET along the coast. • A sign should be erected stating that it is illegal to fish in the CCSR. 7.4.5 The Inland Area 7.4.5.1 The Regulations This area is regulated by the Ordinance of Nature Conservation, 1975 with its amendments. The ordinance with amendments are used both at commercial farms, in game reserves and in communal land. In acknowledgement of the importance to protect biodiversity outside of protected areas the government in 1996 established legislation and regulations which make provision for Communal Area conservancies and wildlife councils. The purpose is to encourage people on communal land to manage their land and resources on a sustainable basis. It aims at giving communal farmers the same rights over wildlife and natural resources as commercial farmers have. The Nature Conservation Amendment Act uses the Conservancies as the means by which limited rights to manage and benefit from wildlife and tourism are given to a specified group of people living within communal areas. The Act sets a number of conditions which rural communities have to meet before a conservancy can be registered by MET. The amendment of the Regulations relating to nature conservation, Regulation 304 of 1996, insert chapters of application for declaration of an area as conservancy, establishment of wildlife councils etc. This inland area also includes Spitzkoppe, Brandberg and sites of high natural quality well visited by tourists. Spitzkoppe is a declared national monument and as such falls under the jurisdiction of the National Monument Council, which is housed in the
PDF created with pdfFactory trial version www.pdffactory.com

Coastal Profile of the Erongo Region - August 1999 169
Ministry of Basic Education and Culture who are responsible for the legislation. The local people in the community take care of protection according to a management plan adopted by the National Monument Council. The Brandberg is also declared a national monument. A Brandberg Trust has been created but they need equipment, training, money and help to draft a management plan for the area.. They applied to UNESCO in order for Brandberg to be proclaimed as a cultural world heritage site. The Trust is working to fulfill the requirements from UNESCO. Once it is a proclaimed heritage site it will be enforced according to the management plan established for the area. 7.4.5.2 Conservation interests • The gravel plains are important for different species of flora and fauna. • The dolorite dykes inland north of Swakopmund are characterised by unique
assemblages of succulent plants. • The wildlife (rhino, elephants and species of game) • Spitzkoppe and Brandberg are areas of high natural, cultural and archaeological
value. 7.4.5.3 Conflicts • Poaching on farms and game reserves. • Off-road driving in riverbeds disturbs wildlife. Tourism development in this area
could damage flora and fauna, because the eco-tourists are going more and more away from gravel roads and are making their own tracks.
• The Management capacity of Spitzkoppe in relation to the increasing tourism is insufficient.
• Tourism in Brandberg is informal and uncontrolled. • Domestic animals in monument areas 7.4.5.4 The enforcement procedures. The regulation of commercial farming is very clear. The farmers have to apply for permits for different activities at their farms. The MET staff situated at the different offices in the region process applications and give recommendations to Head Office, Permit Section. The enforcement of illegal hunting in communal land is carried out by the ranger situated at Uis. The illegal hunter is taken to the police station. The cases later end up as a court case. The illegal hunter will get a fine or go to prison. It is the court who decides the punishment according to the regulations. Problem animals such as leopards and cheetahs are often handled by the ‘Wildlife Trust’ who return the animals back to nature instead of destroying them. In communal land enforcement will be carried out according to the management plan that the conservancies have to draw up. The MET field staff will provide support in the wildlife management. There are no declared conservancies and wildlife councils in the area yet, however some are in the process of being developed.
PDF created with pdfFactory trial version www.pdffactory.com

Coastal Profile of the Erongo Region - August 1999 170
It takes time to create awareness regarding the importance of wildlife protection and nature conservation in the local communities. 7.4.5.5 Problem identification. The idea of making the rural communities responsible for the land is in principle a very good idea. It is the communities that decide whether they want a conservancy and how it will be run. The system regarding building up ‘community organizations’ is very time consuming for the MET staff, if it is going to function properly. So in practice it is difficult to implement. The Ministry of Environment and Tourism has produced a printed document “A Toolbox for the Establishment of Communal Area Conservancies” explaining the methods to establish a conservancy. The main problem in enforcement in this area is not inadequate legislation but the great distances and the lack of human resources. With only one ranger situated in this big area and the 2 regional offices located at the coast with limited number of staff it is almost impossible to enforce properly. 7.4.5.6 Recommendations. • Employment of more staff is needed. Establish an office at Omaruru with a senior
officer and two rangers, one for Omaruru district, one for Karibib district. • There is a need to improve legislation, to include nature in general and not only in
different proclaimed areas. • Protect the existing wildlife. 7.4.6 The Coastal shoreline 7.4.6.1 Regulations Enforcement described in this section is confined to activities along the coastal shore i.e. angling and lobster diving. The area along the coast is regulated by the Sea Fisheries Act, Act 29 of 1992 and the Sea Birds and Seals Protection Act, Act 46 of 1973. There are very clear regulations related to recreational fishing (coastal angling). A set of Regulations made in terms of the Sea Fisheries Act, Act 29 of 1992, came into force on 4 January 1993. A media release of coastal angling set up conservation rules concerning: • Prohibited species, • the season, size and amount of rock lobsters, • quantity limitations to a variety of mostly non-commercial marine organism, • provisions for methods of collecting or catching, trading, exportation and
importation of marine species, • angling areas and limitations to the number of fish per days catch, and
PDF created with pdfFactory trial version www.pdffactory.com

Coastal Profile of the Erongo Region - August 1999 171
• number allowed to be transported in a vehicle. Fishing is prohibited at Sandwich Harbour throughout the year and in the Walvis Bay Lagoon during the spawning season. The Sea Birds and Seal Protection Act, 1973 provides control over certain islands and rocks, for the protection and control of the capture and killing of sea birds and seals and for the disposal of the products of sea birds and seals. MFMR is protecting seabirds in the lagoon and along the coast according to the act. There are provisions in the Sea Fisheries Act to enforce other laws. MFMR will try to find a method to do it. They will co-operate with MET in the future. 7.4.6.2 The conservation interests. • To maintain a sustainable standing stock of fish and invertebrates and thereby
prevent over-exploitation • The conservation of spawning areas along the coast e.g. the lagoon of Walvis Bay
serves as spawning and nursery area for different fish species and is a habitat for a unique intertidal invertebrate fauna.
7.4.6.3 The conflicts. It is estimated that the ski-boat fishermen’s annual catches vary from 10 to 30 tonnes. There is no estimate on catches from angling. It is difficult to tell if the angling along the coast could contribute to a decrease in fish stock. The problem is more related to what could be described as reasonable behaviour. The anglers can take a substantial amount of a certain species during the season and too many fish according to the regulations. Afterwards it is possible for one person to sell them commercially and/or take several hundred kilo’s out of Namibia. Illegal fishing also takes place in areas, where fishing is not allowed in order to protect spawning areas and seal breeding. Angling in the lagoon disturbs the birds at low tide. Many divers take too many lobsters, because it is relatively easy. Afterwards they often sell them to restaurants in the Region. 7.4.6.4 Enforcement procedures. Besides operations offshore to control catches and landings, onshore operations are also carried out to monitor the fish factories, and to control recreational fishing. There is a routine control onshore at the coast from Walvis Bay to Kunene River following a weekly time schedule. The inspectors drive along the coast and inland if it is necessary. They have radio and telephone contact with each other through a central communication system situated in Walvis Bay. They are well equipped to do the enforcement alone and with help from other observers. There is also control at the seashore for ski boats from inspection vessels.
PDF created with pdfFactory trial version www.pdffactory.com
Coastal Profile of the Erongo Region - August 1999 172
The inspectors carry out the control by stopping cars, waiting for the divers to come ashore and by going to the anglers directly. The rules are very clear as to what is allowed and what is not. If somebody breaks the rules the inspector writes out a fine. The fine is usually N$300. The inspector is also allowed to confiscate the catch and to donate the perishables to institution who can use fresh fish. The inspector is not allowed to accept revenue. The offender has to pay an admission of guilt fine it at the office of the magistrate or the local police station. If the offender wishes the case can go to court. Regulations are very clear according to the Criminal Procedure Act, Act 51 of 1977. The inspectors from the MFMR also control motorboats, which are not allowed in the lagoon and they give the permits for angling in the areas that are closed for some periods of the year. In a 3-month period from January to March they issued 269 fines and 11 people were arrested. 7.4.6.5 Problem identification. It is a problem for the country in that it is easy to exploit the marine resources along the coast without paying anything. The law breakers transport the fish to other parts of the country or out of Namibia. There is work in progress in MFMR to introduce a fishing permit system. It could serve different purposes. First of all it will give revenue to the Ministry, it will be possible to calculate the amount of anglers visiting the coast and to estimate the catches. In addition, it will provide for a system to prosecute lawbreakers and prevent them from obtaining another permit in the country. Another idea is a fishing rod license. If a person has one rod he has to have one license, if he has three he needs three licenses etc. Regarding awareness, the only information MFMR gives to people, who would like to be informed about fishing regulation, is a copy of the media release related to the Act. This paper is understandable, but is not user friendly. At the tourism office in MET people get information about the campsite, but not the fishing regulations. There is no information about fishing regulations distributed at the campsites. However, two commercial publications are produced: Shell tide table guide, which is very good in giving information about the tide and the campsites, and fishing regulations for coastal angling. This pamphlet is only distributed from the Shell service stations. The other publication is a guide to angling, diving and accommodation in Namibia 94/95, written by private persons. In addition to the above MFMR are making a pamphlet with fish regulations and it is the intention to include nature conservation messages in this pamphlet.
PDF created with pdfFactory trial version www.pdffactory.com
Coastal Profile of the Erongo Region - August 1999 173
7.4.6.6 Recommendations • Raise the amount of fines for illegal angling. • Introduce a fishing permit system, that could be purchased at the post offices,
garages, tourism offices and at the campsites. Give conservation and regulation information together with the permit.
• Ensure that the income from selling permits goes back to protect the marine environment.
• An awareness campaign targeted at recreational fishing. Common information to the anglers can include conservation messages, campsite facilities and the fishing regulations, together with a tide table guide.
• Secure a dissemination way for the information materials, which is now uncoordinated. The best will be to combine the future information system together with the proposed permit. If a fishing permit system can not be implemented in the near future, it is better to produce the information material now.
• Train and give the tourism officers at the campsite the right to control the anglers and issue fines.
• Integrate the enforcement possibilities, so the MFMR officers can control and issue fines in aspects regarding nature conservation as well.
PDF created with pdfFactory trial version www.pdffactory.com

Coastal Profile of the Erongo Region - August 1999 174
8.0 POTENTIAL COASTAL POLLUTION SOURCES
8.1 WALVIS BAY 8.1.1 General level, pollution from municipality
The status of solid waste management in the Walvis Bay area has most recently been addressed in the report “Development of New Waste Disposal Site for Walvis Bay: Preliminary Engineering and costing (October 1998)” (Africon Namibia in association with Jarrod Ball and Associates cc). The report detailed and proposed a facility to meet waste disposal needs over a 30 year planning horizon.
8.1.1.1 Waste types There are two generic categories of waste, General and Hazardous, according to the risk that each type poses. These are defined as follows:
General waste is normal municipal solid waste, comprising rubble, garden, domestic, commercial and general dry industrial waste. It may also contain certain small quantities of hazardous substances dispersed within it, such as batteries, insecticides, weedkillers, fluorescent tubes and household medical waste such as used plasters and bandages.
Hazardous waste is waste, which, on account of its inherent properties such as toxicity, corrosivity, ignitability or carcinogenicity, has the potential to have a significant adverse effect on public health.
As part of the EEU’s environmental assessment and identification of alternative waste disposal sites, Steffen, Robertson and Kirsten (SRK) were appointed to carry out a waste audit to determine the nature and quantities of waste generated in Walvis Bay. Apart from the two main generic categories of general and hazardous waste, SRK also considered medical waste as a separate category. Special wastes such as abattoir waste and fish factory waste are also considered separately.
General waste The general waste stream comprises predominantly domestic waste collected by the Walvis Bay Municipality (WBM) from Walvis Bay, Narraville and to some extent, from Kuisebmond. However, most of the collection in Kuisebmond is done by “one person contractors” and is removed by the WBM.
A significant proportion of the general waste stream is garden waste produced by the WBM Parks Department as well as general households. This waste is collected mainly by the WBM and garden servicing companies. Street cleaning, beach cleaning and occasional special clean-up operations in Kuisebmond, Narraville and along the beaches also contribute to the general waste stream. On account of the high winds and the surrounding desert, this waste includes large quantities of sand.
A large amount of general waste is removed from businesses by private waste contractors or by the businesses themselves. The army removes its own waste
PDF created with pdfFactory trial version www.pdffactory.com
Coastal Profile of the Erongo Region - August 1999 175
(mainly domestic waste) from the two bases in Walvis Bay and Rooikop. Some general waste is also collected from the offshore oilrig. This waste stream comprises mainly non-hazardous industrial waste, paper, packaging, plastics, wood and some domestic waste.
No changes to the strategy for waste collection and transport are anticipated in the foreseeable future since each stakeholder will extend his service automatically into newly developed areas.
Hazardous waste As a result of the fishing industry and the operations at the Walvis Bay harbor, the majority of the hazardous wastes generated are oily wastes. These comprise heavy fuel oils and sludges resulting from tank cleaning operations, as well as old lubricating oils and oily water from the ships' bilges. The majority of waste oils is reprocessed by, inter alia, Wesco Scrap and sold to various factories for use as furnace oil. The remaining sludges however, are classified as hazardous waste. The bilge waters are processed through a separator to extract useable furnace oil, with the remaining oily water and sludge requiring safe disposal.
Other hazardous wastes include batteries, petrol tank sludges containing lead and other heavy metals, old engine oil from garages, certain scrap metals, solvents, degreasers, old cooking oil, oil contaminated soils, and old paint and grit from shot blasting operations in the harbour area.
In terms of the minimum requirements, most of the aforementioned wastes would be classified as hazard Group 1 or 2 wastes and therefore require disposal on an H:H hazardous waste facility.
Medical waste The SRK waste audit revealed that the majority of infectious clinical waste generated at the hospitals and clinics is incinerated at the government hospital incinerator. This includes sharp objects, swabs, contaminated bandages, human tissue, etc. However, there is concern that the incinerator does not operate at a sufficiently high temperature (1100°) to ensure proper destruction of harmful substances. Furthermore, there is no formal collection of medical waste from private practitioners, which results in medical waste being disposed of with the domestic waste stream. This represents considerable health risks to workers and salvagers at the waste site.
Based on the foregoing, a need was identified to establish a modern state-of-the-art incinerator for medical waste. The logical location for such an incinerator would be at the proposed new hazardous waste disposal facility, so that the resulting ashes could be disposed in the hazardous waste cell.
Special wastes Although not normally regarded as hazardous waste, abattoir waste, fish waste (offal) and condemned meat carcasses and fish require special disposal procedures to prevent odours, flies and health risks. Provided that they are buried immediately on the landfill and that the quantity of liquid does not pose a leachate problem, these wastes
PDF created with pdfFactory trial version www.pdffactory.com

Coastal Profile of the Erongo Region - August 1999 176
should be able to be disposed on the general waste landfill. The generation of these wastes for disposal is irregular, depending on whether or not the fish meal plant at Tunacor is operating.
Waste classification Based on the foregoing, it is concluded that the Walvis Bay waste stream comprises both general waste and hazardous waste. It is therefore necessary to provide both a General (G) waste facility and a Hazardous (H) waste facility.
8.1.1.2 Size of waste stream The size of the landfill operation is determined from the daily rate of deposition expressed in tonnes per day for 260 days of the year (i.e. a 5 day week).
Although Walvis Bay has experienced a relatively high annual growth rate of approximately 11% since 1993 when Walvis Bay was reincorporated into Namibia, a more realistic figure of 4% is used for the long term (30 years) waste generation predictions.
Previously planning, conducted by the Walvis Bay Municipality, (Annual Report of the Town Engineer, unpublished 1995 to 1997) was based on the higher short term figure. Since the revised lower figure has been formally used for planning purposes it is adopted herewith a concomitantly lower site area and airspace.
General waste In the absence of better data, the Initial Rate of Deposition (IRD) of the general waste stream has been determined from the results of the SRK waste audit carried out in 1995/96, as well as discussions with the WBM. Using the volumes and types of waste disposed of at the existing waste site, as well as assumed densities, the daily mass of each waste type for a 260 day year has been estimated as 138 tons in 1998.
Using an IRD of 140 tonne/day, a population growth rate of 4% per year, and a required site life of 30 years the Maximum Rate of Deposition (MRD) is calculated to be 454 tonnes/day. Since the MRD is greater than 25 tonne/day, but less than 500 tonnes/day, the Walvis Bay general waste site is classified as a Medium (M) waste disposal facility.
Hazardous waste The estimated current annual quantities of hazardous waste requiring safe disposal is 566m³/year. This estimate is based partially on the SRK audit, but mostly on information provided by the WBM (A Brummer) and Wesco Scrap (A Pretorius). Should the recycling operation not yield the current recoveries, or if the market for recycled oil collapses, the quantities of oily wastes would increase significantly. It must be emphasised therefore that the accuracy of the figure is questionable, and more reliable figures must be obtained once the initial hazardous waste cell is in operation in order to optimise further development of the facility.
PDF created with pdfFactory trial version www.pdffactory.com
Coastal Profile of the Erongo Region - August 1999 177
In addition to the above quantities, there are also small amounts of hazardous waste such as motor car batteries, fluorescent tubes, pesticides, etc, that need safe disposal.
Medical waste The WBM Health Department has requested that a new modern incinerator be established at the waste site for the disposal of medical waste. No figures on the quantities of medical waste are available. However, in the absence of any better information, based on a generation rate of 0.55kg/capita/year of infectious medical waste, is estimated that, for a population of 50 000, approximately 28 tonnes per year of medical waste would require incineration.
8.1.1.3 Projected landfill airspace requirements General landfill area Over the 30 year life of the site, the total mass of general waste too be disposed of would be approximately 2 130 000 tonnes, assuming no reduction due to composting and recycling. With an assumed in situ landfill density of 900 kg/m³ and a cover to waste ratio of 1:5, the total landfill airspace required is 2 838 000 m³. This would require approximately 473 000m³ of cover material for a proper sanitary landfill operation. For a landfill with an average height of 12m, an area of approximately 24 ha would be required.
Hazardous waste facility On account of both the uncertainty of the hazardous waste generation figures and the high cost of constructing a modern state-of-the-art hazardous waste disposal facility, it would not be advisable to develop a facility for the full 30 year planning horizon. It was therefore recommended to design a hazardous waste cell of a practical minimum size to cater for at least the first five years of operation. An airspace of at least 3 000 m³ would therefore be required. To allow for possible blending or co-disposal with general waste to minimise free liquid surface in the cell, the airspace should be significantly greater.
Potential for leachate generation
The potential for significant leachate generation depends on the water balance associated with a waste disposal site. This is dictated by ambient climatic conditions or by the other site specific factors such as the moisture content of the incoming waste and/or ingress of either ground water or surface water run-off from high ground into the waste body.
Considering the climatic water balance, the moisture content of the waste and the low potential of groundwater egress, it was therefore considered highly unlikely that leachate would be generated at the waste disposal facility, provided that excessive quantities of liquid wastes are not disposed of on the general landfill.
PDF created with pdfFactory trial version www.pdffactory.com

Coastal Profile of the Erongo Region - August 1999 178
Based on the above, the general landfill area was classified as B. This means that leachate management is not necessary. The hazardous waste cell however, is classified as an H:H facility, implying that leachate management is mandatory.
8.1.1.4 WASTE WATER MANAGEMENT / TREATMENT. As water is a scarce and expensive resource, especially in the central coastal region (including Walvis Bay), conservation and prudent management of waste water are of the utmost importance. In addition it is evident that more stringent effluent discharge standards are most likely to be enforced onto local authorities of developing countries in the near future. It is therefore clear that any prospect of expansion should be accompanied by an in-depth investigation into the waste water treatment and water recovery systems required. The waste water treatment could be divided into 3 categories namely; sewer reticulation network, waste water treatment works and the purified effluent distribution. Existing network. At present, the communities of Walvis Bay, Meersig, Kuisebmond and Narraville are served by a water borne network of sewer pipelines. Due to the flat terrain and the fact that the existing treatment works is situated at a higher elevation than the collection network, the sewage drains under gravity flow to four pumping stations from where it is pumped to the treatment works via four separate pipelines. Each community (i.e. Narraville) is served by its own pumping station and the positions are shown on the attached locality plan. Typically the level of the ground water table in Walvis Bay is less than 1 m from the surface. When investigating future extensions to the existing network it has to be kept in mind that the deeper the pipeline, the more difficult it would be to construct. Therefore large drainage areas should be avoided. As the pipelines would be mostly submerged, consideration must also be given to the type of piping material to be used. Couplings should be watertight to prevent saline water ingress and the materials should be manufactured from corrosion resistant polymers. 8.1.1.5 Use of purified effluent According to the findings of the above-mentioned Final Report On The Sewage Treatment Works : Walvis Bay, compiled by VWL Namibia, September 1995, the future uses for the purified effluent appears to be limited to domestic irrigation and the watering of parks and sports fields. Other potential uses such as for commercial irrigation (farming) and industrial application were jeopardised by the users’ concerns for health risks associated with the use of purified effluent where the produce is mainly for human use. Direct recycling for use as potable water was not investigated in the above-mentioned report as the known high cost of tertiary treatment rendered the option uneconomical. The report estimated that a monthly volume of 162 Ml could be available for irrigation if the new treatment plant operates at a capacity of 6 Ml/d (inflow) and at a recovery rate of 90%. This would mean that the Council would save 162 Ml monthly on potable water that would have been used for irrigation previously and that existing
PDF created with pdfFactory trial version www.pdffactory.com
Coastal Profile of the Erongo Region - August 1999 179
fresh water sources could last much longer before the Council would have to look into alternative sources of fresh water such as desalination with high capital and running costs. However, the figure of 162 Ml constitutes only a potential saving as the use of purified effluent for domestic irrigation is currently limited by the following factors: • The saline nature of the soil in the Walvis Bay area is not conducive to gardening.
Because of the extra effort required to establish and maintain gardens, it is currently not a popular option for residents and extensions to the purified effluent system to meet this market might not be economically viable.
• Currently the purified effluent is used primarily for the watering of municipal
gardens and sports fields. The potential increase in revenue from the potable water saving is not sufficient to accommodate further establishment and maintenance of additional gardens (extra labour, etc.).
As a result of the factors above, the Municipality can presently only utilize approximately 50 Ml of purified effluent per month, while the remainder is discharged to the wetlands or to waste. The option of direct recycling would have to be re-evaluated from time to time in the future and may need to be implemented once the supply of fresh water for domestic use is sufficiently stressed. This would probably be the ultimate future use of the effluent. Existing system At present the communities of Meersig, Walvis Bay, Kuisebmond and Narraville are already served by a pressurized purified effluent distribution network, as shown on the locality plan. The effluent is mainly used for domestic irrigation and for the watering of Municipal parks and sports fields. It is estimated that ± 85 % or 4.5 Ml/d of the present inflow (5.5 Ml/d) to the existing works is recovered in the form of purified effluent. Approximately 35 % (1,5 Ml/d) of the purified effluent is pumped to the wetland system while the remaining 65 % (3 Ml/d) is fed into the purified effluent distribution system via an existing water tower located at the existing works. Increase in purified effluent supply When the capacity of the existing treatment works is increased to 8 Ml/d and it is assumed that 75 % of the inflow would be recoverable, approximately 6 Ml/d will be available as purified effluent. Subtracting the 1,5 Ml/d pumped to the wetlands to maintain a constant water level, it will be possible to feed approximately 4,5 Ml/d into the distribution network, resulting in an increase of 1,5 Ml/d available to the newly developed areas. To handle the increased supply, the above-mentioned report recommended that a storage reservoir of 2.5 Ml/d capacity would have to be provided at the existing works to balance the supply. The existing pumping installation and water tower should be adequate to handle the increased supply.
PDF created with pdfFactory trial version www.pdffactory.com
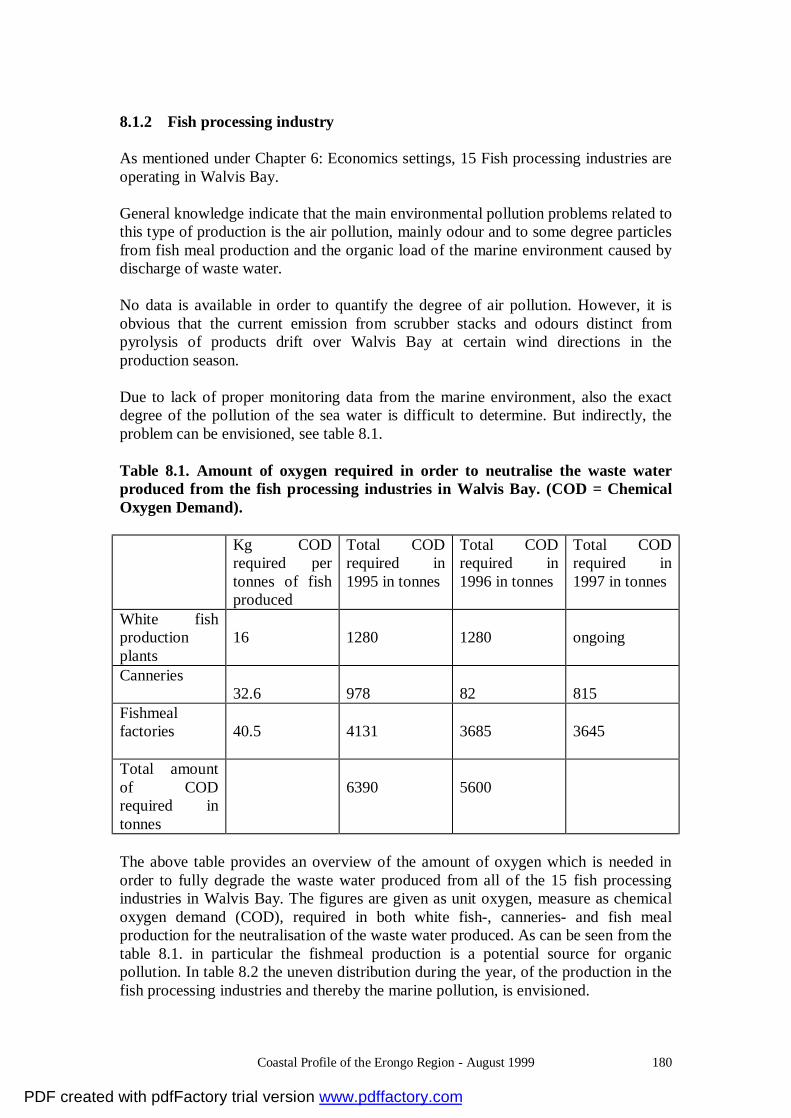
Coastal Profile of the Erongo Region - August 1999 180
8.1.2 Fish processing industry
As mentioned under Chapter 6: Economics settings, 15 Fish processing industries are operating in Walvis Bay. General knowledge indicate that the main environmental pollution problems related to this type of production is the air pollution, mainly odour and to some degree particles from fish meal production and the organic load of the marine environment caused by discharge of waste water. No data is available in order to quantify the degree of air pollution. However, it is obvious that the current emission from scrubber stacks and odours distinct from pyrolysis of products drift over Walvis Bay at certain wind directions in the production season. Due to lack of proper monitoring data from the marine environment, also the exact degree of the pollution of the sea water is difficult to determine. But indirectly, the problem can be envisioned, see table 8.1. Table 8.1. Amount of oxygen required in order to neutralise the waste water produced from the fish processing industries in Walvis Bay. (COD = Chemical Oxygen Demand). Kg COD
required per tonnes of fish produced
Total COD required in 1995 in tonnes
Total COD required in 1996 in tonnes
Total COD required in 1997 in tonnes
White fish production plants
16
1280
1280
ongoing
Canneries
32.6
978
82
815
Fishmeal factories
40.5
4131
3685
3645
Total amount of COD required in tonnes
6390
5600
The above table provides an overview of the amount of oxygen which is needed in order to fully degrade the waste water produced from all of the 15 fish processing industries in Walvis Bay. The figures are given as unit oxygen, measure as chemical oxygen demand (COD), required in both white fish-, canneries- and fish meal production for the neutralisation of the waste water produced. As can be seen from the table 8.1. in particular the fishmeal production is a potential source for organic pollution. In table 8.2 the uneven distribution during the year, of the production in the fish processing industries and thereby the marine pollution, is envisioned.
PDF created with pdfFactory trial version www.pdffactory.com

Coastal Profile of the Erongo Region - August 1999 181
Table 8.2. Data are based on estimates from 1996. Jan Feb Mar Apr May Jun Jul Aug Sep Oct Nov Dec Total amount of COD required in tonnes
700
700
700
1100
1100
700
100
100
100
100
100
100
The effects of the Benguela current system in the sea outside Walvis Bay is described in section 3.7. Taken the very low natural oxygen content of the sea water into account, it can be anticipated that quite a huge area of the sea is required in order to degrade the waste water from the fish processing industries. Often the content of oxygen in sea water outside Walvis Bay is in the order of 2.0ml oxygen/litre sea water, many times even lower. The following calculations can be used in order to envision the size of the problem. The amount of 2.0 ml oxygen/litre of sea water is ~ 2.8 mg oxygen/litre (= 2.8 g per m3). In other words, in order to degrade 5600 tonnes of oxygen the following water masses is needed: 5600 000 000/2.8 = 2 000 000 000 m3 of sea water In the peak seasons in theory the daily amount of sea water needed is the following: 11000 000 000/2.8/31 = 12 672 811 m3 per day. At an average water depth of 5 m the required water area is 1592 m * 1592 m in order for all of the waste to be degraded according to the calculations presented above. In practise oxygen is produced in the sea by phyto plankton and by macro algae during day time. Also, oxygen from the air is dissolved in the sea. This will to some degree ameliorate the effect of the discharge load. However, picture 8.1, an air photo from 1997 taken over Walvis Bay, very clearly shows the discharge plumes from the fish processing factories. Even in lack of proper monitoring data from the sea in the vicinity of the factories, the sea pollution is deemed to be of such a magnitude that discharge standards should be set and enforced for the fish processing industries. 8.1.3 Pollution from harbour. Before the present pollution prevention system could be developed, the pollutants had to be identified and their means of reaching the sea. The harbour was divided into the following areas: • Commercial harbour from berths 1 – 8 • Small craft harbour up to tanker jetty • Synchro lift and fisheries jetties • Fishing companies jetties and rubble wall • Areas within the breakwater
PDF created with pdfFactory trial version www.pdffactory.com
Coastal Profile of the Erongo Region - August 1999 182
• Area north of the breakwater • Area between berth 8 and the pumpstation • Area between pumpstation an Walvis Bay Peninsula • Sea area from Walvis Bay Peninsula and the mainland including anchorages The following pollutants were identified: • Petroleum products on land and in water • Fish processing waste in the air and water • Ore dust in the air, water and on land • Cargo packaging waste on land and in water • Heavy metal waste on land and in water • Toxic waste on land and in air and water • Galley waste on land and in water • Dredged material in the water 8.1.3.1 Petroleum products Any vessel requiring bunkers need to fulfil certain requirements which are contained in the Namport Bunker checklist. The check list is completed by the master and chief engineer and all operations may be stopped by a Namport official if irregularities occur. Management of petroleum pollution are dealt with in the Namport Oil Spill Contingency Plan. 8.1.3.2 Fish processing waste The waste contains fish scales, oil, blood and offal. The quantities have increased over the last few years and it is suspected that all benthos in the harbour has been killed as a result. This fish processing waste is seen as bio degradable but the current influence thereof is much greater than petroleum pollution at present. Fish oil pollution is treated in the same manner as petroleum oil spills and the polluter is charged for the costs. 8.1.3.3 Ore Dust The ore dust emanates from the bulk terminal stock piles and if not controlled could pollute the air, sea and land. Stock piles must be kept wet. The bulk handling installation is equipped with satisfactory spraying devices and very little dust emanates from the area. 8.1.3.4 Heavy metal waste Sources of heavy metal pollution are the manganese ore stock pile, the loading and unloading of minerals from ships in the harbour and the Synchro lift during sandblasting operations 8.1.3.5 Toxic waste Small quantities of toxic waste emanates from the Synchro lift due to arsenic based paints being removed from the hulls of ships. The waste reaches the sea via the
PDF created with pdfFactory trial version www.pdffactory.com
Coastal Profile of the Erongo Region - August 1999 183
current drainage system. International funding is available to rectify this pollution problem. 8.1.3.6 Galley waste Vessels are encouraged to keep galley waste on board for collection on arrival in the port. Containers are made available on the quay and collected on a daily basis. 8.1.4 Dredging operations (water turbidity) Namport has an ongoing dredging operation to keep the existing berths at the designed depth. Approximately 12000 cubic meters of material is dredged every year. The whole harbour is dredged every 5-6 years and ± 120000 cubic meters of material is dredged. The expected volume of material dredged during the deepening of the harbour to –12.8m will be ± 3 mil cubic meters of sand and ±1.8 mil cubic meters of mud. 8.1.5 Dredge spoil dumping ground The choice of dumping ground are dependant on the following factors: • The nature of the sediments and their grain distribution (sand, silt, mud) • The need for reclamation • The coastal processes (tides, currents, wind) • The quality of the sediment (pollutants) • The sensitivity of the environment and the effect on the lagoon The options to the dumping of mud are a reclamation area on land, within the bay or the open sea. The dumping on land will require ±180ha of land. The dumping in the bay will distribute pollutant, may enter the lagoon and ultimately stay in the harbour area. The only feasible alternative is dumping in the open sea. The alternative for the dumping of dredged sand are dumping on land, land reclamation, dumping within the bay, renourishment of Donkey Bay and dumping in the open sea. The recommended option is the reclamation of land south of the existing harbour to facilitate further extension to the commercial harbour. 8.1.6 Ships outside harbour area Bunkering outside the port limits may not be done without the permission of the Ministry of Works, Transport and Communication’s Marine Directorate. Namport has no authority over ships anchored outside the port limits. Bunker transfers between these ship occur and could reach the beach down wind. Marine diesel evaporates rapidly and seldom causes pollution. The officials from the Ministry of Fisheries have access to the vessels and their pollution. Namport have set up a garbage collection service to vessels anchor outside port limits where bags were made available and collected on request. The system was however not sustained. Garbage from these vessels litter the beaches between Walvis Bay and Swakopmund and solid waste covers the sea bed below these vessels.
PDF created with pdfFactory trial version www.pdffactory.com
Coastal Profile of the Erongo Region - August 1999 184
8.2 OTHER COASTAL MUNICIPALITIES 8.2.1 Swakopmund Topographic maps from approximately 1968 show that the present landfill has been in operation in the present area since then. The problems connected with the current landfill site is therefore more aesthetic than physical because in order to reduce wind pollution, the waste is burned and the landfill can be seen from both main roads. Preliminary waste stream analysis indicates that the daily collections are 20 to 23 tonnes or approximately 1kg per capita. This is inclusive of garden refuse, commercial packaging as well as domestic solid waste. During 1997, the scavengers removed and sold 72 tonnes of cans and 780 tonnes of glass. To date the quantities of other metals etc. have not been determined, but due to the nature of Swakopmund’s industry, this will not be a significant volume. The current brief requires the location of a new landfill site together with a new sewerage works. However since the present sewerage works is being overhauled, it will have an extended life span of 5-10 years. It is not envisaged that the current landfill be utilised for a similar period of time, and investigative work is currently in progress. Because of the negative environmental impact of the present site, the growth of overseas tourism, the expansion of the town and cost implications in developing a new solid waste disposal facility, it is recommended that planning should start during 1999 for a grand opening for the millennium.
PDF created with pdfFactory trial version www.pdffactory.com
Coastal Profile of the Erongo Region - August 1999 185
9.0 DEVELOPMENT PLANS IN THE ERONGO REGION
9.1 ERONGO REGION DEVELOPMENT PLAN YEAR 2000 The Erongo Regional Development Plan 1997 – 2000 is a document compiled by the Erongo Regional Council in order to guide forward planning for the region. Forward planning is awkward due to the fact that the advantages which the region possesses do not have any inherit qualities for extensive growth. This is due to the fact that the regional economy is focused on a small number of economic sectors, the regional income are severely cyclical and dependent on natural occurrences, the lack of other income generating sources and lastly the region produce large amounts of people into a limited workforce. The Plan there fore focuses on the economic development of the Region in order to widen the economic base, increase the regional income and create work opportunities for ± 70000 people in the region by the year 2000. The Plan focused on the socio economic conditions, the existing policy framework, the overall objectives, the mining, fishing and agriculture sectors, education and culture, health and social services, tourism development, the environment, roads, settlement areas in the region, the Local Authorities, Regional Government, a Plan of Action and various recommendations. 9.2 WALVIS BAY ACTION PLAN YEAR 1998 - 2001 The goal of the plan is to develop a better management system for the Municipality of Walvis Bay which will assist the Council in achieving its goals of providing better living conditions for all the inhabitants of Walvis Bay. The plan of Action will form the basis of the annual budget of the Municipality of Walvis Bay and will be revised annually in October of each year. This will ensure that new possibilities and opportunities are met in a dynamic planning process. In order to improve productivity by means of the implementation of an effectiveness gain programme, the Management Committee approved the economic frame of 5, 3, 2, and 2% for the respective years of the plan of Action. The principle further implies that 25% of the effectiveness gain will be used for training purposes and the remaining 75% will be spend on new objectives. The result will be that the inhabitants will receive a better service without having to pay more for the municipal services. The Plan of Action will be kept on track due to an extensive reporting programme where Department Heads must report on a quarterly basis in order to show how they are meeting the goals and objectives and where are their respective departments within the set economical frame. The Plan of Action is designed for a 4 year period and it will be revised annually. The Walvis Bay Structure Plan, currently prepared by Stubenrauch Planning Consultants cc, Walvis Bay, will be additional to the Plan of Action in the Walvis Bay Town Council management system. The Walvis Bay Structure Plan will act as a guide plan for the spatial development of Walvis Bay. The plan is designed for a 12 year period and will be revised every 4 years.
PDF created with pdfFactory trial version www.pdffactory.com

Coastal Profile of the Erongo Region - August 1999 186
The primary goal of the Plan of Action is to provide each inhabitant of Walvis Bay with the best possible living conditions. The main goals and objectives are a well developed and sophisticated infrastructure, a well developed and diversified economic base, an enhance socio-economic environment and improved community facilities, and a well managed local authority. The Plan of Action reports on the economic frame and income assumptions, the main challenges and threats, the main goals and objectives, population, business development, the labour market and then focuses on the Departments of the Town Secretary, the Town Treasurer, the Town Engineer, the Town Electrical Engineer, future land developments and the training plan of action. 9.3 OTHER DEVELOPMENT PLANS WITHIN THE REGION 9.3.1 Swakopmund Long Term Development Plan The objective of this study is thus to provide a Long Term Plan with the necessary planning and urban design framework according to which the Swakopmund Town Council can guide future urban development of the Swakopmund Municipal area. The framework provided by Long Term Plan will ensure that the Swakopmund Town Council can create an integrated urban environment that will be to the advantage of the entire population, is within the financial means of the local authority and promote the sustainable use of the natural environment. In order to understand the dynamics of Swakopmund, all available literature was studied; a social survey, sampling approximately 10% of the total population was conducted, discussions held with identified stakeholders, line ministries and officials from the local authority. Public participation is also an important aspect in the compilation of this Long Term Plan. The public will be consulted continuously during the compilation through regular articles in the local newspaper as well as through public meetings. The Long Term Plan will be presented in two documents where the first document consists of the following sections: First Document: Chapter 1 Introduction Chapter 2 The natural environment Chapter 3 The urban environment Chapter 4 The social structure of the town Chapter 5 Economic dimensions Chapter 6 Findings and evaluations Second Document: Chapter 1 Challenges facing the local authority Chapter 2 Planning Proposals Chapter 3 The way forward
PDF created with pdfFactory trial version www.pdffactory.com
Coastal Profile of the Erongo Region - August 1999 187
The Swakopmund Town Council has a certain obligation to the residents of Swakopmund. That is to provide the best possible living conditions for all within the Council’s financial means. Some concerns from Council: • Fragmented town • Informal settlement within the Swakop River • Development of the beach area from Mole to jetty • Informal trade • More pedestrian and bicycle friendly town • Building height restriction – can it be relaxed in certain areas? • Social service programming according to recommended standards • More efficient use of government and school erven • Use of rail and road reserves for green/agricultural uses • Road network hierarchy • Impact of heavy vehicle traffic from Trans-Caprivi and Trans-Kalahari highways • Alignment of the proposed internal bypass • Allocation of an area for an informal settlement • Future location of airport • Development of alternative commercial areas • Addressing parking problem – treatment and location of parking areas • Possible public transport Tourism determines Swakopmund’s role in a regional, national and international context. Swakopmund became well established as a holiday destination in the years leading up to the Second World War in 1939. With the completion of the tarred road from Windhoek to Swakopmund in 1967, it was now possible for inlanders to visit the coast for a weekend. A big demand for plots/holiday homes developed after the completion of the road. Since then, the tourist industry has played an important role in the economy of Swakopmund and will continue to do so. Swakopmund can not be see in isolation with the rest of the towns in the Erongo Region. Since Namibia’s supporting harbour is at Walvis Bay, Swakopmund exist also in close relation to Walvis Bay. With the Trans-Caprivi and Trans-Kalahari highways running from Walvis Bay to Windhoek via Swakopmund, the town will play a supporting role to Walvis Bay. It is therefore necessary to see Swakopmund and Walvis Bay as a working system within the Erongo Region. 9.3.2 Swakopmund River Bridge Policy Plan The Swakopmund Town Council appointed Stubenrauch Planning Consultants cc to compile a policy plan for the area between the main road to Usakos and the northern bank of the Swakopmund River to the outer limits of the Swakopmund jurisdiction area. The main purpose of the policy plan is to assist the Town Council with the evaluation of development applications received within the study area. The plan is to support the general development strategy of the Swakopmund Town Council.
PDF created with pdfFactory trial version www.pdffactory.com

Coastal Profile of the Erongo Region - August 1999 188
The need for the policy plan is due to various applications received within the area and the danger of ad-hoc planning and uncontrolled development in the area would have had negative long term planning implications. The Policy Plan investigated the physiographic features and the existing land uses in the study area and made the following recommendations: • The proposed land uses be accepted and enforced by the Swakopmund Town
Council • The capacity of bulk municipal services to the area be evaluated • The local authority should reserve the right to repossess land if not developed in
accordance to the plan • No motorised vehicles should be allowed in the environmentally sensitive areas • The final alignment of the proposed bypass must be determined • The possible relocation of the airport should be investigated • Short term ad-hoc allocation of land must be stopped • Land for tourism based and recreation facilities must be provided • Land between Kramersdorf and the Rossmund golf Course must be reserved for
future residential uses • Sites for educational and business uses should be provided • The focal point of the Martin Luther Monument must be developed as the eastern
entrance to Swakopmund 9.3.3 Long Beach – Dolphin Beach Structure Plan. The Structure Plan was compiled by Stubenrauch Planning Consultants cc in order to indicate the direction of development in the Long Beach -= Dolphin Beach area based on the study of all relevant influencing factors. The Structure Plan will guide future growth in the area in a co-ordinated and efficient way. The Structure Plan will guide development for the next 20 years. The Study investigated the economic linkages, the physical features, land uses and spatial relationships, infrastructure and services. A questionnaire was also used to evaluate the existing urban system. A summary of the main recommendation in the Structure Plan are: • The strengthening of the recreational centre and establishing links between the
recreational and residential zones • Providing adequate holiday accommodation by upgrading the caravan park and
chalets and encouraging private developments • Additional residential areas to the south of the existing Long Beach residential
area • The existing municipal services must be upgraded to cater for expected future
residential demands • The increase in residential densities at dolphin Beach will result in additional 200
units • The upgrading of municipal services at Dolphin Beach • A informal recreational area between the two residential areas must be protected • Identified environmental threats must be prohibited
PDF created with pdfFactory trial version www.pdffactory.com
Coastal Profile of the Erongo Region - August 1999 189
• The control of off-road vehicles in the area must be enforced by a 90m free area from the high water mark
• The Structure Plan recommendations must be included in the Walvis Bay Town Planning Scheme.
PDF created with pdfFactory trial version www.pdffactory.com
Coastal Profile of the Erongo Region - August 1999 190
10.0 ENVIRONMENTAL MANAGEMENT ISSUES
This part of the profile has been devoted to a presentation of monitoring systems regarding environmental data and to the presentation of various options and recommendations for environmental management in the Erongo Region.. 10.1 PHYSICAL ISSUES; DATA COLLECTION, MONITORING, DATA PROCESSING The reasons for the investment in data collection-, data monitoring-, data processing- and data reporting system is to: Provide a foundation for improved decision making at all levels, from the individual, through municipal and regional levels to the national Government. Increase awareness and understanding of environmental trends and conditions, their causes and consequences among all stakeholders. Facilitate the measurement of progress towards sustainability. The following institutions are dealing with monitoring and data processing in the project area. 10.1.1 Local Institutions with Environmental Monitoring Sites • Ministry of Environment & Tourism (MET): Swakopmund, Walvis Bay,
Gobabeb. • Desert Research Foundation of Namibia (DRFN): Gobabeb Training and
Research Centre. • Ministry of Transport and Communication (MTC): Walvis Bay harbour and
airport. • Department of Water Affairs (DWA) of the Ministry of Agriculture, Water &
Rural Development (MAWRD). • Ministry of Fisheries and Marine Resources (MFMR): Swakopmund, Walvis Bay. • University of Namibia: Henties Bay Training and Research Centre. • Rössing Uranium: laboratories at the Rössing mine 10.1.2 Weather Stations • Desert Research Foundation of Namibia (DRFN): throughout the southern Central
Namib i.e. 4 major long-term stations at: Gobabeb, Kleinberg, Vogelfederberg, Ganab. 4 new long-term stations planned at previous minor sites: Double-3, Swartbank, Zebra Pan, Garnet Hill and measurements at Swakopmund, Walvis Bay, Rooibank.. See table 10.1 for an exhaustive picture of the location, the parameters sampled and the length of the data series of weather monitoring stations, from where data can be obtained upon an enquiry to DRFN.
• Ministry of Transport and Communication (MTC): At Walvis Bay airport. • Ministry of Transport and Communication (MTC): Meteorological Services at
Gobabeb & Walvis Bay since 1962 (previously at Pelican Point). • Department of Water Affairs (DWA): Hamilton Range. • Rössing Uranium: Point Bill. • University of Cologne: nine sites between Swakopmund and Usakos.
PDF created with pdfFactory trial version www.pdffactory.com
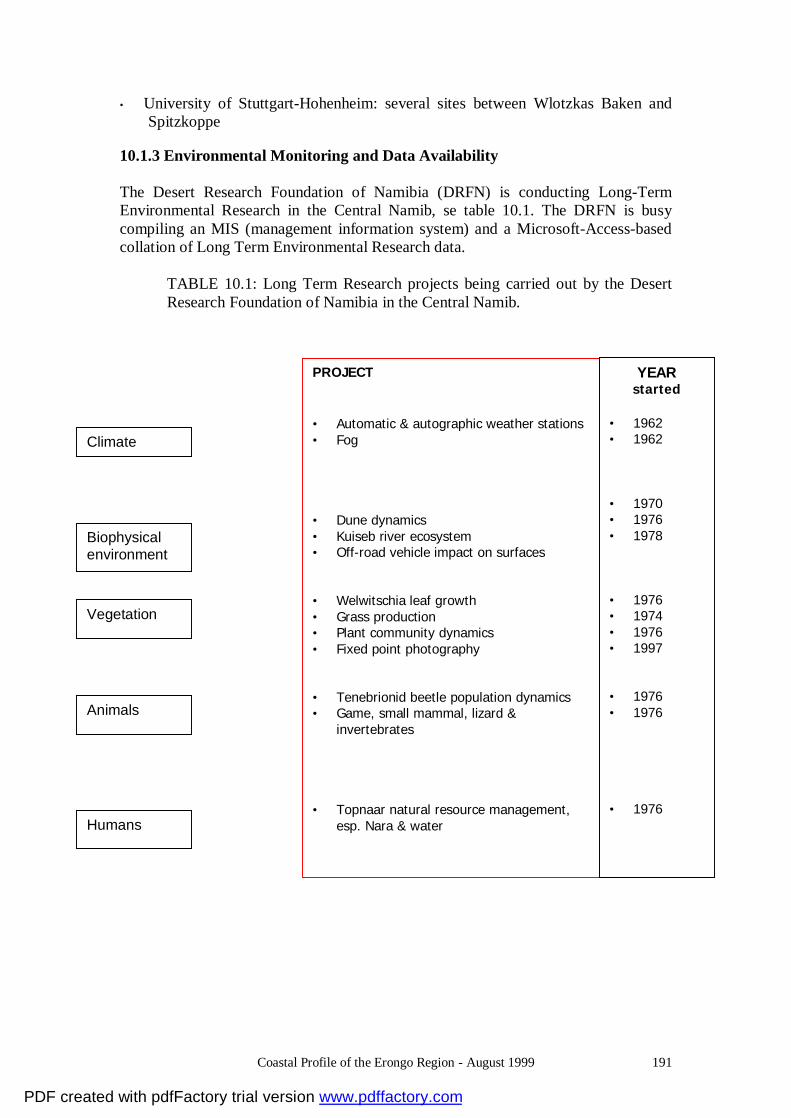
Coastal Profile of the Erongo Region - August 1999 191
• University of Stuttgart-Hohenheim: several sites between Wlotzkas Baken and Spitzkoppe
10.1.3 Environmental Monitoring and Data Availability The Desert Research Foundation of Namibia (DRFN) is conducting Long-Term Environmental Research in the Central Namib, se table 10.1. The DRFN is busy compiling an MIS (management information system) and a Microsoft-Access-based collation of Long Term Environmental Research data.
TABLE 10.1: Long Term Research projects being carried out by the Desert Research Foundation of Namibia in the Central Namib.
Climate
Biophysical environment
Vegetation
Animals
Humans
PROJECT • Automatic & autographic weather stations • Fog • Dune dynamics • Kuiseb river ecosystem • Off-road vehicle impact on surfaces • Welwitschia leaf growth • Grass production • Plant community dynamics • Fixed point photography • Tenebrionid beetle population dynamics • Game, small mammal, lizard &
invertebrates • Topnaar natural resource management,
esp. Nara & water
YEAR started
• 1962 • 1962 • 1970 • 1976 • 1978 • 1976 • 1974 • 1976 • 1997 • 1976 • 1976 • 1976
PDF created with pdfFactory trial version www.pdffactory.com
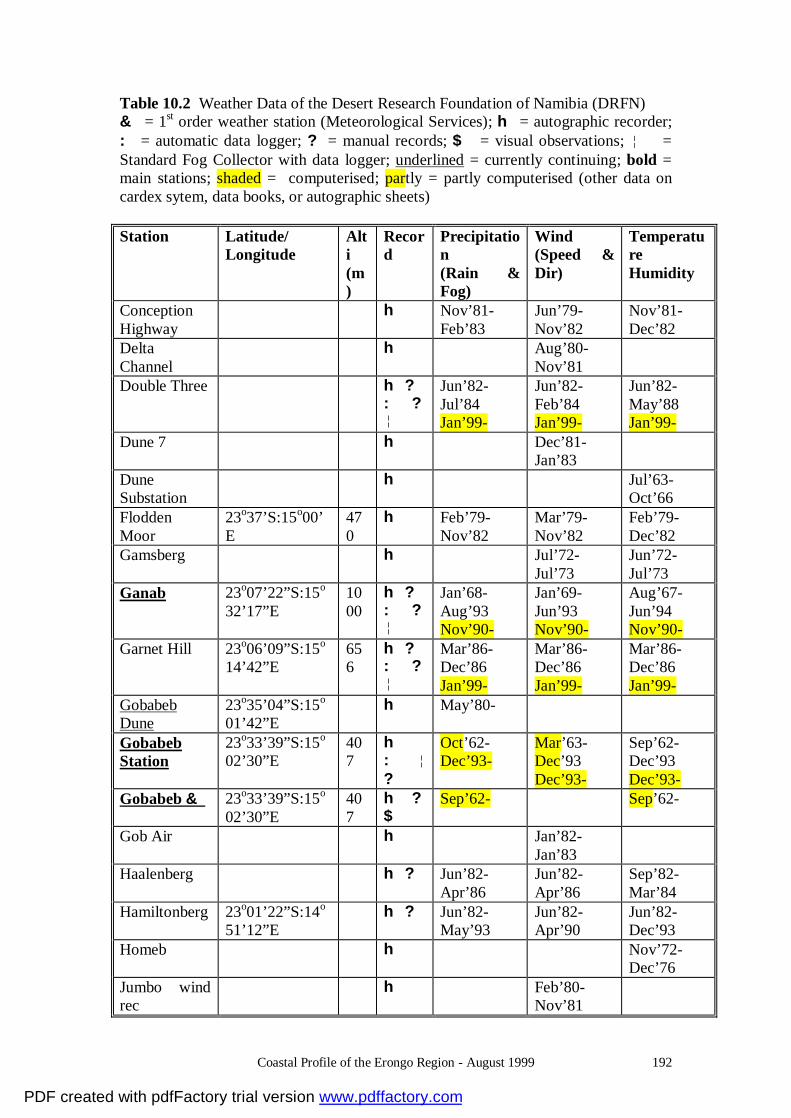
Coastal Profile of the Erongo Region - August 1999 192
Table 10.2 Weather Data of the Desert Research Foundation of Namibia (DRFN) & = 1st order weather station (Meteorological Services); h = autographic recorder; : = automatic data logger; ? = manual records; $ = visual observations; ¦ = Standard Fog Collector with data logger; underlined = currently continuing; bold = main stations; shaded = computerised; partly = partly computerised (other data on cardex sytem, data books, or autographic sheets) Station
Latitude/ Longitude
Alti (m)
Record
Precipitation (Rain & Fog)
Wind (Speed & Dir)
Temperature Humidity
Conception Highway
h Nov’81-Feb’83
Jun’79-Nov’82
Nov’81-Dec’82
Delta Channel
h Aug’80-Nov’81
Double Three h ? : ? ¦
Jun’82-Jul’84 Jan’99-
Jun’82-Feb’84 Jan’99-
Jun’82-May’88 Jan’99-
Dune 7 h Dec’81-Jan’83
Dune Substation
h Jul’63-Oct’66
Flodden Moor
23o37’S:15o00’E
470
h Feb’79-Nov’82
Mar’79-Nov’82
Feb’79-Dec’82
Gamsberg h Jul’72-Jul’73
Jun’72-Jul’73
Ganab 23o07’22”S:15o
32’17”E 1000
h ? : ? ¦
Jan’68-Aug’93 Nov’90-
Jan’69-Jun’93 Nov’90-
Aug’67-Jun’94 Nov’90-
Garnet Hill 23o06’09”S:15o
14’42”E 656
h ? : ? ¦
Mar’86-Dec’86 Jan’99-
Mar’86-Dec’86 Jan’99-
Mar’86-Dec’86 Jan’99-
Gobabeb Dune
23o35’04”S:15o
01’42”E h May’80-
Gobabeb Station
23o33’39”S:15o
02’30”E 407
h : ¦ ?
Oct’62- Dec’93-
Mar’63-Dec’93 Dec’93-
Sep’62-Dec’93 Dec’93-
Gobabeb & 23o33’39”S:15o
02’30”E 407
h ? $
Sep’62- Sep’62-
Gob Air h Jan’82-Jan’83
Haalenberg h ? Jun’82-Apr’86
Jun’82-Apr’86
Sep’82-Mar’84
Hamiltonberg 23o01’22”S:14o
51’12”E h ? Jun’82-
May’93 Jun’82-Apr’90
Jun’82-Dec’93
Homeb h Nov’72-Dec’76
Jumbo wind rec
h Feb’80-Nov’81
PDF created with pdfFactory trial version www.pdffactory.com
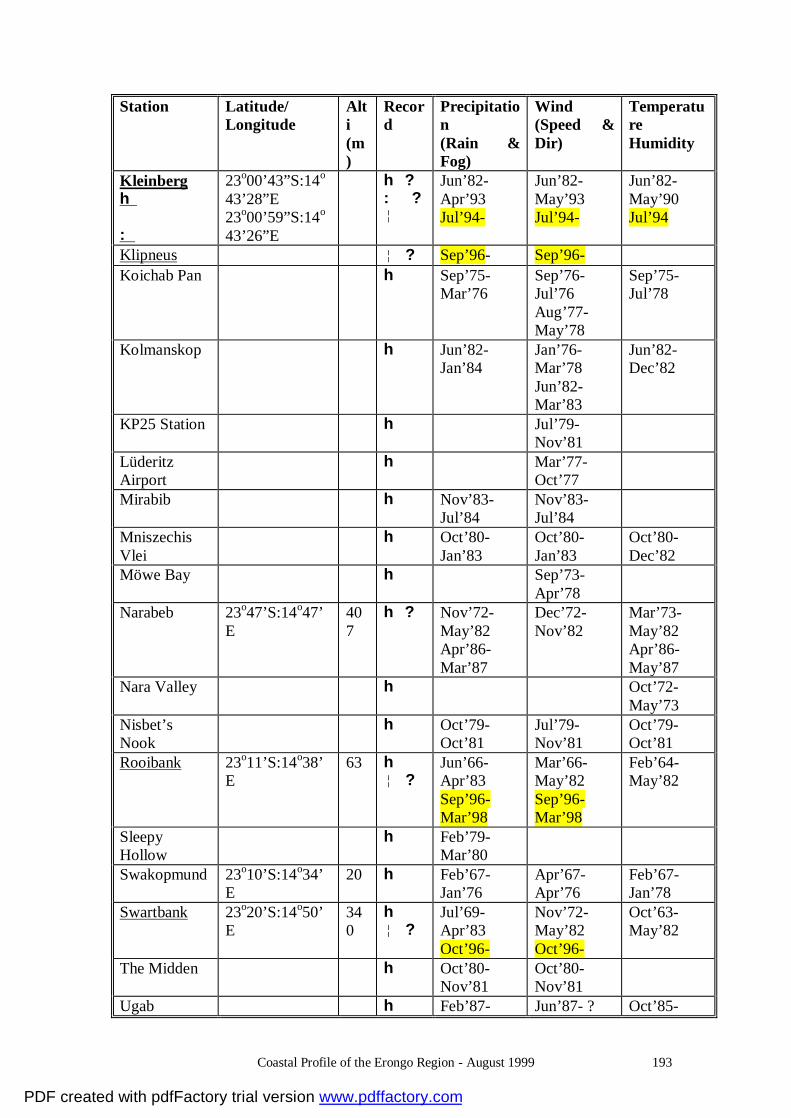
Coastal Profile of the Erongo Region - August 1999 193
Station
Latitude/ Longitude
Alti (m)
Record
Precipitation (Rain & Fog)
Wind (Speed & Dir)
Temperature Humidity
Kleinberg h :
23o00’43”S:14o
43’28”E 23o00’59”S:14o
43’26”E
h ? : ? ¦
Jun’82-Apr’93 Jul’94-
Jun’82-May’93 Jul’94-
Jun’82-May’90 Jul’94
Klipneus ¦ ? Sep’96- Sep’96- Koichab Pan h Sep’75-
Mar’76 Sep’76-Jul’76 Aug’77-May’78
Sep’75-Jul’78
Kolmanskop h Jun’82-Jan’84
Jan’76-Mar’78 Jun’82-Mar’83
Jun’82-Dec’82
KP25 Station h Jul’79-Nov’81
Lüderitz Airport
h Mar’77-Oct’77
Mirabib h Nov’83-Jul’84
Nov’83-Jul’84
Mniszechis Vlei
h Oct’80-Jan’83
Oct’80-Jan’83
Oct’80-Dec’82
Möwe Bay h Sep’73-Apr’78
Narabeb 23o47’S:14o47’E
407
h ? Nov’72-May’82 Apr’86-Mar’87
Dec’72-Nov’82
Mar’73-May’82 Apr’86-May’87
Nara Valley h Oct’72-May’73
Nisbet’s Nook
h Oct’79-Oct’81
Jul’79-Nov’81
Oct’79-Oct’81
Rooibank 23o11’S:14o38’E
63 h ¦ ?
Jun’66-Apr’83 Sep’96-Mar’98
Mar’66-May’82 Sep’96-Mar’98
Feb’64-May’82
Sleepy Hollow
h Feb’79-Mar’80
Swakopmund 23o10’S:14o34’E
20 h Feb’67-Jan’76
Apr’67-Apr’76
Feb’67-Jan’78
Swartbank 23o20’S:14o50’E
340
h ¦ ?
Jul’69-Apr’83 Oct’96-
Nov’72-May’82 Oct’96-
Oct’63-May’82
The Midden h Oct’80-Nov’81
Oct’80-Nov’81
Ugab h Feb’87- Jun’87- ? Oct’85-
PDF created with pdfFactory trial version www.pdffactory.com
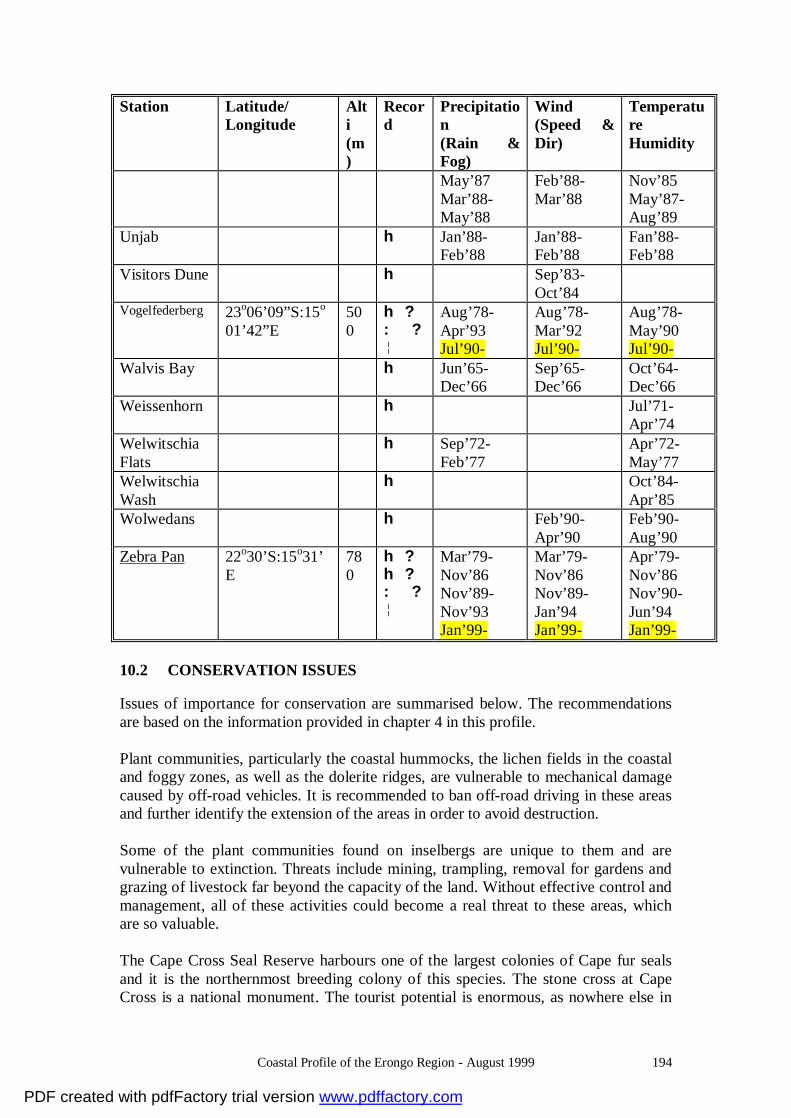
Coastal Profile of the Erongo Region - August 1999 194
Station
Latitude/ Longitude
Alti (m)
Record
Precipitation (Rain & Fog)
Wind (Speed & Dir)
Temperature Humidity
May’87 Mar’88-May’88
Feb’88-Mar’88
Nov’85 May’87-Aug’89
Unjab h Jan’88-Feb’88
Jan’88-Feb’88
Fan’88-Feb’88
Visitors Dune h Sep’83-Oct’84
Vogelfederberg 23o06’09”S:15o
01’42”E 500
h ? : ? ¦
Aug’78-Apr’93 Jul’90-
Aug’78-Mar’92 Jul’90-
Aug’78-May’90 Jul’90-
Walvis Bay h Jun’65-Dec’66
Sep’65-Dec’66
Oct’64-Dec’66
Weissenhorn h Jul’71-Apr’74
Welwitschia Flats
h Sep’72-Feb’77
Apr’72-May’77
Welwitschia Wash
h Oct’84-Apr’85
Wolwedans h Feb’90-Apr’90
Feb’90-Aug’90
Zebra Pan 22o30’S:15o31’E
780
h ? h ? : ? ¦
Mar’79-Nov’86 Nov’89-Nov’93 Jan’99-
Mar’79-Nov’86 Nov’89-Jan’94 Jan’99-
Apr’79-Nov’86 Nov’90-Jun’94 Jan’99-
10.2 CONSERVATION ISSUES Issues of importance for conservation are summarised below. The recommendations are based on the information provided in chapter 4 in this profile. Plant communities, particularly the coastal hummocks, the lichen fields in the coastal and foggy zones, as well as the dolerite ridges, are vulnerable to mechanical damage caused by off-road vehicles. It is recommended to ban off-road driving in these areas and further identify the extension of the areas in order to avoid destruction. Some of the plant communities found on inselbergs are unique to them and are vulnerable to extinction. Threats include mining, trampling, removal for gardens and grazing of livestock far beyond the capacity of the land. Without effective control and management, all of these activities could become a real threat to these areas, which are so valuable. The Cape Cross Seal Reserve harbours one of the largest colonies of Cape fur seals and it is the northernmost breeding colony of this species. The stone cross at Cape Cross is a national monument. The tourist potential is enormous, as nowhere else in
PDF created with pdfFactory trial version www.pdffactory.com

Coastal Profile of the Erongo Region - August 1999 195
Namibia - and few places in the world where numbers and close proximity can compare. Salt is presently mined to the south of the seal reserve and a seal factory north of the reserve, process culled seals. It is recommended to manage the seal reserve from the perception, that the size of the seal population and its tourist value is given the priority. The Damara Tern is classified in the Red Data Book as “rare and near-threatened”. It is most abundant along the Namibian coast during summer and most birds migrate to West Africa in the winter. The main nesting grounds for this species are situated in the project area, although some nests also occur in surrounding areas, in South Africa and perhaps in Angola. A large concentration of 110-120 nests is situated 8-10 km South of Swakopmund on both sides of the main road. The Damara terns nesting here use all available space between the ocean and the dunes. Smaller colonies are found on other localities within the project area. It is recommended to protect these areas and restrict public access where possible. The area south of Swakopmund has been zoned out as part of the Environmental Impact Assessment that has been carried out between Walvis bay and Swakopmund by the CZM project. Brandberg is Namibia’s highest mountain. The Brandberg Monument Area is one of the richest sites on earth regarding rock paintings and at the same time a hotspot for biodiversity. The scenery around the mountain is beautiful and more than 6500 tourists visit the site annually, this number is estimated to increase by 15-40% in the coming years. The site includes also concession areas for small-scale mining activities for rocks and minerals. The Brandberg Monument Area has been proposed as a World Heritage Site, a Man & Biosphere Reserve. The idea is that this should be the core area of a larger management area which include Cape Cross, Messum Crater, Spitzkoppe, the middle part of the Ugab River, Doros Crater, Twyfelfontein, and Petrified Forest. This area could be managed under an administrative body composed of relevant Ministries, NGO and the Erongo- and Kunene Regional Councils. It s highly recommended to establish a task force under the auspices of the new National Body for Coastal Zone Management in order to pursue these ideas. Sandwich Harbour and Walvis Bay lagoon are two of the most important lagoons located along the Namibian coastline, both have been classified as Ramsar sites. Walvis Bay lagoon is the richest coastal wetland on the West Coast of southern Africa and it is planned to declare the lagoon and its surroundings as a Nature Reserve. Eight zones of different habitats have been identified within the lagoon and the surrounding areas. An environmental management plan has been prepared. The subsequent step is planned to culminate in the declaration of the area as a Conservancy or Nature Reserve, to clarify legislation, to develop the necessary support, including staff to oversee the implementation and to guide the management of future uses and developments of the lagoon and surrounding areas. 10.3 RECREATION ISSUES Apart from a small area around Lüderitz, the only part of the Namibian coastline, open to the public, is within the Erongo Region. The remaining part of the Namibian coastal zone is either under diamond mining concession or has park status. The Skeleton Coast Park and the Namib-Naukluft Park place restrictions on public recreational activity.
PDF created with pdfFactory trial version www.pdffactory.com
Coastal Profile of the Erongo Region - August 1999 196
Within the coastal zone of Erongo Region only the area around Cape Cross and the area south of Sandwich Harbour is closed to the public, apart from the commercially exploited salt pans. The largest part of the coastal zone i.e. the West Coast Recreational Area and the Municipal areas around Walvis Bay, Swakopmund and Henties Bay are open for public access and for a variety of recreational activities. People from all over Namibia and from foreign countries come to the Erongo Region and take advantage of the opportunity to partake in relatively unrestricted leisure activities. Angling is carried out all along the coast and tracks after off-road driving can be found almost everywhere. Tour operators offer trips on the so-called quad bikes in the dune fields between Swakopmund and Walvis Bay. Individual quad biking, motor-cross driving, dune skiing and hang-gliding are all examples of activities, which are carried out in the project area. In order to manage the increasing use of the coastal zone in the project area a plan must outline zonation schemes for the various activities on the coast. As a point of departure the Coastal Zone Management project has evaluated the environmental impact of all of the present activities in the dune fields between Swakopmund and Walvis Bay. Management actions to be taken, both on a short- and a long-term basis, have been recommended and a zonation scheme for the area has been set up, see figure 10.2. Zonation for the entire west coast of the Erongo Region is envisioned. Figure 10.2. (the final zonation map found in the EIA of the dune fields between WB and Swakop
PDF created with pdfFactory trial version www.pdffactory.com
Coastal Profile of the Erongo Region - August 1999 197
10.4 SOCIO-ECONOMIC ISSUES Based on chapter 5 and 6 in this profile the following concerns are either dealt with already or must be addressed in future: The steady increase in the growth rate of the population on the coast – in Walvis Bay alone estimated to 6.5% annually – is a challenge to the local economy and to town planning schemes. Only 26% of the population of Swakopmund and 30% of Walvis Bay residents were born in the towns. A combination of perceived and real employment opportunities is the reason behind the trend. The seasonal nature of two of the large sectors for employment, the fish processing- and the tourism industries, is an additional factor, which complicate the situation. Stimulation of the economic growth in particular in the Export Processing Zone, in the tourist- and fishing industries and in Walvis Bay harbour must be supported and sustained. High rates of natural growth in the rural areas will continue to put more pressure on natural resources and will support the current high level of rural to urban migration. Although economic development in the northern towns of Namibia may have a significant effect on limiting the flow of urban migrants to the Erongo Region, the general rate of urbanisation is not expected to decrease significantly. Generally, the housing stock in the towns of the project area is found to be of good quality and is serviced with the necessary municipal services. However, the housing situation is poor in certain areas i.e. the hostel, single quarters and the backyard shacks in Kuisebmond, Mondesa and Omdel. In Kuisebmond, more than three people occupy each habitable room in 20% of the households, 13,2% of the households in Walvis Bay reside in backyard shacks. The Kuisebmond Hostel comprises dormitories of 15-20 men in each room, which amounts to a total of 5,380 men or 14.6% of Walvis Bay’s population. The current need for “low cost housing” in the project area is high and must be given priority. According to information from the press the area of “low cost housing loan schemes” is the first functional area to be decentralised from the central Government to the Regional- and local authorities. More than half of the population of the Erongo Coast resides in low-income areas i.e. these households account for less than 16% of total residential cash income. In the low-income suburbs to the municipalities of the region, 79% of households receive less than N$ 2,000 per month, and 23% of all households in the low-income suburbs has incomes below N$ 500 per month. The size of the household in the project area varies typically from 2.5 to 5.5 persons. A food consumption rate of 60% for a household is defined as poor. At least 30% of the households in the project area is falling under this definition. Poverty is probably the main reasons behind the increasing crime rates in the project area. The situation might deteriorate further within a few years time, because water prices will increase with 100% in this period. There are no easy solutions to the above problems but it is recommended that efforts taken in order to alleviate the situation, is taken mainly on an regional basis and not individually by the municipalities. Medical services are provided at three state hospitals and two private hospitals in the two Health Districts of the Coastal Zone and at 6 health clinics in Walvis Bay Town, Kuisebmond, Narraville, Swakopmund, Tamariskia, Henties Bay and Arandis. Health
PDF created with pdfFactory trial version www.pdffactory.com

Coastal Profile of the Erongo Region - August 1999 198
Centres are found in Swakopmund and Arandis and Outreach Units provide services to communities in Brandberg, Swakopmund and Henties Bay. The health coverage is above the national average. Tuberculosis and HIV/AIDS are the most serious health problems in the region, but other diseases such as respiratory diseases are of concern. 10.5 ENFORCEMENT AND AWARENESS ISSUES
The importance of enhanced enforcement/awareness systems in the Erongo region has been realised by the CZM project when the existing enforcement and awareness programmes were monitored in 1998. The key recommendations from the studies (see progress report 1, 1998) are summarised here and presented together with a short description of the work which was recommended to continue within the field of enforcement/awareness (part of this work has already been carried out): • The total amount of fines and the size of the individual fines should be increased.
Based on an evaluation of the existing magnitude regarding the various types of culprits, based on the seriousness of the offence and based on Namibia’s dependence on the natural resources, new size of fines could be recommended.
MFMR is working actively with suggestions for the amendment of enforcement procedures and MET should join and follow this initiative. It is possible within existing legislation, but the task is time consuming.
• Integrated enforcement where MFMR can enforce MET laws vice versa will be a
real improvement in order to increase the enforcement capacity in the existing situation. Also a step like this is a possibility within existing legislation. For the time being MFMR has taken the initiative here and convened a group composed of representatives from MET, Police, magistrate who evaluate the possibilities regarding integrated enforcement in co-operation with MET. The Regional Coastal Zone Management Committee will be invited to participate in the work in the future.
• For the reduction of the need for enforcement action, physical planning and
zoning is needed in particular in the area between Swakopmund and Walvis Bay so areas for activities such as to quad biking and dune skiing are designated.
• In order really to enhance enforcement systems certain improvements of the
present legislation is a necessity (see section 11.6). • A future environmental awareness campaign must be launched together with the
tightening of the enforcement procedures. • There is a need for expansion of the staff in MET regional office in Erongo
Region . 10.6 LEGAL ISSUES
In considering and evaluating the various pieces of legislation which cover environmental and resource management in the project area, the laws jurisdiction of application, their focus and intention, and their age must be borne in mind (see
PDF created with pdfFactory trial version www.pdffactory.com
Coastal Profile of the Erongo Region - August 1999 199
chapter 7). Most existing laws fail to reflect modern environmental principles, i.e. the polluter-pays principle, inter-generation equity. Many are deficient and ineffective for the following reasons; • The content of the legislation fails to address modern environmental issues. • Regulations have not been promulgated in relation to environmental
considerations in the Project Area. The ability to enact regulations either does not exist for specific environmental problems, or the ability to regulate certain activities has been overlooked or ignored.
• Committees, Bodies, and Officials have not been created or sustained. • Provisions are outdated and ineffectual, and enforcement penalties fail to act as an
effective deterrent. • Lack of skills and certainty in the application of certain laws; and conflicting and
overlapping jurisdiction between governmental authorities and ministries. After several law workshop have been carried out under the auspices of the CZM project the following solutions to the existing situation, regarding the shortcomings of the present legislation could be: • Amendment of existing legislation; especially in areas like penalties, powers,
appointment of officials, or • broadening and incorporating of designated areas under specific statutes, or • new legislation covering the goals of resource- and environmental management in
the coastal zone of Namibia. 10.8 ENVIRONMENTAL ASSESSMENT (EIA) PROCEDURES The environmental assessment policy was passed by the Namibian Cabinet in 1994. So far, the Environmental Assessment (EA) procedure has only had policy status and formal legislative support has lacked. However, with reference to the Namibian constitution an EA procedure is essential before big development projects are approved. Therefore, in Namibia there is a strong tradition for preparation of environmental impact assessments in relation to almost all major construction activities and works. In addition, it should be noted that in relation to mining licences, the Minerals Act of 1992 set certain criteria for environmental impact assessment before mining activities are carried out. Any application for a mining licence for large scale mining must be accompanied by an environmental impact assessment and an environmental management plan. A main problem in relation to the initiation and approval of environmental assessments of projects are the responsibility of a large number of line ministries. Approvals from many different authorities are needed but at present the central co-ordination is lacking. A final draft of the Environmental Management Act of 1998 is available. However, it is uncertain if and when - the Cabinet will pass the Act in its present form. A requirement outlined in the Act i.e. environmental assessment has to be conducted for all of the activities, which are likely to impact the environment. For example,
PDF created with pdfFactory trial version www.pdffactory.com

Coastal Profile of the Erongo Region - August 1999 200
construction/upgrading of most physical installations and production facilities, change of land-use status; resource extraction (mining and quarrying), farming and groundwater abstraction require that the EIA procedure be followed. A definition of works and activities that require environmental assessment is listed in Schedule 1 to the Act. The overall responsibility for enforcement of the Environmental Assessment Act is proposed to lie with the Ministry of Environment and Tourism. As to the draft outline of the Act, it is planned to establish a Sustainable Development Commission, under the auspices of the Ministry of Environment and Tourism. The functions of the Commission include promotion and integration of environmental considerations in all aspects of development, including co-ordination between relevant ministries, local authorities, institutions, organisations, non-governmental organisations etc. in relation to environmental issues. It is proposed to be the responsibility of the Sustainable Development Commission to issue or refuse environmental clearances in respect of projects for which an environmental assessment has been carried out. Further, it is planned to establish a post of Environmental Commissioner to carry out the administrative and secretarial functions of the Sustainable Development Commission. The main responsibilities of the Environmental Commissioner in relation to environmental assessments will be to supervise the environmental assessment process, including the provisions for public participation for projects included in the list to the Act. Further, to undertake a screening process and determine whether environmental assessment is required, and - if this is the case - determine the form, scope and content of the environmental assessments. Finally, the Environmental Commisioner is expected to review the environmental assessment report and make recommendations to the Sustainable Development Commission in respect of granting of or refusing to grant an environmental clearance, with or without conditions. If it, based on the screening, is determined that an environmental assessment is not required, an environmental clearance may be issued by the Environmental Commissioner. The proposed EA legislation will require considerable financial and human resources to ensure its implementation, monitoring and enforcement.
PDF created with pdfFactory trial version www.pdffactory.com
Coastal Profile of the Erongo Region - August 1999 201
11.0 REFERENCES
Literature André H.M., Noti M.I. & Jacobson K.M. 1997: The soil microarthropods of the
Namib Desert: a patchy mosaic. J. Afr. Zool. 111: 499-517. Aubroeck S. 1972: Toeslikking van strandmeer by Walvisbaai. Hydraulics Research
Institute report. Barnard P. 1998: Biological diversity in Namibia – a country study. Namibian
National Biodiversity Task Force, Directorate of Environmental Affairs, Windhoek, Namibia, 332 pp.
Beier von M. 1962: Pseudoscorpioniden aus der Namib-Wüste. Ann. Transv. Mus. 24: 223-230.
Berger-Dell’mour H.A.E. 1985: Rössing Ecological Survey: Lower Vertebrates (Reptiles and Amphibians). Report to Rössing Uranium, State Museum of Namibia, Windhoek, 12 pp.
Berry H.H. 1973: Walvis Bay Lagoon – a potential tragedy. Article prepared for African Wildlife & Report, Nature Conservation and Tourism Division, SWA Administration, 5pp.
Berry H.H. & Berry C.U. 1975: A checklist and notes on the birds of Sandvis, South West Africa. Madoqua. 9(2): 5-18.
Berutti A. 1989: Resident Seabirds: Damara tern. pp. 267-268. In: Oceans of life off southern Africa. Payne, A.I.L. & Crawford, R.J.M. (eds.), Vlaeberg, Cape Town, 380 pp.
Besler H. 1972: Klimaverhältnisse und klimageomorphologische Zonierung der zentralen Namib (Südwestafrika). Stuttgarter Geographische Studien, Stuttgart, 83: 1-209.
Besler H., Blümel W.D., Heine K., Hüser K., Leser H. & Rust U. 1994: Geomorphogenese und Paläoklima Namibias. Die Erde 125: 139-165.
Birch G.F., Rogers J. & Bremner J.M. 1978: Phosphate and Potash Resources on the Continental Margin of Southern Africa. Unpublished. Rep. Geological. Survey South Africa
Braby R, Braby S.J. & Simmons R.E. 1992: 5000 Damara terns in the northern Namib Desert: a reassessment of world population numbers. Ostrich 63: 133-135.
Bremner J.M. 1979: Physical Parameters of the Diatomaceous Mud Belt off South West Africa. Joint Geol. Survey S Afr. and University Cape Town Mar. Geosci. Tech. Rep. 11, 30-35.
Bremner J.M. 1980: Concretionary Phosphorite from SW Africa. J. Geol. Soc. London, 137, 773-768.
Bremner J.M 1983: Biogenic Sediments on the South West African (Namibian) Continental Margin. Rep. Herbert, R.S., Shackleton, L.Y., Thackeray, J.F. and Rogers, J. 1989. Diatomaceous Ooze off Walvis Bay: Collaborative Research on Climatic Change. Suid Afrikaanse Tydskrif vir Wetenskap, 85, 295-296.
Brinckman E. & von Willert D.J. 1987: Injury and recovery of Welwitschia mirabilis. Dinteria 19: 69-76.
PDF created with pdfFactory trial version www.pdffactory.com
Coastal Profile of the Erongo Region - August 1999 202
Brooke R.K. 1984: South African Red Data book – birds. South African National Scientific Programmes Report No.97, FRD, CSIR, Pretoria.
Brown C.J., Jarvis A., Robertson A., Simmons R. 1998: Terrestrial and freshwater diversity: bird diversity. pp. 155-162. In: Biological diversity in Namibia – a country study. Barnard, P. (ed.), Namibian National Biodiversity Task Force, Directorate of Environmental Affairs, Windhoek, Namibia, 332 pp.
Bruyns P. 1988: A note on Aloe in the Brandberg, Namibia and an unusual hybrid. Aloe 25: 24-26.
Bruyns P. 1990: New plant records from the Brandberg. Cimbebasia 12: 161-166. Burger S. W. 1972: Sandindringing in die strandmeer te Walvisbaai, deel I:
Waardasie van die probleem en voorgestelde rigtings vir verdere ondersoek. Nature Conservation and Tourism Division, SWA Administration, 9pp.
Burger L. 1998: Walvis Bay Lagoon: Environmental Management Plan. Environmental Evaluation Unit, University of Cape Town.
Buzer J.S. & Sym S.D. 1983: Diatoms and pollen in a trial core from Sandwich Harbour, South West Africa (Namibia). British Phycological Journal. 18: 121-129.
Central Statistics Office 1991: Population and Housing Census, National Planning Commission, Windhoek
Central Statistics Office 1994: Living Conditions in Namibia, The 1993/1994 Namibia Household Income and Expenditure Survey, National Planning Commission, Windhoek
Channing A.E. 1974: Low-rainfall tolerant South African Anurans with particular reference to those of the Namib. MSc. University of Natal, Dept. of Zoology, Pietermaritzburg.
Coetzee C.G. 1969: The distribution of mammals in the Namib Desert and adjoining inland escarpment. Scientific Papers of the Desert Research Station 40: 23-36.
Collar N.J. & Stuart S.N. 1985: Threatened birds of Africa and related islands, Red Data Book, Part 1. ICBP/IUCN, Cambridge, UK, 761 pp.
Cooper-Driver G.A. 1994: Welwitschia mirabilis – a dream come true. Arnoldia 54(2):2-10.
Costa G., Petralia A., Conti E., Hänel C. 1995: A 'mathematical' spider living on gravel plains of the Namib Desert. Journal of Arid Environments 29: 485-494.
CPA-DNEC 1991: Walvis Bay Nature Reserve Management Plan. Cape Provincial Administration Department of Nature and Environmental Conservation, Cape Town, South Africa, 33pp.
CPA-DNEC 1991: Island Reserves Master Plan. Cape Provincial Administration Department of Nature and Environmental Conservation, Cape Town, South Africa, 27pp.
Craven P. 1989a: A short note on the flora of the Brandberg. SWA Mountaineering 1964-1989 – 25 years.
Craven P. 1989b: Brandberg flora – a short note. Journal of the Mountain Club of South Africa 92: 96-97.
Craven P. 1997: Check list of plants collected on the Brandberg Mountain. NBRI, Windhoek, unpublished.
PDF created with pdfFactory trial version www.pdffactory.com
Coastal Profile of the Erongo Region - August 1999 203
Craven P. 1998: Lichen diversity in Namibia. pp. 114-115. In: Biological diversity in Namibia – a country study. Barnard, P. (ed.), Namibian National Biodiversity Task Force, Directorate of Environmental Affairs, Windhoek, Namibia, 332 pp.
Crawford R.J.M., David J.H.M., Williams A.J. & Dyer B.M. 1989: Competition for space: recolonising seals displace endangered, endemic seabirds off Namibia. Biological Conservation 48: 59-72.
Crawford R.J.M. & Simmons R.E. 1997: Damara tern, Damaraseeswael, Sterna balaenarum. pp. 480-481. In: The Atlas of Southern African Birds, Vol. 1.
CSIR 1984: Sintese van fisiese prosesse in en om Walvisbaai Strandmeer. Departement van Staatkundige Ontwikkeling en Beplanning, CSIR Report C/Sea 8424, 42pp & 42 figs.
CSIR 1989: A study of some physical and biotic processes affecting dredging within the Walvis Bay Lagoon. CSIR Report EMA-C89109, 48 pp, 6 tables, 50 figures.
CSIR 1996: Preventing natural breaching of thepeninsula at Walvis Bay. CSIR Report ENV/S-C 96072, Division of Water, Environment and Forestry Technology, CSIR.
CSIR 1997: An assessment of the potential environmental impacts of the proposed aquifer recharge scheme on the Khan River, Namibia. Rössing Uranium Ltd., Swakopmund, Namibia.
Curtis B.A. 1985: Temperature tolerances in the Namib Desert dune ant, Camponotus detritus. J.Insect Physiol. 31(6): 463-466.
Currie B 1997: The Walvis Bay Lagoon: aspects concerning the fauna. In: Environmental Action Committee (eds.) Towards an integrated management and development plan for the Walvis Bay Lagoon and environs, Papers delivered at a Workshop, 22 July 1997, Walvis Bay.
DANCED 1995: Integrated coastal zone management plan, Walvis Bay area, Erongo Region, Namibia. Draft project proposal to the Government of the Republic of Namibia.
Daneel J.L. 1992: The impact of off-road vehicle traffic on the gravel plains of the Central Namib Desert, Namibia. M.Sc. Thesis, Dept. Agronomy, University of Natal, Pietermaritzburg, South Africa. 117 pp.
David J.H.M. 1987: The Cape fur seal at Cape Cross. African Wildlife. 40(3): 103. David J.H.M. 1989: Seals. pp. 288-302. In: Oceans of life off southern Africa. Payne,
A.I.L. & Crawford, R.J.M. (eds.), Vlaeberg, Cape Town, 380 pp. Dentlinger U. 1983: Social and Spatial Monility along the Kuiseb River in the Namib
Desert, Unpublished MA Thesis, University of Cape Town Department of Environmental Affairs 1989: Coastal oil spill contingency plan:
Walvis Bay zone. Department of Environmental Affairs, Republic of South Africa, Pretoria.
Desert Research Foundation of Namibia (ed) 1997: Towards an integrated management and development plan for the Walvis Bay Lagoon and environs, Proceedings of a Workshop, 22 July 1997, Walvis Bay, Desert Research Foundation of Namibia.
Diehl B.J.M. 1990: Geology, Mineralogy, Geochemistry and Hydrothermal Alteration of the Brandberg Alkaline Complex, Namibia. Memoir 10, Geol. Survey Namibia, 55 pp, Windhoek.
PDF created with pdfFactory trial version www.pdffactory.com
Coastal Profile of the Erongo Region - August 1999 204
Diehl B.J.M. 1992a: Dimension Stone. In: The Mineral Resources of Namibia. Spec. Publn., Geol. Survey Namibia, Windhoek.
Diehl B.J.M. 1992b: Tungsten. In: The Mineral Resources of Namibia. Spec. Publn., Geol. Survey Namibia, Windhoek.
Diehl B.J.M. 1992c: Tin. In: The Mineral Resources of Namibia. Spec. Publn., Geol. Survey Namibia, Windhoek.
Dunai T.J. 1998: Petrographische, geochemische und lagerst„ttenkundliche Untersuchungen an Karbonatitg. auf der Farm Eureka 99, Damaraland, Namibia. Diplomarbeit, Univ. Heidelberg, 96 pp.
Eckardt F. 1996: The distribution and origin of gypsum in the Central Namib Desert, Namibia. PhD Thesis, University of Oxford, 320 pp.
Eckardt F & White K. 1997: Human induced disruption of stone pavement surfaces in the Central Namib Desert, Namibia: Observations from Landsat Thematic Mapper. Remote Sensing 18, 3306-3310.
Endödy-Younga S. 1982: Dispersion and translocation of dune specialist tenebrionids in the Namib area. Cimbebasia (A) 5: 257-271.
Environmental Evaluation Associates of Namibia 1991: Feasibility study, environmental impact evaluation: surfaced road Swakopmund – Cape Cross. Environmental Evaluation Associates of Namibia, Windhoek, 21 pp.
Environmental Evaluation Associates of Namibia 1992: Pelagic birds off northern Namibia and coastline of Namibia - Walvis Bay to the Cunene - a biophysical description. Environmental Evaluation Associates of Namibia, Windhoek, 23pp.
Environmental Evaluation Unit 1996: Environmental assessment of the Walvis Bay development project. Environmental Evaluation Unit, University of Cape Town, 187 pp.
Environmental Evaluation Unit 1997: Environmental assessment of the Walvis Bay development project: Environmental management and monitoring plan. Environmental Evaluation Unit, University of Cape Town, 59pp.
Frost P.G.H. & Shaughnessy E. 1976: Breeding adaptations of the Damara tern Sterna balaenarum. Madoqua 9:33-39.
Gebhardt L. 1973: Sandwich Harbour. S.W.A. Annual Yearbook. Gevers T.M. & van der Westhuyzen J.P. 1931: The occurrences of salt in the
Swakopmund area, South-West Africa. Transactions of the Geological Society of South Africa 1931: 61-80.
Giess W. 1962: Some notes on the vegetation of the Namib Desert. Cimbebasia 2: 3-35.
Giess W. 1971: A preliminary vegetation map of South West Africa. Dinteria 4: 5-114.
Giess W. 1981: Die in der zentralen Namib von Südwestafrika/Namibia festgestellten Pflanzenarten und ihre Biotope. Dinteria 15: 13-29.
Giess W. 1982: Weitere Neunachweise zur Flora des Brandberges. Dinteria 16: 7-9. GKW 1996: Water Supply to the Central Namib Area of Namibia - Feasibility Study.
Volume 2: Project Area and Socio-economic Background, Department of Water Affairs, Windhoek
Goudie A. 1972: Climate, weathering, crust formation, dunes, and fluvial features of the central Namib Desert, near Gobabeb, South West Africa. Madoqua, Series II. 1, 15-31.
PDF created with pdfFactory trial version www.pdffactory.com
Coastal Profile of the Erongo Region - August 1999 205
Greig J.C. & Burdett P.D. 1976: Patterns in the distribution of southern African terrestrial tortoises (Cryptodira: Testudinidae). Zoologica Africana 11(2): 249-273.
Griffin E. 1988: Species richness and seasonal activity of the non-acarine arachnids in three Central Namib Desert gravel plain habitats. Report to Rössing Uranium, State Museum of Namibia, Windhoek, 11 pp.
Griffin E. 1990: Seasonal activity, habitat selection and species richness of Solifugae (Arachnida) on the gravel plains of the central Namib desert. pp. 77-82. In: Namib Ecology - 25 years of Namib research. Seely, M.K. (ed.), Transvaal Museum Monograph No. 7. Transvaal Museum, Pretoria.
Griffin E. & Dippenaar-Schoemann A.S. 1991: A checklist of, and references to, the Namibian spider fauna (Arachnida, Araneae). Cimbebasia, 13: 155-181.
Griffin M. 1997: Checklist and provisional national conservation status of amphibians, reptiles, and mammals known or expected to occur in Namibia. Memorandum, Ministry of Environment and Tourism, Windhoek.
Griffin M. 1998a: Terrestrial and freshwater habitats: reptile diversity. pp. 148-155. In: Biological diversity in Namibia – a country study. Barnard P. (ed.), Namibian National Biodiversity Task Force, Directorate of Environmental Affairs, Windhoek, Namibia, 332 pp.
Griffin M. 1998b: Terrestrial and freshwater habitats: mammal diversity. pp. 162-173. In: Biological diversity in Namibia – a country study. Barnard P. (ed.), Namibian National Biodiversity Task Force, Directorate of Environmental Affairs, Windhoek, Namibia, 332 pp.
Griffin M. 1998c: The species diversity, distribution and conservation of Namibian mammals. Biodiversity and Conservation 7: 483-494.
Griffin E. 1998d: Species richness and biogeography of non-acarine arachnids in Namibia. Biodiversity and Conservation 7: 467-481.
Griffin E. 1998e: Terrestrial and freshwater habitats: arachnid diversity. pp. 126-131. In: Biological diversity in Namibia – a country study. Barnard P. (ed.), Namibian National Biodiversity Task Force, Directorate of Environmental Affairs, Windhoek, Namibia, 332 pp.
GTZ 1993: Central Area Water Master Plan Namibia. Windhoek, Namibia. Günster A. 1993: Does the timing and intensity of rain events affect resource
allocation in serotinous desert plants? Acta Oecologica 14: 153-159. Hachfeld B. 1996: Vegetationsökologische Transektanalyse in der nördlichen
Zentralen Namib. Master of Science. Institut für Allgemeine Botanik der Universität Hamburg, Hamburg, 137 pp.
Hamilton W.J. 1975: Coloration and its thermal consequences for diurnal desert insects. pp. 67-89. In: Environmental Physiology of Desert Organisms. N.F. Hadley, Editor. Halstead Press: U.S.A.
Harrison J.A., Allan D.G., Underhill L.G., Herremans M., Tree A.J., Parker V. & Brown C.J. (eds.), Johannesburg: BirdLife South Africa. 785 pp.
Heather-Clark S. 1996: An environmental overview of the Walvis Bay ‘bay area’, Namibia. M.Phil. thesis, University of Cape Town, 82pp.
Heine K. 1998: Late Quaternary climate changes in the Central Namib Desert, Namibia. Pages 293-304 in A.S. Alsharhan, K.W. Glennie, G.L.
PDF created with pdfFactory trial version www.pdffactory.com
Coastal Profile of the Erongo Region - August 1999 206
Whittle & C.G.S. Kendall, eds. Quaternary Deserts and Climatic Change. A.A. Balkema, Rotterdam.
Heine K. and Walter R. 1996: Die Gipskrustenböden der zentralen Namib (Namibia) und ihr paläoklimatischer Aussagewert. Petermanns Geographische Mitteilungen 140: 237-253.
Hellwig D.H.R. 1968: A water quality study of the fresh water found around the Sandwich lagoon. CSIR National Institute for Water Research.
Henschel J.R. 1990a: Spiders wheel to escape. South African Journal of Science 86: 151-152.
Henschel J.R. 1990b: The biology of Leucorchestris arenicola (Araneae: Heteropodidae), a burrowing spider of the Namib dunes. pp.115-127. In: Namib Ecology - 25 years of Namib research. Seely M.K. (ed.), Transvaal Museum Monograph No. 7. Transvaal Museum, Pretoria.
Henschel J.R. 1995: Tool use by spiders: stone selection and placement by corolla spiders Ariadna (Segestriidae) of the Namib Desert. Ethology 101: 187-199.
Henschel J.R. 1997: Psammophily in Namib Desert spiders. Journal of Arid Environments 37: 695-707.
Henschel J.R. & Lubin Y.D. 1992: Environmental factors affecting the web and activity of a psammophilous spider in the Namib Desert. Journal of Arid Environments 22: 173-189.
Henschel J.R., Dausab R. & Breuninger B. 1997: NARA Workshop of the Topnaar Community and DRFN at Lauberville, 19th November 1997. Minutes of the Desert Research Foundation of Namibia and the Topnaar Community Foundation, Walvis Bay.
Henschel J.R., Mtuleni V., Gruntkowski N., Seely M.K. & Shanyengana S.E. 1998a: Namfog: Namibian Application of Fog-Collecting Systems, Phase I: Evaluation of Fog-Water Harvesting. Occasional Paper No.8, Desert Research Foundation of Namibia.
Henschel J.R. & Seely M.K. 1999: Long-term growth patterns of Welwitschia mirabilis, a long-lived plant of the Namib Desert (including a bibliography). Plant Ecology, submitted.
Henschel J.R., Seely M.K. & Polis G.A. 1998b: Long term population dynamics of tenebrionid beetles in the Namib Desert. Ecological Monographs (in preparation).
Henschel J.R., Seely M.K. & Zeidler J. 1999: Long-term environmental research in western Namibia identifies fundamental processes underlying biodiversity. Madoqua, submitted.
Herre H. 1961: The age of Welwitschia bainesii (Hook. f) Carr.: C14 research. Journal of South African Botany 27:139-140.
Hiscocks K. & Perrin M.R. 1988: Home range and movements of black-backed jackals at Cape Cross Seal Reserve, Namibia. South African Journal of Wildlife Research. 18(3): 97-100.
Hockey P.A.R. and Bosman A.L. 1983: Conservation management of the Walvis Bay lagoon with special reference to its importance as a bird habitat. Percy FitzPatrick Institute Report, Association of Round Tables of South Africa, Walvis Bay Section 36, 33pp.
PDF created with pdfFactory trial version www.pdffactory.com
Coastal Profile of the Erongo Region - August 1999 207
Hodgson A.N., Hänel C. & Loveridge A.J. 1994: The reproductive cycle of the pulmonate snail Xerocerastus minutus from the Namib desert. J. Moll. Stud. 60: 355-358.
Hughes P., Brundit G.B. & Searson S. 1992: The vulnerability of Walvis Bay to rising sea levels. Journal of Coastal Research 8: 868-881.
Hugo P.J. 1968: Die voorkoms van ilmenithoudende sand langs die Weskus in die Distrikte van Swakopmund en Omaruru. Unpubl. rep. Geol. Survey Namibia, 4 pp.
Irish J. 1990: Namib biogeography, as exemplified mainly by the Lepismatidae (Thysanura: Insecta). In: Seely M.K. (ed.). Namib Ecology - 25 years of Namib research. Pretoria: Transvaal Museum Monograph 7: 61-66.
ISO 1995: ISO 14000, Environmental Management Systems – General Guidelines on Principles, Systems and Supporting Techniques, and ISO 14001, Environmental Management System – Specifications with Guidance for Use, International Standards Organisation of the European Community.
Jackson S.P. 1941: A note on the climate of Walvis Bay. S.Afr. Geographical Journal, 23, 46-53.
Jacobson K.M. 1992: Factors affecting VA-mycorrhizal community structure in the Namib Dune Field; and the population biology of an ectomycorrhizal Basidomycete: Suillus granulatus. Ph.D. thesis, Virginia Polytechnic Institute and State University, Blacksburg, Virginia, USA.
Jacobson P.J., Jacobson K.M., Seely M.K. 1995: Ephemeral rivers and their catchments: sustaining people and development in western Namibia. Desert Research Foundation of Namibia, Windhoek, 167 pp.
Jensen R.A.C. 1970: Across the waterless Namib dunes. Geographical Magazine, London. p. 728-732.
Jones B. 1992: Preliminary Report on the Socio-ecological Survey of the Lower Kuiseb Valley, Ministry of Environment and Tourism, Windhoek
Joubert J.J., Steyn P.L., Britz T.J. & Wessels D.C.J. 1982: Chemical composition of some lichen species occurring in the Namib Desert, SWA. Dinteria 16: 33-43.
Jürgens N. 1991: A new approach to the Namib Region, I: Phytogeographic subdivision. Vegetatio 97: 21-38.
Jürgens N., Burke A., Seely M.K. & Jacobson K.M. 1997: Desert. pp. 189-214. In: Cowling, R.M., Richardson, D.M. & Pierce, S.M. (eds.), Vegetation of Southern Africa. Cambridge University Press, Cambridge, 615 pp.
Jürgens N. & Burke A. 1999: The arid scenario: Inselbergs in the Namib desert are rich oases in a poor matrix. In: Porembski & Barthlott (eds) Vegetation of inselbergs, Springer Verlag, Berlin, in prep.
Kensley B.F. & Penrith M.J. 1977: Biological survey of Sandvis 1, introduction and faunal list. Madoqua. 10(3): 181-190.
Kers L.E. 1967: The distribution of Welwitschia mirabilis Hook.f. Svensk Botanisk Tidskrift 61:97-125.
Keulder C. 1997: Traditional Authorities and Regional Councils in Southern Namibia, Friedrich Ebert Stifung, Windhoek
PDF created with pdfFactory trial version www.pdffactory.com

Coastal Profile of the Erongo Region - August 1999 208
Kinahan J., 1991: The historical archaeology of nineteenth century fisheries at Sandwich Harbour on the Namib coast. Cimbebasia. 13: 1-27.
Kinahan J., 1991: Nineteenth century fisheries at Sandwich Habour on the Namib coast. State Museum of Namibia, Windhoek.
Koch C. 1962: The Tenebrionidae of southern Africa 31: Comprehensive notes on the tenebrionid fauna of the Namib Desert. Annals of the Transvaal Museum 24: 61-106.
Kolberg H. 1997: Report on the Brandberg scoping workshop held in the Fisheries Auditorium, Swakopmund, 2nd September 1997. Memorandum, Ministry of Environment and Tourism, Khorixas, Namibia.
Lamoral B.H. 1979: The scorpions of Namibia (Arachnida: Scorpionida). Ann. Natal Mus. 23: 497-784.
Lancaster N. 1989: The Namib sand sea: dune forms, processes and sediments. A.A.Balkema, Rotterdam, 180 pp.
Lancaster J., Lancaster N. & Seely M.K. 1984: Climate of the central Namib Desert. Madoqua. 14, 5-61.
Lawrence R.F. 1962: Spiders of the Namib Desert. Annals of the Transvaal Museum 24: 197-211.
Lawrence R.F. 1965: New and little known arachnida from the Namib Desert, S.W.Africa. Scientific Papers of the Namib Desert Research Station, 27: 1-12.
Lawrence R.F. 1966: New dune spiders (Sparassidae) from the Namib Desert, South West Africa. Cimbebasia 17: 3-15.
Lenssen J., Tarr P. & Berry H. 1991: An assessment of visitors statistics and linefishing along the Sandwich shoreline, Namib-Naukluft Park, Namibia. Madoqua. 18(1): 33-36.
Lindesay J.A. & Tyson P.D. 1990: Thermo-topographically induced boundary layer oscillations over the central Namib, southern Africa. International Journal of Climatology. 10, 63-77.
Loutit R. 1997: Proposals and concepts relating to a future management plan for the Greater Brandberg Area, Erongo/Kunene Regions, Namibia. Memorandum, Ministry of Environment and Tourism, Khorixas, Namibia.
Louw G.N. & Seely M.K. 1980: Exploitation of fog water by a perennial Namib dune grass, Stipagrostis sabulicola. S.Afr.J.Sci., Vol. 76, 38-39.
Lubin Y.D. & Henschel J.R. 1990: Foraging at the thermal limit: Burrowing spiders (Eresidae) in the Namib Desert dunes. Oecologia 84: 461-467.
Maggs G.L., Kolberg H.H. & Hines C.J.H. 1994: Botanical diversity in Namibia – an overview. In: B.J. Huntley (ed.) Botanical diversity in southern Africa. Strelitzia 1:93-104.
Maggs G.L., Craven P. & Kolberg H. 1998: Plant species richness, endemism, and genetic resources in Namibia. Biodiversity & Conservation 7: 435-446.
Malan J.S. 1995: Peoples of Namibia, University of the North, Pretoria Marais E. 1998: Terrestrial and freshwater habitats: terrestrial insects. pp. 134-139.
In: Biological diversity in Namibia – a country study. Barnard P. (ed.), Namibian National Biodiversity Task Force, Directorate of Environmental Affairs, Windhoek, Namibia, 332 pp.
Marsh A.C. 1985: Thermal responses and temperature tolerance in a diurnal desert ant, Ocymyrmex barbiger. Physiol.Zool. 58(6): 629-636.
PDF created with pdfFactory trial version www.pdffactory.com

Coastal Profile of the Erongo Region - August 1999 209
Miller E.W.B. 1980: Walvis Bay Sand Dues Heavy Mineral Concentration. Unpubl. rep., EWB Miller Ass., 14 pp.
Miller R.McG 1983: Evolution of the Damara Orogen of South West Africa/Namibia. Spec. Publ. 11 Geol. Soc. South Afr.,515 pp, Johannesburg.
Milner S.C., Duncan A.R., Marsh J.S. & Miller R.McG. 1988: Field Excursion Guide to the Etendeka Volcanics and Associated Intrusives, N.W. Namibia.
Ministry of Basic Education and Culture 1992-5: Education Statistics, Windhoek MOHHS 1996: Erongo Regional Office Annual Report 1995-96, Swakopmund MOHHS 1997: Erongo Regional Office Annual Report 1996-97, Swakopmund Moisel L. 1982: Wanderungen im Brandbergmassif (mit Nachtrag zur Pflanzenliste).
Dinteria 16: 21-26. Molyneux T.G. 1976: Birds of the north-east Namib Desert Park and adjoining areas.
Madoqua 9(3): 45-52. Morris A.J. 1980: A report on the nature conservation and outdoor recreation
potential of the Walvis Bay enclave. Department of Nature and Environmental Conservation, Cape Provincial Administration, Report ANO/4/70, 45pp.
Municipality of Walvis Bay 1997: Proposed Plan of Action 1998-2001 - Walvis Bay Nagel J.F. 1959: Fog precipitation at Swakopmund. Union of South Africa
Newsletter 125, 1-9. Nagel J.F. 1962: Fog precipitation measurements on Africa's Southwest Coast. South
African Weather Bureau, Notos. 11, 51-60. Nicolson S.W., Louw G.N. & Edney E.B. 1984: Use of a ventilated capsule and
tritiated water to measure evaporative water losses in a tenebrionid beetle. J.Exp.Biol. 108: 477-481.
Nieman W.A., Heyns C. & Seely M.K. 1978: A note on precipitation at Swakopmund. Madoqua 11, 69-73.
Nordenstam B. 1974: The Flora of the Brandberg. Dinteria 11: 3-67. Nordenstam B. 1982: The Brandberg revisited. Dinteria 16: 3-5. Olivier J. 1992: Some spatial and temporal aspects of fog in the Namib. SA
Geographer 19, 106-126. Olivier J. 1995: Spatial distribution of fog in the Namib. Journal of Arid
Environments 29, 129-138. Olivier J. & Stockton P.L. 1989: The influence of upwelling extent upon fog
incidence at Lüderitz, southern Africa. International Journal of Climatology 9, 69-75.
Penrith M.L. 1986: Relationships of the tribe Adesmiini (Coleptera: Tenebrionidae) and a revision of the genus Stenodesia Reitter. Annals of the Transvaal Museum 34: 275-302.
Pietruszka R.D. & Seely M.K. 1985: Predictability of two moisture sources in the Namib Desert. South African Journal of Science 81, 682-685.
Polis G.A. & Hurd S.D. 1996: Allochthonous input across habitats, subsidized consumers, and apparent trophic cascades: examples from the ocean-land interface. pp. 275-285. In: Food webs: integration of patterns and dynamics. Polis G.A. & Winemiller K.O. (eds). Chapman & Hall, New York.
Prins A. & Leroux V. 1986: South African spiders and scorpions: identification, first aid, and medical treatment. Anubis Press, Cape Town, 72 pp.
PDF created with pdfFactory trial version www.pdffactory.com
Coastal Profile of the Erongo Region - August 1999 210
Preston-Whyte R. A., & Tyson P.D. 1988: The atmosphere and weather of southern Africa. Oxford University Press.
Prozesky O.P.M. 1963: Ornithological results of the Transvaal Museum Namib expedition May 1959, and the subsequent trip to Sandwich Harbour during January, 1960. Ostrich.
Ramsar 1996: Convention on Wetlands: Strategic plan 1997-2002. Conference Proceedings, 6th Meeting of the Conference of the Contracting Parties, Brisbane, Australia, 19-27 March 1996, 26pp.
Roberts C.S., Seely M.K., Ward D., Mitchell D. & Campbell J.D. 1991: Body temperatures of Namib Desert tenebrionid beetles: their relationship in laboratory and field. Physiol.Ent. 16: 463-475.
Robinson E. R. 1976: Phytosociology of the Namib Desert Park, South West Africa. Msc. thesis, University of Natal, Pietermaritzburg, South Africa.
Robinson E.R. 1978: Phytogeography of the Namib Desert of South West Africa (Namibia) and its significance to discussions of the age and uniqueness of this desert. pp. 67-74. In: Palaeoecology of Africa and the surrounding Islands, Vol.10. Van Zinderen Bakker, E.M. & Coetzee, J.A. (eds.), Balkema, Rotterdam.
Roesener H. & Schreuder C.P. 1992: Uranium. In: The Mineral Resources of Namibia. Spec. Publn., Geol. Survey Namibia, Windhoek.
Rose P M & Scott D.A. 1994: Waterfowl population estimates. IWRB, Slimbridge, Britain.
Rust U. 1991: Klima, Klimaschwankungen und Relief in der randtropischen Namib. Lagegegebenheiten als methodisches Argument - und ein Epilog. Geomethodica 16: 123-168.
Schieferstein B. 1990: Ökologische Untersuchungen an den Flechtenfeldern der Namib-Nebelwüste. M.Sc. thesis. Institut für Botanik, Universität Stuttgart-Hohenheim, Stuttgart, Germany.
Schieferstein B. & Loris K.. 1992: Ecological investigations on lichen fields of the Central Namib. Vegetation 98: 113-128.
Schneider M.B. 1990: Bewässerungslandwirtschaft in Namibia. Wissenschaftliche Forschung in Namibia, 19, Namibia Wissenschaftliche Gesellschaft, Windhoek.
Schneider G.I.C. & Diehl B.J.M. 1992: Industrial Rocks. In: The Mineral Resources of Namibia. Spec. Publn., Geol. Survey Namibia, Windhoek.
Schneider G.I.C. & Genis G. 1992a: Salt. In: The Mineral Resources of Namibia. Spec. Publn., Geol. Survey Namibia, Windhoek.
Schneider G.I.C. & Genis G. 1992b: Gypsum. In: The Mineral Resources of Namibia. Spec. Publn., Geol. Survey Namibia, Windhoek.
Schneider G.I.C & Miller R.McG. 1998: The Geology and Mineral Resources of the Coastal and Marine Zone of Namibia.
Schneider G.I.C. & Seeger K.G. 1992a: Copper. In: The Mineral Resources of Namibia. Spec. Publn., Geol. Survey Namibia, Windhoek.
Schneider G.I.C. & Seeger K.G. 1992b: Semi-precious stones. In: The Mineral Resources of Namibia. Spec. Publn., Geol. Survey Namibia, Windhoek.
Schneider G.I.C. & Schreuder C.P. 1992: Wollastonite. In: The Mineral Resources of Namibia. Spec. Publn., Geol. Survey Namibia, Windhoek.
Schreiber U. 1996: The Geology of the Walvis Bay Area. Explanation of Sheet 2214, Geological Survey of Namibia, 50 p., Windhoek.
PDF created with pdfFactory trial version www.pdffactory.com
Coastal Profile of the Erongo Region - August 1999 211
Schulze B.R. 1969: The climate of Gobabeb. In Scientific Papers of the Namib Desert Research Station 4, 5-12.
Seely M.K., de Vos M.P. & Louw G.N. 1977: Fog imbibition, satellite fauna and unusual leaf structure in a Namib Desert dune plant, Trianthema hereroensis. S.Afr. J. Sci., Vol. 73, 169-172.
Seely M. K. 1978: Grassland productivity: the desert end of the curve. S.Afr.J.Sci. 74: 295-297.
Seely M. K. 1989: Patterns of plant establishment on a linear dune. Israel Journal of Botany 39: 443-451.
Seely M.K. & Louw G.N. 1980: First approximation of the effects of rainfall on the ecology and energetics of a Namib Desert dune ecosystem. Journal of Arid Environments. 3, 25-54.
Seely M.K. & Stuart P. 1976: The climate of Gobabeb, ten year summary 1962/72. Namib Bulletin 1, 7-9.
Senin Y.M. 1970: Phosphorus in Bottom Sediments of the South West African Shelf. Litolog. i Poliznye Iskopaemye, 1, 11-26.
Shaughnessy P.D. 1982: The status of seals in South Africa and Namibia. In: Mammals of the seas. FAO Fish.Ser.5 4:383-410.
Shilomboleni A.G. 1998: The !Nara and factors that lead to its decline in productivity. Diploma thesis, in-service training in natural resource management, Polytechnic of Namibia, 21 pp.
Simmons R. 1993: A census of the desert-breeding Damara tern Sterna balaenarum in Namibia. In: Birds and the African Environment: Proceedings of the 8th Pan-African Ornithological Congress. Wilson, R.T. (ed.), pp. 395-398, Museé Royal de l’ Afrique Centrale, Tervuren, Belgium.
Simmons R.E., Cordes I & Braby R. 1998: Latitudinal trends, population size and habitat preferences of Damara terns Sterna balaenarum on Namibia’s desert coast. Ibis (in press).
Simon D. 1996: What’s in a Map? Regional Restructuring and the State in Independent Namibia, NEPRU Occasional Paper No. 8, Windhoek
Southgate R.I., Masters P. & Seely M.K. 1996: Precipitation and biomass changes in the Namib Desert dune ecosystem. J.Arid Environments 33: 267-280.
Statistics Sweden 1997: Namibia Intercensal Demographic Survey Incorporated Mid-decade Goal Survey 1996: Report from three Missions to Central Statistics Bureau Windhoek, NAMSTAT 1996:2
Statistics Sweden 1997: Namibia Labour Force Survey 1997: Report from a Mission to Central Statistics Bureau Windhoek, NAMSTAT 1997:2
Stuart C. T. 1975: Preliminary notes on the mammals of the Namib Desert Park. Madoqua Series II 4: 5-68.
Stuart C.T. 1975: A short note on the diet of Tyto alba at Sandwich Harbour, Namib Desert Park, South West Africa. Madoqua Series II 4: 103.
Stuart C.T. 1975: Marine fauna collected at Sandwich Harbour, Namib Desert Park, South West Africa. Madoqua Series II 4: 101-102.
Taljaard J.J. 1979: Low-level atmospheric circulation over the Namib. Newsletter of the Weather Bureau of South Africa 361, 65-67.
TRP 1997: Housing Demand and Affordability Study, Municipality of Walvis Bay, TRP Associates, Windhoek
Tyson P.D. 1986: Climatic change and variability in southern Africa. Oxford University Press, Cape Town.
PDF created with pdfFactory trial version www.pdffactory.com

Coastal Profile of the Erongo Region - August 1999 212
Tyson P.D., & Lindesay J.A. 1992: The climate of the last 2000 years in southern Africa. The Holocene 2,3: 271-278.
Tyson P.D. & Seely M.K. 1980: Local winds over the central Namib. The South African Geographical Journal. 62, 135-150.
Van den Eynden V., Vernemmen P. & Van Damma P. 1992: The Ethnobotany of the Topnaar, Universiteit Gent
Van der Meer M. 1997: Presentation from the Namibian Ports Authority on pollution emanating from the harbor and vessels anchored off port limits. In: Environmental Action Committee (eds.) Towards an integrated management and development plan for the Walvis Bay Lagoon and environs, Papers delivered at a Workshop, 22 July 1997, Walvis Bay.
Vendrig M. 1990: Fog occurrence and measurement in Namibia. Unpublished manuscript 32 pp.
Von Willert D.J. 1994: Welwitschia mirabilis Hook. fil. - das Überlebenswunder der Namibwüste. Naturwissenschaften 81:430-442.
Walter H. 1936: Die ökologischen Verhältnisse in der Namib-Nebelwüste (Südwestafrika). Gebrüder Borntraeger, Leipzig, 71 pp.
Walter H. 1985: The Namib Desert. In: Evenari et al. Ecosystems of the world. Vol 12B: Hot deserts and arid shrublands. A. Esevier, Amsterdam, pp. 245-282.
Walter H. & Breckle S.-W. 1984: Ökologie der Erde, Band 2: Spezielle Ökologie der Tropen und Subtropen. UTB, Stuttgart, 461 pp.
Ward J.D. 1989: Comments on the geomorphology of Walvis Lagoon and environs. Geological Survey report Ref. 13/7/3/1/3, 11pp.
Ward J.D. 1997: Sedimentation of the Walvis Bay Lagoon. In: Environmental Action Committee (eds.) Towards an integrated management and development plan for the Walvis Bay Lagoon and environs, Papers delivered at a Workshop, 22 July 1997, Walvis Bay.
Ward J.D., Seely M.K. & Lancaster N. 1983: On the antiquity of the Namib. South African Journal of Science 79: 175-183.
Ward J. & Seely M. 1990: Dune sands, ocean currents and man: Namibia's dynamic coastline. Rössing Magazine Oct.1990: 12-17.
Wartha R.R. & Genis G. 1992: Lead and Zinc. In: The Mineral Resources of Namibia. Spec. Publn., Geol. Survey Namibia, Windhoek.
WBEAC 1997: Towards an integrated management and development plan for the Walvis Bay lagoon and environs. Walvis Bay Environmental Action Committee, Papers delivered at a Workshop, 22 July 1997, Walvis Bay.
Wessels D.C.J. 1987: Ligeenvelde van die Namib. Namib Times, 7 August 1987. Wessels D.C.J. 1989: Lichens of the Namib Desert, SWA/Namibia. 1. The
chasmoendolithic habitat. Dinteria 20: 3-22. Wessels D.C.J., Wessels L.A. & Holzapfel W.H. 1979: Preliminary report on lichen-
feeding Coleoptera occurring on Teloschistes capensis in the Namib Desert, South West Africa. Bryologist 82:270-273.
Wetschnig W. 1992: Zur Flora und Vegetation des Südlichen Afrika: die Namib. Carinthia II 182/102: 73-91.
Wharton R.A. 1981: Namibian Solifugae (Arachnida). Cimbebasia 5: 1-87.
PDF created with pdfFactory trial version www.pdffactory.com
Coastal Profile of the Erongo Region - August 1999 213
Whitelaw D.A., Underhill L.G., Cooper J. & Clinning C.F. 1978: Waders (Charadrii) and other birds on the Namib Coast: counts and conservation priorities. Madoqua 11(2): 137-150.
Wilkinson M.J., Blaha J.E. & Noli D. 1989: A new lagoon on the Namibian coast of South Africa: sand spit growth documented from STS-29 shuttle photography. Geocarto International 1989: 63-66.
Williams A. 1987: Conservation management of the Walvis Bay wetland with particular reference to coastal bird numbers and their conservation significance. Association of Round Tables in Southern Africa, Namibia, Walvis Bay Round Table #36, 24pp.
Williams A. 1993: Swakopmund salt-works, the world’s richest artificial nature reserve? Rössing October 1993: 1-5.
Williams T. 1997: Birds of the Walvis Bay Lagoon and associated wetlands, including the Bird Sanctuary. In: Environmental Action Committee (eds.) Towards an integrated management and development plan for the Walvis Bay Lagoon and environs, Papers delivered at a Workshop, 22 July 1997, Walvis Bay.
Williams T.P. 1989: Controls on Mineralisation at the Namib Mine, Zinc and Lead (Namibia) (Pty) ltd, Swakopmund, Namibia. Unpubl. B.Sc. Hons. thesis, University of Witwatersrand, Johannesburg.
Withers P. 1979: Ecology of a small mammal community on a rocky outcrop of the Namib Desert. Madoqua Series II 3: 229-246.
Zur Strassen W.H. 1971: The fur seal of southern Africa. Howard Timmins, Cape Town. 71 pp
Zwamborn J.A. 1972: Siltation of Walvis Bay lagoon: proposed measurements and research. Hydraulics Research Unit, Stellenbosch, Report MEW 0131, 4pp.
Legal References: 1. Policy on Accommodation Establishments, Municipality of Swakopmund
1998 2. Baseline Report: Coastal Zone Management Plan for the Erongo Region,
University of Cape Town 1995-1996. Report commissioned by DANCED.
3. The Walvis Bay Act (No. 1 of 1994). 4. Nature Conservation Ordinance (No. 4 of 1975) 5. Regulations relating to Nature Conservation (No. 240 of 1976). 6. Walvis Bay Municipality: By-law for the control of the Seashore and the
Sea, 1985. 7. Convention on Wetlands of International Importance especially as
waterfowl Habitat (Ramsar), 1971, acceded in 1995. 8. The convention on Biological Diversity, 1992, acceded 1992.
PDF created with pdfFactory trial version www.pdffactory.com

Coastal Profile of the Erongo Region - August 1999 214
9. Towards An Integrated Management and Development Plan for the
Walvis Bay Lagoon and Environs. Workshop papers presented by the environmental action committee 22 July 1997.
10. The Environmental Management Bill, final draft by Michaela Figueira. 11. The Nature Conservation Amendment Act (No. 5 of 1996). 12. Amendment of Regulations relating to Nature conservation (No. 304 of
1996). 13. Sea Fisheries Act (No. 29 of 1992). 14. Sea Birds and Seal Protection Act (No. 46 of 1973) 15. Media Release of coastal angling. Regulation made in terms of Sea
Fisheries Act coming into force on 4 January 1993. 16. A toolbox for the establishment of Communal Area Conservancies.
Ministry of Environment and Tourism, 1997. 17. The Criminal Procedure Act (No. 51 of 1977). 18. Report on the Brandberg Scoping Workshop held at the Fisheries
Auditorium Swakopmund 2 September 1997. 19. West Cost Recreation Area Ordinance, Ordinance 20 of 1973.
PDF created with pdfFactory trial version www.pdffactory.com