Coastal Engineering Report for Lower Honoapiilani Road ...
73
Coastal Engineering Report for Lower Honoapiilani Road Erosion at Kaopala Bay Lahaina, Maui, Hawaii September 2018 Prepared for: County of Maui, DPW Engineering Division 200 S. High Street Kalana O Maui Bldg. 4 th floor Wailuku, HI 96793 Prepared by: Sea Engineering, Inc. Makai Research Pier Waimanalo, HI 96795 Job No. 25619
Transcript of Coastal Engineering Report for Lower Honoapiilani Road ...

Coastal Engineering Report for Lower Honoapiilani
Road Erosion at Kaopala Bay
Lahaina, Maui, Hawaii
September 2018
Prepared for:
County of Maui, DPW
Engineering Division
200 S. High Street
Kalana O Maui Bldg. 4th
floor
Wailuku, HI 96793
Prepared by:
Sea Engineering, Inc.
Makai Research Pier
Waimanalo, HI 96795
Job No. 25619

Coastal Engineering Report for Lower Honoapiilani
Road Erosion at Kaopala Bay
Sea Engineering, Inc. i
This page intentionally left blank

Coastal Engineering Report for Lower Honoapiilani
Road Erosion at Kaopala Bay
Sea Engineering, Inc. ii
TABLE OF CONTENTS
1. INTRODUCTION ................................................................................................................. 1
2. PROJECT SITE DESCRIPTION ........................................................................................ 2
2.1 SITE LOCATION ................................................................................................................. 2
2.2 SITE VISIT AND SHORELINE DESCRIPTION ......................................................................... 2
2.2.1 Profile North ............................................................................................................. 9
2.2.2 Profile South ........................................................................................................... 10
2.3 OFFSHORE BENTHIC HABITATS ....................................................................................... 14
2.4 HISTORICAL SHORELINE ANALYSIS AND SHORELINE SETBACK ...................................... 15
3. OCEANOGRAPHIC SETTING AND DESIGN PARAMETERS ................................. 18
3.1 WIND CLIMATE ............................................................................................................... 18
3.1.1 Extreme Winds ........................................................................................................ 19
3.2 CURRENTS AND CIRCULATION ........................................................................................ 21
3.3 WAVE CONDITIONS ......................................................................................................... 21
3.3.1 Deepwater Wave Heights ........................................................................................ 23
3.3.2 Nearshore Wave Transformation ............................................................................ 26
3.3.3 Hurricanes and Tropical Cyclones ......................................................................... 28
3.4 TIDE AND WATER LEVEL RISE ........................................................................................ 28
3.4.1 Tides ........................................................................................................................ 28
3.4.2 Mesoscale Eddies and Other Oceanographic Phenomena ..................................... 29
3.4.3 Wave Setup .............................................................................................................. 30
3.4.4 Storm Surge ............................................................................................................. 30
3.4.5 Sea-Level Rise ......................................................................................................... 31
3.4.6 Estimating the Effect of Sea-Level Rise on the Shoreline ....................................... 35
3.4.7 Combined Stillwater Level ...................................................................................... 36
3.4.8 Wave Height at the Shoreline ................................................................................. 37
3.5 TSUNAMI ......................................................................................................................... 38
3.6 FLOOD INSURANCE RATING ............................................................................................ 40
3.7 COASTAL PROCESSES DISCUSSION .................................................................................. 41
4. SHORE PROTECTION ALTERNATIVES ..................................................................... 43
4.1 VULNERABILITY TO COASTAL HAZARDS ........................................................................ 43
4.2 SHORE PROTECTION ALTERNATIVES ............................................................................... 43
4.2.1 Emergency Shore Protection .................................................................................. 46
4.2.2 Seawall .................................................................................................................... 49
4.2.3 Rock Revetment ....................................................................................................... 52
4.2.4 Beach Nourishment ................................................................................................. 54
4.2.5 Shore Protection Impacts ........................................................................................ 55

Coastal Engineering Report for Lower Honoapiilani
Road Erosion at Kaopala Bay
Sea Engineering, Inc. iii
4.2.6 Shore Protection Impact Mitigation ....................................................................... 57
4.3 REGULATORY ENVIRONMENT ......................................................................................... 58
4.3.1 Overview ................................................................................................................. 58
4.3.2 Federal Requirements ............................................................................................. 58
4.3.3 State of Hawaii Requirements ................................................................................. 59
4.3.4 County of Maui Requirements ................................................................................ 60
5. RECOMMENDATIONS .................................................................................................... 62
5.1 RECOMMENDATIONS FOR FOLLOW-ON WORK .................................................................. 63
5.1.1 Additional Design ................................................................................................... 63
5.1.2 Environmental Review ............................................................................................ 63
5.1.3 Permits .................................................................................................................... 63
6. REFERENCES .................................................................................................................... 66
LIST OF FIGURES
FIGURE 1-1. ROADWAY THREATENED BY UNSTABLE SHORELINE ESCARPMENT .............................. 1
FIGURE 2-1. KAOPALA BAY REGIONAL OVERVIEW ......................................................................... 4
FIGURE 2-2. TMK MAP OF PROJECT AREA ....................................................................................... 4
FIGURE 2-3. KAOPALA BAY OVERVIEW AND PROFILE LOCATIONS .................................................. 5
FIGURE 2-4. TRANSITION FROM ROCK SUBSTRATE TO CLAY/SILT ALLUVIUM .................................. 6
FIGURE 2-5. ROCK OUTCROP IN PROJECT REACH (SEE FIGURE 2-3 FOR LOCATION) ......................... 6
FIGURE 2-6. BEACH AT NORTH END OF KAOPALA BAY FROM START OF THE ROCK REVETMENT ...... 7
FIGURE 2-7. 54-INCH DRAINAGE OUTLET ........................................................................................ 7
FIGURE 2-8. EXISTING REVETMENT (VIEW LOOKING NORTH); NOTE STEEPENING NEAR THE CREST .. 8
FIGURE 2-9. END OF ROCK REVETMENT........................................................................................... 8
FIGURE 2-10. START OF REVETMENT ON ROBINSON PROPERTY ....................................................... 9
FIGURE 2-11. PROFILE NORTH THROUGH ROCK REVETMENT ........................................................... 9
FIGURE 2-12. DRAINAGE PIPE AND CRM WALL; NOTE ROCK SUBSTRATE ...................................... 11
FIGURE 2-13. 24-INCH DRAINAGE OUTLET IN 2000. ....................................................................... 11
FIGURE 2-14. RUPTURE OF THE SOIL ADJACENT TO THE ROADWAY .............................................. 12
FIGURE 2-15. SHORELINE EROSION SCARP AND COBBLE BEACH SOUTH OF THE 24-INCH DRAINAGE
OUTLET; NOTE COLLAPSING TREE AND ROOT BALL ................................................................. 12
FIGURE 2-16. START OF ROCK REVETMENT ON SOUTH END OF THE PROJECT REACH ...................... 13
FIGURE 2-17. PROFILE SOUTH THROUGH SILT/CLAY EMBANKMENT ............................................... 13
FIGURE 2-18. OFFSHORE GEOMORPHOLOGY AT THE PROJECT SITE ................................................. 14

Coastal Engineering Report for Lower Honoapiilani
Road Erosion at Kaopala Bay
Sea Engineering, Inc. iv
FIGURE 2-19. OFFSHORE BIOTA IS PRIMARILY MACROALGAE ........................................................ 15
FIGURE 2-20. EROSION RATE MAP AT KAOPALA BAY ................................................................... 16
FIGURE 2-21. A PORTION OF THE 1912 T-SHEET SHOWING THE PROJECT AREA ............................. 17
FIGURE 3-1. WIND ROSE FOR KAPALUA AIRPORT (STATION PHJH) .............................................. 19
FIGURE 3-2. COMMON WAVE TYPES AND APPROACH DIRECTIONS IN HAWAII................................ 23
FIGURE 3-3. WAVE EXPOSURE AT KAOPALA BAY .......................................................................... 23
FIGURE 3-4. VIRTUAL BUOY LOCATIONS ........................................................................................ 24
FIGURE 3-5. A) WAVE HEIGHT ROSE AND B) WAVE PERIOD ROSE FOR NOAA HINDCAST STATION
81102 ..................................................................................................................................... 25
FIGURE 3-6. A) WAVE HEIGHT ROSE AND B) WAVE PERIOD ROSE FOR NOAA HINDCAST STATION
81115 ..................................................................................................................................... 25
FIGURE 3-7. 50-YEAR NORTH SWELL TRANSFORMATION AROUND OAHU AND MAUI NUI .............. 27
FIGURE 3-8. NOS TIDE RECORD FOR AUGUST, 2017, SHOWING ANOMALOUS SEA LEVEL RISE ....... 30
FIGURE 3-9. GLOBAL SEA LEVEL TRENDS ................................................................................... 33
FIGURE 3-10. MEAN SEA LEVEL TREND, KAHULUI HARBOR, 1947 TO 2015 (NOAA, 2017) .......... 33
FIGURE 3-11. SCENARIOS FOR PROJECTED RELATIVE SEA-LEVEL RISE, KAHULUI HARBOR
(USACE, 2014) ...................................................................................................................... 34
FIGURE 3-12. COASTAL EROSION AT KAOPALA BAY ..................................................................... 35
FIGURE 3-13. TSUNAMI EVACUATION MAP, KAOPALA BAY ........................................................... 39
FIGURE 3-14. FLOOD INSURANCE RATE MAP FOR KAOPALA BAY (MAP NO. 1500030264F) ........ 40
FIGURE 4-1. MANAGED RETREAT OPTION WITH NEW MAUKA TRANSIT CORRIDOR USING RAILWAY
RIGHT-OF-WAY ....................................................................................................................... 45
FIGURE 4-2. ELCOROCK REVETMENT LAYOUT ............................................................................... 48
FIGURE 4-3. ELCOROCK REVETMENT SECTION .............................................................................. 48
FIGURE 4-4. TYPICAL SEAWALL SECTION ....................................................................................... 51
FIGURE 4-5. SCHEMATIC OF CRM WALL USED ON REVETMENT PROTECTED REACHES .................. 52
FIGURE 4-6. TYPICAL ROCK REVETMENT SECTION ......................................................................... 54
FIGURE 4-7. AN EXAMPLE OF END EFFECTS .................................................................................... 57
FIGURE 4-8. EXAMPLE OF PASSIVE EROSION AT KAHANA BAY ...................................................... 57
FIGURE 4-9. APPROXIMATE JURISDICTIONAL BOUNDARIES AT KAOPALA BAY .............................. 58
FIGURE 5-1. SCHEMATIC REPRESENTATION OF NEW CRM SEAWALL. ........................................... 64
LIST OF TABLES
TABLE 3-1. ANNUAL MAXIMUM 2-MINUTE WIND SPEEDS AT DANIEL K. INOUYE INTERNATIONAL
AIRPORT ................................................................................................................................. 20
TABLE 3-2. EXTREME VALUE DISTRIBUTION PERIODS FOR 2-MINUTE AVERAGED WIND SPEEDS AT
DANIEL K. INOUYE INTERNATIONAL AIRPORT (1969 TO 2012) .............................................. 21

Coastal Engineering Report for Lower Honoapiilani
Road Erosion at Kaopala Bay
Sea Engineering, Inc. v
TABLE 3-3. DEEPWATER WAVE HEIGHTS BY RETURN PERIOD FOR NORTH PACIFIC AND SOUTH
PACIFIC SWELL ....................................................................................................................... 26
TABLE 3-4. 50-YEAR WAVE PARAMETERS ...................................................................................... 27
TABLE 3-5. WATER LEVEL DATA FOR KAHULUI HARBOR (NOAA) ............................................... 29
TABLE 3-6. ANNUAL MINIMUM ATMOSPHERIC PRESSURE AT HONOLULU AIRPORT AND ESTIMATED
PRESSURE RELATED WATER LEVEL RISE ................................................................................. 31
TABLE 3-7. PROJECTED RELATIVE SEA-LEVEL RISE, KAHULUI HARBOR (NOAA, 2017) ............. 34
TABLE 3-8. NON-STORM POTENTIAL STILL WATER LEVEL RISE AT THE SITE FOR A 50-YEAR RETURN
PERIOD NORTH SWELL ............................................................................................................. 37
TABLE 3-9. 50-YEAR DESIGN WATER DEPTH AND WAVE HEIGHT .................................................... 38
TABLE 4-1. ANTICIPATED ENVIRONMENTAL REVIEW AND REGULATORY PERMITTING
REQUIREMENTS ...................................................................................................................... 61
TABLE 5-1. COMPARISON OF ALTERNATIVES ................................................................................. 65

Coastal Engineering Report for Lower Honoapiilani
Road Erosion at Kaopala Bay
Sea Engineering, Inc. 1
1. INTRODUCTION
During the winter of 2017-2018, the shoreline erosion scarp at Kaopala Bay in West Maui began
to encroach on Lower Honoapiilani Road. The County of Maui, Department of Public Works
(DPW) retained Sea Engineering, Inc. (SEI) to evaluate the shoreline erosion processes at this
location and provide alternatives for temporary and permanent protection.
The coastline of West Maui has been severely degraded over the last few years by a combination
of oceanographic factors. The winter wave season is usually tempered by the presence of the
island of Molokai, which blocks much of the wave activity from the northwest. However, the
Pailolo channel is open to the north, and waves from the north-northwest through north-northeast
directions can approach the West Maui coastline unimpeded. Two highly energetic winters
(2015-2017), and persistent wave activity from the north over those winters and during 2018
have contributed to the severe degradation of the West Maui shoreline.
Additionally, sea level was elevated from 2016 to early 2018 across all the Hawaiian Islands,
with tide levels regularly measuring approximately 0.3 to 0.9 ft above predicted levels. This
phenomenon was thought to be related to the 2015-2016 El Niño – Southern Oscillation (ENSO)
event. The effects of elevated sea level include higher wave heights at the shoreline that can
increase erosional effects.
Recent erosion has brought the shoreline escarpment dangerously close to the makai edge of
Lower Honoapiilani Road, with a high potential for undermining the road (Figure 1-1). At the
location shown in the figure, the root ball of a collapsing tree is causing the soil to rupture and
fail. The Maui County DPW has requested assistance with evaluating the existing conditions at
the site and the consideration of potential solutions to reduce the road’s vulnerability to coastal
hazards.
Figure 1-1. Roadway threatened by unstable shoreline escarpment

Coastal Engineering Report for Lower Honoapiilani
Road Erosion at Kaopala Bay
Sea Engineering, Inc. 2
2. PROJECT SITE DESCRIPTION
2.1 Site Location
Kaopala Bay is located on the west shore of the island of Maui, approximately six miles north of
the town of Lahaina. The physical geography of the region is dominated by the ancient West
Maui Volcano, which has collapsed and eroded into the West Maui Mountains. The nearly
circular shape of the volcano has generated a similarly curved shoreline. The area is part of the
Maui Nui complex, which includes the islands of Maui, Lanai, Molokai, and Kahoolawe. The
islands form a ring of protection that limits wave exposure (see Figure 3-3). The channels
between the islands shape the tide-generated currents, and the prominent land masses, especially
Haleakala volcano, greatly affect the local wind conditions. Kaopala Bay borders the Pailolo
channel, which runs between Maui and Molokai.
A regional location map is shown in Figure 2-1. Kaopala Bay is bounded by Haukoe Point to
the north and Kalaeokaia Point to the south. The project site is approximately 600 ft in length,
and consists of a reach that borders the county road and is between private property boundaries –
the Sarkin Estate to the north (on Haukoe Point), and the Robinson Estate to the South (see TMK
map, Figure 2-2). Kaopala gulch runs from the West Maui Mountains and contains an
ephemeral stream that flows into Kaopala Bay during periods of rain via a 54-inch drainage pipe
toward the north end of the bay. An 18-inch drainage outlet is located at the north end of the bay
in the lee of Haukoe Point, and a 24-inch outlet is located in the middle of the bay near the study
site. Figure 2-3 is an overview of Kaopala Bay showing the project reach and geographic and
geomorphic features described in this report.
2.2 Site Visit and Shoreline Description
Coastal engineers from Sea Engineering, Inc. (SEI) conducted a site visit of Kaopala Bay on
January 31, 2018. The investigation was conducted for DPW due to concern about potential
undermining of Lower Honoapiilani Road. The site work included profile measurements and
mapping of the existing erosion scarp, edge of pavement location, and other shoreline features.
The mapping was done using a survey total station referenced to a previous topographic survey
conducted in approximately the year 2000 that was provided by DPW.
The Kaopala Bay shoreline faces northwest and is a combination of sandy, rocky, and engineered
shoreline features. Haukoe Point is a rock headland that bounds Kaopala Bay on the north. A
narrow sand beach is located on the north side, in the lee of Haukoe Point. However, most of the
beach area is composed of basalt cobbles overlying a rock substrate. The rock grades upward
into cohesive red clay and silt alluvium (Figure 2-4), and the shoreline is characterized by a near
vertical escarpment of this material. Lower Honoapiilani Road approaches close to this
shoreline escarpment in this area as it skirts the bay. The closest point of approach of the

Coastal Engineering Report for Lower Honoapiilani
Road Erosion at Kaopala Bay
Sea Engineering, Inc. 3
roadway to the escarpment at the time of the site visit was approximately 6 ft. The crest of the
scarp and the roughly horizontal platform that contains the roadway are at an elevation of
approximately 15 to 17 ft above MSL.
The rock substrate varies in competency and elevation. A raised and indurated outcrop within
the project area was used as a survey base station (Figure 2-5).
The north part of the bay at Haukoe Point has a narrow beach (Figure 2-6). The approximate
southern end of the beach is at the 54-inch drainage outlet, although this likely varies over time.
The 54-inch outlet is surrounded by a CRM headwall (Figure 2-7). The pipe and headwall are in
reasonably good condition, although the CRM needs some repair at the beach level.
The shoreline escarpment on each side of the 54-inch drainage outlet CRM headwall is protected
with a basalt rock revetment for approximately 450 ft, from Haukoe Point to a position
approximately 30 ft north of the rock outcrop (see Figure 2-3), and approximately 100 ft north of
the 24-inch drainage outlet. The revetment is in a degraded condition caused by down-slope
movement of armor stone at the toe and lower section. As a result, the revetment profile is steep
near the crest, and more gently sloping near the waterline (Figure 2-8). The 30-ft reach between
the revetment and rock outcrop is unprotected, with an eroding scarp that approaches to within 6
ft of the edge of the roadway (see Figure 2-9).
At the south end of the bay, the shoreline transitions back into another basalt rock revetment that
fronts the Robinson estate and continues south to Kalaeokaia Point (Figure 2-10).
The area of most concern is the unprotected reach between the two revetments, and includes the
24-inch drainage outlet, the at-risk area caused by a collapsing tree shown in Figure 1-1, and the
30-ft reach between the rock outcrop and north revetment (see Figure 2-3). Part of this reach
may include private land of the Robinson property as it also fronts at-risk portions of the road.
Two profiles were surveyed in Kaopala Bay: Profile North was surveyed through the rock
revetment at the middle of the bay and Profile South was surveyed at the location where the road
was closest to the erosion scarp. Profile locations are shown in Figure 2-3.

Coastal Engineering Report for Lower Honoapiilani
Road Erosion at Kaopala Bay
Sea Engineering, Inc. 4
Figure 2-1. Kaopala Bay Regional Overview
Figure 2-2. TMK map of project area
Haukoe Point
Kalaeokaia
Point
Kaopala
Gulch

Coastal Engineering Report for Lower Honoapiilani
Road Erosion at Kaopala Bay
Sea Engineering, Inc. 5
Figure 2-3. Kaopala Bay overview and profile locations

Coastal Engineering Report for Lower Honoapiilani
Road Erosion at Kaopala Bay
Sea Engineering, Inc. 6
Figure 2-4. Transition from rock substrate to clay/silt alluvium
Figure 2-5. Rock outcrop in project reach (see Figure 2-3 for location)

Coastal Engineering Report for Lower Honoapiilani
Road Erosion at Kaopala Bay
Sea Engineering, Inc. 7
Figure 2-6. Beach at north end of Kaopala Bay from start of the rock revetment
Figure 2-7. 54-inch drainage outlet

Coastal Engineering Report for Lower Honoapiilani
Road Erosion at Kaopala Bay
Sea Engineering, Inc. 8
Figure 2-8. Existing revetment (view looking north); note steepening near the crest
Figure 2-9. End of rock revetment, taken from rocky outcrop; note exposed scarp on the right

Coastal Engineering Report for Lower Honoapiilani
Road Erosion at Kaopala Bay
Sea Engineering, Inc. 9
Figure 2-10. Start of revetment on Robinson property
2.2.1 Profile North
Profile North was taken through the rock revetment and is shown in Figure 2-11. The distance
from the makai edge of the road pavement to the top of the shoreline scarp at Profile North is 14
feet. The nominal land elevation between the revetment crest and the edge of the pavement is 17
feet above mean sea level (MSL). The revetment steepness is approximately 1 vertical to 0.5
horizontal (note: standard revetment design steepness is a maximum of 1 vertical to 1.5
horizontal).
Figure 2-11. Profile North through rock revetment

Coastal Engineering Report for Lower Honoapiilani
Road Erosion at Kaopala Bay
Sea Engineering, Inc. 10
2.2.2 Profile South
The shoreline along the southern portion of the project reach includes a steep red clay and silt
shoreline scarp fronted by a cobble beach. The clay embankment continues south from the rocky
outcrop described in the previous section, and eventually transitions to another rock revetment
fronting the Robinson property (see Figure 2-3).
South of the rock outcrop shown in Figure 2-5, the red clay and silt shoreline scarp approaches
within 10 ft of the makai edge of the road. A 24-inch concrete drainage pipe with a CRM
headwall protrude from the clay embankment, approximately 60 feet to the south of the rock
outcrop (Figure 2-12). The CRM is loosely grouted and appears to be constructed with stone
cobbles from the beach. Figure 2-13 is a photograph of the drainage outlet taken in the year
2000. It shows that a significant amount of erosion of the shoreline scarp has occurred since
that time.
South of the drainage pipe is a series of undermined and partially collapsed trees located between
the clay embankment and the makai edge of the pavement. The undermining has been caused by
erosion of the shoreline scarp. The unsupported trees fall seaward, causing movement of the root
ball and disturbance to the surrounding soil. One of the collapsing trees is causing the ground to
rupture within 6 inches of the makai edge of the pavement (Figure 2-14, see also Figure 1-1).
Others are undermined and near collapse (Figure 2-15).
Further south, the shoreline trends away from the road and is protected by another rock
revetment (Figure 2-16). The rock revetment fronts the privately owned Robinson Estate (TMK
4-3-015:036).
Profile South (Figure 2-17) is located between the 24-inch drainage pipe and the partially
collapsed tree. The distance between the makai edge of the road pavement and the top of the
shoreline scarp was measured to be 8 feet. The elevation of the road at the south profile is 15
feet above MSL.

Coastal Engineering Report for Lower Honoapiilani
Road Erosion at Kaopala Bay
Sea Engineering, Inc. 11
Figure 2-12. Drainage pipe and CRM wall; note rock substrate
Figure 2-13. 24-inch drainage outlet in 2000; significant shoreline erosion has occurred since that
time.

Coastal Engineering Report for Lower Honoapiilani
Road Erosion at Kaopala Bay
Sea Engineering, Inc. 12
Figure 2-14. Rupture of the soil adjacent to the roadway caused by the collapsing tree
Figure 2-15. Shoreline erosion scarp and cobble beach south of the 24-inch drainage outlet; note
collapsing tree and root ball

Coastal Engineering Report for Lower Honoapiilani
Road Erosion at Kaopala Bay
Sea Engineering, Inc. 13
Figure 2-16. Start of rock revetment on south end of the project reach
Figure 2-17. Profile South through silt/clay embankment
Coastal Engineering Report for Lower Honoapiilani
Road Erosion at Kaopala Bay
Sea Engineering, Inc. 14
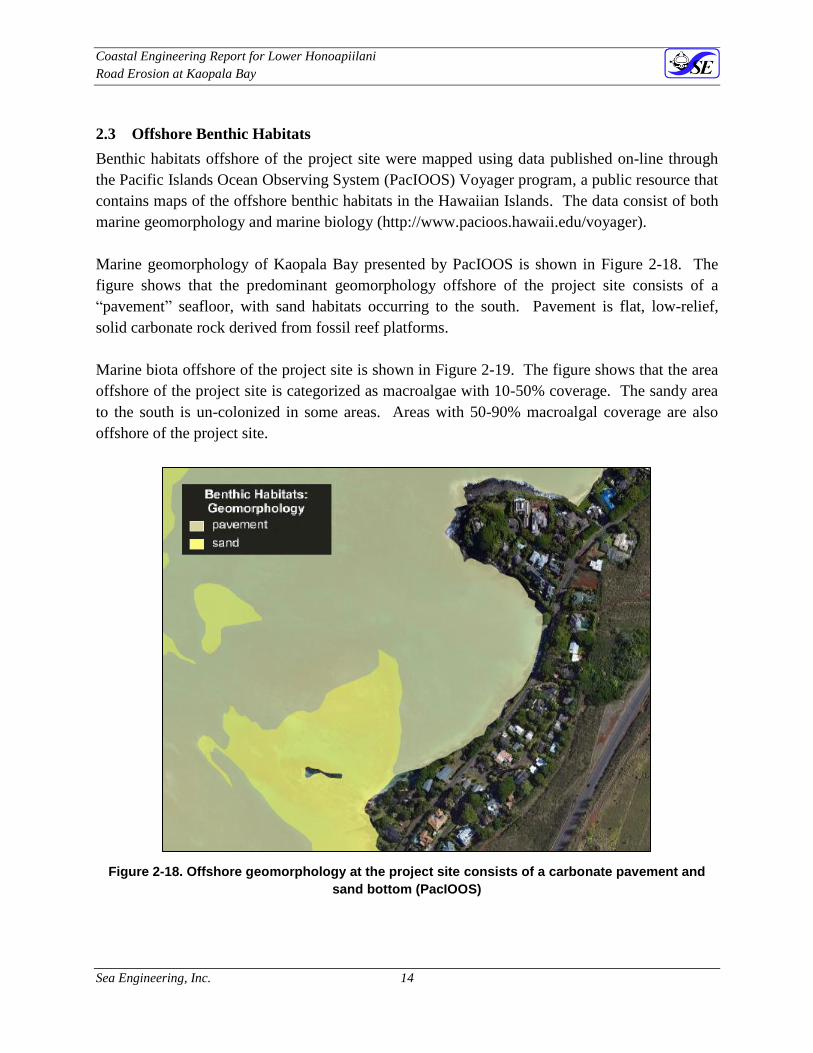
2.3 Offshore Benthic Habitats
Benthic habitats offshore of the project site were mapped using data published on-line through
the Pacific Islands Ocean Observing System (PacIOOS) Voyager program, a public resource that
contains maps of the offshore benthic habitats in the Hawaiian Islands. The data consist of both
marine geomorphology and marine biology (http://www.pacioos.hawaii.edu/voyager).
Marine geomorphology of Kaopala Bay presented by PacIOOS is shown in Figure 2-18. The
figure shows that the predominant geomorphology offshore of the project site consists of a
“pavement” seafloor, with sand habitats occurring to the south. Pavement is flat, low-relief,
solid carbonate rock derived from fossil reef platforms.
Marine biota offshore of the project site is shown in Figure 2-19. The figure shows that the area
offshore of the project site is categorized as macroalgae with 10-50% coverage. The sandy area
to the south is un-colonized in some areas. Areas with 50-90% macroalgal coverage are also
offshore of the project site.
Figure 2-18. Offshore geomorphology at the project site consists of a carbonate pavement and
sand bottom (PacIOOS)

Coastal Engineering Report for Lower Honoapiilani
Road Erosion at Kaopala Bay
Sea Engineering, Inc. 15
Figure 2-19. Offshore biota is primarily macroalgae (PacIOOS)
2.4 Historical Shoreline Analysis and Shoreline Setback
As part of a comprehensive shoreline mapping program, the University of Hawaii Coastal
Geology Group (UHCGG) conducted an historical aerial photographic analysis of Maui beaches
(UHCGG, 2003). The UHCGG used aerial photographs dating from 1949 to 1997 to compare
shorelines and calculate shoreline change rates. The photographs have been ortho-rectified and
geo-referenced, and the low water marks on the photographs digitized to provide a record of
long-term changes. In some areas, survey maps from 1912, known as “T-Sheets”, are also used
for reference. The photographs and maps are used to quantify coastal erosion based on changes
in the low water positions. This methodology captures erosion and accretion trends that include
fluctuations in beach width, as well as erosion of the shoreline scarp. The resulting erosion map
for the project area is shown in Figure 2-20.
The UHCGG data are used to calculate an Annual Erosion Hazard Rate (AEHR) based on
averaged movement of the shoreline reference feature (i.e., the low water position) relative to an
arbitrary baseline. The AEHR at Kaopala Bay is 2.4 feet per year, meaning that the digitized
historical shorelines showed a landward movement trend of 2.4 feet per year during the study
period. To the south of the project site, at Kalaeokaia Point, AEHR’s drop to less than 0.5 feet
per year. The high erosion rate towards the middle of the bay is due to the measured position of

Coastal Engineering Report for Lower Honoapiilani
Road Erosion at Kaopala Bay
Sea Engineering, Inc. 16
the 1912 shoreline, which may be a statistical and chronological outlier. The 1912 shoreline was
located nearly 100 feet seaward of the 1949 shoreline. Figure 2-20 shows the T-sheet drawing of
the project area, and illustrates the potential problems with trying to accurately scale the
shoreline position. Since 1949, the shoreline has experienced little landward movement.
Erosion trends since 1997 are hard to calculate from aerial images due to the presence of dense
vegetation between the road and the shoreline but it is likely that the present erosion rate is less
than 1 foot per year.
The AEHR calculated by the UHCGG is used by the County of Maui to determine the shoreline
setback line. Only minor construction activities are allowed in the shoreline setback area (the
area between the shoreline and the shoreline setback line) without a shoreline setback variance
(SSV).
Figure 2-20. Erosion Rate Map at Kaopala Bay (Univ. of Hawaii Coastal Geology Group)

Coastal Engineering Report for Lower Honoapiilani
Road Erosion at Kaopala Bay
Sea Engineering, Inc. 17
Figure 2-21. A Portion of the 1912 T-sheet showing the project area and potential for scaling
inaccuracies
A comparison of the top bank position for the area north of, and adjacent to, the 24-inch drainage
line, as surveyed in the year 2000 and during the recent site visit, indicates between 12 ft and 6 ft
of erosion over 18 years (see Figures 2-12 and 2-13). The erosion rates thus calculated, 0.33
ft/year and 0.7 ft/year, are probably a reasonable range for erosion rates on this shoreline.
Observations of erosion in other locations in West Maui show that the erosion is both seasonal
and episodic, with weather and climate playing a major role.
As noted in the introduction (Section 1), high water levels due to tide, wave setup, and other
phenomena, and wave climate –the combination of swell directions, wave height and frequency
of occurrence, are primary factors that cause erosion of the shoreline. The combined phenomena
will have a highly variable frequency of occurrence, so the erosion rate should not be expected to
be steady. In addition, observations show high lateral variability, with erosion hotspots
developing over limited distances along the shoreline.

Coastal Engineering Report for Lower Honoapiilani
Road Erosion at Kaopala Bay
Sea Engineering, Inc. 18
3. OCEANOGRAPHIC SETTING AND DESIGN PARAMETERS
Design of shore protection structures is based on knowledge of site specific environmental
parameters which affect the type, size, placement, and composition of a shore protection
strategy. Coastal engineering structures that protect life and property are generally designed for
a “worst case” wave condition such as occurs during a hurricane or large storm, or from a similar
extreme event with a low statistical probability of occurrence. A 50-year recurrence interval
wave event is typically used for coastal engineering design criteria.
Although deep water waves caused by severe storm conditions can be very large, wave heights in
shallow water are physically limited by the water depth. The physical phenomena of waves,
wind, and pressure reduction during storm conditions can cause an elevated water level that will
in turn allow larger than normal waves to reach the shoreline and attack shoreline structures.
These waves are termed depth-limited and serve as a basis for calculating the wave conditions
applicable to shoreline structure design.
The following discussion of oceanographic design parameters is based on existing available data
and used for concept-level design development.
3.1 Wind Climate
The prevailing winds throughout the year in Hawaii are the northeast tradewinds. Tradewind
frequency varies from more than 90% during the summer to only 50% in January, with an
overall annual frequency of 70%. Tradewinds are produced by the outflow of air from the North
Pacific High. The center of this high-pressure system is typically located well north and east of
the Hawaiian chain, but it moves to the north and south seasonally. In the summer months, the
center moves to the north, causing the tradewinds to be at their strongest from May through
September. In the winter, the center moves to the south, resulting in decreasing tradewind
frequency from October through April. During these months, the tradewinds continue to blow;
however, their average monthly frequency decreases to 50%. The blocking effect of the West
Maui Mountains decreases the influence of tradewinds in the Kahana area, and causes the winds
that occur to come from a more northerly direction, following land contours. Offshore, wind
speeds in the channels between Maui, Molokai, and Lanai can be significantly faster due to the
funneling effect caused by the land masses surrounding the Pailolo channel. The shoreline is
typically sheltered, with variable winds near the beach and a wind line offshore of Haukoe Point
during most tradewind conditions.
Wind patterns of a more transient nature increase during the winter months. Winds from extra-
tropical storms can be strong from almost any direction, depending on the strength and position
of the storm. The low-pressure systems associated with these storms typically track west to east

Coastal Engineering Report for Lower Honoapiilani
Road Erosion at Kaopala Bay
Sea Engineering, Inc. 19
across the North Pacific, north of the Hawaiian Islands. Kona winds generally come from a
southerly to southwesterly direction, and are sometimes associated with slow moving low
pressure systems known as “Kona lows” situated near the island chain. These storms are often
accompanied by heavy rains.
Figure 3-1 is a wind rose diagram for wind data recorded in 2014 at the Kapalua Airport, 1.5
miles south of Kaopala Bay. The wind rose indicates the frequency of occurrence based on wind
speed and direction, and shows the dominance of NE tradewind flow.
Figure 3-1. Wind rose for Kapalua Airport (Station PHJH)
3.1.1 Extreme Winds
The wind record at the Kapalua Airport is not sufficiently complete to calculate historical trends.
The Daniel K. Inouye International Airport on Oahu (formerly the Honolulu International
Airport) is a good proxy for estimating extreme wind that may occur at Kaopala Bay. An
extreme value distribution was applied to the 44 annual maximum 2-minute averaged wind speed
records to develop expected extreme wind speeds for various return periods ranging from 1 to
100 years. The extreme value wind speeds are presented in Table 3-2. The maximum 2-minute
averaged wind listed in Table 3-1 (46 mph) is equivalent to the 50-year wind speed from Table
3-2.

Coastal Engineering Report for Lower Honoapiilani
Road Erosion at Kaopala Bay
Sea Engineering, Inc. 20
Table 3-1is a list of the yearly maximum 2-minute averaged wind speeds at the airport for the 44-
year period from 1969 to 2012, ordered by wind speed. Some of the annual maxima shown are
associated with specific storm events. The highest value of 46 miles per hour in November of 1982
occurred during the passage of Hurricane Iwa. Other events include Hurricane Iniki in 1992 at 38
miles per hour, and several severe Kona storms with wind speeds up to 40 miles per hour.
An extreme value distribution was applied to the 44 annual maximum 2-minute averaged wind
speed records to develop expected extreme wind speeds for various return periods ranging from
1 to 100 years. The extreme value wind speeds are presented in Table 3-2. The maximum 2-
minute averaged wind listed in Table 3-1 (46 mph) is equivalent to the 50-year wind speed from
Table 3-2.
Table 3-1. Annual maximum 2-minute wind speeds at Daniel K. Inouye International Airport
Year Wind Speed
(mph) Year
Wind Speed
(mph) 1982 46 1972 33
1969 40 1973 33
1970 40 1993 33
2004 40 1999 33
2007 39 2010 33
2011 39 1997 32
1976 38 2003 32
1992 38 2005 32
1977 37 1994 31
2008 37 2006 31
1975 36 1981 30
2002 36 1985 30
1980 35 1986 30
1990 35 1989 30
2000 35 2012 30
2001 35 1987 29
2009 35 1988 29
1971 34 1984 28
1974 34 1991 28
1978 34 1995 28
1979 34 1996 28
1998 34 1983 23

Coastal Engineering Report for Lower Honoapiilani
Road Erosion at Kaopala Bay
Sea Engineering, Inc. 21
Table 3-2. Extreme value distribution periods for 2-minute averaged wind speeds at Daniel K.
Inouye International Airport (1969 to 2012)
Return Period
(years)
Wind Speed
(mph) 1 33.3
2 35.6
5 38.7
7 39.8
10 41.0
15 42.3
20 43.3
25 44.0
30 44.6
40 45.6
50 46.3
75 47.7
100 48.6
3.2 Currents and Circulation
Local currents in the Hawaiian Islands are generally driven by the semi-diurnal tides. Surface
currents can also be driven by the wind, and currents nearshore are predominately affected by the
presence of reefs and breaking waves. Storlazzi and Jaffe (2006) found that vigorous tradewind
conditions that prevail during the summer season caused relatively strong downwind currents.
During periods of calm, termed “relaxation events”, currents were tide-dominated and skewed to
the northeast. Large wave conditions prevalent during winter months induced offshore flows.
Nearshore wave-derived currents include rip currents and longshore currents that can be
dangerous to swimmers.
3.3 Wave Conditions
Surrounded by the Pacific Ocean, the Hawaiian Islands are subject to wave approach from all
directions. The wave climate in Hawaii is typically characterized by five general wave types.
These include northeast tradewind waves, southeast tradewind swell, southern swell, North
Pacific swell, and Kona wind waves (Figure 3-2). Tropical storms and hurricanes also generate
waves that can approach the islands from virtually any direction. Any and all of these wave
conditions may occur at the same time.
Kaopala Bay is at the center of the Maui Nui complex, which consists of the islands of Maui,
Lanai, Molokai, and Kahoolawe. These islands shelter Kaopala Bay and limit the directions of
direct wave exposure (Figure 3-3).

Coastal Engineering Report for Lower Honoapiilani
Road Erosion at Kaopala Bay
Sea Engineering, Inc. 22
Tradewind waves occur throughout the year and are the most persistent in April through
September when they usually dominate the local wave climate. They result from the strong and
steady tradewinds blowing from the northeast quadrant over long fetches of open ocean.
Tradewind deepwater waves are typically between 3 to 8 feet in height with periods of 5 to 10
seconds, depending upon the strength of the tradewinds and how far the fetch extends east of the
Hawaiian Islands. The direction and approach, like the tradewinds themselves, varies between
north-northeast and east-northeast and is centered on the northeast direction. Although Kaopala
Bay is sheltered from the direct approach of tradewind waves by the island of Maui, a portion of
the tradewind wave energy reaches the area by wrapping around the north end of the island and
contributes to a generally rough offshore sea state during tradewind conditions. The tradewind
waves may also wrap around West Maui from the south.
Waves can also be generated by the southeastern tradewinds that blow south of the equator and
can occur any time during the year. Southeast tradewind swell has small wave heights on the
order of 1 foot and typical periods less than 12 seconds. These waves are not typically used for
design criteria but may be important for sediment transport in some areas due to their frequency
of occurrence. However, southeast tradewind swell is not expected at Kaopala Bay because of
island shadowing.
Southern swell is generated by storms in the southern hemisphere and is most prevalent during
the months of April through September. Traveling distances of up to 5,000 miles, these waves
arrive with relatively low deepwater wave heights of 1 to 4 feet and long periods of 14 to 20
seconds. Depending on the positions and tracks of the southern hemisphere storms, southern
swell approaches from the southeast through southwest directions.
During the winter months in the northern hemisphere, strong storms are frequent in the North
Pacific in the mid-latitudes and near the Aleutian Islands. These storms generate large North
Pacific swells that range in direction from west-northwest to northeast and arrive at the northern
Hawaiian shores with little attenuation of wave energy. Deepwater wave heights often reach 10
feet and in extreme cases can reach over 20 feet. Wave periods vary between 12 and 20 seconds,
depending on the location of the storm. The island of Molokai shelters Kaopala Bay from the
direct impact of northwest swell. However, swells with a more northerly direction can produce
significant wave energy at Kaopala Bay, creating large shorebreak and strong longshore currents.
Kona storm waves are generated by mid-latitude low-pressure system and occur at random
intervals throughout the year, with higher frequency during the winter months. They approach
from the south through west directions. Some winter seasons have several Kona storms; others
have none. Kona storm waves typically have periods ranging from 6 to 10 seconds; wave
heights are dependent upon the storm intensity, but deepwater heights can exceed 15 feet.

Coastal Engineering Report for Lower Honoapiilani
Road Erosion at Kaopala Bay
Sea Engineering, Inc. 23
Figure 3-2. Common wave types and approach directions in Hawaii
Figure 3-3. Wave exposure at Kaopala Bay
3.3.1 Deepwater Wave Heights
Historical deepwater wave data were obtained using offshore wave hindcasts. Wave hindcasting
is a tool used to calculate past wave events based on weather models and historical data. With

Coastal Engineering Report for Lower Honoapiilani
Road Erosion at Kaopala Bay
Sea Engineering, Inc. 24
proper inputs, wave hindcast models can calculate historical wave climates anywhere in the
world. Hindcast model outputs are often recorded for a single location, known as a virtual buoy.
WaveWatch III (WWIII) is a numerical wave model used to forecast and hindcast waves.
Hindcast wind data for a 29-year period (1979-2008) are available at a wide range of locations
through the National Oceanographic and Atmospheric Administration (NOAA/NCEP). For this
assessment, hindcast data were obtained from NOAA virtual buoy 81115, located 60 miles to the
southwest of Kaopala Bay, and virtual buoy 81102, located 62 miles to the northeast of Kaopala
Bay (Figure 3-4). Wave height and period roses for NOAA virtual buoy 81102 and 81115 are
shown in Figure 3-5 and Figure 3-6, respectively.
A Weibull extreme value distribution was applied to the hindcast data in order to determine
recurrence interval wave heights for each directional sector. Table 3-3 shows wave heights by
return period for both North Pacific and South Pacific Swell. The 50-year wave height is a
recurrence value that is expected at the site approximately once every 50 years, or a 2% chance
of occurring during any given year. This wave height is frequently used as the design wave
height for shore protection structures. The 50-year North Pacific swell has a significant wave
height of 32.7 feet, a peak period of 18 seconds, and a direction from the NW. The 50-year
South Pacific swell has a deepwater wave height of 7.2 feet, a peak period of 18 seconds, and a
direction from the SSW.
Figure 3-4. Virtual buoy locations

Coastal Engineering Report for Lower Honoapiilani
Road Erosion at Kaopala Bay
Sea Engineering, Inc. 25
a) b)
Figure 3-5. a) Wave height rose and b) wave period rose for NOAA Hindcast Station 81102
a) b)
Figure 3-6. a) Wave height rose and b) wave period rose for NOAA Hindcast Station 81115

Coastal Engineering Report for Lower Honoapiilani
Road Erosion at Kaopala Bay
Sea Engineering, Inc. 26
Table 3-3. Deepwater wave heights by return period for North Pacific and South Pacific Swell
Return Period
(years)
North Pacific Swell
Hs (ft)
(from WIS 81115)
Southern Swell
Hs (ft)
(from WIS 81102)
Typical Seasonal High 15.9 3.4
1 21.3 4.6
2 23.3 5.1
5 26.0 5.7
10 28.0 6.2
25 30.7 6.8
50 32.7 7.2
3.3.2 Nearshore Wave Transformation
As deepwater waves propagate toward shore, they begin to encounter and be transformed by the
ocean bottom. In shallow water, the wave speed becomes related to the water depth. As waves
slow with decreasing depth, the process of wave shoaling steepens the wave and increases the
wave height. Wave breaking occurs when the wave profile shape becomes too steep to be
maintained. This typically occurs when the ratio of wave height to water depth is about 0.78, and
is a mechanism for dissipating the wave energy. Wave energy is also dissipated due to bottom
friction. The phenomenon of wave refraction is caused by differential wave speed along a wave
crest as the wave passes over varying bottom contours, and will cause wave crests to converge or
diverge and may locally increase or decrease wave heights. Not strictly a shallow water
phenomenon, wave diffraction is the lateral transmission of wave energy along the wave crest,
and will cause the spreading of waves in a shadow zone, such as occurs behind a breakwater or
other barrier.
Output from a SWAN (Simulating Waves Nearshore) numerical wave model for the 50-year
North Pacific swell event is shown in Figure 3-7 and illustrates the transformation that a wave
undergoes as it approaches West Maui. Wave models indicate that breaking wave heights
offshore of West Maui for both North Pacific and southern swell is approximately 60% of the
deepwater wave heights. This transmission coefficient (Kt) is the combined effects of wave
transformation phenomena, including wave shoaling, wave refraction, and wave diffraction. A
summary showing the breaking wave height parameters offshore of Kaopala Bay for the 50-year
North Pacific and southern swell events is shown in Table 3-4.

Coastal Engineering Report for Lower Honoapiilani
Road Erosion at Kaopala Bay
Sea Engineering, Inc. 27
Figure 3-7. 50-year north swell transformation around Oahu and Maui Nui
Table 3-4. 50-year wave parameters
50-year Event North Pacific Swell Southern Swell
Deepwater Wave
Height (ft) 32.7 7.2
Direction 315 190
Period (sec) 18 18
Transmission
Coefficient (Kt) 0.6 0.6
Breaking Wave
Height at Kaopala (ft) 19.3 4.4

Coastal Engineering Report for Lower Honoapiilani
Road Erosion at Kaopala Bay
Sea Engineering, Inc. 28
3.3.3 Hurricanes and Tropical Cyclones
Tropical cyclones originate over warm ocean waters, and they are considered hurricane strength
when they generate sustained wind speeds over 64 knots (74 mph). Hurricanes that affect the
Hawaiian Islands form near the equator in the region between Mexico and the central North
Pacific. They typically track toward the west or northwest. These storms often pass south of the
Hawaiian Islands, though some have a northward curvature passing near the islands.
Only three hurricanes have passed through the Hawaiian Islands in the past 25 years: Hurricanes
Iwa in 1982 and Iniki in 1992, both passing near or over the island of Kauai as well as Hurricane
Iselle in 2014 passing over the island of Hawaii. These storms caused high surf and wave
damage on multiple shores of the islands. High wave conditions due to hurricanes and tropical
storms passing near the islands is not unusual during the Central Pacific hurricane season (June 1
through November 30).
Severe tropical storms and hurricanes have the potential to generate extremely large waves,
which could potentially damage the shoreline area at the project site. Although not frequent or
even likely events, they may be considered for project design conditions, particularly with regard
to shoreline structures.
3.4 Tide and Water Level Rise
The total water depth at a particular location is composed of the depth below the sea level datum,
plus factors that add to the still water level (SWL) such as the astronomical tide, mesoscale
eddies, wave setup, storm surge (pressure setup and wind setup), and potential sea level change
over the life of the project. The sea level datum used for navigation related projects (such as
harbor design) is the mean lower low water (MLLW) level, which represents the average
elevation of the lowest daily tides. Most topographic work by land surveyors use the mean sea
level (MSL) datum, which is an average of hourly tide levels.
3.4.1 Tides
Hawaii tides are semi-diurnal with pronounced diurnal inequalities (i.e., two tidal cycles each
day with the range of high and low water levels being unequal). Tidal predictions and historical
extreme water levels are given by the Center for Operational Oceanographic Products and
Services (COOPS), National Ocean Service (NOS), NOAA. The nearest tide station to Kaopala
Bay is at Kahului Harbor, 15 miles to the southeast of Kaopala Bay on the north side of Maui.
The water level data from this station is shown in Table 3-5 and is based on the 1983-2001 tidal
epoch.

Coastal Engineering Report for Lower Honoapiilani
Road Erosion at Kaopala Bay
Sea Engineering, Inc. 29
There is no tide gauge at Lahaina Harbor, located 8 miles to the south of Kaopala Bay; however,
NOAA provides time offsets and height multipliers to predict tides at Lahaina Harbor. High and
low tides at Lahaina Harbor occur after high and low tide at Kahului Harbor. The time offset at
Lahaina Harbor relative to Kahului Harbor is +78 minutes for high tides and +61 minutes for low
tides. The height multiplier is 0.89 times the Kahului high tide (MLLW datum) and 0.81 times
the Kahului low tide (MLLW datum).
Table 3-5. Water level data for Kahului Harbor (NOAA)
Datum Elevation
(ft MLLW)
Elevation
(ft MSL)
Mean Higher High Water +2.3 1.1
Mean High Water +1.9 0.8
Mean Sea Level +1.1 0.0
Mean Low Water +0.3 -0.8
Mean Lower Low Water 0.0 -1.1
3.4.2 Mesoscale Eddies and Other Oceanographic Phenomena
Hawaii is subject to periodic extreme tide levels due to large oceanic eddies and other
oceanographic phenomena that have recently been recognized and that sometimes propagate
through the islands. Mesoscale eddies produce tide levels that can be up to 0.5 feet higher than
normal for periods up to several weeks (Firing and Merrifield, 2004).
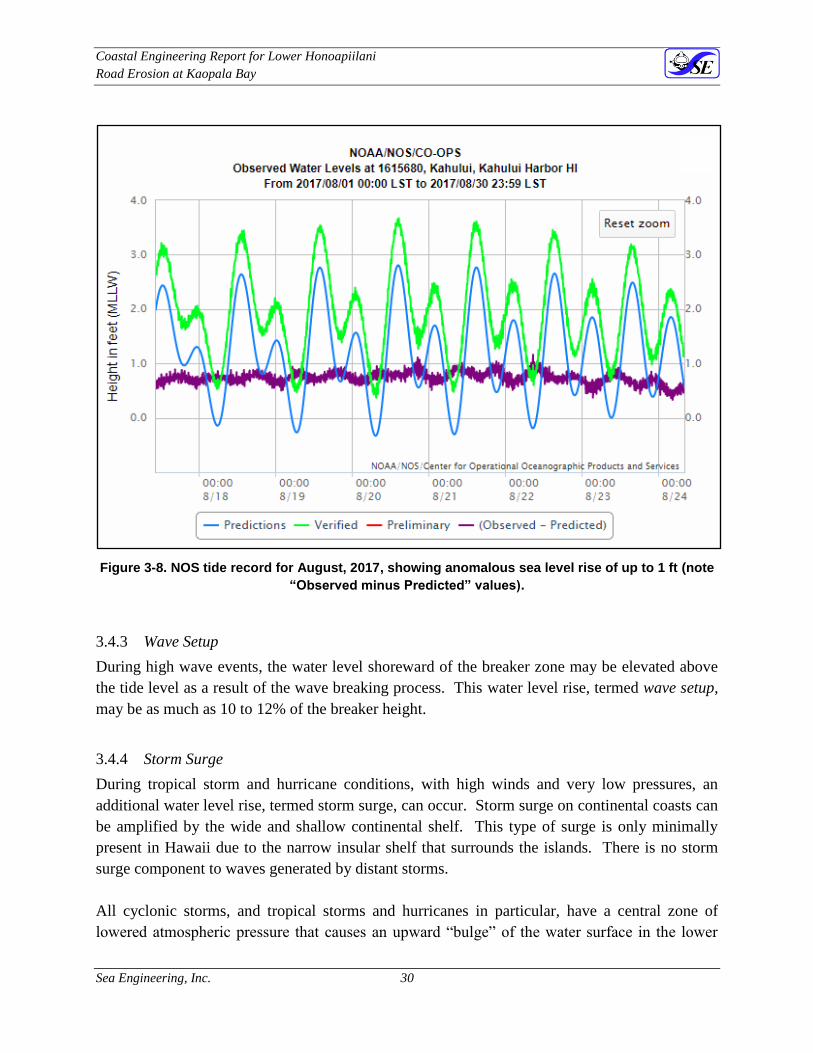
A longer term sea level anomaly occurred from 2016 to 2018 across all the Hawaiian Islands,
with tide levels regularly measured to be approximately 0.3 to 0.9 ft above predicted levels. This
phenomenon is thought to be related to the 2015-2016 ENSO event and appeared to dissipate in
early 2018. Figure 3-8 shows predicted versus measured tides at the Kahului tide station in
August 2017.
Coastal Engineering Report for Lower Honoapiilani
Road Erosion at Kaopala Bay
Sea Engineering, Inc. 30
Figure 3-8. NOS tide record for August, 2017, showing anomalous sea level rise of up to 1 ft (note
“Observed minus Predicted” values).
3.4.3 Wave Setup
During high wave events, the water level shoreward of the breaker zone may be elevated above
the tide level as a result of the wave breaking process. This water level rise, termed wave setup,
may be as much as 10 to 12% of the breaker height.
3.4.4 Storm Surge
During tropical storm and hurricane conditions, with high winds and very low pressures, an
additional water level rise, termed storm surge, can occur. Storm surge on continental coasts can
be amplified by the wide and shallow continental shelf. This type of surge is only minimally
present in Hawaii due to the narrow insular shelf that surrounds the islands. There is no storm
surge component to waves generated by distant storms.
All cyclonic storms, and tropical storms and hurricanes in particular, have a central zone of
lowered atmospheric pressure that causes an upward “bulge” of the water surface in the lower

Coastal Engineering Report for Lower Honoapiilani
Road Erosion at Kaopala Bay
Sea Engineering, Inc. 31
pressure areas. The water level rise due to reduction of atmospheric pressure associated with a
storm is determined by the following equation:
Sp = 1.14 ΔP
The surge (Sp) is measured in feet, and the pressure units are inches of mercury. A 12-year
record of annual minimum pressure recorded at Honolulu Airport is shown in Table 3-6, along
with the estimated pressure related water level rise. The pressure related water level rise
generally varied between 0.2 and 0.5 feet during this time period. The minimum pressure
recorded in Honolulu during the passage of Hurricane Iniki was not unusually low; however, this
is not surprising as Iniki was a relatively small storm in terms of diameter, and the storm center
passed some 80 miles distant.
Table 3-6. Annual minimum atmospheric pressure at Honolulu Airport and Estimated Pressure
related water level rise
Year Annual Minimum
Pressure (in. Hg)
Pressure Setup
(feet)
1992 (Iniki) 29.52 0.5
1996 29.66 0.3
1997 29.73 0.2
1998 29.78 0.2
1999 29.86 0.1
2000 29.79 0.1
2001 29.71 0.2
2002 29.83 0.1
2003 29.76 0.2
2004 29.51 0.5
2005 29.73 0.2
2006 29.75 0.2
3.4.5 Sea-Level Rise
The effects of climate change have caused a world-wide rise in sea level. The present rate of
global mean sea-level rise (SLR) appears to be accelerating compared to the mean of the 20th
Century (Figure 3-9), but the rate of rise is locally variable (Fletcher et al, 2010). Factors
contributing to SLR include decreased global ice volume and thermal expansion of the ocean due
to warming. Recent climate research by the Intergovernmental Panel on Climate Change (IPCC)
predicts continued or accelerated global warming for the 21st Century and possibly beyond,
which would cause a continued or accelerated rise in global mean sea-level (USACE, 2011).

Coastal Engineering Report for Lower Honoapiilani
Road Erosion at Kaopala Bay
Sea Engineering, Inc. 32
The present estimated rate of global mean sea level change (SLC) is + .13 in/yr (+3.4 mm/yr)
(NASA, 2017). It is estimated that global SLC may reach +3.3 feet (+1 meter) by the end of this
century, and the National Oceanic and Atmospheric Administration estimates possible SLR as
high as +10.8 feet (+3.3m). Sea level is highly variable, and there is some indication that
Hawaii’s location in the middle of the Pacific Ocean may result in a somewhat higher SLC than
high latitude regions due to reduced gravitation around melting polar ice caps (Sweet et al,
2017). SLC will have a significant impact on the shorelines and low-lying coastal areas.
Sea level trends and prediction scenarios are calculated at tide stations where sea level
measurements are available. The nearest NOS tide station to the project area is at Kahului
Harbor. The sea level trend there for the period of 1947 to present is shown in Figure 3-10
(NOAA, 2017). The rate of sea level change (RSLC) is shown in the figure as being
approximately linear, increasing at a rate of 0.08 in/yr ± 0.016 in (+2.04 ± 0.42 mm/yr) based on
monthly data for the period 1947 to 2015. Figure 3-10 also shows inter-annual anomalies of up
to approximately 0.5 feet (15 cm).
Estimates for sea-level rise for Kaopala Bay using five scenarios provided by the USACE (2014)
and NOAA (2017) for Kahului Harbor are shown in Figure 3-11 and Table 3-7. While the
projections are based on the most current scientific models and measurements, discretion is
necessary in selecting the appropriate scenario. Selecting the appropriate sea level change
projection is a function of many parameters, including topography, coastal setting, criticality of
infrastructure, potential for resilience, budget, and function. As an example, it may be best to
design a power plant or hospital based on the High or Extreme rate, since those are considered
critical infrastructure that would be expensive to modify and damage could have a long, far-
reaching impact. On the other hand, a revetment along a coastal road or park might be designed
based on a lesser rate, and the revetment could be adaptive and reconstructed as sea level rises,
or the road could be relocated as part of future mitigation plans.
The NOAA intermediate rate is considered a reasonable prediction for future sea level at
Kaopala Bay. The calculations predict an increase of 2.3 feet by 2070. For comparison, the low
and high estimates using the same procedure are 1.0 feet and 5.5 feet, respectively.

Coastal Engineering Report for Lower Honoapiilani
Road Erosion at Kaopala Bay
Sea Engineering, Inc. 33
Figure 3-9. Global Sea Level Trends (State of Hawaii Climate Adaptation Portal)
Figure 3-10. Mean sea level trend, Kahului Harbor, 1947 to 2015 (NOAA, 2017)

Coastal Engineering Report for Lower Honoapiilani
Road Erosion at Kaopala Bay
Sea Engineering, Inc. 34
Figure 3-11. Scenarios for projected Relative Sea-Level Rise, Kahului Harbor (USACE, 2014)
Table 3-7. Projected Relative Sea-Level Rise, Kahului Harbor (NOAA, 2017) (values in feet)
Year NOAA Low NOAA Int-
Low
NOAA Int NOAA Int-
High
NOAA
High
NOAA
Extreme
2000 0.00 0.00 0.00 0.00 0.00 0.00
2010 0.10 0.13 0.20 0.26 0.30 0.30
2020 0.26 0.33 0.43 0.52 0.62 0.69
2030 0.39 0.49 0.69 0.89 1.08 1.21
2040 0.52 0.69 0.98 1.35 1.74 1.94
2050 0.72 0.92 1.41 1.97 2.56 2.95
2060 0.89 1.12 1.84 2.62 3.51 4.13
2070 1.02 1.31 2.33 3.44 4.63 5.51
2080 1.15 1.51 2.85 4.36 5.94 7.09
2090 1.28 1.71 3.41 5.28 7.22 8.79
2100 1.44 1.90 4.07 6.50 9.06 11.02

Coastal Engineering Report for Lower Honoapiilani
Road Erosion at Kaopala Bay
Sea Engineering, Inc. 35
3.4.6 Estimating the Effect of Sea-Level Rise on the Shoreline
The recently released Hawaii Sea Level Rise Vulnerability and Adaptation Report (Hawaii
Climate Change Mitigation and Adaptation Commission, 2017) uses a combination of historical
shoreline change trends and the RD-A model of shoreline profile change (Davidson-Arnott,
2005) to estimate shoreline recession due to sea level rise along Hawaii’s beaches. The results
have also been published in the PACIOOS Voyager Sea Level Rise Viewer. With 2.0 feet of sea
level rise (nearly equivalent to the NOAA Intermediate value for 2070), the report estimates that
the shoreline at Kaopala Bay would be located mauka of the current alignment of Lower
Honoapiilani Road for approximately 900 feet (Figure 3-12).
Figure 3-12. Coastal erosion at Kaopala Bay (PacIOOS Hawaii Sea Level Rise Viewer)
Despite being presented on the PACIOOS Voyager site, the model results shown in Figure 3-12
should be used with caution. The RD-A model was developed for sand beaches with well

Coastal Engineering Report for Lower Honoapiilani
Road Erosion at Kaopala Bay
Sea Engineering, Inc. 36
developed dune systems as found on the east coast of the United States. Its application for
Hawaiian beach systems is constrained by assumptions that reduce its usefulness (see Anderson
et al, 2015). In fact, the cobble beach and clay and silt shoreline scarp existing at the project site
is not a coastal morphology that adapts well to existing shoreline change models.
3.4.7 Combined Stillwater Level
The various water level rise phenomena are additive and may occur at a given time. The total
still water level, therefore, is a linear combination of:
Astronomical tide and other oceanographic phenomena (Sa),
Sea level rise due to atmospheric pressure reduction (Sp),
Wind tide caused by wind stress component perpendicular to the coastline (Sx)
and parallel to the coastline (Sy),
Wave set-up on the beach as a result of the breaking waves (Sw),
Sea level rise (SSLR),
or,
S = Sa + Sp + Sx + Sy + Sw + SSLR
In order to predict a maximum potential water level at Kaopala Bay during a reasonable project
life (i.e. 50 years), best estimates of the above components must be obtained. An astronomical
tide of +2.3 feet (Mean Higher High Water at Kahului Harbor) is considered appropriate for this
discussion due to the frequency of occurrence of this tide level and the duration of distant-
generated swells. The 2070 NOAA Intermediate sea-level rise estimate is +2.3 feet. Mesoscale
eddies and other oceanographic phenomena frequently contribute +0.5 feet to the water level,
based on existing data. This elevation of regional sea level change has been witnessed several
times in the previous decade, and is suitable for planning purposes. The component of the still
water level rise due to astronomical tides and other oceanographic phenomena is thus +5.1 feet.
The combination of pressure setup (Sp) and wind setup (Sx and Sy) is defined as storm surge.
During non-storm conditions, there is no wind or pressure setup component of still water level
rise.
In Hawaii, wave setup (Sw) can be the largest contributor to the still water level rise for design
wave events. For this discussion, wave setup was assumed to be 10% of the nearshore wave
height 50-year return period wave height. Based on an initial deepwater wave height of 32.7 feet
for a 50-year North Pacific swell, and a resulting breaking wave height of 19.3 ft, the wave setup
is calculated to be approximately +1.9 feet at Kaopala Bay.

Coastal Engineering Report for Lower Honoapiilani
Road Erosion at Kaopala Bay
Sea Engineering, Inc. 37
Nearshore waves are typically depth limited, meaning that the amount of wave energy that
reaches the shoreline is directly tied to the water depth offshore of the shoreline. As a result,
higher water levels generally result in increased impacts on the shoreline. As wave energy
increases with the square of the wave height, even a small water level increase can dramatically
change the coastal processes at a particular shoreline.
Table 3-8. Non-storm potential still water level rise at the site for a 50-year return period north
swell
Parameter Water Level Rise
(ft MLLW)
Tide (Kahului MHHW) +1.1
Sea-Level Rise
(2070 NOAA Int High)
+2.3
Other Oceanographic
Phenomena
+0.5
Storm Surge +0.0
Wave Setup +1.9
Total Stillwater Level Rise +5.8
3.4.8 Wave Height at the Shoreline
Because waves break in water depths proportional to their height, waves in shallow water are
necessarily limited in size. Wave heights are generally highest at the offshore breaking point and
gradually diminish in size as the bottom depths decrease. Attenuation of wave height in the on-
shore direction is due to the combination of wave breaking and friction. Large storm waves will
initially break offshore in deep water, then reform and continue shoreward as progressively
smaller waves, with wave breaking occurring several times before reaching the shore. The wave
height at the shoreline is therefore dependant on the water level at the shoreline. To determine
the actual design wave height at the shoreline, the design stillwater level must be considered.
As waves shoal and their forward speed is reduced, they tend to become higher and steeper.
Waves break when the waveform becomes too steep to be maintained. This occurs at ratios of
water depth to wave height (d/Hb) that generally range from 0.5 to 1.4, and depends on wave
steepness and bottom slope. An accepted value, based upon solitary wave theory, is a ratio of
0.78. In effect, wave heights over a reef flat are depth-limited, meaning there is a maximum
wave height that can occur for a given depth of water. The bottom conditions at the project site
are highly variable, with numerous patch reefs, holes, and sand bars. Based on offshore profiles,
an average MSL water depth of 3 ft is used for calculation of nearshore design wave heights, and
a d/Hb ratio of 0.78 is used for breaking wave criteria.

Coastal Engineering Report for Lower Honoapiilani
Road Erosion at Kaopala Bay
Sea Engineering, Inc. 38
Table 3-9 shows the calculation of the design water depth and the design wave height given by a
d/Hb ratio of 0.78. Using this ratio the nearshore design wave height for the 50-year North
Pacific swell event would be 6.9 feet.
Design wave height is often the most important parameter for the design of a shore protection
structure. The wave height determines wave forces on structure, which determines various
features of the project, including structure height and armor unit size. The analysis used in this
report is appropriate for development of concept design. For detailed final design, a more
rigorous design wave analysis is recommended. This would include, for example, numerical
modeling of wave transformations across the reef.
Table 3-9. 50-year design water depth and wave height
Parameter Design Conditions (ft)
Nominal Water Depth (MSL Datum) 3.0
Total Stillwater Level Rise 5.8
Design Water Depth 8.8
Design Wave Height 6.9
3.5 Tsunami
Tsunami are sea waves that result from large-scale seafloor displacements. They are most
commonly caused by an earthquake of magnitude 7.0 or greater adjacent to or under the ocean.
If the earthquake involves a large segment of land that displaces a large volume of water, the
water will travel outwards in a series of waves, each of which extends from the ocean surface to
the sea floor where the earthquake originated. Tsunami waves may only be a foot or so in height
in mid-ocean, but they can have wave lengths of hundreds of miles and travel at 500 miles per
hour. As they approach shore, they interact with the shoaling seafloor by slowing in speed and
increasing in height. Tsunami waves can both push inland and recede at considerable speed.
The recession often causes as much damage as the original wave front itself.
Most tsunamis in Hawaii originate from the tectonically active areas located around the Pacific
Rim (e.g., Alaska, Chile, Japan). Waves originating with earthquakes in these areas take hours
to reach Hawaii, and the network of sensors that is part of the Pacific tsunami warning system
can give Hawaii several hours advance warning of tsunami from these locations. Less
commonly, tsunamis originate from seismic activity in the Hawaiian Islands, and there is much
less advance warning for these. The 1975 Halape earthquake (magnitude 7.2) produced a wave
that reached Oahu in less than a half hour, for example.

Coastal Engineering Report for Lower Honoapiilani
Road Erosion at Kaopala Bay
Sea Engineering, Inc. 39
Walker (2013) reports three historical tsunamis with runup data at Kaopala Bay. The 1946
tsunami had a runup elevation of 24 feet, the 1957 tsunami had a runup elevation of 9 feet, and
the 1960 tsunami had a runup elevation of 10 feet. Fletcher et al (2002) classifies the area as a
“High” tsunami hazard area.
Tsunami evacuation maps are available for all islands in Hawaii and are based on computer
modeling of significant tsunami generating earthquakes that might occur around the Pacific Rim.
The maps are widely regarded as a worst case scenario. Figure 3-13 shows the tsunami
evacuation map for Kaopala Bay. The evacuation zone extends to 550 feet inland to
Honoapiilani Highway. The extreme tsunami evacuation zone extends 750 feet inland.
Figure 3-13. Tsunami evacuation map, Kaopala Bay
Planning
Area No. 1

Coastal Engineering Report for Lower Honoapiilani
Road Erosion at Kaopala Bay
Sea Engineering, Inc. 40
3.6 Flood Insurance Rating
The National Flood Insurance Program, administered by the Federal Emergency Management
Agency (FEMA), produces maps identifying flood hazards and risks. Figure 3-14 shows the
Flood Hazard Assessment Report for the project site.
The map indicates that coastal area fronting Lower Honoapiilani Road at Kaopala Bay is rated
zone VE with a base flood elevation of 17 feet MSL. Zone VE, the Coastal High Hazard Area, is
the flood insurance rate zone that corresponds to coastal floodplains that have a 1-percent annual
chance of additional hazards associated with storm waves. Portions of Lower Honoapiilani Road
on the north and south ends of Kaopala Bay fall in zone AE, which is the 100-year floodplain of
the Kaopala Stream.
Figure 3-14. Flood Insurance Rate Map for Kaopala Bay (Map No. 1500030264F)

Coastal Engineering Report for Lower Honoapiilani
Road Erosion at Kaopala Bay
Sea Engineering, Inc. 41
3.7 Coastal Processes Discussion
The Kaopala Bay shoreline is eroding and there is no indication that it will stabilize in the future.
Aerial images dating back to 1949 indicate that the southern portion of the bay has not held a
sand beach in recent history. As is common along many Maui shorelines, there is a clear
offshore beach rock slab that represents a beach location during a previous time, but it is nearly
500 feet offshore of the present day shoreline location.
3.7.1 West Maui Erosion event of 2015 – 2018
Water level and wave climate are primary forcing conditions for beach and shoreline changes.
As noted in Section 3.4.8, nearshore wave height will increase with higher tides and other water
level changes, such as wave setup, mesoscale eddies, and pressure effects. Higher wave heights
mean higher wave energy impacts on the beach, and it must adapt accordingly. Adaptation
examples may include changes in grain size toward a coarser distribution, beach profile
adjustment toward higher berm elevations, and higher rates of sand transport. For coastal areas
that experience seasonal beach loss, additional wave energy may result in temporary beach loss
for a higher percentage of time. Higher wave energy input may also result in higher rates of sand
transport in both the cross-shore and longshore directions.
As discussed in Section 3.3, the wave climate in West Maui is highly seasonal, dominated by
waves from the north in the winter, and waves from the south in the summer. Waves approach
the coastline at high angles of incidence, resulting in strong longshore sand transport in
seasonally opposing directions. If the winter and summer wave conditions are more or less
balanced, the movement of sand in one direction is compensated by movement in the opposite
direction six months later (Eversole & Fletcher, 2003). Strong winter or summer wave seasons
can result in complete depletion of beach sand at the end of the beach cell, with the resultant
exposure and erosion of the shoreline scarp. The erosion can be compounded if the seasonal
wave conditions are not balanced, and beach restoration from the opposing wave direction is not
accomplished.
The El Nino winter of 2015-2016 was characterized by numerous large wave events. In
particular, the spring of 2016 had sustained wave events from the north that were in the exposure
window of the Pailolo Channel (see Figure 3-3). That time period coincided with numerous
shoreline erosion problems in West Maui. The winter of 2016-2017, while not an El Nino event,
was also characterized by a wave climate with sustained swell from the north quadrant.
Conversely, the summers of 2016 and 2017 were notable for the paucity of southern swell
events. The combined effect of strong winter north swell conditions with a lack of balance from
weak summer wave conditions, and the temporary sea level rise effects discussed in Section
3.4.2 have seriously degraded many beaches in West Maui. Under the influence of more or less

Coastal Engineering Report for Lower Honoapiilani
Road Erosion at Kaopala Bay
Sea Engineering, Inc. 42
one-way transport from winter conditions, sand has moved offshore or around cell boundaries
and left many beaches in a depleted state. The loss of sand, coupled with high water conditions,
enables waves to attack and erode the shoreline.
The beach at the project site is primarily composed of dense rock cobbles, and is therefore a high
energy beach that is not likely to be easily transported. However, elevated water levels have
enabled wave action to attack the vulnerable silt and clay shoreline scarp, causing recession and
the damage. Although the 2016-2018 sea level anomaly appears to be dissipating at the present
time, future sea level rise due to climate change, as well as high tides, wave set-up, and pressure
effects during storms, will likely cause continued erosion of the shoreline scarp and threaten the
roadway. As mentioned in Section 2.4, the erosion is not necessarily steady in time or space, but
can occur during discrete seasonal and climate related wave events, as well as at localized
erosion zones (“hot spots”).

Coastal Engineering Report for Lower Honoapiilani
Road Erosion at Kaopala Bay
Sea Engineering, Inc. 43
4. SHORE PROTECTION ALTERNATIVES
4.1 Vulnerability to Coastal Hazards
Lower Honoapiilani Road at Kaopala Bay has an immediate need for remediation along an
approximate 100-foot length of road that could otherwise result in the loss of the makai lane.
Future erosion events will only increase the vulnerability of the road to erosion related damage.
While the present erosion at Kaopala Bay and much of the West Maui coastline is probably due
to a combination of events (El Nino winter waves, sustained swell events from the north,
anomalous high sea level), future sea level rise will bring additional erosive conditions that will
strain coastal infrastructure.
The makai side of the roadway is fronted by a vertical erosion scarp; vegetation on and above the
scarp is undermined in some locations. Failure of the scarp or collapse of the vegetation could
cause portions of the road to become undermined and potentially fail. Events that could trigger a
failure of the scarp could be a large north swell event or a Kona storm in combination with high
water levels. The roadway at Kaopala Bay has a long term vulnerability along a 900-foot length
of road that could result in the eventual loss of both lanes.
4.2 Shore Protection Alternatives
Loss of Lower Honoapiilani Road at Kaopala Bay would affect traffic flow to the residential
community around Kaopala Bay as well as infrastructure buried in the roadway. This
infrastructure includes storm drain lines, potable water supply, and sewer lines. Shore protection
options include:
“No action” in the form of managed retreat;
Temporary emergency protection (geotextile sand bags);
Seawall
Rock revetment
Beach nourishment
4.2.1 No Action (Managed Retreat)
Taking “no action” to reduce erosion of the shoreline at Kaopala Bay will likely result in
additional recession of the shoreline and undermining and eventual loss of use of Lower
Honoapiilani Road. Unfortunately, the existing information concerning erosion rates along this
reach is questionable. The AEHR calculated by the UHCGG (2.4 ft/yr) is heavily influenced by
reliance on 1912 T-Sheet information (see Section 2.4), and projected erosion positions from sea
level rise modeling are likely to be not applicable because the modeling used a dissimilar coastal
morphology (see Section 3.4.5). The erosion rate based on topographic surveys in 2000 and for
this report (2018) indicate an erosion rate between 0.3 and 0.7 ft per year.

Coastal Engineering Report for Lower Honoapiilani
Road Erosion at Kaopala Bay
Sea Engineering, Inc. 44
Observations of erosion at nearby Kahana Bay have shown that the erosion of a silt-clay
shoreline scarp can happen very quickly under adverse conditions. Those conditions may
include seasonal deflation of the sand beach and exposure of the shoreline scarp, high or
sustained wave conditions, and high water levels due to tides and other oceanographic
phenomena. The erosion can occur in localized hot spots, as well as along long reaches. The
presence of falling trees along the shoreline scarp can complicate the erosion by rupture of the
soil around the perimeter of the root ball (see Figures 1-1 and 2-14).
While the actual rate of shoreline erosion remains in question, sea level rise projections make
continued erosion a certainty. With undermining of a portion of the road imminent, future
damage is inevitable. Roadway damage will not only directly affect transportation, but may
damage buried infrastructure, including water and sewer lines.
Coping with the No Action alternative can also be termed “managed retreat”, and this is viewed
as a viable long term option for many shoreline areas. For this reach of Lower Honoapiilani
Road, managed retreat would involve the following:
Abandonment of the roadway, and development of alternative transportation corridors;
Abandonment and re-location of infrastructure, including water lines, drainage lines, and
sewer lines, as well as overhead utilities (power and cable);
It is assumed that all infrastructure lines can be re-located, but the costs will be high. At this
location, alternative transportation corridors can likely also be accomplished. Figure 4-1 shows a
potential plan for a by-pass to move the Kaopala Bay portion of Lower Honoapiilani Road
mauka to service the housing area. The plan shown would use the existing 40-ft railway right-
of-way. While the legal, political, and cost ramifications are not clear, the plan will likely be
complicated and expensive. Although located inland, the right-of–way is within the tsunami
evacuation zone, and crosses the AE flood zone and floodway at Kaopala Stream (see Figures 3-
13 and 3-14) However, all properties fronting the project reach can be accessed by the mauka
alignment. Access to individual homes within the parcels would require new driveway
alignments and would likely be the responsibility of the owners. No Action, and abandonment
of Lower Honoapiilani Road, would also place the private shoreline property mauka of the
existing road at risk from erosion and shoreline recession. Abandonment of Lower Honoapiilani
Road would also likely result in the permanent loss of this road and coastal land along the reach.

Coastal Engineering Report for Lower Honoapiilani
Road Erosion at Kaopala Bay
Sea Engineering, Inc. 45
Figure 4-1. Managed retreat option with new mauka transit corridor using railway right-of-way

Coastal Engineering Report for Lower Honoapiilani
Road Erosion at Kaopala Bay
Sea Engineering, Inc. 46
4.2.1 Emergency Shore Protection
Given the apparent imminent undermining of Lower Honoapiilani Road, SEI recommended in a
February 7, 2018 memorandum to DPW that they consider implementing emergency shore
protection.
Emergency shore protection is considered non-engineered protection using temporary methods
and available materials. Temporary methods are not compatible with typical engineering design
criteria, but have been developed by trial and error, and acceptance by permitting agencies. At
present, geotextile sand bags are considered the only viable temporary shore protection option in
open coast environments. Large geotextile sand bags weighing 1 to 5 tons are stacked against
the shoreline scarp. These last for approximately two years before repairs and partial
replacement become necessary due to movement of the bags caused by wave forces and failure
of the geotextile due to sun and weather. In past years, sand bag protection was typically done
using 2 cubic yard woven geotextile bags (Bulklift bags). More recently, ElcoRock geotextile
containers have become available. ElcoRock is a coastal construction system utilizing robust
geotextile containers designed to be filled with sand and then placed to form a stable and durable
structure. The containers are available in 0.75m³ (3,000 lbs) and 2.5m³ (11,000 lbs) sizes. The
containers are efficient to install and remove, and the larger containers provide a stable structure
for Hawaii’s exposed coastal areas. The non-woven geotextile fabric is UV and vandal resistant,
has excellent abrasion resistance, and its soft finish is attractive and non-abrasive.
The preferred emergency shore protection at Kaopala Bay consists of 2.5m³ ElcoRock sand-
filled geotextile containers stacked to protect the shoreline scarp in the vicinity of the threat as
shown in Figure 4-2. The ElcoRock would be stacked on a slope to match the slope of the
erosion scarp and have a crest elevation up to the top of the scarp, which has an approximate
elevation of +15’ MSL. Figure 4-3 shows a proposed sandbag section view. The ElcoRock
weigh approximately 5 tons each, and require a medium-sized excavator for placement (e.g.
Komatsu PC400). While smaller 0.75m³ ElcoRock have been used for most recent temporary
emergency structures in West Maui, the larger containers are recommended for this application
due to the north swell exposure at Kaopala Bay and seriousness of the threat to a public roadway.
The proposed shore protection structure is 80 feet in length, and backed by geotextile filter
fabric. The structure design will require approximately 44 ElcoRock containers and will have a
footprint of approximately 800 square feet. The ElcoRock can be removed upon completion of a
long-term coastal management solution. The preferred fill material is carbonate sand. In the
past this requirement has been filled by dune deposits found in Wailuku and mined by Ameron.
However, due to a moratorium imposed on that resource, an alternative sand sources will likely
be necessary. These may include crushed carbonate, crushed basalt, or dredged sand.

Coastal Engineering Report for Lower Honoapiilani
Road Erosion at Kaopala Bay
Sea Engineering, Inc. 47
Materials and Quantities
Materials include:
(44) ElcoRock 2.5 m3 sand containers
(144) cubic yards of sand-sized fill material
(2000) square feet geotextile filter fabric underlayment
Access and Staging
Equipment and material access would necessarily be from Lower Honoapiilani Road.
Equipment and materials would be staged on the road and would require at least a one lane
closure along 300 feet of Lower Honoapiilani Road.
Installation
ElcoRock containers would be filled on-site, using the ElcoRock J-Bin filling
apparatus.
Any remaining trees fronting the road in the project area would be cut or removed
to allow unobstructed installation of the ElcoRock. Beach cobbles should be
graded to create a stable, flat surface for ElcoRock placement.
Geotextile underlayment would be rolled out by hand. Installation of the
ElcoRock containers would be accomplished using an excavator. Road plates are
recommended to protect the road surface.
Construction Duration
Construction is anticipated to take approximately 1 week.
Permits for Temporary Emergency Shore Protection
Temporary installations typically require administrative authorization from both the County
Department of Planning and State DLNR-OCCL. As the structure is usually placed seaward of
the upper reach of the wash of the waves, nominal jurisdiction is held by the state. However, the
shoreline zone is designated a special management area regulated by the county. The county
Special Management Area Emergency Permit is designated as SM3 and is issued when there is a
threat to a legally habitable structure, or when public infrastructure is at risk of failure which
would substantially affect public health and safety. DLNR-OCCL operates under similar
emergency criteria, and will issue a letter of authorization for the emergency structure.
If the emergency structure is located below the high water mark, it is considered to also be in
“Waters of the United States”, and will need a letter of authorization from the U.S. Army Corps
of Engineers.

Coastal Engineering Report for Lower Honoapiilani
Road Erosion at Kaopala Bay
Sea Engineering, Inc. 48
Figure 4-2. ElcoRock revetment layout
Figure 4-3. ElcoRock revetment section

Coastal Engineering Report for Lower Honoapiilani
Road Erosion at Kaopala Bay
Sea Engineering, Inc. 49
4.2.2 Seawall
A seawall is a vertical or sloping concrete, cement-rubble-masonry (CRM), cement-masonry unit
(CMU), or sheet pile wall used to protect the land from wave damage and erosion. A seawall, if
properly designed and constructed, is a proven, long lasting, and relatively low maintenance
shore protection method. Seawalls also have the advantage of having a relatively small footprint
on the shore.
The impervious and vertical face of a seawall results in very little wave energy dissipation.
Hence, wave energy is deflected both upward and downward, and also a large amount of wave
energy is reflected seaward. The downward energy component can cause scour at the base of the
wall - therefore the foundation of a seawall is critical for its stability, particularly on an eroding
shoreline. Ideally, a seawall should be constructed on a solid, non-erodible substrate. Seawalls
are not flexible structures, and their structural stability is dependent on the stability of their
foundations.
If the foundation of the seawall is breached, hydraulic processes can erode fill material behind
the wall. With the loss of enough fill, the ground surface behind the seawall will collapse into a
sink hole. When a sink hole is observed, repairs should be made as soon as possible or the wall
may eventually fail. Repair methods vary; one method is to excavate behind the wall, reinforce
the foundation with concrete, and replacing the fill with appropriately graded material. To avoid
foundation problems, the seawall foundation should be well below the potential scour level.
The presence of a visible rock substrate at a relatively high elevation near the most at-risk
portion of the shoreline embankment gives strong support for the use of a seawall as a shore
protection option (see Figures 2-4, 2-5, and 2-13).

Coastal Engineering Report for Lower Honoapiilani
Road Erosion at Kaopala Bay
Sea Engineering, Inc. 50
Figure 4-4 illustrates a potential design cross-section for a CRM seawall structure at Kaopala
Bay. The rock substrate simplifies wall requirements for both a foundation and anchoring,
allowing use of a gravity wall such as the CRM structure shown. This type of structure will also
allow some expansion of the road shoulder by pushing the wall seaward and adding fill behind
the wall.
Advantages of a CRM wall at Kaopala Bay include:
Potential for good foundation conditions;
High foundation elevation minimizes size of the wall;
Relatively simple design and construction;
Compatible with drainage outlets;
Aesthetically well matched with surroundings.
The presence of a high energy cobble beach mitigates some of the negative qualities of a seawall.
Wave reflection will tend to rapidly attenuate due to the high friction properties of the cobbles,
and these also have excellent resistance to scour.

Coastal Engineering Report for Lower Honoapiilani
Road Erosion at Kaopala Bay
Sea Engineering, Inc. 51
A seawall is particularly applicable to the area of concern shown in Figure 2-3, and as shown in
Figure 4-4. However, it can also be used to protect the revetment reaches by placing the wall
against the vertical clay/silt escarpment as long as a solid foundation is still accessible.
Geotechnical borings are recommended at approximately 100-ft intervals along the reach of the
bay in order to have a complete assessment of the foundation conditions. The remnant stones
that form the over-steepened section against the clay/silt scarp should be removed prior to wall
construction, and place at lower elevations on the beach (Figure 4-5).
Figure 4-4. Typical seawall section

Coastal Engineering Report for Lower Honoapiilani
Road Erosion at Kaopala Bay
Sea Engineering, Inc. 52
Figure 4-5. Schematic of CRM wall used on revetment protected reaches
4.2.3 Rock Revetment
A rock rubblemound revetment is a sloping uncemented structure built using boulder-sized rock.
The most common method of revetment construction is to place an armor layer of stone, sized
according to the design wave height, over an underlayer and filter designed to distribute the
weight of the armor layer and to prevent loss of fine shoreline material through voids in the
revetment. The armor layer is typically two stone diameters in thickness.
Armor Stone Size
Typical revetment structures are designed as rock rubble mounds with a slope of up to 1.5
Horizontal to 1Vertical (1.5H:1V), which is the steepest slope recommended by the Coastal
Engineering Manual (2006). Stone sizing for the design wave height is given by the Hudson
Formula (Coastal Engineering Manual, 2006):
where,
W = weight in pounds of an individual armor stone
wr = unit weight of the stone, 160 lb/ft3
H = wave height, 6.9 feet (see Section 3.4.8)
KD = armor stone stability coefficient, 2
cot)1( 3
3
rD
r
SK
HwW

Coastal Engineering Report for Lower Honoapiilani
Road Erosion at Kaopala Bay
Sea Engineering, Inc. 53
Sr = specific gravity of the stone relative to seawater, use 2.5
cot θ = cotangent of the groin side slope, use 1.5
The resultant armor stone weight is approximately 5,000 pounds with a corresponding nominal
diameter of 3.2 feet. A range of ± 25% of the median weight is typically utilized, which yields a
stone weight range of 3,750 to 6,500 pounds. These are preliminary values, and may be
conservative. A more rigorous design wave development including numerical modeling is
recommended for final design parameters.
Revetment Underlayer
Underlayer stone is utilized to transition between the large armor stone and small filter stone or
filter layer. Sizing of the underlayer stone is important for providing sufficient porosity for
energy dissipation rather than reflection, to achieve interlocking between the armor and
underlayer, and to insure that the underlayer material cannot be dislodged through voids in the
armor layer. Underlayer stone is sized at approximately one-tenth the armor stone weight, which
in this case is approximately 500 lbs.
The underlayer stone should be placed over a geotextile filter fabric layer. The geotextile
prevents the migration of fine soil particles through voids in the structure, and permits relief of
hydrostatic pressures within the soils. The underlayer stone protects the geotextile from damage
during placement of the armor layer, and together with the geotextile helps distribute the weight
of the armor stone to provide for more uniform settling. The existing slope should be graded and
dressed prior to revetment construction to provide a 1.5H:1V slope. Rocks and other debris
which might puncture or tear the geotextile should be removed from the prepared slope.
Figure 4-6 shows a potential rock revetment design cross section, assuming a rock substrate for
embedment of the revetment toe.
One major advantage of a rock revetment versus a vertical seawall is that the rough porous rock
surface and relatively flat slope of the structure will tend to absorb wave energy and reduce wave
reflection. Properly designed and constructed rock revetments are durable, flexible, and highly
resistant to wave damage. Should toe scour occur, the structure can settle and readjust without
major failure. Damage from large waves is typically not catastrophic, and the revetment can still
function effectively even if damage occurs. From a coastal engineering perspective, a rock
rubblemound revetment is often the most suitable shore protection alternative for coastal
shorelines.

Coastal Engineering Report for Lower Honoapiilani
Road Erosion at Kaopala Bay
Sea Engineering, Inc. 54
The project area contains reaches with existing rock revetment protection. The stone is mostly
undersized, and down-slope movement has caused over-steepening of the top portions of the
structure. While new revetment construction is probably not practical for the at-risk portions of
the shoreline due to the wide footprint of the structure, repair of the existing revetment reaches is
a feasible option. It is recommended that additional geotechnical information be acquired in
order decide if a wall or revetment is the best approach.
Figure 4-6. Typical rock revetment section
4.2.4 Beach Nourishment
When sand loss is gradual and the beach has a high economic value for recreation and tourism, it
is sometimes good coastal management policy to replenish the littoral cell with sand from
offshore or other sources. Massive beach nourishment projects have taken place on the eastern
seaboard, Gulf coasts (USACE CEM, 2006), and Southern California (SANDAG, 2000). In the
past ten years “Hawaii sized” beach nourishment projects have taken place on Oahu, Kuhio
Beach Park (2006), Waikiki Beach (2012) and Iroquois Point (2013).
Beach nourishment is expensive, and containment features or structures such as T- head groins
are sometimes necessary to keep the sand from disappearing. Some areas have features such as
headlands or reefs that naturally stabilize the sand. On open ocean or otherwise unprotected
coasts T-head groins both decrease the amount of wave energy reaching the beach, and act as
artificial littoral cells to stabilize the sand.

Coastal Engineering Report for Lower Honoapiilani
Road Erosion at Kaopala Bay
Sea Engineering, Inc. 55
Beach nourishment requires a supply of sand that is similar in character to the native beach sand.
While sand in Hawaii may seem like a plentiful commodity, the reality is that good quality beach
sand is in very short supply. Inland dune deposits have been used for some nourishment efforts,
but the process of transport by wind preferentially selects a naturally finer grain size, and dune
sand therefore tends to be composed of grains that are too fine for many applications. Offshore
sand deposits also tend to have grain sizes that are finer than many beaches, and many reef-top
deposits are thin and of insufficient volume for meaningful use. However, offshore deposits
have been found that are in some cases suitable. Dredging and recovery operations are
expensive, but have been shown to be effective. The Waikiki Beach Maintenance project (2012)
recovered 24,000 cy of sand from and offshore deposit and pumped it to shore to nourish 1,730
feet of beach in the center of Waikiki, at a cost of $2.4M.
Beaches can be stabilized by beach nourishment, and the addition of sand can slow the erosion of
fast lands. However, in dynamic environments sand that is not held in place by natural
headlands or containment structure can rapidly disappear during adverse conditions. Recent
beach monitoring in Waikiki shows that approximately half of the 2012 nourishment project
sand is no longer on the beach.
In Kaopala Bay, there appears to be a stable beach in the lee of Haukoe Point (see Figure 2-6).
However, the beach along the rest of the bay is composed of rock cobbles with little to no sand.
This morphology is a strong indication that, in general, sand is not stable along this reach of
coast. Implementing a beach nourishment project for the purpose of protecting the shoreline
scarp and protecting the roadway is not likely to be successful.
4.2.5 Shore Protection Impacts
Shore protection is a controversial topic because of both real and perceived impacts to the coastal
environment. Following are brief descriptions of typical impacts that may occur due to
construction of shore protection.
Impoundment
Impoundment is the sequestration of sediment behind a shore protection structure. By
preventing erosion of the upland behind the structure, an eroded beach can be starved of new
sand. Although there are some beach morphologies that may behave in this way, beaches on the
West Coast (California) and Hawaii generally are not directly supplied with sand from coastal
upland erosion. Studies have shown that California beaches derive about 10% of their sand from
the erosion of coastal bluffs, with the majority of beach sand being sourced from river and
stream flow and then transported laterally along the coast (Patsch & Griggs, 2006). In contrast,
Hawaii beaches are primarily composed of carbonate sand that is derived from biogenic

Coastal Engineering Report for Lower Honoapiilani
Road Erosion at Kaopala Bay
Sea Engineering, Inc. 56
production on fringing reefs and transported to shore by wave action (Moberly & Chamberlain,
1964; Inman et al, 1963).
Placement Loss
Placement loss is the term used to describe the loss of beach due to the footprint of a structure
encroaching on the beach area. The amount of placement loss depends on the structure type and
where it is located. A vertical seawall placed landward of the shoreline would result in virtually
no placement loss, for example, while loss due to revetment construction (see Figure 4-6) may be
20 to 30 ft. However, this figure is misleading since much of the revetment is buried, especially
during seasonal periods when sand is present on a beach.
Flanking Erosion (End Effects)
Flanking erosion is when erosion occurs behind a shore protection structure, and can be a
mechanism for structure failure. Flanking can be accelerated by end effects. End effects are
caused by the radiation of waves from the edge of coastal structure. The waves radiate in a more
or less arcing pattern due to an expanding wave front (i.e. like waves in a pond). Because of this
pattern, as well as attenuation due to wave breaking and bottom friction, the waves lose energy
with distance from the source and results in end effects being a near field process, meaning that
the effects are most pronounced close to the source, in this case the end or edge of the structure.
Figure 4-7 is a photograph of end effect processes, showing waves radiating from the edge of a
temporary structure. The soft sand on the adjacent shoreline is easily eroded. The near-field
property of the phenomenon can be seen by inspection of the eroded shoreline in the photograph.
Passive Erosion
Passive erosion is a term used to describe the effect of erosion that occurs next to a protected
shoreline. With time the unprotected shoreline can erode sufficiently to create an offset and
change the geometry of the coast. Geometry is important for coastal processes, and the offset
can create a de-facto headland that provides a barrier to sand transport and prevents deposition in
front of the protected area. Figure 4-8 shows an example of passive erosion at Kahana Bay:
sand is prevented from being transported and deposited by the offset between the protected and
unprotected shorelines.
Wave Reflection and Scour
Wave reflection from vertical structures is perceived to inhibit the accretion of sand and have a
generally negative impact on beaches, although evidence of this effect has not been clearly
documented (Griggs et al, 1994, CEM, 2006). Nevertheless, it is accepted coastal engineering
practice to minimize wave reflection as much as possible. Wave reflection can also cause a soft
substrate to scour and deepen into a trough in front of the reflecting surface, thereby affecting the
nearshore morphology.

Coastal Engineering Report for Lower Honoapiilani
Road Erosion at Kaopala Bay
Sea Engineering, Inc. 57
Figure 4-7. An example of end effects
Figure 4-8. Example of passive erosion at Kahana Bay; note shoreline offset – shoreline on the
right was unprotected until recently
4.2.6 Shore Protection Impact Mitigation
Much of the impacts from shore protection can be minimized by understanding the existing
environmental conditions and designing accordingly. For example, a revetment is often a
preferred structure as it tends to reduce wave reflection. However, the substantial cobble beach
that exists at Kaopala Bay is a natural and extremely effective wave absorption mechanism that

Coastal Engineering Report for Lower Honoapiilani
Road Erosion at Kaopala Bay
Sea Engineering, Inc. 58
will minimize reflection and scour in front of a vertical wall such that the ameliorating effects of
a revetment are redundant. Passive erosion and flanking due to end effects is typically countered
by extending the structure to where it is naturally protected such that these effects are minimize
or eliminated.
4.3 Regulatory Environment
4.3.1 Overview
Hawaii shorelines and coastal waters are governed by a complex array of Federal, State, and
County jurisdictions, rules and regulations. Figure 4-9 illustrates the approximate jurisdictional
boundaries that will determine the scope of the environmental review and regulatory permitting
requirements for a shore protection structure at Kaopala Bay. The U.S. Army Corps of
Engineers (USACE) has jurisdiction seaward of the mean higher high water (MHHW) line and
offshore for 200 nautical miles. The Hawaii Department of Land and Natural Resources (DLNR)
has jurisdiction seaward of the certified shoreline1 to 3 nautical miles offshore, which overlaps
with portions of the USACE jurisdiction. The area landward of the certified shoreline is
managed by the County of Maui.
Figure 4-9. Approximate jurisdictional boundaries at Kaopala Bay
4.3.2 Federal Requirements
The USACE is the designated lead agency with regulatory authority over Navigable Waters of
the United States, which includes the oceans and coastal waters seaward of MHHW.
1 “Shoreline” means the upper reaches of the wash of the waves, other than storm or seismic waves, at high tide during the season
of the year in which the highest wash of the waves occurs, usually evidenced by the edge of vegetation growth, or the upper limit of debris left by the wash of the waves (Hawaii Administrative Rules (HAR) §13-222).”

Coastal Engineering Report for Lower Honoapiilani
Road Erosion at Kaopala Bay
Sea Engineering, Inc. 59
Construction seaward of MHHW typically requires a Department of the Army (DA) permit
pursuant to Section 10 of the Rivers and Harbors Act of 1899 (33 USC 403) and Section 404 of
the Clean Water Act (33 USC 1344). All work or structures in or affecting the course, condition,
location or capacity of navigable waters, including tidal wetlands, require DA authorization
pursuant to Section 10. In addition, activities involving the discharge of dredged or fill material
(i.e., armor stones) into Waters of the United States requires a DA permit pursuant to Section
404. Activities which require federal permits must also meet requirements of the Coastal Zone
Management Act (CZMA). The MHHW elevation for the project site is approximately 1.2 feet
above mean sea level (MSL). The horizontal location of the MHHW line varies depending on
the beach profile. The rock revetment structure would likely extend seaward of MHHW. Thus,
Federal permits would be required. Federal permits may not be required for the seawall
alternative, assuming it can be located landward of the MHHW line on the shoreline.
4.3.3 State of Hawaii Requirements
The Hawaii Department of Land and Natural Resources (DLNR) is the designated lead agency
with regulatory authority over Conservation District and Public Trust lands, which includes
unencumbered land and submerged land. All lands in Hawaii are classified into four land use
districts: urban, rural, agricultural, and conservation. Hawaii Revised Statutes (HRS) § 205-2
(Coastal Zone Management , or CZM) is the overarching policy that designates the types of uses
permitted in the four land use districts. The area landward of the shoreline at Kaopala Bay is
located in the Urban District. The area seaward of the shoreline in Kaopala Bay is considered
submerged State land and is located in the Conservation District, Resource Subzone, which
extends 3-nautical miles seaward from the shoreline.
The certified shoreline establishes the landward limits of the Conservation District. The Board
of Land and Natural Resources (BLNR) has exclusive jurisdiction to govern land uses in the
Conservation District. Shore protection would be considered an identified land use in the
Resource Subzone of the Conservation District pursuant to Hawaii Administrative Rules (HAR)
§13-5-24-P-15 Shoreline Erosion Control (D-1); therefore, the project will require a
Conservation District Use Permit (CDUP) from the DLNR Office of Conservation and Coastal
Lands (DLNR-OCCL).
The Conservation District Use Application (CDUA) will require submittal of an Environmental
Assessment (EA) and a Finding of No Significant Impact (FONSI) pursuant to Hawaii Revised
Statutes (HRS), Chapter 343, and its implementing regulations. Hawaii Administrative Rules
(HAR) Title 11, Chapter 200, addresses the determination of significance and contents of an
environmental assessment.

Coastal Engineering Report for Lower Honoapiilani
Road Erosion at Kaopala Bay
Sea Engineering, Inc. 60
Water quality standards and regulations are administered by the Hawaii Department of Health,
Clean Water Branch (DOH-CWB). A National Pollutant Discharge Elimination System
(NPDES) Permit is required any time construction activity covers an area one (1) acre in size or
greater, and is intended to prevent pollutants from reaching coastal waters as a result of storm
water runoff. Information required to obtain a permit includes project specific details and
construction drawings, receiving state water information, storm and non-storm water discharge, a
Best Management Practices Plan (BMPP), and Post-Construction Pollutant Control Measures.
Should any part of the project be constructed below the MHHW mark, a DA Section 404 permit
would be required, which may in turn trigger a requirement for a Section 401 Water Quality
Certification (WQC), which is administered by the Hawaii Department of Health. The WQC
requires the applicant to conduct water quality monitoring before, during, and after construction.
4.3.4 County of Maui Requirements
The County of Maui Department of Planning is the designated lead agency with regulatory
authority over the area landward of the certified shoreline within the Special Management Area
(SMA). Hawaii Revised Statutes (HRS) §205-2 establishes the types of land uses that are
permissible within the SMA, which is considered the most sensitive area of the coastal zone.
The certified shoreline establishes the seaward limits of the SMA and is the baseline that
counties use to calculate shoreline setbacks in Hawaii. It is likely that some portion of proposed
shore protection will be mauka of the certified shoreline, and will therefore require an SMA
permit and a Shoreline Setback Variance (SSV). As with the CDUP, the SMA requires an
Environmental Assessment.
Lower Honoapiilani Road is located in the VE Flood Zone with a Base Flood Elevation of 17
feet, therefore a Flood Development Permit and Coastal High Hazard Area Certificate will likely
be required. The activity may involve ground disturbing activities and/or stockpiling of
materials, so a Grubbing and Grading Permit may be required.
The anticipated environmental review and regulatory permitting requirements for a shore
protection structure at Kaopala Bay are summarized in
Table 4-1, below.

Coastal Engineering Report for Lower Honoapiilani
Road Erosion at Kaopala Bay
Sea Engineering, Inc. 61
Table 4-1. Anticipated Environmental Review and Regulatory Permitting Requirements
FEDERAL
Department of the Army Permit (DA)
Lead Agency: US Army Corps of Engineers (USACE)
Authority: Section 10 of the Rivers and Harbors Act of 1899 (33 USC 403) and
Section 404 of the Clean Water Act (33 USC 1344)
STATE OF HAWAII
Conservation District Use Permit (CDUP)
Lead Agency: Hawaii Department of Land and Natural Resources (DLNR)
Authority: Hawaii Administrative Rules (HAR) 13-5
Environmental Assessment (EA)
Lead Agency: Hawaii Office of Environmental Quality Control (OEQC)
Authority: Hawaii Revised Statutes (HRS) Chapter 343
National Pollution Discharge Elimination System Permit (NPDES)
Lead Agency: Hawaii Department of Health (DOH)
Authority: Hawaii Administrative Rules, Chapter 11-55
Water Quality Certification (WQC)
Lead Agency: Hawaii Department of Health (DOH)
Authority: Section 401 of the Clean Water Act (33 USC 1344)
COUNTY OF MAUI
Special Management Area Minor Permit (SMA)
Lead Agency: County of Maui Department of Planning
Authority: Hawaii Revised Statutes (HRS) Chapter 205-A
Special Flood Hazard Area Development Permit
Lead Agency: County of Maui Department of Planning
Authority: Maui County Code (MCC), Chapter 19.62
Coastal High Hazard Area Certification
Lead Agency: County of Maui Department of Planning
Authority: Maui County Code (MCC), Section 19.62.060.G.6.a
Grubbing and Grading Permit
Lead Agency: County of Maui Department of Public Works
Authority: Maui County Code (MCC), Chapter 20.08
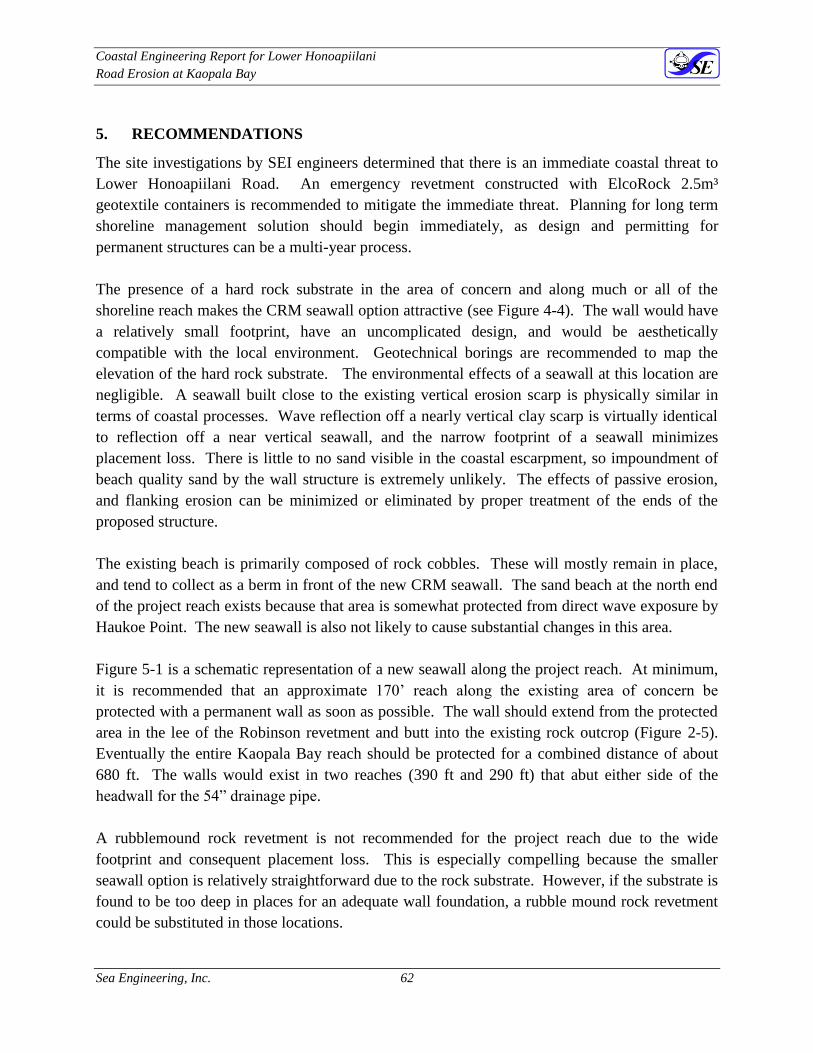
Coastal Engineering Report for Lower Honoapiilani
Road Erosion at Kaopala Bay
Sea Engineering, Inc. 62
5. RECOMMENDATIONS
The site investigations by SEI engineers determined that there is an immediate coastal threat to
Lower Honoapiilani Road. An emergency revetment constructed with ElcoRock 2.5m³
geotextile containers is recommended to mitigate the immediate threat. Planning for long term
shoreline management solution should begin immediately, as design and permitting for
permanent structures can be a multi-year process.
The presence of a hard rock substrate in the area of concern and along much or all of the
shoreline reach makes the CRM seawall option attractive (see Figure 4-4). The wall would have
a relatively small footprint, have an uncomplicated design, and would be aesthetically
compatible with the local environment. Geotechnical borings are recommended to map the
elevation of the hard rock substrate. The environmental effects of a seawall at this location are
negligible. A seawall built close to the existing vertical erosion scarp is physically similar in
terms of coastal processes. Wave reflection off a nearly vertical clay scarp is virtually identical
to reflection off a near vertical seawall, and the narrow footprint of a seawall minimizes
placement loss. There is little to no sand visible in the coastal escarpment, so impoundment of
beach quality sand by the wall structure is extremely unlikely. The effects of passive erosion,
and flanking erosion can be minimized or eliminated by proper treatment of the ends of the
proposed structure.
The existing beach is primarily composed of rock cobbles. These will mostly remain in place,
and tend to collect as a berm in front of the new CRM seawall. The sand beach at the north end
of the project reach exists because that area is somewhat protected from direct wave exposure by
Haukoe Point. The new seawall is also not likely to cause substantial changes in this area.
Figure 5-1 is a schematic representation of a new seawall along the project reach. At minimum,
it is recommended that an approximate 170’ reach along the existing area of concern be
protected with a permanent wall as soon as possible. The wall should extend from the protected
area in the lee of the Robinson revetment and butt into the existing rock outcrop (Figure 2-5).
Eventually the entire Kaopala Bay reach should be protected for a combined distance of about
680 ft. The walls would exist in two reaches (390 ft and 290 ft) that abut either side of the
headwall for the 54” drainage pipe.
A rubblemound rock revetment is not recommended for the project reach due to the wide
footprint and consequent placement loss. This is especially compelling because the smaller
seawall option is relatively straightforward due to the rock substrate. However, if the substrate is
found to be too deep in places for an adequate wall foundation, a rubble mound rock revetment
could be substituted in those locations.

Coastal Engineering Report for Lower Honoapiilani
Road Erosion at Kaopala Bay
Sea Engineering, Inc. 63
Managed retreat consisting of road and utility relocation is feasible in this location due to the
potential availability of land for a new transit corridor, but is certainly not the most cost effective
solution and would cause extensive disruption to the community.
Beach nourishment is not considered a feasible option for this area. Based on existing
conditions, sand is generally not stable along the project reach and any beach nourishment effort
would need to be accompanied with substantial retention structures such as T-groins. Even then,
beach nourishment would not guarantee stability of the shoreline and protection of the road.
Table 5-1 is a comparison of selected protection options. Project costs listed in the table are
based on recent projects on Maui and Kauai. Costing for shore protection is uncertain as each
project has its own difficulties, and is dependant on the availability of stone and access for heavy
equipment.
5.1 Recommendations for follow-on work
Follow-on work for protection of the Kaopala Bay shoreline include additional design,
environmental review and permitting.
5.1.1 Additional Design
Additional design needs include a new topographic survey of the entire reach, geotechnical
borings (e.g., at 100’ intervals or less) to determine the rock substrate conditions and elevation,
additional oceanographic parameter analysis, and structural engineering design input. These
elements can be presented together in a Basis of Design Report. The report should be prepared
by an engineering firm with experience in coastal structure design.
5.1.2 Environmental Review
An environmental assessment will be required for county and state permits. The assessment will
likely require a marine biological and water quality survey, cultural impact assessment,
archaeological monitoring plan, and a preliminary drainage plan. The environmental assessment
can be prepared by an engineering firm with experience in coastal design, or by a planning firm
with experience in Maui County with assistance from the design engineers and other
subcontractors.
5.1.3 Permits
As indicated in Section 4.3, the project will probably require state (CDUP) and county (SMA,
SSV) permits at minimum. Federal permits may or may not be required, depending on the final
design configuration and location. If the rock substrate is sufficient in elevation, the CRM wall

Coastal Engineering Report for Lower Honoapiilani
Road Erosion at Kaopala Bay
Sea Engineering, Inc. 64
design may be out of federal jurisdiction. Permit application can either be prepared by a
planning firm with assistance from the design engineers, or by the design engineers.
Figure 5-1. Schematic representation of new CRM seawall.

Coastal Engineering Report for Lower Honoapiilani
Road Erosion at Kaopala Bay
Sea Engineering, Inc. 65
Table 5-1. Comparison of Alternatives
Alternative SEI Rating Pros Cons
1. CRM Seawall Preferred
Shoreline armoring (maximum protection);
Minimize coastal footprint;
Minimal impact on coastal processes;
Rugged, adaptable structure
Low impact on marine environment
Reflective (but equivalent to existing morphology)
Cost: $5,000 – $6,000 per linear ft
2. Revetment Second Preferred
Shoreline armoring (maximum protection);
Minimize reflection;
Minimal impact on coastal processes;
Rugged, adaptable structure
Wide footprint / placement loss
Cost: $6,000 – $9,000 per linear ft
3. Emergency ElcoRock
Containers
Preferred
(Temporary)
Proven robust temporary protection
Quickly implemented
Installed with Emergency permits
Temporary only – will degrade with time (e.g. 2 yrs) and will need repairs
4. Beach Nourishment Not Appropriate
None
Sand is not stable, would require extensive additional retention structures.
Will not protect roadway
Cost (with structures): $4,000 - $9,000 per linear ft
8. Managed Retreat Not Appropriate Feasible due to available land
No additional structures required
Will allow coastal erosion
Will require relocation of transit corridor
Will require relocation of buried utilities
Very high cost (to be determined)

Coastal Engineering Report for Lower Honoapiilani
Road Erosion at Kaopala Bay
Sea Engineering, Inc. 66
6. REFERENCES
Anderson, Tiffany R., C.H. Fletcher, M.M. Barbee, I.N. Frazer, B.M. Romine, 2015; Doubling of
coastal erosion under rising sea level by mid-century in Hawaii; Natural Hazards: Journal of the
International Society of the Prevention and Mitigation of Natural Hazards, Springer Science DOI
10.1007/s11069-015-1698-6
Davidson-Arnott R., 2005; Conceptual model of the effects of sea level rise on sandy coasts.
Journal of Coastal Research 21(6):1166–1172
Eversole, D., Fletcher, C.H., 2003. Longshore Sediment Transport Rates on a Reef-
Fronted Beach: Field Data and Empirical Models Kaanapali Beach, Hawaii, Journal of
Coastal Research: Vol. 19, No. 3, pp. 649–663.
Firing, Y.L. and M.A. Merrifield, 2004. Extreme sea level events at Hawaii: Influence of mesoscale
eddies. Geophysical Research Letters, Vol. 31(24).
Fletcher, C.H. III, E.E. Grossman, B.M. Richmond, and A.E. Gibbs, 2002. Atlas of Natural Hazards
in the Hawaiian Coastal Zone. Investigations Series I-2761. U.S. Geological Survey: Washington,
D.C.
Fletcher, C., R. Boyd, W.J. Neal, and V. Tice, 2010. Living on the Shores of Hawaii. University of
Hawaii Press. Honolulu, HI.
Griggs, G.B, J. Tait, W. Corona, 1994; The Interaction of Seawalls and Beaches: Seven Years of
Monitoring Monterey Bay, California; Shore and Beach, July 1994
Hawaii Climate Change Mitigation and Adaptation Commission, 2017. Hawaii Sea Level Rise
Vulnerability and Adaptation Report. Prepared by Tetra Tech, Inc. and the State of Hawaii
Department of Land and Natural Resources, Office of Conservation and Coastal Lands
Moberly, R., and T. Chamberlain, 1964; Hawaiian Beach Systems; Hawaii Institute of
Geophysics, HIG-64-2
Inman, D.L., W.R. Gayman, D.C. Cox, 1963; Littoral Sedimentary Processes on Kauai, a
Subtropical High Island; Pacific Science, Vol. XVII, January 1963
NASA. Climate Change: Vital Signs of the Planet: Sea Level Change website.
http://climate.nasa.gov/vital-signs/sea-level/. Retrieved October, 2017.
National Oceanic and Atmospheric Administration (NOAA). NOAA Tides & Currents website.
https://tidesandcurrents.noaa.gov/sltrends/sltrends_station.shtml?stnid=1611400. Retrieved October
15, 2017.

Coastal Engineering Report for Lower Honoapiilani
Road Erosion at Kaopala Bay
Sea Engineering, Inc. 67
Pacific Island Ocean Observing System. PacIOOS website. Available from:
oos.soest.hawaii.edu/pacioos/. Last accessed October 15, 2017.
Patsch, K., and Griggs, G., 2006; Littoral Cells, Sand Budgets, and Beaches: Understanding
California’s Shoreline; Institute of Marine Sciences, University of California, Santa Cruz;
California Department of Boating and Waterways; California Coastal Sediment Management
WorkGroup
SANDAG (2000) http://www.sandag.org/index.asp?projectid=298&fuseaction=projects.detail
School of Ocean and Earth Science and Technology (SOEST), 1996. The Ocean Atlas of
Hawaii. Available online at URL: http://oos.soest.hawaii.edu; last accessed October 15, 2017.
Storlazzi, Curt D., B.E. Jaffe, 2008; The relative contribution of processes driving variability in
flow, shear, and turbidity over a fringing coral reef: West Maui, Hawaii; Estuarine, Coastal, and
Shelf Science; Elsevier Vol. 77, pp 549-564
Sweet, William V., R.E. Kopp, C.P. Weaver, J. Obeysekara, R. M. Horton, E. R. Thieler, C.
Zervas, 2017. Global and Regional Sea Level Rise Scenarios for the United States; NOAA
Technical Report NOS CO-OPS 083.
University of Hawaii Coastal Geology Group, 2009. Hawaii Coastal Erosion Website. Available
from: http://www.soest.hawaii.edu/asp/coasts/index.asp. Last accessed October 13, 2017.
U.H. Coastal Geology Group, 2003; Maui Shoreline Atlas; prepared for County of Maui,
Contract No. G0605.
U.S. Army Corps of Engineers, 2006. Coastal Engineering Manual.
U.S. Army Corps of Engineers, 2011. Sea Level Change Considerations for Civil Works
Programs. EC1165-2-212.
U.S. Army Corps of Engineers, 2014. Website: Responses to Climate Change
http://www.corpsclimate.us/ccaceslcurves.cfm.
Walker, D.A., 2013; Runups in the Hawaiian Islands for Large, Pacific-Wide, 20th
and Early
21st Century Tsunamis; International Tsunami Information Center, NOAA National Weather
Service.