Coastal-Change and Glaciological Map of the Ross … · Coastal-Change and Glaciological Map of the...
27
Prepared in cooperation with the Scott Polar Research Institute, University of Cambridge, United Kingdom Coastal-Change and Glaciological Map of the Ross Island Area, Antarctica: 1962–2005 By Jane G. Ferrigno, Kevin M. Foley, Charles Swithinbank, and Richard S. Williams, Jr. Pamphlet to accompany Geologic Investigations Series Map I–2600–I 2010 U.S. Department of the Interior U.S. Geological Survey
Transcript of Coastal-Change and Glaciological Map of the Ross … · Coastal-Change and Glaciological Map of the...

Prepared in cooperation with the Scott Polar Research Institute, University of Cambridge, United Kingdom
Coastal-Change and Glaciological Map of the Ross Island Area, Antarctica: 1962–2005
By Jane G. Ferrigno, Kevin M. Foley, Charles Swithinbank, and Richard S. Williams, Jr.
Pamphlet to accompanyGeologic Investigations Series Map I–2600–I
2010
U.S. Department of the InteriorU.S. Geological Survey
U.S. Department of the InteriorKEN SALAZAR, Secretary
U.S. Geological SurveyMarcia K. McNutt, Director
U.S. Geological Survey, Reston, Virginia: 2010
For more information on the USGS—the Federal source for science about the Earth, its natural and living resources, natural hazards, and the environment, visit http://www.usgs.gov or call 1-888-ASK-USGS
For an overview of USGS information products, including maps, imagery, and publications, visit http://www.usgs.gov/pubprod
To order this and other USGS information products, visit http://store.usgs.gov
Any use of trade, product, or firm names is for descriptive purposes only and does not imply endorsement by the U.S. Government.
Although this report is in the public domain, permission must be secured from the individual copyright owners to reproduce any copyrighted materials contained within this report.
Suggested citation:Ferrigno, J.G., Foley, K.M., Swithinbank, Charles, and Williams, R.S., Jr., 2010, Coastal-change and glaciological map of the Ross Island area, Antarctica: 1962–2005: U.S. Geological Survey Geologic Investigations Series Map I–2600–I, 1 map sheet, 23-p. text.
ISBN 978-1-4113-2477-0

iii
Contents
Introduction.....................................................................................................................................................1Background ...........................................................................................................................................1Objectives...............................................................................................................................................2Sources...................................................................................................................................................3Methodology ..........................................................................................................................................3RADARSAT Image Mosaic of Antarctica and its Geodetic Accuracy .........................................4
Geographic Description ................................................................................................................................4Glacier Inventory and Glaciological Features ..........................................................................................4Coastal-Change Analysis—Discussion of Selected Glaciological Features ......................................5
Glaciers that Drain from or through the Transantarctic Mountains .............................................5Byrd Glacier ..................................................................................................................................5Darwin Glacier..............................................................................................................................6Hatherton Glacier ........................................................................................................................6Mulock Glacier .............................................................................................................................6Skelton Glacier .............................................................................................................................6Koettlitz Glacier ............................................................................................................................6
Erebus Glacier Tongue .........................................................................................................................6McMurdo Dry Valleys ..........................................................................................................................7Icebergs..................................................................................................................................................7Ice Cores ................................................................................................................................................7Blue-Ice Areas and Meteorites ..........................................................................................................8Subglacial Lakes ...................................................................................................................................8
Summary..........................................................................................................................................................9Acknowledgments .........................................................................................................................................9References Cited............................................................................................................................................9Appendix—Tables 2 and 3 ..........................................................................................................................15
Figures 1. Index map of the planned and published 1:1,000,000-scale coastal-change and glacio-
logical maps of Antarctica ..........................................................................................................2 2. Location map of Antarctica showing West and East Antarctica, the Transantarctic
Mountains, the Ross Ice Shelf, and the Antarctic Peninsula ................................................4
iv
Tables 1. Coastal-change and glaciological maps of Antarctica at 1:1,000,000 scale, published to
date .................................................................................................................................................2 2. Topographic, satellite image, and photo maps in the Ross Island map area, produced
by the USGS and cooperators ..................................................................................................16 3. Inventory of named glaciers and glaciological features on the coastal-change and
glaciological map of the Ross Island area .............................................................................19
Conversion Factors
Multiply By To obtain
meter (m)kilometer (km)
Length3.2810.6214
foot (ft) mile (mi)
Areasquare kilometer (km2) 0.3861 square mile (mi2)
Volumecubic kilometer (km3) 0.2399 cubic mile (mi3)

Coastal-Change and Glaciological Map of the Ross Island Area, Antarctica: 1962–2005
By Jane G. Ferrigno,1 Kevin M. Foley,1 Charles Swithinbank,2 and Richard S. Williams, Jr.3
Introduction
Background
Reduction in the area and volume of the two polar ice sheets is intricately linked to changes in global climate, and the resulting rise in sea level could severely impact the densely populated coastal regions on Earth. Antarctica is Earth’s largest reservoir of glacial ice. Melting of the West Antarctic part alone of the Antarctic ice sheet would cause a sea-level rise of approximately 6 meters (m), and the potential sea-level rise after melting of the entire Antarctic ice sheet is estimated to be 65 m (Lythe and others, 2001) to 73 m (Williams and Hall, 1993). Shepherd and Wingham (2007) discussed change in the Antarctic ice sheet as part of the global picture, and Jenkins and Holland (2007) discussed the real potential of sea-level rise from the melting of floating ice such as ice shelves and icebergs. The mass balance (the net volumetric gain or loss) of the Antarctic ice sheet is highly complex, responding differently to different climatic and other conditions in each region (Vaughan, 2005). In a review paper, Rignot and Thomas (2002) concluded that the West Antarctic ice sheet is probably becoming thinner overall; although it is known to be thickening in the west, it is thinning in the north. Thomas and others (2004), on the basis of aircraft and satellite laser altimetry surveys, believe that the thinning may be accelerating. Joughin and Tulaczyk (2002), on the basis of ice-flow velocities derived from analysis of synthetic-aperture radar data, concluded that most of the Ross ice streams (ice streams flowing into the east side of the Ross Ice Shelf) have a positive mass balance, whereas Rignot and others (2004) infer a larger negative mass balance for glaciers flowing northward into the Amundsen Sea, a trend indicated by Swithinbank and others (2003a, b, 2004). The mass balance of the East
Antarctic ice sheet is thought by Davis and others (2005) to be positive on the basis of the change in satellite-altimetry measurements made between 1992 and 2003. On the basis of Gravity, Recovery, and Climate Experiment (GRACE) satellite measurements of Earth’s gravity from 2002 to 2005, Velicogna and Wahr (2006) concluded that the mass of the Antarctic ice sheet decreased during the period of measurement, and that the West Antarctic ice sheet accounted for most of the loss of ice. Rignot and others (2008) studied loss of ice from the Antarctic ice sheet on the basis of regional climate modeling and satellite interferometric synthetic-aperture radar measurements acquired during the period between 1992 and 2006. They concluded that ice in East Antarctica is at near-equilibrium or has a slightly negative mass balance; ice in West Antarctica, including the Antarctic Peninsula, has a negative mass balance.
Measurement of changes in area and mass balance of the Antarctic ice sheet was given a very high priority in recommendations by the Polar Research Board of the National Research Council (1986), in subsequent recommendations by the Scientific Committee on Antarctic Research (SCAR) (1989, 1993), and by the National Science Foundation’s (1990) Division of Polar Programs. On the basis of these recommendations, the U.S. Geological Survey (USGS) decided that the archive of early 1970s Landsat 1, 2, and 3 Multispectral Scanner (MSS) images of Antarctica and the subsequent repeat coverage made possible with Landsat and other satellite images provided an excellent means of documenting changes in the cryospheric coastline of Antarctica (Ferrigno and Gould, 1987). Although changes in the areal extent of the Antarctic ice sheet are not directly related to changes in mass balance, the two are related, and the analysis of the changing coastline can yield important information. The availability of this information provided the impetus for carrying out a comprehensive analysis of the glaciological features of the coastal regions and changes in ice fronts of Antarctica (Swithinbank, 1988; Williams and Ferrigno, 1988). The project was later modified to include Landsat 4 and 5 MSS and Thematic Mapper (TM) images, RADARSAT images, and in some areas, aerial photography, NOAA AVHRR (National Oceanic and Atmospheric Administration, Advanced Very High Resolution Radiometer),
MODIS (Moderate Resolution Imaging Spectroradiometer),
1U.S. Geological Survey, 926A National Center, Reston, VA 20192–0002.2Scott Polar Research Institute, University of Cambridge, Lensfield Road,
Cambridge CB2 1ER, United Kingdom.3U.S. Geological Survey, 384 Woods Hole Road, Woods Hole, MA
02543–1598.

2 Coastal-Change and Glaciological Map of the Ross Island Area, Antarctica: 1962–2005
and Landsat 7 Enhanced Thematic Mapper Plus (ETM+) data to compare changes that occurred during a 20- to 25- or 30-year time interval (or longer where data were available, as in the Antarctic Peninsula). The results of the analysis are being used to produce a digital database and a series of USGS Geologic Investigations Series Maps (I–2600) (Williams and others, 1995; Ferrigno and others, 2002, 2005, 2006, 2007, 2008, and 2009; Swithinbank and others, 2003a,b, 2004; and Williams and Ferrigno, 2005) (available online at http://www.glaciers.er.usgs.gov). Table 1 lists the USGS Geologic Investigations Series coastal-change and glaciological maps of Antarctica that have been published to date.
Objectives
The coastal-change and glaciological mapping project has five primary objectives:
1. to determine coastline changes that have occurred during the past three decades, or longer where addi-tional information exists;
2. to establish an accurate baseline series of 1:1,000,000-scale maps (fig. 1) that defines, from the analysis of Landsat and other satellite images, the glaciological characteristics (for example, floating ice, grounded ice, and so forth) of the coastline of Antarctica during three main time intervals: (1) early 1970s (Landsat 1, 2, or 3), (2) middle 1980s to early 1990s (Landsat 4 or 5), and (3) late 1990s to early 2000s (RADARSAT or Landsat 7 ETM+);
3. to determine velocities of outlet glaciers, ice streams, and ice shelves, and the position of the grounding line, from analysis of Landsat images and other sources;
Table 1. Coastal-change and glaciological maps of Antarctica at 1:1,000,000 scale, published to date.
[Information on ordering published maps can be obtained by calling the U.S. Geological Survey at 1-888-ASK-USGS or by visiting the USGS online at http://www.usgs.gov/pubprod]
As shown on index map
Map number Map name References (see References Cited) URL for online access
A
BCDEF
GHI
I–2600–A
I–2600–BI–2600–CI–2600–DI–2600–EI–2600–F (2d ed.)I–2600–GI–2600–HI–2600–I
Trinity Peninsula and South Shetland Islands
Larsen Ice ShelfPalmer LandRonne Ice ShelfEights CoastBakutis Coast
Saunders CoastNorthern Ross Ice ShelfRoss Island
Ferrigno and others (2006)
Ferrigno and others (2008)Ferrigno and others (2009)Ferrigno and others (2005)Swithinbank and others (2004)Swithinbank and others (2003b)
Swithinbank and others (2003a)Ferrigno and others (2007)This report
http://pubs.usgs.gov/imap/2600/A
http://pubs.usgs.gov/imap/2600/Bhttp://pubs.usgs.gov/imap/2600/Chttp://pubs.usgs.gov/imap/2600/Dhttp://pubs.usgs.gov/imap/2600/Ehttp://pubs.usgs.gov/imap/2600/F
http://pubs.usgs.gov/imap/2600/Ghttp://pubs.usgs.gov/imap/i-2600-hhttp://pubs.usgs.gov/imap/2600/I
Figure 1. Index map of the planned and published 1:1,000,000-scale coastal-change and glaciological maps of Antarctica. Ross Island area map is shaded. Maps published to date are indicated by letter and described in table 1. They are available printed and online; see table 1 for more information.
4. to compile a comprehensive inventory of named (from published maps) and unnamed (from analysis of Landsat images) outlet glaciers and ice streams in Antarctica that are mappable from Landsat and other satellite images or from ancillary sources (for example, maps, gazetteers, digital databases, and so forth) (Swithinbank, 1980, 1985; Alberts, 1981, 1995; National Science Foundation, 1989; British Antarctic Survey and others, 1993);
5. to compile a 1:5,000,000-scale map of Antarctica derived from the 1:1,000,000-scale maps. Each 1:1,000,000-scale map, apart from the three sheets covering the Antarctic Peninsula, extends to the southernmost nunatak within each map area or to the southernmost extent of Landsat images (about lat 81.5º S.). The coverage area of some maps (for example, those covering the Ronne and Filchner Ice Shelves) was extended farther south to encompass the entire ice shelf.
Sources
Most of the earlier maps in the Coastal-Change and Glaciological Maps of Antarctica series relied almost exclusively on Landsat and other satellite data as the source of information. The coverage areas of the Landsat 1, 2, and 3 MSS images, Landsat 4 and 5 MSS and TM images, and Landsat 7 ETM+ images used in the compilation of these maps are shown on the index maps contained on the margin of each map. Below the index maps, information about each image is listed.
On this map, the early Landsat 1 MSS scenes were acquired from 1973 to 1974. The Landsat 4 TM images date from 1988 to 1990. The Landsat 7 ETM+ images used in the analysis of coastline change were digital and date from 2001. Other satellite images used were AVHRR data from 2000 and 2001 and MODIS images from 2002, 2004, and 2005. The base for the map was the 1997 RADARSAT image mosaic. The 125-meter picture-element (pixel)-resolution 1997 RADARSAT image mosaic of Antarctica, compiled by The Ohio State University’s Byrd Polar Research Center (BPRC), was used both as a base for correct geographic position and geometric rectification of digitized Landsat imagery and as an additional source of coastal-change data.
In addition to incorporating Landsat and other satellite imagery, the three Antarctic Peninsula maps (Trinity Peninsula area and South Shetland Islands (map I–2600–A), Larsen Ice Shelf area (map I–2600–B), and Palmer Land area (map I–2600–C)) were compiled utilizing the abundance of current and historical vertical and (or) oblique aerial photographs and other source material archived by the British Antarctic Survey (BAS).
The source material for this map also included the large number of topographic and thematic maps produced for the Ross Island map area by the USGS and cooperators (see table 2 and map margin). The maps used for the compilation of this publication date from 1962 to 2003.
Although not completed in time to be used in this map compilation, the Landsat Image Mosaic of Antarctica (LIMA), using about 1,000 Landsat 7 ETM+ images acquired between 1999 and 2006 (USGS, 2007), was produced in a recent cooperative project between the USGS, the National Aeronautics and Space Administration (NASA), the National Science Foundation (NSF), and BAS. The mosaic is seamless,
Introduction 3
virtually cloud-free, and has been corrected for sun angle and elevation. It is the most geometrically accurate and highest resolution satellite mosaic of Antarctica produced to date and is a superb tool for glaciological studies. It is located online at http://lima.usgs.gov.
Methodology
The primary steps in the compilation of the Ross Island area map are listed and discussed below:
1. Identification of optimum Landsat MSS, TM, or ETM+ images for three time intervals (early 1970s, middle 1980s to early 1990s, and early 2000s);
2. Manual annotation of glaciological features by SCAR Code (Scientific Committee on Antarctic Research, 1980) or Antarctic Digital Database (ADD) Geocode (British Antarctic Survey and others, 1993; ADD Consortium, 2007) on 1:500,000-scale transparent overlays of Landsat images for both earlier time intervals and directly on the computer workstation monitor for the 1997 RADARSAT image mosaic and Landsat ETM+ images;
3. Positional control of mapped features. Because our goal is to produce the most accurate, high-resolution printed maps and digital databases of the coastal regions of Antarctica, we expended considerable thought and research on choosing the optimum method of geolocating mapped features. The decision was made to georegister the imagery and annota-tions to the 1997 RADARSAT image mosaic of Antarctica, in order to give the most geometrically accurate base then available. An added benefit was that the RADARSAT mosaic was compiled in polar stereographic projection, having a standard parallel at lat 71º S.— the same projection selected for the map series, making georegistration simpler—with due consideration given to scale distortion on map cover-age north and south of lat 71º S. (Sievers and Bennat, 1989). The primary benefit of the polar stereographic projection is cartographic continuity between adja-cent maps in the coverage provided of the coastal regions of Antarctica;
4. Scanning hard-copy photographic images to produce 400 dots-per-inch (dpi), 256-shade, gray-scale digi-tized satellite images. The digitized satellite images, and those already in digital format, were coregistered and geometrically corrected to the RADARSAT image mosaic using ERDAS Imagine software. Pass points were used for coregistration to geometrically fit the scenes to the RADARSAT base;
5. Addition of velocity vectors and geographic place-names; and addition of topographic contours at
4 Coastal-Change and Glaciological Map of the Ross Island Area, Antarctica: 1962–2005
selected intervals, generated from the BPRC Digital Elevation Model data and modified where necessary to be congruent with surface features;
6. Description of glaciological features (including the position of the grounding line) and analysis of ice-surface velocities of selected outlet glaciers and ice shelves.
RADARSAT Image Mosaic of Antarctica and its Geodetic Accuracy4
The 125-meter picture-element (pixel)-resolution RADARSAT image mosaic of Antarctica was used both as a base for correct geographic position and geometric rectification of digitized Landsat imagery and as an additional source of coastal-change data. The RADARSAT image mosaic is composed of data recorded from 9 September to 20 October 1997 and was selected as the most accurate base available at the time for geolocating the Landsat imagery; therefore, it was considered essential to confirm the published geodetic accuracy of the mosaic (±150 m; Noltimier and others, 1999). For a description of BPRC procedure for constructing the RADARSAT image mosaic, see Jezek, 1998; Norikane and others, 1998; and Liu, 1999. The USGS analysis is described more fully in earlier coastal-change maps (see USGS Maps I–2600–D through H).
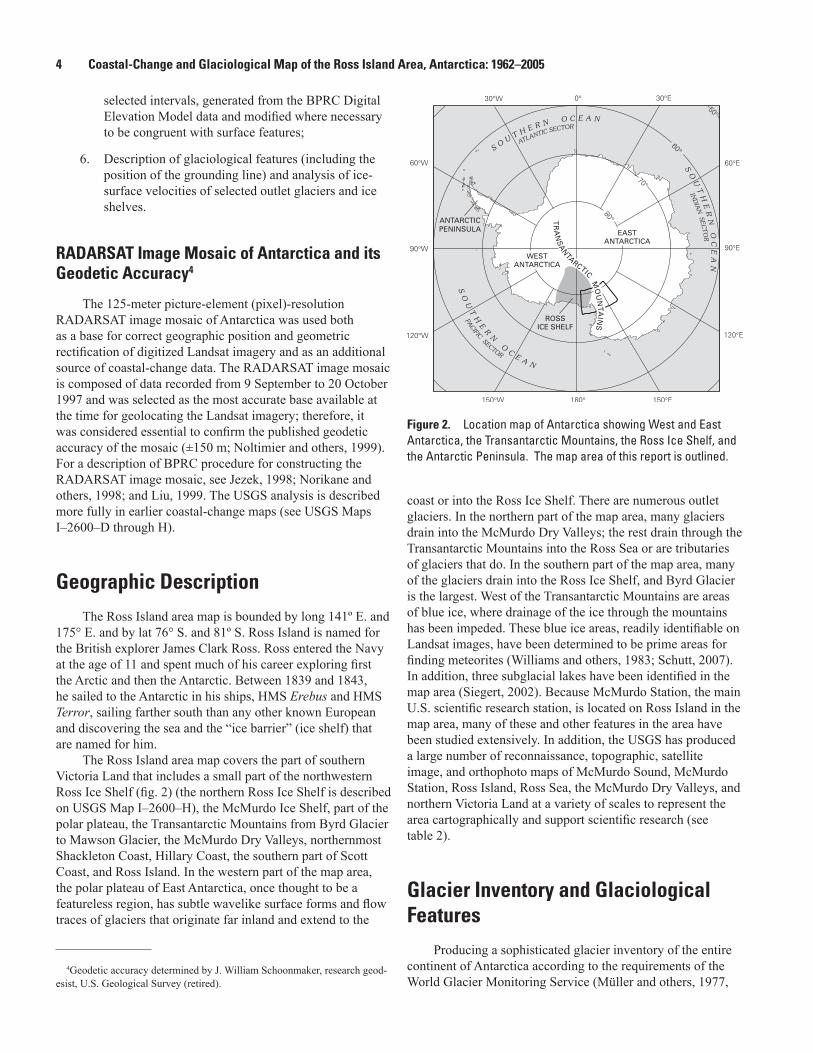
Geographic DescriptionThe Ross Island area map is bounded by long 141º E. and
175° E. and by lat 76° S. and 81º S. Ross Island is named for the British explorer James Clark Ross. Ross entered the Navy at the age of 11 and spent much of his career exploring first the Arctic and then the Antarctic. Between 1839 and 1843, he sailed to the Antarctic in his ships, HMS Erebus and HMS Terror, sailing farther south than any other known European and discovering the sea and the “ice barrier” (ice shelf) that are named for him.
The Ross Island area map covers the part of southern Victoria Land that includes a small part of the northwestern Ross Ice Shelf (fig. 2) (the northern Ross Ice Shelf is described on USGS Map I–2600–H), the McMurdo Ice Shelf, part of the polar plateau, the Transantarctic Mountains from Byrd Glacier to Mawson Glacier, the McMurdo Dry Valleys, northernmost Shackleton Coast, Hillary Coast, the southern part of Scott Coast, and Ross Island. In the western part of the map area, the polar plateau of East Antarctica, once thought to be a featureless region, has subtle wavelike surface forms and flow traces of glaciers that originate far inland and extend to the
Figure 2. Location map of Antarctica showing West and East Antarctica, the Transantarctic Mountains, the Ross Ice Shelf, and the Antarctic Peninsula. The map area of this report is outlined.
coast or into the Ross Ice Shelf. There are numerous outlet glaciers. In the northern part of the map area, many glaciers drain into the McMurdo Dry Valleys; the rest drain through the Transantarctic Mountains into the Ross Sea or are tributaries of glaciers that do. In the southern part of the map area, many of the glaciers drain into the Ross Ice Shelf, and Byrd Glacier is the largest. West of the Transantarctic Mountains are areas of blue ice, where drainage of the ice through the mountains has been impeded. These blue ice areas, readily identifiable on Landsat images, have been determined to be prime areas for finding meteorites (Williams and others, 1983; Schutt, 2007). In addition, three subglacial lakes have been identified in the map area (Siegert, 2002). Because McMurdo Station, the main U.S. scientific research station, is located on Ross Island in the map area, many of these and other features in the area have been studied extensively. In addition, the USGS has produced a large number of reconnaissance, topographic, satellite image, and orthophoto maps of McMurdo Sound, McMurdo Station, Ross Island, Ross Sea, the McMurdo Dry Valleys, and northern Victoria Land at a variety of scales to represent the area cartographically and support scientific research (see table 2).
Glacier Inventory and Glaciological Features
Producing a sophisticated glacier inventory of the entire continent of Antarctica according to the requirements of the World Glacier Monitoring Service (Müller and others, 1977,
4Geodetic accuracy determined by J. William Schoonmaker, research geod-esist, U.S. Geological Survey (retired).

Coastal-Change Analysis—Discussion of Selected Glaciological Features 5
1978), as part of its ongoing “World Glacier Inventory” program, has been impossible with the present state of glaciological knowledge about Antarctica (Swithinbank, 1980). As recently as 2009, the World Glacier Inventory Web site hosted by the National Snow and Ice Data Center (NSIDC) did not include Antarctic data. However, as more remotely sensed data become available, and as more scientific interest is focused on Antarctica, more glacier inventories will be developed, especially for localized areas. The first glacier inventory carried out in Antarctica using the methodology of the World Glacier Inventory was done on the northern end of the Antarctic Peninsula on James Ross Island by Rabassa and others (1982). Braun and others (2001) proposed a geographic information system (GIS)-based glacier inventory for the Antarctic Peninsula as part of the Global Land Ice Measurements from Space (GLIMS) Project (Kieffer and others, 2000), and Rau and others (2004) carried out a comprehensive GIS inventory of 900 individual glaciers and glaciological features in the northern part of the Antarctic Peninsula.
Because of the glaciological complexity and the large number of unnamed and unidentified glaciers in the map area, we have not attempted to compile a comprehensive glacier inventory of the unnamed glaciers. Instead, we have compiled a list of named glaciers and related glaciological features within the Ross Island map area, gathered from published maps, the USGS Geographic Names Information System (GNIS) database (http://geonames.usgs.gov/antarctic/index.html), and the SCAR Composite Gazetteer of Antarctica (http://data.aad.gov.au/aadc/gaz/scar/). This list is presented in table 3.
The map area has an amazing variety of glaciological features. There are 323 named glaciers and related glaciological features on the map as defined in various scientific glossaries (Armstrong and others, 1973, 1977; Neuendorf and others, 2005). The named features include outlet, valley, and cirque glaciers, and ice shelves, ice piedmonts, snowfields, ice fields, icefalls, and glacier tongues (table 3).
Coastal-Change Analysis—Discussion of Selected Glaciological Features
As would be expected, floating ice fronts, iceberg tongues, and glacier tongues are the most dynamic and changeable features in the coastal regions of Antarctica. On this map, unlike most of the previous maps in this series, the ice fronts do not show much change. The positions of the ice fronts as observed on the three sets of Landsat imagery and on other satellite imagery were mapped and annotated with the date for each position. This made it possible to date and analyze changes that have occurred. The only noticeable change, however, is along the front of the McMurdo Ice Shelf, where recession of a few kilometers to as much as 5 km
occurred between January 1974 and October 1997. As a result, the following discussion focuses on the glaciological features of the area.
Glaciers that Drain from or through the Transantarctic Mountains
Byrd GlacierByrd Glacier is one of the largest valley glaciers in the
world and possibly the most active glacier draining the polar plateau of East Antarctica. It has surface velocities of more than 800 m a-1, as fast as some surging glaciers. Byrd Glacier is more than 180 km long and is 22 km wide at its narrowest point (Swithinbank, 1988). It drains an area greater than 1 x 10⁶ km2 and is the largest single source of ice (more than 18 km3 a-1) flowing into the western margin of the Ross Ice Shelf. Its flow pattern can be followed across the Ross Ice Shelf to the Ross Sea. In spite of its size and importance, it was not well known or named before 1960 (Swithinbank, 1963). The entire length of Byrd Glacier was not successfully imaged by moderate-resolution satellite imagery until 1982, when Landsat 4 with its more southerly orbit was able to view the upper region of the glacier (Swithinbank, 1988).
Because of the fact that Byrd Glacier provides the primary outflow for a major part of East Antarctica, studies have been made of its current and past behavior to help predict its future and to understand its role in influencing the mass balance of the entire East Antarctic ice sheet. Work was first done on Byrd Glacier as part of the International Geophysical Year (IGY). Swithinbank’s measurements, made between 1960 and 1962, of seven glaciers flowing into the Ross Ice Shelf discovered the overwhelming contribution of the outflow of Byrd Glacier (Swithinbank, 1963). In 1978 and 1979, extensive field studies were carried out on the glacier as part of the Byrd-Darwin Glacier project. The studies included aerial photography, radio echo sounding, ground-survey ice sampling, and ablation measurements (Hughes, 1979; Hughes and Fastook, 1981). Brecher (1982) used stereographic vertical aerial photographs to photogrammetrically determine surface velocities and elevations. He calculated a maximum surface velocity of 875 m a-1 well upstream of the glacier mouth. All velocities compared well with Swithinbank’s 1960–62 measurements and with the 1978–79 field measurements. Brecher (1962) also compared the 1978–79 aerial photographs with aerial photographs acquired in 1960 and 1963; he determined that there was no appreciable change in the surface elevation during the time interval. Further surface-velocity measurements were made by Lucchitta and Ferguson (1986) using Landsat MSS data from January 1974 and November 1983. Their average velocities were between 750 and 800 m a-1, about the same as the earlier measurements. In contrast, recent ice-velocity measurements acquired using 2000–2001 Advanced Spaceborne Thermal Emission and Reflectance
6 Coastal-Change and Glaciological Map of the Ross Island Area, Antarctica: 1962–2005
(ASTER) imagery by Stearns and Hamilton (2005) showed substantial deceleration of Byrd Glacier. Parts of the glacier that had been flowing at 850 m a-1 in 1978–79 were flowing at 650 m a-1 in the ASTER data, indicating the flow of this glacier is very dynamic and changeable over time.
Models to describe the dynamics of Byrd Glacier were made using the 1978–79 field data and radio-echo sounding data. Reusch and Hughes (2003) suggest that Byrd Glacier may be undergoing rapid changes based on evidence of ice flux, information on basal melting (Rignot and Thomas, 2002), and a position for the grounding line (Rignot and Thomas, 2002) that is 20 km farther inland than where it was located by Hughes and Fastook (1981). Kenneally and Hughes (2004) suggest that if the grounding line is retreating upglacier, this eventually could lead to the drawdown of ice from the interior of East Antarctica.
Darwin GlacierDarwin Glacier, more than 90 km long and 3 km wide,
is a large glacier that flows from the Darwin Mountains into the Ross Ice Shelf. The lower part of the glacier was first mapped in the early 1900s by the British National Antarctic Expedition. The glacier was visited by the Commonwealth Trans-Antarctic Expedition in 1956–58. In 1978–79, the Byrd-Darwin Glacier field project visited Darwin Glacier. Although most of the focus of the project was on Byrd Glacier, ice-surface-velocity measurements were made on Darwin Glacier and indicated a maximum surface velocity of 100 m a-1 (Hughes, 1979; Hughes and Fastook, 1981).
Hatherton GlacierHatherton Glacier is a large glacier, approximately 3 km
wide and more than 60 km long. It is a tributary to Darwin Glacier, which it joins after flowing through the Transantarctic Mountains. Both Darwin and Hatherton Glaciers are ice starved, with little to no flow from the polar plateau and little contribution to the Ross Ice Shelf. A modeling study of the response of Hatherton Glacier to Ross Ice Sheet grounding-line retreat in the Holocene was carried out by Anderson and others (2004) to contribute to the understanding of present and future grounding-line retreat of the West Antarctic ice sheet.
Mulock GlacierMulock Glacier is a large glacier, more than 80 km long
and about 12 km wide, that drains the polar plateau. Less than half as wide as Byrd Glacier, it is still considered an important outlet glacier. Its surface elevation is 1,400 m at the plateau and decreases to 100 m where it joins the Ross Ice Shelf (Swithinbank, 1988). Swithinbank (1963) made surface-velocity measurements during 1960–62 to assess the overall contribution of several outlet glaciers to the total regime of the
Ross Ice Shelf. The surface velocity of Mulock Glacier was measured at about 390 m a-1 near its mouth, contributing 5.6 km3 a-1 of ice to the shelf. Scambos and others (http://nsidc.org/data/velmap/ross_shelf/ross_nw/ross_nw_vel.html) used Landsat imagery from 1989 to calculate ice-surface velocity. Their results were similar to the earlier measurements, with velocities at the grounding line about 350 to 400 m a-1, increasing to more than 700 m a-1 as the glacier moved into the Ross Ice Shelf.
Skelton GlacierSkelton Glacier is a large glacier flowing from Skelton
Névé, from which it gets most, if not all, of its nourishment, into the Ross Ice Shelf. It is about 130 km long, and its maximum thickness is 1,450 m. Its surface drops from 2,200 m on the plateau to 100 m at the grounding line. The glacier was the route for traveling from the Ross Ice Shelf to the polar plateau by the Commonwealth Trans-Antarctic Expedition in 1956–58 and the Victoria Land Traverse in 1958– 59. During the latter ascent, seismic, gravity, magnetic, and glaciological studies were made. The glaciological studies included ice-thickness and ice-movement measurements. At the mouth of the glacier, the ice thickness ranged from 490 to 600 m, the ice-surface velocity averaged about 89 m a-1, and the discharge to the shelf was only 0.8 km3 a-1 of ice (Wilson and Crary, 1961). As a result, Skelton Glacier has very little effect on the flow of the ice shelf. During the 1960–61 geophysical traverse from McMurdo Station to the South Pole, Skelton Glacier was also the route chosen to access the polar plateau.
Koettlitz GlacierKoettlitz Glacier drains from Koettlitz Névé in the
Transantarctic Mountains and flows between Brown Peninsula and the mainland, entering McMurdo Sound near Cape Chocolate. Koettlitz Glacier is more than 75 km long, and its tongue is afloat for at least 25 km. It has received scientific attention since the days of Scott’s expeditions (1910–13) because of the fish and marine invertebrates found on its surface. The hypothesis that the surface distribution of marine fauna was explained by freezing of marine organisms to the base of the ice shelf (basal freezing) and gradual migration upward to the surface (surface ablation) was confirmed by Gow and Epstein (1972). Gow and Govoni (1994) used map data, field observations, and remotely sensed data to observe the retreat of the ice front from 1910–13 to 1992; they estimated that more than 300 km2 of ice had calved off the glacier tongue during that 80-year period.
Erebus Glacier Tongue
A small but distinctive feature on the map, due to its serrated edges, is the Erebus Glacier Tongue, the extension of Erebus Glacier into Erebus Bay. Erebus Glacier Tongue is

Coastal-Change Analysis—Discussion of Selected Glaciological Features 7
unusually long (14 km) and unusually narrow, averaging only about 1.5 km in width (Delisle and others, 1989). The tongue was originally mapped by the British National Antarctic Expedition under Scott (1901–04) and has been intensively studied with radio-echo sounding and other techniques since 1967. It is floating for about 13.5 km of its length (Delisle and others, 1989). According to Holdsworth (1974, 1982), it is 350 m thick at the grounding line and thins to 120 m at its seaward end. Holdsworth (1974) measured an ice-surface velocity at the seaward end of 165 m a-1, but Delisle and others (1989) cited an average velocity of 140 m a-1. Holdsworth (1974) determined that the glacier tongue has a calving recurrence interval of 30 years, but according to Delisle and others (1989), the last calving event occurred about 1944 and was long overdue. The delay in calving may have been due, in part, to buffering by the sea ice that surrounds the glacier tongue.
McMurdo Dry Valleys
The McMurdo Dry Valleys region on this map, extending roughly from lat 76.5º S. to 78.5º S. and from long 160º E. to 164.5º E., is an area of about 16,000 km2, of which approximately 2,000 km2 is essentially snow free (Chinn, 1988). The three major, mostly ice-free valleys are Taylor, Wright, and Victoria Valleys. There are three main types of glaciers in the region. Outlet glaciers from the East Antarctic ice sheet enter the valleys from the west. The mountain ranges between the valleys support alpine glaciers, and piedmont glaciers are located along the coast (Chinn, 1988). Chinn (1988) thought and Fountain and others (2006) showed that the alpine glaciers were approximately in equilibrium. Glacier velocities in the area are typically very slow, generally 1 m a-1 or less, with the maximum of 3 m a-1 measured on Meserve Glacier (Chinn, 1988; Fountain and others, 2006). But Chinn (1998) stated that if it is taken into consideration that the flow and ablation regimes of the McMurdo Dry Valleys’ glaciers are two orders of magnitude slower than those of temperate glaciers, then the glaciers actually are fluctuating as dynamically as temperate glaciers. Because the McMurdo Dry Valleys are so close to McMurdo Station, many studies have been carried out on the glaciers there. Some of the more comprehensive include Chinn (1980, 1985, 1998), Fountain and others (1998, 2004, 2006), and Fountain and Lyons (2003). Interesting work was done by MacClune and others (2003), who considered that the conditions of high sublimation, low melting, and dust accumulation made the glaciers in the McMurdo Dry Valleys terrestrial analogs for Martian ice caps.
Icebergs
Large icebergs have not calved in the map area recently, but icebergs that have calved and drifted westward from the eastern part of the Ross Ice Shelf have impacted the wildlife
on Ross Island and impeded access to McMurdo Station. In the last decade, several very large icebergs calved from the front of the eastern part of the Ross Ice Shelf (Ferrigno and others, 2007). On 17 March 2000, one of the largest tabular icebergs ever recorded was seen; it was named B-15. It calved from west of Roosevelt Island along rifts that had been observed on satellite imagery for several years (Lazzara and others, 1999). It was 295 km long, 37 km wide, and had an area of about 10,000 km2. Soon afterward, several new icebergs were formed by the breaking of B-15 into smaller pieces (B-15A, B, C, and D) and by the collision of B-15 with the ice shelf (B-16, -17, -18, and -19, and C-16). B-15A, the largest remnant of the original B-15, and C-16 drifted west until they collided with Ross Island in December 2001 and December 2000, respectively, where they remained until at least October 2003. The icebergs disrupted ocean circulation, shipping, and marine life. MacAyeal and others (2003) placed automatic weather stations, ice-sounding radar, seismometers, and tracking devices on B-15A and C-16 for detailed monitoring and to model the effects of future climate change on the ice shelves of Antarctica. See Ferrigno and others (2007) for additional discussion of the calving of these and other icebergs from the Ross Ice Shelf.
Ice Cores
Antarctic ice cores are a unique and powerful resource for studying climate change (Wolff, 2005). Both shallow and deep cores have yielded important information in many parts of the continent. The International Trans-Antarctic Scientific Expedition (ITASE), planned for the continent-wide collection and interpretation of environmental data, has included ice-core drilling in its program to reconstruct the last approximately 200 years of climate change, or longer where data are available (http://www2.umaine.edu/itase/). Since 1968, deep ice cores have been drilled in Antarctica that have yielded information on previous climate for several hundreds of thousands of years. In 1968, the first core to extend through the ice sheet and reach bedrock was drilled at Byrd Station (lat 80° S., long 119.5° W.). It was 2,191 m long and was dated at more than 50,000 years (Hammer and others, 1994). The 3,623-m Vostok core (drilled in different intervals from 1970 to 1998) gave information from the last four glacial-interglacial cycles, extending back about 420,000 years (Petit and others, 1999). The first Dome Fuji (lat 77°19´ S., long 39°42´ E.) deep ice core, drilled in 1995 and 1996, was 2,500 m long and extended back 340,000 years (Watanabe and others, 1999; Kawamura and others, 2007). Another deep core from Dome Fuji, drilled from 2003 to 2007 and 3,035 m long, may cover as many as 720,000 years (Motoyama, 2007). The Dome Charlie (C) ice core (lat 75°06´ S., long 123°24´ E.) has reached the oldest ice to date. Drilled from 1999 to 2004, it was 3,270 m long and reached ice extending back more than 800,000 years and covering at least eight glacial cycles (EPICA, 2004).

8 Coastal-Change and Glaciological Map of the Ross Island Area, Antarctica: 1962–2005
On this map sheet, Taylor Dome (lat 77°40´ S., long 157°40´ E.), which receives ice from Dome Charlie and drains to the Ross Sea through Scott Coast (Frezzotti and others, 2000), is the location of an ice-drilling project that successfully reached bedrock at a depth of 554 m. The project was started in 1990–91, and drilling, which was begun in 1991–92, was completed in the 1993–94 season. The Taylor Dome ice core, containing a paleoclimatic record longer than 130,000 years, was only the second (after Vostok) to provide a stratigraphically undisturbed record through the entire last glacial cycle. Because the core is relatively shallow, it has provided excellent CO2 and δ 13C (proxy temperature) measurements (http://depts.washington.edu/isolab/taylor). Reviews of the project and results are in Morse and others (1999) and Steig and others (2000).
Blue-Ice Areas and Meteorites
Areas of bare glacier ice, turquoise-blue in color, contrasting sharply with the more extensive white snow cover, occur in many parts of Antarctica and are called “blue ice,” a term first used by the Swedish glaciologist Valter Schytt (1961) during the 1944–52 Norwegian-British-Swedish Expedition to Queen Maud Land. Blue ice is found primarily near coastal mountains and nunataks but can appear in the interior within the main flow of the ice sheet. Blue-ice areas became linked with the search for meteorites in 1970. From earliest exploration until 1969, only four meteorites had been found in Antarctica, all during overland traverses, and it was thought that there were extremely limited opportunities for finding meteorites in Antarctica. During the 1969–70 Antarctic field season, Japanese scientists found nine meteorites in a blue-ice area of the Queen Fabiola (Yamato) Mountains (Yoshida and others, 1971) and many more in succeeding years. This unexpected discovery suggested that blue-ice areas might be a rich source of meteorites. In 1975, the United States inaugurated a search program (Antarctic Search for Meteorites, ANSMET) that first focused in the blue-ice areas around the Allan Hills in cooperation with Japanese scientists; eleven meteorites were found (Cassidy, 1977). The successful search soon expanded to other areas and found increasing numbers of specimens. Since then, international search teams have located about 35,000 specimens in Antarctica (Schutt, 2007).
Blue ice occurs in areas of low accumulation (less snowfall), high ablation, high wind speed (removes snow and increases ablation), and slow horizontal motion (Annexstad, 1982), where the ice movement is completely or partly blocked by subglacier or subaerial mountain ranges. A meteorite fall is a rare occurrence, and slow ice flow against a blockage concentrates meteorites on an ablating surface. Low temperatures also slow the deterioration of meteorites that are not in chemical equilibrium at the Earth’s surface (Cassidy and others, 1992). The co-location of meteorites and blue ice has yielded information for both the meteorite
and glaciological scientific communities. Blue-ice areas have also been investigated for use as aircraft landing sites for wheeled aircraft (Mellor and Swithinbank, 1989; Swithinbank, 1989, 1991). The idea has proved valid and has been used and developed by private and government entities of several countries.
It was recognized early in the search for meteorites that identification of blue-ice areas, using aerial reconnaissance or inspection of satellite imagery, could greatly aid the search, and a suggestion was made to compile a thematic map of the continent using satellite imagery (Williams and others, 1982, 1983). The Japanese produced early maps of the meteorite locations in the Yamato Mountains and the Allan Hills (Yanai, 1983, 1984). A concerted effort to map meteorite locations grew out of the need to document, present, and maintain ANSMET location data (Antarctic Meteorite Location and Mapping Project, AMLAMP) (Schutt and others, 1989, 1993). Thematic maps were produced until 1994, but currently mapping is being done in the ESRI ArcGIS environment (Schutt, 2007).
Meteorites have been found in East Antarctica in the Yamato and Sør Rondane Mountains and along the Transantarctic Mountains. The greatest number have been found in the Yamato and Sør Rondane Mountains and the nearby area (more than 16,500 meteorites as of 2008, according to Japan’s National Institute of Polar Research, Antarctic Meteorite Research Center Web site (http://www.nipr.ac.jp/english/r_centers/t04_amrc.html)), but the greatest extent is along the Transantarctic Mountains, where the flow of the East Antarctic ice sheet has been obstructed. Several of the sites are located on this map sheet. The Allan Hills-David Glacier region (David Glacier is about 75 km north of the map area) includes numerous meteorites from the Allan Hills, Elephant Moraine, and Reckling Moraine areas and has yielded approximately 3,400 meteorite specimens. The McMurdo Dry Valleys region has yielded a few meteorites, and the Darwin-Byrd Glacier region has yielded more than 1,100 specimens, mostly from the Meteorite Hills (Schutt 2007). Harvey (2003) gave a comprehensive discussion of the origin and significance of Antarctic meteorites.
Subglacial Lakes
Subglacial lakes were first recognized in Antarctica in airborne radio-echo sounding records in the late 1960s by Robin and others (1970). Oswald and Robin (1973) counted 17 of these lakes at the base of the ice sheet beneath several thousand meters of ice. Since then, new data and re-evaluation of older data have increased the number of recognized lakes to 77 (Siegert and others, 1996), and 145 (Siegert and others, 2005). It is worth noting that although the data do not cover the whole continent, subglacial lakes have been found in much of the data, suggesting they exist continent-wide. The lakes range in size from about 500 m in length to the largest known lake, Vostok Subglacial Lake. Vostok, first described
References Cited 9
by Kapitsa and others (1996), has been studied intensively and is now recognized to have maximum dimensions of 250 km by 80 km and a total area of 14,000 km2 (Siegert and others, 2005). Most subglacial lakes are located in the interior of the ice sheet where surface slopes, ice velocity, and surface accumulation are low (Siegert, 2002). Dowdeswell and Siegert (2002) divided subglacial lakes into three types based on location: (1) lakes in subglacial basins in the ice-sheet interior, (2) lakes on the flanks of subglacial mountains, and (3) lakes near the onset region of enhanced glacier flow. Sixteen lakes fall into the last category and of these, three occur near the onset of fast flow into Byrd Glacier (Siegert, 2002), the glacier that is a major glaciological feature on this map. Subglacial lakes, especially Vostok Subglacial Lake, are of interest because of the possible inclusion of unique life forms that may indicate if life can exist in harsh conditions in other parts of the solar system and help explain the processes that triggered the evolutionary explosion on Earth. Also their presence may help decipher the geologic history of Antarctica, including the location and dynamics of paleo-ice sheets (Bell and Karl, 1998).
SummaryThe analysis of Landsat 1 MSS images (1973 to 1974),
Landsat 4 TM images (1988 to 1990), Landsat 7 ETM+ images (2001), and other satellite imagery and historical data of the Ross Island area made it possible to identify and describe glaciological features. Little noticeable change has occurred in the ice fronts on the map, with the exception of overall recession in the McMurdo Ice Shelf area of up to 5 km between 1974 and 1997. Therefore the discussion is focused on a review of selected glaciers that flow from or through the Transantarctic Mountains including Byrd, Darwin, Mulock, Skelton, and Koettlitz Glaciers. The following glaciological topics are also reviewed: the Erebus Glacier Tongue, investigations in the McMurdo Dry Valleys, and iceberg calving, ice cores, subglacial lakes, and the relation of blue ice to accumulation of meteorites.
AcknowledgmentsWe would like to acknowledge the outstanding support
provided for the preparation of this map by numerous individuals. Charles Swithinbank’s participation in the project was made possible by the much-appreciated support of Jerry C. Comati, Chief, Environmental Sciences Branch, U.S. Army Research, Development, and Standardization Group (London, United Kingdom) of the U.S. Army Materiel Command. We are indebted to Dann S. Blackwood, USGS (Woods Hole, Mass.) and the late Lewis V. Thompson, USGS (Reston, Va.) for assistance with custom photographic processing of Landsat images. For the map series, James R. Estabrook,
USGS (Reston, Va.) provided superb and thorough map and text edits, and D. Paul Mathieux, USGS (Reston, Va.) created excellent computer graphics. John Splettstoesser and Andrew Fountain provided very helpful reviews. Funding for the project was provided by the USGS commitment to the multi-Federal agency U.S. Climate Change Science Program.
References Cited
ADD Consortium, 2007, Antarctic Digital Database, Version 5.0: Cambridge, United Kingdom, Scientific Committee on Antarctic Research, digital data and documentation. (Available online at http://www.add.scar.org:8080/add/)
Alberts, F.G., comp. and ed., 1981, Geographic names of the Antarctic (Names approved by the United States Board on Geographic Names [1st ed.]: Washington, D.C., National Science Foundation [Report] NSF 81–5, 959 p.
Alberts, F.G., comp. and ed., 1995, Geographic names of the Antarctic, second edition, 1995—Names approved by the United States Board on Geographic Names: Arlington, Va., National Science Foundation [Report] NSF 95–157, 834 p. (Antarctic place-names can also be found online at http://geonames.usgs.gov/antarctic/index.html)
Anderson, B.M., Hindmarsh, R.C.A., and Lawson, W.J., 2004, A modeling study of the response of Hatherton Glacier to Ross Ice Sheet grounding line retreat: Global and Planetary Change, v. 42, no. 1-4, p. 143–153.
Annexstad, J.O., 1982, Geology and glaciology of selected blue-ice regions in Antarctica, in Bull, Colin, and Lipschutz, M.E., eds., Workshop on Antarctic glaciology and meteorites, Houston, Texas, April 19–20, 1982: Lunar and Planetary Institute Technical Report 82-03, p. 36–37.
Armstrong, Terence, Roberts, Brian, and Swithinbank, Charles, 1973, Illustrated glossary of snow and ice (2d ed.): Cambridge, United Kingdom, Scott Polar Research Institute, Special Publication 4, 60 p.
Armstrong, Terence, Roberts, Brian, and Swithinbank, Charles, 1977, Proposed new terms and definitions for ice features: Polar Record, v. 18, no. 116, p. 501–502.
Bell, R.E., and Karl, D.M., 1998, Lake Vostok; a curiosity or a focus for interdisciplinary study?: National Science Foundation Sponsored Workshop, Washington, D.C., September 7–8, 1998, Final Report. (Also available online at http://www.ldeo.columbia.edu/res/pi/vostok)
Braun, Matthias, Rau, F[rank], and Simöes, J.C., 2001, A GIS-based glacier inventory for the Antarctic Peninsula and the South Shetland Islands; a first case study on King George Island: Geo-Spatial Information Science Quarterly, v. 2, no. 2, p. 15–24.
10 Coastal-Change and Glaciological Map of the Ross Island Area, Antarctica: 1962–2005
Brecher, H.H., 1982, Photogrammetric determination of surface velocities and elevations on Byrd Glacier: Antarctic Journal of the United States, v. 17, no. 5, p. 79–81.
British Antarctic Survey (BAS), Scott Polar Research Institute (SPRI), and World Conservation Monitoring Centre (WCMC), 1993, Antarctic digital database (CD-ROM) with accompanying user’s guide and reference manual, version 1.0: Cambridge, United Kingdom, Scientific Committee on Antarctic Research, 156 p. Updated versions of the database (currently, ADD Version 5.0, with additional generalized map products, improved coastlines, and corrected contours in some areas) have been released (see ADD Consortium, 2007).
Cassidy, W.A., 1977, Antarctic search for meteorites: Antarctic Journal of the United States, v. 12, no. 4, p. 96–98.
Cassidy, William, Harvey, Ralph, Schutt, John, Delisle, Georg, and Yanai, Keizo, 1992, The meteorite collection sites of Antarctica: Meteoritics, v. 27, no. 5, p. 490–525.
Chinn, T.J., 1980, Glacier balances in the Dry Valleys area, Victoria Land, Antarctica: IAHS [International Association of Hydrological Sciences]-AISH Publication 126, p. 237–247.
Chinn, T.J., 1985, Structure and equilibrium of the Dry Valleys glaciers: New Zealand Antarctic Record, v. 6, Supplement, p. 73–88.
Chinn, T.J., 1988, The ‘Dry Valleys’ of Victoria Land, in Swithinbank, Charles, Antarctica, chap. B of Williams, R.S., Jr., and Ferrigno, J.G., eds., Satellite image atlas of glaciers of the world: U.S. Geological Survey Professional Paper 1386, p. B39–B41. (Also available online at http://pubs.usgs.gov/pp/p1386b)
Chinn, T.J., 1998, Recent fluctuations of the Dry Valleys glaciers, McMurdo Sound, Antarctica: Annals of Glaciology, v. 27, p. 119–124.
Davis, C.H., Li, Yonghong, McConnell, J.R., Frey, M.M., and Hanna, Edward, 2005, Snowfall-driven growth in East Antarctic Ice Sheet mitigates recent sea-level rise: Science, v. 308, no. 5730, p. 1898–1901.
Delisle, G., Chinn, T., Karlen, W., and Winters, P., 1989, Radio echo-sounding of Erebus Glacier Tongue: New Zealand Antarctic Record, v. 9, no.1, p. 15–30.
Dowdeswell, J.A., and Siegert, M.J., 2003, The physiography of modern Antarctic subglacial lakes: Global and Planetary Change, v. 35, no. 3-4, p. 221–236.
EPICA community members, 2004, Eight glacial cycles from an Antarctic ice core: Nature, v. 429, no. 6992, p. 623–628. (Also available online at http://www.nature.com/nature/archive/index.html)
Ferrigno, J.G., and Gould, W.G., 1987, Substantial changes in the coastline of Antarctica revealed by satellite imagery: Polar Record, v. 23, no. 146, p. 577–583.
Ferrigno, J.G., Williams, R.S., Jr., and Thomson, J.W., 2002, Coastal-change and glaciological maps of the Antarctic Peninsula: U.S. Geological Survey Fact Sheet FS–017–02, 2 p. (Also available online at http://pubs.usgs.gov/fs/fs17-02/)
Ferrigno, J.G., Foley, K.M., Swithinbank, Charles, Williams, R.S., Jr., and Dailide, L.M., 2005, Coastal-change and glaciological map of the Ronne Ice Shelf area, Antarctica: 1974–2002: U.S. Geological Survey Geologic Investigations Series Map I–2600–D, 1 sheet, scale 1:1,000,000, with 11-p. pamphlet. (Also available online at http://pubs.usgs.gov/imap/2600/D/)
Ferrigno, J.G., Cook, A.J., Foley, K.M., Williams, R.S., Jr., Swithinbank, Charles, Fox, A.J., Thomson, J.W., and Sievers, Jörn, 2006, Coastal-change and glaciological map of the Trinity Peninsula area and South Shetland Islands, Antarctica: 1843–2001: U.S. Geological Survey Geologic Investigations Series Map I–2600–A, 1 sheet, scale 1:1,000,000, with 32-p. pamphlet. (Also available online at http://pubs.usgs.gov/imap/2600/A/)
Ferrigno, J.G., Foley, K.M., Swithinbank, Charles, and Williams, R.S., Jr., 2007, Coastal-change and glaciological map of the northern Ross Ice Shelf area, Antarctica: 1962–2004: U.S. Geological Survey Geologic Investigations Series Map I–2600–H, 1 sheet, scale 1:1,000,000, with 11-p. pamphlet. (Also available online at http://pubs.usgs.gov/imap/i-2600-h)
Ferrigno, J.G., Cook, A.J., Mathie, A.M., Williams, R.S., Jr., Swithinbank, Charles, Foley, K.M., Fox, A.J., Thomson, J.W., and Sievers, Jörn, 2008, Coastal-change and glaciological map of the Larsen Ice Shelf area, Antarctica: 1940–2005: U.S. Geological Survey Geologic Investigations Series Map I–2600–B, 1 sheet, scale 1:1,000,000, with 28-p. pamphlet. (Also available online at http://pubs.usgs.gov/imap/2600/B/)
Ferrigno, J.G., Cook, A.J., Mathie, A.M., Williams, R.S., Jr., Swithinbank, Charles, Foley, K.M., Fox, A.J., Thomson, J.W., and Sievers, Jörn, 2009, Coastal-change and glaciological map of the Palmer Land area, Antarctica: 1947–2009: U.S. Geological Survey Geologic Investigations Series Map I–2600–C, 1 sheet, scale 1:1,000,000, with 28-p. pamphlet. (Also available online at http://pubs.usgs.gov/imap/2600/C/)
Fountain, A.G., and Lyons, W.B., 2003, Century to millennial scale climate change and ecosystem response in Taylor Valley, Antarctica, in Greenland, David, Goodin, D.G., and Smith, R.C., eds., Climate variability and ecosystem response at Long-Term Ecological Research sites: New York, Oxford University Press, p. 319–340.

References Cited 11
Fountain, A.G., Dana, G.L., Lewis, K.J., Vaughn, B.H., and McKnight, D.M., 1998, Glaciers of the McMurdo Dry Valleys, southern Victoria Land, Antarctica, in Priscu, J.C., ed., Ecosystem dynamics in a polar desert; the McMurdo Dry Valleys, Antarctica: Antarctic Research Series, v. 72, p. 65–75.
Fountain, A.G., Neumann,T.A., Glenn, P.L., and Chinn, T.J., 2004, Can climate warming induce glacier advance in Taylor Valley, Antarctica?: Journal of Glaciology, v. 50, no. 171, p. 556–564.
Fountain, A.G., Nylen, T.H., MacClune, K.L., and Dana, G.L., 2006, Glacier mass balances (1993–2001), Taylor Valley, McMurdo Dry Valleys, Antarctica: Journal of Glaciology, v. 52, no. 178, p. 451–462.
Frezzotti, Massimo, Tabacco, I.E., and Zirizzotti, Achille, 2000, Ice discharge of eastern Dome C drainage area, Antarctica, determined from airborne radar survey and satellite image analysis: Journal of Glaciology, v. 46, no 153, p. 253–264.
Gow, A.J., and Epstein, Samuel, 1972, On the use of stable isotopes to trace the origins of ice in a floating ice tongue: Journal of Geophysical Research, v. 77, no. 33, p. 6552–6557.
Gow, A.J., and Govoni, J.W., 1994, An 80-year record of retreat of the Koettlitz Ice Tongue, McMurdo Sound, Antarctica: Annals of Glaciology, v. 20, p. 237–241.
Hammer, C.U., Clausen, H.B., and Langway, C.C., Jr., 1994, Electrical conductivity method (ECM) stratigraphic dating of the Byrd Station ice core, Antarctica: Annals of Glaciology, v. 20, p. 115–120.
Harvey, Ralph, 2003, The origin and significance of Antarctic meteorites: Chemie der Erde-Geochemistry, v. 63, no. 2, p. 93–147.
Holdsworth, G., 1974, Erebus Glacier Tongue, McMurdo Sound, Antarctica: Journal of Glaciology, v. 13, no. 67, p. 27–35.
Holdsworth, G., 1982, Dynamics of Erebus Glacier Tongue: Annals of Glaciology, v. 3, p. 131–137.
Hughes, T., 1979, Byrd Glacier: Antarctic Journal of the United States, v. 14, no. 5, p. 88–91.
Hughes, T., and Fastook, J.L., 1981, Byrd Glacier; 1978–1979 field results: Antarctic Journal of the United States, v. 16, no. 5, p. 86–89.
Jenkins, Adrian, and Holland, David, 2007, Melting of floating ice and sea level rise: Geophysical Research Letters, v. 34, no. 16, L16609, 5 p. (Digital Object Identifier 10.1029/2007GL030784.)
Jezek, K.C., ed., 1998, RADARSAT Antarctic Mapping Project; proceedings of the post Antarctic Imaging Campaign-1 Working Group meeting, November 18, 1997: Columbus, Ohio, The Ohio State University, Byrd Polar Research Center, BPRC Report 17, 40 p.
Joughin, Ian, and Tulaczyk, Slawek, 2002, Positive mass balance of the Ross Ice Streams, West Antarctica: Science, v. 295, no. 5554, p. 476–480.
Kapitsa, A.P., Ridley, J.K., Robin, G. de Q., Siegert, M.J., and Zotikov, I.A., 1996, A large deep freshwater lake beneath the ice of central East Antarctica: Nature, v. 381, no. 6584, p. 684–686. (Digital Object Identifier 10.1038/381684a0.)
Kawamura, Kenji, and others, 2007, Northern Hemisphere forcing of climatic cycles in Antarctica over the past 360,000 years: Nature, v. 448, no. 7156, p. 912–916.
Kenneally, J.P., and Hughes, T.J., 2004, Basal melting along the floating part of Byrd Glacier: Antarctic Science, v. 16, no. 3, p. 355–358.
Kieffer, Hugh, and others, 2000, New eyes in the sky measure glaciers and ice sheets: EOS (Transactions of the American Geophysical Union), v. 81, no. 24, p. 265, 270–271.
Lazzara, M.A., Jezek, K.C., Scambos, T.A., MacAyeal, D.R., and van der Veen, C.J., 1999, On the recent calving of icebergs from the Ross Ice Shelf: Polar Geography, v. 23, no. 3, p. 201–212.
Liu, Hongxing, 1999, Development of an Antarctic digital elevation model: Columbus, Ohio, The Ohio State University, Byrd Polar Research Center, BPRC Report 19, 157 p.
Lucchitta, B.K., and Ferguson, H.M., 1986, Antarctica; measuring glacier velocity from satellite images: Science, v. 234, no. 4780, p. 1105–1108.
Lythe, M.B., Vaughan, D.G., and the BEDMAP Consortium, 2001, BEDMAP; a new ice thickness and subglacial topographic model of Antarctica: Journal of Geophysical Research, v. 106B, no. 6, p. 11,335–11,352.
MacAyeal, D.R., Thom, Jonathan, and Bliss, Andrew, 2003, Giant tabular icebergs as surrogate ice shelves in field studies of Antarctica’s response to environmental warming [abs.]: EOS (Transactions of the American Geophysical Union), v. 84, no. 46, Fall Meeting Supplement, Abstract C31C–0413, p. F 378.
MacClune, K.L., Fountain, A.G., Kargel, J.S., and MacAyeal, D.R., 2003, Glaciers of the McMurdo Dry Valleys; terrestrial analog for Martian polar sublimation: Journal of Geophysical Research (Planets), v. 108, no. E4, p. 1–12. (Digital Object Identifier 10.1029/2002JE001878.)
12 Coastal-Change and Glaciological Map of the Ross Island Area, Antarctica: 1962–2005
Mellor, M., and Swithinbank, Charles, 1989, Airfields on Antarctic glacier ice: Hanover, N.H., U.S. Army Corps of Engineers Cold Regions Research and Engineering Laboratory, CRREL Report 89–21, 97 p.
Morse, D.L., Waddington, E.D., Marshall, H-P., Neumann, T.A., Steig, E.J., Dibb, J.E., Winebrenner, D.P., and Arthern, R.J., 1999, Accumulation rate measurements at Taylor Dome, East Antarctica; techniques and strategies for mass balance measurements in polar environments: Geografiska Annaler, v. 81A, no. 4, p. 683–694. (Digital Object Identifier 10.1111/1468-0459.00106.)
Motoyama, Hideaki, 2007, The second deep ice coring project at Dome Fuji, Antarctica: Scientific Drilling, v. 5, p. 41–43.
Müller, Fritz, Caflisch, T., and Müller, G., 1977, Instructions for the compilation and assemblage of data for a world glacier inventory: Zürich, Swiss Federal Institute of Technology, Temporary Technical Secretariat for World Glacier Inventory, International Commission on Snow and Ice, 28 p.
Müller, Fritz, Caflisch, T., and Müller, G., 1978, Instructions for the compilation and assemblage of data for a world glacier inventory—Supplement; identification/glacier number: Zürich, Swiss Federal Institute of Technology, Temporary Technical Secretariat for World Glacier Inventory, 7 p. and appendix.
National Research Council, 1986, U.S. research in Antarctica in 2000 A.D. and beyond; a preliminary assessment: Washington, D.C., National Academy Press, 35 p.
National Science Foundation, 1989, Gazetteer of the Antarctic, fourth edition—Names approved by the United States Board on Geographic Names: Washington D.C., National Science Foundation [Report] NSF 89–98, 145 p.
National Science Foundation, 1990, A long-range science plan for the Division of Polar Programs of the National Science Foundation; recommendations by the Divisional Advisory Committee for Polar Programs: Washington, D.C., National Science Foundation [Report] NSF 90–48, 45 p.
Neuendorf, K.K.E., Mehl, J.P., Jr., and Jackson, J.A., eds., 2005, Glossary of geology (5th ed.): Alexandria, Va., American Geological Institute, 800 p.
Noltimier, K.F., Jezek, K.C., and others, 1999, RADARSAT Antarctic Mapping Project; mosaic construction, 1999, in Stein, T.I., ed., Remote sensing of the system Earth; a challenge for the 21st century: Institute of Electrical and Electronics Engineers, International Geoscience and Remote Sensing Symposium 1999, Proceedings, v. 5, p. 2349–2351.
Norikane, Lynne, Wilson, Bob, and Jezek, Ken, 1998, RADARSAT Antarctic mapping system; system overview;
an update, in Jezek, K.C., ed., Early results from the first RADARSAT-1 Antarctic mapping mission: Columbus, Ohio, The Ohio State University, Byrd Polar Research Center, BPRC Technical Report 98-02, p. 4–6.
Oswald, G.K.A., and Robin, G. de Q., 1973, Lakes beneath the Antarctic ice sheet: Nature, v. 245, no. 5423, p. 251–254.
Petit, J.R., Jouzel, J., Raynaud, D., Barkov, N.I., Barnola, J.-M., Basile, I., Benders, M., Chappellaz, J., Davis, M., Delaygue, G., Delmotte, M., Kotlyakov, V.M., Legrand, M., Lipenkov, V.Y., Lorius, C., Pépin, L., Ritz, C., Saltzman, E., and Stievenard, M., 1999, Climate and atmospheric history of the past 420,000 years from the Vostok ice core, Antarctica: Nature, v. 399, no. 6735, p. 429–436.
Rabassa, Jorge, Skvarca, Pedro, Bertani, Luis, and Mazzoni, Elizabeth, 1982, Glacier inventory of James Ross and Vega Islands, Antarctic Peninsula: Annals of Glaciology, v. 3, p. 260–264.
RADARSAT Antarctic Mapping Project (RAMP), 1997, RADARSAT SAR-1 image map mosaic of Antarctica: Columbus, Ohio, The Ohio State University, Byrd Polar Research Center.
Rau, Frank, Mauz, Fabian, De Angelis, Hernán, Jaña, Ricardo, Neto, J.A. [Arigony-Neto, Jorge], Skvarca, Pedro, Vogt, Steffen, Saurer, Helmut, and Gossmann, Hermann, 2004, Variations of glacier frontal positions on the northern Antarctic Peninsula: Annals of Glaciology, v. 39, p. 525–530.
Reusch, D., and Hughes, T., 2003, Surface “waves” on Byrd Glacier, Antarctica: Antarctic Science, v. 15, no. 4, p. 547–555.
Rignot, Eric, and Thomas, R.H., 2002, Mass balance of polar ice sheets: Science, v. 297, no. 5586, p. 1502–1506.
Rignot, E[ric], Casassa, G., Gogineni, P., Krabill, W., Rivera, A., and Thomas, R., 2004, Accelerated ice discharge from the Antarctic Peninsula following the collapse of Larsen B ice shelf: Geophysical Research Letters, v. 31, no. 18, L18401, 4 p. (Digital Object Identifier 10.1029/2004GL020697.)
Rignot, Eric, Bamber, J.L., van den Broeke, M.R., Davis, Curt, Li, Yonghong, van de Berg, W.J., and van Meijgaard, Erik, 2008, Recent Antarctic ice mass loss from radar interferometry and regional climate modeling: Nature Geoscience, v. 1, no. 2, p. 106–110.
Robin, G. de Q., Swithinbank, C.W.M., and Smith, B.M.E., 1970, Radio echo exploration of the Antarctic ice sheet: International Symposium on Antarctic Glaciological Exploration (ISAGE), Hanover, New Hampshire, September 3–7, 1968, International Association of Hydrological Sciences Publication 86, p. 97–115.
References Cited 13
Schutt, John, 2007, Antarctic meteorite location and mapping project (AMLAMP): http://geology.geol.cwru.edu/~amlamp/intro/
Schutt, John, Fessler, Brian, and Cassidy, W.A., 1989, Antarctic meteorite location and mapping project: Lunar and Planetary Institute Technical Report 89–02, 58 p.
Schutt, John, Fessler, Brian, and Cassidy, W.A., 1993, Antarctic meteorite location and mapping project (AMLAMP); Antarctic meteorite location map series explanatory text and user’s guide to AMLAMP data: Lunar and Planetary Institute Technical Report 93–07, 179 p.
Schytt, Valter, 1961, Blue ice-fields, moraine features, and glacier fluctuations: Oslo, Norsk Polarinstitutt, Norwegian-British-Swedish Antarctic Expedition 1949–52, Scientific Results, v. 4E, p. 181–204.
Scientific Committee on Antarctic Research [SCAR], Working Group on Geodesy and Cartography, 1980, Standard symbols for use on maps of Antarctica (2d ed.): [no place], SCAR, 15 p.
SCAR [Scientific Committee on Antarctic Research] Steering Committee for the IGBP [International Geosphere-Biosphere Programme], 1989, The role of the Antarctic in global change; scientific priorities for the International Geosphere-Biosphere Programme (IGBP): Cambridge, United Kingdom, ICSU Press, 28 p.
SCAR [Scientific Committee on Antarctic Research] Steering Committee for the IGBP [International Geosphere-Biosphere Programme], 1993, The role of the Antarctic in global change; an international plan for a regional research programme: Cambridge, United Kingdom, SCAR, 54 p.
Shepherd, Andrew, and Wingham, Duncan, 2007, Recent sea-level contributions of the Antarctic and Greenland ice sheets: Science, v. 315, no. 5818, p. 1529–1532. (Digital Object Identifier 10.1126/science.1136776.)
Siegert, M.J., 2002, Which are the most suitable Antarctic subglacial lakes for exploration?: Polar Geography, v. 26, no. 2, p. 134–146.
Siegert, M.J., Dowdeswell, J.A., Gorman, M.R., and McIntyre, N.F., 1996, An inventory of Antarctic sub-glacial lakes: Antarctic Science, v. 8, no. 3, p. 281–286.
Siegert, M.J., Carter, Sasha, Tabacco, Ignazio, Popov, Sergey, and Blankenship, D.D., 2005, A revised inventory of Antarctic subglacial lakes: Antarctic Science, v. 17, no. 3, p. 453–460. (Digital Object Identifier 10.1017/S0954102005002889.)
Sievers, Jörn, and Bennat, Heinz, 1989, Reference systems of maps and geographic information systems of Antarctica: Antarctic Science, v. 1, no. 4, p. 351–362.
Stearns, Leigh, and Hamilton, Gordon, 2005, A new velocity map for Byrd Glacier, East Antarctica, from sequential ASTER satellite imagery: Annals of Glaciology, v. 41, p. 71–76.
Steig, E.J., Morse, D.L., Waddington, E.D., Stuiver, Minze, Grootes, P.M., Mayewski, P.A., Twickler, M.S., and Whitlow, S.I., 2000, Wisconsinan and Holocene climate history from an ice core at Taylor Dome, western Ross embayment, Antarctica: Geografiska Annaler, v. 82A, no. 2-3, p. 213–235.
Swithinbank, Charles, 1963, Ice movement of valley glaciers flowing into the Ross Ice Shelf, Antarctica: Science, v. 141, no. 3580, p. 523–524.
Swithinbank, Charles, 1980, The problem of a glacier inventory of Antarctica, in World glacier inventory; proceedings of the workshop at Riederalp, Switzerland, 17–22 September 1978: International Association of Hydrological Sciences Publication No. 126, p. 229–236.
Swithinbank, Charles, 1985, A distant look at the cryosphere: Advances in Space Research, v. 5, no. 6, p. 263–274.
Swithinbank, Charles, 1988, Antarctica, chap. B of Williams, R.S., Jr., and Ferrigno, J.G., eds., Satellite image atlas of glaciers of the world: U.S. Geological Survey Professional Paper 1386, p. B1–B278, 2 pls. (Also available online at http://pubs.usgs.gov/pp/p1386b/)
Swithinbank, C[harles], 1989, Ice runways near the South Pole: Hanover, N.H., U.S. Army Corps of Engineers Cold Regions Research and Engineering Laboratory, CRREL Special Report 89–19, 42 p.
Swithinbank, C[harles], 1991, Potential airfield sites in Antarctica for wheeled aircraft: Hanover, N.H., U.S. Army Corps of Engineers Cold Regions Research and Engineering Laboratory, CRREL Report 91–24, 68 p.
Swithinbank, Charles, Williams, R.S., Jr., Ferrigno, J.G., Foley, K.M., Hallam, C.A., and Rosanova, C.E., 2003a, Coastal-change and glaciological map of the Saunders Coast area, Antarctica: 1972–1997: U.S. Geological Survey Geologic Investigations Series Map I–2600–G, 1 sheet, scale 1:1,000,000, with 9-p. pamphlet. (Also available online at http://pubs.usgs.gov/imap/2600/G/)
Swithinbank, Charles, Williams, R.S., Jr., Ferrigno, J.G., Foley, K.M., and Rosanova, C.E., 2003b, Coastal-change and glaciological map of the Bakutis Coast area, Antarctica: 1972–2002: U.S. Geological Survey Geologic Investigations Series Map I–2600–F (2d ed.), 1 sheet, scale 1:1,000,000, with 10-p. pamphlet. (Also available online at http://pubs.usgs.gov/imap/2600/F/)
Swithinbank, Charles, Williams, R.S., Jr., Ferrigno, J.G., Foley, K.M., Rosanova, C.E., and Dailide, L.M., 2004,
14 Coastal-Change and Glaciological Map of the Ross Island Area, Antarctica: 1962–2005
Coastal-change and glaciological map of the Eights Coast area, Antarctica: 1972–2001: U.S. Geological Survey Geologic Investigations Series Map I–2600–E, 1 sheet, scale 1:1,000,000, with 11-p. pamphlet. (Also available online at http://pubs.usgs.gov/imap/2600/E/)
Thomas, R., Rignot, E., Casassa, G., Kanagaratnam, P., Acuña,C., Akins, T., Brecher, H., Frederick, E., Gogineni, P., Krabill, W., Manizade, S., Ramamoorthy, H., Rivera, A., Russell, R., Sonntag, J., Swift, R., Yungel, J., and Zwally, J., 2004, Accelerated sea-level rise from West Antarctica: Science, v. 306, no. 5694, p. 255–258.
U.S. Geological Survey, 2007, Landsat image mosaic of Antarctica (LIMA): U.S. Geological Survey Fact Sheet 2007–3116, 4 p. (Also available online at http://pubs.usgs.gov/fs/2007/3116/)
Vaughan, D.G., 2005, How does the Antarctic ice sheet affect sea level rise?: Science, v. 308, no. 5730, p. 1877–1878.
Velicogna, Isabella, and Wahr, John, 2006, Measurements of time-variable gravity show mass loss in Antarctica: Science, v. 311, no. 5768, p. 1754–1756.
Watanabe, Okitsugu; Kamiyama, Kokichi; Motoyama, Hideaki; Fujii, Yoshiyuki; Shoji, Hitoshi; and Satow, Kazuhide, 1999, The paleoclimate record in the ice core at Dome Fuji station, East Antarctica: Annals of Glaciology, v. 29, p. 176–178.
Williams, R.S., Jr., and Ferrigno, J.G., 1988, Landsat images of Antarctica, in Swithinbank, Charles, Antarctica, chap. B of Williams, R.S., Jr., and Ferrigno, J.G., eds. Satellite image atlas of glaciers of the world: U.S. Geological Survey Professional Paper 1386, p. B139–B278. (Also available online at http://pubs.usgs.gov/pp/p1386b/)
Williams, R.S., Jr., and Ferrigno, J.G., 2005 [revised 2009], Coastal-change and glaciological maps of Antarctica: U.S. Geological Survey Fact Sheet 2005–3055, 2 p. (Also available online at http://pubs.usgs.gov/fs/2005/3055/)
Williams, R.S., Jr., and Hall, D.K., 1993, Glaciers, in Gurney, R.J., Foster, J.L., and Parkinson, C.L., eds., Atlas of satellite observations related to global change: Cambridge, United Kingdom, Cambridge University Press, p. 401–422.
Williams, R.S., Jr., Meunier, T.K., and Ferrigno, J.G., 1982, Delineation of blue-ice areas in Antarctica from satellite imagery, in Bull, Colin, and Lipschutz, M.E., eds., Workshop on Antarctic glaciology and meteorites, Houston, Texas, April 19–20, 1982: Lunar and Planetary Institute Technical Report 82–03, p. 49–51.
Williams, R.S., Jr., Meunier, T.K., and Ferrigno, J.G., 1983, Blue ice, meteorites and satellite imagery in Antarctica: Polar Record, v. 21, no. 134, p. 493–496.
Williams, R.S., Jr., Ferrigno, J.G., Swithinbank, Charles, Lucchitta, B.K., and Seekins, B.A., 1995, Coastal-change and glaciological maps of Antarctica: Annals of Glaciology, v. 21, p. 284–290.
Wilson, C.R., and Crary, A.P., 1961, Ice movement studies on the Skelton Glacier: Journal of Glaciology, v. 3, no. 29, p. 873–878.
Wolff, E.W., 2005, Understanding the past; climate history from Antarctica: Antarctic Science, v. 17, no. 4, p. 487–495. (Digital Object Identifier 10.1017/S0954102005002919.)
Yanai, Keizo, 1983, Yamato Mountains, Sheet 2 of Locality map series of Antarctic meteorites: Tokyo, National Institute of Polar Research.
Yanai, Keizo, 1984, Allan Hills, Sheet 1 of Locality map series of Antarctic meteorites: Tokyo, National Institute of Polar Research.
Yoshida, Masaru; Ando, Hisao; Omoto, Kunio; Naruse, Renji; and Ageta, Yutaka, 1971, Discovery of meteorites near Yamato Mountains, East Antarctica: Antarctic Record, v. 39, p. 62–65.

Appendix—Tables 2 and 3
16 Coastal-Change and Glaciological Map of the Ross Island Area, Antarctica: 1962–2005
Table 2. Topographic, satellite image, and photo maps in the Ross Island map area, produced by the USGS and cooperators.—Continued
Name Publication Date
1:250,000-Scale Topographic Reconnaissance Series
Cape SelborneCarlyon GlacierConvoy RangeFranklin IslandMount DiscoveryMount HarmsworthMount OlympusRoss IslandTaylor GlacierTurnstile Ridge
196619661965, revised 198819651965, revised 19881965, revised 198819661960, revised 19701965, revised 19881966, revised 1988
1:250,000-Scale Satellite Image Maps
Churchill MountainsConvoy RangeDarwin MountainsMount HarmsworthMount JoyceRoss IslandSouth Ross Sea Region
20031974 (printed 1989)20021974 (printed 1989)1974 (printed 1989)1975 (printed 1989)1999
1:100,000-Scale Satellite Image Maps
Byrd NévéConvoy RangeDarwin GlacierMcMurdo Dry ValleysMount DiscoveryNicholson PeninsulaRoss Island and McMurdo SoundSkelton NévéTurnstile Ridge
200320002001199519992003200020002001
1:50,000-Scale Topographic Series
Alatna Valley (co-op with New Zealand)Beacon Valley (co-op with New Zealand)Cambridge Glacier (co-op with New Zealand)Cape Chocolate (co-op with New Zealand) Cape Roberts (co-op with New Zealand)Cathedral Rocks (co-op with New Zealand)Debenham Glacier (co-op with New Zealand)Flagship Mountain (co-op with New Zealand)Granite Knolls (co-op with New Zealand)Joyce Glacier (co-op with New Zealand)
In preparation1993In preparation1993In preparation1993In preparationIn preparation19931997
Appendix—Tables 2 and 3 17
Table 2. Topographic, satellite image, and photo maps in the Ross Island map area, produced by the USGS and cooperators.—Continued
Name Publication Date
19931977197719771977197719771997In preparation19971997In preparationIn preparationIn preparation19971997199719771977In preparation
n.d. [2005]In preparation2002In preparationn.d. [2005]19992002200120012001In preparationIn preparation20022002In preparationIn preparation
19911996, 2d ed. 2000
1:50,000-Scale Topographic Series—Continued
Knobhead (co-op with New Zealand)LabyrinthLake BonneyLake BrownworthLake FryxellLake VandaMarble Point Marshall Valley (co-op with New Zealand)Mount Endeavour (co-op with New Zealand)Mount Huggins (co-op with New Zealand)Mount Lister (co-op with New Zealand)Mount Mahony (co-op with New Zealand)Mount Whitcombe (co-op with New Zealand)Skew Peak (co-op with New Zealand)The Pyramid (co-op with New Zealand)The Spire (co-op with New Zealand)Twin Rocks (co-op with New Zealand)Victoria Upper LakeWebb LakeWyandot Ridge (co-op with New Zealand)
1:25,000-Scale Satellite Image Maps
Airdevronsix IcefallsBeacon HeightsCape CrozierCavendish RocksDaisDenton GlacierHut Point PeninsulaLake FryxellMarble PointMatterhornMiers ValleyMount BastionMount BirdMount ErebusMount KowalczykVictoria Valley
Miscellaneous Scale Satellite Image Maps
I-2284 Antarctica, 1:5,000,000I-2560 Antarctica, 1:5,000,000

18 Coastal-Change and Glaciological Map of the Ross Island Area, Antarctica: 1962–2005
Table 2. Topographic, satellite image, and photo maps in the Ross Island map area, produced by the USGS and cooperators.—Continued
Name Publication Date
Miscellaneous Scale Satellite Image Maps—Continued
RADARSAT Image Map of Antarctica, 1:5,000,000Victoria Land Coast, 1972–73, 1:1,000,000McMurdo Sound, 1972–74, 1:1,000,000McMurdo Sound Region, 1:500,000McMurdo Sound Region, 1:250,000
2003197619761973 (printed 1975)1973
Miscellaneous Scale Photomaps
Hut Point Peninsula, 1:13,500 McMurdo Station, 1:2,500McMurdo Station, 1:1,800McMurdo Station, 1:1,560 McMurdo Station, USA – Scott Base, NZ, 1:8,000
1983 (printed 1985)1983 (printed 1985)199620012000
Miscellaneous Other Maps
Ross Ice Shelf, 1:2,188,000 (sketch map)Ross Ice Shelf, 1:1,000,000 (sketch map)McMurdo Sound, 1:1,000,000 International Map of the World seriesRoss Island and vicinity, 1:250,000 TopographicIce-Free Valleys, Victoria Land, 2 sheets, 1:100,000 Topographic,
USGS Open-File Report 84–303Skelton Glacier, 1:100,000 Topographic,
USGS Open-File Report 84–304Wright Valley Labyrinth Area, 1:20,000 Topographic,
USGS Open-File Report 84–302Cape Crozier, Ross Island, 1:4,800 Topographic,
USGS Open-File Report 84–301
1980 (compiled 1972)1972197419861984 (compiled 1962)
1984 (compiled 1962)
1984 (compiled 1965)
1984 (compiled 1963)

Appendix—Tables 2 and 3 19
Table 3. Inventory of named glaciers and glaciological features on the coastal-change and glaciological map of the Ross Island area.—Continued
Feature Name Location (latitude, longitude)
Adams Glacier 780700S 1633800EAdélie Glacier 771300S 1663000EAiken Glacier 773800S 1632400EAirdevronsix Icefalls 773100S 1602200EAlbatross Glacier 771700S 1663100E
Alberich Glacier 773600S 1613600EAlbrecht Penck Glacier 764000S 1622000EAlley Glacier 795800S 1580500EAllison Glacier 781600S 1615500EAmos Glacier 774900S 1633900E
Amphitheatre Glacier 781700S 1630400EAnt Hill Glacier 784900S 1613000EAnu Whakatoro Glacier 771725S 1614200EAtka Glacier 764100S 1613300EAurora Glacier 773700S 1673800E
Bachtold Glacier 770730S 1620000EBall Glacier 780300S 1625000EBarne Glacier 773600S 1662600EBaronick Glacier 783600S 1615000EBartley Glacier 773200S 1621300E
Bartrum Glacier 794400S 1584400EBaxter Glacier 764000S 1615100EBenson Glacier 764900S 1621200EBeowulf Glacier 773800S 1614900EBertoglio Glacier 791800S 1602000E
Biker Glacier 771200S 1600700EBindschadler Glacier 775800S 1620900EBlackwelder Glacier 775600S 1641200EBlankenship Glacier 775900S 1614500EBlue Glacier 775000S 1641000E
Bol Glacier 775200S 1623400EBonne Glacier 775300S 1634900EBorns Glacier 774700S 1620100EBowden Glacier 780800S 1630700EBowers Piedmont Glacier 774300S 1641800E
Brecher Glacier 804200S 1572800EBrier Icefalls 801500S 1553600EBryan Glacier 772415S 1605545E
Table 3. Inventory of named glaciers and glaciological features on the coastal-change and glaciological map of the Ross Island area.—Continued
Feature Name Location (latitude, longitude)
Burrows Glacier 780200S 1635600EByrd Glacier 802000S 1590000EByrd Névé 810000S 1540000ECalkin Glacier 774600S 1621700ECambridge Glacier 765700S 1603100E
Canada Glacier 773700S 1625900ECarleton Glacier 780100S 1623000ECarlyon Glacier 793400S 1595000ECassidy Glacier 774600S 1600900ECassini Glacier 775300S 1634800E
Catspaw Glacier 774300S 1614200ECavendish Icefalls 774900S 1612000ECerberus Glacier 772700S 1615400EChattahoochee Glacier 763400S 1604200EChinn Glacier 772800S 1621500E
Circle Icefall 793800S 1563000EClark Glacier 772500S 1622500ECleveland Glacier 765500S 1620100EClio Glacier 772600S 1620000ECocks Glacier 784100S 1620000E
Comberiate Glacier 782100S 1621400ECommanda Glacier 773000S 1625600ECommonwealth Glacier 773500S 1631900ECondit Glacier 775200S 1624800EConrow Glacier 773400S 1620700E
Cooper Snowfield 805600S 1584000ECotton Glacier 770700S 1614000ECovert Glacier 775400S 1630400ECranfield Icefalls 795600S 1584000ECreagh Glacier 780100S 1611000E
Creagh Icefall 780200S 1610800ECrescent Glacier 774000S 1631400ECrisp Glacier 771200S 1621200ECycle Glacier 771200S 1601000EDahe Glacier 771500S 1620200E
Dale Glacier 781700S 1620200EDarkowski Glacier 775200S 1622500EDarwin Glacier 795300S 1590000E
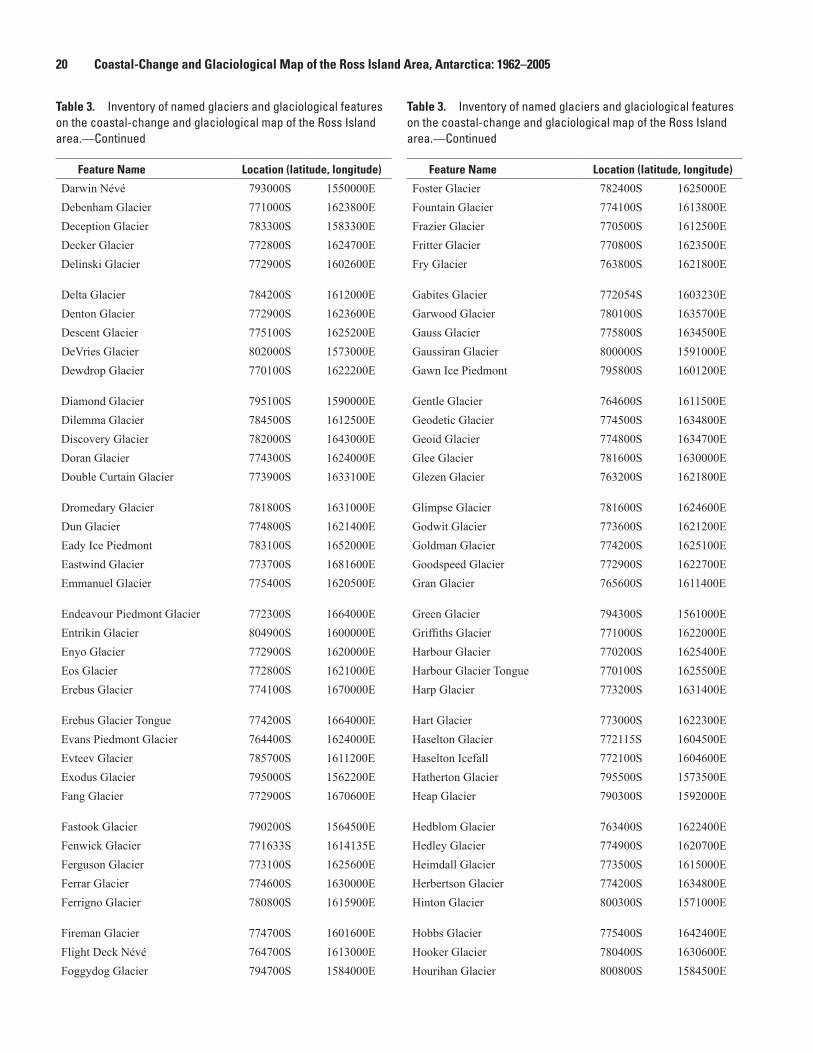
20 Coastal-Change and Glaciological Map of the Ross Island Area, Antarctica: 1962–2005
Table 3. Inventory of named glaciers and glaciological features on the coastal-change and glaciological map of the Ross Island area.—Continued
Feature Name Location (latitude, longitude)
Darwin Névé 793000S 1550000EDebenham Glacier 771000S 1623800EDeception Glacier 783300S 1583300EDecker Glacier 772800S 1624700EDelinski Glacier 772900S 1602600E
Delta Glacier 784200S 1612000EDenton Glacier 772900S 1623600EDescent Glacier 775100S 1625200EDeVries Glacier 802000S 1573000EDewdrop Glacier 770100S 1622200E
Diamond Glacier 795100S 1590000EDilemma Glacier 784500S 1612500EDiscovery Glacier 782000S 1643000EDoran Glacier 774300S 1624000EDouble Curtain Glacier 773900S 1633100E
Dromedary Glacier 781800S 1631000EDun Glacier 774800S 1621400EEady Ice Piedmont 783100S 1652000EEastwind Glacier 773700S 1681600EEmmanuel Glacier 775400S 1620500E
Endeavour Piedmont Glacier 772300S 1664000EEntrikin Glacier 804900S 1600000EEnyo Glacier 772900S 1620000EEos Glacier 772800S 1621000EErebus Glacier 774100S 1670000E
Erebus Glacier Tongue 774200S 1664000EEvans Piedmont Glacier 764400S 1624000EEvteev Glacier 785700S 1611200EExodus Glacier 795000S 1562200EFang Glacier 772900S 1670600E
Fastook Glacier 790200S 1564500EFenwick Glacier 771633S 1614135EFerguson Glacier 773100S 1625600EFerrar Glacier 774600S 1630000EFerrigno Glacier 780800S 1615900E
Fireman Glacier 774700S 1601600EFlight Deck Névé 764700S 1613000EFoggydog Glacier 794700S 1584000E
Table 3. Inventory of named glaciers and glaciological features on the coastal-change and glaciological map of the Ross Island area.—Continued
Feature Name Location (latitude, longitude)
Foster Glacier 782400S 1625000EFountain Glacier 774100S 1613800EFrazier Glacier 770500S 1612500EFritter Glacier 770800S 1623500EFry Glacier 763800S 1621800E
Gabites Glacier 772054S 1603230EGarwood Glacier 780100S 1635700EGauss Glacier 775800S 1634500EGaussiran Glacier 800000S 1591000EGawn Ice Piedmont 795800S 1601200E
Gentle Glacier 764600S 1611500EGeodetic Glacier 774500S 1634800EGeoid Glacier 774800S 1634700EGlee Glacier 781600S 1630000EGlezen Glacier 763200S 1621800E
Glimpse Glacier 781600S 1624600EGodwit Glacier 773600S 1621200EGoldman Glacier 774200S 1625100EGoodspeed Glacier 772900S 1622700EGran Glacier 765600S 1611400E
Green Glacier 794300S 1561000EGriffiths Glacier 771000S 1622000EHarbour Glacier 770200S 1625400EHarbour Glacier Tongue 770100S 1625500EHarp Glacier 773200S 1631400E
Hart Glacier 773000S 1622300EHaselton Glacier 772115S 1604500EHaselton Icefall 772100S 1604600EHatherton Glacier 795500S 1573500EHeap Glacier 790300S 1592000E
Hedblom Glacier 763400S 1622400EHedley Glacier 774900S 1620700EHeimdall Glacier 773500S 1615000EHerbertson Glacier 774200S 1634800EHinton Glacier 800300S 1571000E
Hobbs Glacier 775400S 1642400EHooker Glacier 780400S 1630600EHourihan Glacier 800800S 1584500E

Appendix—Tables 2 and 3 21
Table 3. Inventory of named glaciers and glaciological features on the coastal-change and glaciological map of the Ross Island area.—Continued
Feature Name Location (latitude, longitude)
Howard Glacier 774000S 1630500EHowchin Glacier 781200S 1632200EHughes Glacier 774400S 1622700EHuka Kapo Glacier 772412S 1604300EHunt Glacier 765200S 1622500E
Irving Glacier 761300S 1601600EJezek Glacier 775900S 1621300EJoyce Glacier 780100S 1634200EJudith Glacier 802900S 1584900EKamb Glacier 775500S 1623900E
Kehle Glacier 785600S 1601800EKempe Glacier 781800S 1625400EKennedy Glacier 773900S 1621200EKitticarrara Glacier 774300S 1630200EKoettlitz Glacier 781500S 1641500E
Koettlitz Névé 782700S 1630000EKreutz Snowfield 771730S 1611530ELacroix Glacier 774000S 1623300ELanding, The 782200S 1612500ELashly Glacier 775700S 1595000E
Lieske Glacier 800500S 1565000ELister Glacier 775900S 1630500ELobeck Glacier 771315S 1614600ELoftus Glacier 773300S 1624600ELofty Promenade 773100S 1685200E
Lower Jaw Glacier 782200S 1625700ELower Staircase 782500S 1614500ELugger Glacier 765800S 1605000EMackay Glacier 765800S 1620000EMackay Glacier Tongue 765800S 1622000E
Marchant Glacier 780600S 1620300EMarchetti Glacier 771100S 1613300EMarin Glacier 760400S 1622200EMarr Glacier 774300S 1624400EMarston Glacier 765400S 1623000E
Mason Glacier 785300S 1614100EMatterhorn Glacier 774100S 1622700EMawson Glacier 761300S 1620500E
Table 3. Inventory of named glaciers and glaciological features on the coastal-change and glaciological map of the Ross Island area.—Continued
Feature Name Location (latitude, longitude)
McCleary Glacier 793300S 1565000EMcCraw Glacier 800700S 1563500EMcDermott Glacier 782000S 1620400EMcMurdo Ice Shelf 780000S 1663000EMercury Glacier 793400S 1571700E
Merrick Glacier 801300S 1585200EMeserve Glacier 773100S 1621700EMidship Glacier 765200S 1613000EMiers Glacier 780500S 1634000EMiller Glacier 771200S 1620000E
Mime Glacier 773700S 1614500EMinerva Glacier 793412S 1571500EMinnehaha Icefalls 770200S 1622400EMitchell Glacier 775700S 1630300EMoa Glacier 774200S 1624600E
Mollweide Glacier 775700S 1634500EMorning Glacier 782700S 1634800EMulock Glacier 790000S 1600000ENakai Snowfield 772900S 1613100ENewall Glacier 773000S 1625000E
New Glacier 770200S 1622400ENordenskjöld Ice Tongue 761100S 1624500ENorris Glacier 774000S 1621200ENorthwind Glacier 764000S 1611800ENylen Glacier 774100S 1612900E
Oates Piedmont Glacier 762500S 1623500EOdell Glacier 764400S 1595500EOdin Glacier 773500S 1613600EOrestes Glacier 772700S 1615300EOverflow Glacier 774700S 1631100E
Overturn Glacier 795400S 1571500EPackard Glacier 772100S 1621000EPakaru Icefalls 773800S 1663900EPalais Glacier 780200S 1611900EPascoe Glacier 764600S 1610100E
Peckham Glacier 802100S 1572500EPedalling Ice Field 771500S 1595500EPetrel Glacier 771400S 1662800E

22 Coastal-Change and Glaciological Map of the Ross Island Area, Antarctica: 1962–2005
Table 3. Inventory of named glaciers and glaciological features on the coastal-change and glaciological map of the Ross Island area.—Continued
Feature Name Location (latitude, longitude)
Pipecleaner Glacier 781400S 1625100EPlane Table Glacier 773400S 1612900EPlummet Glacier 774700S 1615400EPotter Glacier 782300S 1621200EPrebble Icefalls 795400S 1555500E
Priddy Glacier 775600S 1640100EPrion Glacier 772000S 1663500EPyne Glacier 770400S 1621800EPūanu Glacier 772330S 1605840EQuaternary Icefall 771800S 1663000E
Radian Glacier 781300S 1630000ERagotzkie Glacier 800200S 1574500ERagotzkie Icefall 800300S 1580000ERamseier Glacier 803000S 1561800ERenegar Glacier 782200S 1630800E
Repeater Glacier 772800S 1625100ERhone Glacier 774200S 1621400ERim Glacier 771300S 1602500ERinger Glacier 771500S 1615100ERivard Glacier 780400S 1635500E
Robson Glacier 770500S 1621100ERoss Ice Shelf 813000S 1750000WRotunda Glacier 780000S 1613800ERuecroft Glacier 781300S 1614000ERutgers Glacier 781400S 1615500E
Salient Glacier 780600S 1630500ESalmon Glacier 775800S 1640500ESandy Glacier 772900S 1615700ESchlatter Glacier 774100S 1612700ESchultz Glacier 771900S 1622000E
Schutt Glacier 781600S 1613100EScrivener Glacier 765700S 1613700EScudding Glacier 765400S 1604500EScuppers Icefalls 764800S 1613600ESefton Glacier 804500S 1565200E
Sennet Glacier 801200S 1584200EShark Fin Glacier 782300S 1625500ESharpend Glacier 765200S 1605600E
Table 3. Inventory of named glaciers and glaciological features on the coastal-change and glaciological map of the Ross Island area.—Continued
Feature Name Location (latitude, longitude)
Shearwater Glacier 771900S 1663100ESheathbill Glacier 7718.70S 1663600EShell Glacier 771600S 1662500EShimmering Icefield 763900S 1594400ESkelton Glacier 783500S 1613000E
Skelton Icefalls 781400S 1581900ESkelton Névé 782000S 1600000ESollas Glacier 774300S 1623600ESolomon Glacier 782300S 1623000ESouth America Glacier 774900S 1614700E
Spring Glacier 775500S 1630600ESprocket Glacier 771200S 1603400EStocking Glacier 774200S 1615000EStuckless Glacier 781600S 1661200ESuess Glacier 773800S 1624000E
Sykes Glacier 773500S 1613200ETaylor Glacier 774400S 1621000ETedrow Glacier 775800S 1615000ETelemeter Glacier 774800S 1601200ETern Glacier 771700S 1663200E
Terra Nova Glacier 772700S 1674200ETerror Glacier 773700S 1680300ETopside Glacier 764200S 1605700ETouchdown Glacier 794800S 1581000ETowle Glacier 763800S 1610500E
Trepidation Glacier 784600S 1622100ETripp Ice Tongue 763400S 1624500ETurnabout Glacier 774600S 1604300ETwombley Glacier 803500S 1574500EUpper Jaw Glacier 782100S 1625700E
Upper Staircase 781500S 1610000EValhalla Glacier 773400S 1615800EVereyken Glacier 782500S 1635700EVictoria Lower Glacier 771800S 1624000EVictoria Upper Glacier 771600S 1612500E
Victoria Upper Névé 771600S 1610500EVon Guerard Glacier 773900S 1632000EWaddington Glacier 780300S 1612700E
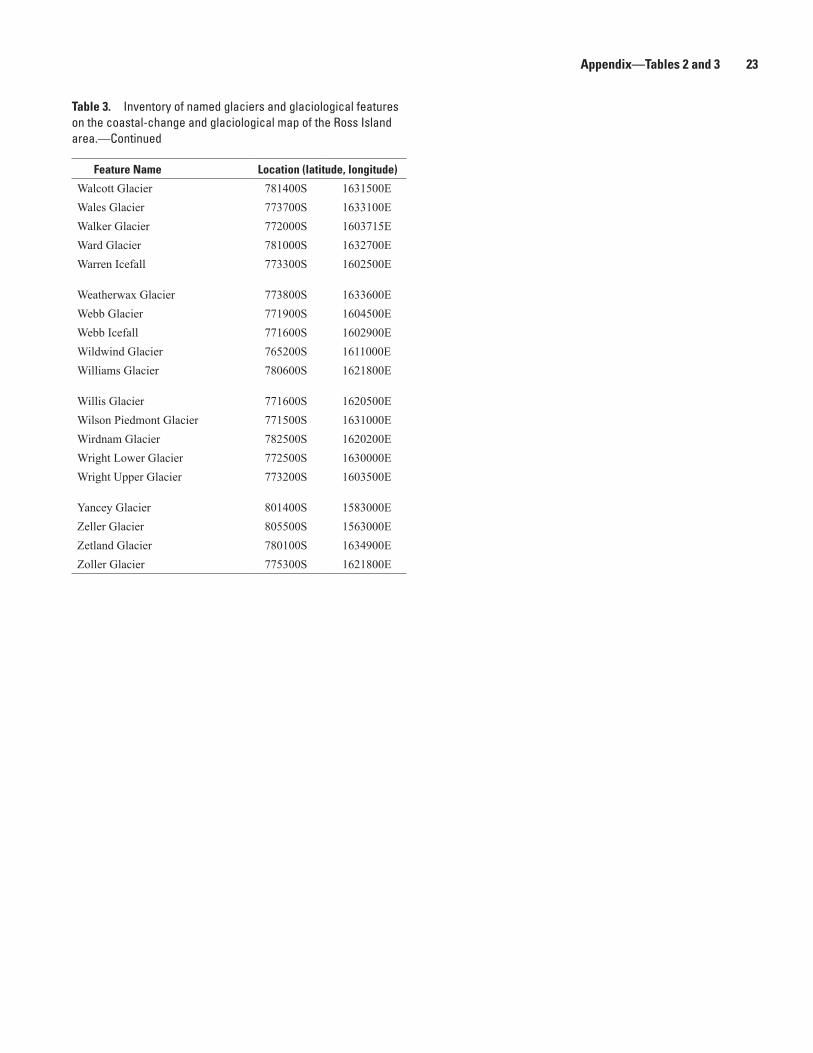
Appendix—Tables 2 and 3 23
Table 3. Inventory of named glaciers and glaciological features on the coastal-change and glaciological map of the Ross Island area.—Continued
Feature Name Location (latitude, longitude)
Walcott Glacier 781400S 1631500EWales Glacier 773700S 1633100EWalker Glacier 772000S 1603715EWard Glacier 781000S 1632700EWarren Icefall 773300S 1602500E
Weatherwax Glacier 773800S 1633600EWebb Glacier 771900S 1604500EWebb Icefall 771600S 1602900EWildwind Glacier 765200S 1611000EWilliams Glacier 780600S 1621800E
Willis Glacier 771600S 1620500EWilson Piedmont Glacier 771500S 1631000EWirdnam Glacier 782500S 1620200EWright Lower Glacier 772500S 1630000EWright Upper Glacier 773200S 1603500E
Yancey Glacier 801400S 1583000EZeller Glacier 805500S 1563000EZetland Glacier 780100S 1634900EZoller Glacier 775300S 1621800E