Lecture 9 Constructing a Coastal Data Model for Nearshore Puget Sound
Coastal and Nearshore Mapping

Courtesy of LCDR Gonsalves, NOAA
Leadline Surveys

Courtesy of LCDR Gonsalves, NOAA
Single Beam Echosounders (since 1950s)

Temporal and Spatial Scales of Coastal Change

Objectives • Collect elevation, geologic, and benthic habitat data across the coastal zone,
spanning from the top of coastal bluffs to nearshore waters up to at least 15 m deep.
• Assess the viability of performing repetitive surveys to enable change detection including bluff erosion, spit formation, and a quantification of sediment supply to the beach and nearshore.
• Develop methods, technology, survey platforms, tools, analysis, and applications
for collecting and processing modern data sets needed for coastal and marine resource management.
• Assess the present condition of the nearshore zone and establish an inventory of key indicators such as beach morphology (e.g., elevation, slope and width), grain size, and habitat characteristics.
• Understand role of bluff sediment supply to nearshore physical and ecological
processes: Δ Volume; Δ Slope; Δ grain size; Δ upland and aquatic vegetation

Coastal Morphology Mapping
Quarterly beach profiles since summer 1997 in the CRLC
RTK-GPS ATV surface maps, beach profiles (to wading depth), and CPS nearshore bathymetry.

Cross-Shore Profiles
• Low tide when max amount of beach exposed
• Walk from the dune, across the beach, out to wading depth (swash zone) typically 0.5 to 1 m below MLLW depending on conditions
• Data points collected using a GPS mounted on a backpack with a measured antenna height
• Data depicts seasonal changes as well as dune elevation, beach width, and sand volume
Coastal Monitoring Techniques

Cross-shore profiles
Feb 1998 Feb 2004
Dec 2013

Alongshore Surface Maps
• Survey at low tide when max amount of beach exposed
• Drive ATV along beach, back and forth throughout a 3-4 km section (between dune toe and water’s edge)
• Data points collected using a GPS mounted on ATV with a measured antenna height
• Data interpolated in the cross-shore to generate beach elevation maps used for volume change analysis
Coastal Monitoring Techniques
CLARIS
Coastal LiDAR and
Radar Imaging
System

Nearshore bathymetry
• Survey at high tide when lower beach face is submerged
• Drive PWC along transect from 1-2 km offshore through surf zone
• Data points collected using a GPS and single beam echosounder mounted on PWC with a measured antenna height
• Combine data with beach transects to generate continuous profile of beach and nearshore
Coastal Monitoring Techniques

USGS/OSU Survey Vessels
Coastal Profiling System
2007 Honda Aquatrax F-12 4-stroke Personal Water Craft (PWC) Length 3.20 m Beam 1.25 m Vessel Speed ~6 knots Maximum personnel 1 Single beam echo-sounding RTK DGPS positioning Operational depths to ~20 m and < 2.5 km from shore
Details of equipment, operational techniques, and accuracy: Ruggiero et al., 2007, USGS DS260

Alternative Shallow Water Systems
RLDA Surveying & Mapping
Oceanscience
Seafloor Systems
Ross Laboratories

Beach Profiles
and Nearshore
Bathymetry Northern WA Coast

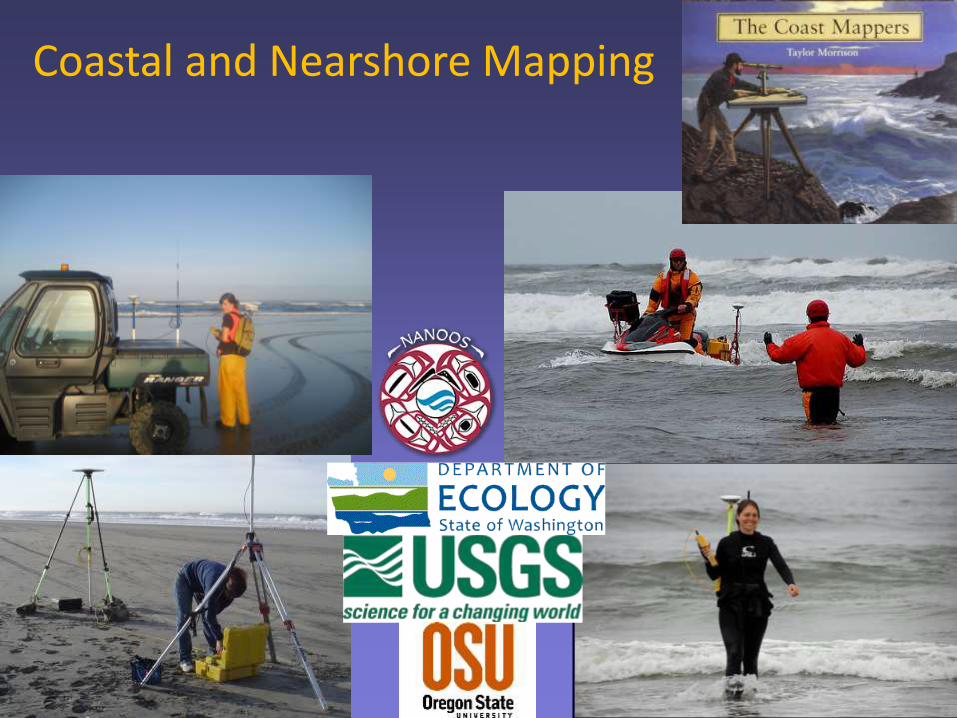
Quileute Coast Nearshore Profile

‘Typical’ Nearshore CRLC Profile
Bar Height > 4.0 m
Bar Crest > 1.0 km from shoreline

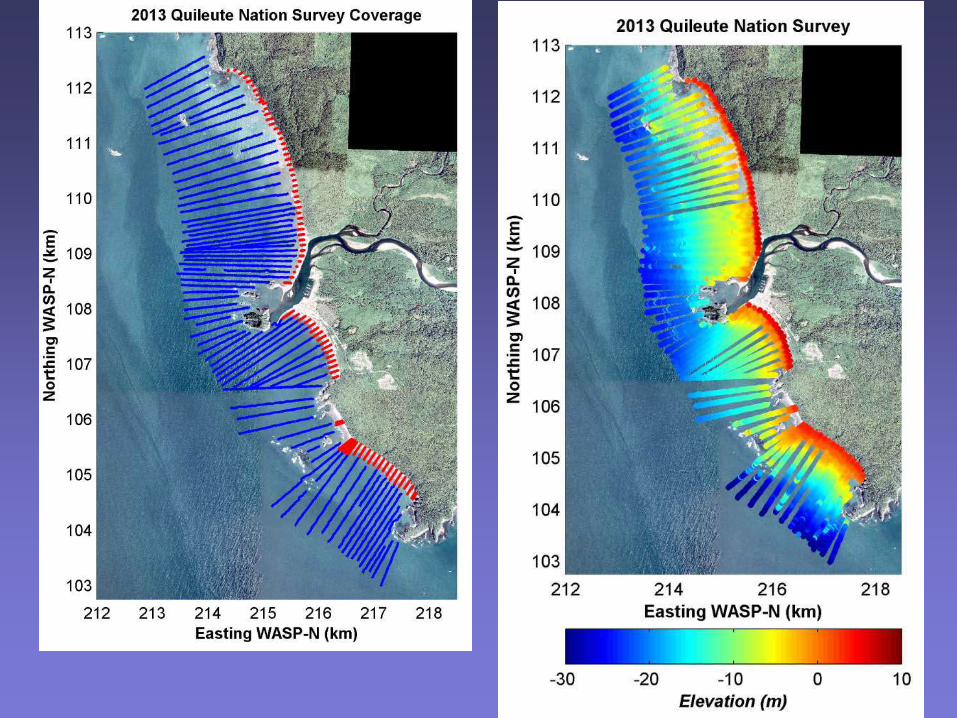
Nearshore Profile Change

Nearshore Profile Change

Nearshore Profile Change

Nearshore Profile Change

Nearshore Profile Change

Nearshore Profile Change

Nearshore Profile Change
Nearshore Profile Change
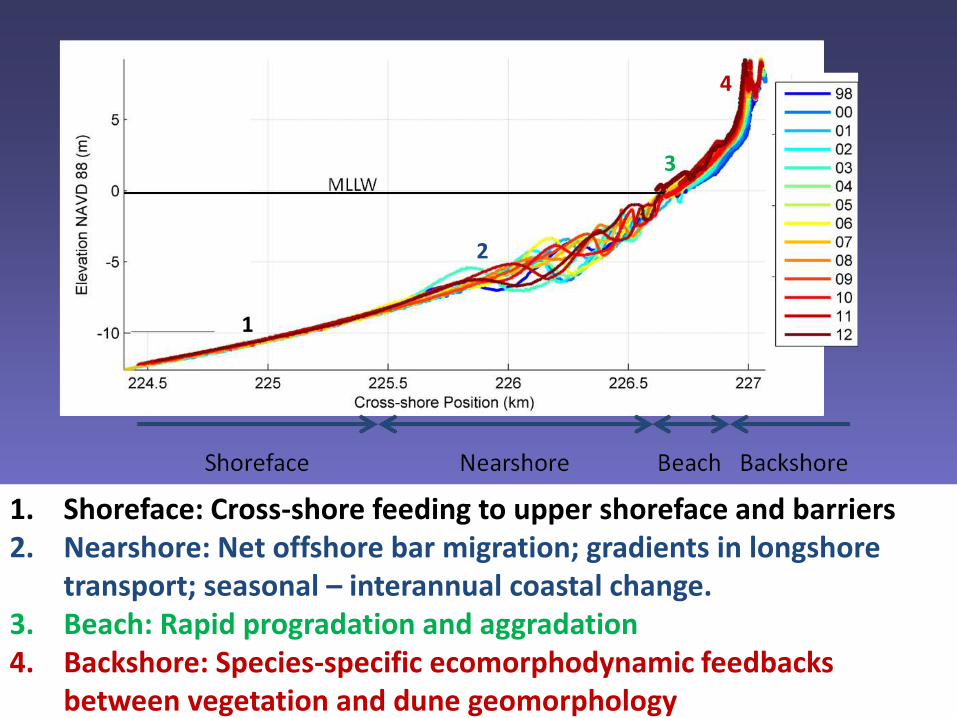
1. Shoreface: Cross-shore feeding to upper shoreface and barriers 2. Nearshore: Net offshore bar migration; gradients in longshore
transport; seasonal – interannual coastal change. 3. Beach: Rapid progradation and aggradation 4. Backshore: Species-specific ecomorphodynamic feedbacks
between vegetation and dune geomorphology
1
2
3
4

Prograding beach and foredunes
2 new foredunes since 1999; Coastal change rate = ~4.5 – 7.5 m/yr

Prograding foredunes
~10 m3/m/yr of observed accumulation in foredunes; ~.3 Mm3 in 3km surface map area between 2000 and 2011.
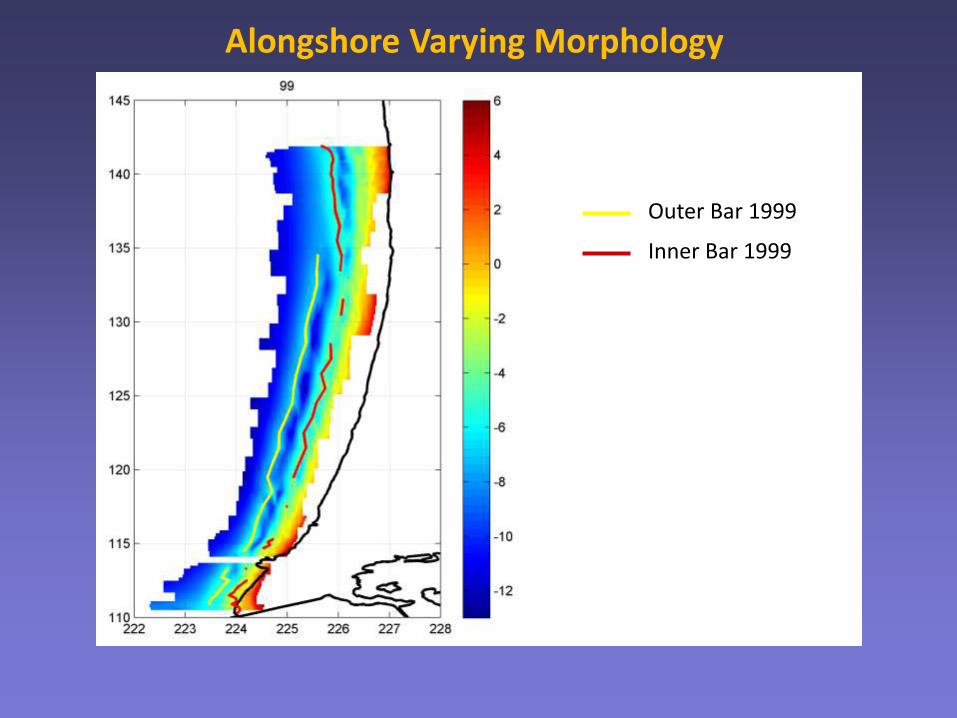
Alongshore Varying Morphology
Outer Bar 1999
Inner Bar 1999
Outer Bar 1999
Inner Bar 1999
Outer Bar 2000
Inner Bar 2000
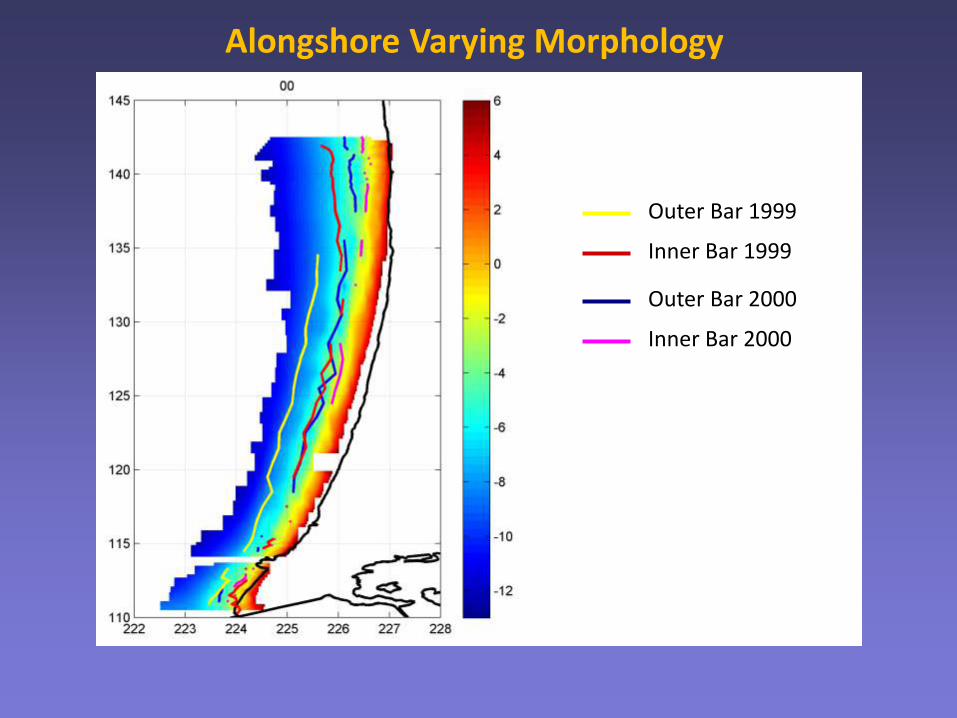
Alongshore Varying Morphology

Outer Bar 1999
Inner Bar 1999
Outer Bar 2001
Inner Bar 2001
Alongshore Varying Morphology
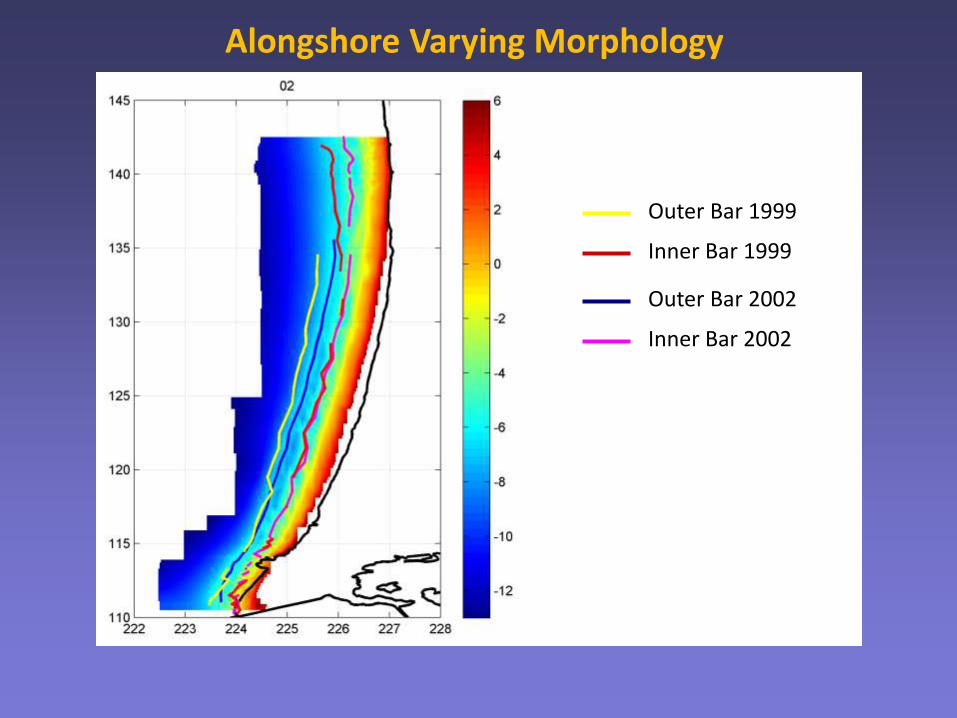
Outer Bar 1999
Inner Bar 1999
Outer Bar 2002
Inner Bar 2002
Alongshore Varying Morphology
Outer Bar 1999
Inner Bar 1999
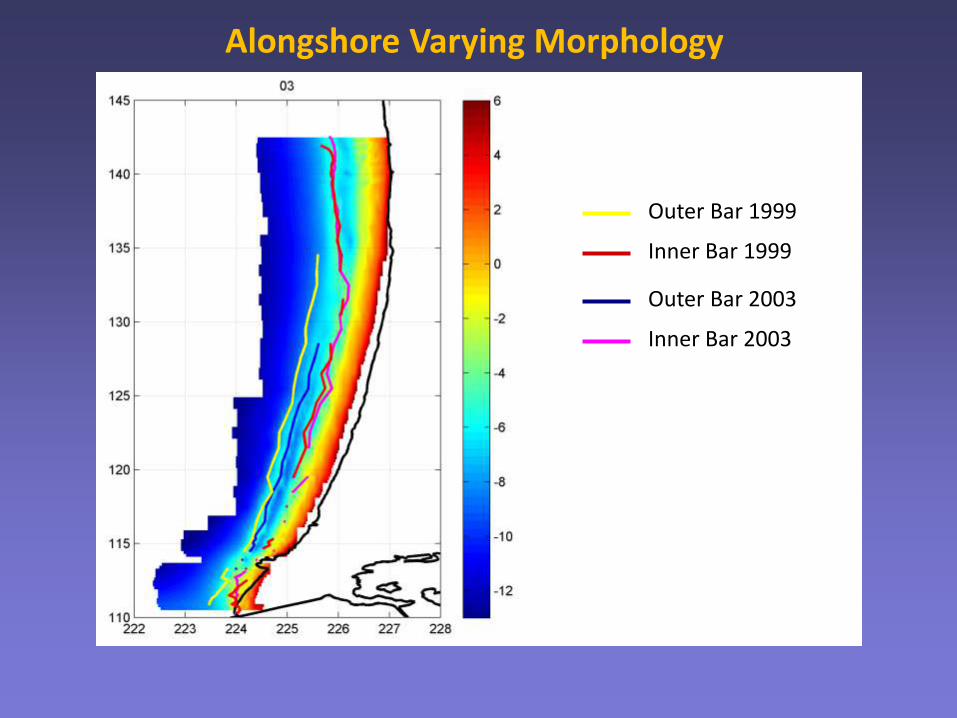
Outer Bar 2003
Inner Bar 2003
Alongshore Varying Morphology

Outer Bar 1999
Inner Bar 1999
Outer Bar 2004
Inner Bar 2004
Alongshore Varying Morphology

Outer Bar 1999
Inner Bar 1999
Outer Bar 2006
Inner Bar 2006
Alongshore Varying Morphology
Outer Bar 1999
Inner Bar 1999
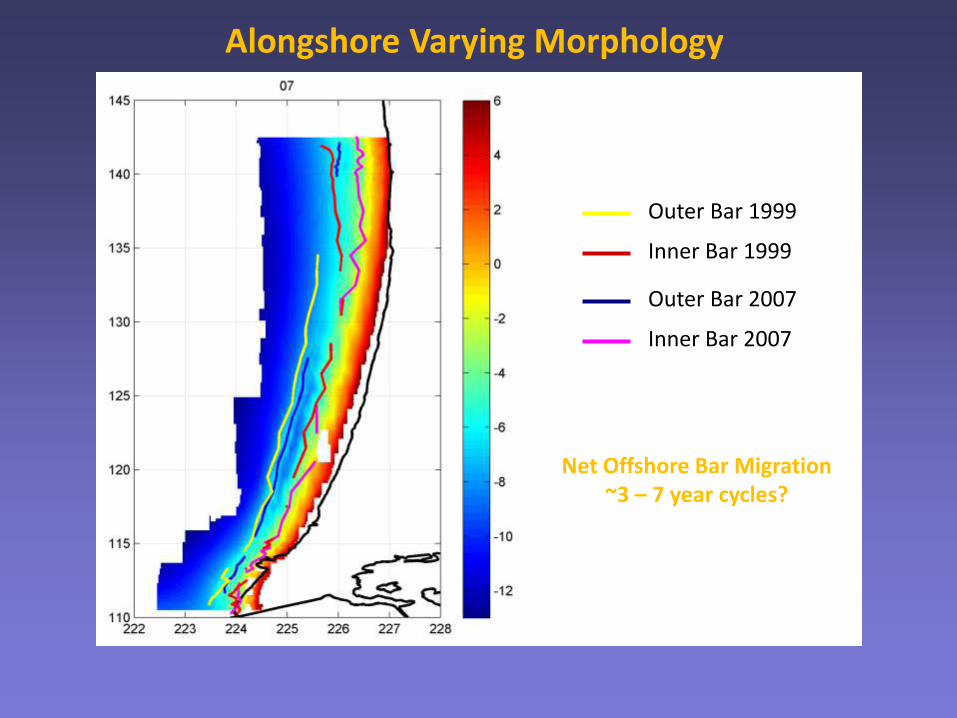
Outer Bar 2007
Inner Bar 2007
Net Offshore Bar Migration ~3 – 7 year cycles?
Alongshore Varying Morphology

Shoreface Bathymetry Change: 1926-1958
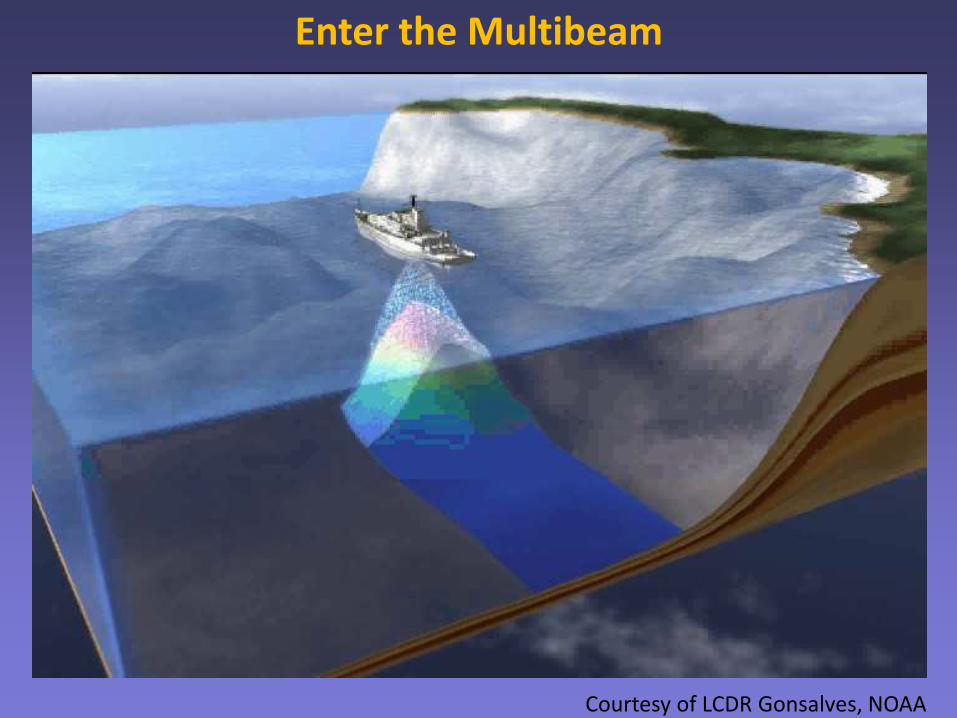
Enter the Multibeam
Courtesy of LCDR Gonsalves, NOAA

Hydrography – Enter the Multibeam • Rather than sending a single pulse of energy straight
down; imagine forming multiple beams and directing them to either side of your vessel.
Courtesy of LCDR Gonsalves, NOAA

Single Beam Density Selected Soundings
Courtesy of LCDR Gonsalves, NOAA
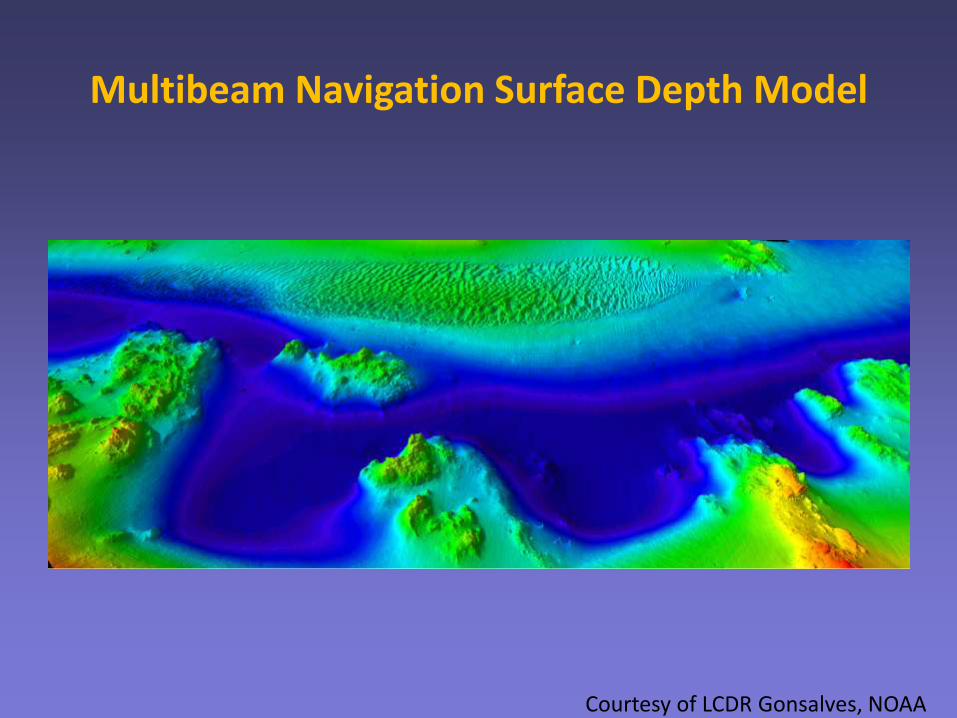
Multibeam Navigation Surface Depth Model
Courtesy of LCDR Gonsalves, NOAA

• Beach-landing craft specifically designed for shallow-water hydrographic and topographic surveying
• Trailerable 28’ x 10’ vessel for local launch and recovery
• 18” shallow draft
• Twin hull for stability and limited roll; straight line tracking; maneuverability
• Drop-down bow door for land-based surveying (RTK base, scanner targets)
• Moon-pool sonar deployment for repeatability and rigidity
R/V George Davidson
1825-1911
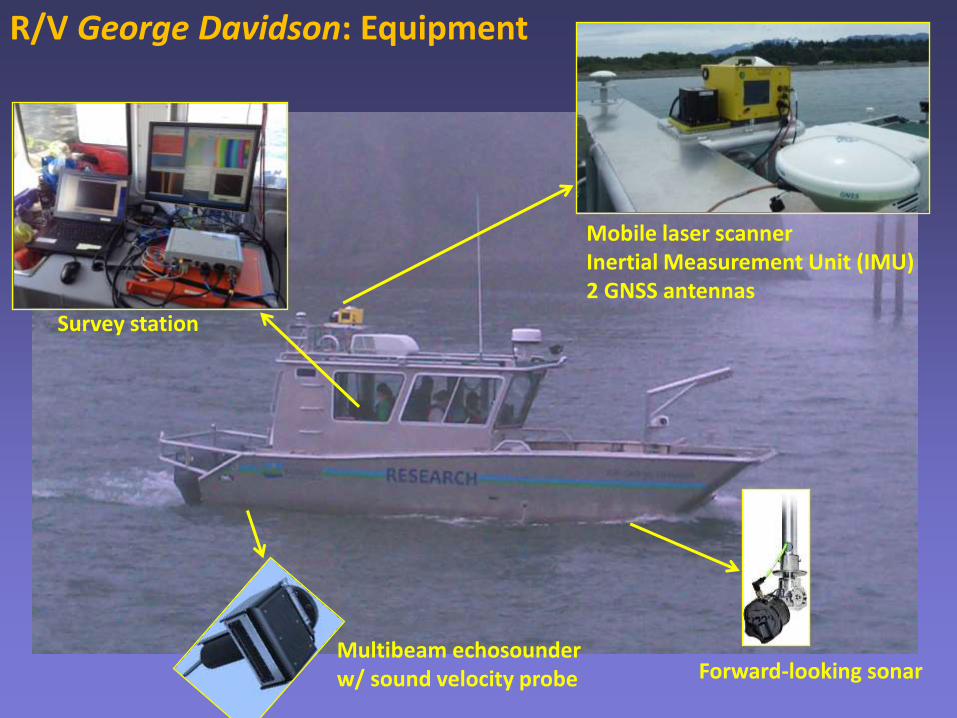
R/V George Davidson: Equipment
Multibeam echosounder w/ sound velocity probe
Mobile laser scanner Inertial Measurement Unit (IMU) 2 GNSS antennas
Survey station
Forward-looking sonar

Boat-based lidar: Optech Ilris HD-ER
• Vertical swath up to 80°
• Images landscape as vessel moves
• Range of up to 1800 m
• Up to 10,000 Hz ping rate
• Beam diameter = 19 mm at 100 m

Alternative Remote Sensing Platforms
Skeye BV

Multibeam echosounder: R2Sonic 2022 • 256 beams ping simultaneously
• Up to 160° swath or focused for higher resolution
• 4 x water depth
• Up to 60 Hz ping rate
• Beam steering (e.g., tilt the swath towards shoreline)
Shallow water is dangerous!

Interferometric swath bathymetry and side scan sonar for shallow water
Alternative Sonar Systems
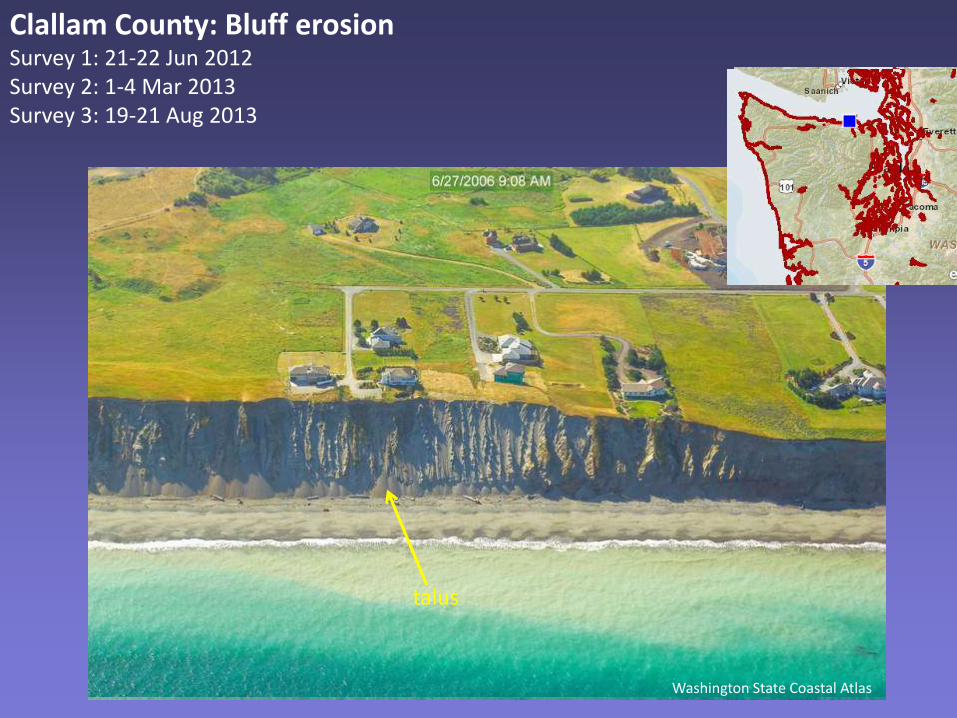
Clallam County: Bluff erosion Survey 1: 21-22 Jun 2012 Survey 2: 1-4 Mar 2013 Survey 3: 19-21 Aug 2013
Washington State Coastal Atlas
talus

Washington State Coastal Atlas
Photo from R/V George Davidson during survey
Oblique perspective of bluffs

Overhanging trees
Log / LWD
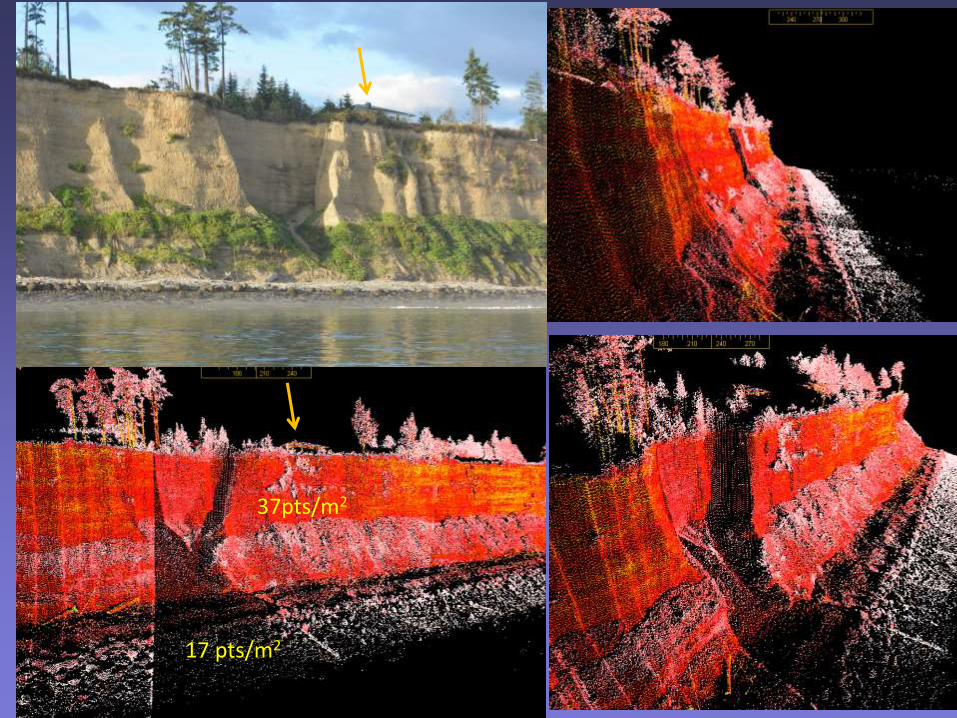
37pts/m2
17 pts/m2
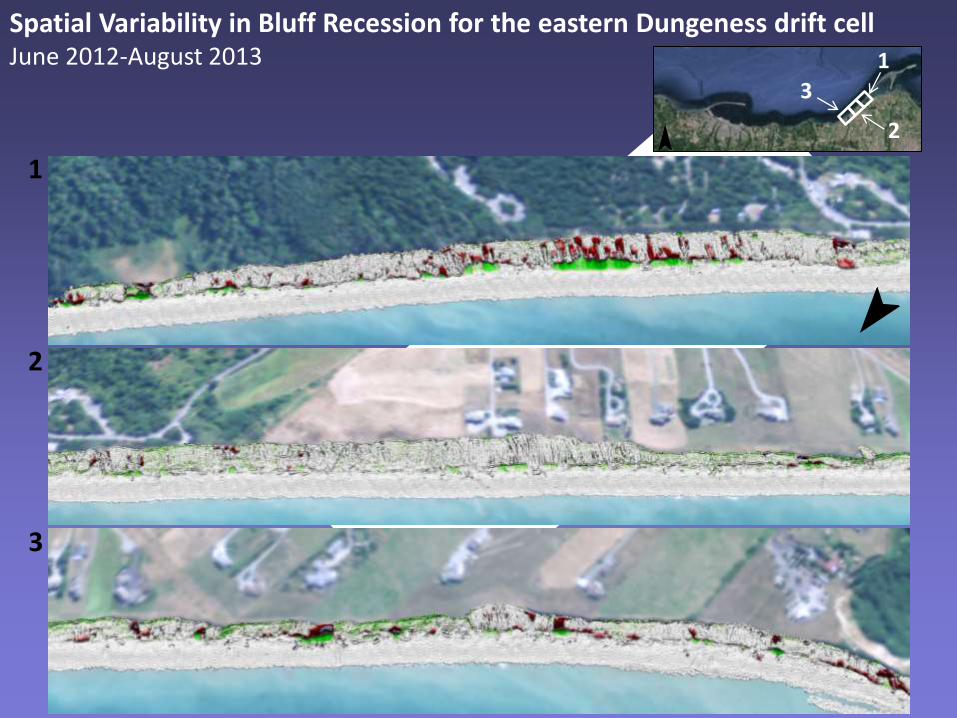
Spatial Variability in Bluff Recession for the eastern Dungeness drift cell June 2012-August 2013
1
2
3
1
2
3
¯
¯
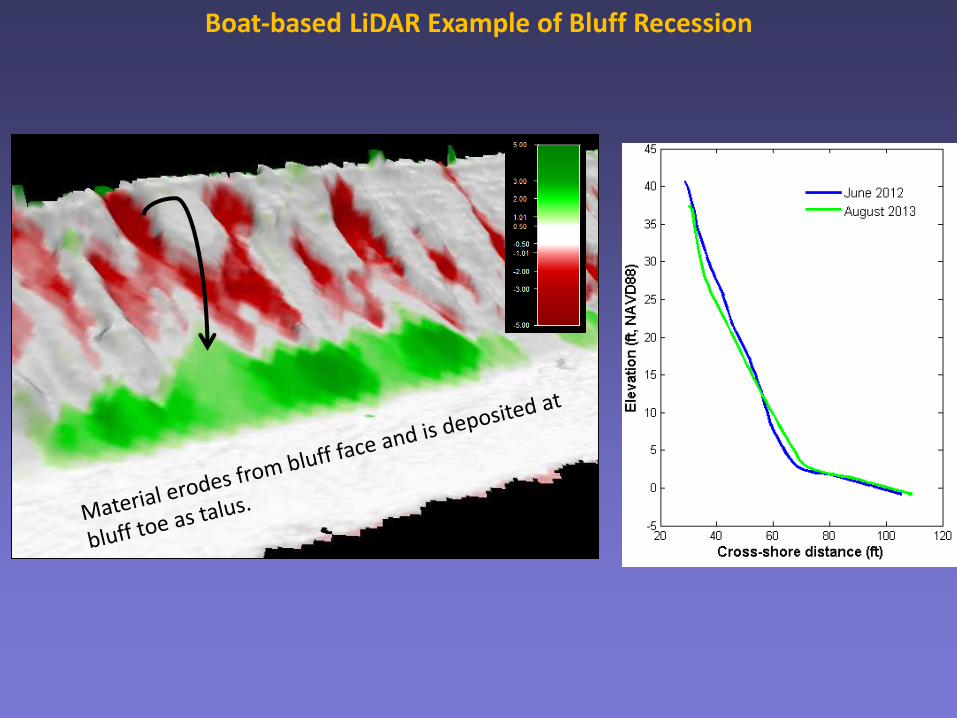
Boat-based LiDAR Example of Bluff Recession

¯

Washington State Coastal Atlas
Coastal Mapping at La Push for Marine Spatial Planning 14-16 Sept 2012
James Island and Quillayute River

Coastal Mapping at La Push for Marine Spatial Planning 14-16 Sept 2012
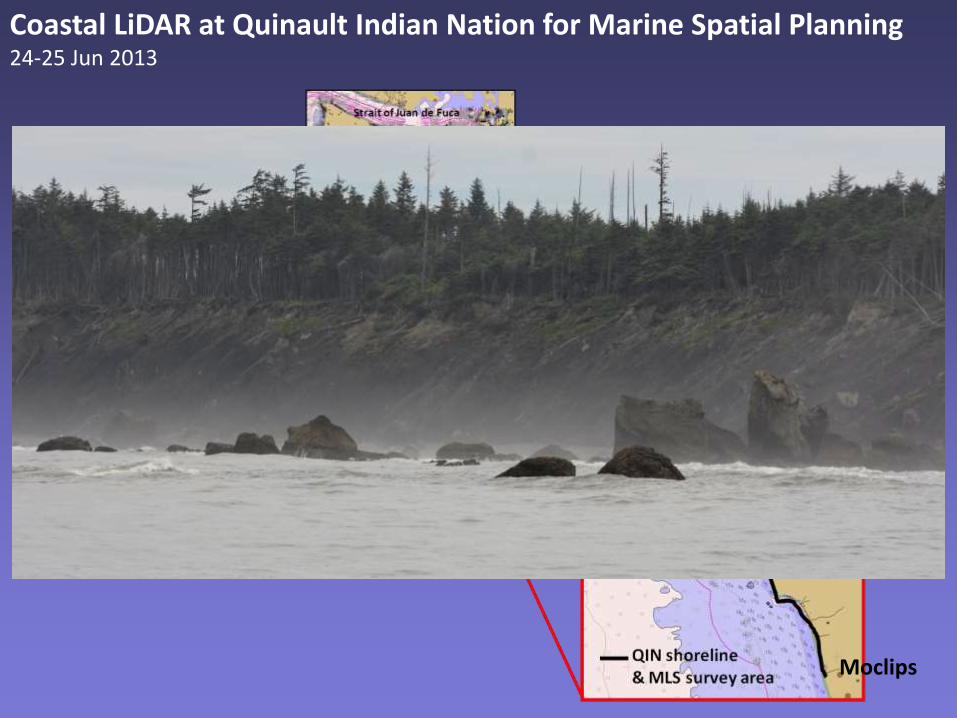
Coastal LiDAR at Quinault Indian Nation for Marine Spatial Planning 24-25 Jun 2013
Moclips
Kalaloch
~44 km of shoreline

Coastal LiDAR at Quinault Indian Nation for Marine Spatial Planning 24-25 Jun 2013

Multibeam and Coastal LiDAR at Empire Spit/Tokeland for Shoalwater Bay Flood and Coastal Storm Damage Reduction Project 9-16 Sept 2014
Elevation (m)
NAVD88
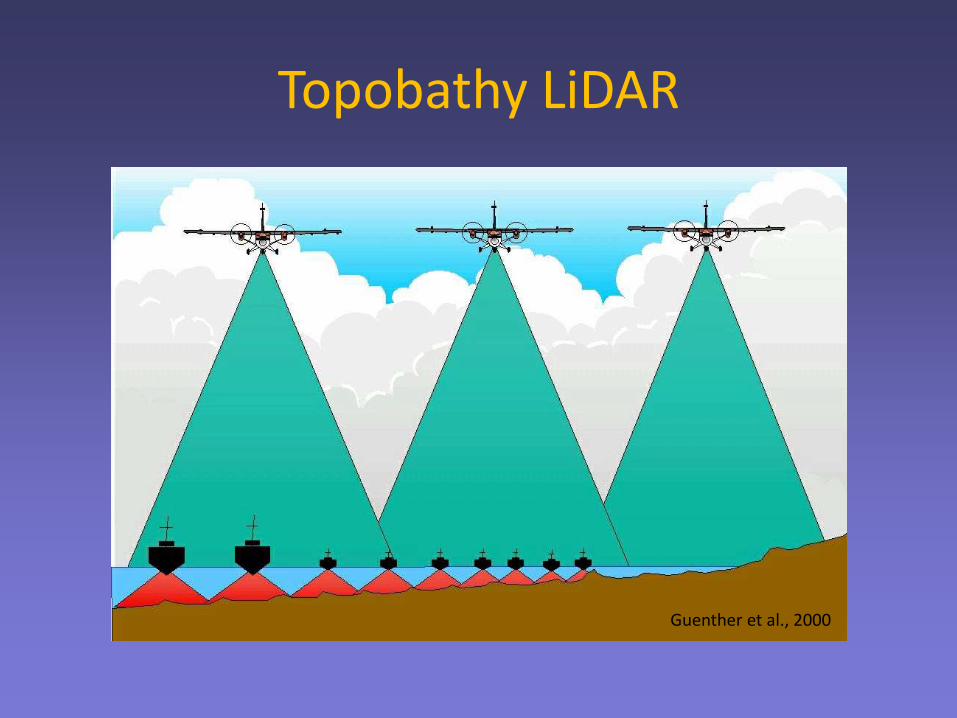
Topobathy LiDAR
Guenther et al., 2000

Topobathy LiDAR
LaRocque and West, 1990
Offers efficient surveys of nearshore bathymetry where water clarity is sufficient.
Optech CZMIL

2014 Southern Washington Coast

2014 Northern Washington Coast
Conclusions
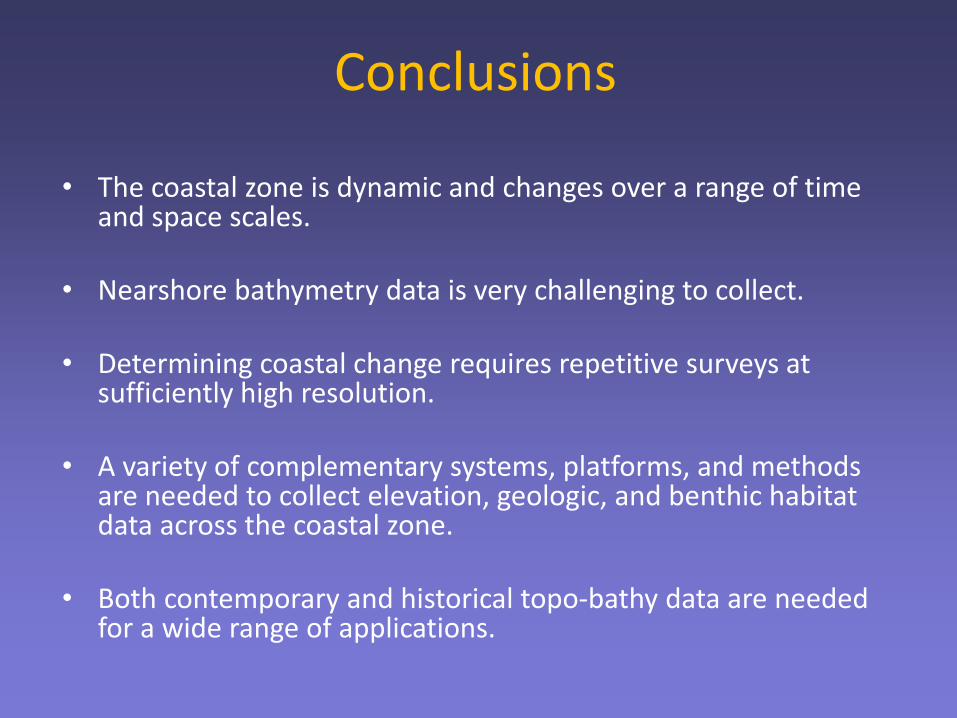
• The coastal zone is dynamic and changes over a range of time and space scales.
• Nearshore bathymetry data is very challenging to collect.
• Determining coastal change requires repetitive surveys at sufficiently high resolution.
• A variety of complementary systems, platforms, and methods are needed to collect elevation, geologic, and benthic habitat data across the coastal zone.
• Both contemporary and historical topo-bathy data are needed for a wide range of applications.