Coal Perspectives and Clean Coal Technologies World Wide · © IEA Clean Coal Centre World Energy...
64
© IEA Clean Coal Centre www.iea-coal.org.uk Coal Perspectives and Clean Coal Technologies World Wide International Workshop on Coal Technology: Petrobras& ABCM Dr John Topper Managing Director, IEA Clean Coal Centre 13 March 2007, Rio de Janeiro, Brazil
Transcript of Coal Perspectives and Clean Coal Technologies World Wide · © IEA Clean Coal Centre World Energy...
© IEA Clean Coal Centre www.iea-coal.org.uk
Coal Perspectives and Clean Coal Technologies World Wide
International Workshop on Coal Technology: Petrobras& ABCM
Dr John Topper
Managing Director, IEA Clean Coal Centre
13 March 2007, Rio de Janeiro, Brazil
© IEA Clean Coal Centre www.iea-coal.org.uk
World Energy Outlook 2006
Courtesy of Dr. Fatih BirolChief Economist
International Energy Agency
© IEA Clean Coal Centre www.iea-coal.org.uk
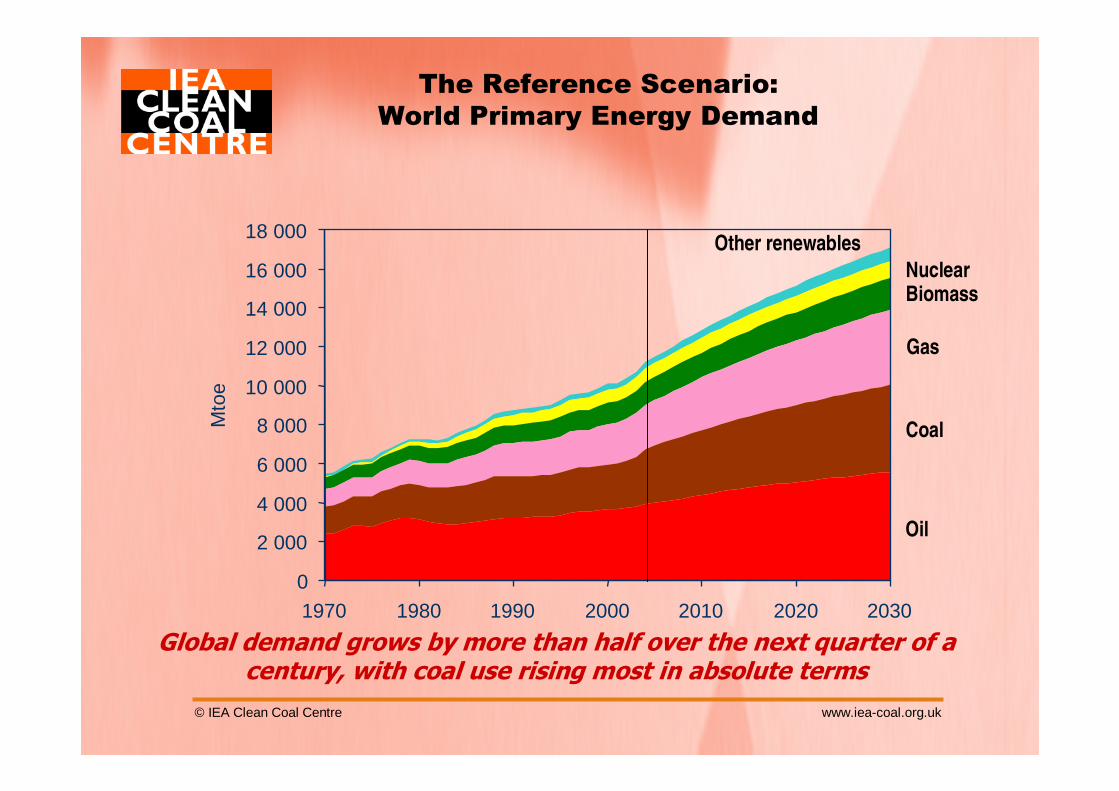
The Reference Scenario: World Primary Energy Demand
Global demand grows by more than half over the next quarter of acentury, with coal use rising most in absolute terms
Oil
Coal
Gas
BiomassNuclear
Other renewables
0
2 000
4 000
6 000
8 000
10 000
12 000
14 000
16 000
18 000
1970 1980 1990 2000 2010 2020 2030
Mto
e
© IEA Clean Coal Centre www.iea-coal.org.uk
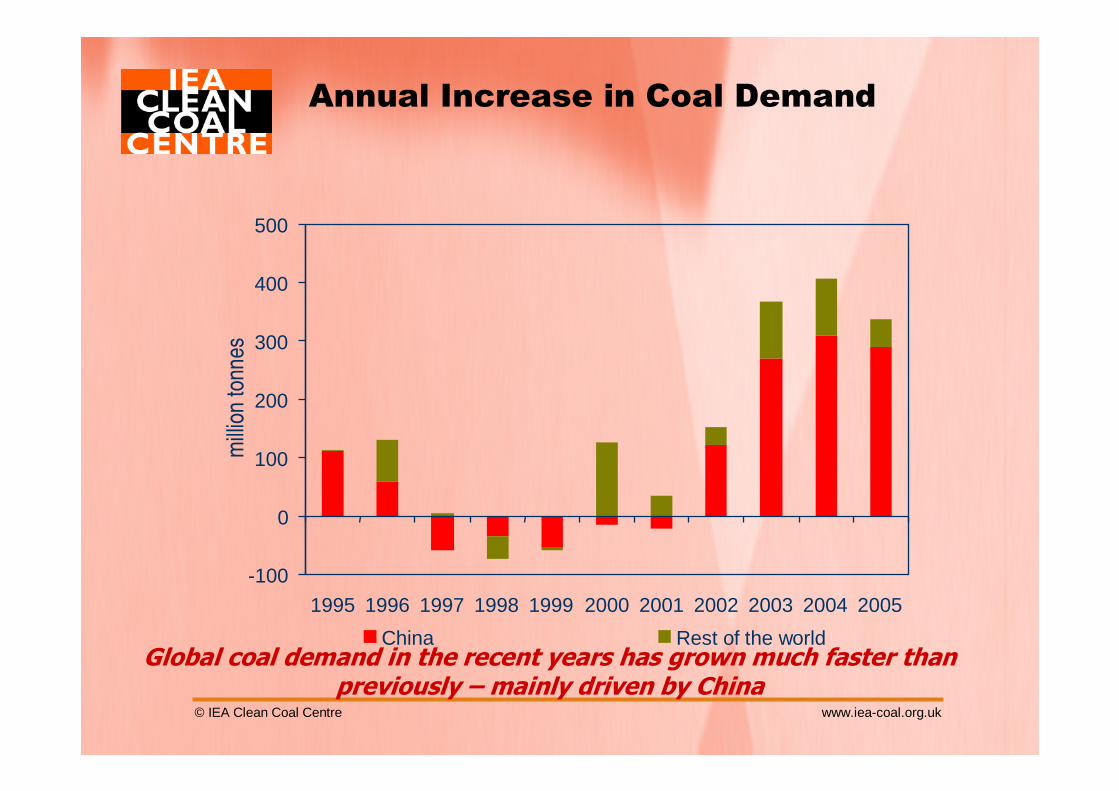
Annual Increase in Coal Demand
Global coal demand in the recent years has grown much faster than previously – mainly driven by China
mill
ion
tonn
es
-100
0
100
200
300
400
500
1995 1996 1997 1998 1999 2000 2001 2002 2003 2004 2005
China Rest of the world
© IEA Clean Coal Centre www.iea-coal.org.uk
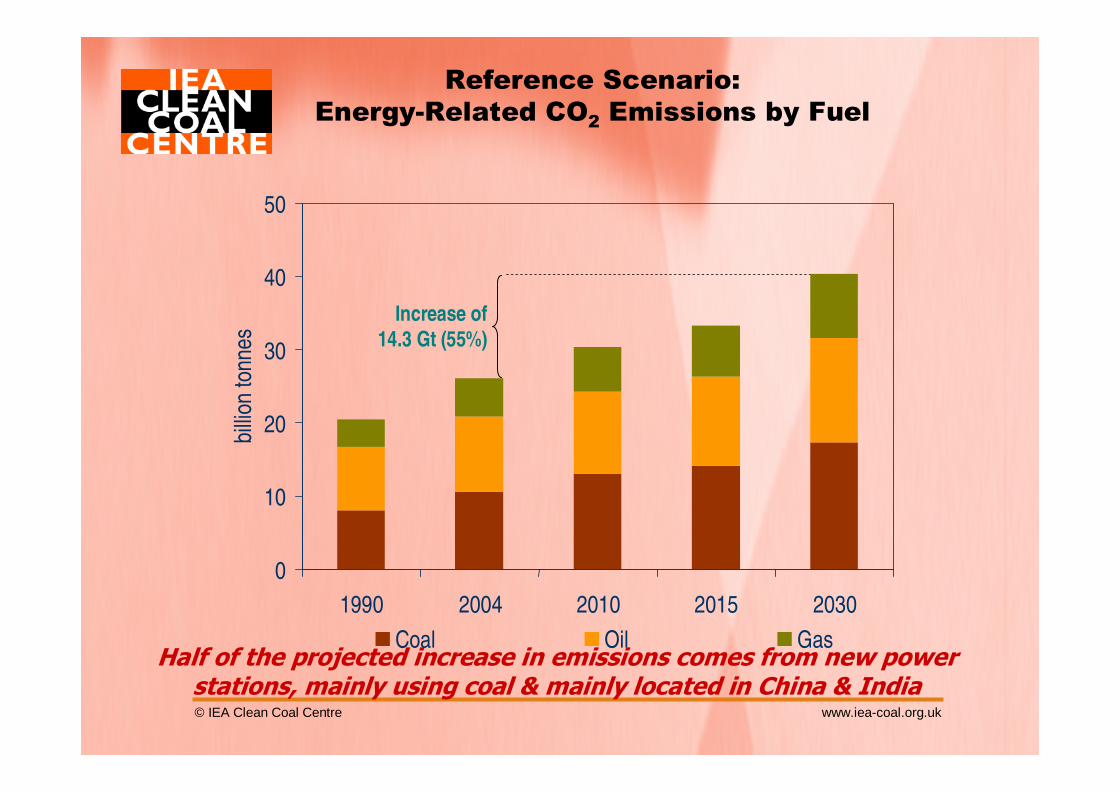
Reference Scenario: Energy-Related CO2 Emissions by Fuel
Half of the projected increase in emissions comes from new powerstations, mainly using coal & mainly located in China & India
Increase of 14.3 Gt (55%)
0
10
20
30
40
50
1990 2004 2010 2015 2030
billi
on to
nnes
Coal Oil Gas
© IEA Clean Coal Centre www.iea-coal.org.uk
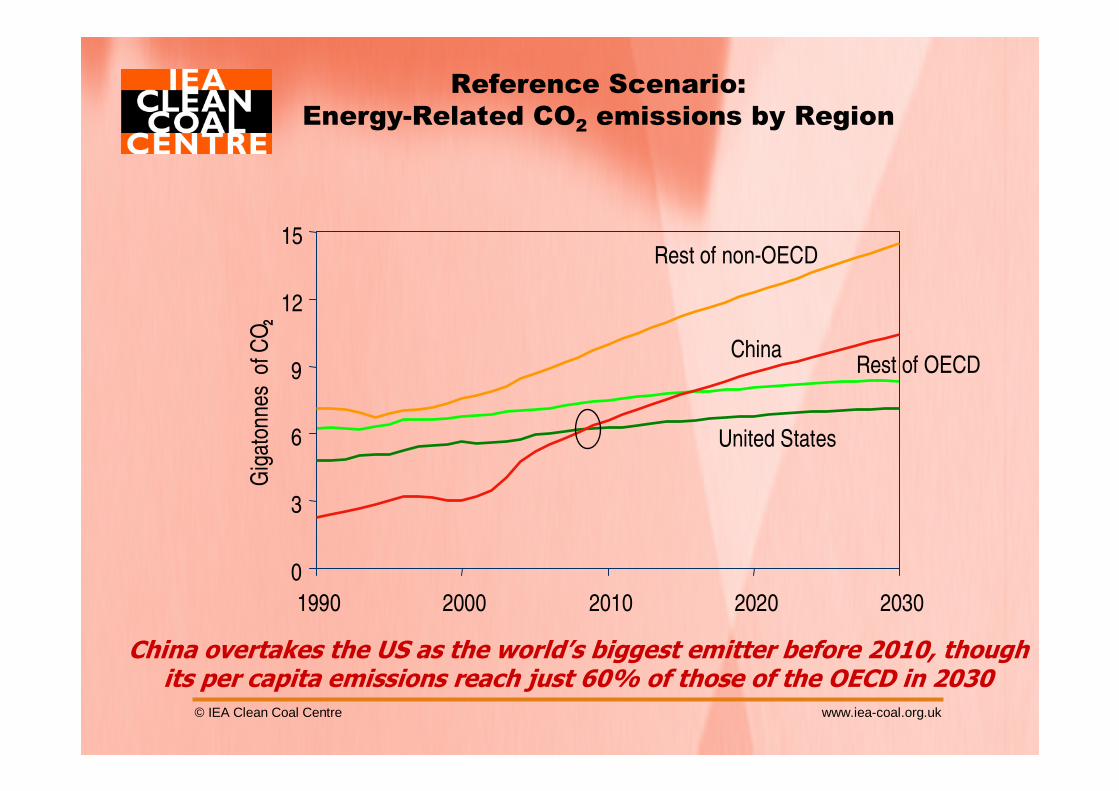
Reference Scenario:Energy-Related CO2 emissions by Region
China overtakes the US as the world’s biggest emitter before 2010, though its per capita emissions reach just 60% of those of the OECD in 2030
0
3
6
9
12
15
1990 2000 2010 2020 2030
Gig
aton
nes
of C
O2
United States
China
Rest of non-OECD
Rest of OECD
© IEA Clean Coal Centre www.iea-coal.org.uk
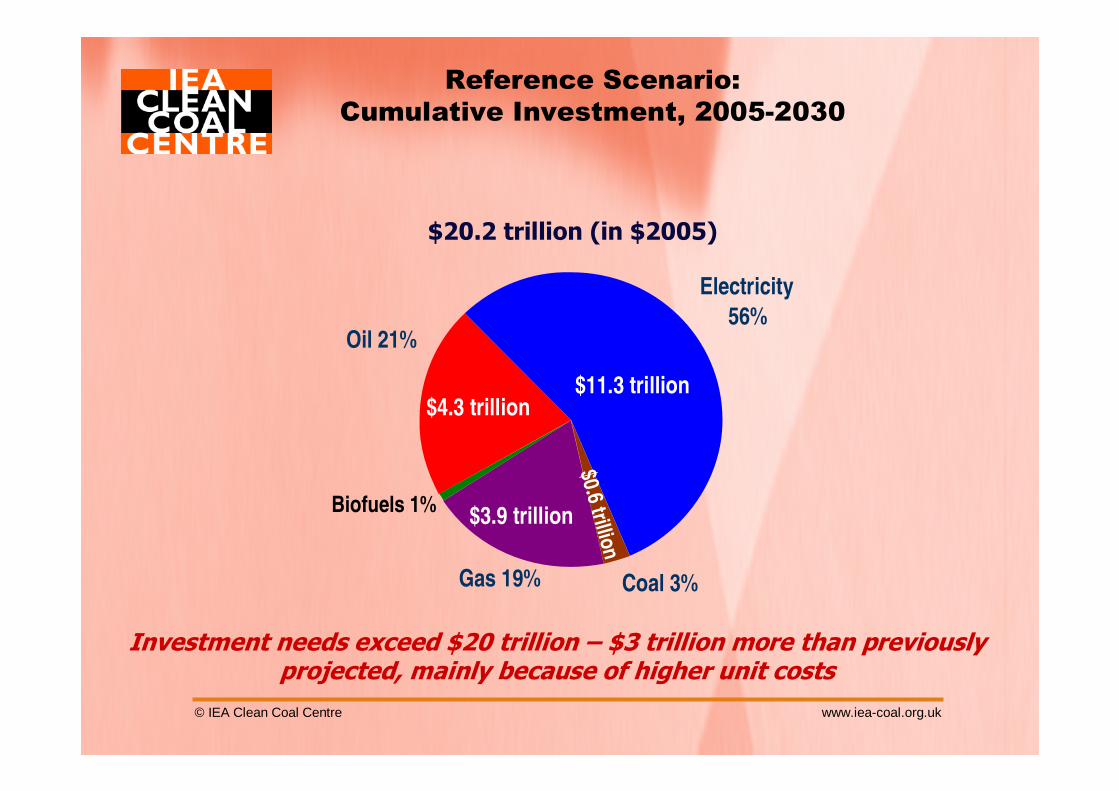
Oil 21%
Electricity
56%
Coal 3%Gas 19%
Reference Scenario: Cumulative Investment, 2005-2030
Investment needs exceed $20 trillion – $3 trillion more than previously projected, mainly because of higher unit costs
$20.2 trillion (in $2005)
$4.3 trillion$11.3 trillion
$3.9 trillion$0.6 trillion
Biofuels 1%
© IEA Clean Coal Centre www.iea-coal.org.uk
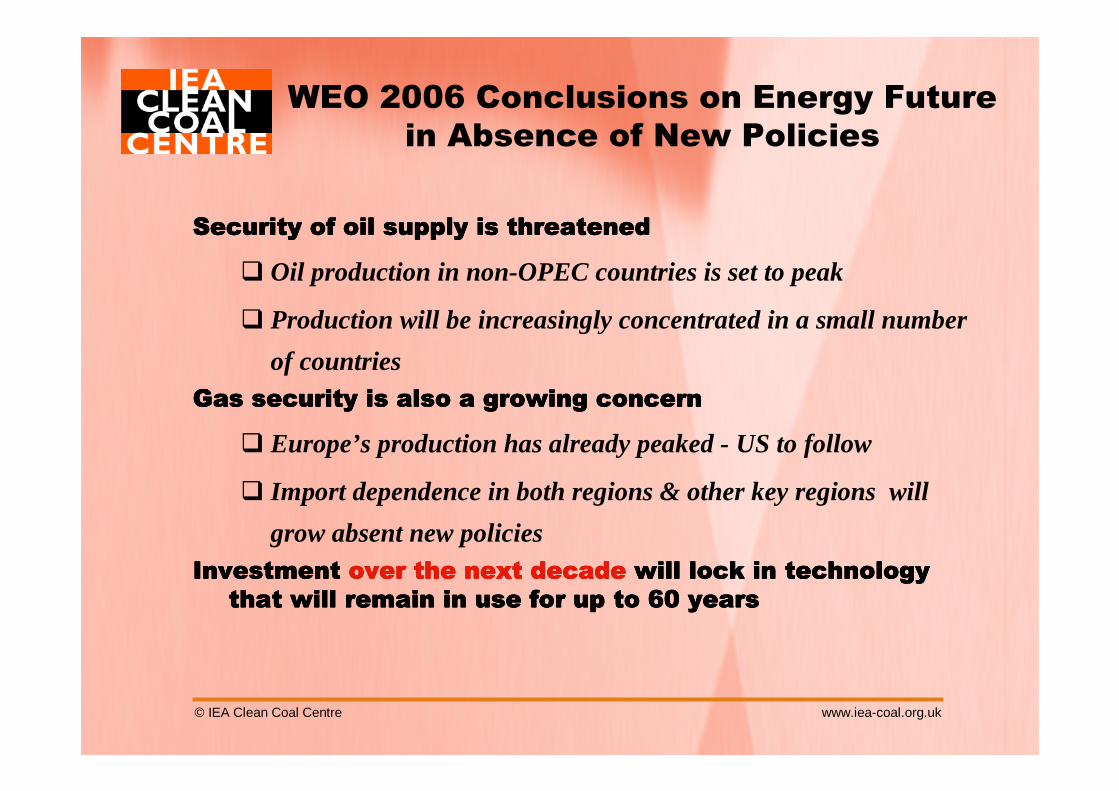
WEO 2006 Conclusions on Energy Future in Absence of New Policies
Security of oil supply is threatenedSecurity of oil supply is threatenedSecurity of oil supply is threatenedSecurity of oil supply is threatened
� Oil production in non-OPEC countries is set to peak
� Production will be increasingly concentrated in a small number
of countriesGas security is also a growing concernGas security is also a growing concernGas security is also a growing concernGas security is also a growing concern
� Europe’s production has already peaked - US to follow
� Import dependence in both regions & other key regions will
grow absent new policiesInvestment Investment Investment Investment over the next decadeover the next decadeover the next decadeover the next decade will lock in technology will lock in technology will lock in technology will lock in technology
that will remain in use for up to 60 yearsthat will remain in use for up to 60 yearsthat will remain in use for up to 60 yearsthat will remain in use for up to 60 years
© IEA Clean Coal Centre www.iea-coal.org.uk
PULVERISED COAL FOR POWER
What is State-of-the-Art and what are the prospects?
© IEA Clean Coal Centre www.iea-coal.org.uk
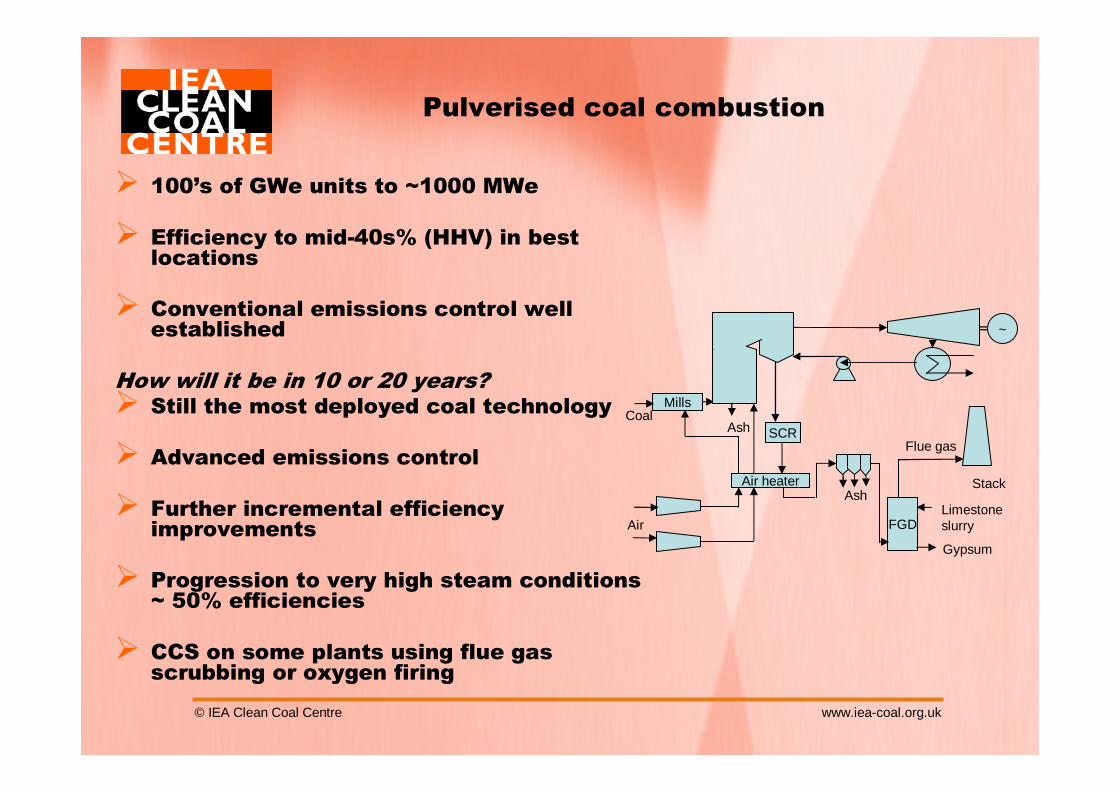
Pulverised coal combustion
� 100’s of GWe units to ~1000 MWe
� Efficiency to mid-40s% (HHV) in best locations
� Conventional emissions control well established
How will it be in 10 or 20 years?� Still the most deployed coal technology
� Advanced emissions control
� Further incremental efficiency improvements
� Progression to very high steam conditions ~ 50% efficiencies
� CCS on some plants using flue gas scrubbing or oxygen firing
~
Limestone slurry
Gypsum
Mills
Air heater
Ash
Air
Coal
AshStack
FGD
SCRFlue gas
© IEA Clean Coal Centre www.iea-coal.org.uk
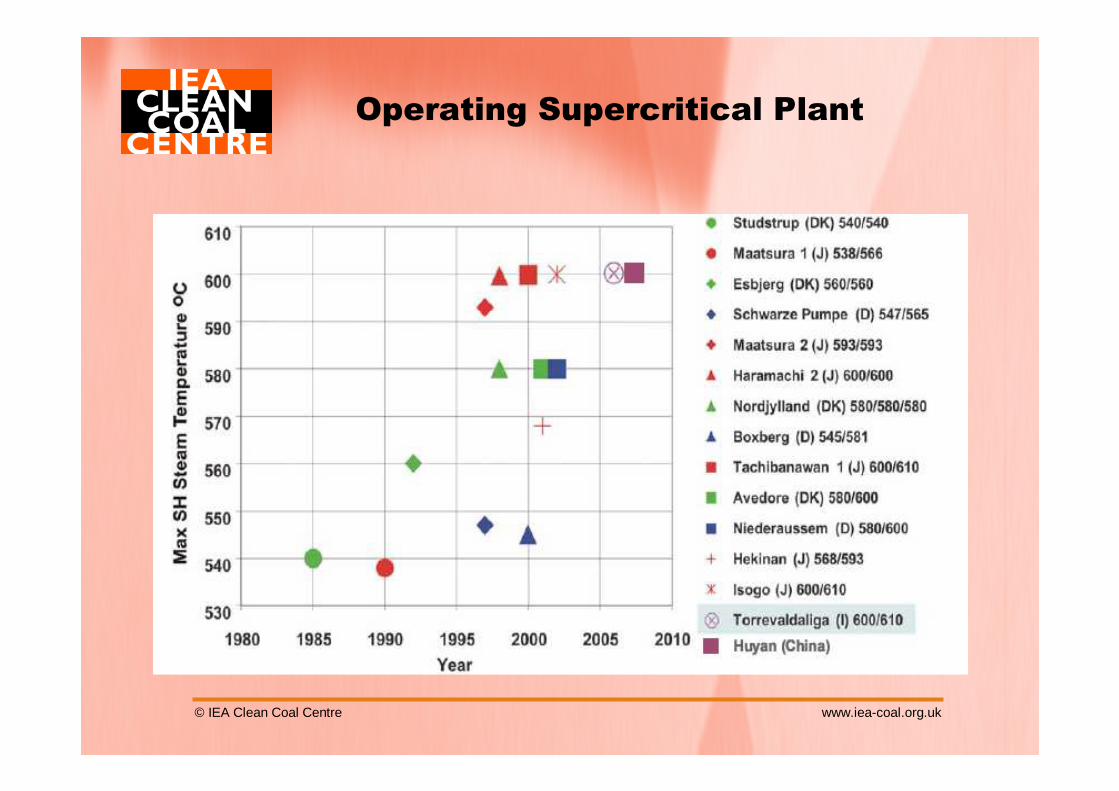
Operating Supercritical Plant
© IEA Clean Coal Centre www.iea-coal.org.uk
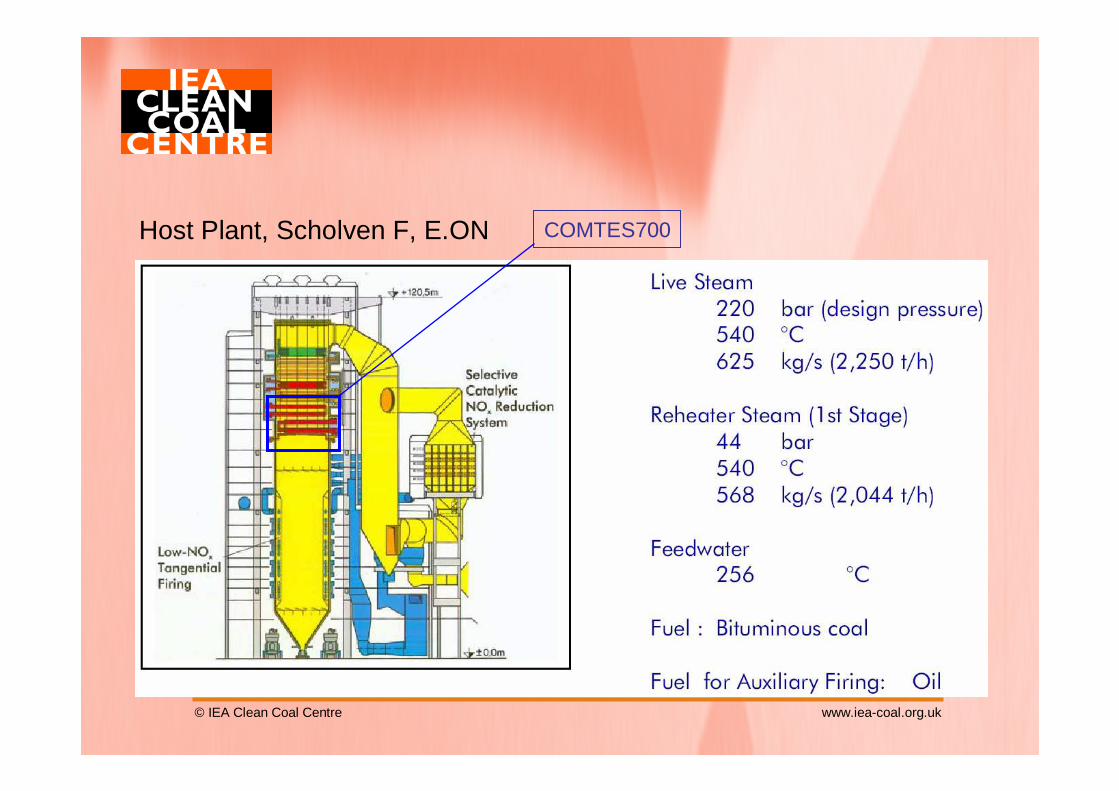
Host Plant, Scholven F, E.ON COMTES700
© IEA Clean Coal Centre www.iea-coal.org.uk
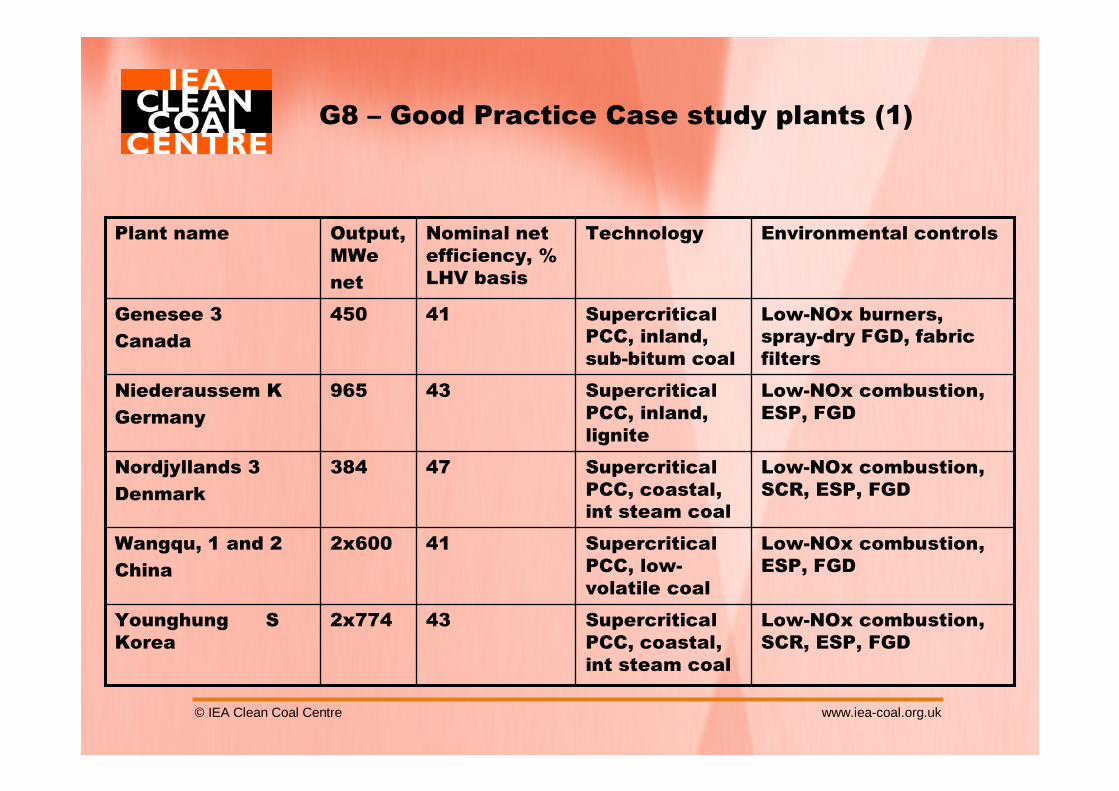
G8 – Good Practice Case study plants (1)
Low-NOx combustion, ESP, FGD
Supercritical PCC, inland, lignite
43965Niederaussem K
Germany
Low-NOx combustion, SCR, ESP, FGD
Supercritical PCC, coastal, int steam coal
432x774Younghung S Korea
Low-NOx combustion, ESP, FGD
Supercritical PCC, low-volatile coal
412x600Wangqu, 1 and 2
China
Low-NOx combustion, SCR, ESP, FGD
Supercritical PCC, coastal, int steam coal
47384Nordjyllands 3
Denmark
Low-NOx burners, spray-dry FGD, fabric filters
Supercritical PCC, inland, sub-bitum coal
41450Genesee 3
Canada
Environmental controlsTechnologyNominal net efficiency, % LHV basis
Output, MWe
net
Plant name
© IEA Clean Coal Centre www.iea-coal.org.uk
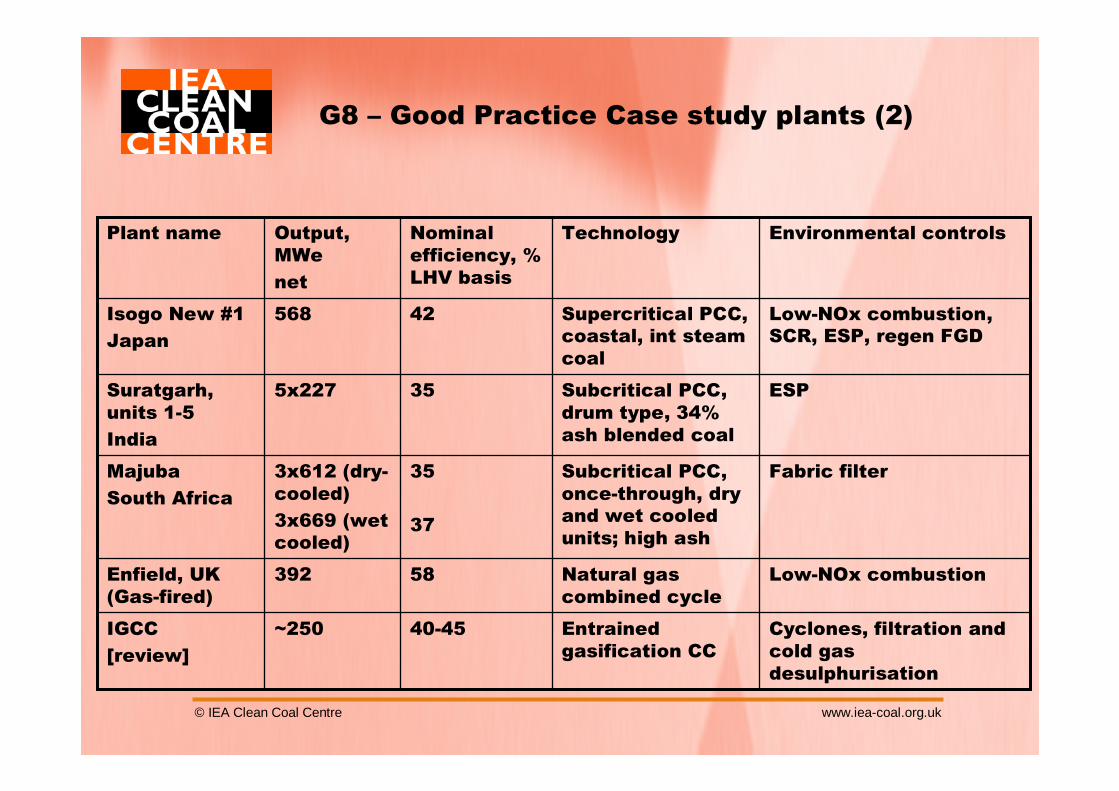
G8 – Good Practice Case study plants (2)
Cyclones, filtration and cold gas desulphurisation
Entrained gasification CC
40-45~250IGCC
[review]
Low-NOx combustionNatural gas combined cycle
58392Enfield, UK (Gas-fired)
Fabric filterSubcritical PCC, once-through, dry and wet cooled units; high ash
35
37
3x612 (dry-cooled)
3x669 (wet cooled)
Majuba
South Africa
ESPSubcritical PCC, drum type, 34% ash blended coal
355x227Suratgarh, units 1-5
India
Low-NOx combustion, SCR, ESP, regen FGD
Supercritical PCC, coastal, int steam coal
42568Isogo New #1
Japan
Environmental controlsTechnologyNominal efficiency, % LHV basis
Output, MWe
net
Plant name
© IEA Clean Coal Centre www.iea-coal.org.uk
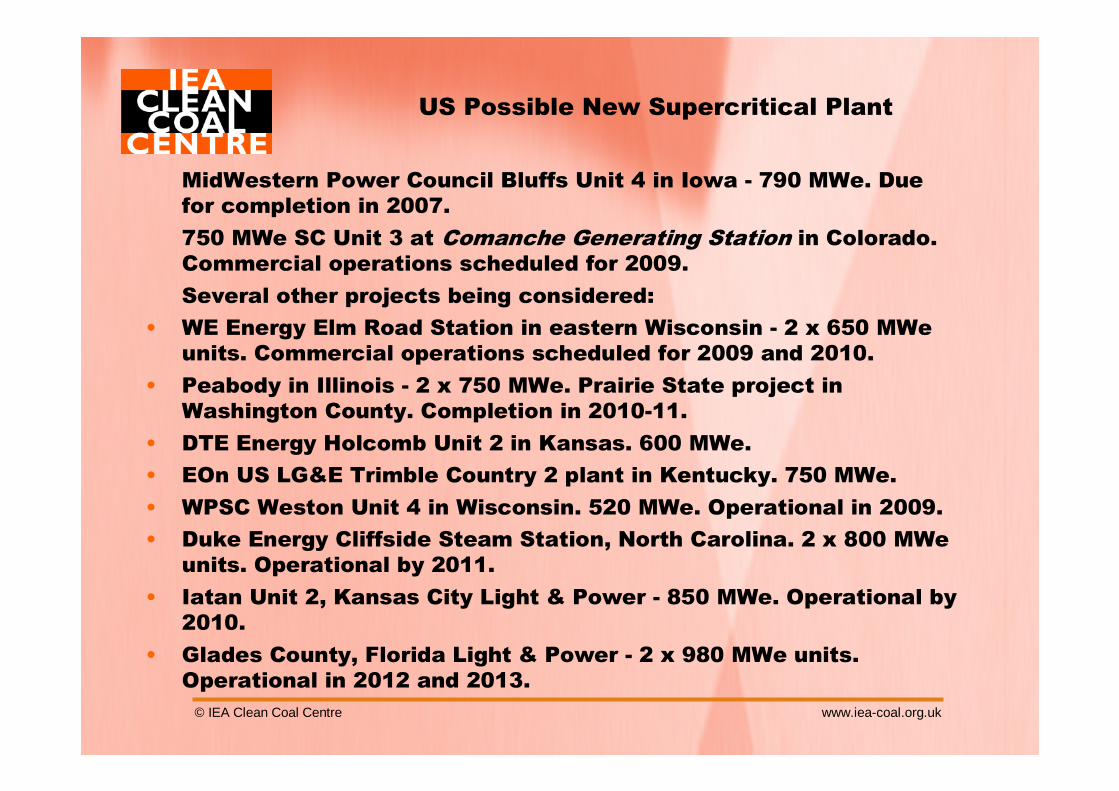
US Possible New Supercritical Plant
MidWestern Power Council Bluffs Unit 4 in Iowa - 790 MWe. Due for completion in 2007.
750 MWe SC Unit 3 at Comanche Generating Station in Colorado. Commercial operations scheduled for 2009.
Several other projects being considered:
• WE Energy Elm Road Station in eastern Wisconsin - 2 x 650 MWeunits. Commercial operations scheduled for 2009 and 2010.
• Peabody in Illinois - 2 x 750 MWe. Prairie State project in Washington County. Completion in 2010-11.
• DTE Energy Holcomb Unit 2 in Kansas. 600 MWe.
• EOn US LG&E Trimble Country 2 plant in Kentucky. 750 MWe.
• WPSC Weston Unit 4 in Wisconsin. 520 MWe. Operational in 2009.
• Duke Energy Cliffside Steam Station, North Carolina. 2 x 800 MWeunits. Operational by 2011.
• Iatan Unit 2, Kansas City Light & Power - 850 MWe. Operational by 2010.
• Glades County, Florida Light & Power - 2 x 980 MWe units. Operational in 2012 and 2013.
© IEA Clean Coal Centre www.iea-coal.org.uk
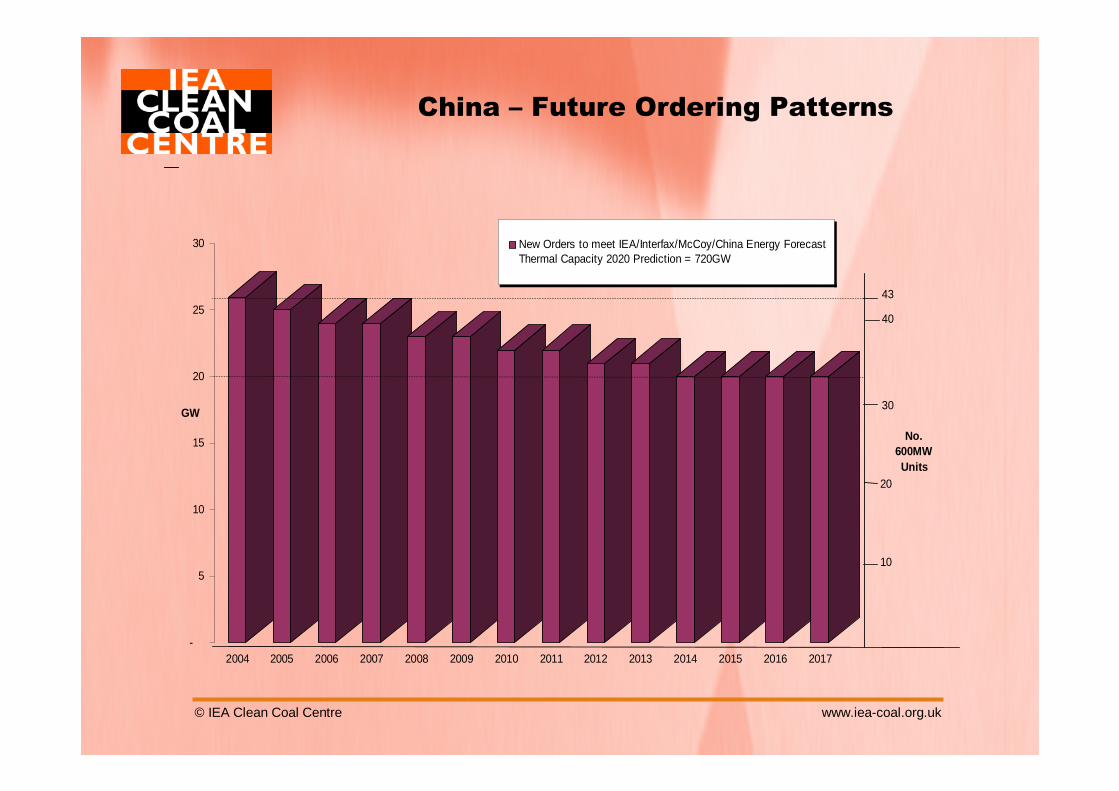
China – Future Ordering Patterns
-
5
10
15
20
25
30
2004 2005 2006 2007 2008 2009 2010 2011 2012 2013 2014 2015 2016 2017
New Orders to meet IEA/Interfax/McCoy/China Energy ForecastThermal Capacity 2020 Prediction = 720GW
GW
10
20
30
40
43
No.600MWUnits
© IEA Clean Coal Centre www.iea-coal.org.uk
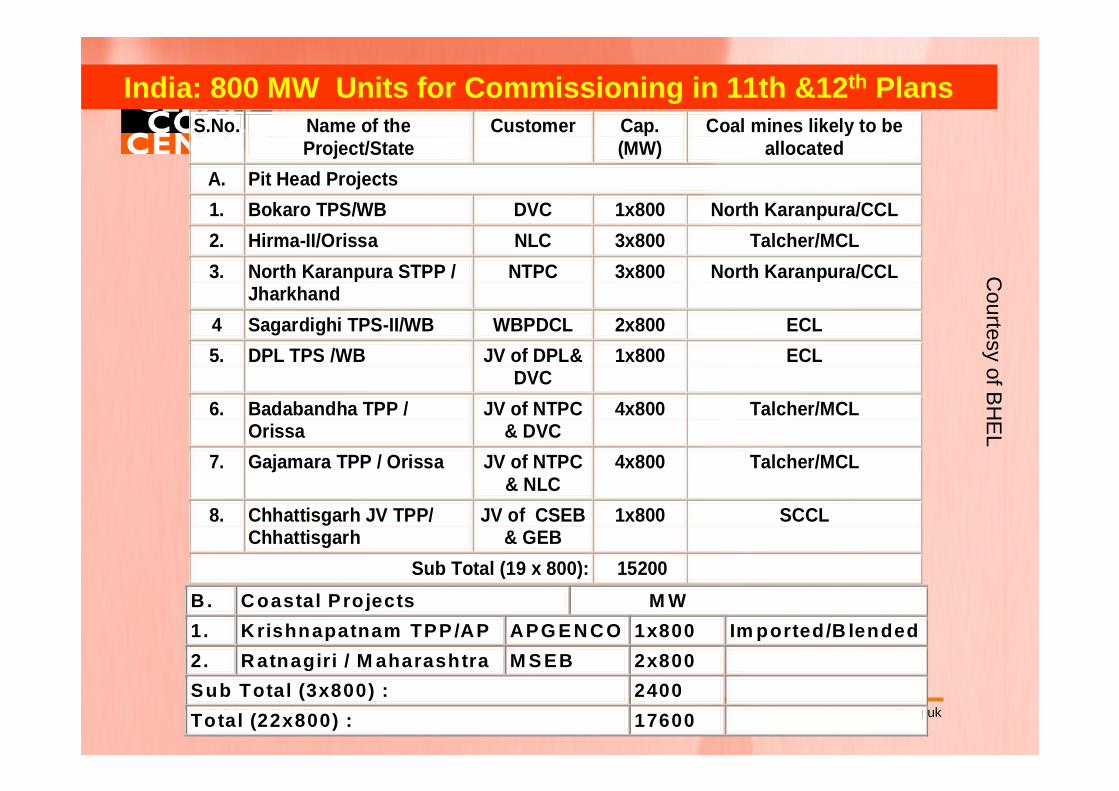
S.No. Name of the Project/State
Customer Cap. (MW)
Coal mines likely to be allocated
A. Pit Head Projects
1. Bokaro TPS/WB DVC 1x800 North Karanpura/CCL
2. Hirma-II/Orissa NLC 3x800 Talcher/MCL
3. North Karanpura STPP / Jharkhand
NTPC 3x800 North Karanpura/CCL
4 Sagardighi TPS-II/WB WBPDCL 2x800 ECL
5. DPL TPS /WB JV of DPL& DVC
1x800 ECL
6. Badabandha TPP / Orissa
JV of NTPC & DVC
4x800 Talcher/MCL
7. Gajamara TPP / Orissa JV of NTPC & NLC
4x800 Talcher/MCL
8. Chhattisgarh JV TPP/ Chhattisgarh
JV of CSEB & GEB
1x800 SCCL
Sub Total (19 x 800): 15200
India: 800 MW Units for Commissioning in 11th &12 th PlansC
ourtesy of BH
EL
B . C oastal P ro jects M W
1. K rishnapatnam TPP /AP APG E N C O 1x800 Im ported/B lended
2. R atnagiri / M aharashtra M S EB 2x800
Sub Total (3x800) : 2400
Total (22x800) : 17600
© IEA Clean Coal Centre www.iea-coal.org.uk
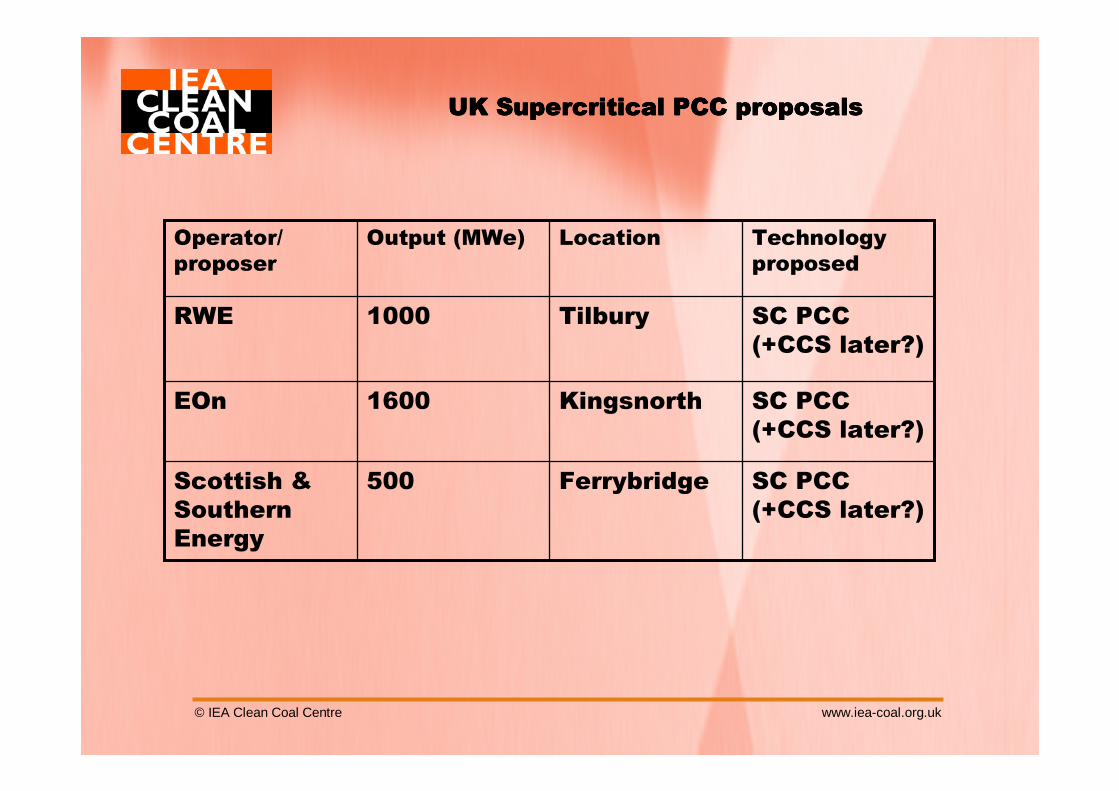
UK Supercritical PCC proposalsUK Supercritical PCC proposalsUK Supercritical PCC proposalsUK Supercritical PCC proposals
Technology proposed
LocationOutput (MWe)Operator/ proposer
SC PCC (+CCS later?)
Ferrybridge500Scottish & Southern Energy
SC PCC (+CCS later?)
Kingsnorth1600EOn
SC PCC (+CCS later?)
Tilbury1000RWE

© IEA Clean Coal Centre www.iea-coal.org.uk
Lagisza Supercritical CFBC – new design
• The world’s first CFBC unit with supercritical steam conditions
• Largest CFBC; 460 MWe
• Start-up in 2009
• Emissions of SOx, NOxand particulates lower than required by latest EU LCPD limits.
• Located to NE of Katowice, Poland
© IEA Clean Coal Centre www.iea-coal.org.uk
TOWARDS ZERO EMISSIONS

© IEA Clean Coal Centre www.iea-coal.org.uk
CarbonReduction
Time
`IncreasedEfficiency`Trajectory
`Zero Emissions`Trajectory
Near-term Mid-term Long-term
Zero emissions will need the most efficient plant
Key issue will be value of CO2
Carbon Abatement Technology Options are complementary
© IEA Clean Coal Centre www.iea-coal.org.uk
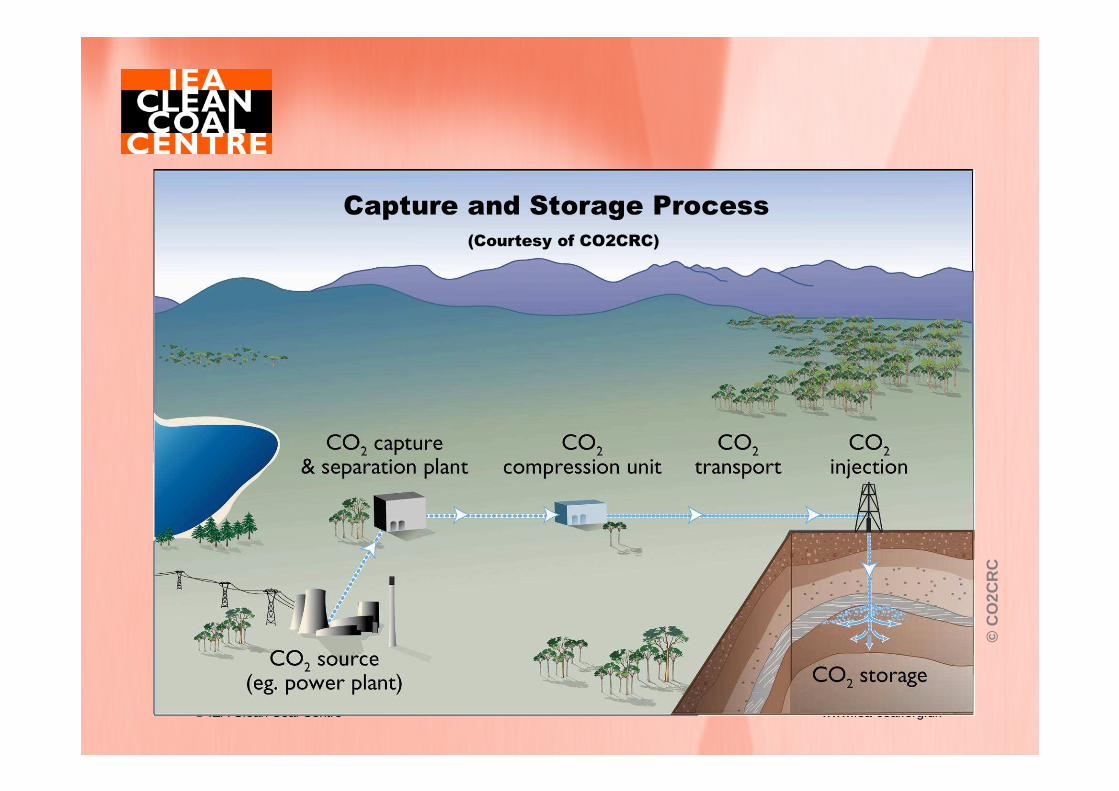
©C
O2C
RC
Capture and Storage Process(Courtesy of CO2CRC)
© IEA Clean Coal Centre www.iea-coal.org.uk
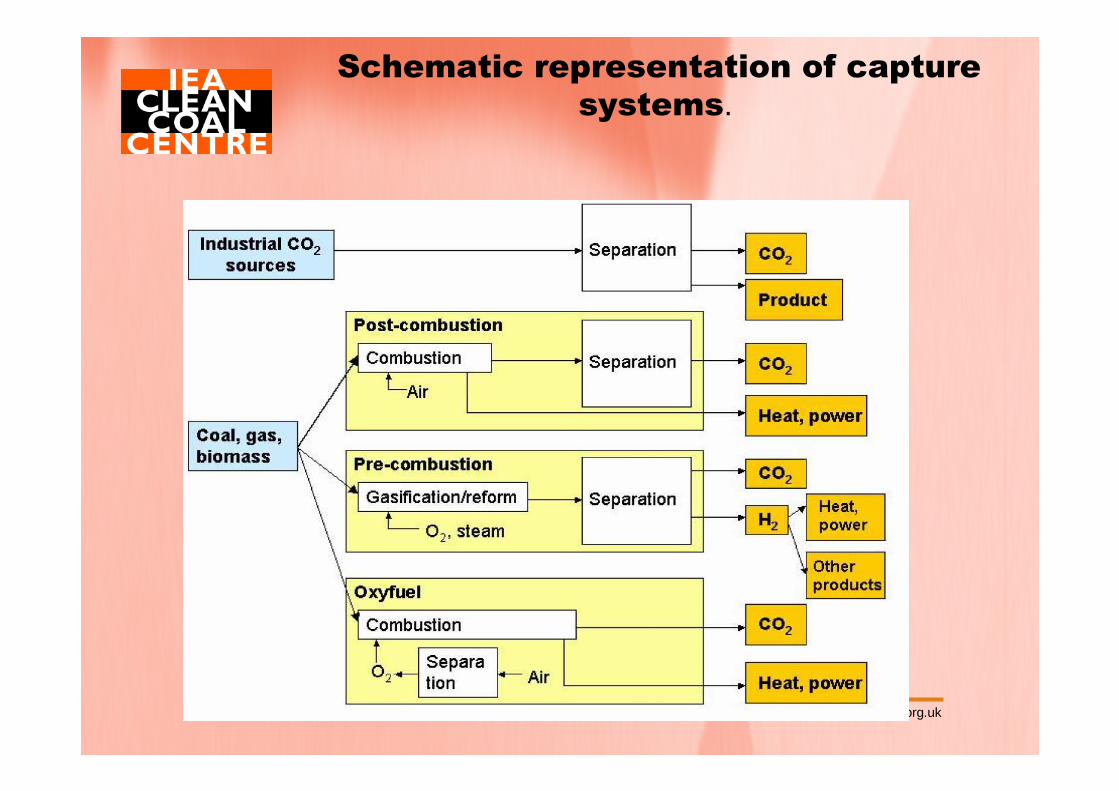
Schematic representation of capture systems.
© IEA Clean Coal Centre www.iea-coal.org.uk
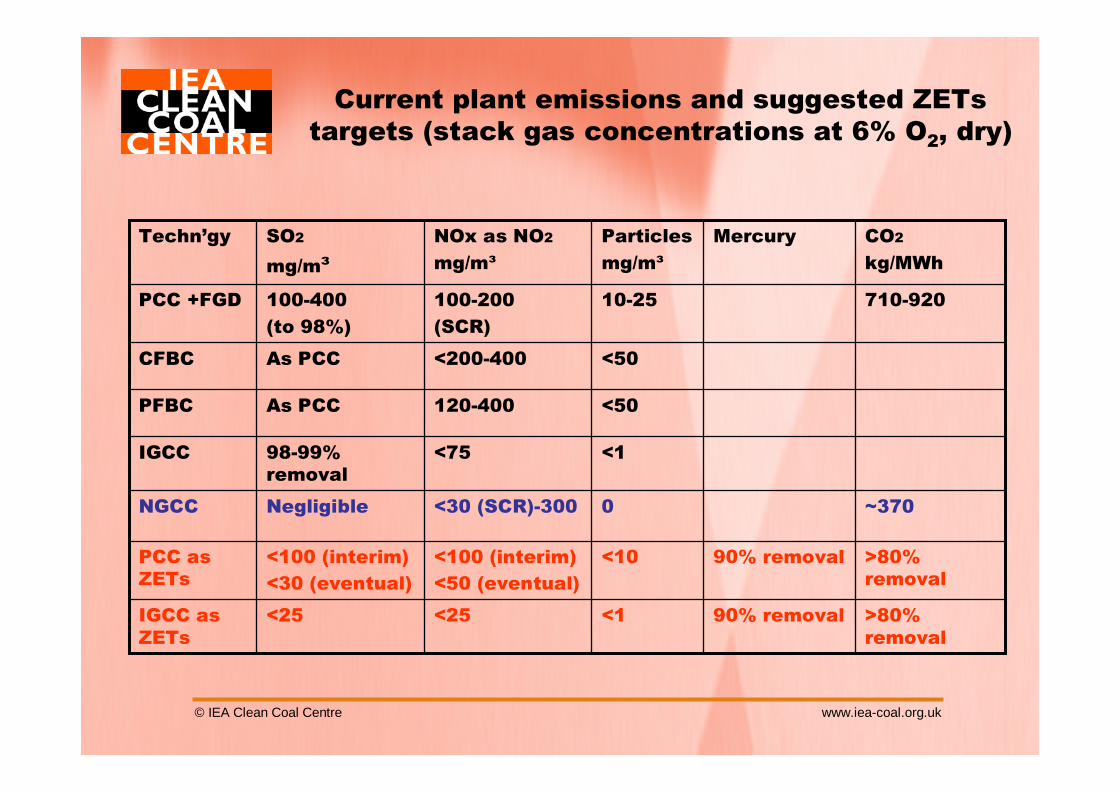
Current plant emissions and suggested ZETstargets (stack gas concentrations at 6% O2, dry)
>80% removal
90% removal<1<25<25IGCC as ZETs
>80% removal
90% removal<10<100 (interim)
<50 (eventual)
<100 (interim)
<30 (eventual)
PCC as ZETs
~3700<30 (SCR)-300NegligibleNGCC
<1<7598-99% removal
IGCC
<50120-400As PCCPFBC
<50<200-400As PCCCFBC
710-92010-25100-200
(SCR)
100-400
(to 98%)
PCC +FGD
CO2
kg/MWh
MercuryParticles
mg/m³
NOx as NO2
mg/m³
SO2
mg/m³
Techn’gy
© IEA Clean Coal Centre www.iea-coal.org.uk
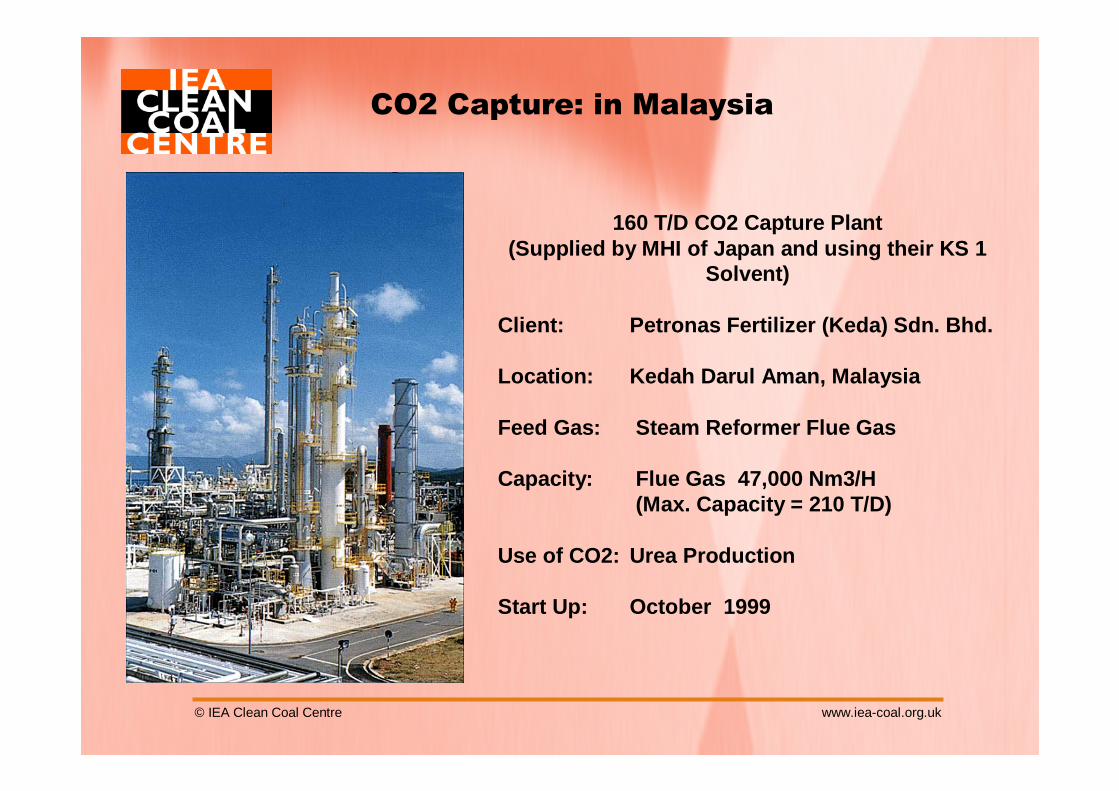
160 T/D CO2 Capture Plant(Supplied by MHI of Japan and using their KS 1
Solvent)
Client: Petronas Fertilizer (Keda) Sdn. Bhd.
Location: Kedah Darul Aman, Malaysia
Feed Gas: Steam Reformer Flue Gas
Capacity: Flue Gas 47,000 Nm3/H(Max. Capacity = 210 T/D)
Use of CO2: Urea Production
Start Up: October 1999
CO2 Capture: in Malaysia
© IEA Clean Coal Centre www.iea-coal.org.uk
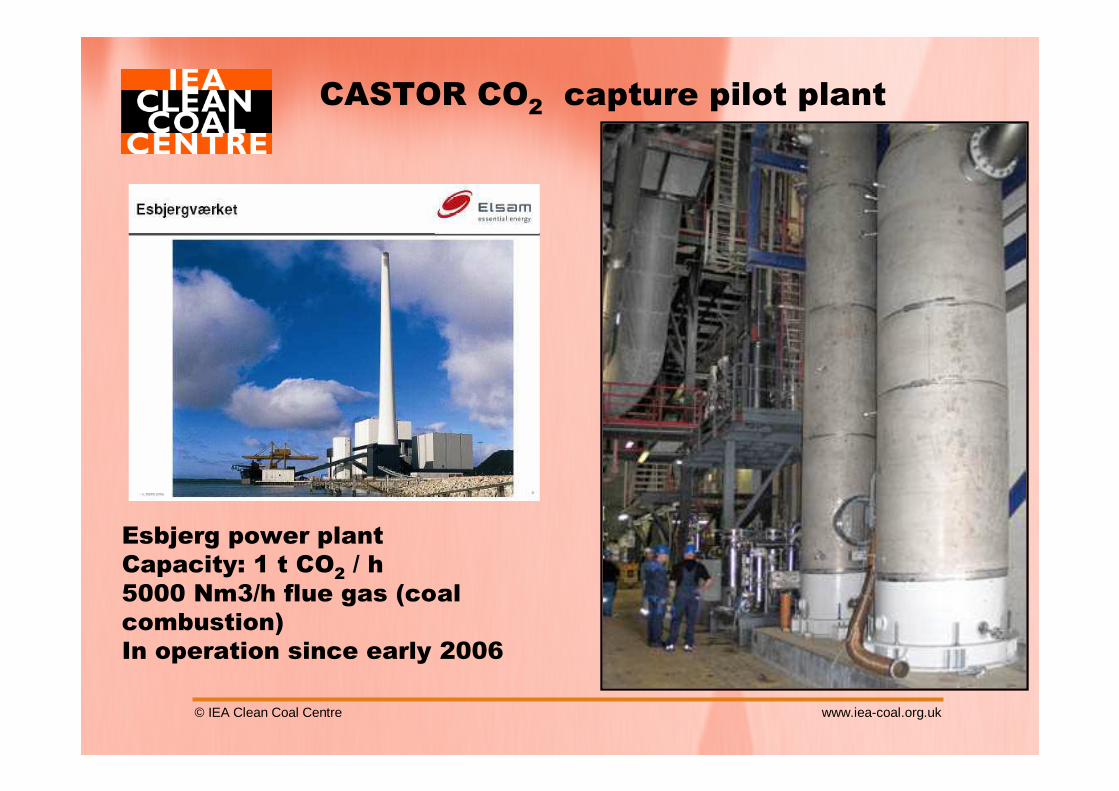
CASTOR CO2 capture pilot plant
Esbjerg power plantCapacity: 1 t CO2 / h5000 Nm3/h flue gas (coal combustion)In operation since early 2006
© IEA Clean Coal Centre www.iea-coal.org.uk
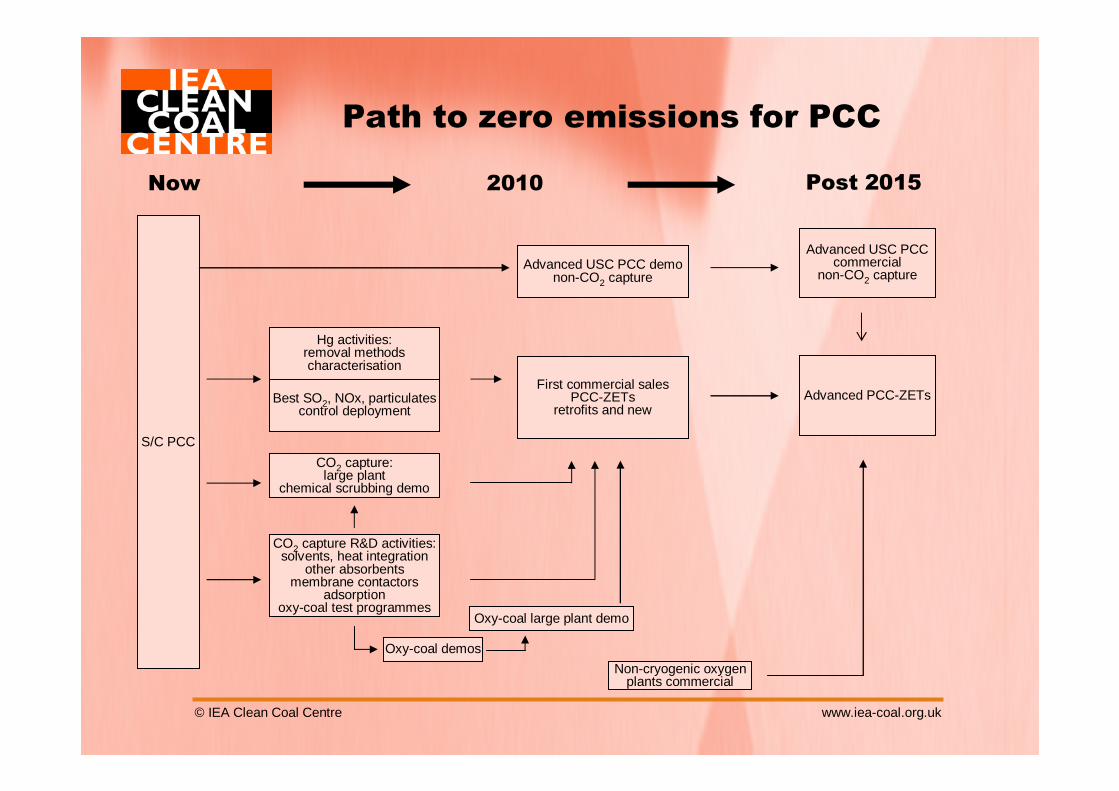
Path to zero emissions for PCC
S/C PCC
Hg activities:removal methodscharacterisation
First commercial salesPCC-ZETs
retrofits and newAdvanced PCC-ZETsBest SO2, NOx, particulates
control deployment
CO2 capture:large plant
chemical scrubbing demo
CO2 capture R&D activities:solvents, heat integration
other absorbentsmembrane contactors
adsorptionoxy-coal test programmes
Advanced USC PCC demonon-CO2 capture
Advanced USC PCCcommercial
non-CO2 capture
Non-cryogenic oxygenplants commercial
Oxy-coal demos
Oxy-coal large plant demo
Post 2015Now 2010
www.ieagreen.org.uk
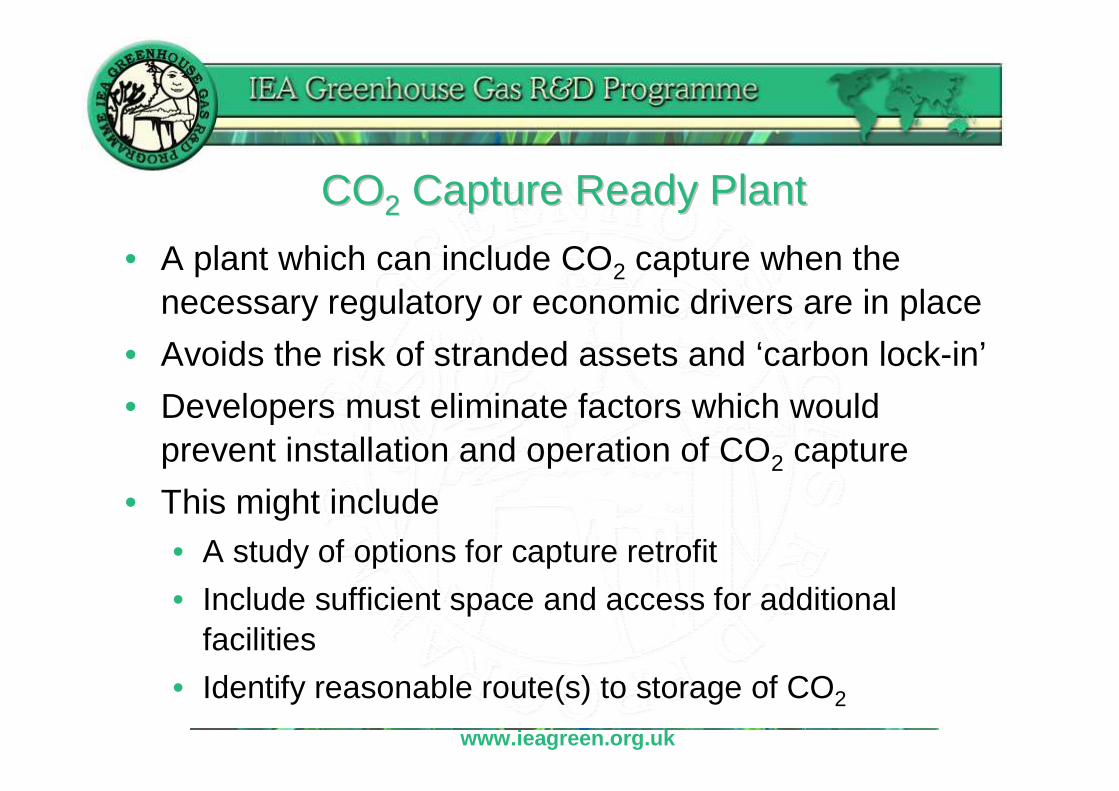
COCO22 Capture Ready PlantCapture Ready Plant
• A plant which can include CO2 capture when the necessary regulatory or economic drivers are in place
• Avoids the risk of stranded assets and ‘carbon lock-in’
• Developers must eliminate factors which would prevent installation and operation of CO2 capture
• This might include• A study of options for capture retrofit
• Include sufficient space and access for additional facilities
• Identify reasonable route(s) to storage of CO2
www.ieagreen.org.uk
COCO22 Capture Ready PlantCapture Ready Plant
• Some pre-investments could be made to reduce the future cost of capture retrofit• For example, oversizing equipment
• Factors to take into account when considering pre-investment• Uncertainty about if or when capture would be retrofitted• Uncertainty about developments in capture technology
and the optimum technology in future• Economic discounting reduces the value of future cost
savings
© IEA Clean Coal Centre www.iea-coal.org.uk
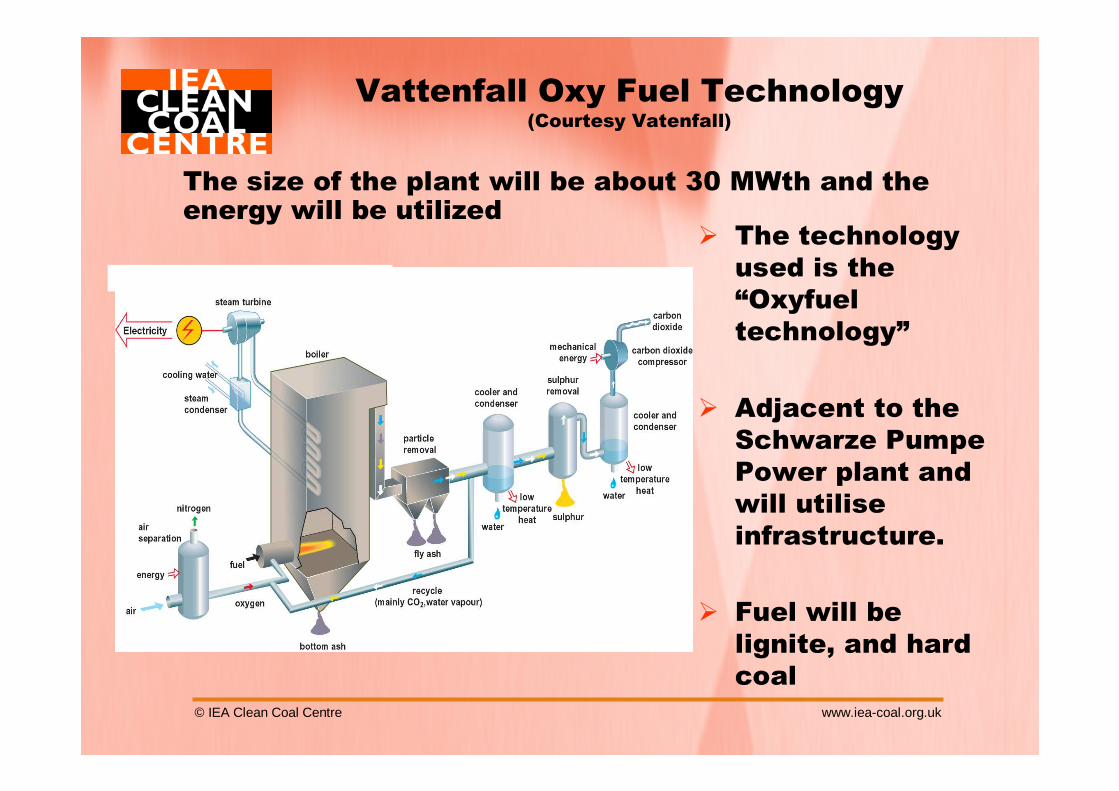
Vattenfall Oxy Fuel Technology(Courtesy Vatenfall)
The size of the plant will be about 30 MWth and the energy will be utilized
� The technology used is the “Oxyfuel technology”
� Adjacent to the Schwarze PumpePower plant and will utiliseinfrastructure.
� Fuel will be lignite, and hard coal
© IEA Clean Coal Centre www.iea-coal.org.uk
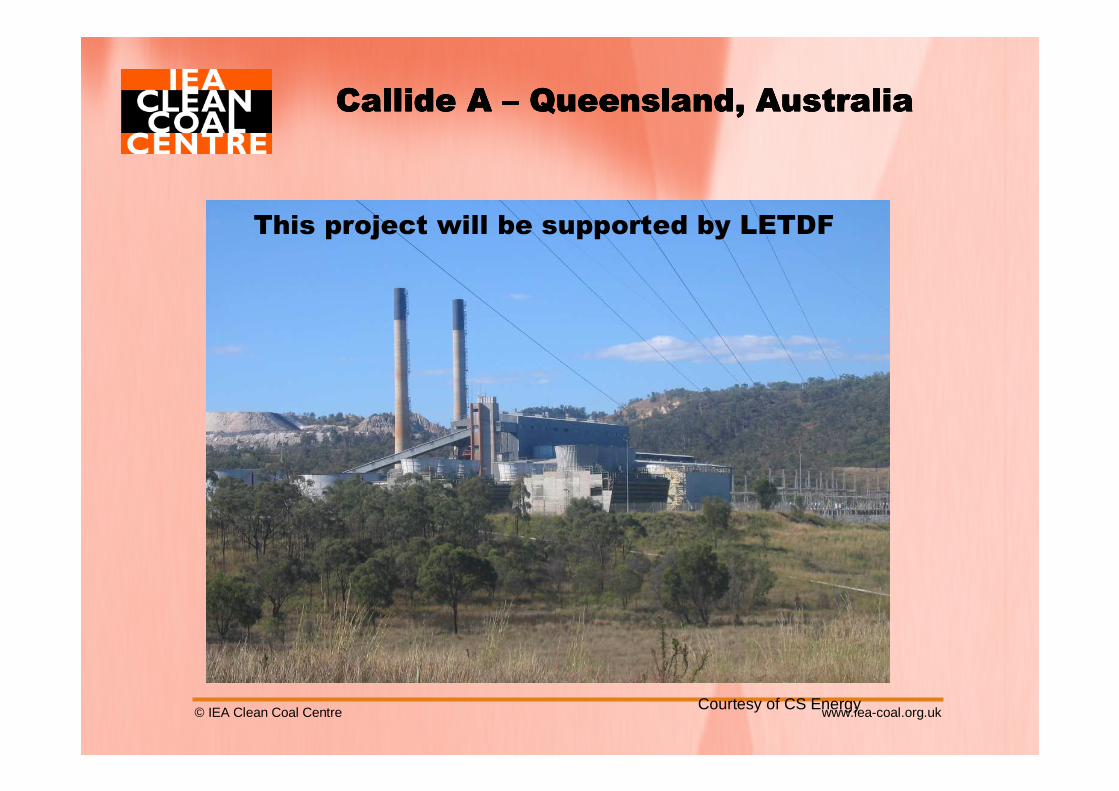
Callide A Callide A Callide A Callide A –––– Queensland, AustraliaQueensland, AustraliaQueensland, AustraliaQueensland, Australia
Courtesy of CS Energy
This project will be supported by LETDF

© IEA Clean Coal Centre www.iea-coal.org.uk
Pilot-scale oxy fuel testing by IHI at Aioi (Japan)
Test facility:
– Capacity 1.2 MWt (~ 150 kg coal/h)– Furnace size – 1.3m dia x 7.5 m
Objectives:
– Compare air- vs oxy-firing combustion and emissions– Additional validation of Callide A boiler model– Investor confidence– Ash samples for other CCSD Projects
Status:
– Callide & Acland coals tested in Sep. 05– Rolleston coal to be tested in Dec. 05
Measurements:– Burnout and temperature profiles– Ash deposition tares– Emissions including Hg– Turn-down effects– Fly ash for characterization
© IEA Clean Coal Centre www.iea-coal.org.uk
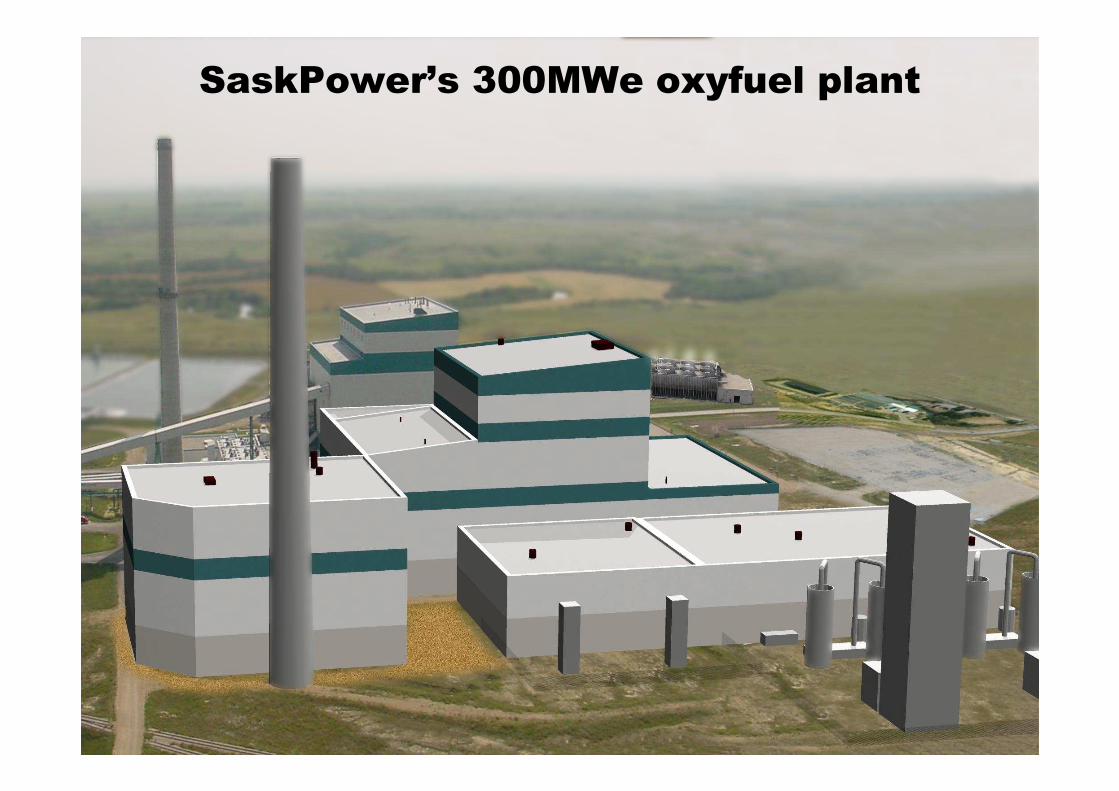
SaskPower’s 300MWe oxyfuel plant
© IEA Clean Coal Centre www.iea-coal.org.uk
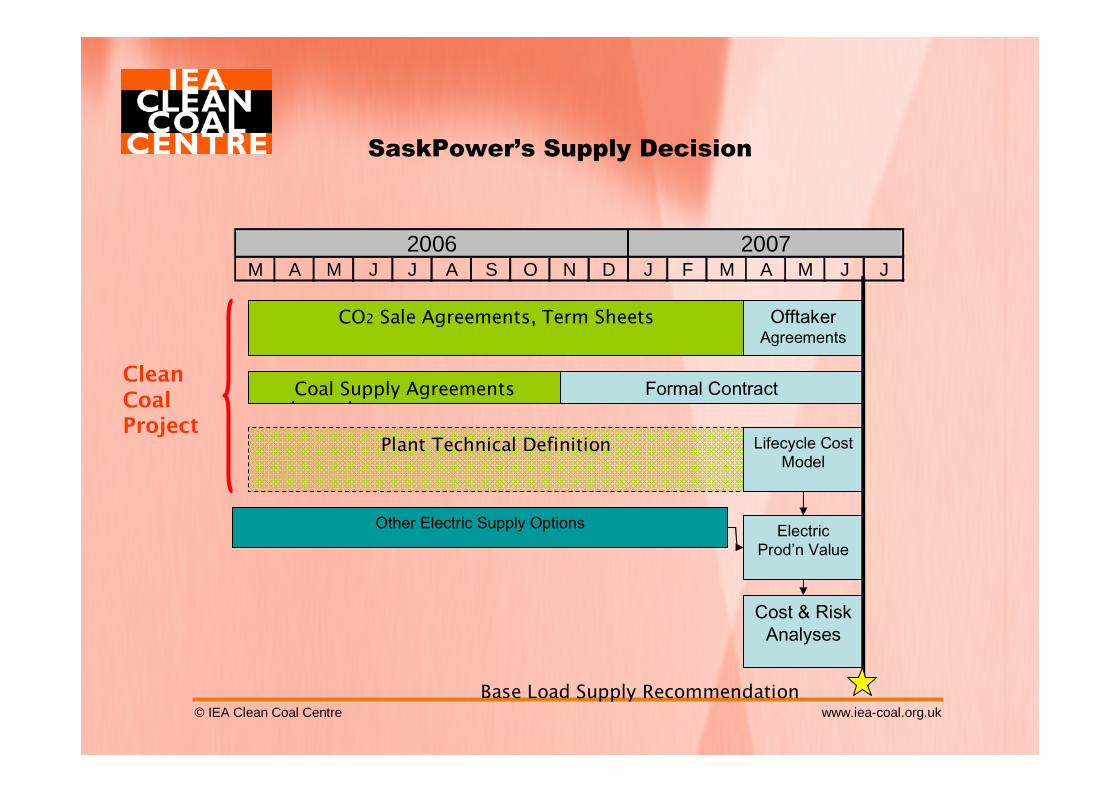
SaskPower’s Supply Decision
M A M J J A S O N D J F M A M J J2006 2007
Cost & Risk Analyses
Electric Prod’n Value
Lifecycle Cost Model
CO2 Sale Agreements, Term Sheets Offtaker Agreements
Coal Supply Agreements Formal Contract
Other Electric Supply Options
Plant Technical Definition
Base Load Supply Recommendation
Clean Coal Project
© IEA Clean Coal Centre www.iea-coal.org.uk
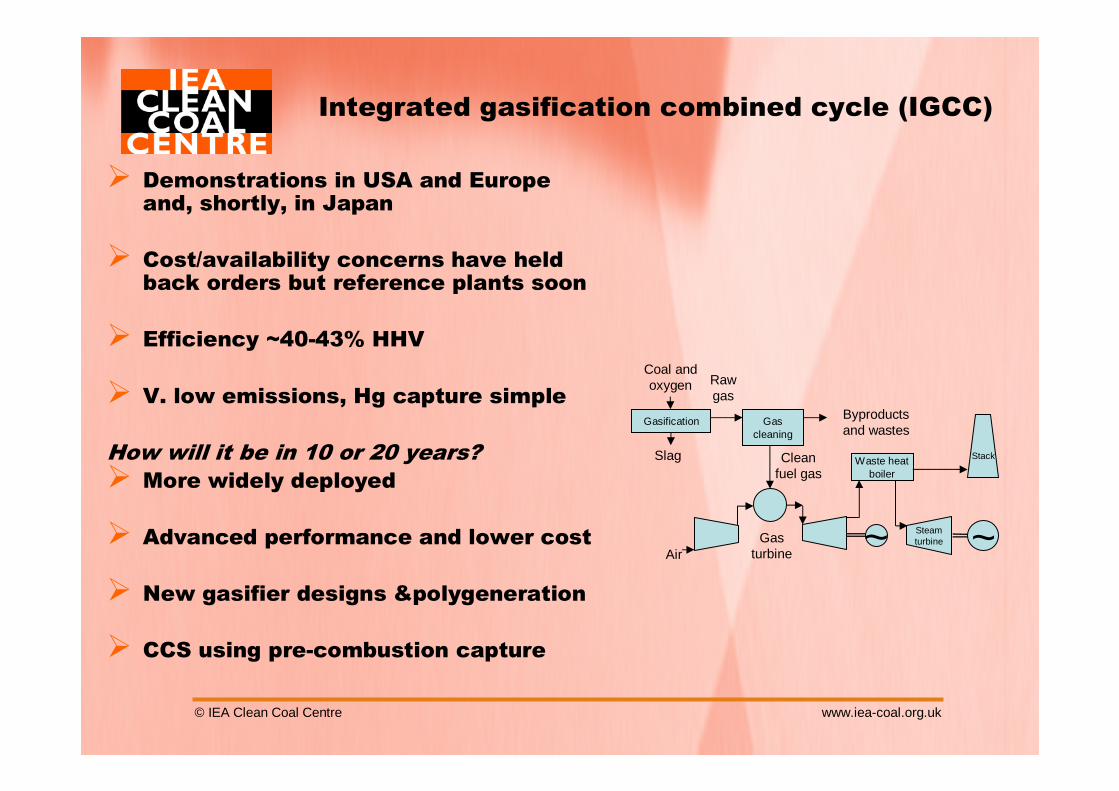
Integrated gasification combined cycle (IGCC)
� Demonstrations in USA and Europe and, shortly, in Japan
� Cost/availability concerns have held back orders but reference plants soon
� Efficiency ~40-43% HHV
� V. low emissions, Hg capture simple
How will it be in 10 or 20 years?
� More widely deployed
� Advanced performance and lower cost
� New gasifier designs &polygeneration
� CCS using pre-combustion capture
Gasification
Coal and oxygen Raw
gas
Clean fuel gas
~Gas turbine
Waste heatboiler
Stack
Steamturbine ~
Byproductsand wastes
Slag
Air
Gas cleaning
© IEA Clean Coal Centre www.iea-coal.org.uk
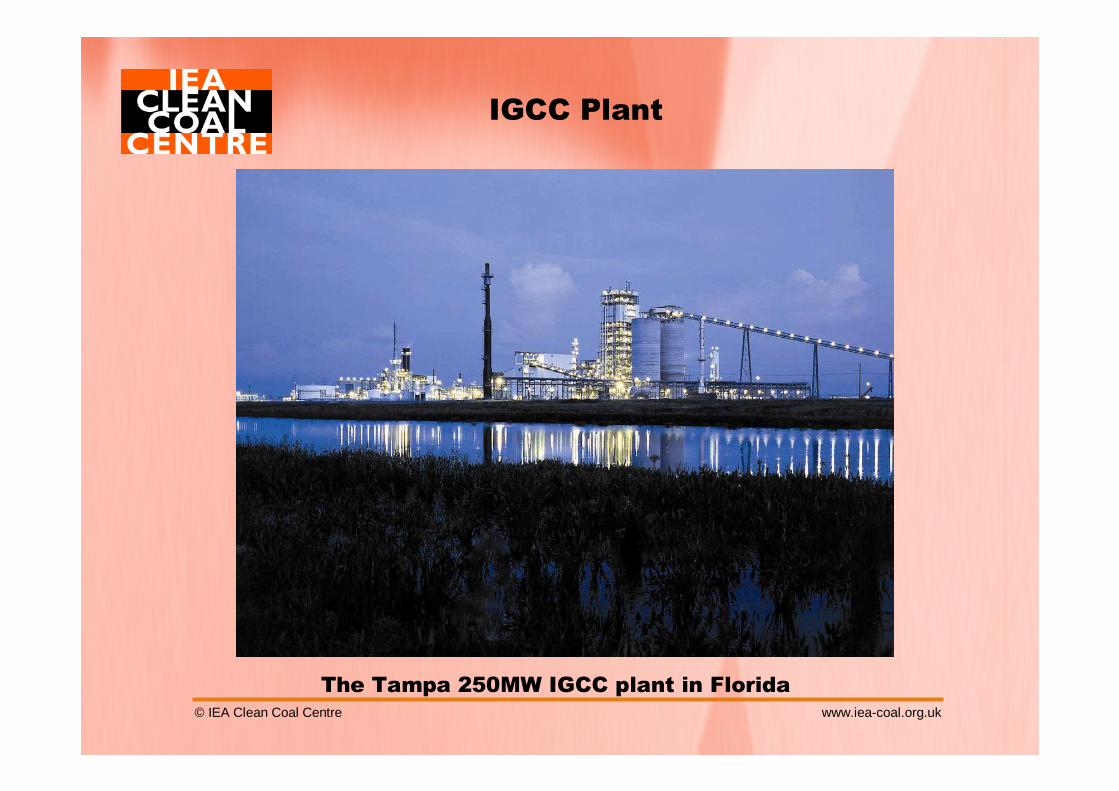
IGCC Plant
The Tampa 250MW IGCC plant in Florida
© IEA Clean Coal Centre www.iea-coal.org.uk
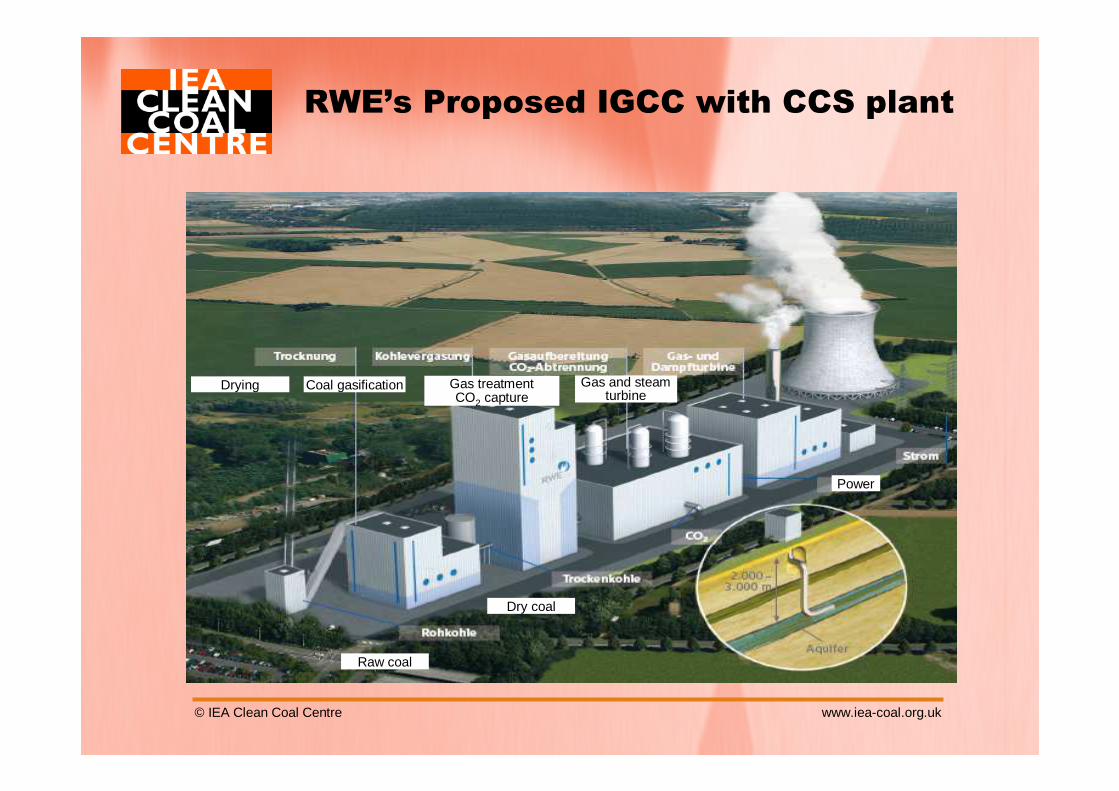
RWE’s Proposed IGCC with CCS plant
Drying Coal gasification Gas treatmentCO2 capture
Gas and steamturbine
Power
Dry coal
Raw coal
© IEA Clean Coal Centre www.iea-coal.org.uk
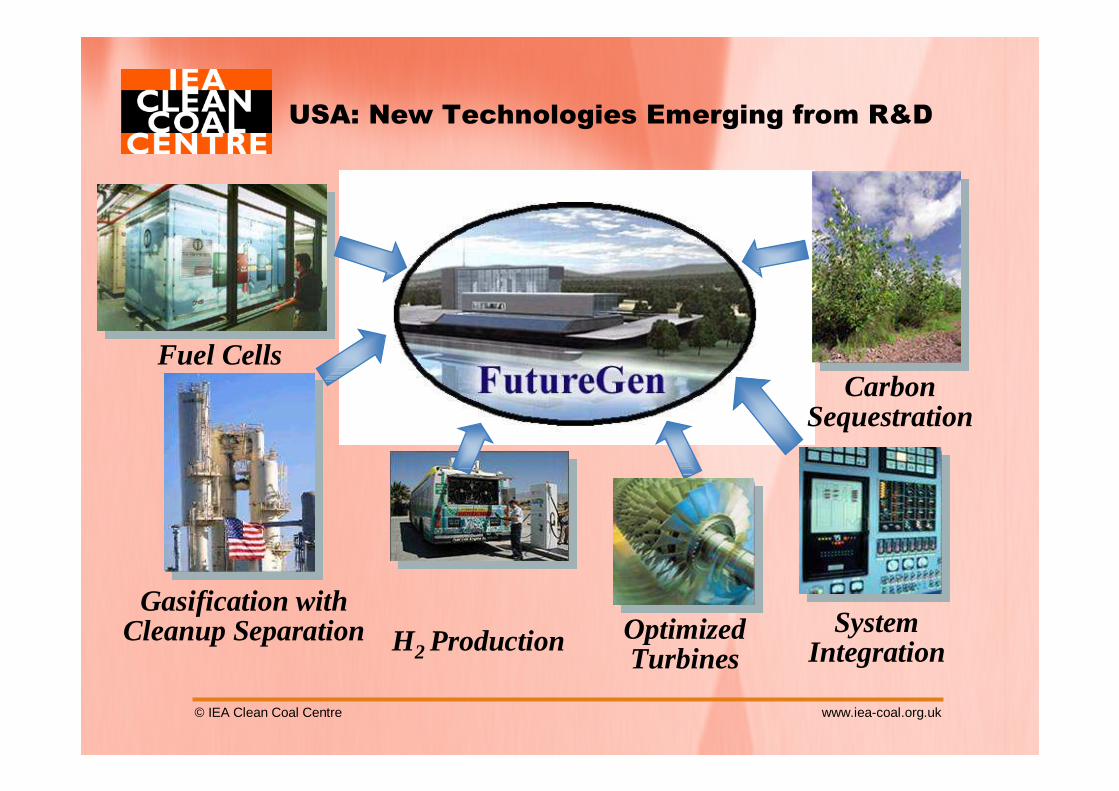
Gasification with Cleanup Separation System
Integration
CarbonSequestration
USA: New Technologies Emerging from R&D
Optimized Turbines
Fuel Cells
H2 Production
© IEA Clean Coal Centre www.iea-coal.org.uk
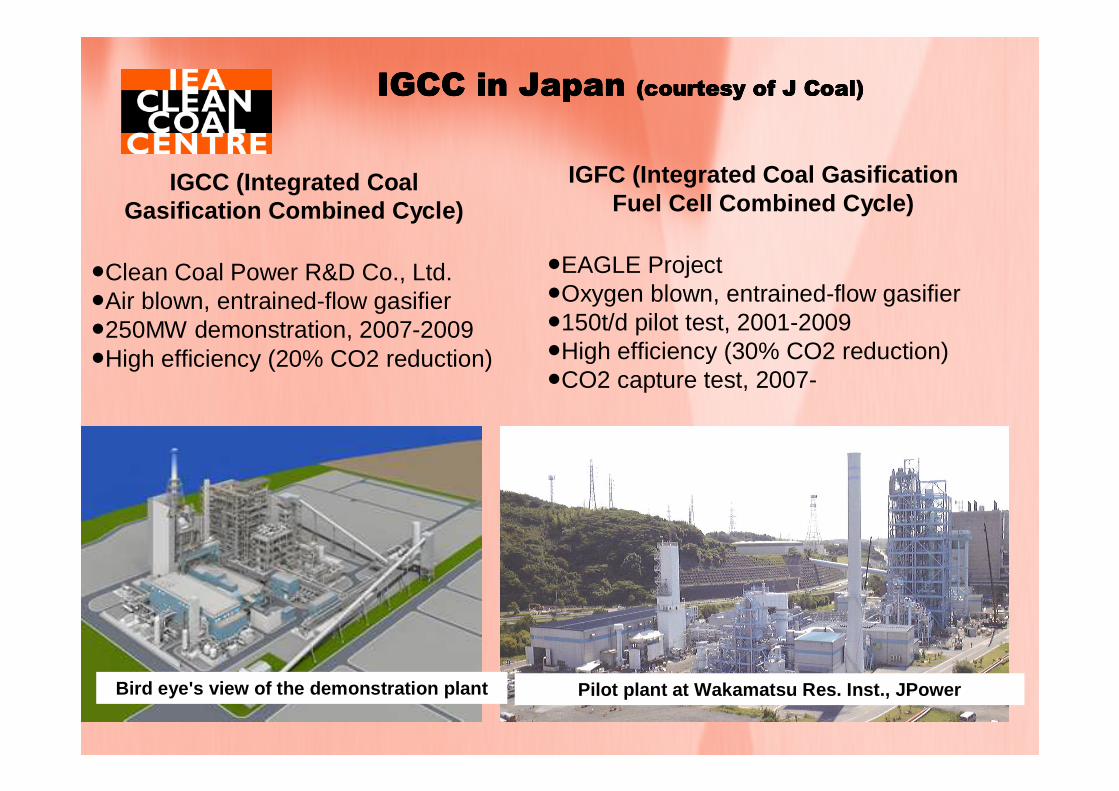
IGCC in Japan IGCC in Japan IGCC in Japan IGCC in Japan (courtesy of J Coal)(courtesy of J Coal)(courtesy of J Coal)(courtesy of J Coal)
IGCC (Integrated Coal Gasification Combined Cycle)
IGFC (Integrated Coal Gasification Fuel Cell Combined Cycle)
●EAGLE Project●Oxygen blown, entrained-flow gasifier●150t/d pilot test, 2001-2009●High efficiency (30% CO2 reduction)●CO2 capture test, 2007-
●Clean Coal Power R&D Co., Ltd.●Air blown, entrained-flow gasifier●250MW demonstration, 2007-2009●High efficiency (20% CO2 reduction)
Bird eye's view of the demonstration plant Pilot plant at Wakamatsu Res. Inst., JPower
© IEA Clean Coal Centre www.iea-coal.org.uk
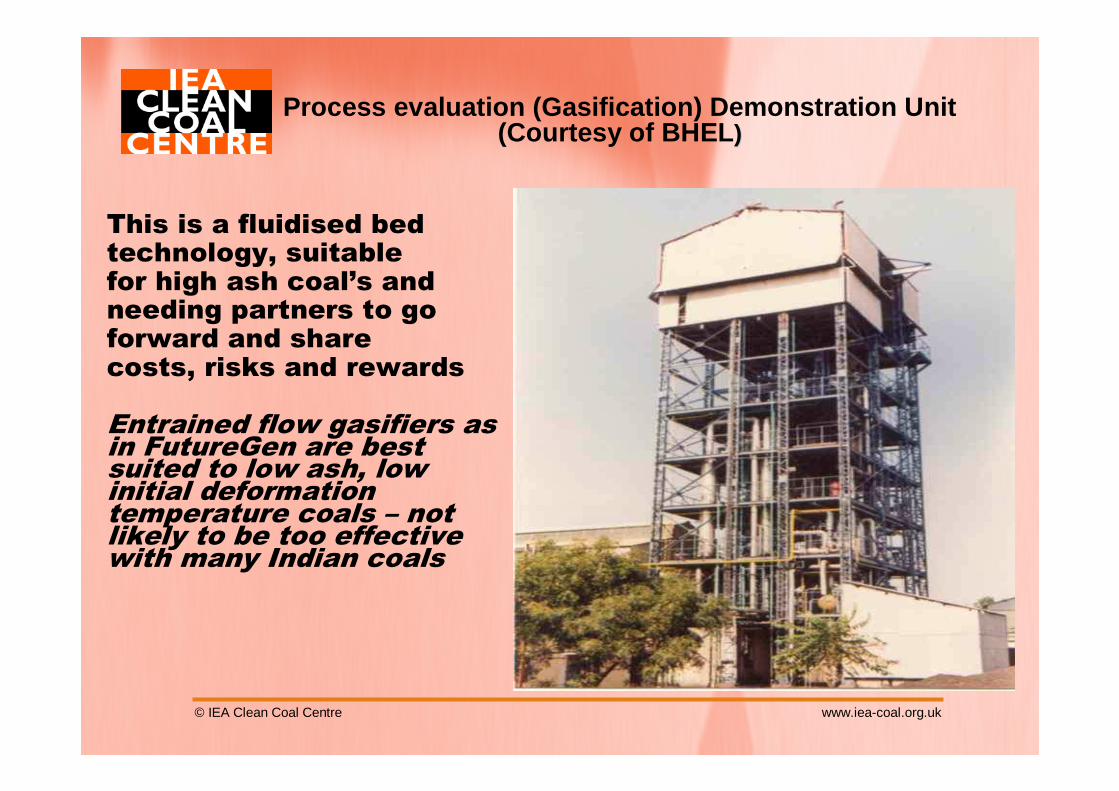
This is a fluidised bed technology, suitable for high ash coal’s and needing partners to goforward and share costs, risks and rewards
Entrained flow gasifiers as in FutureGen are best suited to low ash, low initial deformation temperature coals – not likely to be too effective with many Indian coals
Process evaluation (Gasification) Demonstration Uni t (Courtesy of BHEL ))
© IEA Clean Coal Centre www.iea-coal.org.uk
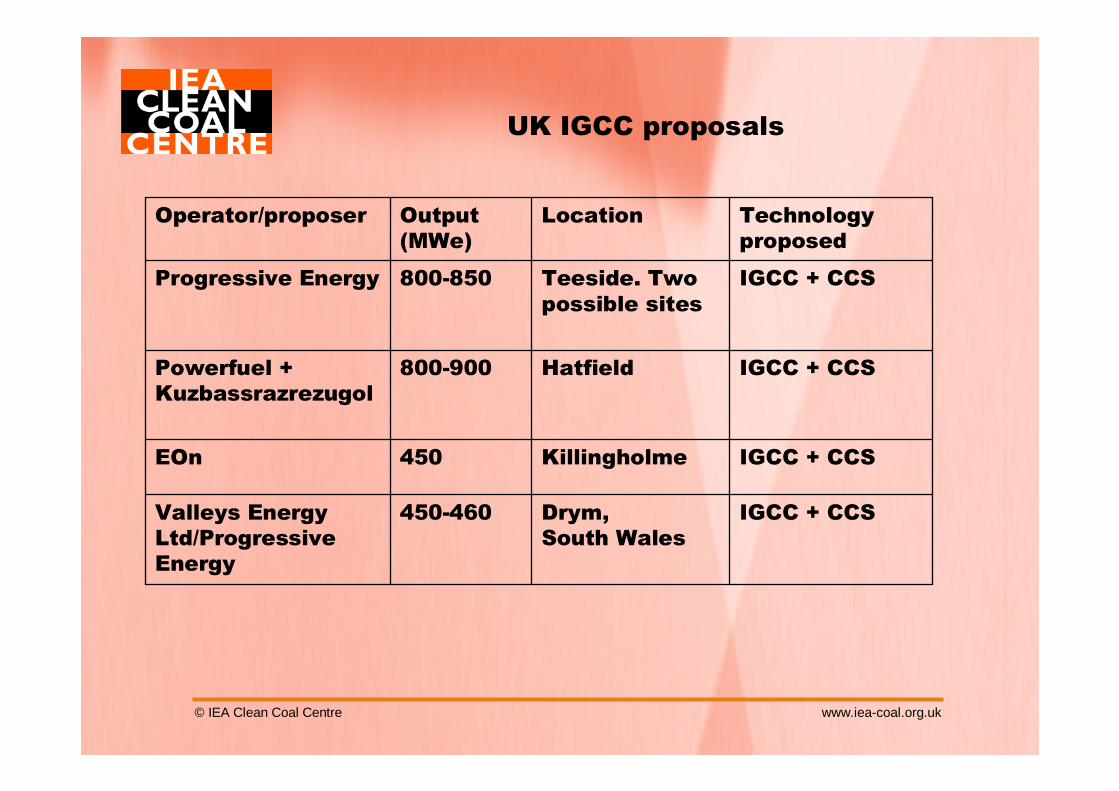
UK IGCC proposals
IGCC + CCSDrym, South Wales
450-460Valleys Energy Ltd/Progressive Energy
IGCC + CCSKillingholme450EOn
IGCC + CCSHatfield800-900Powerfuel + Kuzbassrazrezugol
IGCC + CCSTeeside. Two possible sites
800-850Progressive Energy
Technology proposed
LocationOutput (MWe)
Operator/proposer
© IEA Clean Coal Centre www.iea-coal.org.uk
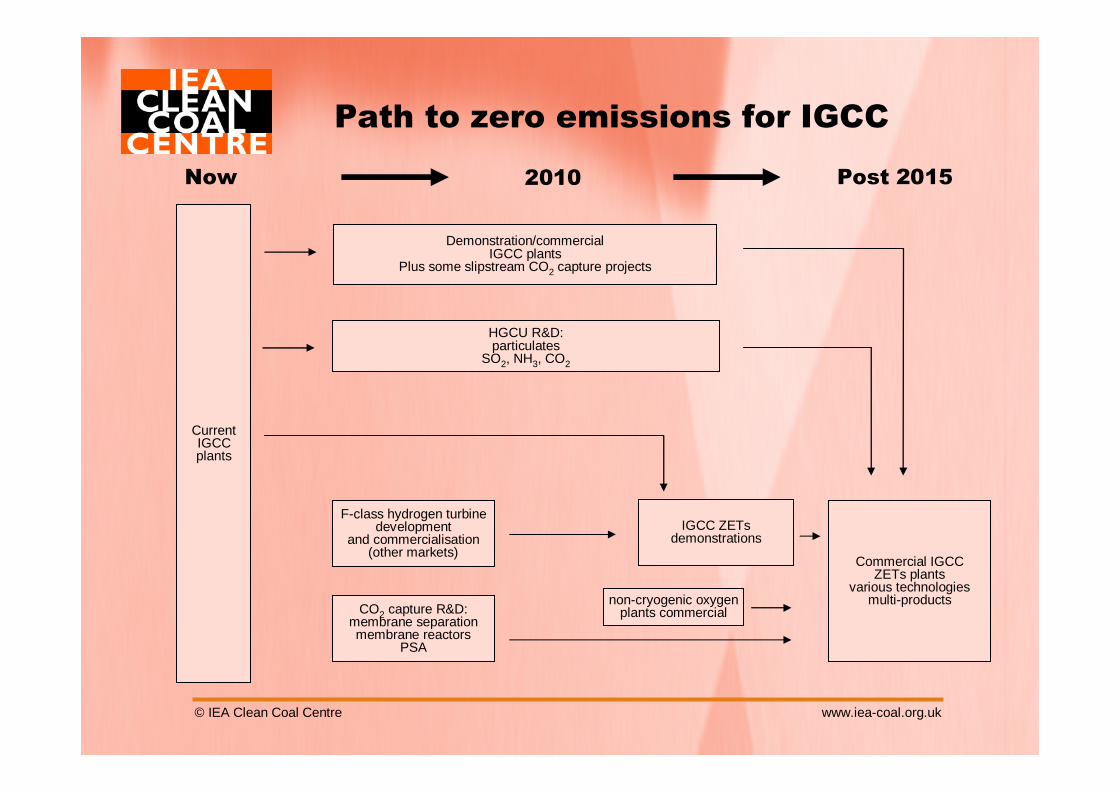
Path to zero emissions for IGCC
CurrentIGCCplants
IGCC ZETsdemonstrations
Commercial IGCCZETs plants
various technologiesmulti-productsnon-cryogenic oxygen
plants commercialCO2 capture R&D:membrane separationmembrane reactors
PSA
HGCU R&D:particulates
SO2, NH3, CO2
Demonstration/commercialIGCC plants
Plus some slipstream CO2 capture projects
F-class hydrogen turbinedevelopment
and commercialisation(other markets)
Post 2015Now 2010
© IEA Clean Coal Centre www.iea-coal.org.uk
CAPITAL COSTS, POWER COSTS & EFFICIENCIES
© IEA Clean Coal Centre www.iea-coal.org.uk
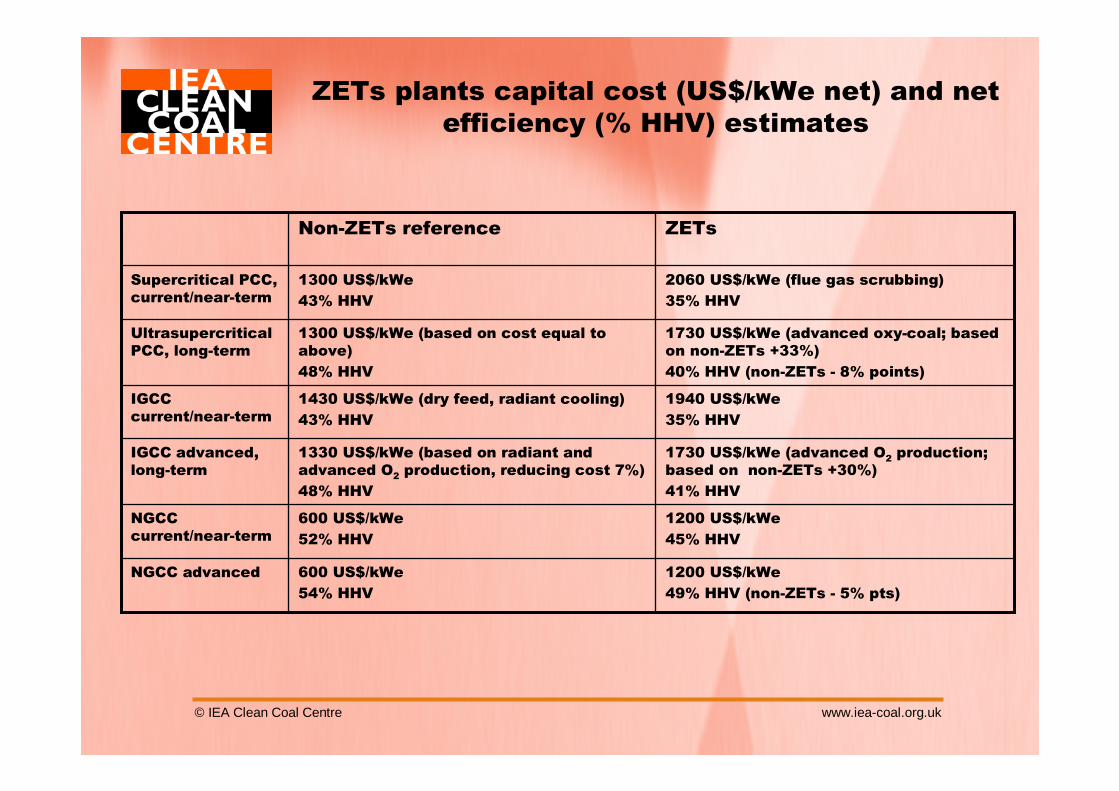
1200 US$/kWe
49% HHV (non-ZETs - 5% pts)
600 US$/kWe
54% HHV
NGCC advanced
1200 US$/kWe
45% HHV
600 US$/kWe
52% HHV
NGCC current/near-term
1730 US$/kWe (advanced O2 production; based on non-ZETs +30%)
41% HHV
1330 US$/kWe (based on radiant and advanced O2 production, reducing cost 7%)
48% HHV
IGCC advanced, long-term
1940 US$/kWe
35% HHV
1430 US$/kWe (dry feed, radiant cooling)
43% HHV
IGCC current/near-term
1730 US$/kWe (advanced oxy-coal; based on non-ZETs +33%)
40% HHV (non-ZETs - 8% points)
1300 US$/kWe (based on cost equal to above)
48% HHV
UltrasupercriticalPCC, long-term
2060 US$/kWe (flue gas scrubbing)
35% HHV
1300 US$/kWe
43% HHV
Supercritical PCC, current/near-term
ZETsNon-ZETs reference
ZETs plants capital cost (US$/kWe net) and net efficiency (% HHV) estimates

© IEA Clean Coal Centre www.iea-coal.org.uk
Net efficiencies (LHV)with and without CO2 capture
(Courtesy of Vatenfall – oxy fuel network meeting Cottbus November 2005)
0
10
20
30
40
50
60
PF+dr
ier no
capt
ure
PF ox
yfuel
with
FGD
IGCC ca
ptur
e
PF Pos
tcom
busti
on "E
cona
mine S
M+"
PF no
captu
re
PF Oxy
fuel
with F
GD
IGCC "T
exac
o" ca
pture
aMDEA
IGCC "S
hell"
capt
ure
aMDEA
PF Pos
tcom
busti
on "E
cona
mine S
M+"
NGCC no c
aptur
e
NGCC postc
ombu
stion
"Eco
nam
ine S
M+"
Pla
nt e
lect
rical
effi
cien
cy (L
HV
) [%
]
Natural GasLignite Bituminous Coal

© IEA Clean Coal Centre www.iea-coal.org.uk
Summary picture on capital costs and efficiencies of ZETs plants
� Main incremental cost of ZETs plants will come from CO2
capture, which incurs a large specific capital cost penalty
� PCC and IGCC in ZETs forms could be broadly similar in capital cost
� However, range and uncertainty in estimated costs are considerable
� Efficiency penalties of combustion-based ZETs systems could be becoming more similar to those being predicted for IGCC-based ZETs
© IEA Clean Coal Centre www.iea-coal.org.uk
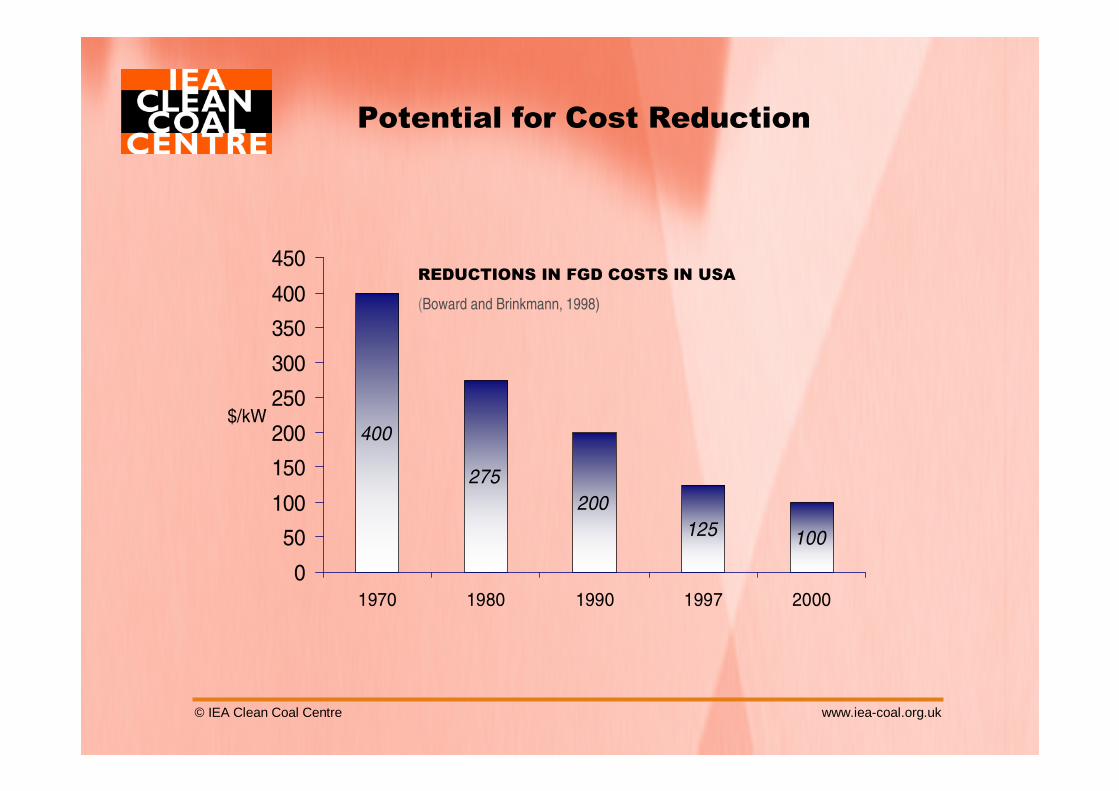
Potential for Cost Reduction
400
275
200
100125
0
50
100
150
200
250
300
350
400
450
1970 1980 1990 1997 2000
$/kW
REDUCTIONS IN FGD COSTS IN USA
(Boward and Brinkmann, 1998)
© IEA Clean Coal Centre www.iea-coal.org.uk
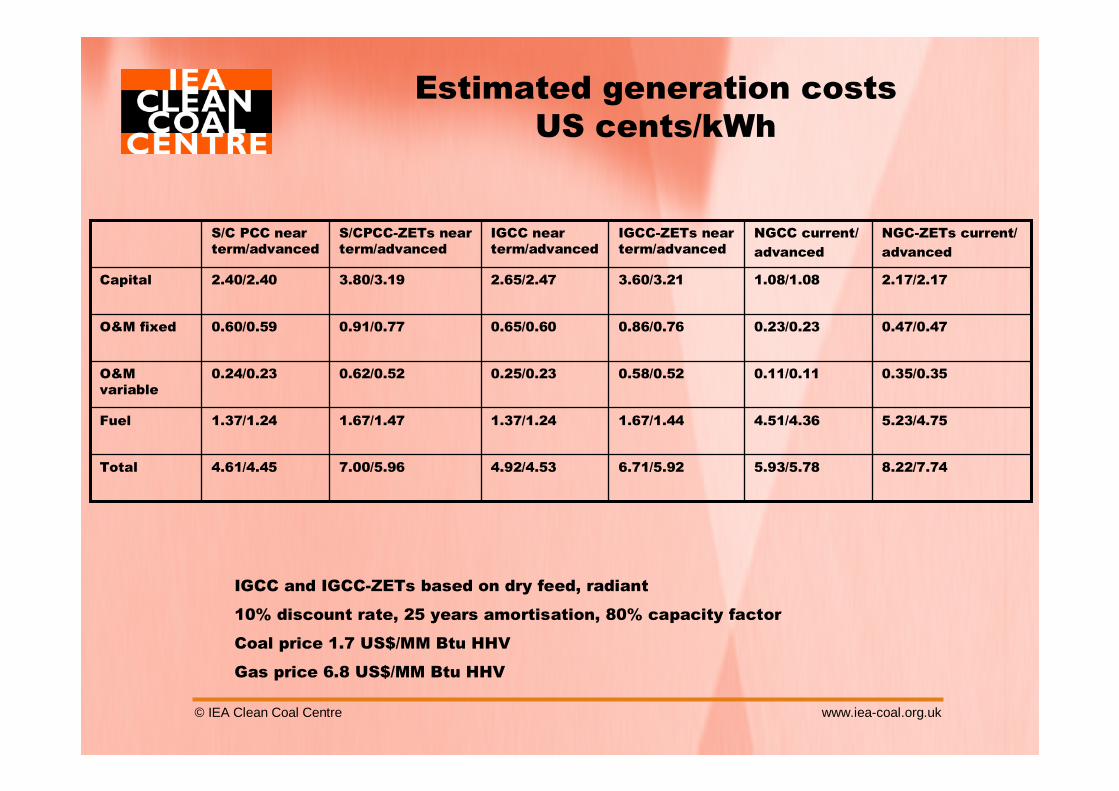
Estimated generation costs US cents/kWh
8.22/7.745.93/5.786.71/5.924.92/4.537.00/5.964.61/4.45Total
5.23/4.754.51/4.361.67/1.441.37/1.241.67/1.471.37/1.24Fuel
0.35/0.350.11/0.110.58/0.520.25/0.230.62/0.520.24/0.23O&M variable
0.47/0.470.23/0.230.86/0.760.65/0.600.91/0.770.60/0.59O&M fixed
2.17/2.171.08/1.083.60/3.212.65/2.473.80/3.192.40/2.40Capital
NGC-ZETs current/
advanced
NGCC current/
advanced
IGCC-ZETs near term/advanced
IGCC near term/advanced
S/CPCC-ZETs near term/advanced
S/C PCC near term/advanced
IGCC and IGCC-ZETs based on dry feed, radiant
10% discount rate, 25 years amortisation, 80% capacity factor
Coal price 1.7 US$/MM Btu HHV
Gas price 6.8 US$/MM Btu HHV
© IEA Clean Coal Centre www.iea-coal.org.uk
SOURCES OF INFORMATION
© IEA Clean Coal Centre www.iea-coal.org.uk
© IEA Clean Coal Centre www.iea-coal.org.uk
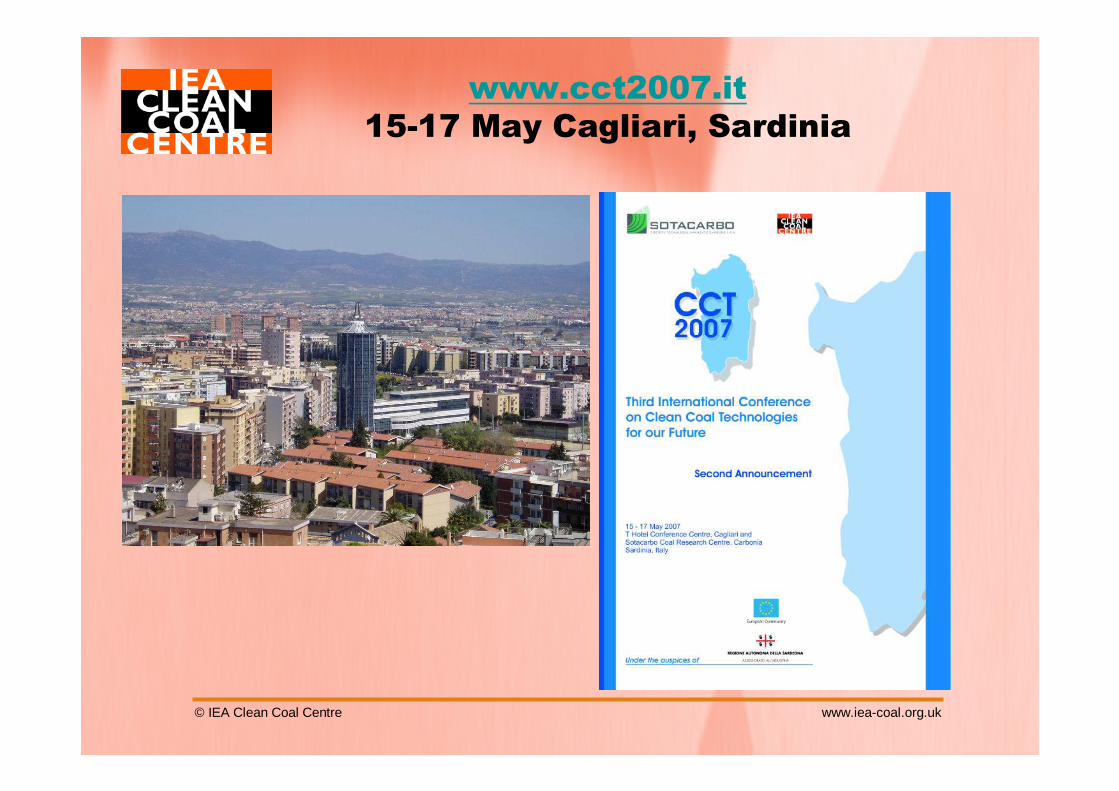
www.cct2007.it15-17 May Cagliari, Sardinia
www.ieagreen.org.uk
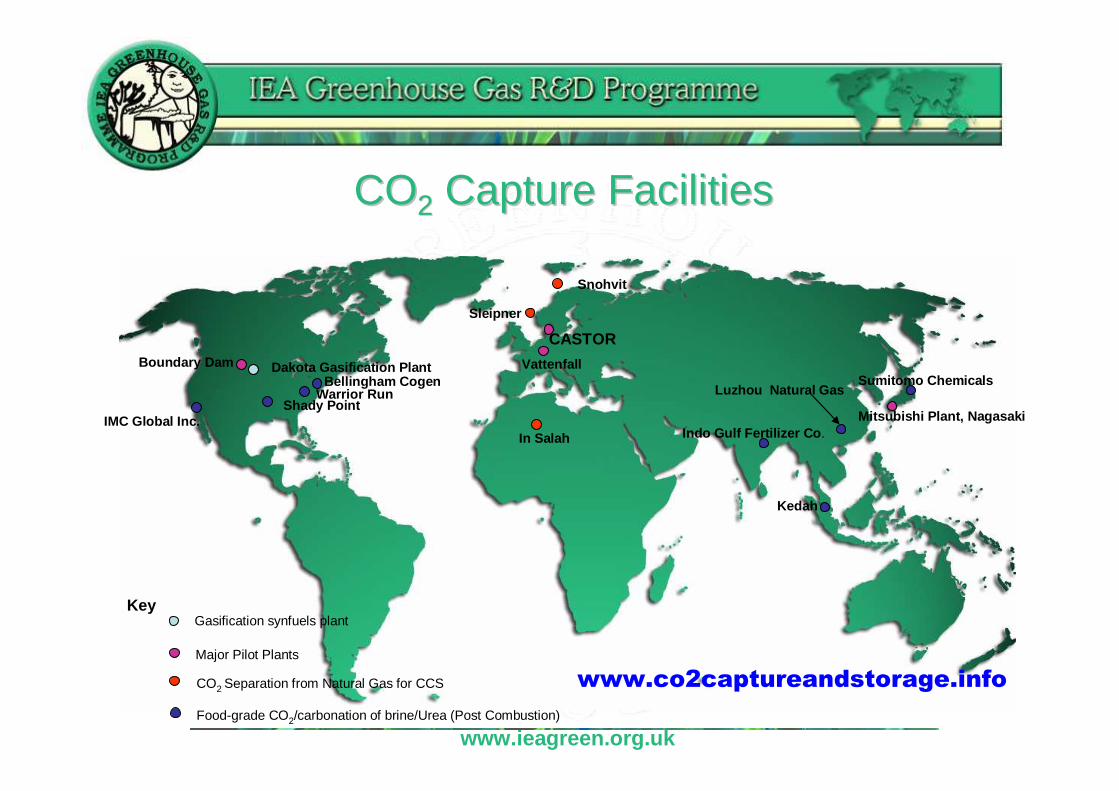
COCO22 Capture FacilitiesCapture Facilities
Mitsubishi Plant, Nagasaki
Sumitomo Chemicals
Indo Gulf Fertilizer Co .
Luzhou Natural Gas
Vattenfall
CASTOR
Snohvit
Sleipner
In Salah
Shady Point
Bellingham CogenDakota Gasification PlantBoundary Dam
IMC Global Inc.
Key
Warrior Run
Gasification synfuels plant
Major Pilot Plants
CO2 Separation from Natural Gas for CCS
Food-grade CO2/carbonation of brine/Urea (Post Combustion)
Kedah
www.co2captureandstorage.info
www.ieagreen.org.uk
Storage of CO2 and IEA GHG DatabaseStorage of CO2 and IEA GHG Database

www.ieagreen.org.uk
COCO22 storage effectiveness increases with depth storage effectiveness increases with depth Courtesy of CO2CRC

www.ieagreen.org.ukCourtesy of CO2CRC

www.ieagreen.org.uk
CO2Injection
site
Weyburn EOR – CO 2 Storage Project
Productionwell

www.ieagreen.org.uk
Saline FormationsSaline Formations

www.ieagreen.org.uk
COCO22 Injection and Storage ActivitiesInjection and Storage Activities
Nagaoka
HokkaidoQinshui Basin
Snohvit
Sleipner
In Salah
Key
ECBM projects
EOR projects
Gas production Fields
Saline aquifier
SibillaRECOPOL
CO2 SINK
K-12B
Cerro Fortunoso
Frio
West Pearl Queen
MountaineerWeyburn
Penn WestAlberta ECBM
Teapot DomeRangely
Burlington
4 New CO2-EOR Pilots in Canada
50 Acid Gas injection sites in North America
70 CO2-EOR projects in U.S.A.
GorgonDepleted Oil Field
Otway Basin

www.ieagreen.org.uk
Source: National Occupational Health and Safety Commission Compendium of Worker’s Compensation Statistics, Australia, 2001 -02, December 2003
APPEA Safety Incident Database 2003
*Frequency rate is calculated for one week or more lost time
**Data used is 2003 statistics
Courtesy of CO2CRC

www.ieagreen.org.uk
Current MembershipCurrent Membership

www.ieagreen.org.uk
Studies in progressStudies in progress
• Remediation of leakage from geological storage• Risk assessment and regulatory needs• Environmental impact frameworks• Sub-sea ecosystem impacts of CO2 leakage• Terrestrial ecosystem impacts of CO2 leakage• Distributed capture and collection of CO2
• Co-production of hydrogen and electricity• Regional capacity for CO2 storage in India• Improved oxygen production processes•• CaptureCapture--ready power plantready power plant

© IEA Clean Coal Centre www.iea-coal.org.uk
MEMBERS
Italy JapanRep. of Korea UK
Spain
BHEL India
Anglo Coal S. Africa
USA
ESKOM S. Africa
Netherlands Group
BG Group, UK
AustriaCanada
Germany
CEC
BRICC China
ACIC, Australia
CANZ, New Zealand
Eletrobras, Brazil
DPG, Denmark
Suek, Russia
SIG, Sweden
Schlumberger in process

© IEA Clean Coal Centre www.iea-coal.org.uk
Work in progress
Trace elements and fly ash utilisation (in draft)
Potential impact of ETS and LCPD on EU coal demand (in draft)
Clean coal technologies for a carbon constrained world
Operational patterns of coal-fired plant to 2010
G8 contract – energy efficiency of coal-fired plants
Cofiring coal with waste and opportunity fuels
Polygeneration from coal
Coal resources for power generation in China
Korean Energy Strategy Project (KESP)
Future developments in IGCC
CO2 capture technologies
Coal supply chain costs
Competitiveness of coal-fired power generation
Coal to liquids (CTL)
Properties and behaviour of SO2 adsorbents
Economics of mercury control

© IEA Clean Coal Centre www.iea-coal.org.uk
CLEAN COAL TECHNOLOGY THAT WORKS
The End – Thank you for your Attention