Coal /coal ash/tar sands=GLOBAL WARMING.........
161
• In a “Frank Statement to Cigarette Smokers” that appeared in 448 newspapers in 1954, the tobacco industry laid out the themes of denial that it would use into the 1990s: “Medical research...indicates many possible causes of lung cancer. There is no agreement among authorities regarding the cause. • There is no proof that cigarette smoking is one of the causes. The validity of the statistics is questioned by numerous scientists.” But as cigarette smokers aged, the connection between smoking and lung cancer became impossible to deny. The WHO estimates that over the 20th Century, tobacco caused 100 million deaths. One billion are estimated to die from tobacco during the 21st century.
Transcript of Coal /coal ash/tar sands=GLOBAL WARMING.........

• In a “Frank Statement to Cigarette Smokers” that appeared in 448 newspapers in 1954, the tobacco industry laid out the themes of denial that it would use into the 1990s: “Medical research...indicates many possible causes of lung cancer. There is no agreement among authorities regarding the cause.
• There is no proof that cigarette smoking is one of the causes. The validity of the statistics is questioned by numerous scientists.” But as cigarette smokers aged, the connection between smoking and lung cancer became impossible to deny. The WHO estimates that over the 20th Century, tobacco caused 100 million deaths. One billion are estimated to die from tobacco during the 21st century.


2009….


What happened to coal• : In the first quarter of 2012, coal made up just
36 percent of U.S. electricity generation – down from nearly 45 percent from the same period in 2011. That's a 9 percent drop in U.S. coal use in just one year.
• In a surprising turnaround, the amount of carbon dioxide released into the atmosphere in the United States has fallen dramatically to its lowest level in 20 years -- and government officials say the biggest reason is that cheap and plentiful natural gas has led many power plant operators to switch from dirtier-burning coal


Benefits of coal
• Coal is available in abundance around the globe, unlike oil and natural gas, which are available in only certain pockets of the world
• To use coal, you just mine it and use it.
•The abundance of resource, easy accessibility and cheaper mode of transportation makes coal a cheaper form of energy.
• Yet another advantage of coal over its fossil counterparts is the fact that it is relatively easy to transport from one place to another
• Average electricity costs in Kentucky were 4.63 cents per kilowatt-hour during 2004, the lowest in the United States for the third consecutive year.

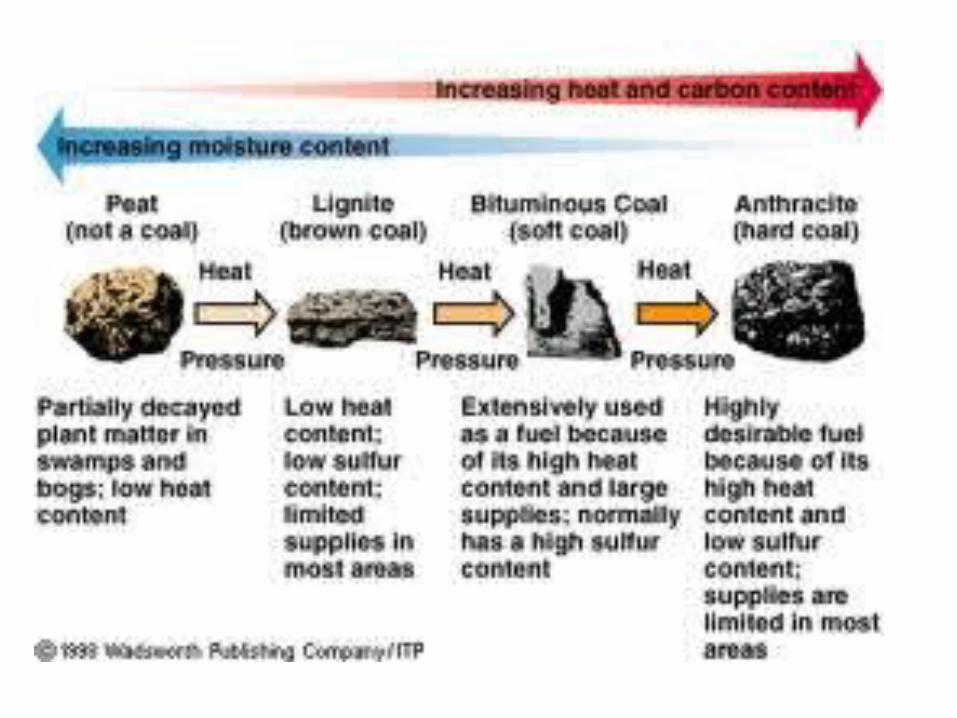
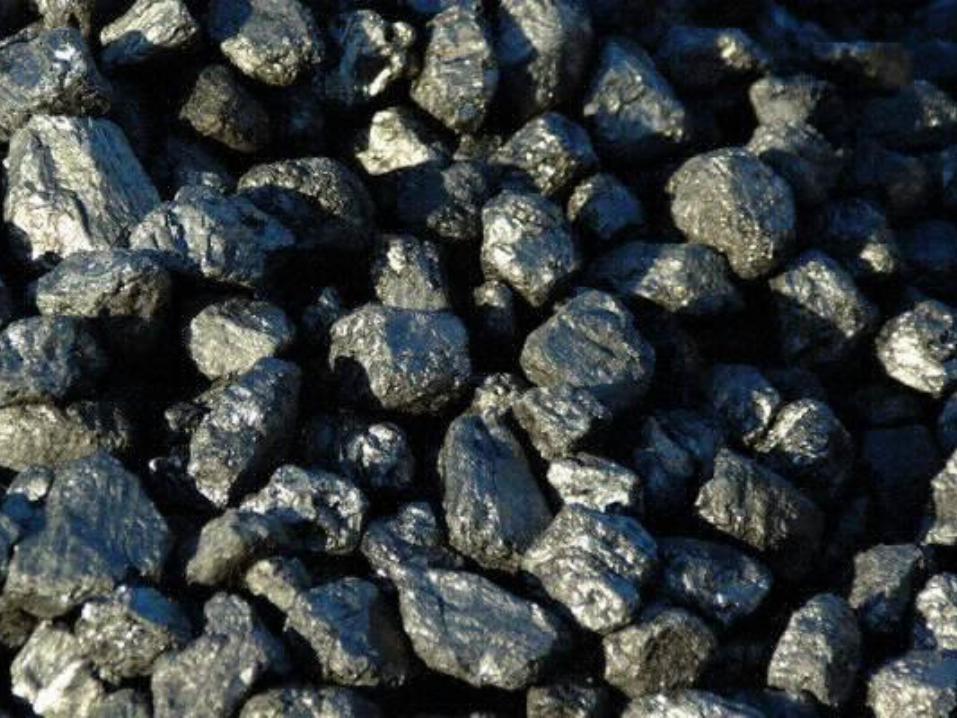
Coal types• Anthracite is coal with the highest carbon content, between 86
and 98 percent, and a heat value of nearly 15,000 BTUs-per-pound The principal use of anthracite today is for a domestic fuel in either hand-fired stoves or automatic stoker furnaces
• The most plentiful form of coal in the United States, bituminous coal is used primarily to generate electricity and make coke for the steel industry. Bituminous coal has a carbon content ranging from 45 to 86 percent carbon and a heat value of 10,500 to 15,500 BTUs-per-pound
• Ranking below bituminous is subbituminous coal with 35-45 percent carbon content and a heat value between 8,300 and 13,000 BTUs-per-pound. Reserves are located mainly in a half-dozen Western states and Alaska. Although its heat value is lower, this coal generally has a lower sulfur content than other types, which makes it attractive for use because it is cleaner burning.
• U.S. coal production decreased 8.3 percent to 1,074.9 million short tons, 96.9 million short tons below 2008's record level.
• Coal consumption decreased 11.0 percent, mostly due to slumping economic conditions as well as the milder winter and cooler summer weather experienced in many parts of the U.S. in 2009.
• Coal stocks were at record levels, reaching 233.0 million short tons at the end of 2009.
• Coal mine employment was 87,755 in 2009, a decrease of 1.0 percent from the 2008 level


• A typical (500 megawatt) coal plant burns 1.4 million tons of coal each year. There are about 600 U.S. coal plants
• Coal fired power plants provide about 50% of consumed electricity in the USA…
• Oregon had one coal-fired generating station in 2005, the Boardman Plant, with 601 MW of capacity - representing 4.7% of the state's total electric generating capacity.[1] Oregon ranks 42nd out of the 50 states in terms of coal energy production. However, nearly 40% of Oregon's power comes from coal, half of which is produced out of state, primarily the Powder River Basin in Wyoming and Montana

Where are the powerplants?
• Rank State # of Plants Total Capacity 2005 Power Prod.
1 Texas 20 21,238 MW 148,759 GWh 2 Ohio 35 23,823 MW 137,457 GWh 3 Indiana 31 21,551 MW 123,985 GWh 4 Pennsylvania 40 20,475 MW 122,093 GWh 5 Illinois 32 17,565 MW 92,772 GWh 6 Kentucky 21 16,510 MW 92,613 GWh 7 West Virginia 19 15,372 MW 91,601 GWh 8 Georgia 16 14,594 MW 87,624 GWh 9 North Carolina 25 13,279 MW 78,854 GWh 10 Missouri 24 11,810 MW 77,714 GWh

Electrical use
• In 2008, the average annual electricity consumption for a U.S. residential utility customer was 11,040 kWh, an average of 920 kilowatt-hours (kWh) per month. Tennessee had the highest annual consumption at 15,624 kWh and Maine the lowest at 6,252 kWh.


New Mexico plant

Coal ash
• The average yearly generation of coal ash is about 61 million metric tons (MT)
• Typically 70 to 80 percent of coal ash is disposed of in dry landfills.
• At issue is coal's content of uranium and thorium, both radioactive elements. They occur in such trace amounts in natural, or "whole," coal that they aren't a problem. But when coal is burned into fly ash, uranium and thorium are concentrated at up to 10 times their original levels.

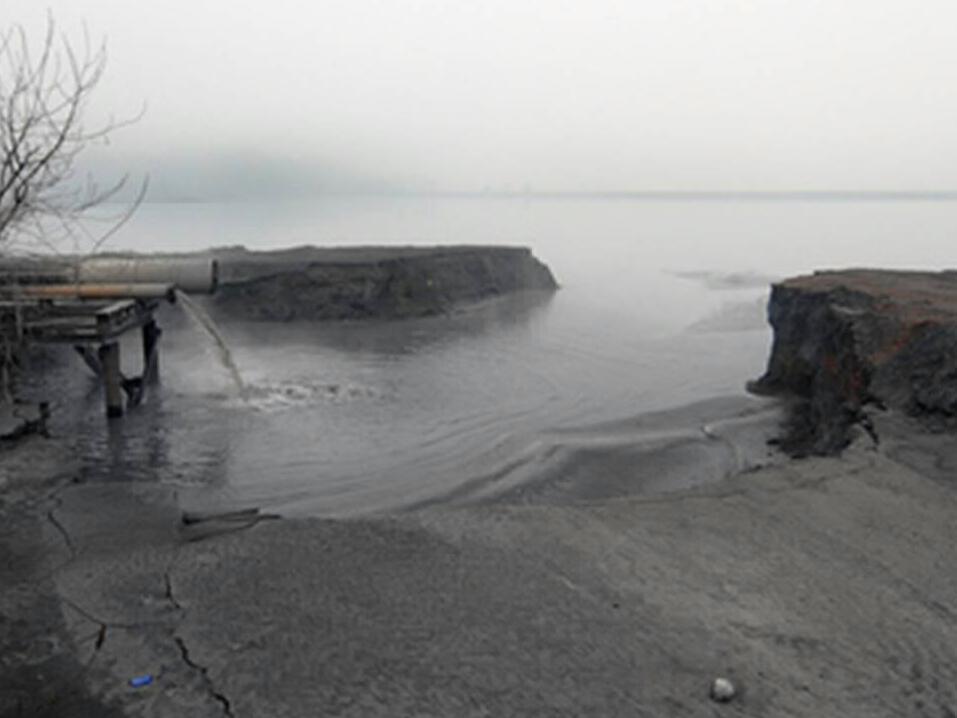
• The coal ash pond that ruptured and sent a billion gallons of toxic sludge across 300 acres of East Tennessee was only one of more than 1,300 similar dumps across the United States — most of them unregulated and unmonitored — that contain billions more gallons of fly ash and other byproducts of burning coal.
• Numerous studies have shown that the ash can leach toxic substances that can cause cancer, birth defects and other health problems in humans, and can decimate fish, bird and frog populations in and around ash dumps, causing developmental problems like tadpoles born without teeth, or fish with severe spinal deformities.

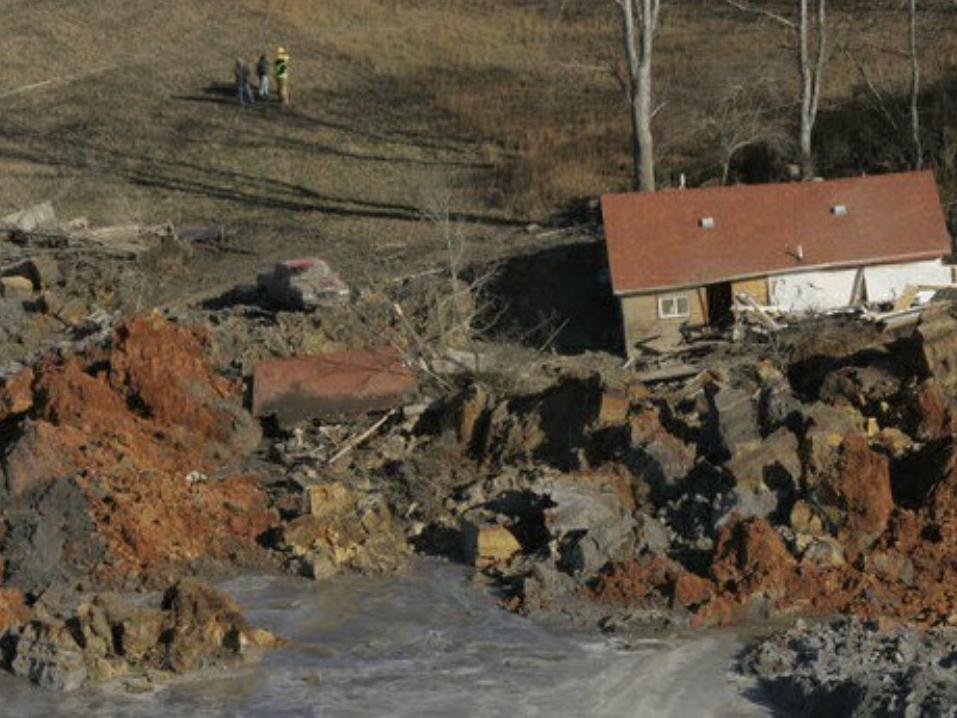
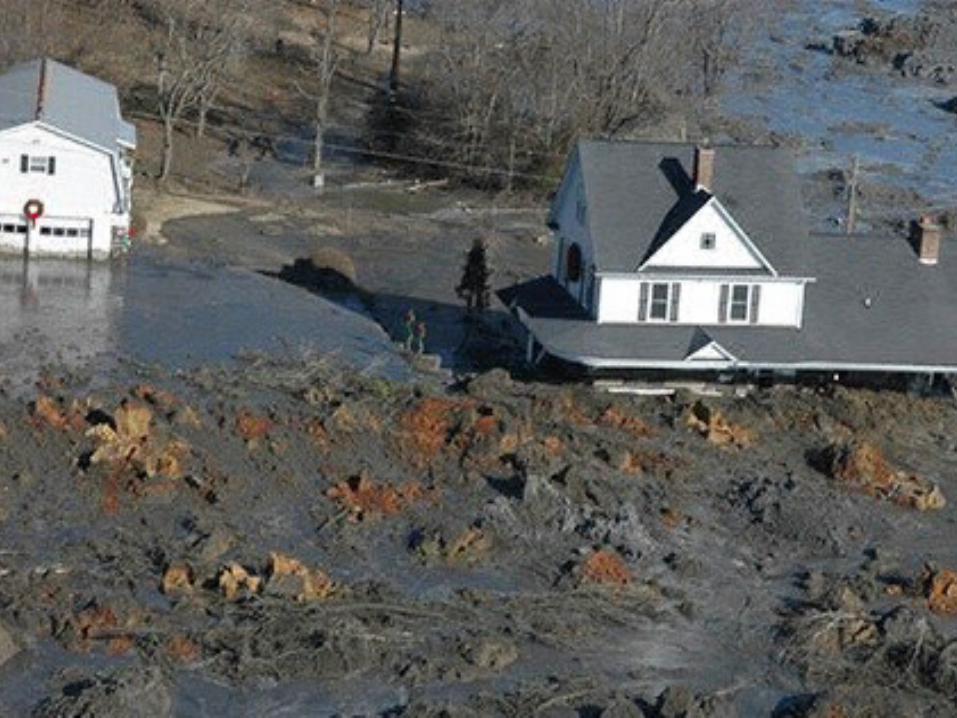
Kingston plant: Tennessee

• 525 million gallons of wet coal ash, enough toxic slurry to flood more than 3,000 acres of nearby land, spilled into the nearby Tennessee River and surrounding areas when a retaining wall at a power plant in the town of Harriman gave way.
• The sludge destroyed 12 homes, though no one was directly injured. However, an unprecedented fish kill occurred in the Tennessee River and area tributaries in the aftermath of the spill.


Landfill in Brandywine, MD

Metals in coal ash
• Many of the heavy metals released in the mining and burning of coal are environmentally and biologically toxic elements, such as lead, mercury, nickel, tin, cadmium, antimony, and arsenic, as well as radio isotopes of thorium and strontium

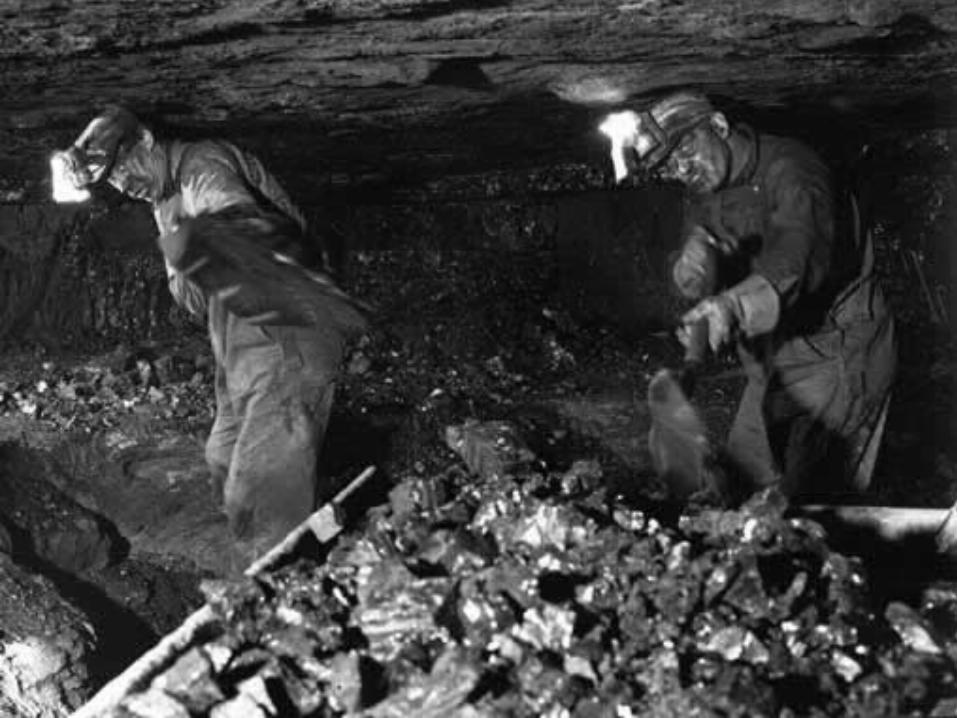
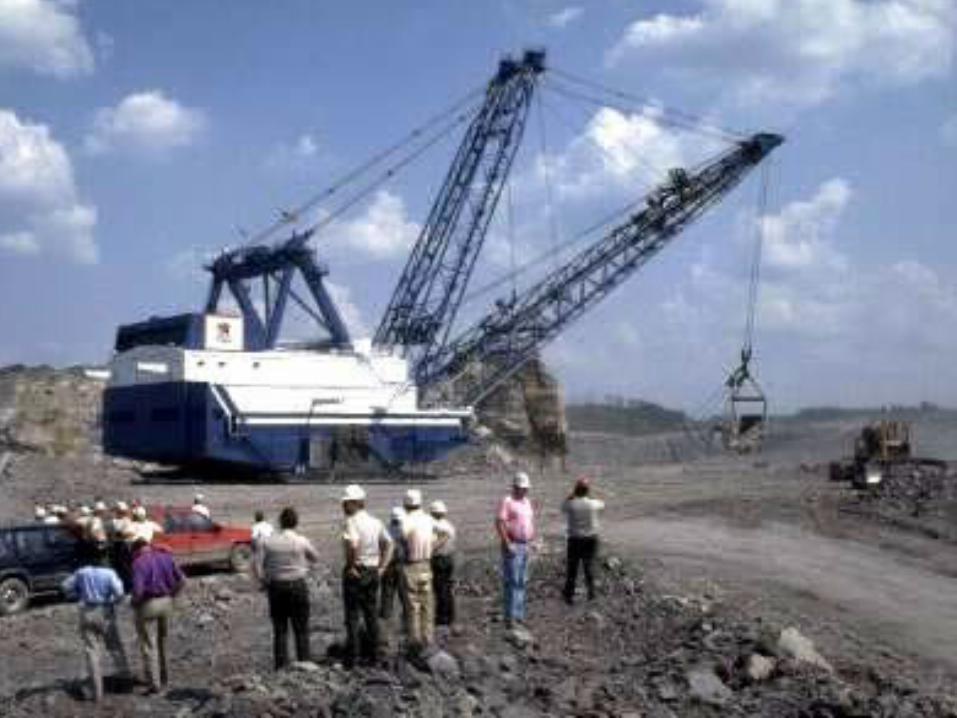
Types of coal mining
• Surface mining (including mountain top removal) is used to produce most of the coal in the United States because it is less expensive than underground mining. Surface mining can be used when the coal is buried less than 200 feet underground.
• Underground mining, sometimes called deep mining, is used when the coal is buried several hundred feet below the surface. Some underground mines are 1,000 feet deep.


• 1. Forests are clear-cut; often scraping away topsoil, lumber, understory herbs such as ginseng and goldenseal, and all other forms of life that do not move out of the way quickly enough. Wildlife habitat is destroyed and vegetation loss often leads to floods and landslides. Next, explosives up to 100 times as strong as ones that tore open the Oklahoma City Federal building blast up to 800 feet off mountaintops. Explosions can cause damage to home foundations and wells. “Fly rock,” more aptly named fly boulder, can rain off mountains, endangering resident’s lives and homes.


• 2. Huge Shovels dig into the soil and trucks haul it away or push it into adjacent valleys.
• 3. A dragline digs into the rock to expose the coal. These machines can weigh up to 8 million pounds with a base as big as a gymnasium and as tall as a 20-story building. These machines allow coal companies to hire fewer workers. A small crew can tear apart a mountain in less than a year, working night and day. Coal companies make big profits at the expense of us all.


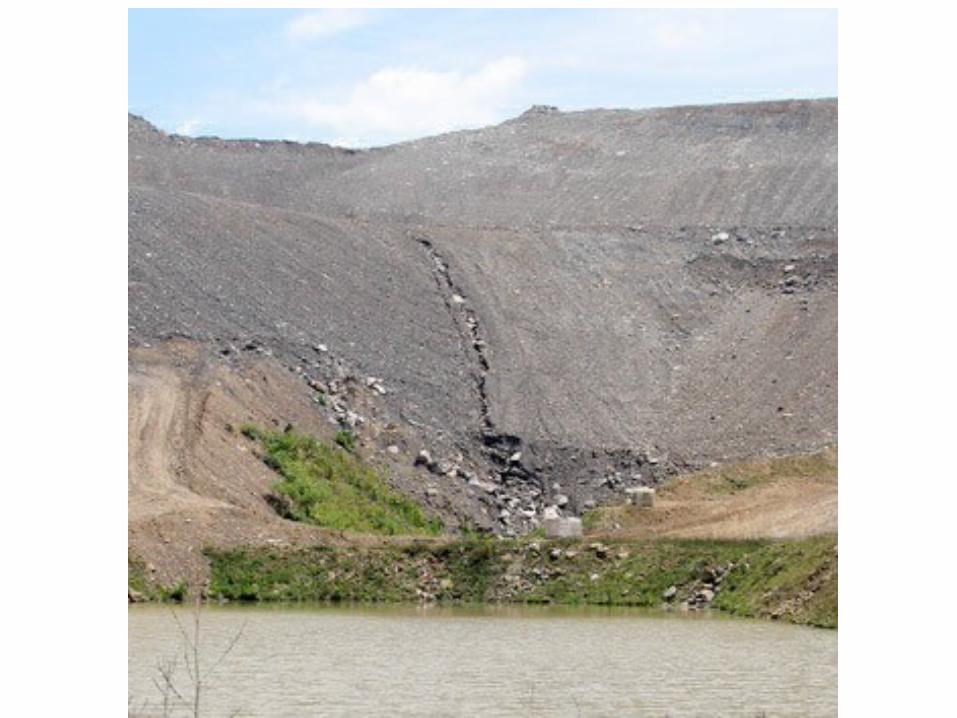
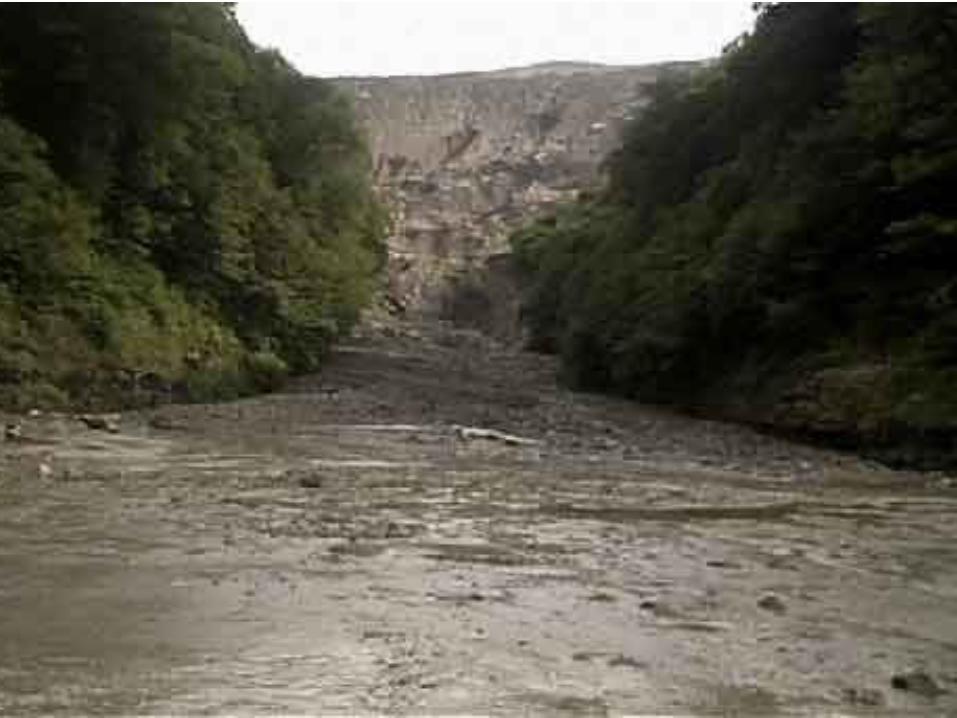
• 4. Giant machines then scoop out the layers of coal, dumping millions of tons of “overburden” – the former mountaintops – into the narrow adjacent valleys, thereby creating valley fills. Coal companies have forever buried over 1,200 miles of biologically crucial Appalachian headwaters streams
• 5. Coal companies are supposed to reclaim land, but all too often mine sites are left stripped and bare. Even where attempts to replant vegetation have been made, the mountain is never again returned to its healthy state


Twisted Gun Golf course

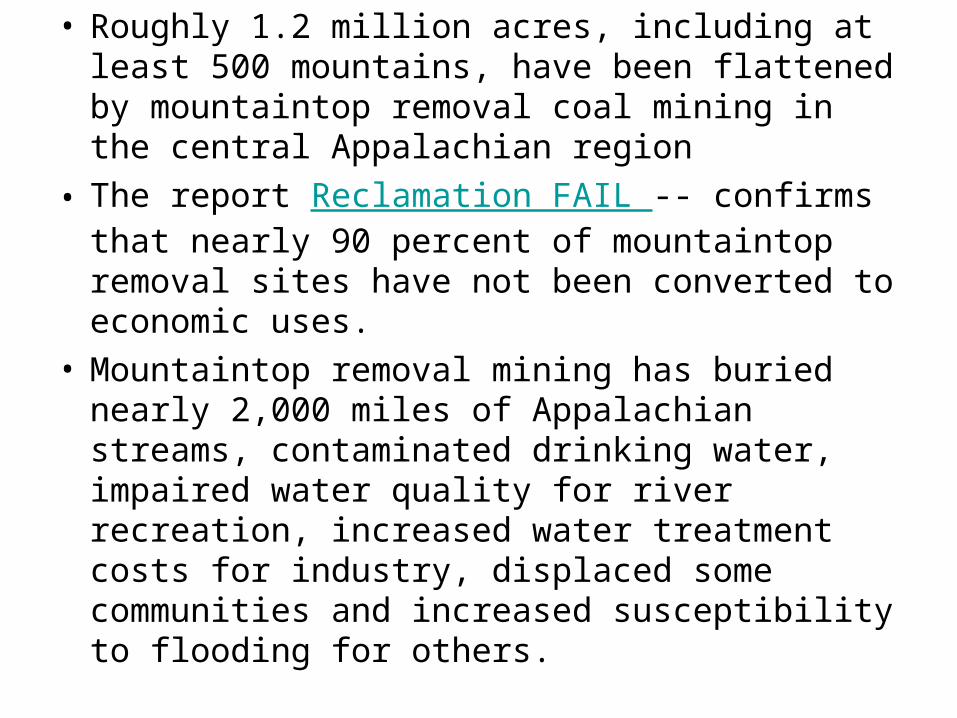
• Roughly 1.2 million acres, including at least 500 mountains, have been flattened by mountaintop removal coal mining in the central Appalachian region
• The report Reclamation FAIL -- confirms that nearly 90 percent of mountaintop removal sites have not been converted to economic uses.
• Mountaintop removal mining has buried nearly 2,000 miles of Appalachian streams, contaminated drinking water, impaired water quality for river recreation, increased water treatment costs for industry, displaced some communities and increased susceptibility to flooding for others.

How about tar sands?
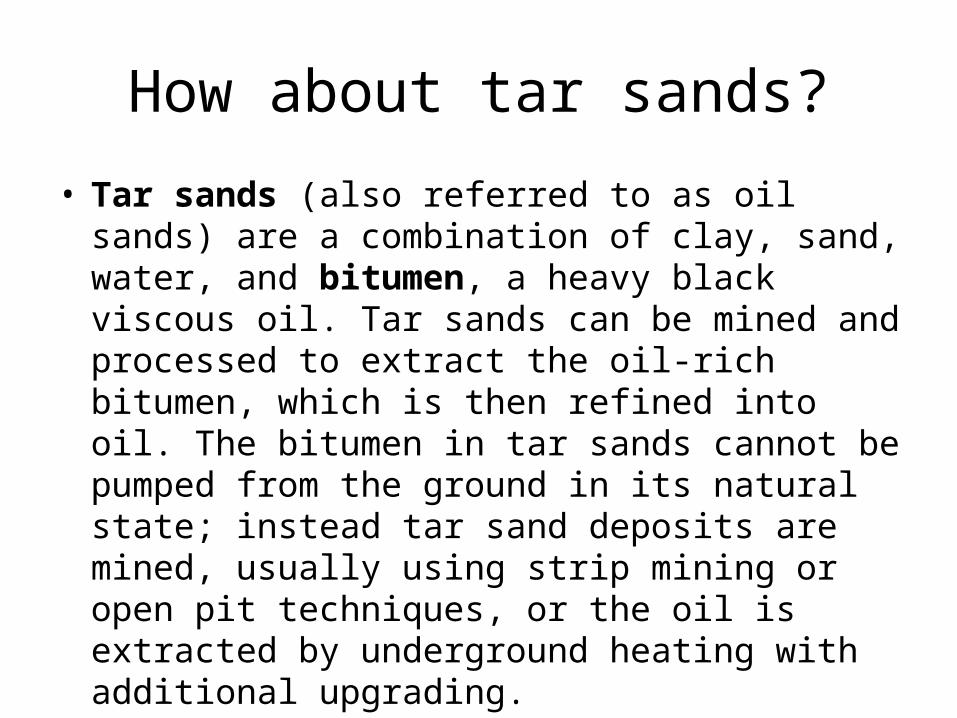
• Tar sands (also referred to as oil sands) are a combination of clay, sand, water, and bitumen, a heavy black viscous oil. Tar sands can be mined and processed to extract the oil-rich bitumen, which is then refined into oil. The bitumen in tar sands cannot be pumped from the ground in its natural state; instead tar sand deposits are mined, usually using strip mining or open pit techniques, or the oil is extracted by underground heating with additional upgrading.

How much oil?• Much of the world's oil (more than 2
trillion barrels) is in the form of tar sands, although it is not all recoverable. While tar sands are found in many places worldwide, the largest deposits in the world are found in Canada (Alberta) and Venezuela, and much of the rest is found in various countries in the Middle East.

Tradeoffs?
• About two tons of tar sands are required to produce one barrel of oil. Roughly 75% of the bitumen can be recovered from sand. After oil extraction, the spent sand and other materials are then returned to the mine, which is eventually reclaimed.


Tailings ponds
• During the process of separating bitumen from the tar sands, large amounts of water are mixed in with the sand, and once the oil has been removed, the leftover mixture of water, sand, clay and residual bitumen - known as tailings - has to be stored in a stable location so that the solution can settle and separate. The storage facilities are known as tailings ponds.
• The tar sands tailings ponds currently contain around 190 billion gallons of waste water.


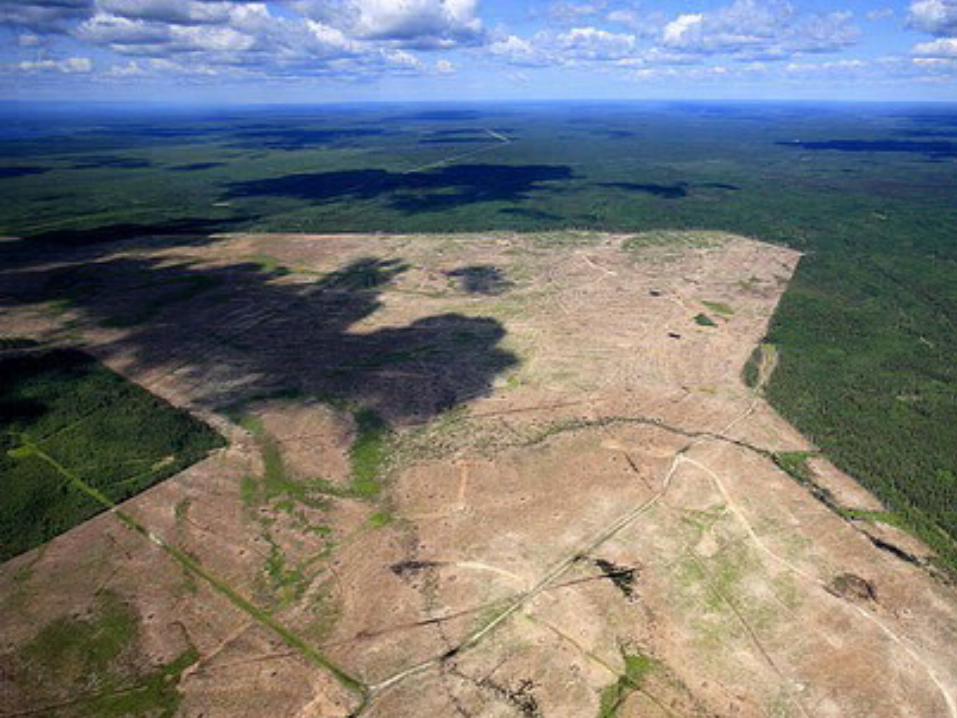
Forests?• 4.3 million hectares of the Boreal Forest cover the tar
sands, and these are being clearcut so that oil companies can access the tar underneath. The Boreal Forest has been referred to as the lungs of our planet, and tar sands operations threaten to destroy an area the size of Florida.
• Canada's vast Boreal Forest — one of the largest intact forest ecosystems on Earth — is gravely threatened by logging and tar sands mining. Some 3 BILLION birds — 30% of all the land birds in North America! — migrate to the Boreal each spring to feast and breed. They include warblers, thrushes, raptors, flycatchers and many, many more.


Athabasca oil sands
• The Athabasca deposit is the largest reservoir of crude bitumen in the world and the largest of three major oil sands deposits in Alberta, along with the nearby Peace River and Cold Lake deposits. Together, these oil sand deposits lie under 141,000 square kilometres (54,000 sq mi) of sparsely populated boreal forest and muskeg (peat bogs) and contain about 1.7 trillion barrels (270×10^9 m3) of bitumen in-place, comparable in magnitude to the world's total proven reserves of conventional petroleum.


Keystone pipeline
• The Keystone Pipeline System is a pipeline system to transport synthetic crude oil and diluted bitumen ("dilbit") from the Athabasca oil sands region in northeastern Alberta, Canada to multiple destinations in the United States
• The oil would move to refineries in Illinois, the Cushing oil distribution hub in Oklahoma, and proposed connections to refineries[along the Gulf Coast of Texas

Oil…
• Currently, the United States consumes 19.6 million barrels per day, of oil, which is more than 25% of the world's total.. As a result, the U.S produces one fourth of the world's carbon emissions.
• According to the EIA, the United States has 21 billion barrels of proved oil reserves as of January 1, 2000. The U.S. uses about 6.6 billion barrels per year. That is only enough oil to last the U.S. about three and a half years without importing oil from other countries

Who has it?
• # 1 Saudi Arabia:262,700,000,000 barrels • # 2 Canada:178,900,000,000 barrels • # 3 Iran:133,300,000,000 barrels• # 4 Iraq:112,500,000,000 barrels • 5 United Arab Emirates:97,800,000,000
barrels • # 14 United States:22,450,000,000 barrels • # 15 China:18,260,000,000 barrels• # 50 Germany:395,800,000 barrels

Oil to the USA!
• # 1…Canada reigns as the United States' leading oil supplier, exporting some 707,316,000 barrels of oil per year (1,938,000 barrels per day) — a whopping 99 percent of its annual oil exports, according to the EIA.
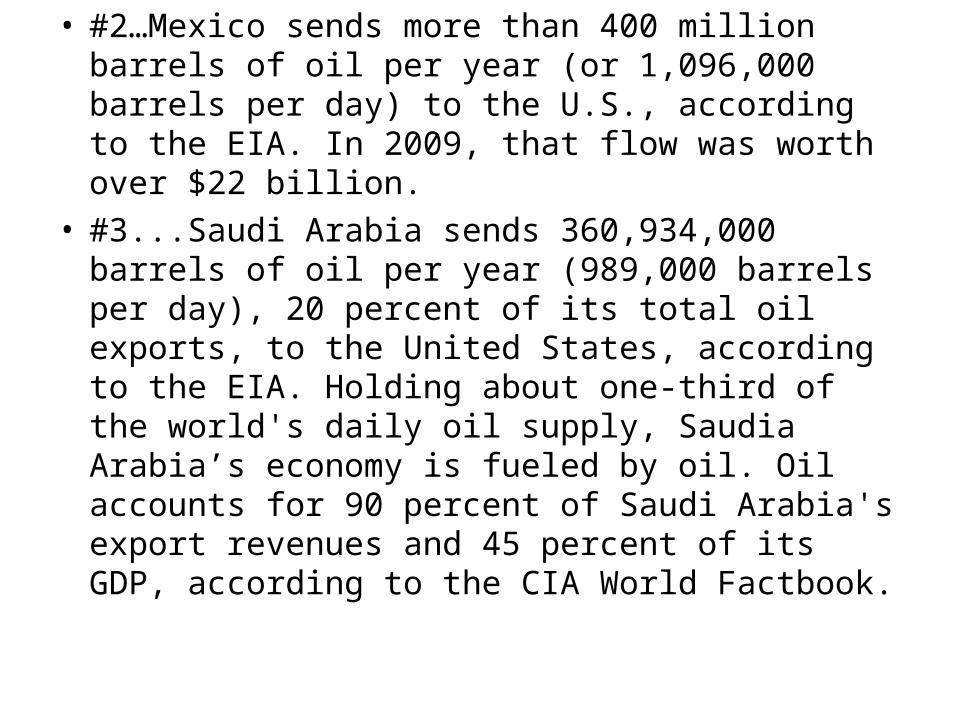
• #2…Mexico sends more than 400 million barrels of oil per year (or 1,096,000 barrels per day) to the U.S., according to the EIA. In 2009, that flow was worth over $22 billion.
• #3...Saudi Arabia sends 360,934,000 barrels of oil per year (989,000 barrels per day), 20 percent of its total oil exports, to the United States, according to the EIA. Holding about one-third of the world's daily oil supply, Saudia Arabia’s economy is fueled by oil. Oil accounts for 90 percent of Saudi Arabia's export revenues and 45 percent of its GDP, according to the CIA World Factbook.
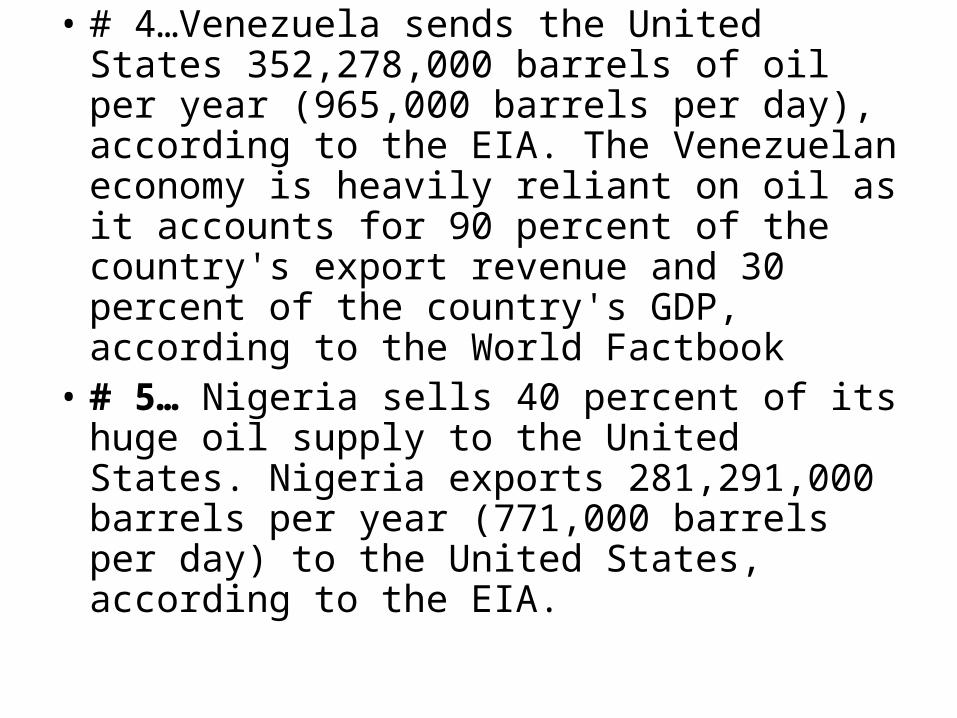
• # 4…Venezuela sends the United States 352,278,000 barrels of oil per year (965,000 barrels per day), according to the EIA. The Venezuelan economy is heavily reliant on oil as it accounts for 90 percent of the country's export revenue and 30 percent of the country's GDP, according to the World Factbook
• # 5… Nigeria sells 40 percent of its huge oil supply to the United States. Nigeria exports 281,291,000 barrels per year (771,000 barrels per day) to the United States, according to the EIA.


Gulf of Mexico• 6659 active and removed oil platforms and rigs, of
which 819 are still fully manned. • The Gulf of Mexico normally pumps about 1.5 million
barrels per day (bpd) of US crude • The Gulf of Mexico has a total of 7,664 pipelines. Total
pipeline miles are 25,176.48. Of the 30 companies with the largest number of pipelines and longest mileage in the Gulf of Mexico deepwater, the MMS records Chevron as having the largest number. Chevron has a total of 861. Energy Partners, Ltd. is second with 517 pipelines. Murphy Exploration & Production Company is third with 314 pipelines.


How much???
• Proved oil reserves at the end of 2008 are estimated to have been 1258.0 thousand million (billion) barrels. That represented an increase of 17.7% over the 1997 figure of 1068.5 billion barrels, despite estimated cumulative production of 290 billion barrels during the intervening ten years, ie global reserves additions amounted to around 480 billion barrels between end-1998 and end-2008.

Still…much undiscovered?
• Well over 70% of the Earth's crust remains to be explored for hydrocarbon (including oil, coal, gas, kerogens, bitumens, peats, clathrates, heavy oils). The truly giant oil fields may not have been discovered yet.
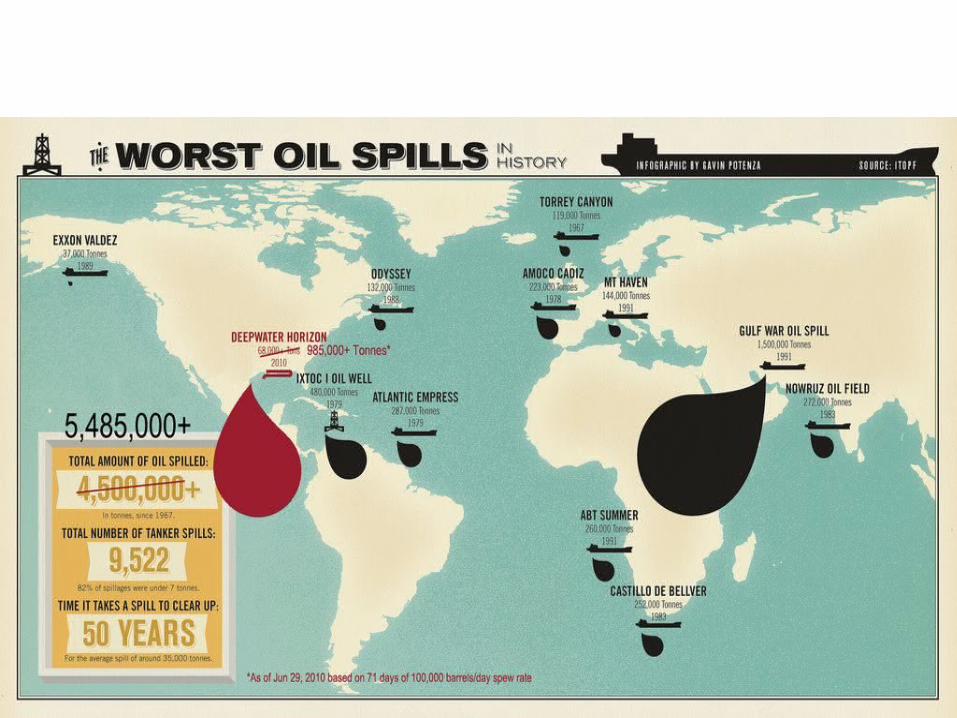

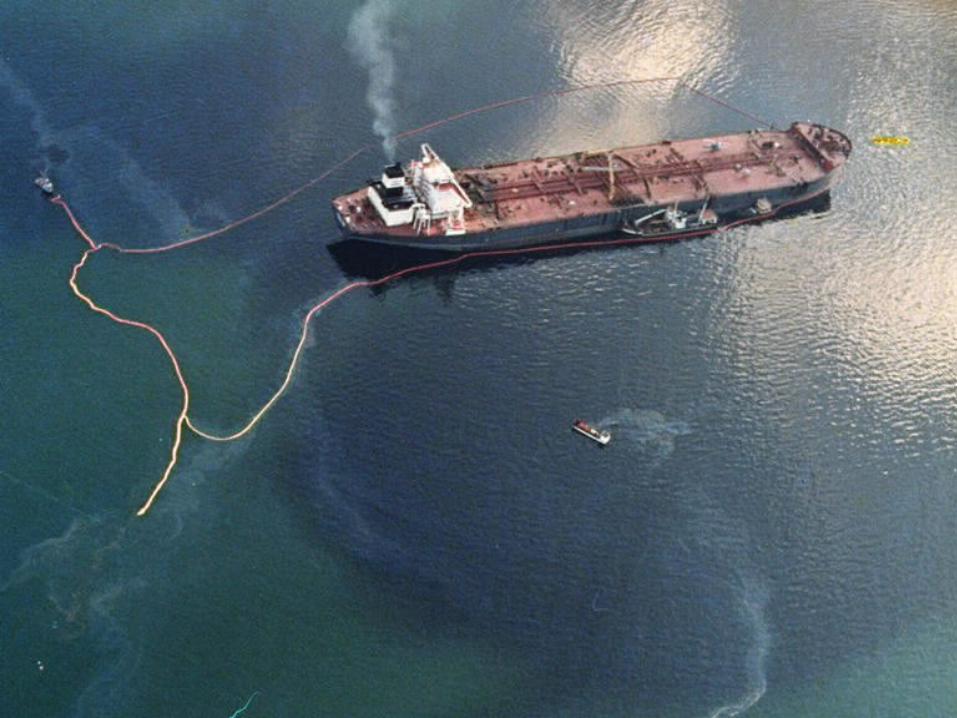
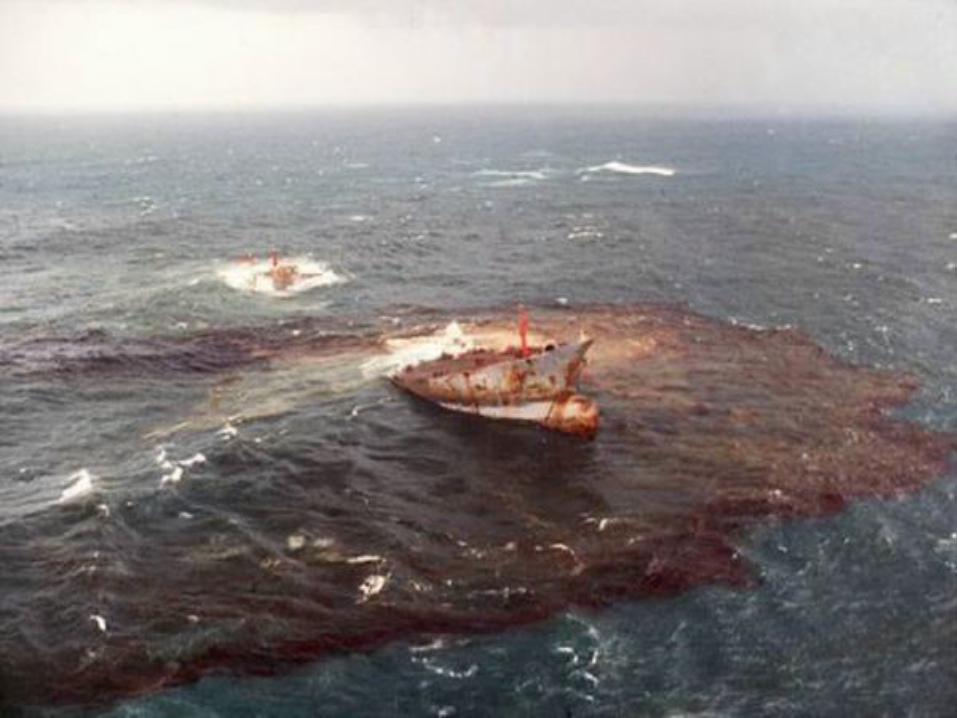
Worst spills
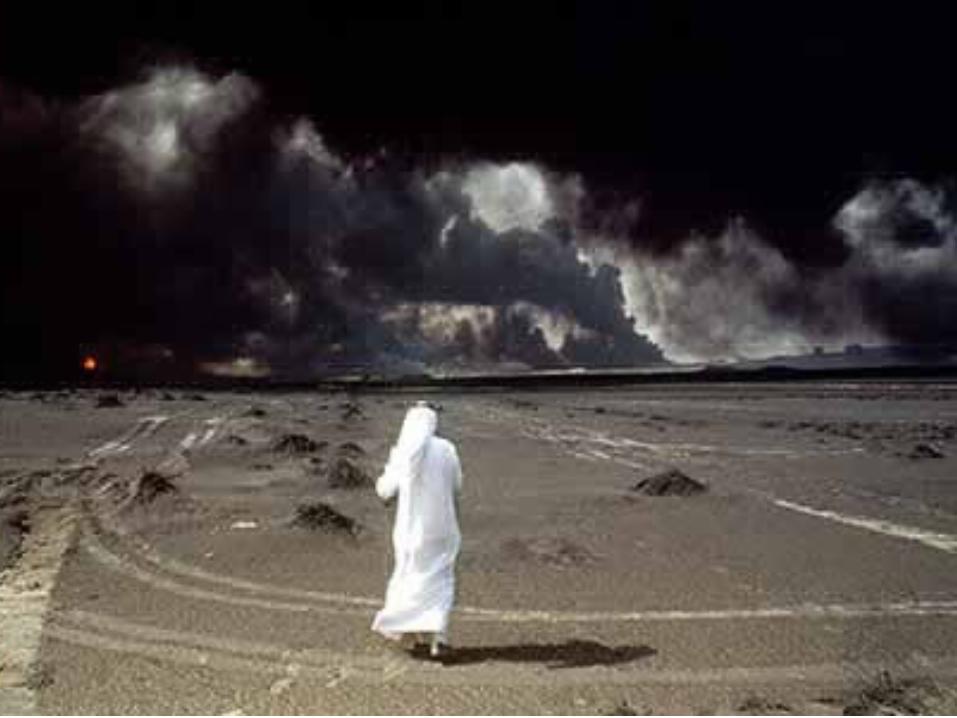
• 1. Arabian Gulf/Kuwaitwhen: Jan. 19, 1991
• Where: Persian Gulf, KuwaitAmount spilled: 380-520 million gallons
• Done on purpose!!!!


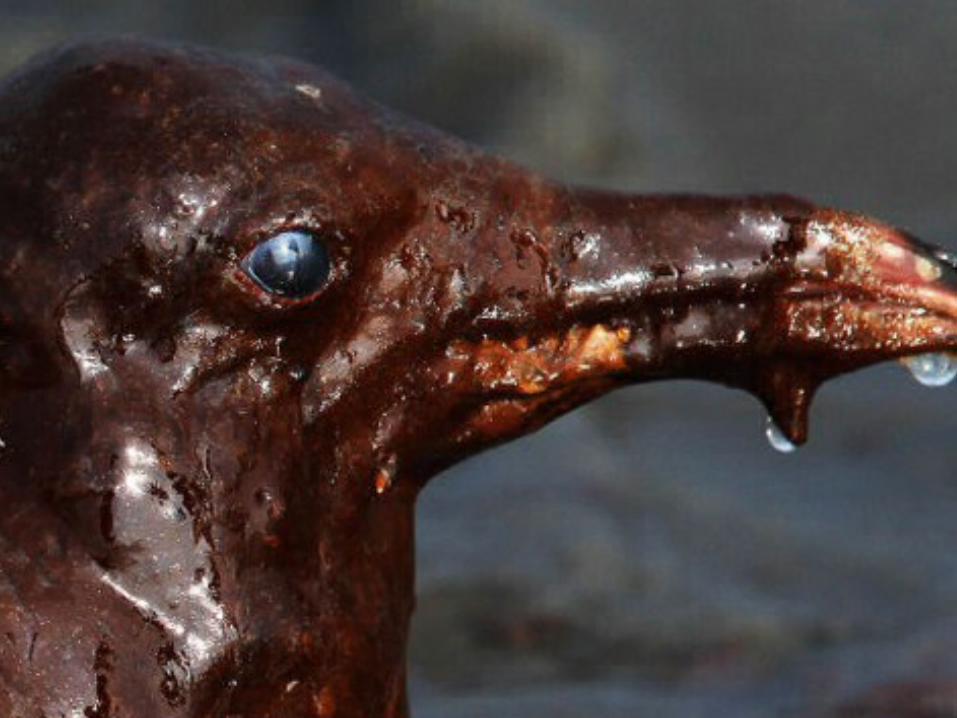
• 2. Gulf oil spill
• When: April 22, 2010
• Where: Gulf of Mexico
• Amount spilled: An estimated 206 million gallons
• 3. Ixtoc 1 Oil SpillWhen: June 3, 1979
• Where: Bay of Campeche off Ciudad del Carmen, MexicoAmount spilled: 140 million gallons


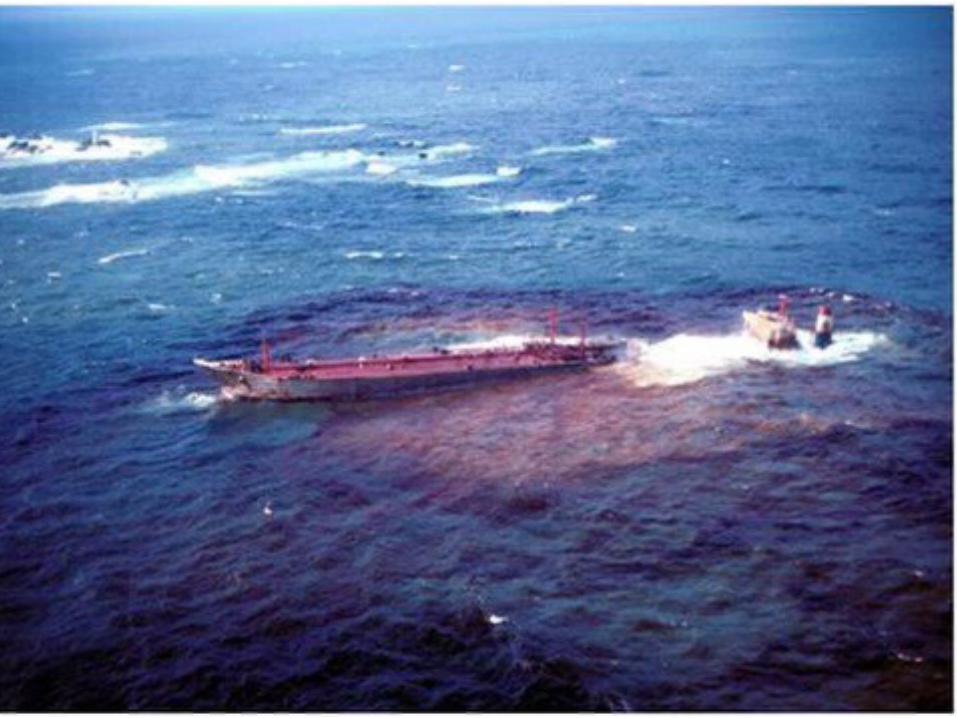
• 4. Atlantic Empress Oil SpillWhen: July 19, 1979
• Where: Off the coast of Trinidad and TobagoAmount spilled: 90 million gallons
• 5. Kolva River Oil SpillWhen: Aug. 6, 1983
• Where: Kolva River, RussiaAmount spilled: 84 million gallons
• 13. The Torrey Canyon Oil Spill
• When: March 18, 1967Where: Scilly Isles, UKAmount spilled: 25-36 million gallons


Atlantic Empress

Exxon Valdez

Amoco Cadiz


China…wildcard???
• China:7,578,000 bbl/day • The globe now has more than 1 billion
vehicles and is expected to hit the 2 billion mark within 20 years.
• Beijing alone now adds nearly 1,500 cars to its roads every day.Over the past decade, China has tripled its vehicle fleet to 45 million while India’s has doubled to 15 million.

USA?
• Only 246 million cars at the end of 2009.
• Every one gallon of gas…means 20 pounds of carbon dioxide
• What are the other social/environmental issues???


Global warming
• But the catch-phrase global warming is pretty recent. Or is it...? The first very modern-sounding use of this term harks back a surprisingly long time, to a First Mention in this November 6, 1957 newspaper article. Hammond Times….

Climate/gases• It is the strongest greenhouse gas, contributing
36% to 66% to the overall effect for vapor alone, 66% to 85% when you include clouds. It is however, not considered a climate "forcing," because the amount of H2O in the air basically varies as a function of temperature.
• If you artificially increase the level of H2O in the air, it rains out immediately (in terms of climate response times). Similarly, due to the abundance of ocean on the earth's surface, if you somehow removed all the water from the air, it would quickly be replaced through evaporation.
• Certain gases in the atmosphere have the property of absorbing infrared radiation. Oxygen and nitrogen the major gases in the atmosphere do not have this property. The infrared radiation strikes a molecule such as carbon dioxide and causes the bonds to bend and vibrate - this is called the absorption of IR energy. The molecule gains kinetic energy by this absorption of IR radiation.
• Carbon dioxide doesn't absorb the energy from the sun, but it does absorb some of the heat energy released from the earth. When a molecule of carbon dioxide absorbs heat energy, it goes into an excited unstable state. It can become stable again by releasing the energy it absorbed. Some of the released energy will go back to the earth and some will go out into space.

Carbon storage
• Of the three places where carbon is stored—atmosphere, oceans, and land biosphere—approximately 93 percent of the CO 2 is found in the oceans.
• Forests dominate the terrestrial carbon cycle, harboring 86% of the planet’s above-ground carbon and 73% of the planet’s soil carbon.
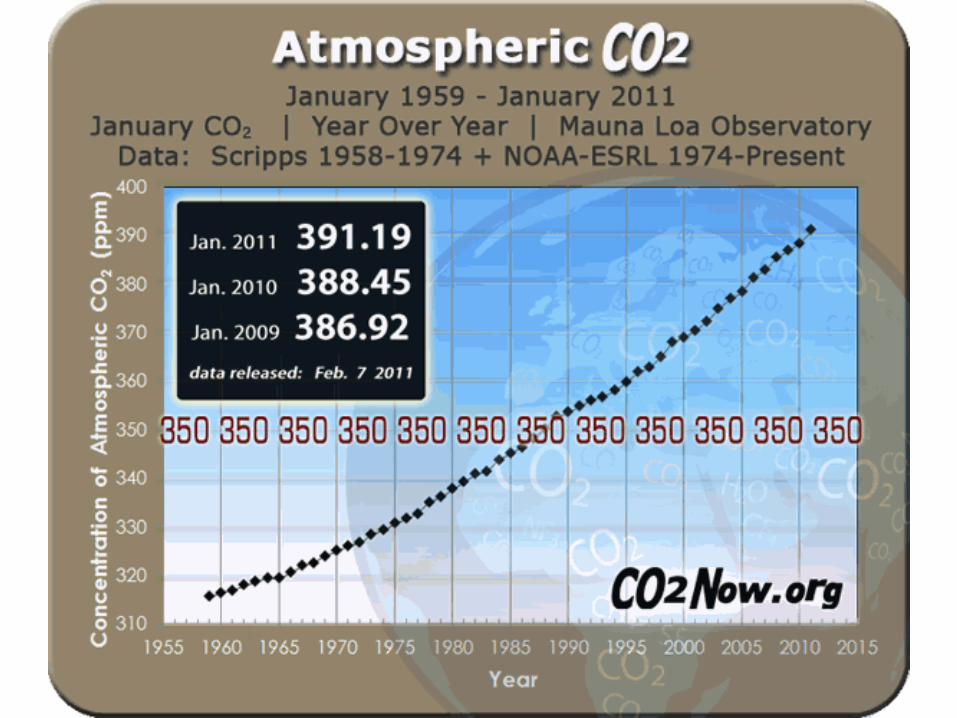
Since the Industrial Revolution, humans have greatly increased the quantity of carbon dioxide found in the Earth's atmosphere and oceans. Atmospheric levels have increased by over 30%, from about 275 parts per million (ppm) in the early 1700s.
In early 2012….we crossed 400 parts per million!!!
Oceans/change• increased air and sea surface
temperatures
• rises in sea level
• changes in weather patterns
• more frequent storms, droughts, floods and other extreme weather in some places
• possible alteration of ocean circulation patterns
• changes in seawater chemistry due to increased carbon dioxide concentrations

Ocean pH
• Ocean pH (usually 8.3)
• Oceans absorb a vast amount of carbon dioxide and incorporate into their shells (especially Mollusks with their calcium rich blood!)
• Is the ocean reaching a point of carbon saturation?
Acidification
•When CO2 levels in the atmosphere reach about 500 parts per million, you put calcification out of business in the ocean.
• Currently, atmospheric CO2 levels are presently 391 ppm, rising from 305 in 1960.

Coral bleaching
• Warming ocean temperatures cause coral bleaching by disrupting the relationship between coral and zooxanthellae algae. Coral bleaching decreases coral growth, reduces fecundity and can kill coral. Global warming is making bleaching events more frequent. How fast the oceans warm will largely determine whether coral survive.


Extent of bleaching
• (UNEP-WCMC) provides a new global estimate for coral reefs world-wide: 284 300 sq km, an area just half the size of France
• Approximately 58% percent of the world's reefs may already be threatened by human activities such as coastal development and overexploitation of marine products.

How serious?
• Record warm ocean temperatures across much of Earth’s tropical oceans during the summer of 2010 created the second worst year globally for coral-killing bleaching episodes. The warm waters, fueled in part by the El Ni±o phenomena, caused the most coral bleaching since 1998, when 16 percent of the world’s reefs were killed off.
• If every American family planted just one tree, the amount of CO2 in the atmosphere would be reduced by one billion lbs annually. This is almost 5% of the amount that human activity pumps into the atmosphere each year
• Northern forests appear to absorb about 1.5 billion tons of the 8 billion tons of carbon emitted each year. About 3.2 billion tons of this amount ends up in the atmosphere, while another 2.4 billion is taken up by the oceans.
• On average, one broad leaf tree will absorb in the region of 1 tonne of carbon dioxide during its full life-time (approximately 100 years).
• Forests in the United States absorb and store about 750 million metric tons of carbon dioxide each year, an amount equivalent to 10% of the country’s CO2 emissions. (50 pounds yearly/per tree?)


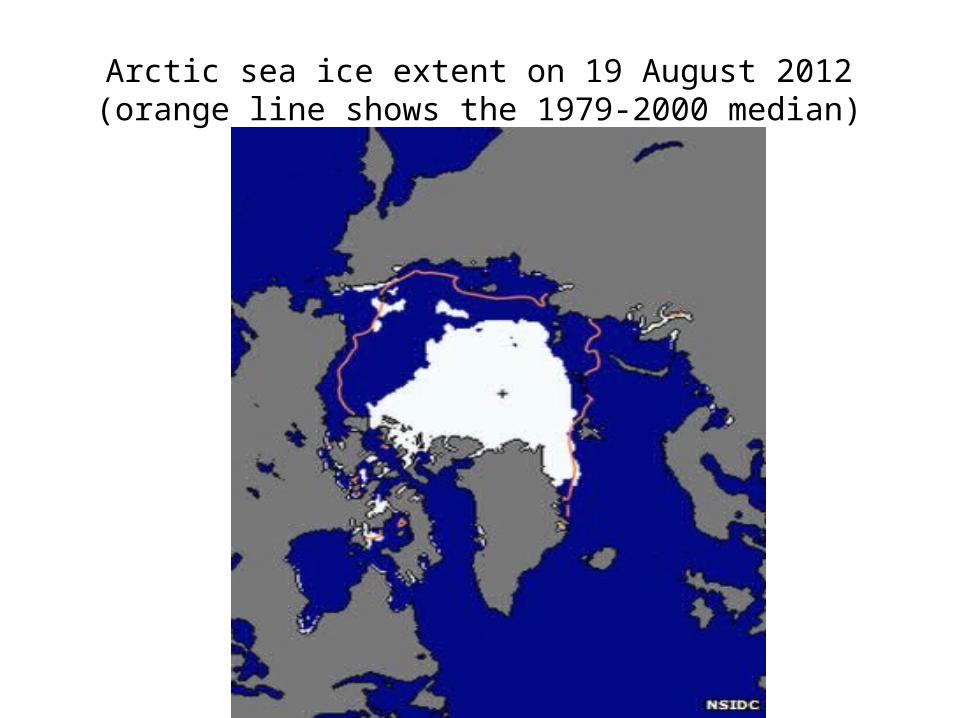
Arctic sea ice extent on 19 August 2012 (orange line shows the 1979-2000 median)
Greenland
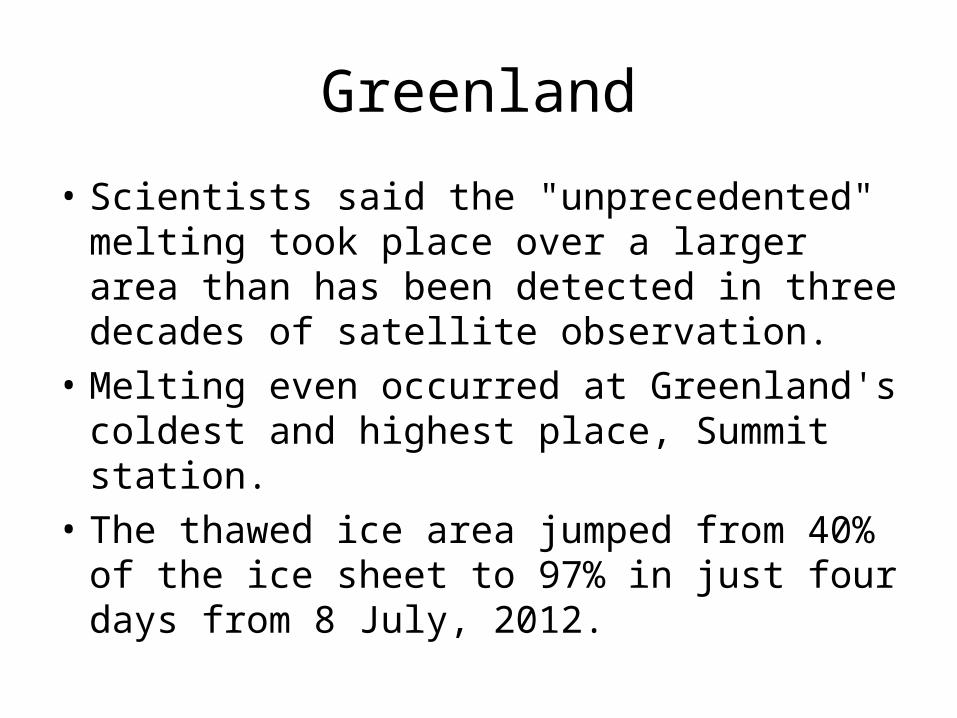
• Scientists said the "unprecedented" melting took place over a larger area than has been detected in three decades of satellite observation.
• Melting even occurred at Greenland's coldest and highest place, Summit station.
• The thawed ice area jumped from 40% of the ice sheet to 97% in just four days from 8 July, 2012.

Ice loss
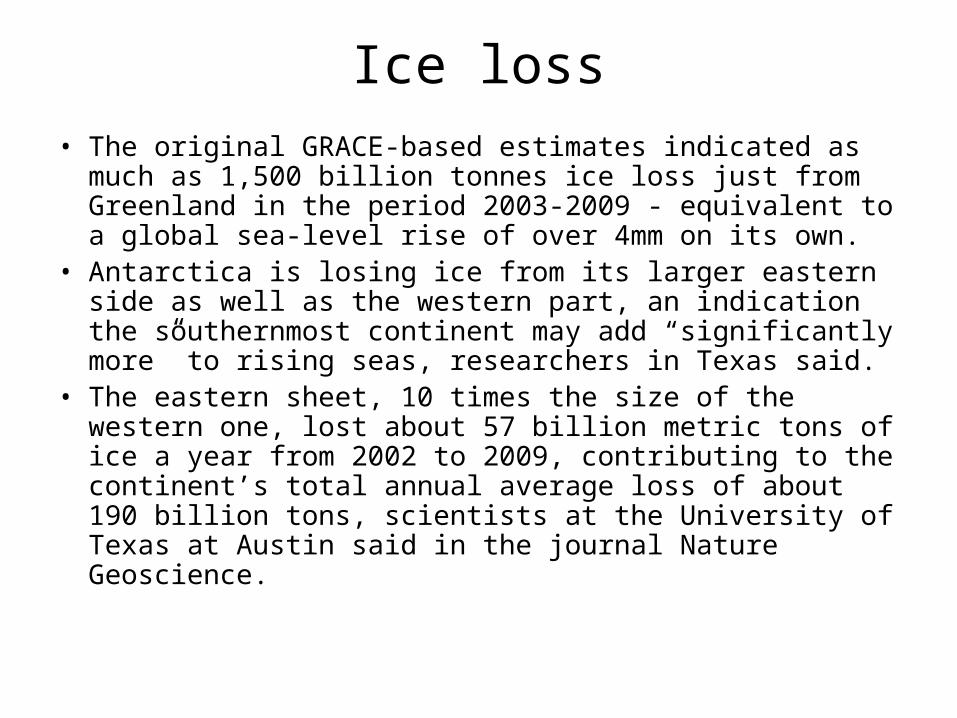
• The original GRACE-based estimates indicated as much as 1,500 billion tonnes ice loss just from Greenland in the period 2003-2009 - equivalent to a global sea-level rise of over 4mm on its own.
• Antarctica is losing ice from its larger eastern side as well as the western part, an indication the southernmost continent may add “significantly more” to rising seas, researchers in Texas said.
• The eastern sheet, 10 times the size of the western one, lost about 57 billion metric tons of ice a year from 2002 to 2009, contributing to the continent’s total annual average loss of about 190 billion tons, scientists at the University of Texas at Austin said in the journal Nature Geoscience.

Polar bears
• Researchers from the U.S. Geological Survey tracked a polar bear that swam an amazing 232 hours and 426 miles in the Beaufort Sea in North Alaska, searching for sea ice. The scientists believe that the bear’s epic swim is a result of climate change.
• In fact, if the ice melts one month earlier than in the 1990s, 40 to 73 per cent of pregnant female bears living on the western side of the bay will not carry their pregnancies to term, says the study led by University of Alberta biostatistician Péter Molnár.


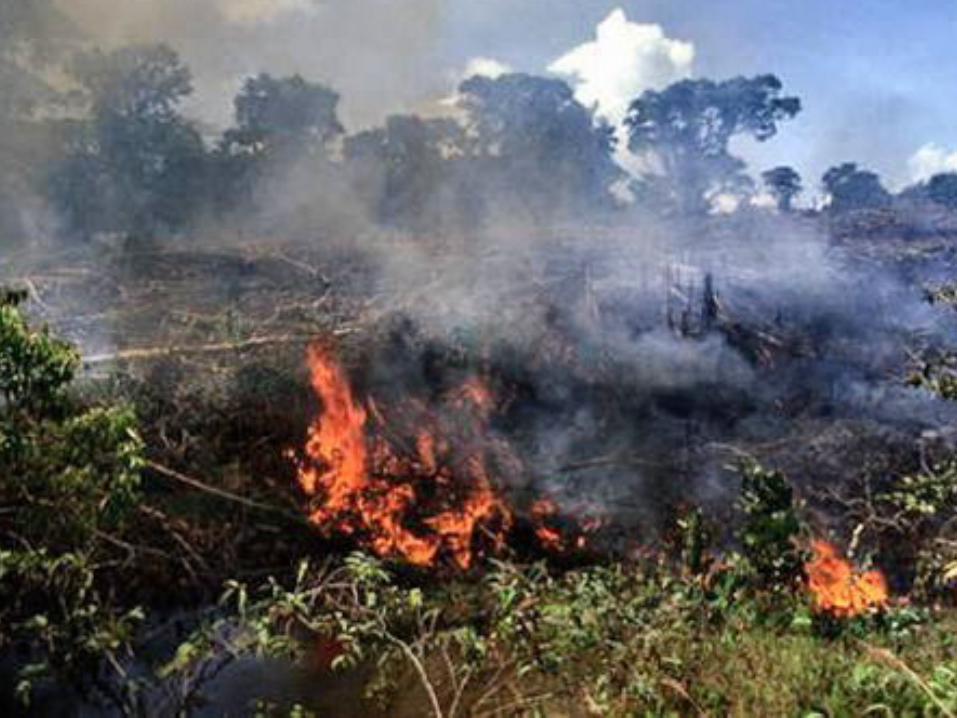
Amazon/drought/CO2
• The Amazon's vast rain forests typically pull some 1.5 billion tons of carbon dioxide from the air each year, storing the carbon in their wood and offsetting CO2 emissions that come as humans burn fossil fuels and clear forests for farming.
• The team calculates that once that decomposition process has kicked in completely, the dead trees will release over time some 5 billion tons of CO2.


1,2,4,8 meter rise

Sea level rise?
• Records and research show that sea level has been steadily rising at a rate of 1 to 2.5 millimeters (0.04 to 0.1 inches) per year since 1900.
• This rate may be increasing. Since 1992, new methods of satellite altimetry (the measurement of elevation or altitude) indicate a rate of rise of 3 millimeters (0.12 inches) per year.