Coagulation/Flocculation Workshop · PDF fileAquatic humic substances ... Broad application...
91
C Coa agula W C Flem A ation Wor Cours ing Tr April 1 n/Flo rksh se # 3 raining 1-13, occu hop 3103 g Cen 2017 ulati nter ion
Transcript of Coagulation/Flocculation Workshop · PDF fileAquatic humic substances ... Broad application...

CCoaagulaW
C
FlemA
ationWor
Cours
ing TrApril 1
n/Florksh
se # 3
raining1-13,
occuhop
3103
g Cen 2017
ulati
nter
ion


State of Tennessee
Coagulation / Flocculation Workshop April 11-13, 2017 Course #3103 Fl
emin
g T
rain
ing
Ce
nte
r
Tuesday, April 11 8:30 Registration and Welcome Amanda Carter 8:45 Water Clarification Training Amanda 11:45 Lunch 1:00 Jar Testing Math Amanda
Wednesday, April 12 8:30 Plant Example Amanda 11:45 Lunch 1:00 Laboratory Amanda
Thursday, April 13 8:30 Laboratory Amanda 9:45 Exam Review Amanda 11:15 Lunch 12:30 Course Review and Exam Amanda
Phone: 615-898-6507 Fax: 615-898-8064 E-mail: [email protected]
Fleming Training Center 2022 Blanton Dr.
Murfreesboro, TN 37129


Table of Contents
Section 1 Coagulation and Flocculation 3
Section 2 Math 21
Section 3 Plant Examples 67
Section 4 Laboratory 79

2

Section 1
Coagulation / Flocculation
3

1
Coagulation/Flocculation Workshop
Course #3103
TDEC - Fleming Training Center 2
Objectives of Water Treatment One objective of water treatment
professionals is to manage the removal of solids in the water that make it unsuitable for drinking.
These solids can be either particulate, dissolved or colloidal in size and character.
TDEC - Fleming Training Center
3TDEC - Fleming Training Center 4
Suspended Suspended
DissolvedDissolved
Colloidal
TDEC - Fleming Training Center
5
Particle Diameter, mm
Representative Particle
Time Required to Settle 1 foot
10 Gravel 0.3 sec1 Coarse sand 3 sec0.1 Fine sand 38 sec0.01 Silt 33 min0.001 Bacteria 55 hours0.0001 Color 230 days0.00001 Colloidal particles 6.3 yrs0.000001 Colloidal Particles 63 year minTDEC - Fleming Training Center 6
Suspended Solid
A solid organic or inorganic particle that is held in suspension by the action of flowing water.
TDEC - Fleming Training Center
Section 1 TDEC - Fleming Training Center
Coagulation / Flocculation4

7
Suspended Solids Common In Surface Waters Clay Sand Silt Bacteria Algae and other microorganisms
TDEC - Fleming Training Center 8
Suspended Solids Common In Surface Waters Effects of Particulates
Turbidity Suspended solids Taste and odors Corrosion
TDEC - Fleming Training Center
9
Colloidal Solid
Finely divided solid that will not settle out of water for very long periods of time unless the coagulation-flocculation process is used.
TDEC - Fleming Training Center 10
Colloidal Solids Common In Surface Waters Water color Aquatic humic substances Decomposition by-products (organic) Industrial wastes Silica Calcium carbonate
TDEC - Fleming Training Center
11
Colloidal Solids Common In Surface Waters Effects of colloidal material
Turbidity Deposition Taste and odors Increase coagulant usage and residuals Disinfection by-products (THM’s)
TDEC - Fleming Training Center 12
Dissolved Solid
Any material that is dissolved in water and can be recovered by evaporating the water after filtering out the suspended material.
TDEC - Fleming Training Center
TDEC - Fleming Training Center Section 1
Coagulation / Flocculation 5

13
Dissolved Solids Common In Surface and Ground Waters Water hardness
Calcium Magnesium
Iron and manganese Heavy metals Nitrates and nitrites
Salts Chlorides Sulfates Sulfides
Fluoride and silica compounds
TDEC - Fleming Training Center 14
Dissolved Solids Common In Surface and Ground Waters Effects of dissolved solids
Scaling and deposits Tastes and odors Toxic effects Corrosion Staining
TDEC - Fleming Training Center
15
Colloidal and Suspended Particles These particles have a surface charge
which is responsible for their “stability” to remain separate and suspended in the water.
TDEC - Fleming Training Center 16
Negatively Charged Particles
TDEC - Fleming Training Center
17
Coagulation
The water treatment process that causes very small suspended particles to attract one another and form larger particles
This is accomplished by the addition of a chemical, called a coagulant, that neutralizes the electrostatic charges on the particles that cause them to repel each other
TDEC - Fleming Training Center 18TDEC - Fleming Training Center
Section 1 TDEC - Fleming Training Center
Coagulation / Flocculation6

19
Initial Mixing
Purpose is to completely mix the coagulant into the raw water flow stream in a fast and uniform manner
Hydrolysis takes place almost instantaneously during the addition of the coagulant Less than 1 second
Complete floc development may take several minutes
TDEC - Fleming Training Center 20
Initial Mixing cont.
Flash mix and rapid mix can be used interchangeably
When conducting a jar test, the time the mixer runs at rapid mix should be equivalent to the effective detention time of the flash mix chamber in the plant
TDEC - Fleming Training Center
21
Flocculation
The water treatment process, following coagulation, that uses gentle stirring to bring suspended particles together so that they will form larger, more settleable clumps called floc.
TDEC - Fleming Training Center 22TDEC - Fleming Training Center
23TDEC - Fleming Training Center 24
Floc Characteristics
A typical conventional surface water treatment plant process that uses sedimentation followed by filtration benefits from a large, heavy floc that helps settling
TDEC - Fleming Training Center
TDEC - Fleming Training Center Section 1
Coagulation / Flocculation 7

25
Floc Characteristics cont.
A common misconception is that increasing the chemical dose increases the settling efficiency of the floc particles because the larger floc looks great in the basins This larger floc particle is more often just a chemical
floc, such as aluminum hydroxide precipitate In reality, this dose increase is a waste of chemicals
and therefore money and it creates more sludge to waste
TDEC - Fleming Training Center 26
Common Coagulants
TDEC - Fleming Training Center
27
Coagulants
Coagulants - positively charged chemicals that neutralize negatively charged particles in water to promote coagulation Alum (aluminum sulfate) Ferric Sulfate / Ferric Chloride Organic Polymers Polyaluminum chlorides
TDEC - Fleming Training Center 28
Alum
Advantages Inexpensive Handles variable water Historically used coagulant Broad application window Effective at organic removal
TDEC - Fleming Training Center
29
Alum
Disadvantages Produces large amounts of chemical solids Reduction in alkalinity Poor cold water performance Potential post precipitation problems
TDEC - Fleming Training Center 30
Ferric Sulfate/Ferric Chloride
Advantages Inexpensive Applied over a broad pH range Effective at organic removal Large floc formation
TDEC - Fleming Training Center
Section 1 TDEC - Fleming Training Center
Coagulation / Flocculation8
31
Ferric Sulfate/Ferric Chloride
Disadvantages Potential colored water Highly staining chemical Very corrosive products that can increase
maintenance costs Large chemical solids formation Strong alkalinity reduction Heavy metal considerations
TDEC - Fleming Training Center 32
Organic Polymers
Advantages Low dosages applied Minimal chemical solids generation No alkalinity reduction Aids in dewatering of sludge Reaction independent of pH and alkalinity Good cold water performance
TDEC - Fleming Training Center
33
Organic Polymers
Disadvantages Expensive Must base product choice on performance Poor primary coagulants Potential filter fouling Can adversely effect filter run lengths Possible monomer residuals
TDEC - Fleming Training Center 34
Polyaluminum Chloride Products Other chemical names
Aluminum Chlorohydrate (ACH) Aluminum Hydroxychloride Aluminum Chloride Hydroxide Polyaluminum Chloride Polyaluminumchlorosulfate
TDEC - Fleming Training Center
35
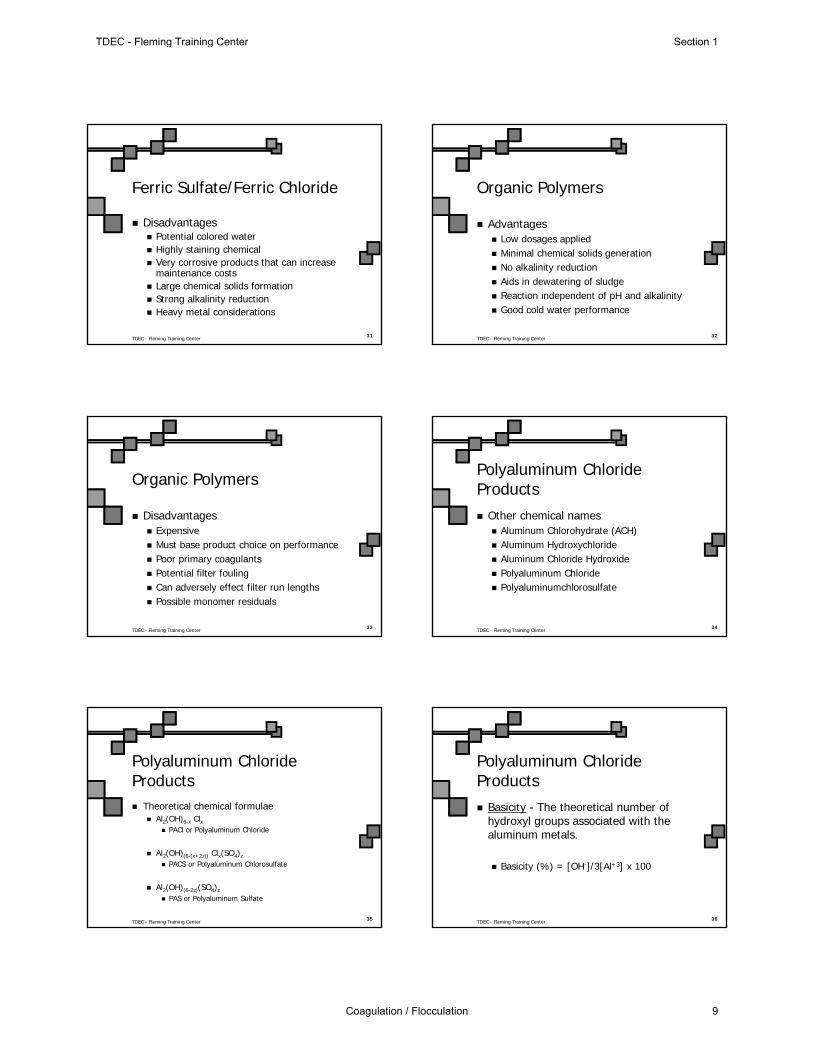
Polyaluminum Chloride Products Theoretical chemical formulae
Al2(OH)6-x Clx PACl or Polyaluminum Chloride
Al2(OH)(6-(x+2z)) Clx(SO4)z
PACS or Polyaluminum Chlorosulfate
Al2(OH)(6-2z)(SO4)z
PAS or Polyaluminum Sulfate
TDEC - Fleming Training Center 36
Polyaluminum Chloride Products Basicity - The theoretical number of
hydroxyl groups associated with the aluminum metals.
Basicity (%) = [OH-]/3[Al+3] x 100
TDEC - Fleming Training Center
TDEC - Fleming Training Center Section 1
Coagulation / Flocculation 9

37
Polyaluminum Chloride Products Basicity (%) = [OH-]/3[Al+3] x 100
Low Basicity = 0-33% Al2(OH)6-x Clx x = 4 to 6
Middle Basicity = 34 - 67% Al2(OH)6-x Clx x= 2 to 3.99
High Basicity = 68- 83% Al2(OH)6-x Clx x < 2
TDEC - Fleming Training Center 38
PACl Products – Basicity Related to Performance Low
More like AlCl3 Competes with
traditional coagulants Faster reaction More pH depression More corrosive Good TOC removal
High More like polymers Multiple applications Less chemical solids
generated Less pH depression Less alkalinity
consumption
TDEC - Fleming Training Center
39
Polyaluminum Chloride Products Advantages
Variety of products that can meet multiple goals
Improve overall water quality versus traditional coagulants
Better plant operations ACH is highly concentrated aluminum source Overall treatment cost savings
TDEC - Fleming Training Center 40
Polyaluminum Chloride Products Disadvantages
Must base product choice on performance Relative $/# is higher than traditional salts Overall cost picture must be calculated Must be applied properly Most plants don’t have historical data with
PACl Should match flocculant to PACl
TDEC - Fleming Training Center
41
PACl Product Comparisons –TOC Removal
CoagulantTOC Removal
(%) Dose Active Metal DoseLow Basicity PACl 38.4 0.03 1.14Mid Basicity PACl 30.0 0.03 0.88High Basicity PACl/ACH
26.5 0.10 0.94
PACS (Polyaluminum Chlorosulfate)
28.1 0.04 0.82
TDEC - Fleming Training Center 42
PACl Product Comparisons –Particulate RemovalSize Range Removal by High
Basicity PAClRemoval by Mid Basicity PACS
< 2 mm 67% 60%
2-5 mm 57% 45%
5-10 mm 60% 33%
TDEC - Fleming Training Center
Section 1 TDEC - Fleming Training Center
Coagulation / Flocculation10

43
PACl Product Comparisons
Equal Metal Application Dosages
Applied Dose PACl 5.3% as Al or 10% Al203 30 mg/L
10 - 70% Basicity
ACH 12.7% as Al or 24% Al203 12.5 mg/L 83% Basicity
TDEC - Fleming Training Center 44
Coagulant Blends
Inorganic salt w/ organic polymers Various ratios
Inorganic w/ acid Various ratios
Inorganic w/ additive
TDEC - Fleming Training Center
45
Various Coagulant Applications
TDEC - Fleming Training Center 46
Various Coagulant Applications
Reduced particle counts
Ease of use Cost savings Chemical residue
(sludge) reduction Aluminum residual
reduction
Stable treated water Longer filter runs Cold water treatment TOC, THM, HAA
removal Faster settling rates
TDEC - Fleming Training Center
47
Various Coagulant Applications
Set/prioritize treatment goals Understand individual raw water issues
Cold water Low alkalinity High organic episodes Extremely variable turbidity water Highly colored water Easy to treat, constant water
TDEC - Fleming Training Center 48
Selecting the CorrectPolymer Each polymer has a specific function Each type of polymer has benefits and
limitations Understand it’s limitations
TDEC - Fleming Training Center
TDEC - Fleming Training Center Section 1
Coagulation / Flocculation 11

49
Water Soluble Solution Cationic Polymers Polymer reacts with the colloidal material
in the water by neutralizing the charge or by bridging (tying together) individual particles to form visible insoluble floc
Polymer has a positive charge and the colloidal material has a negative charge
TDEC - Fleming Training Center 50
Define the Polymer PrimaryTreatment Goals Solids removal Settled turbidity Filtered turbidity Sludge reduction Filter run lengths Color removal
TDEC - Fleming Training Center
51
Understanding the Water Source Type of source
Well, Lake, River
Parameters Temperature Turbidity pH Alkalinity
TDEC - Fleming Training Center 52
Characteristics of Organic Polymers Cationic polymers
Examples Polyamines Polyquaternaries Polydadmac Epi-dma
Molecular weight below 100,000 Available as aqueous solutions
TDEC - Fleming Training Center
53
Characteristics of Organic Polymers Cationic flocculants
Examples Copolymers of acrylamide and DMAEM/DADMAC Mannich amines
Molecular weight over 1,000,000 Available as powders and emulsions
TDEC - Fleming Training Center 54
Characteristics of Organic Polymers Nonionic flocculants
Examples Polyacrylamides
Molecular weight over 1,000,000 Available as powders and emulsions
TDEC - Fleming Training Center
Section 1 TDEC - Fleming Training Center
Coagulation / Flocculation12

55
Characteristics of Organic Polymers Anionic flocculants
Examples Polyacrylates Copolymers Acrylamide/ acrylate
Molecular weight over 1,000,000 Available as powders and emulsions
TDEC - Fleming Training Center 56
How to Run a Successful Plant Trial Define primary goals Understanding water source Chemical programs Design a chemical program Jar testing Plant trial
TDEC - Fleming Training Center
57
Defining Primary Treatment Goals Solids removals Settled turbidity Filtered turbidity Color removal TOC/HAA removal Lengths of filtered runs Sludge reduction
TDEC - Fleming Training Center 58
Chemical Program
Each chemical used in a water plant influences and/or impacts the performance of another
Understand its purpose and its limitations Design chemical program to:
Water Source Applications Goals
TDEC - Fleming Training Center
59
Jar Testing
Used to screen different technologies
Test procedure should correlate to plant’s performance Mixing energy Slow mixing Settling time
TDEC - Fleming Training Center 60
Jar Testing
Compare to plant’s chemical program: Settled turbidity Filtered turbidity pH Alkalinity Filtered Index TOC/UV
TDEC - Fleming Training Center
TDEC - Fleming Training Center Section 1
Coagulation / Flocculation 13

61
Planning and Scheduling
Note: Valid trials are an exercise in experimental design.
Plan carefully Set clear goals Scheduling Training Polymer/coagulant introduction
TDEC - Fleming Training Center 62
Planning and Scheduling cont.
Equipment Technical support Measurements made
TDEC - Fleming Training Center
63
Planning and Scheduling cont.
Schedule the plant trial to avoid plant projects focus on trial
Make the trial long enough 30 to 60 days First week for transition period Second week allows for dosage optimization and
operators to become familiar with the programs strengths and weaknesses
TDEC - Fleming Training Center 64
Planning and Scheduling cont.
Data collected after this break in period provides a valid comparison to historical data
TDEC - Fleming Training Center
65
Product Changeover
Use a conservative approach Gradual introduction of new chemistry Gradual weaning off of old chemistry
75/25% - 50/50% - 25/75% - 100% Use conservative dosage
Optimize later Adjust other chemistries systematically
TDEC - Fleming Training Center 66
Operator Training
The fate of any trial rests in the hands of the operators
Operators should know the trial goals, understand the new chemistry, and what to expect
TDEC - Fleming Training Center
Section 1 TDEC - Fleming Training Center
Coagulation / Flocculation14

67
Laboratory Testing Techniques
EquipmentSolution preparation
Test procedures
TDEC - Fleming Training Center 68
Equipment
Jars Square Round
Stirrer Water bath Analytical Equipment
Turbidimeter pH meter Thermometer
TDEC - Fleming Training Center
69
Types of Jars
1-Liter Circular First used Least expensive
2-Liter Circular 2-Liter Square
TDEC - Fleming Training Center 70
1-Liter Circular Jars
Disadvantages: Holds very little water
Minor errors in chemical doses result in large error in actual doses
Water rotates with paddles Reduces the amount of actual mixing
Limited amount of water for analysis Does not provide a good sampling point
In general, 1-L jars are not acceptableTDEC - Fleming Training Center
71
2-Liter Circular Jars
Provides enough sample Stators inserted may help with mixing
May interfere with dosing and sampling
Sample siphon can be added, but with some difficulty
Disadvantage: Water still rotates with the stirrer unless stators are
used
TDEC - Fleming Training Center 72TDEC - Fleming Training Center
TDEC - Fleming Training Center Section 1
Coagulation / Flocculation 15

73
2-Liter Square Beaker
Advantages: Square configuration reduces rotation of
water Thicker wall and lower heat conductivity of
plexiglass reduces water temp change during test
Jars are less fragile and can be repaired Sampling port can easily be installed
TDEC - Fleming Training Center 74
Round vs. Square Mixing
Use the same shape as your flash mix
TDEC - Fleming Training Center
75
Stirrer
Two basic types Gear-driven
Best
Magnetic-driven Easier to add chemicals Doesn’t turn smoothly at slow speeds
TDEC - Fleming Training Center 76
Impellers
Types Paddle Turbine Marine Axial flow
Need the one that best simulates full scale
TDEC - Fleming Training Center
77
Impellers
Magnetic stirrers are only available with paddles Corresponds to paddle, walking-beam, flat-
blade turbine type mixing devices
Top mounted stirrers with flat paddles are best Shaft and impeller can be changed
TDEC - Fleming Training Center 78
Water Bath
Jars set in a rectangular tank with raw water circulating around them
This is only necessary for cold water
TDEC - Fleming Training Center
Section 1 TDEC - Fleming Training Center
Coagulation / Flocculation16

79TDEC - Fleming Training Center 80
Water Bath
Determination for use of water bath: Take a raw sample
Run jar test immediately
Take another sample Let warm 5-10 degrees Run same test and take note in difference
TDEC - Fleming Training Center
81
Analytical Equipment
Turbidimeter pH meter
Thermometer Pipets
Analytical balance
TDEC - Fleming Training Center 82
Solution Preparation
Accuracy is critical - Small errors are compounded by large dilutions
Dilute solutions of 1 g/L or less of coagulants or polymers should be prepared daily
TDEC - Fleming Training Center
83
Solution Prep - Dry Products
Dissolve 1 gram of a chemical that is 100% in 1000 mL of DI water This is a 0.1% solution by weight or 1,000 mg/L
In a 1 liter test beaker, 1 mL of the above equals 1 mg/L
If the chemical is not 100%, then divide by the percent of the chemical available
TDEC - Fleming Training Center 84
Solution Prep - Dry Products
Useful dilution for alum, iron salts, carbons and alkalis
Lower this dilution for polymers, fluorides and potassium permanganate
TDEC - Fleming Training Center
TDEC - Fleming Training Center Section 1
Coagulation / Flocculation 17

85
Example
TDEC - Fleming Training Center 86
Dry Alum
Use a 1-L volumetric flask Dissolve 10 grams in 600 mL DI water Fill to the mark and mix Solution contains 10,000 mg/L Therefore, 1 mL of the stock solution added to a
2-L jar will equal a 5 mg/L alum dose
TDEC - Fleming Training Center
87
Solution Prep - Liquid Products
To make a 10 g/L solution (1% or 10,000 mg/L) of a liquid product, divide 10 gram by specific gravity This is the mL of chemical to dissolve in 1000
mL DI water In a 1 liter test beaker, 1 mL of the above
equals 10 mg/L of liquid product For solutions like PACl
Remember, Jar Test beakers are usually 2 L, therefore double dose
TDEC - Fleming Training Center 88
Solution Prep - Liquid Products
Again, remember Jar Test beakers are usually 2L, therefore double doseTDEC - Fleming Training Center
89
Solution Prep - Liquid Products
TDEC - Fleming Training Center 90
Solution Prep - Liquid Products
TDEC - Fleming Training Center
* multiply x 2 for a 2 liter jar
Section 1 TDEC - Fleming Training Center
Coagulation / Flocculation18

91
Solution Prep - Liquid Products
TDEC - Fleming Training Center
* multiply x 2 for a 2 liter jar
92
Micro-pipeting
Try to place dose on an object that can perch on the rim of the jar until you are ready to add all at the same time Septas from TOC vials Powder pillows
TDEC - Fleming Training Center
93
Jar Testing
Must know volume of test jars and speed rates of stirrers prior to test
Don’t use laboratory grade chemicals Use what you feed in
plant
TDEC - Fleming Training Center 94
Test Procedure Obtain fresh sample of water Sample temp. should not vary more than 3°C Record the following:
Dispense equal volumes of water into jarsTDEC - Fleming Training Center
Temperature pH Turbidity
Color Iron Manganese
Hardness Alkalinity Fluoride
Phosphorus Suspended Solids
95
Test Procedure
Start mixing sequence and add test chemicals Always run a control of current program Mixing times and speeds are obtained from
plant designs and operations Observe formation rate, floc size and settling
rate Record all results
TDEC - Fleming Training Center 96
Filterability Index
Comparison of filtration rate of sample vs. DI water
Helps predict the effect of a coagulant program on the filtration process
Samples tested are clarified settled water, filter influent and jar test decants
TDEC - Fleming Training Center
TDEC - Fleming Training Center Section 1
Coagulation / Flocculation 19

97
F-I Equipment
Membrane filter holder 47mm Membrane filters 0.45 micrometers (m) Vacuum source - consistent Filter flask, vacuum tubing, forceps Stopwatch Deionized water
TDEC - Fleming Training Center 98
F-I Procedure
Measure 200 mL DI water Place membrane in filter holder Start vacuum Add DI water Time in seconds to filter DI water Discard membrane and DI filtrate Repeat for test sample Test sample filtrate for water quality
TDEC - Fleming Training Center
99
F-I Procedure
Filterability Index (FI) = Time of SampleTime of DI water
Good Performance Sand Filters FI < 3 High Rate Filters FI < 2 Filtered Turbidity < 0.3 NTU
TDEC - Fleming Training Center 100
Troubleshooting
Incomplete Floc??? Take sample after settling basin Put on jar tester and set paddles to slow mix If floc appears, you have incomplete
flocculation
TDEC - Fleming Training Center
Section 1 TDEC - Fleming Training Center
Coagulation / Flocculation20

Section 2
Math
21

4/3/2017
1
Jar Testing
Practical Uses Velocity Gradient
Laboratory Testing Techniques Filterability Index Demonstration
TDEC - Fleming Training Center 1
Key Parameters
Velocity gradient in the flash mix
Effective retention time in the flash mix
Velocity gradient in the flocculator
Effective retention time in the flocculator
Surface overflow rate on the sedimentation basin
TDEC - Fleming Training Center 2
Section 2 TDEC - Fleming Training Center
Math22

4/3/2017
2
Practical Uses for Jar Tests
Determine coagulant and flocculant dosages
Determine mixing times
Chemical addition sequence
Mixing energies
Dosages of taste and odor control chemicals
Dosages of oxidant chemicals
TDEC - Fleming Training Center 3
Determine Dose
Bracket expected “best” dosage If 15 mg/L alum is expected to be best, test
5, 10, 15, 20 , 25 and 30 mg/L
Change only one variable (i.e. pH adjustment chemical dose) during each test run Perform multiple runs if multiple variable
changes are necessary
TDEC - Fleming Training Center 4
TDEC - Fleming Training Center Section 2
Math 23

4/3/2017
3
Rules to Remember
Keep equipment clean
Rinse jars and paddles with DI water
Use fresh chemicals
Add chemicals in correct order
Pre-measure chemicals
TDEC - Fleming Training Center 5
Rules to Remember
Use 2 liters of water per jar
Drain water out of sample line before taking sample
Check pH at flash mix and jar to compare
Light heats up water – leave off
TDEC - Fleming Training Center 6
Section 2 TDEC - Fleming Training Center
Math24

4/3/2017
4
Velocity Gradient, G, sec-1
The power input per unit volume of water How much horsepower the mixing device is
supplying to the water to mix the coagulant into the water
OR
How much horsepower is being supplied to increase floc formation in the flocculators
TDEC - Fleming Training Center 7
Velocity Gradient, G, sec-1 The concept of velocity gradient is one of
the most important ideas to be understood when conducting jar tests
The intensity of mixing is generally measured by the velocity gradient A higher number indicates more intense
mixing
Mixing intensities, or velocity gradients, during jar tests should correspond to those in the treatment plant
TDEC - Fleming Training Center 8
TDEC - Fleming Training Center Section 2
Math 25

4/3/2017
5
Velocity Gradient, G, sec-1
Units = sec-1 or ft/sec/ft
G should decrease as water goes through the treatment process
TDEC - Fleming Training Center 9
How to Find Velocity Gradient
Consultant or plant engineer
Manufacturer of unit
Bid specs, drawings or O&M manual
Calculations taught in this workshop
Educated guess/trial and error
TDEC - Fleming Training Center 10
Section 2 TDEC - Fleming Training Center
Math26

4/3/2017
6
Sedimentation
Sedimentation basins remove particles by gravity
The surface loading rate or overflow rate is the most important parameter for sedimentation
Surface loading corresponds to velocity
TDEC - Fleming Training Center 11
Example – Repeat from Slide 123
The surface overflow rate for a basin is 2,500 gpd/ft2. What is the settling velocity in cm/min for the basin?
Settling Velocity, = (0.0025 MGD/ft2)(2,829.56)
cm/min
Settling Velocity = 7.07 cm/min
TDEC - Fleming Training Center 12
TDEC - Fleming Training Center Section 2
Math 27

4/3/2017
7
Settling Velocity
To calculate the settling velocity or the rate at which the particles settle, the following conversion factors can be used
TDEC - Fleming Training Center 13
Shortcut…
Plant Flow Rate / Surface Area Multiply
By Settling Velocity
MGD/ft2 2,829.56 cm/min
gal/min/ft2 4.0746 cm/min
TDEC - Fleming Training Center 14
Section 2 TDEC - Fleming Training Center
Math28

4/3/2017
8
SLR to Settling Velocity
A sedimentation tank will remove all particles that exceed the critical velocity for a given overflow rate
Therefore, the surface loading rate corresponds to the settling velocity and must match that of the process
TDEC - Fleming Training Center 15
Settling Velocities cont.
A sedimentation tank with a surface overflow rate of 1440 gpd/ft2 removes particles that settle faster than 4 cm/min.
Particles that settle slower would not be removed
TDEC - Fleming Training Center 16
TDEC - Fleming Training Center Section 2
Math 29

4/3/2017
9
Settling Velocity cont.
Surface Overflow Rate, gpd/ft2
Settling Velocity,
cm/min
180 0.5
360 1.0
720 2.0
1440 4.0
3600 10.0
TDEC - Fleming Training Center 17
Note: 1 gpm/ft2 is equivalent to a settling velocity of 4 cm/min
Settling Velocities
General design of alum and ferric sedimentation basins:
SOR rates of 400-1000 gpd/ft2
Settling velocities of 1-3 cm/min
Samples should be taken from 2-10 min in jar tests
TDEC - Fleming Training Center 18
Section 2 TDEC - Fleming Training Center
Math30

4/3/2017
10
Settling Velocities cont.
Allowing the water to settle for 30-60 minutes and then taking a sample for turbidity has no relationship to the full-scale system
This sample should not be used for collecting useful jar test information
TDEC - Fleming Training Center 19
Settling Velocities cont.
Jar tests can be used to determine what percent of the turbidity has a certain settling velocity
Basin efficiencies can be estimated for a given overflow rate with this info
TDEC - Fleming Training Center 20
TDEC - Fleming Training Center Section 2
Math 31

4/3/2017
11
Ready for Some Math???
TDEC - Fleming Training Center 21
Get your calculators out!!
How to Find Velocity Gradient
Formula
V = tank volume, ft3
P = horsepower minus 10%
= viscosity, (lbs)(sec)/ft2
550 converts HP to WHP TDEC - Fleming Training Center
22
))((
))(550(
V
PG
Section 2 TDEC - Fleming Training Center
Math32

4/3/2017
12
Horsepower
P = horsepower (motor and gear unit)
Take about 10% off for wear and tear 100 hp, use 90 hp
Get this from your motor nameplate or paperwork
TDEC - Fleming Training Center 23
) )(V (μ
) )(P (550G
Viscosity
= viscosity of water in force (lb)(sec)/ft2
See chart on next slide
TDEC - Fleming Training Center 24
) )(V (μ
) )(P (550G
TDEC - Fleming Training Center Section 2
Math 33

4/3/2017
13
Temperature ° C , (lbs)(sec)/ft2 Temperature ° F
2 0.000033613 35.6
4 0.000032731 39.2
6 0.000030747 42.8
8 0.000028964 46.4
10 0.000027846 50
12 0.000024879 53.6
14 0.000024529 57.2
16 0.000023293 60.8
18 0.000022139 64.4
20 0.000021061 68.0
22 0.000020061 71.6
24 0.000019128 75.2
26 0.000018261 78.8
28 0.000017461 82.4
30 0.000016712 86.0 TDEC - Fleming Training Center
25
Volume
V = volume of the flash mix basin in ft3
Square basin, ft3 = (length, ft)(width, ft)(depth, ft)
Round basin, ft3 = (0.785)(Diameter, ft)2(depth, ft)
TDEC - Fleming Training Center 26
) )(V (μ
) )(P (550G
Section 2 TDEC - Fleming Training Center
Math34

4/3/2017
14
Example
Motor HP = 6 hp
Water Temp = 18° C
Flash mix = 10ft x 10ft x 12 ft deep
What is G?
TDEC - Fleming Training Center 27
Example
P = (6HP)(0.90) = 5.4 hp
= 0.000022139 (from chart)
V = (10ft)(10ft)(12ft) = 1200 ft3
TDEC - Fleming Training Center 28
Motor HP = 6
Water Temp = 18° C
Flash mix = 10ft x 10ft x 12 ft deep
TDEC - Fleming Training Center Section 2
Math 35

4/3/2017
15
Example
𝐺 = 550 5.4 ℎ𝑝
0.000022139 1200 𝑓𝑡3
𝐺 = 2970
0.0265668
𝐺 = 111,793.6673
𝐺 = 334𝑠𝑒𝑐−1 TDEC - Fleming Training Center
29
) )(V (μ
) )(P (550G
Now What?
Now what do we do with G now that we have found it?
Velocity gradient can be correlated to paddle speed in the jar test machine.
TDEC - Fleming Training Center 30
Section 2 TDEC - Fleming Training Center
Math36

4/3/2017
16
TDEC - Fleming Training Center 31
334
250
Water Temp = 18° C
Your Turn
HP = 3
Temperature = 16° C
Volume of flash mix = 8ft x 8ft x 10ft
What is the velocity gradient and what should be the setting for the jar test paddles?
TDEC - Fleming Training Center 32
TDEC - Fleming Training Center Section 2
Math 37

4/3/2017
17
Example
P = (3 HP)(0.90) = 2.7 hp
= 0.000023293 (from chart)
V = (8ft)(8ft)(10ft) = 640 ft3
TDEC - Fleming Training Center 33
Motor HP = 3
Water Temp = 16° C
Flash mix = 8ft x 8ft x 10 ft deep
Example
𝐺 = (550)(2.7 ℎ𝑝)
(0.000023293)(640 𝑓𝑡3)
𝐺 = 1485
0.01490752
𝐺 = 99,614.1545
𝐺 = 315.6 𝑠𝑒𝑐−1 TDEC - Fleming Training Center
34
) )(V (μ
) )(P (550G
Section 2 TDEC - Fleming Training Center
Math38

4/3/2017
18
TDEC - Fleming Training Center 35
315
250
Water Temp = 16° C
One More Time
HP = 2
Temperature = 24° C
Volume of flash mix = 9ft x 9ft x 10ft
What is the velocity gradient and what should be the setting for the jar test paddles?
TDEC - Fleming Training Center 36
TDEC - Fleming Training Center Section 2
Math 39

4/3/2017
19
Example
P = (2HP)(0.90) = 1.8 hp
= 0.000019128 (from chart)
V = (9ft)(9ft)(10ft) = 810 ft3
TDEC - Fleming Training Center 37
Motor HP = 2
Water Temp = 24° C
Flash mix = 9ft x 9ft x 10 ft deep
TDEC - Fleming Training Center 38
sec8.252
02124.897,63
01549368.0
990
)810)(000019128.0(
)8.1)(550(
1
3
G
G
G
ft
hpG
Section 2 TDEC - Fleming Training Center
Math40

4/3/2017
20
TDEC - Fleming Training Center 39
253
185
Water Temp = 24° C
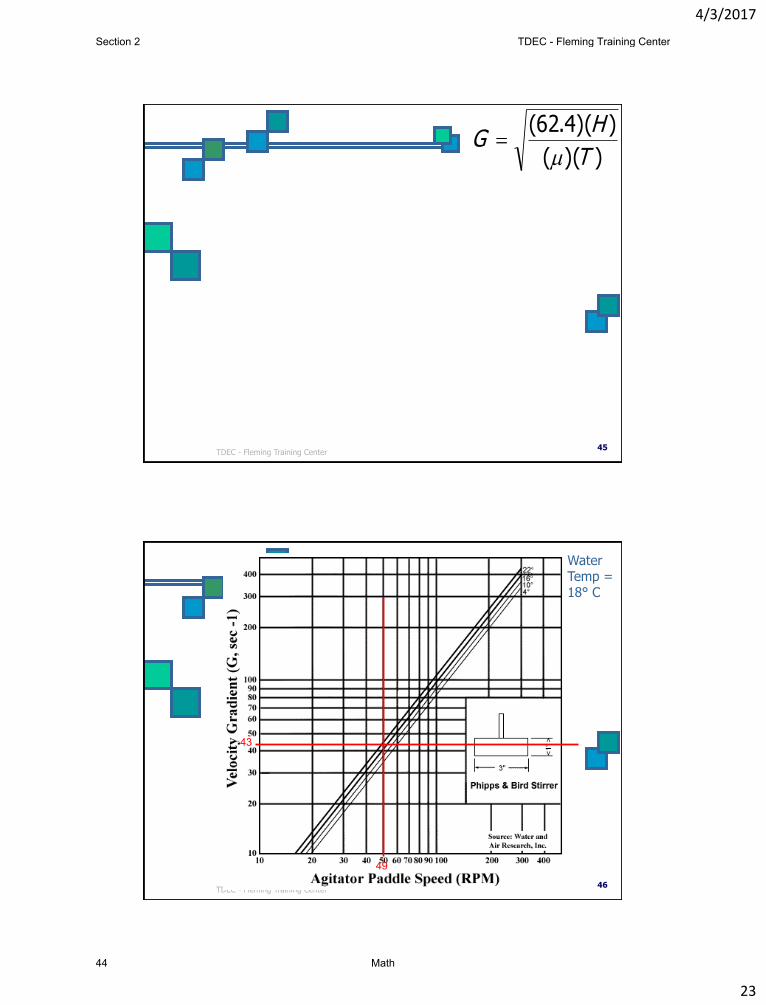
Hydraulic Jumps, Weirs and Baffles
Formula
H= head loss, ft
= viscosity, (lbs)(sec)/ft2
T = detention time, sec
TDEC - Fleming Training Center 40
))((
))(4.62(
T
HG
TDEC - Fleming Training Center Section 2
Math 41

4/3/2017
21
Example
Temperature = 20° C
= 0.000021061
Weir is 2 feet high
Detention time = 55 seconds
TDEC - Fleming Training Center 41
))((
))(4.62(
T
HG
𝐺 = 62.4 2 𝑓𝑡
0.000021061 55 𝑠𝑒𝑐
𝐺 = 124.8
0.001158355
𝐺 = 107,738.9919
𝐺 = 328.2 𝑠𝑒𝑐−1
TDEC - Fleming Training Center 42
))((
))(4.62(
T
HG
Section 2 TDEC - Fleming Training Center
Math42

4/3/2017
22
TDEC - Fleming Training Center 43
328
240
Water Temp = 20° C
Your Turn
Temperature = 18° C
Weir is 2 feet high
Detention time = 51 minutes = 3060 sec
What is the velocity gradient and what should be the setting for the jar test paddles?
TDEC - Fleming Training Center 44
TDEC - Fleming Training Center Section 2
Math 43
4/3/2017
23
TDEC - Fleming Training Center 45
sec9.42 1
193131.1842
06774534.0
8.124
)sec3060)(000022139.0(
)ft2)(4.62(
G
G
G
G
))((
))(4.62(
T
HG
TDEC - Fleming Training Center 46
43
49
Water Temp = 18° C
Section 2 TDEC - Fleming Training Center
Math44
4/3/2017
24
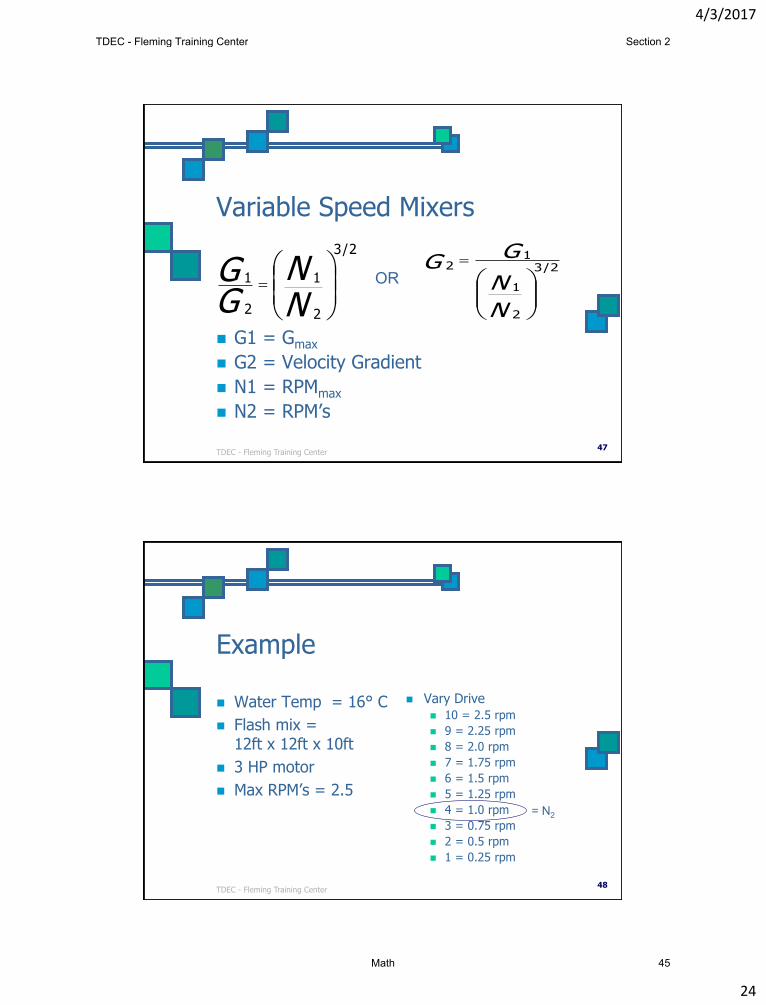
Variable Speed Mixers
G1 = Gmax
G2 = Velocity Gradient
N1 = RPMmax
N2 = RPM’s
TDEC - Fleming Training Center 47
NN
GG
2
1
2/3
2
1 OR
N
N
GG
2
1
2/31
2
Example
Water Temp = 16° C
Flash mix = 12ft x 12ft x 10ft
3 HP motor
Max RPM’s = 2.5
Vary Drive 10 = 2.5 rpm
9 = 2.25 rpm
8 = 2.0 rpm
7 = 1.75 rpm
6 = 1.5 rpm
5 = 1.25 rpm
4 = 1.0 rpm
3 = 0.75 rpm
2 = 0.5 rpm
1 = 0.25 rpm
TDEC - Fleming Training Center 48
= N2
TDEC - Fleming Training Center Section 2
Math 45

4/3/2017
25
P = (3 hp)(0.90) = 2.7 hp
= 0.000023293 (from chart)
V = (12ft)(12ft)(10ft) = 1440 ft3
TDEC - Fleming Training Center 49
TDEC - Fleming Training Center 50
sec4.210G
95754.272,44G
03354192.0
1485
)1440)(000023293.0(
)7.2)(550(
)V)((
)P)(550(
1
1
1
1
31
1
G
ft
hpG
G
Section 2 TDEC - Fleming Training Center
Math46

4/3/2017
26
TDEC - Fleming Training Center 51
53G
952847075.3210
G
1.02.5
sec210G
2
2
2/3
-1
2
This is the velocity gradient at vary drive 4
with 1.0 rpm
N
N
GG
2
1
2/31
2
G1 = Gmax
G2 = Velocity Gradient
N1 = RPMmax
N2 = RPM’s
TDEC - Fleming Training Center 52
53
61
Water Temp = 16° C
TDEC - Fleming Training Center Section 2
Math 47

4/3/2017
27
Using 2.5 for N1 and 210 for G1, solve for G2 at all other RPM’s
TDEC - Fleming Training Center 53
TDEC - Fleming Training Center 54
Setting Flocculator RPM
G2 Jar Test RPM
10 2.5 210 187
9 2.25 179 162
8 2.0 150 137
7 1.75 123 115
6 1.5 98 100
5 1.25 74 80
4 1.0 53 61
3 0.75 35 43
2 0.5 19 27
1 0.25 6.6 <10
Section 2 TDEC - Fleming Training Center
Math48

4/3/2017
28
Calculating Stirring Times
Stirring Time, = (Plant Capacity, gpm)(DT, min)
min Actual Flow Rate, gpm
Detention Time, min = Tank Vol, gal
Flow Rate, gpm
TDEC - Fleming Training Center 55
What if your jar test machine won’t give you a high enough G (velocity gradient)?
You must mix longer to compensate for the decreased velocity gradient
TDEC - Fleming Training Center 56
G1T1 = G2T2
TDEC - Fleming Training Center Section 2
Math 49

4/3/2017
29
Example
Velocity Gradient = 1000 sec-1
Time = 15 sec
Temp = 22°C
Our Phipps & Bird machine will only go up to 105 rpm’s, which is equivalent to ~ 100 sec-1
TDEC - Fleming Training Center 57
𝐺1𝑇1 ≡ 𝐺2𝑇2
𝑇1 ≡𝐺2 𝑇2𝐺1
𝑇1 ≡1000 𝑠𝑒𝑐−1 15 𝑠𝑒𝑐
100 𝑠𝑒𝑐−1
𝑇1 = 150 𝑠𝑒𝑐@105 𝑟𝑝𝑚
TDEC - Fleming Training Center 58
T1 = Tmax = time to use in jar test, sec G1 = Gmax= maximum G for jar test machine, sec-1 T2 = actual process detention time, sec G2 = calculated velocity gradient, sec-1
Section 2 TDEC - Fleming Training Center
Math50

4/3/2017
30
Sedimentation
Does surface loading rate influence sedimentation?
Yes – this is one of the most important factors
Also knows as Surface Overflow Rate
SOR = Basin Flow Rate, gpd
Basin Surface Area, ft2
TDEC - Fleming Training Center 59
Example
A water plant has four sedimentation basins. It treats 6 MGD. The flow is split equally between all four basins. The basins are 30 feet long and 20 feet wide. What is the surface overflow rate for each basin in gpd/ft2?
TDEC - Fleming Training Center 60
TDEC - Fleming Training Center Section 2
Math 51

4/3/2017
31
𝑔𝑝𝑑 𝑏𝑎𝑠𝑖𝑛 =6,000,000 𝑔𝑝𝑑
4 𝑏𝑎𝑠𝑖𝑛𝑠
𝑔𝑝𝑑 𝑏𝑎𝑠𝑖𝑛 = 1,500,000 𝑔𝑝𝑑 𝑏𝑎𝑠𝑖𝑛
𝑆𝑂𝑅 = 1,500,000 𝑔𝑝𝑑
30 𝑓𝑡 20 𝑓𝑡
𝑆𝑂𝑅 = 1,500,000 𝑔𝑝𝑑
600 𝑓𝑡2
𝑆𝑂𝑅 = 2,500 𝑔𝑝𝑑
𝑓𝑡2
TDEC - Fleming Training Center 61
Conversion of SOR to Settling Velocities
Settling Velocity, = (SOR, gpd/ft2)(3785 cm3/gal)
cm/min (1440 min/day)(929 cm2/ft2)
TDEC - Fleming Training Center 62
1 cm3 = 1 mL 3785 mL = 1 gal
Therefore, 3785 cm3 also = 1 gal
Section 2 TDEC - Fleming Training Center
Math52

4/3/2017
32
Example The surface overflow rate for a basin is
2,500 gpd/ft2. What is the settling velocity in cm/min for the basin?
Settling Velocity, = (SOR, gpd/ft2)(3785 cm3/gal)
cm/min (1440 min/day)(929 cm2/ft2)
Settling Velocity, = (2,500, gpd/ft2)(3785 cm3/gal)
cm/min (1440 min/day)(929 cm2/ft2)
Settling Velocity = 7.07 cm/min
TDEC - Fleming Training Center 63
Settling Velocities
Settling Velocity, cm/min Sampling Time, min
0.5 20
1.0 10
2.0 5
4.0 2.5
10.0 1
TDEC - Fleming Training Center 64
Chart based on a sample depth in the jar of 10 cm
TDEC - Fleming Training Center Section 2
Math 53

4/3/2017
33
10cm = 2.5 min
4 cm/min
So, at 10 cm = 1.4 min till sampling
7 cm/min time
TDEC - Fleming Training Center 65
Section 2 TDEC - Fleming Training Center
Math54

Coagulation/Flocculation Math
Volume 1. A flash mix chamber is 4 feet wide by 5 feet long and contains water to a depth of
3 feet. What is the volume in gallons of water in the flash mix chamber? 2. A flocculation basin is 50 feet long by 20 feet wide and contains water to a depth of
8 feet. What is the volume in gallons of the water in the basin? 3. A flocculation basin is 40 feet long by 16 feet wide and contains water to a depth of
8 feet. How many gallons of water are in the basin? 4. A flash mix chamber is 5 feet square and contains water to a depth of 42 inches.
What is the volume in gallons of water in the flash mixing chamber?
TDEC - Fleming Training Center Section 2
Math 55

5. A flocculation basin is 25 feet wide by 40 feet long and contains water to a depth of 9 feet 2 inches. What is the volume in gallons of water in the flocculation basin?
Detention Time 6. The flow to a flocculation basin is 3,625,000 gal/day. If the basin is 60 feet long by
25 feet wide and contains water to a depth of 9 feet, what is the detention time (in minutes) of the flocculation basin?
7. A flocculation basin is 50 feet long by 20 feet wide and has a water level of 8 feet.
What is the detention time (in minutes) in the basin if the flow to the basin is 2.8 MGD?
8. A flash mix chamber is 6 feet long, 5 feet wide and 5 feet deep. It receives a flow
of 9 MGD. What is the detention time (in seconds) in the chamber?
Section 2 TDEC - Fleming Training Center
Math56

9. A flocculation basin is 50 feet long by 20 feet wide and has a water depth of 10 feet. If the flow to the basin is 2,250,000 gal/day, what is the detention time in minutes?
10. A flash mix chamber is 4 feet square and has a water depth of 42 inches. If the
flash mix chamber receives a flow of 3.25 MGD, what is the detention time in seconds?
Dry Feeder Settings 11. The desired dry alum dosage, as determined by the jar test, is 10 mg/L. Determine
the lb/day setting on a dry alum feeder if the flow is 3,450,000 gal/day. 12. Jar tests indicate that the best polymer dose for a water sample is 12 mg/L. If the
flow to be treated is 1,660,000 gal/day, what should the dry chemical lb/day feed setting be?
TDEC - Fleming Training Center Section 2
Math 57

13. Determine the desired lb/day setting on a dry alum feeder if jar tests indicate an optimum dose of 12 mg/L and the flow to be treated is 2.66 MGD.
14. The desired dry alum dose is 9 mg/L, as determined by a jar test. If the flow to be
treated is 940,000 gal/day, how many lb/day dry alum will be required? 15. A flow of 4.10 MGD is to be treated with a dry polymer. If the desired dose is 13
mg/L, what should the dry chemical feeder in lb/day setting be? 16. Calculate the actual chemical feed rate in pounds per day if a container is placed
under a chemical feeder and 2.3 pounds are collected during a 30-minute period.
Section 2 TDEC - Fleming Training Center
Math58

17. During a 24-hour period, a flow of 1,920,000 gal/day is treated. If 42 pounds of polymer were used for coagulation during that 24-hour period, what is the polymer dosage in mg/L?
Liquid Feeder Settings 18. Jar tests indicate that the best alum dose for a unit process is 7 mg/L. The flow to
be treated is 1.66 MGD. Determine the gal/day setting for the alum solution feeder if the liquid alum contains 5.24 pounds of alum per gallon of solution.
19. The flow to a plant if 3.43 MGD. Jar testing indicates that the optimum alum dose
is 12 mg/L. What should the gal/day setting be for the solution feeder if the alum solution is a 55% solution?
20. Jar tests indicate that the best alum dose for a unit process is 10 mg/L. The flow to
be treated is 4.13 MGD. Determine the gal/day setting for the alum solution feeder if the liquid alum contains 5.40 pounds of alum per gallon of solution.
TDEC - Fleming Training Center Section 2
Math 59

21. Jar tests indicate the best liquid alum dose for a unit process is 11 mg/L. The flow to be treated is 880,000 gal/day. Determine the gal/day setting for the liquid alum chemical feeder if the liquid alum is a 55% solution.
22. A flow of 1,850,000 gal/day is to be treated with alum. Jar tests indicate that the
optimum alum dose is 15 mg/L. If the liquid alum contains 640 mg alum per milliliter solution, what should be the gallons per day setting for the alum solution feeder?
23. The desired solution feed rate was calculated to be 40 gal/day. What is this feed
rate expressed at milliliters per minute (mL/min)? 24. The desired solution feed rate was calculated to be 34.2 gal/day. What is this feed
rate expressed at milliliters per minute (mL/min)?
Section 2 TDEC - Fleming Training Center
Math60

25. The optimum polymer dose has been determined to be 10 mg/L. The flow to be treated is 2,880,000 gal/day. If the solution to be used contains 55% active polymer, what should the solution chemical feeder setting be in milliliters per minute (mL/min)?
26. The optimum polymer dose for a 2,820,000 gal/day flow has been determined to be
6 mg/L. If the polymer solution contains 55% active polymer, what should the solution chemical feeder setting in milliliters per minute be? Assuming the polymer solution weighs 8.34 lbs/gal.
27. Jar tests indicate that the best alum dose for a unit process is 16 mg/L. The liquid
alum contains 5.40 pounds alum per gallon of solution. What should the setting be on the solution chemical feeder in milliliters per minute (mL/min) when the flow to be treated is 3.45 MGD?
Chemical Usage 28. Based on the amount of chemical used each day, what was the average chemical
use in pound/day for the following week: Monday, 81 pounds; Tuesday, 73 pounds; Wednesday, 74 pounds; Thursday 66 pounds; Friday 79 pounds; Saturday 80 pounds and Sunday, 82 pounds.
TDEC - Fleming Training Center Section 2
Math 61
29. The average chemical use at the plant is 90 lbs/day. If the chemical inventory in stock is 2200 pounds, how many days supply is this?
30. The chemical inventory in stock is 889 pounds. If the average chemical use at the
plant is 58 pounds per day, how many days supply is this? 31. The average gallons of polymer solution used each day at a treatment plant are 88
gal/day. A chemical feed tank has a diameter of 3 feet and contains solution to a depth of 3 feet 4 inches. How many days supply is in the solution tank?
32. Jar tests indicate that the optimum polymer dose for a unit process is 2.8 mg/L. If
the flow to be treated is 18 MGD, how many pounds of dry polymer will be required for a 30-day period?
Section 2 TDEC - Fleming Training Center
Math62

33. What is your velocity gradient for a flash mix that is 6 feet square by 8 feet deep. You have a 5 hp motor and the water temperature is 20C.
34. What is your velocity gradient for a flash mix that is 10 feet by 10 feet and 12 feet
deep. You have a 8 hp motor and the water temperature is 22C. 35. Your flocculators are 20 feet square by 16 feet deep. You have a variable speed
drive that has 3 hp and the maximum RPM’s equals 2.5 and you have the variable speed set on 6. The water temperature is 18C. Find your velocity gradient.
36. Your second set of flocculators is 20 feet square by 16 feet deep. You have a
variable speed drive that has 3 hp and the maximum RPM’s equals 2.5 and you have the variable speed set on 3. The water temperature is 18C. Use the chart above. Find your velocity gradient.
Vary Drive 10 = 2.5 rpm 9 = 2.25 rpm 8 = 2.0 rpm 7 = 1.75 rpm 6 = 1.5 rpm 5 = 1.25 rpm 4 = 1.0 rpm 3 = 0.75 rpm 2 = 0.5 rpm 1 = 0.25 rpm
TDEC - Fleming Training Center Section 2
Math 63
37. Your old jar test machine will only go up to 125 rpm’s, which is equivalent to about 140 sec-1. Your water temperature is 22C. You wanted to achieve a mixing velocity of 600 sec-1 for 16 seconds. How long must you mix to make up for the slow mixing?
38. Your old jar test machine will only go up to 80 rpm’s, which is equivalent to about
75 sec-1. Your water temperature is 16C. You wanted to achieve a mixing velocity of 153 sec-1 for 13 seconds. How long must you mix to make up for the slow mixing?
Surface Overflow Rate 39. A rectangular sedimentation basin is 60 feet long and 25 feet wide. When the flow
is 510 gal/min, what is the surface overflow rate in gal/day/ft2? 40. A circular clarifier has a diameter of 70 feet. If the flow to the clarifier is 1610
gal/min, what is the surface overflow rate in gal/day/ft2?
Section 2 TDEC - Fleming Training Center
Math64

41. A rectangular sedimentation basin receives a flow of 540,000 gal/day. If the basin is 50 feet long and 20 feet wide, what is the surface overflow rate in gal/day/ft2?
42. The surface overflow rate for a basin is 2,300 gal/day/ft2. What is the settling
velocity in cm/min? 43. The surface overflow rate for a basin is 1,500 gal/day/ft2. What is the settling
velocity in cm/min? Answers:
1. 448.8 gal 2. 59,840 gal 3. 38,298 gal 4. 654.5 gal 5. 68,567 gal 6. 40 min 7. 30.8 min 8. 10.8 sec 9. 48 min 10. 11.1 sec 11. 288 lbs/day 12. 166 lbs/day 13. 266 lbs/day 14. 70.6 lbs/day 15. 445 lbs/day
16. 110.4 lbs/day 17. 2.6 mg/L 18. 18.5 gpd 19. 74.8 gpd 20. 63.8 gpd 21. 17.6 gpd 22. 43.3 gpd 23. 105 mL/min 24. 89.9 mL/min 25. 137.6 mL/min 26. 80.9 mL/min 27. 224 mL/min 28. 76.4 lbs/day 29. 24.4 days 30. 15.3 days
31. 2 days 32. 12,610 lbs 33. 638 sec-1 34. 406 sec-1 35. 47 sec-1 36. 17 sec-1 37. 69 sec 38. 27 sec 39. 489.6 gpd/ft2 40. 602.7 gpd/ft2 41. 540 gpd/ft2 42. 6.5 cm/min 43. 4.2 cm/mi
TDEC - Fleming Training Center Section 2
Math 65

66

Section 3
Plant Examples
67

PLANT EXAMPLES
1
Plant Example
2
Flash Mix 10 hp
4ft x 4ft x 8 ft
#1 #2 #3 #4
10 rpm
15 rpm
20 rpm
27 rpm
20ft x 70ft
Each floc tank 18.1ft x 18.1ft x 14 ft
6 MGD 22 ntu 20°C
31.1 max rpm 27 max rpm
3 hp 2 hp
Jar Tester maxes out at
400 sec-1
Section 3 TDEC - Fleming Training Center
Plant Examples68

Plant Example
• We need to replicate in the lab how our plant performs
– Detention times
– Velocity gradients (RPMs in lab)
– Surface overflow rate
– Sampling time
3
Step 1 – Flash Mix
• Find G (velocity gradient)
• Find Detention time for Flash Mix in seconds
4
TDEC - Fleming Training Center Section 3
Plant Examples 69

Flash Mix
𝐺 =550 𝑃
µ 𝑉
𝑓𝑙𝑎𝑠ℎ 𝑚𝑖𝑥 𝑣𝑜𝑙, 𝑓𝑡3 = 4 𝑓𝑡 4 𝑓𝑡 8 𝑓𝑡 = 128𝑓𝑡3
𝑃 = 10 ℎ𝑝 0.90 = 9 ℎ𝑝
𝐺1 =550 9 ℎ𝑝
0.000021061 125 𝑓𝑡3= 1355𝑠𝑒𝑐−1
5
Flash Mix
𝐷𝑇 = 𝑣𝑜𝑙𝑢𝑚𝑒, 𝑔𝑎𝑙
𝑓𝑙𝑜𝑤
𝐷𝑇 = 957.44 𝑔𝑎𝑙
6,000,000 𝑔𝑝𝑑
𝐷𝑇 = 0.00016 𝑑𝑎𝑦𝑠
𝐷𝑇, sec = 0.00016 𝑑𝑎𝑦𝑠 24 ℎ𝑟
1 𝑑𝑎𝑦
60 𝑚𝑖𝑛
1 ℎ𝑟
60 𝑠𝑒𝑐
1 𝑚𝑖𝑛
𝐷𝑇, sec = 13.8 𝑠𝑒𝑐
6
𝐹𝑙𝑎𝑠ℎ 𝑚𝑖𝑥 𝑣𝑜𝑙, 𝑔𝑎𝑙 = 128𝑓𝑡3 7.48 𝑔𝑎𝑙 𝑓𝑡3 𝐹𝑙𝑎𝑠ℎ 𝑚𝑖𝑥 𝑣𝑜𝑙, 𝑔𝑎𝑙 = 957.44 𝑔𝑎𝑙
Section 3 TDEC - Fleming Training Center
Plant Examples70

Flash Mix • Jar tester max 300 rpm ≈ 400 sec-1
𝑇1 =𝐺2 𝑇2𝐺1
𝑇1 =13.8 𝑠𝑒𝑐 400 𝑠𝑒𝑐−1
1355 𝑠𝑒𝑐−1
𝑇1 = 46.7 𝑠𝑒𝑐
• 46.7 sec at 400 rpm for flash mix 7
Step 2 - Flocculators
• Find G2 for Flocculator #1
• Plug velocity gradient into chart to determine paddle RPMs on jar tester
• Repeat for any additional flocculators
• ** Be sure to note any changes in dimensions, RPMs and HP
8
TDEC - Fleming Training Center Section 3
Plant Examples 71

Flocculators
𝑓𝑙𝑜𝑐 𝑡𝑎𝑛𝑘 𝑣𝑜𝑙, 𝑓𝑡3 = 18.1 𝑓𝑡 18.1 𝑓𝑡 14 𝑓𝑡 𝑓𝑙𝑜𝑐 𝑡𝑎𝑛𝑘 𝑣𝑜𝑙 = 4586.54 𝑓𝑡3
𝐺1(floc 1 & 2) =550 2.7 ℎ𝑝
0.000021061 4586.54 𝑓𝑡3
𝐺1 𝑓𝑙𝑜𝑐 1 & 2 = 124 𝑠𝑒𝑐−1
𝐺1(floc 3 & 4) =550 1.8 ℎ𝑝
0.000021061 4586.54 𝑓𝑡3
𝐺1 floc 1 & 2 = 101 𝑠𝑒𝑐−1
9
)V)((
)P)(550(1
G
Flocculator #1
𝐺2 =124
31.127
32 = 100.3 𝑠𝑒𝑐−1
• Plug this into Phipps Bird Chart
≈ 98 rpm
10
N
N
GG
2
1
2/31
2
Section 3 TDEC - Fleming Training Center
Plant Examples72

Flocculator #2
𝐺2 =124
31.120
32 = 63.9 𝑠𝑒𝑐−1
• Plug this into Phipps Bird Chart
≈ 69 rpm
11
N
N
GG
2
1
2/31
2
Flocculator #3
𝐺2 =101
31.115
32 = 41.8 𝑠𝑒𝑐−1
• Plug this into Phipps Bird Chart
≈ 49 rpm
12
N
N
GG
2
1
2/31
2
TDEC - Fleming Training Center Section 3
Plant Examples 73

Flocculator #4
𝐺2 =101
31.110
32 = 22.8 𝑠𝑒𝑐−1
• Plug this into Phipps Bird Chart
≈ 30 rpm
13
N
N
GG
2
1
2/31
2
Flocculators
𝐷𝑇 =𝑣𝑜𝑙𝑢𝑚𝑒, 𝑔𝑎𝑙
𝑓𝑙𝑜𝑤
𝐷𝑇 = (34307.3192 𝑔𝑎𝑙)
2,000,000 𝑔𝑝𝑑= 0.0172 days
DT,min = 0.0172 𝑑𝑎𝑦𝑠 24 ℎ𝑟
1 𝑑𝑎𝑦
60 𝑚𝑖𝑛
1 ℎ𝑟
DT,min = 24.7 min ≈ 25 min
14
𝑣𝑜𝑙𝑢𝑚𝑒, 𝑔𝑎𝑙 = (4586.54 𝑓𝑡3)(7.48 𝑔𝑎𝑙 𝑓𝑡3 ) 𝑣𝑜𝑙𝑢𝑚𝑒, 𝑔𝑎𝑙 = 34307.3192 𝑔𝑎𝑙
𝑓𝑙𝑜𝑤 = 6,000,000 𝑔𝑝𝑑
3 𝑏𝑎𝑠𝑖𝑛𝑠
𝑓𝑙𝑜𝑤 = 2,000,000 𝑔𝑝𝑑
Section 3 TDEC - Fleming Training Center
Plant Examples74

Jar Test Sequence
• Flash 46.7 sec @ 300 rpm
• Then 25 min @ 98 rpm
• Then 25 min @ 69 rpm
• Then 25 min @ 49 rpm
• Then 25 min @ 30 rpm
15
Step 3 – Sedimentation Basin
• Find Surface Overflow Rate for sedimentation basin
• Find sampling time for sedimentation basin
16
TDEC - Fleming Training Center Section 3
Plant Examples 75

Settling Time
𝑆𝑂𝑅, 𝑔𝑝𝑑 𝑓𝑡2 = 𝑓𝑙𝑜𝑤, 𝑔𝑝𝑑
𝑎𝑟𝑒𝑎, 𝑓𝑡2
𝑆𝑂𝑅, 𝑔𝑝𝑑 𝑓𝑡2 = 2,000,000 𝑔𝑝𝑑
(20 𝑓𝑡)(70𝑓𝑡)
𝑆𝑂𝑅 = 1428.6𝑔𝑝𝑑 𝑓𝑡2
17
𝑣𝑜𝑙𝑢𝑚𝑒 = 6,000,000 𝑔𝑝𝑑
3 𝑏𝑎𝑠𝑖𝑛𝑠
𝑣𝑜𝑙𝑢𝑚𝑒 = 2,000,000 𝑔𝑝𝑑
Settling Velocity
𝑆𝑒𝑡𝑡𝑙𝑖𝑛𝑔 𝑣𝑒𝑙𝑜𝑐𝑖𝑡𝑦 = 1428.6 𝑔𝑝𝑑 𝑓𝑡2 3785 𝑐𝑚3 𝑔𝑎𝑙
1440 𝑚𝑖𝑛 𝑑𝑎𝑦 929𝑐𝑚2 𝑓𝑡2
𝑐𝑚/min = 4 𝑐𝑚/𝑚𝑖𝑛
18
Settling Velocity, cm/min Sampling Time, min
0.5 20
1.0 10
2.0 5
4.0 2.5
10.0 1
Sample at 2.5 min and 10 min
Section 3 TDEC - Fleming Training Center
Plant Examples76

Plant Example
45ft x 70ft
FlashMix10 hp
8ft x 8ft x 8 ft
#1 #2
15rpm
21 rpm
18ft x 18ft x 18 ft
8 MGD10 ntu20°C
3 HP
20ft x 20ft x 20 ft
3 HP
30 max rpm
30 max rpm
TDEC - Fleming Training Center Section 3
Plant Examples 77

Plant Example #2
Flash Mix
Velocity Gradient = ______________________
Detention time = ______________________
Jar test max RPM = ______________________
Time correction = ______________________
Flocculator #1
Velocity Gradient = ______________________
Jar Test rpm = ______________________
Detention Time = ______________________
Flocculator #2
Velocity Gradient = ______________________
Jar Test rpm = ______________________
Detention Time = ______________________
Sedimentation
Surface Overflow Rate= ______________________
Settling Velocity = ______________________
Sampling Time = ______________________
Section 3 TDEC - Fleming Training Center
Plant Examples78

Section 4
Laboratory
79

Water Treatment Troubleshooting and Problem Solving
Jar Testing Introduced in 1918 and has remained the most common method for evaluating alternative coagulation and flocculation control strategies for establishing chemical dosages
There is no standardized procedure for conducting jar tests
So we must have a uniform or standardized approach to conducting jar tests
Jar Testing A series of sample containers and a mechanical stirring device
The water to be tested is placed in the containers and the treatment chemicals are added during stirring
There is an initial period of rapid stirring to facilitate dispersion of the chemicals
The chemically treated water is then slow mixed, or flocculated for a period of time
The mixing is then stopped, and the floc is allowed to settle
Jar Testing During the settling step, samples of the water can be collected at timed intervals and analyzed
Following the settling step, samples of the water can be collected, filtered through either a 0.45 µm filter or a 1 µm filter, and analyzed for UV‐absorbance, total organic carbon (TOC) and/or trihalomethane (THM) formation potential
Application Principle applications of jar tests are to optimize existing plant operations
Used for the selection and/or determination of
Coagulant dosage
Coagulant aid selection and dosage
Sequence of chemical addition
Optimum pH of coagulation
Improved coagulation/flocculation for THM precursor removal
Impact of oxidant dosages and conditions
Key Elements Planning
Define the purpose and goals of the study
Select the water to be tested
Determine the information required
Establish the testing conditions
Develop the testing program
Identify and prepare treatment chemicals
Conduct the jar tests
Analyze the data
Section 4 TDEC - Fleming Training Center
Laboratory80

Planning the Jar Test Establish Purpose and Goals
Selection of coagulant dosage
Selection of coagulant aid dosage
Determination of optimum pH of coagulation
Optimization of THM precursor removal
Selection of Water to be Tested
Raw water
Pre‐sedimentation basin effluent
Oxidant contactor effluent
Other pre‐coagulant addition location
Planning the Jar Test Information Required
Water quality parameters for coagulant determination
Turbidity
True color
pH
Filtered UV‐254
Water quality parameters for coagulant aid determination
Turbidity
Planning the Jar Test Information Required
Water quality parameters for optimum pH determination
Turbidity
pH
UV‐254
Planning the Jar Test Example Testing Program – Selecting coagulant dose
Perform initial screen of a broad range of coagulant dosages
Dosages: 10, 20, 30, 40, 50, 60 mg/L
pH of coagulation = 6.5 for alum, lower for iron coagulants
Use the coagulant aid type and dosage currently in use in all six jars
Measure the primary water quality parameters
Turbidity
pH
UV‐254 (if equipped)
Planning the Jar Test Example Testing Program – Selecting coagulant dose
Step 1 concluded optimum dosage of 20 mg/L
Perform second jar test based on initial jar test
Dosages: 14, 17, 20, 23, 26 mg/L
pH of coagulation and coagulant aid type and dosage would remain the same
Optimum coagulant dosage defined as:
Acceptable turbidity removal
Minimizing the filtered UV‐absorbance (if applicable)
Planning the Jar Test Testing Conditions
Standard procedure for establishing jar testing conditions
Utilize the rapid mix and flocculation mixing intensities and detention times in use at the full‐scale plant
During the settling step, set a sampling time that would correspond to the surface loading rate or detention time of the settling basin
TDEC - Fleming Training Center Section 4
Laboratory 81

Equipment Jar test apparatus
Analytical equipment
Preparation of Chemicals Chemical stock solutions must be diluted for jar test
Amount of dilution required dependent upon dosage and minimum amount of chemical that can be accurately measured
Effectiveness of coagulants and coagulant aids can be affected by dilution
Dilutions less than 0.1% solution may loose its effectiveness due to hydrolysis
Dilutions will degrade over time
Should be made up on a weekly basis
Jar Test Procedure Initial Preparation
Define and record
Objective of the study
Chemicals to be used, points of application and dosage
Water to be tested
Prepare all chemical stock solutions
Calibrate all analytical equipment
Clean all apparatus prior to use
Wipe jars and paddles and rinse with warm water between tests
Rinse all pipettes and syringes
Jar Test Procedure1. Collect at least 12 liters of water to be tested (3.2 gal)
2. Measure and record the initial parameters of interest
Temperature, pH, turbidity, color, etc
3. Fill square jars up to the 2‐liter mark
4. Position jars so jar test paddles are centered
5. Fully lower paddles and tighten thumb screw
6. Ready and arrange all chemicals to be added
7. Set rapid mix speed on the jar test stirrer
8. Add predetermined doses of chemicals into jars (all at the same time) and being timing the rapid mix step
Jar Test Procedure9. Continue rapid mix for predetermined time
10. Reduce mixing speed for flocculation and begin timing flocculation period
11. Stop the mixing at the end of predetermined flocculation time an d begin timing the settling period
12. Withdraw samples at the appropriate intervals
waste the water in sampling tube prior to collecting each sample
13. Analyze the timed samples for turbidity and record the results
Jar Test Procedure14. Measure and record the pH of each jar
15. Conduct all other analyses required for the test
Alkalinity
Temperature
etc
Section 4 TDEC - Fleming Training Center
Laboratory82

Jar Test Procedure Potential sources of error
Deposition of coagulant aid on the paddles or on the walls of the jar
Improper preparation of the chemical stocks
Excessive aging of the chemical stocks
Incomplete dispersion of the chemicals added to the jars
Measurement error of chemicals
Use of chemicals from different source than t hose used in the full scale plant
Jar Test Interpretation Performed to select
Optimum coagulant dose
Optimum pH of coagulation
Optimum coagulant aid dose
Selection based on turbidity and NOM removal
Use results to prepare a graph
Turbidity as a function of the time of sampling
Filtered UV‐absorbance as a function of dose or pH
TOC as a function of dose or pH
Jar Test Interpretation Turbidity Removal
Tillman, Glenn M. Water Treatment Troubleshooting and Problem Solving. Chelsea, Michigan: Ann Arbor Press, Inc., 1996. Print.
TDEC - Fleming Training Center Section 4
Laboratory 83

Conducting the Jar Test
Before starting:
Define study goals
Define testing parameters
Have testing and analytical equipment ready o Working and clean
Prepare reagent solutions o Properly labeled and mixed
Data sheet available o Should be a good guide for conducting
1. Treatment performance is often expressed in terms of percentage removal. Therefore
an important beginning step is to determine the quality of the raw water to be tested.
Such data may be obtained from treatment plant records or determined during the jar
test. Also, pH and alkalinity data may help determine necessary additions of acid or base
2. Enter the names and concentrations of the chemicals to be added on the data sheet.
This information is necessary to determine the volumes of the chemical to be added
during the jar test.
3. Enter the G values for the rapid mix and flocculation stages of the full‐scale plant on the
data sheet. If the effect of varying mixing intensities is to be evaluated, use the
appropriate range of G values. Convert these values to the appropriate rpm in the jar
tests.
a. Refer to the Phipps & Bird graph to determine correct rpm value based on jar
test equipment used.
4. Enter the detention times for the rapid mix and the flocculation stages of the full‐scale
plant in the data sheet. If the effects of the detention times are to be evaluated, use an
appropriate range of durations.
5. Enter the coagulant doses on the data sheet. If the test will determine an optimum
coagulant dose, it is useful to select doses in increments of 10 mg/L for alum, or
equivalent doses if other coagulants are to be tested. Smaller increments may be used
for fine‐tuning the optimum coagulant dose. Then calculate the volume of coagulant to
be dispensed into the jar to obtain the desired coagulant dose.
Section 4 TDEC - Fleming Training Center
Laboratory84

6. If applicable, proceed with all the other chemicals in a similar manner.
7. Based on the surface loading or overflow rate of the sedimentation basin of the full‐
scale plant, determine the critical settling velocity as outlined in the discussion. Divide
the depth of the sampling port on the jars in centimeters by the settling velocity to
obtain the sampling time in minutes.
8. Fill the jars with the water to be tested, and position them under the stirring apparatus
so they are centered with respect to the impeller and shafts.
9. Lower the impellers or paddles so that they are about one‐third from the bottoms of the
jar.
10. Begin the flash mix period based on the previously determine values. Do not forget to
record the starting time Dispense the desired doses of chemicals as rapidly as possible
into the jars. Dispense the chemicals in the same sequence as the full scale plant, unless
the effect of moving the point of application is to be evaluated.
11. After the rapid mix period, decrease the mixing speed to the predetermined value for
the flocculation period. At this point, the coagulation pH is typically measured.
12. After the flocculation period, stop the mixer and remove the paddles from the jars.
Collect samples at the times previously calculated to simulate the full‐scale
sedimentation plants. Sample withdrawal may be accomplished either by the use of a
syringe, a fixed sampling port, or a pipette. The first portion of the samples taken from a
fixed port should be discarded. When using a syringe, samples should be taken from the
same depth as the fixed port.
13. After sampling, conduct the laboratory analysis, observing holding times required for
specific analytical applications.
14. Enter laboratory results on the data sheet.
TDEC - Fleming Training Center Section 4
Laboratory 85

RPM
Duration
RPM
Duration
RPM
Duration
RPM
Duration
RPM
Durationmg/L mL or /L mg/L mL or /L mg/L mL or /L mg/L mL or /L mg/L mL or /L mg/L mL or /L
Concentration
Specific Gravity
Concentration
Specific GravityTime of Settling,
min
Depth of Sampling,
cm
Settling Velocity, cm/min
Tubidity, ntu
% Remaining
Tubidity, ntu
% Remaining
Tubidity, ntu
% Remaining
Tubidity, ntu
% Remaining
Tubidity, ntu
% Remaining
Tubidity, ntu
% Remaining
10
10
10
10
10
10
Turbidity Color pH
Jar # 1 2 3 4 5 6
Rapid Mix
Flocculation
Type
Raw Water
Chemicals
Type
Floc Size
pH
Color
Fleming Training CenterSection 4 TDEC - Fleming Training Center
Laboratory86

Date Time Analyst
Jar ChemicalRaw
Turbidity Raw pHChemical
Dose, mg/LSpecific Gravity
Chemical Purity, %
uL used for 2 L jar Settled pH
Settled Turbidity at
2.5 min
Settled Turbidity at
10 min
1
2
3
4
5
6
Date Time Analyst
Jar ChemicalRaw
Turbidity Raw pHChemical
Dose, mg/LSpecific Gravity
Chemical Purity, %
uL used for 2 L jar Settled pH
Turbidity at 2.5 min
Turbidity at 10 min
1
2
3
4
5
6
Fleming Training Center
TDEC - Fleming Training Center Section 4
Laboratory 87


![[LECTURE] Coagulation and Flocculation](https://static.fdocuments.in/doc/165x107/577d2b6f1a28ab4e1eaac2f2/lecture-coagulation-and-flocculation.jpg)