Coaching or Selection? Venture Capital and Firms ... 2012/ISS SESSION 4/Lahr .pdf · 1 Coaching or...
35
1 Coaching or Selection? Venture Capital and Firms’ Patenting Performance Henry Lahr * [email protected] Andrea Mina [email protected] Centre for Business Research and UK~IRC, Judge Business School, University of Cambridge, Trumpington Street, Cambridge, CB2 1AG, UK. (Version: May 2012) * Contact author Acknowledgments: The authors gratefully acknowledge funding from the European Community's Seventh Framework Programme (FP7/2007-2013) under Socio-economic Sciences and Humanities grant agreement n° 217466.
-
Upload
doankhuong -
Category
Documents
-
view
217 -
download
0
Transcript of Coaching or Selection? Venture Capital and Firms ... 2012/ISS SESSION 4/Lahr .pdf · 1 Coaching or...

1
Coaching or Selection? Venture Capital and
Firms’ Patenting Performance
Henry Lahr*
Andrea Mina
Centre for Business Research and UK~IRC,
Judge Business School, University of Cambridge,
Trumpington Street, Cambridge,
CB2 1AG, UK.
(Version: May 2012)
* Contact author
Acknowledgments: The authors gratefully acknowledge funding from the European Community's
Seventh Framework Programme (FP7/2007-2013) under Socio-economic Sciences and Humanities
grant agreement n° 217466.

2
Abstract
This paper addresses the problem of financing business enterprise. Schumpeter famously described
the banks and money market as “the headquarters of the capitalist system” (1934: 126). In his later
discussion of capitalism’s future in the post-war period, Schumpeter (1943: 121) emphasised
capitalism’s challenge to operate “in the face of public antagonism, under burdens which eliminate
capitalist motivation and make it impossible to accumulate venture capital”. Since Schumpeter’s time,
‘venture capital’ has been used in an increasingly narrow sense: it now refers to a specific form of
entrepreneurial finance. In addition, and contrary to Schumpeter’s fear that the supply of capital for
entrepreneurial efforts might dry up, the provision of risk capital has significantly evolved over time
and grown into a specialised form of external capital whose contribution is seen as a key component
of modern knowledge economies.
The question of whether and under what circumstances venture capital (VC) spurs innovation,
however, envelops a set of rather complex mechanisms. It has a rich underlying structure and poses a
very significant reverse causation problem concerning the firms’ innovation behaviour and their
ability to attract venture capital. This is especially the case when the indicators used to measure
innovation in empirical research are patents. Several studies find a positive relation between patenting
activity and VC financing (Kortum and Lerner, 2000; Baum and Silverman, 2004; Ueda and
Hirukawa, 2008; Popov and Roosenboom, 2009; Bertoni, Croce and D’Adda, 2010), but the relative
effects of the role of patents as signals of firm quality to investors, the selection of quality-firms by
VC funds, and the coaching functions of investors which might lead to improvement in firms’
patenting rates has not been successfully disentangled in the relevant literature.
Increased patenting can be explained by a number of reasons. First, VC firms might actually be able
to coach their portfolio companies, thereby increasing patent output. However, quite independently of
their coaching of investee firms, venture capital firms might be exceptionally good at selecting a
priori good portfolio companies. These companies produce an above-average number of patents after
the investment simply because investors were able to forecast this output without actively contributing
to it. Finally, cross-sectional studies often find increased patenting activity in firms with VC
involvement. In this case, causality can run from patenting to a higher probability of obtaining VC
financing, because patents granted or pending can be strong signals of firm quality. All in all, the
reverse impact of venture capital on innovation has proved difficult to assess because of fundamental
difficulties in establishing a control group of firms with identical characteristics apart from the
venture capital ‘treatment’.
The core contribution of this paper is the development of an analytical process that explicitly accounts
for endogeneity of VC investments and allows us to identify the ‘real’ effect of VC of firm patenting
rates. We incorporate into a simultaneous model the investor’s decision to provide capital (or, stated
differently, the firm’s ability to signal its quality to investors) and distinguish signalling from
selection and coaching effects. Starting from univariate models for patenting and VC investment as a
baseline, we construct multivariate models for these mechanisms which we estimate simultaneously
by maximum simulated likelihood. In addition, we model firms’ patenting as two sequential
decisions, in which firms first decide whether to patent and then determine the intensity of their
patenting (note that we take into account both the application and the granting of patents).
Studies trying to establish a control group of firms that do not obtain VC financing but are otherwise
identical often rely on propensity score matching or comparable algorithms to identify similar firms
(Engel and Keilbach, 2007; Peneder, 2010). Firms with VC investors are usually collected first, and
only thereafter a sample of control firms is matched by various firm characteristics. Instead, we
collect information on both types of firms at the same time by sampling from the population of US
and UK small and medium-sized enterprises (SMEs). From a life-cycle perspective of the firm, this
seems more plausible. A major difference to ex-post matching is that we first identify firms that
actually seek finance, since differences in financing needs might already explain patenting
performance in studies using matched samples.

3
Contrary to prior research, the effect of venture capital on patenting is insignificant or negative in all
but one case if we account for endogeneity of VC investments. The only exception seems to be the
number of patent applications in the period following a venture capital investment, although the
likelihood that a firm patents at all actually decreases. We can reproduce prior findings of a positive
impact of venture capital on patenting activities only in results for independent equations. Our results
support the view that venture capital follows patent signals to invest in companies with commercially
viable products instead of actively contributing to patent production. These findings positively relate
to the observation by venture capitalists Stuck and Weingarten (2005) that even technologically
experienced venture capitalists act like businesspeople, avoiding risks and focusing on entrepreneurs
that have value propositions that can be realised within the fund’s lifetime.
The proportion of scientific staff explains the number of patent applications and grants, while having
an R&D programme determines whether a firm patents. Venture capital investment seems to be
attracted by firms with patenting activities, but not by the number of patents. We test two new
variables, product development time and market size. Both predict patenting activity, which might
explain why industry competition is not associated with patenting in our models, contrary to results by
Baum and Silverman (2004) and Scherer (1983). We find evidence for a two-step decision process in
patenting: in the first step, firms decide whether or not to patent, and it is this decision which
determines the likelihood of VC financing.
The paper contributes to the theoretical and policy debate of the role of venture capital in the
financing of business enterprise and adds to the literature original methodological advances that can
be used to resolve reverse-causality problems in this important area of empirical research.
Key Words:
Venture capital, Coaching, Selection, Innovation, Endogeneity, Patenting, SME finance

4
1. Introduction
Does venture capital contribute to the patenting performance of firms? This question, although
simple to ask, has a rich underlying structure, since reverse causation between firms’ patenting
behaviour and their ability to attract venture capital places significant econometric obstacles in the
path to correct identification of causes and effects. The main themes that have to be addressed in order
to answer this question are the signalling function of patents as indicators of firm quality, the selection
of quality firms by venture capital (VC) funds and the role venture capitalists play in improving firm
patenting performance.
Several studies find a positive relation between patenting activity and VC-financing (Kortum and
Lerner, 2000; Baum and Silverman, 2004; Ueda and Hirukawa, 2008; Popov and Roosenboom, 2009;
Bertoni, Croce and D’Adda, 2010). This is often interpreted as evidence that VC firms are able to
coach their portfolio companies, thereby increasing patent output. There are, however, alternative
explanations: venture capital firms might be exceptionally good at selecting promising portfolio
companies. These companies produce an above-average number of patents after the investment
simply because investors were able to forecast this output without actively contributing to it. Cross-
sectional studies often find increased patenting activity in firms with VC involvement. In this case,
causality can run from patenting to a higher probability of obtaining VC financing, because patents
granted or pending can be strong signals of firm quality for investors, as the literature has begun to
appreciate. And yet the reverse impact of venture capital on innovation has proved difficult to assess,
because it is difficult to establish a control group of firms with identical characteristics apart from the
venture capital “treatment”.
We aim to tackle causality problems by explicitly accounting for endogeneity of VC
investments. Incorporating into a simultaneous model the investor’s decision to invest or, stated
differently, the firm’s ability to signal its quality to investors, should help distinguish signalling from
selection and coaching effects. Baum and Silverman (2004) propose to disentangle these effects by
investigating whether start-up characteristics that predict VC investments coincide with the influences
of these same characteristics on firm performance. They argue that coaching might be at work if

5
characteristics that affect VCs’ investment decisions are different from those affecting firms’ post-
investment performance. We build on this idea by modelling both mechanisms simultaneously. We
further contribute to the literature by modelling firms’ patenting as two sequential decisions, in which
firms first decide whether to patent and then determine the intensity of their patenting.
Studies trying to establish a control group of firms that do not obtain VC financing but are
otherwise identical often rely on propensity score matching or comparable algorithms to identify
similar firms (Engel and Keilbach, 2007; Peneder, 2010). Firms with VC investors are usually
collected first, and only thereafter a sample of control firms is matched by various firm characteristics.
Instead, we collect information on both types of firms at the same time by sampling from the
population of US and UK small and medium-sized enterprises (SMEs). From a life-cycle perspective
of a firm, this seems more plausible. A major difference to ex-post matching is that we first identify
firms that actually seek finance. Within this sample, we can investigate the impact of venture capital
on patenting performance.
Contrary to prior research, the effect of venture capital on the number of patents produced is
insignificant or negative if we account for endogeneity. If we look at the decision to patent, the only
exception seems to be one model for granted patents using the full sample including merger targets,
for which the likelihood of having a latent patenting status increases after venture capital investments.
We can only reproduce prior findings of a positive impact of venture capital on patenting activities in
results for separate equations. Our results support the view that venture capital follows patent signals
to invest in companies with commercially viable products instead of actively contributing to patent
production. They confirm emergent anecdotal evidence (Stuck and Weingarten, 2005) that shows that
even technologically experienced venture capitalists act like businesspeople, avoiding risks and
focusing on entrepreneurs that have value propositions that can be realised within the fund’s lifetime.
Other relevant predictors for patent applications and grants are market size and product development
time. Adding market size as a predictor might explain why industry competition does not seem to
change patenting activities of firms.
The remainder of this paper is organised as follows. Section 2 reviews prior literature from a
methodological point of view and yields insights into variables that might drive patenting and venture

6
capital investments. We present our dataset and methodology in section 3 and discuss our results in
section 4. Section 5 summarises and concludes.
2. Related literature
The literature related to our research question falls into two categories corresponding to our
patenting and venture capital equations. In this section, we briefly review this literature on the
determinants of venture capital investments and on the decision to use patents to protect the firm’s
intellectual property. Most authors study either the impact of VC on patenting behaviour or the
signalling effect of patents for VC investments. A few take endogeneity into account, but with other
outcome variables in mind, such as sales growth, or with an industry or country focus. In the
following overview of the literature, we put an emphasis on relevant independent variables and
modelling decisions like estimation of count data and endogenous binomial choice situations.
Patent productivity
Among the first studies to empirically study the relation between R&D and patenting behaviour
are Scherer’s (1965a, 1965b) contributions. He regresses the number of patents granted to Fortune
500 firms in 1959 on 1955 firm data and finds an elasticity of patent grants to the number of R&D
employees scaled by sales with an indication of diminishing returns to R&D input intensity. While he
explicitly considers the time lag between the inception of an invention and the patent approval by the
US Patent Office, not all studies that followed have done so. Pakes and Griliches (1980) include
current and lagged R&D expenditure and find a strong cross-sectional contemporaneous effect of
R&D expenditures on patent applications, but a less strong one in a time-series context. Pakes (1981)
shows this contemporaneous effect for patent grants.
Scherer (1965b) discusses the recurring theme of how to treat zero patent counts in log-linear
specifications of R&D input (employees) and output (patents) and finds large differences in
estimation results. Zeros usually appear in firm-level studies, whereas studies modelling production
functions on a country or industry basis (for example, Kortum and Lerner, 2000) rarely encounter zero
7
cell counts. Some authors choose to drop offending zeros from their sample, while others assume that
observing zero patents really means one patent, or a fraction (Zhang, 2009).
Hausman, Hall and Griliches (1984) suggest using Poisson and negative binomial models and
find a strong influence of contemporaneous R&D expenditures and patent applications. Negative
binomial models that allow for random or “fixed” firm effects perform best. Comparing different
specifications, they find that most of the variation in their panel data is found in the between firms
(cross-sectional) dimension but there is also additional variability in the time dimension. Unobserved
heterogeneity between firms is particularly important in our model setup, since it might be correlated
with both patenting and VC investments.
Bound, Cummins, Griliches, Hall and Jaffe (1984) estimate a more traditional OLS model, in
which the logarithm of R&D explains the number of patent grants in logs. They set the log of patents
to zero whenever patents are zero and allow for a different intercept for these firms. Their results
indicate a highly significant impact of R&D, while firm size measured by gross plant value is also
positive and significant. Similar to Hausman, Hall and Griliches (1984), they try Poisson and negative
binomial specifications but find large variation in estimated parameters, which they attribute to the
large number of zero patents (half their sample). Sample separation into high R&D (>USD2m) and
low R&D firms leads to more coherent estimates across specifications, but much smaller positive
coefficients for R&D in small firms.
Scherer (1983) plots the relative frequency of patenting in groups of firm’s lines of business that
are selected on the basis of R&D expenditures. His graph shows the typical sigmoid-type relation
between R&D and the propensity to patent. We follow this line of thinking by modelling this most
basic decision to patent. In his linear regressions of patent grants he finds that patenting rises roughly
proportionately with R&D effort within individual industries. Company diversification appears to
increase patenting activities, whereas industry concentration is associated with fewer patents. Brouwer
and Kleinknecht (1999) estimate probit models for having at least one patent application and Poisson
models for the number of applications. They find that firm size given by the (log) number of
employees is the most significant predictor of applications, followed by R&D expenditures as a

8
percentage of sales. R&D collaborations, sales of innovative products and firms operating in high-tech
sectors are all associated with a higher propensity to patent.
While much research has focused on the patenting behaviour of firms, fewer studies have
incorporated venture capital as an explanatory variable. The importance of venture capital and
business angels in situations of asymmetric information between firm insiders and investors has long
been recognised (Sahlman, 1990; Gompers, 1995; Hellman, 1998, Gompers and Lerner, 1999, 2001;
Kaplan and Strömberg, 2003, 2004). These equity investors seem to be able to increase firm value
beyond the provision of financial resources (see also Bergemann and Hege, 1998; Riyanto and
Schwienbacher, 2006; Schwienbacher, 2008). The literature broadly agrees that for small innovative
firms venture capitalists are much more skilled than large banks at screening firms and providing
value-added to their portfolio companies (Gorman and Sahlman, 1989; MacMillan, Kulow and
Khoylian, 1989; Bygrave and Timmons, 1992; Keuschnigg and Nielsen, 2004; Ueda, 2004).
One of the most prominent studies on the relation between VC financing and patenting is
Kortum and Lerner’s (2000) empirical account of venture capital and its contribution to the patent
production function. With the benefit of aggregation by industry and thus avoiding zero patent counts,
they find a positive and significant effect of VC financing on patent grants. However, both patenting
and venture funding could be related to unobserved technological opportunities, thereby causing an
upward bias in the coefficient on venture capital. In regressions that exploit a policy shift in venture
fund legislation to construct an instrumental variable, they again find a positive impact on patenting.
Ueda and Hirukawa (2008) show that Kortum and Lerner’s findings become even more significant
during the venture capital boom in the late 1990’s. They further estimate models of total factor
productivity (TFP) growth, but do not find that VC investment affects total factor productivity
growth. Popov and Roosenboom (2009) find similar, albeit weaker results for European countries and
industries. Finally, Hirukawa and Ueda (2008) estimate autoregressive models for TFP growth and
patent counts by industry. Although TFP growth appears to be positively related to future VC
investment, they find little evidence that VC investments precede an increase in patenting. To the
contrary, lagged VC investments are often negatively related with both TFP growth and patent counts.

9
Firm-level studies on venture capital and patenting have appeared only recently. Lerner,
Sørensen and Strömberg (2008) estimate various models, including Poisson and negative binomial
models, for patents granted and patent citations in firms that experienced leveraged buyouts (LBOs).
They find an increased number of citations for patents applications after the LBO and no decrease in
patent originality and generality after the investments. Patent counts do not seem to change in a
uniform direction. Engel and Keilbach (2007) use propensity score matching and balanced score
matching to compare German venture-funded firms to non-VC ones with respect to innovation output
and growth. VC-funded firms apply for ten times as many patents as matched non-VC firms.
However, this difference is only weakly significant. Caselli, Gatti and Perrini (2009) use a similar
matching procedure to assess the difference in patenting and related growth variables in venture-
backed IPOs of Italian firms. They find a higher average number of patents in venture-backed firms
than in their matched counterparts. They argue, however, that VCs select firms based on patents rather
than promote continued innovation after the investment. Zhang (2009) estimates a log-linear tobit
model of patents before and after an IPO with endogenous VC investment. Venture capital appears to
be positively related to patents in the pre-IPO period, but not thereafter. Significant variables are the
percentage of shares owned by the VC, R&D expenditures and dummy variables for bank-affiliated,
corporate, independent or foreign venture capital funds. The assumption of firms always having at
least one patent when taking logs may bias these results. Bertoni, Croce and D’Adda (2010) estimate
random effects logit models for the likelihood of observing one or more patents and random effects
negative binomial models for the number of patents, depending on lagged patent stock and lagged VC
backing, in a panel of Italian technology firms. Patent applications depend on VC backing, size
(employees), the founders’ technical work experience, founders’ university education and cash flow.
In summary, research using firm-level information is mixed but indicates that the positive findings of
prior studies could be driven by venture firms’ selecting investee companies based on patents instead
of fostering innovation after the investment.

10
Venture capital investment
The second equation of our model determines whether venture capitalists decide to invest in a
firm or, when seen from the investee’s perspective, the firm is able to attract venture capital to fund its
growth. The literature on venture capital finance emerged during the venture capital revolution in the
1990’s (Gompers and Lerner, 2001). As in the literature on patenting, early papers started to look at
the determinants of VC finance without regard to patents. For example, although Hellmann and Puri
(2000) do not study the impact of patents directly, they find that innovator firms are more likely to
attract venture capital than imitator firms and obtain venture capital much earlier in their life.
Baum and Silverman (2004) are the first to estimate models for VC financing and patent
applications and grants on the same dataset. Their VC model suggests that the amount of VC finance
obtained depends on lagged patents granted and applied for, R&D expenditures, R&D employees,
government research assistance, the amount of sector-specific venture capital, horizontal and vertical
alliances, and being a university spin-off. Age is negatively related to venture capital, as are net cash
flow, diversification and industry concentration. Mann and Sager (2007) confirm the positive impact
of patenting on VC-related performance variables, including the number of financing rounds, total
investment and exit status. A start-up firm’s prior patenting attracts larger amounts of VC funds in
Cao and Hsu’s (2011) study of venture-backed firms.
In Baum and Silverman’s (2004) negative binomial models for patent applications, the most
significant predictors are lagged applications, having a corporate parent, being a university spin-off,
government assistance and, with negative coefficients, age, cash flow, diversification and industry
concentration. The latter finding is in line with Scherer (1983) who finds a negative relation between
concentration and patenting in some specifications, whereas he finds a positive coefficient for
diversification. Patent grants and applications strongly predict future patent grants, in addition to
sector-specific VC financings and, negatively, industry concentration.
Two other studies that relate patents to outcome variables associated with venture funding are
those by Häussler, Harhoff and Müller (2009) and Hsu and Ziedonis (2008). Häussler et al. use a
proportional hazards model to estimate the time to VC financing and find a positive effect of patent
applications on the hazard rate. They test various measures of patent quality, of which both the

11
average number of citations and the share of opposed patents reduce the time until the first VC
investment occurs. Results of Hsu and Ziedonis’ (2008) study of VC-financed semiconductor start-
ups suggest that patent applications increase both the likelihood of obtaining initial capital from a
prominent VC and of going public.
Closely related to our model are studies that employ binary models for the likelihood of
obtaining venture capital. As part of their matching procedure, Engel and Keilbach (2007) estimate a
probit model for VC involvement that predicts a positive association with patents as well as the
founder’s education. Colombo and Grilli (2010) show results for similar probit models, in which
founders’ managerial education and the firm’s objective to exploit a technological opportunity help
predict the likelihood of VC investments. Patenting, however, does not appear among their predictors.
Peneder (2010) aims to assess the impact of venture capital on firm growth by matching VC- and non-
VC funded firms. While estimating propensity scores for his matching procedure in a probit model, he
finds a positive impact of patents, employment and a firm’s credit rating on the likelihood of VC
financing, and a negative effect of age, cash flow and return on capital employed. Finally, Audretsch,
Bönte and Mahagaonkar (2009) have results for separate probit models for venture capital and
business angel investments. In both cases, patents predict VC financing if the company is at the
prototyping stage in its life cycle. Furthermore, firms obtain capital from venture funds or business
angels if they were founded by a team rather than a single person.
3. Data and methodology
This paper builds on a unique comparative survey of UK and US businesses jointly carried out
by the Centre for Business Research of the University of Cambridge and the Industrial Performance
Center of MIT in 2004-2005.1 The basis for the sampling was the Dun & Bradsheet (D&B) database,
which contains company-specific information drawn from various sources, including Company
House, Thomson Financial and press and trade journals. The sample covered manufacturing and
business service sectors and was collected through a telephone survey between March and November
1 Cosh et al. (2006) contains a full description of the survey design, sampling and instrument.

12
2004 (response rate: 18.7% for the US and 17.5% for the UK), which was followed by a postal survey
of large firms in Spring 2005 leading to a total sample of 1,540 US firms and 2,129 UK firms. We
restrict our sample to firms that sought finance during the two years prior to being interviewed. Since
the survey does not contain information on the financing behaviour of large firms, the sample contains
firms with up to 1000 employees only. In total, this leaves us with a working sample of 940 firms, 513
in the US and 427 in the UK. A separate set of analyses contains firms that did not become merger
targets in the post-survey period. There are 888 firms in this sample, 486 in the US and 402 in the UK.
The survey lists venture capital funds and business angels as a source of external finance. We
incorporate this information as an endogenous binary variable in our models. Firms answered the
survey questions almost completely. Minor gaps in the data, however, would have prevented us from
using about 10 percent of the survey responses. In order to avoid having to drop observations due to
missing values, we impute missing values by random regression imputation (Gelman and Hill, 2006).
The number of imputations is generally very low and always below 2 percent per variable. If values
are missing in our dependent variables, we drop these observations.
Patent data are taken from the European Patent Office’s (EPO) Worldwide Patent Statistical
Database (PatStat). It contains information on 68.5 million applications by 17.3 million assignees and
inventors from 1790 to 2010, although the European Patent Office states that both numbers are likely
to be smaller due to a large number of duplicate entries or entries for referential consistency of
publications in the database. Since there are no firm identifiers available in PatStat, we match patent
information to the survey data by firm name. To align patent data with the period addressed in the
survey (three years), we count the number of patents applied for and granted within a three-year
period prior to the interview and determine patenting status for each firm from this number. More
specifically, we use application filing dates and publications dates that represent the first grant of an
application to locate applications and grants in the time dimension. For our dependent variables, we
count applications and grants for the whole post-survey period. This procedure captures long-term
effects of venture capital and maximises the chance that firms with small, but positive, patenting rates
produce at least one patent, which allows us to distinguish patenting from non-patenting firms.

13
[Insert table 1 about here]
Table 1 shows descriptive statistics for patenting activities and independent variables. In our
sample, 147 firms applied for patents during the three-year survey period (t), while 170 firms filed
patent applications in the next period (t+1). Patent grants can be identified in 116 and 144 firms,
respectively. Ninety-four firms received venture capital or business angel financing with about equal
proportions of these two types of early stage financing. A simple cross-tabulation of an indicator for
VC financing and an indicator for patenting activity at t highlights the strong link between venture
capital and patenting (see table 2). It shows that 44.8 percent of VC-financed firms were applying for
patents whereas only 12.3 percent of those without VC involvement did so. This picture begins to
look different already if we consider the time dimension. In the group of firms without VC
involvement and without any patent applications at time t, 52 applied for patents at t+1, while 26 of
those who were patenting at t did not show any patenting activities one period later. In the VC-
financed group, firms that start to patent (11) balance those that discontinue patenting activities (11).
In our multivariate analyses, further control variables help extract the precise relationship between VC
financing and patenting.
[Insert table 2 about here]
We select explanatory variables based on the literature on venture capital and patenting. Prior
studies often used a very limited number of explanatory variables, sometimes limited to R&D
expenditures only. We extend the scope of economically plausible predictors for the propensity to
patent. R&D intensity is a variable of first choice. Since prior research used various measures,
including the log of R&D expenditures, R&D expenditures scaled by size variables, or the number of
R&D employees, we choose a combination of these, which best suits our estimation equations: We
first proxy for size by the logarithm of employment and control for R&D intensity by the percentage
of R&D staff and a dummy indicating the presence of R&D expenditures. One advantage of this
structure is that it avoids including multiple size-dependent measures, since variables enter the
expected mean in Poisson specifications multiplicatively. We try to account for the arrival of

14
technological opportunities by including an estimate of the firm’s growth opportunities, as reported by
the company. Other variables are more straightforward controls for age, country, whether a firm was
founded as a university spin-off and whether a firm belongs to the manufacturing sector, defined as
ISIC Rev. 3.1 codes 15–37. Similar to Scherer (1983), we use the amount of international sales to
measure market size and control for industry concentration by the number of competitors. We
measure CEO education by a dummy variable indicating whether the CEO has a university degree.
Product development time enters our equations, since it might play a role in attracting VC financing
(Hellman and Puri, 2000). Finally, we include lagged patent applications and grants as proxies for the
part of a firm’s knowledge stock that is used to produce new patents. Baum and Silverman (2004) also
argue that lagged dependent variables help account for unobserved heterogeneity (Jacobson, 1990).
Estimation
Previous research shows that the vast majority of firms do not patent, which causes observations
of zero patents in a large proportion of firms. This in turn leads to model instability and error
distributions that do not meet the model’s assumptions if these excess zeroes are not properly
addressed (Bound, Cummins, Griliches, Hall and Jaffe, 1984; Hausman, Hall and Griliches, 1984).
We suspect that there might be a two-step process for patenting, in which firms first decide
whether to patent at all and then produce patents according to a Poisson or similar distribution (see
figure 1). At the same time, we have to deal with endogenous VC investments, which complicates
models that are no longer analytically tractable. We model patenting activity as a binary variable that
depends on firm and industry characteristics as well as an endogenous binary variable that indicates
whether or not a firm receives venture capital financing. This endogenous selection process is more
general than ex post comparing firms by propensity score matching (Engel and Keilbach, 2007).

15
Figure 1. Model framework Dependent variables are venture capital investment at time t and the number of patent applications or grants at time t+1. In
the binary bivariate case, “Patents (yes/no)” measures whether we observe any number of patents for the firm at time t+1. In
zero-inflated Poisson models that also include the number of patents at t+1, this variable indicates firms’ latent patenting
status.
After establishing baseline results for independent patenting and VC equations, we present two
sets of simultaneous equations: In the first set comprising two probit equations for patenting and
venture capital investments, we ignore information about the number of patents and treat firms’
patenting behaviour as a binary outcome. The second set of equations adds the number of patents in a
zero-inflated Poisson model.
The patenting equation in the recursive bivariate system of equations is
1
, 1 0 1 2( ln( ) 0)i t it it it it itPat I X Pat PatN VC , (1)
where is a dummy variable indicating whether firm applied for one or more patents or,
depending on context, received at least one patent grant in period . denotes the number of
patent applications or patents granted. The indicator function equals one if the condition in
parentheses holds and zero otherwise. Since patent applications and grants can be zero, and the natural
logarithm would not exist in this case, we set to zero and use a dummy variable ( ) to
indicate patenting status. Endogenous venture capital investment is captured by an indicator variable
( ), and represents exogenous variables. The simultaneously determined venture capital
investment is
Patents
(yes/no)
Patents
(yes/no, number)
Venture
Capital
eVC
Patents
(number)
eP eP#
Correlation in unobserved variance components
Knowledge
capital
Selection
CoachingCoaching
Time t Time t+1

16
0 1 2( ln( ) 0)it it it it itVC I Z Pat PatN , (2)
where is a vector of exogenous explanatory variables which can contain some or all of the
elements in . Endogeneity of venture capital financing is accounted for by allowing arbitrary
correlation between the error terms. Since the error terms’ variance is not identified in binary models,
the error terms and are normalised to have a variance of one.
A similar simultaneous model structure can be used to predict the number of patents. Since
patent data show a large number of non-patenting firms, we model this empirical fact using a zero-
inflated Poisson distribution. In this model, firms self-select into the patenting regime, and a third
equation models the number of patent applications or grants produced according to a Poisson
distribution. Similar to Lambert’s (1992) zero-inflated Poisson model, the number of patents is
distributed as
it
it
-
it it
1 - k
it it
0 with probability p +(1-p )e
with probability (1-p )e /k!, 1,2, .itPatN
k k
(3)
The likelihood that a firm chooses not to patent in the next period is
1
0 1 2( ln( ) )it it it it it itp I X Pat PatN VC , (4)
while the conditional mean of the Poisson process in the patenting state is
0 1 2ln( ) N
it it it it it itexp X Pat PatN VC . (5)
A novel feature of our model is that a firm’s likelihood of obtaining venture capital is determined by
an additional equation
0 1 2( ln( ) 0)it it it it itVC I Z Pat PatN (6)
as in the bivariate Probit case above.
We allow for arbitrary contemporaneous correlation between and as well as between
and , which are assumed to follow bivariate normal distributions. Specifying the model in this way
allows for correlation between heterogeneity in expected means of patent counts, the decision to
patent and VC financing. The variance of individual-level errors ( introduces a free parameter that

17
accounts for overdispersion in Poisson models (Miranda and Rabe-Hesketh, 2006). Identification in
semiparametric models of binary choice variables often relies on exclusion restrictions (Heckman,
1990; Taber, 2000). In our parametric case, however, the functional form is sufficient for
identification. Imposing additional restrictions on our model can in fact cause spurious results, since
variables included in the VC equation but excluded from the patenting equations would affect the
outcome equation through if these variables are not truly independent from patenting. We
therefore choose the exogenous variables in all equations to be identical ( .
We report results for our models in four steps: First, single-equation probit models serve as
(most likely biased) benchmarks against which to compare simultaneous models (equations (1) and
(2) independently). Second, we estimate bivariate recursive probit models for VC financing and
patenting (equations (1) and (2) simultaneously). Third, zero-inflated Poisson models using
information about the number of patents are presented, but excluding simultaneous VC investment to
establish baseline results for the next step which includes adds a zero-inflated Poisson model to the
system of equations (equations (3) to (6)). Estimation of this last simultaneous model is done by
maximum simulated likelihood2 (see, for example, Gouriéroux and Monfort (1996) and Train (2009)).
Our data are constrained to a cross-section by survey design. However, we are able to match
patent data from PatStat for the periods before and after the survey period. We therefore use the
subscript mainly to conceptually distinguish between these periods. As the original data were
obtained through interviews over a period of almost a year, there is some variation in the time period
the firms are referring to when answering questions regarding their patenting and other economic
activities “over the last three years”. Therefore, an observation designated by subscript for one firm
does not necessarily lie at exactly the same point in time as that for another firm.
2 We use 200 random draws from a truncated normal distribution in all models estimated by maximum
simulated likelihood. Further estimation details including likelihood function and MSL methodology are
available from the authors upon request.

18
4. Empirical results
Correlations between venture capital investment and subsequent patenting are substantial and
highly significant, ranging between 0.21 for (log) patent applications and 0.26 for a dummy variable
measuring whether a firm was granted any number of patents after the VC investment. As we
construct increasingly complete models for the relations between VC investment and patenting, this
link becomes very weak and disappears in all but one model. The effect of endogenising venture
capital investments can best be seen from performing three sets of estimations. Tables 3 and 4 show
results from separate regressions for the likelihood of obtaining VC finance and the likelihood to
patent. Table 5 shows models with identical regressors but allowing for contemporaneous error
correlation between the venture capital equation and the patenting equation. Finally, tables 6 and 7
include an additional equation for the number of patents in addition to an equation that determines
firms’ latent patenting status.
[Insert tables 3 and 4 about here]
Independent equations – Patenting
If patenting activity is estimated in univariate probit regressions, venture capital appears to
strongly increase the likelihood of obtaining patent grants (see table 4). This effect is only second in
magnitude to the effect of lagged patenting activity and about as strong a predictor as R&D efforts.
This result is in line with prior research which often finds a contemporaneous effect of venture capital
on patenting (Zhang, 2009; Bertoni, Croce and D’Adda 2010, Kortum and Lerner, 2000). Moreover,
this finding is expected if VC funds select portfolio companies based on the number of patents.
Dropping VC investment from the equation decreases model fit significantly, which suggests that in a
univariate setting venture capital predicts patenting.
We find a strong persistence in patenting, both in patents and grants. If firms patent in one
period, they tend to do so in the next, with coefficients being stable across models. An indicator for
prior-period patenting is significant in all specifications, while applying for or receiving a large
number of patents in one period increases the likelihood of observing at least one patent in the next.
These effects can be interpreted in two ways: On one hand, prior patenting can proxy for unobserved

19
heterogeneity between firms in their ability to produce innovations. Other variables in our models
might not capture all aspects of firms’ internal processes and external market characteristics that lead
to patenting behaviour. On the other hand, knowledge in the form of existing patents often is an input
factor for new patents. Existing patents can signal the size of this otherwise difficult to measure
knowledge stock. Since this stock of productive capacity depreciates over time, it is reasonable to
assume that recent additions to the patent stock explain present and future patenting best, which is
what we find in our results.
The percentage of R&D staff and the existence of R&D expenditures are two other ways of
measuring knowledge-producing capacity in firms. Consistent with prior studies, we find evidence for
productivity effects of R&D expenditures. Contrary to the findings by Hausman, Hall and Griliches
(1984), the percentage of R&D staff does not seem to predict patenting. Since we only measure
whether a firm produces any number of patents compared to no patents at all, our finding is plausible
given that the intensity of R&D staff helps predict the intensity of patenting, as shown in our models
for simultaneous equations.
A company’s age does not seem to change the likelihood of patenting much, although we
observe a slightly significant effect on future applications. This negative finding is consistent with the
literature (however, Baum and Silverman (2004) find a negative effect of age on patent applications
and a positive one on grants). If patenting was to depend on firm age, we would expect a start-up
effect early in the life of firms that are founded to exploit some technological opportunity. We tried a
dummy variable indicating whether a firm was only founded during the sample period but found no
influence on patenting activity. Employment yields different results for patent applications and grants.
As in Bound, Cummins, Griliches, Hall and Jaffe’s (1984) study, we find a positive effect on future
applications, but none for grants. Other observed variables do not seem to explain variation in
patenting that size would explain if these variables were excluded. Collinearity in our models is
generally low (variance inflation factors well below 5) and dropping significant variables from the
models does not significantly change the effect of size.
Industry effects are negligible in all our models. Manufacturing is sometimes found to show a
higher tendency to patent than the service sector. However, many technology firms operate under SIC

20
codes assigned to service industries, which could blur the boundaries between patenting and non-
patenting industries. A more fine-grained decomposition of industries into additional—possibly high-
tech—sectors might help discover effects for some of these. Unfortunately, our sample size does not
admit adding individual two-digit SIC codes and composing industry dummies based on the
likelihood of patenting would defeat the purpose of estimating this likelihood.
There is an increased likelihood of receiving patent grants in US firms, which we do not find for
applications. In contrast to findings presented by Bertoni, Croce and D’Adda (2010), the CEO’s
higher education does not increase the likelihood of being granted one or more patents. We find no
effect of the CEO’s education in any of our model specifications.
University spin-offs can be seen as a vehicle to exploit the commercial potential of inventions
made within universities or public-private collaborations. We would therefore expect a positive
impact on granted patents, if not on patent applications. Unlike in results presented by Baum and
Silverman (2004), in none of our models the spin-off indicator produces a significant impact. This
could be due to the small number of university spin-offs in our sample (=20). Another explanation can
be found in the time pattern of patenting in spin-offs. If a spin-off company is formed to exploit a
patent after it has been granted, the relation between spin-off and patents would be stronger for past
patents than for future ones. Indeed, we find a correlation between past patent grants and university
spin-offs in a separate analysis, but not for future patent applications or grants.
Patenting activity is strongly associated with product market characteristics. Firms that operate
nationally or internationally are more likely to engage in patent production than local or regional
firms. There is little difference between models future applications and grants. Products that need a
long development time are more often protected by patents than those with a short time to market.
Again, this is reasonable from a firm’s perspective to protect its intellectual property. Protection from
imitation should be most prominent in industries with many competitors. However, firms in
concentrated markets could also try to deter potential competitors from entering their market by
erecting fences of accumulated patents (Scherer, 1983). While Scherer (1983) finds evidence for a
link between industry concentration and the number of patents only in models that do not control for
sectors, Baum and Silverman (2004) find fewer patents in concentrated industries. The effect of

21
competition in our models, however, is negative but insignificant. We test the hypothesis that
competition is more relevant if the firm operates internationally, but do not find significance for such
an interaction.
Expected firm growth as estimated by the firm does not appear to affect the likelihood to patent.
This result can be interpreted as firms using patents not to prepare for future growth, but to defend
themselves against competitors or potential market entrants. In the latter case, we would not expect to
see a relation between patenting and growth opportunities.
Prior studies found conflicting evidence on the impact of profitability on patenting. Bertoni,
Croce and d’Adda (2010) show a positive relation between net cash flow and patents, whereas Baum
and Silverman (2004) report a negative one. We also tried a proxy for profitability constructed from
pre-tax profits scaled by assets, but did not find significant results. Consequently, we decided to drop
this variable from our models due to the large amount of missing values in survey responses on
profits.
Independent equations – Venture capital investment
A firm’s knowledge stock is similarly predictive for venture capital investment as it is for
patenting activity as shown in table 3. R&D expenditures and R&D staff strongly predict VC
investments, as does the CEO’s education. Patenting attracts VC investments, although it is the fact
that a company applies for patents, and not the number of applications or grants, that predicts VC
investments. Patent grants do not predict venture capital investments, although they are often said to
convey a stronger signal about firm quality than applications, which are often rejected by patent
offices.
Venture capital involvement can be found in young firms, in line with prior research, but being a
university spin-off again does not lead to a greater likelihood of being a target for investments.
Although comparable to other predictors in its effect size, we find a slightly significant spin-off
indicator in only one specification.
Interestingly, venture capital funds appear to invest in large firms more often than in smaller
ones. This finding can be explained in light of our sample of small and medium-sized companies.

22
Since our sample contains firms with 10 to 1000 employees, we can expect that most tiny firms never
need or obtain funding by VCs, whereas the proportion of VC-financed businesses is likely to be
larger for medium-sized firms. There is no contradiction to the finding that VC funds primarily invest
in young and small firms. Conditional on being a portfolio company, it is likely that a firm is young
and small. From an unconditional perspective of a firm that may or may not attract venture capital,
this does not need to be the case.
Venture funds predominantly target firms operating in industries with non-manufacturing SIC
codes. Firms in international market with few competitors seem to be attractive investments, although
coefficients for industry competitiveness do not become significant. Expected growth does not seem
to play a role in VC investments, which is surprising, since venture capital is often seen as capital that
helps young companies exploit their product’s market potential. Firms with a long product
development time are neither more nor less likely to obtain venture capital. Although collinearity is
no big problem in these models, there is some correlation between product development time and
R&D efforts, which causes development time to become a significant predictor of VC investments if
R&D variables are dropped from the regression.
The set of equations 4 to 6 in table 3 addresses the concern that results might be driven by
sample attrition due to firms being taken over. Although the entity would still be producing patents,
we would not be able to observe this activity if the firm is merged into its parent company. We
therefore exclude all firms that are involved in mergers and acquisitions as targets of such
transactions. Results for this reduced sample are virtually unchanged compared to the full sample in
all univariate and bivariate models (not all of which are shown here to conserve space).
Simultaneous equations – Patenting and VC
Instead of predicting patenting behaviour and venture capital investments separately, we now
turn to a set of equations that predicts both variables simultaneously. Results are presented in table 5.
Allowing for potential endogeneity of VC investments in the patenting equations, we find largely
unchanged results in the VC equation. Differences for patenting activities, however, are particularly
striking for coefficients on endogenous venture capital investments.

23
[Insert table 5 about here]
Venture capital does not seem to increase patenting activity and even decreases the likelihood of
filing patent applications after the investment. Studies on an industry level have found a positive
association (Kortum and Lerner, 2000; Ueda and Hirukawa, 2008 for TFP growth), while results for
samples of individual firms are mixed. Future patent grants are not negatively affected by venture
capital, but may decrease several years later when patent authorities decide about applications.
Estimation uncertainty might explain the diminished influence of venture capital, since there is one
more parameter (the error correlation) to estimate in the simultaneous model compared to the separate
models. However, estimated correlations are positive and significant. The impact of this correlation
can be seen in the coefficients for venture capital, which change considerably when estimated
simultaneously. The negative sign of this change is what we would expect if the error correlation was
positive. In such a case, coefficients for VC in univariate models would exhibit an upward bias, which
would be reduced if we account for endogeneity of VC investments.
Introducing cross-equation correlation harmonises coefficients for some variables between
models. Age is now insignificant in all models for patenting, while the importance of R&D increases.
The positive effect on patent grants for US firms becomes weaker in a simultaneous model but is still
weakly significant. Firm size, however, increases its effect size, but only on future patent applications.
We do not have an explanation for this result, but we can rule out collinearity as a cause of spurious
effects. The effect of employment on future patenting also exists in simple bivariate correlations
between employment and patenting variables, whose sizes roughly mirror the coefficients in our
multivariate models.
Since we perform our regressions on a sample of firms that sought external finance and not only
those that obtained it, we perform a set of robustness on this subsample. Whether or not a firm obtains
finance can have a profound impact on its ability to start or sustain patenting activities. Results of
separate regressions confirm our findings in table 5. Three small changes appear, however, in the
patenting equations. First, firms founded as university spin-offs experience a higher likelihood of
applying for patents than in our earlier results. Due to the small group of spin-offs in our sample, this

24
result has to be taken with a grain of salt, but indicates the plausible mechanism that spin-offs that are
able to attract sufficient funding can afford to realise their development plans. Second, the effect size
of development time decreases slightly and loses its significance. Third, coefficients on product
market competition all increase in magnitude, and the one predicting future applications is slightly
significant now.
Putting everything together – Patent counts, patenting and venture capital
The large number of zeroes in patent counts suggests that patenting is a two-stage process,
consisting of the binary decision to patent and the decision of how many patents to produce. Two
popular methods to model the number of patents produced by such a process are based on a zero-
inflated Poisson distribution or a zero-inflated negative binomial distribution. Results in table 6 are
derived from Poisson models, as the overdispersion parameter introduced in negative binomial models
turned out to be unnecessary.
[Insert table 6 about here]
Ignoring the potential endogeneity of venture capital in the patenting decisions, we find opposing
effects of venture capital on the decision to patent and the number of patents granted. Similar to
binary models that ignore endogeneity, VC exerts a strong and positive influence on the likelihood of
being granted at least one patent (models 3 and 6). On the other hand, VC investments seem to
decrease the number of patents granted. This result contradicts the usual notion of venture capitalists
facilitating growth and development of firms, if VC pursue an extremely selective strategy that
encourages firms to patent only the most promising of their developments.
A more plausible picture emerges if endogenously determined venture capital is added to the
models (see table 7). The effect of VC on the number of granted patents becomes insignificant now,
while VC investments increase the likelihood of (latent) patenting in our results for the full sample, as
would be expected if venture capitalists perform a coaching function in their portfolio companies.
Moreover, and surprisingly similar to the “exogenous” model setup, the number of patent applications

25
appears to decrease after VC investments. This result holds for the sample excluding merger targets
(model 4), while there are no effects of VC on either patenting variable in the full sample.
[Insert table 7 about here]
If we look at the number of patents applied for or being granted, our results support the view that
venture capital follows patent signals to invest in companies with commercially viable products
instead of initiating patenting programmes. While the effect of venture capital on the existence of
patenting programmes and the number of patents produced is weak, it has a positive negative impact
on patent applications and a positive one on the success of these applications in some models. Venture
capitalists seem to be attracted by firms that produce patents, but contribute only to the exploitation of
existing technology. In the medium term, VC funded firms are likely to undergo a structural change
that shifts resources from the production of new patent applications to the exploitation of existing
knowledge.
Control variables for future patent counts behave mostly as expected and give additional insights
into firms’ patenting decision. While manufacturing firms and service firms appeared –
counterintuitively – equally likely to patent, we can now see that being a manufacturing firm increases
the number of patents. Estimating three equations simultaneously picks the relevant equations for our
two R&D variables: The existence of R&D programmes mainly predicts patenting in general, while
the proportion of R&D staff explains the number of applications and grants produced. Contrary to
results presented by Baum and Silverman (2004) we find no impact of competition on the number of
patents or the decision to patent. However, firms tend to protect their position in the market by
choosing to patent if their relevant market is large. Long product development times are a significant
predictor for patenting status, but not for the number of patents applied for or granted.
Estimated model parameters provide strong support for simultaneously modelling VC
investment, patenting and the number of patents. In most of the models tested for patent applications
and grants, error correlations between the first (VC) equation and the second and third are highly
significant. External shocks leading to VC investment correlate with the likelihood to patent, but

26
coefficients are hardly significant for patents granted. Estimated error correlations between VC
investment and patent numbers are similarly large and significant. We test model stability by checking
influential observations and cross-tabulations for firms that start or stop their patenting activities
depending on VC investment, but do not find any abnormalities. Future research efforts should focus
on the generation of larger samples that reduce the importance of individual observations, particularly
in the subset of firms obtaining venture capital financing.
5. Conclusion
The mechanisms by which firms signal their quality to investors through patents and how
venture capital funds influence these firms’ patenting behaviour have been studied extensively in the
literature. Because firm’s patenting activity might not be independent from venture capitalists’
decisions to invest based on patent signals, these two decisions should be made at the same time
instead of separately. We take causality problems in firm’s patenting behaviour into account by
explicitly allowing for endogeneity of VC investments. Incorporating the investor’s decision to invest
into a simultaneous model helps distinguishing signalling from selection and coaching effects. As a
second contribution to the literature, we model patenting as a two-step process, in which firms first
decide whether to use patents at all and then determine the number of applications they file.
We find that the causal link from venture capital to patenting is weak, contrary to studies on
aggregate patenting and venture capital investment (Kortum and Lerner, 2000). A positive effect can
only be found consistently if potential endogeneity of VC financing is ignored. Instead, venture
capital even appears to exert a negative influence on future patent applications in the sample of firms
excluding merger targets. Venture capital funds seem to primarily select portfolio companies based on
the signalling function of patents and thereby help them to commercialise their ideas. This signalling
function of patents is most strongly associated with patent applications rather than granted ones. The
number of patents appears not to play a major role in attracting venture capital, but it is the fact that a
firm patents at all that makes them attractive targets for investments.
Our results for determinants of patenting mostly confirm prior research. Firm size is positively
related to future patent applications and R&D efforts measured by the existence of R&D expenses and

27
the percentage of R&D staff are highly significant. Where Baum and Silverman (2004) find mixed
evidence for an age effect on applications and grants, we decompose this effect into a non-significant
one on the likelihood to patent and a negative and significant one for the number of applications. Age
effects on granted patents are all negligible. The founder’s education does not increase the likelihood
to patent. Results for university spin-offs are similarly insignificant. The proportion of scientific staff,
however, explains the number of patent applications and grants, while having an R&D programme
determines whether a firm patents. Finally, the effect of industry competition on the intensity of
patenting is insignificant, contrary to results by Baum and Silverman (2004) and Scherer (1983). We
test two new variables, product development time and market size. Both predict patenting activity,
which might explain why competition is not associated with patenting in our models.
Results for the VC investment equation are very similar in all specifications. VC investment
depends on whether a firm applies for patents, but not on patenting volume. Interestingly, patent
grants predict venture capital investments about as well as patent applications, although theoretically
they should convey a stronger signal about firm quality than applications. Venture capital funds invest
in companies operating in non-manufacturing sectors in international markets, whose CEOs tend to
have university degrees. Unexpectedly, within-industry competition does not change the likelihood of
VC investments, nor does expected growth.
By modelling the VC’s decision to invest and the portfolio company’s patenting activity
simultaneously, we are able to answer the question of what comes first, patents or VC investment, in
favour of patenting. More specifically, having a positive number of patent applications or grants
predicts venture capital investments, whereas obtaining venture capital investments is not informative
about the future existence of patenting programmes. In terms of patent numbers, portfolio firms of
venture funds seem to be more successful in being granted patents, but tend to reduce applications. If
venture capitalists are performing a coaching function, their activities appear to affect the outcome of
patent applications, but not firms’ efforts to generate additional products.
Our models greatly reduce the possibilities in which selection by VCs might drive a change in
observed patenting behaviour, because estimating the correlation between the error terms in both
equations controls for unobserved simultaneous variance in VC financing and patenting. If VC firms

28
react to some unobserved company characteristic that can be subsumed in the error term of the
switching equation, this unobserved heterogeneity is taken into account when estimating the outcome
model for patenting activity. Error correlation between the VC equations and our two patenting
equations are both highly significant, which supports our estimation strategy.
We find evidence for a two-step decision process in patenting: In the first step, firms decide
whether or not to patent, and it is this decision which determines the likelihood of VC financing. Only
after a firm has established an R&D programme, an estimation of the number of patents yields
sensible results. Models aiming to explain firms’ patent numbers should thus incorporate a
mechanism that determines whether a firm patents at all before estimating the number of patent
applications or grants.
References
Audretsch, D. B., Bönte, W. & Mahagaonkar, P. (2009), Financial Signaling by Innovative Nascent
Entrepreneurs, Jena Economic Research Papers No. 2009-012, available at
http://www.wiwi.uni-jena.de/Papers/jerp2009/wp_2009_012.pdf.
Baum, J. A. C. & Silverman, B. S. (2004), Picking winners or building them? Alliance, intellectual,
and human capital as selection criteria in venture financing and performance of biotechnology
startups, Journal of Business Venturing 19(3), 411–436.
Bergemann, D. & Hege, U. (1998), Venture capital financing, moral hazard, and learning, Journal of
Banking & Finance 22(6-8), 703–735.
Bertoni, F., Croce, A. & D'Adda, D. (2010), Venture capital investments and patenting activity of
high-tech start-ups: a micro-econometric firm-level analysis, Venture Capital 12(4), 307–326.
Bound, J., Cummins, C., Griliches, Z., Hall, B. H. & Jaffe, A. (1984), Who Does R&D and Who
Patents?, in Zvi Griliches, ed., 'R&D, patents, and productivity', University of Chicago Press,
21–54.
Bygrave, W. & Timmons, J. (1992), Venture Capital at the Crossroads, Harvard Business School
Press, Boston.
Cao, J. & Hsu, P.-H. (2010), Patent Signaling, Entrepreneurial Performance, and Venture Capital
Financing, Working Paper, available at http://ssrn.com/abstract=1678809.
Caselli, S., Gatti, S. & Perrini, F. (2009), Are Venture Capitalists a Catalyst for Innovation?,
European Financial Management 15(1), 92–111.
Colombo, M. G. & Grilli, L. (2010), On growth drivers of high-tech start-ups: Exploring the role of
founders' human capital and venture capital, Journal of Business Venturing 25(6), 610–626.
Engel, D. & Keilbach, M. (2007), Firm-level implications of early stage venture capital investment –
An empirical investigation, Journal of Empirical Finance 14(2), 150–167.
Gelman, A. & Hill, J. (2006), Data Analysis Using Regression and Multilevel/Hierarchical Models,
Cambridge University Press.

29
Gompers, P. A. (1995), Optimal Investment, Monitoring, and the Staging of Venture Capital, The
Journal of Finance 50(5), 1461–1489.
Gompers, P. A. & Lerner, J. (1999), An analysis of compensation in the U.S. venture capital
partnership, Journal of Financial Economics 51, 3–44.
Gompers, P. A. & Lerner, J. (2001), 'The Venture Capital Revolution', Journal of Economic
Perspectives 15(2), 145–168.
Gorman, M. & Sahlman, W. A. (1989), What do venture capitalists do?, Journal of Business
Venturing 4(4), 231–248.
Gouriéroux, C. & Monfort, A. (1996), Simulation-Based Econometric Methods, Oxford University
Press.
Hausman, J., Hall, B. H. & Griliches, Z. (1984), Econometric Models for Count Data with an
Application to the Patents-R&D Relationship, Econometrica 52(4), 909–938.
Häussler, C., Harhoff, D. & Müller, E. (2009), To Be Financed or Not… – The Role of Patents for
Venture Capital Financing, ZEW - Centre for European Economic Research Discussion Paper
No. 09-003, available at http://ssrn.com/abstract=1393725.
Heckman, J. (1990), Varieties of Selection Bias, The American Economic Review 80(2), 313–318.
Hellmann, T. (1998), The Allocation of Control Rights in Venture Capital Contracts, The RAND
Journal of Economics 29(1), 57–76.
Hellman, T. & Puri, M. (2000), The interaction between product market and financing strategy: the
role of venture capital, Review of Financial Studies 13(4), 959–984.
Hsu, D. & Ziedonis, R. H. (2008), Patents as quality signals for entrepreneurial ventures, Academy of
Management Best Paper Proceedings.
Jacobson, R. (1990), Unobservable Effects and Business Performance, Marketing Science 9(1), 74–
85.
Kaplan, S. N. & Strömberg, P. (2003), Financial Contracting Theory Meets the Real World: An
Empirical Analysis of Venture Capital Contracts, Review of Economic Studies 70(243), 281–
315.
Kaplan, S. N. & Strömberg, P. (2004), Characteristics, Contracts, and Actions: Evidence from
Venture Capitalist Analyses, The Journal of Finance 59(5), 2177–2210.
Keuschnigg, C. & Nielsen, S. B. (2004), Start-ups, venture capitalists, and the capital gains tax,
Journal of Public Economics 88(5), 1011–1042.
Kortum, S. & Lerner, J. (2000), Assessing the Contribution of Venture Capital to Innovation, The
RAND Journal of Economics 31(4), 674–692.
Lambert, D. (1992), Zero-Inflated Poisson Regression, with an Application to Defects in
Manufacturing, Technometrics 34(1), 1–14.
Lerner, J., Sorensen, M. & Strömberg, P. (2011), Private Equity and Long-Run Investment: The Case
of Innovation, The Journal of Finance 66(2), 445–477.
MacMillan, I. C., Kulow, D. M. & Khoylian, R. (1989), Venture capitalists' involvement in their
investments: Extent and performance, Journal of Business Venturing 4(1), 27–47.
Mann, R. J. & Sager, T. W. (2007), Patents, venture capital, and software start-ups, Research Policy
36(2), 193–208.
Miranda, A. & Rabe-Hesketh, S. (2006), Maximum likelihood estimation of endogenous switching
and sample selection models for binary, ordinal, and count variables, The Stata Journal 6(3),
285–308.

30
Pakes, A. (1981), Patents, R&D, and the stock market rate of return, NBER Working Paper. Available
at http://www.nber.org/papers/w0786.
Pakes, A. & Griliches, Z. (1980), Patents and R&D at the firm level: A first report, Economics Letters
5(4), 377–381.
Peneder, M. (2010), The Impact of Venture Capital on Innovation Behaviour and Firm Growth,
WIFO Working Paper 363/2010, available at http://www.wifo.ac.at/wwa/downloadController/
displayDbDoc.htm?item=WP_2010_363$.PDF.
Popov, A. & Roosenboom, P. (2009), Does private equity investment spur innovation? Evidence from
Europe, Working Paper, available at www.ecb.int/pub/pdf/scpwps/ecbwp1063.pdf.
Riyanto, Y. E. & Schwienbacher, A. (2006), The strategic use of corporate venture financing for
securing demand, Journal of Banking & Finance 30(10), 2809–2833.
Sahlman, W. (1990), The structure and governance of venture-capital organisations, Journal of
Financial Economics 27(2), 473–521.
Scherer, F. M. (1965a), Firm Size, Market Structure, Opportunity, and the Output of Patented
Inventions, The American Economic Review 55(5), 1097–1125.
Scherer, F. M. (1965b), Size of Firm, Oligopoly, and Research: A Comment, The Canadian Journal of
Economics and Political Science / Revue canadienne d'Economique et de Science politique
31(2), 256–266.
Scherer, F. M. (1983), The propensity to patent, International Journal of Industrial Organization 1(1),
107–128.
Schwienbacher, A. (2008), Innovation and Venture Capital Exits, Economic Journal 118(533), 1888–
1916.
Stuck, B. & Weingarten, M. (2005), How Venture Capital Thwarts Innovation, IEEE Spectrum April
2005, available at http://spectrum.ieee.org/computing/hardware/how-venture-capital-thwarts-
innovation.
Taber, C. R. (2000), Semiparametric identification and heterogeneity in discrete choice dynamic
programming models, Journal of Econometrics 96(2), 201–229.
Train, K. E. (2009), Discrete Choice Methods with Simulation, Cambridge University Press.
Ueda, M. (2004), Banks versus Venture Capital: Project Evaluation, Screening, and Expropriation,
Journal of Finance 59(2), 601–621.
Ueda, M. & Hirukawa, M. (2008), Venture Capital and Industrial 'Innovation', Working paper,
available at http://ssrn.com/abstract=1242693.
Zhang, J. X. (2009), Shareholding by venture capitalists and patent applications of Japanese firms in
the pre- and post-IPO Periods, Institute of Innovation Research Working Paper, Hitotsubashi
University, available at http://ideas.repec.org/p/hit/iirwps/09-02.html.

31
Table 1. Descriptive statistics
Variable Mean Median Std.
Dev.
Min Max Description
Patent applications in t+1 4.139 0 34.243 0 779 Number of patent applications by the firm in the
period after the survey.
Patent grants in t+1 2.770 0 30.340 0 889 Number of patent grants to the firm in the period after the survey.
Patent applications in t 3.293 0 25.356 0 526 Number of patent applications by the firm in the
period three years prior to the survey.
Patent grants in t 1.203 0 9.996 0 273 Number of patent grants to the firm in the period
three years prior to the survey.
VC/BA investment 0.102 0 0.303 0 1 A venture capital fund or business angel invested in the firm over the three-year period prior to the
survey.
Age (Log) 2.936 2.996 0.858 0.693 5.720 The natural logarithm of the firm's age in years.
Size (Log(Employees)) 3.848 3.714 1.059 1.099 6.804 The natural logarithm of the number of employees in
the most recent financial year.
US firm 0.546 1 0.498 0 1 The firm has its headquarters in the United States. Dummy variable.
Manufacturing sector 0.699 1 0.459 0 1 The firm is operating in the manufacturing sector.
Dummy variable.
R&D expend. (yes/no) 0.732 1 0.443 0 1 The firm has R&D expenditures. Dummy variable.
R&D staff 0.074 0 0.176 0 1 Full-time R&D staff as a proportion of total staff.
CEO has a degree 0.635 1 0.482 0 1 The firm's Chief Executive or MD has a degree.
Dummy variable.
University spin-off 0.021 0 0.144 0 1 The firm is a university spin-off. Dummy variable.
Market size 1.747 2 0.911 0 3 Size of the firm's market. Coded as ordinal 0=local, 1=regional, 2=national, 3=international, treated as
cardinal.
Competitors (Log) 1.990 1.792 1.002 0 6.909 Number of companies that the firm regards as serious
competitors plus one, in logs.
Product dev. time 0.971 1 1.048 0 4 Average time it takes to develop a new product from conception to the market. Coded as ordinal 0=less
than 6 months to 4=more than 5 years, treated as
cardinal.
Expected growth 3.117 3 1.007 0 4 Growth expected for national employment over the next 10 years. Coded as ordinal 0=a lot smaller
the 4=a lot larger, treated as cardinal.
Table 2. Venture capital and patenting status This table presents the number of firms in each present and future patenting status dependent on venture capital / business angel investment.
Row entries are the number of firms with any number of patent applications at time t. Columns show the number of firms applying for or
being granted any number of patents.
No VC/BA:
Applications in t+1
VC/BA:
Applications in t+1
No VC/BA:
Grants in t+1
VC/BA:
Grants in t+1
Applications in t No Yes
No Yes
No Yes
No Yes
No 688 52
42 11
717 23
47 6
Yes 29 75
11 32
24 80
8 35

32
Table 3. Venture capital investment – univariate This table presents probit models for the likelihood of observing venture capital or business angel investments. Standard errors are in
parentheses. Significance levels: *** p<0.01; ** p<0.05; * p<0.1.
All observations Excluding merger targets
Model 1
2
3
4
5
6 Dependent variable VC/BA
investment
VC/BA
investment
VC/BA
investment
VC/BA
investment
VC/BA
investment
VC/BA
investment
VC/BA investment
Patent applications (Log) -0.102 (0.08)
-0.112 (0.09) Patent applications >0 0.598 (0.20) ***
0.630 (0.21) ***
Patent grants (Log)
-0.155 (0.12)
-0.238 (0.13) * Patent grants >0
0.363 (0.23)
0.403 (0.24)
Age (Log) -0.334 (0.09) *** -0.348 (0.09) *** -0.346 (0.09) *** -0.290 (0.10) *** -0.303 (0.10) *** -0.300 (0.10) ***
Size (Log(Employees)) 0.203 (0.07) *** 0.199 (0.06) *** 0.191 (0.06) *** 0.176 (0.07) ** 0.178 (0.07) ** 0.165 (0.07) ** US firm -0.328 (0.14) ** -0.318 (0.14) ** -0.319 (0.14) ** -0.353 (0.15) ** -0.338 (0.15) ** -0.342 (0.15) **
Manufacturing sector -0.377 (0.13) *** -0.347 (0.13) *** -0.341 (0.13) ** -0.360 (0.14) ** -0.329 (0.14) ** -0.325 (0.14) **
R&D expend. (yes/no) 0.455 (0.21) ** 0.484 (0.21) ** 0.507 (0.21) ** 0.748 (0.26) *** 0.768 (0.26) *** 0.795 (0.26) ***
R&D staff (in %) 0.649 (0.33) ** 0.828 (0.32) ** 0.824 (0.31) *** 0.799 (0.35) ** 1.040 (0.34) *** 0.967 (0.33) ***
CEO has a degree 0.357 (0.17) ** 0.364 (0.17) ** 0.386 (0.17) ** 0.360 (0.18) ** 0.361 (0.18) ** 0.380 (0.18) **
University spin-off 0.465 (0.32) 0.493 (0.33) 0.531 (0.33) 0.320 (0.34) 0.381 (0.36) 0.401 (0.36) Market size 0.213 (0.09) ** 0.220 (0.09) ** 0.232 (0.09) *** 0.197 (0.10) ** 0.203 (0.10) ** 0.213 (0.09) **
Expected growth 0.021 (0.07) 0.010 (0.07) 0.007 (0.07) 0.058 (0.08) 0.047 (0.08) 0.042 (0.08)
Product dev. time 0.054 (0.07) 0.060 (0.07) 0.065 (0.07) 0.051 (0.07) 0.060 (0.07) 0.065 (0.07) Competitors (Log) -0.051 (0.07) -0.066 (0.07) -0.067 (0.07) -0.015 (0.08) -0.034 (0.08) -0.033 (0.08)
Intercept -2.027 (0.49) *** -1.937 (0.48) *** -1.934 (0.47) *** -2.524 (0.56) *** -2.439 (0.55) *** -2.417 (0.54) ***
Observations 940
940
940
888
888
888 Log-Likelihood -236.2
-238.7
-240.2
-202.8
-204.4
-206.6
Chi-sq. test 106.5
110.1
98.3
93.3
96.2
86.6
P-value 0.000
0.000
0.000
0.000
0.000
0.000 Pseudo- R² 0.238
0.230
0.225
0.246
0.240
0.231
Table 4. Patenting activity – univariate This table presents probit models for the likelihood of observing any number of patent applications or grants, respectively. Standard errors
are in parentheses. Significance levels: *** p<0.01; ** p<0.05; * p<0.1.
Including VC/BA Excluding VC/BA
Model 1
2
3
4
5
6
Dependent variable Applications
in t+1
Grants
in t+1
Grants
in t+1
Applications
in t+1
Grants
in t+1
Grants
in t+1
Patenting (yes/no)
VC/BA investment 0.219 (0.20) 0.627 (0.19) *** 0.473 (0.24) **
Patent applications (Log) 0.501 (0.12) ***
0.662 (0.14) *** 0.508 (0.12) ***
0.652 (0.14) ***
Patent applications >0 0.991 (0.22) ***
1.595 (0.23) *** 1.001 (0.22) ***
1.614 (0.22) *** Patent grants (Log)
0.579 (0.15) ***
0.545 (0.15) ***
Patent grants >0
1.234 (0.22) ***
1.249 (0.22) ***
Age (Log) 0.154 (0.08) * 0.026 (0.10) 0.114 (0.11) 0.144 (0.08) * -0.008 (0.09) 0.095 (0.11) Size (Log(Employees)) 0.139 (0.06) ** 0.026 (0.06) 0.002 (0.08) 0.145 (0.06) ** 0.046 (0.06) 0.016 (0.07)
US firm 0.116 (0.13) 0.338 (0.14) ** 0.373 (0.17) ** 0.101 (0.13) 0.286 (0.14) ** 0.332 (0.17) ** Manufacturing sector 0.040 (0.14) 0.180 (0.16) 0.137 (0.18) 0.017 (0.14) 0.088 (0.16) 0.066 (0.18)
R&D expend. (yes/no) 0.453 (0.18) ** 0.366 (0.19) * 0.528 (0.22) ** 0.462 (0.18) ** 0.408 (0.19) ** 0.559 (0.22) **
R&D staff (in %) 0.076 (0.36) 0.574 (0.43) -0.372 (0.44) 0.138 (0.36) 0.756 (0.41) * -0.274 (0.42) CEO has a degree 0.104 (0.14) -0.242 (0.15) -0.273 (0.17) 0.116 (0.14) -0.197 (0.15) -0.232 (0.17)
University spin-off 0.105 (0.37) -0.272 (0.41) -0.602 (0.39) 0.138 (0.36) -0.156 (0.41) -0.484 (0.37)
Market size 0.233 (0.09) *** 0.317 (0.10) *** 0.262 (0.11) ** 0.241 (0.09) *** 0.340 (0.09) *** 0.279 (0.11) *** Expected growth 0.055 (0.07) 0.047 (0.07) 0.101 (0.09) 0.052 (0.07) 0.046 (0.07) 0.098 (0.09)
Product dev. time 0.173 (0.06) *** 0.136 (0.06) ** 0.115 (0.07) 0.174 (0.06) *** 0.136 (0.06) ** 0.121 (0.07)
Competitors (Log) -0.068 (0.06) -0.049 (0.06) -0.097 (0.08) -0.069 (0.06) -0.058 (0.06) -0.096 (0.08) Intercept -3.626 (0.49) *** -3.048 (0.54) *** -3.504 (0.70) *** -3.601 (0.49) *** -2.955 (0.54) *** -3.458 (0.70) ***
Observations 940
940
940
940
940
940
Log-Likelihood -258.6
-227.2
-165.8
-259.3
-232.4
-168.0 Chi-sq. test 238.0
210.2
238.2
238.0
214.7
247.5
P-value 0.000
0.000
0.000
0.000
0.000
0.000
Pseudo- R² 0.418
0.436
0.588
0.416
0.423
0.583

33
Table 5. Patenting and VC investment – Simultaneous equations This table presents bivariate recursive probit models for patent applications, patent grants and for the likelihood of observing venture capital
or business angel investments. Standard errors are in parentheses. Significance levels: *** p<0.01; ** p<0.05; * p<0.1.
All observations Excluding merger targets
Model 1
2
3
4
5
6 Dependent variable in
patenting equation Applications
in t+1 Grants in t+1
Grants in t+1
Applications in t+1
Grants in t+1
Grants in t+1
Patenting (yes/no)
VC/BA investment -0.808 (0.36) ** 0.007 (0.50) -0.260 (0.34) -1.342 (0.60) ** 0.143 (0.60) -0.237 (0.36) Patent applications (Log) 0.431 (0.11) ***
0.619 (0.13) *** 0.518 (0.20) ***
0.563 (0.14) ***
Patent applications >0 1.075 (0.20) ***
1.640 (0.22) *** 0.992 (0.20) ***
1.648 (0.22) ***
Patent grants (Log)
0.544 (0.15) ***
0.557 (0.17) *** Patent grants >0
1.256 (0.22) ***
1.274 (0.23) ***
Age (Log) 0.058 (0.09) -0.024 (0.11) 0.053 (0.11) 0.006 (0.15) 0.029 (0.11) 0.054 (0.11)
Size (Log(Employees)) 0.174 (0.06) *** 0.049 (0.06) 0.032 (0.07) 0.170 (0.06) *** 0.058 (0.07) 0.033 (0.07) US firm 0.029 (0.13) 0.292 (0.16) * 0.310 (0.17) * -0.026 (0.17) 0.299 (0.16) * 0.300 (0.17) *
Manufacturing sector -0.069 (0.14) 0.117 (0.16) 0.059 (0.17) -0.095 (0.20) 0.096 (0.17) 0.056 (0.17)
R&D expend. (yes/no) 0.504 (0.17) *** 0.400 (0.19) ** 0.558 (0.21) *** 0.614 (0.19) *** 0.406 (0.21) ** 0.543 (0.21) *** R&D staff (in %) 0.274 (0.34) 0.720 (0.43) * -0.206 (0.43) 0.659 (0.35) * 0.994 (0.43) ** 0.028 (0.45)
CEO has a degree 0.175 (0.14) -0.196 (0.16) -0.215 (0.16) 0.214 (0.16) -0.255 (0.16) -0.203 (0.17)
University spin-off 0.267 (0.34) -0.148 (0.41) -0.441 (0.38) 0.019 (0.37) 0.099 (0.40) -0.375 (0.40) Market size 0.260 (0.08) *** 0.334 (0.09) *** 0.282 (0.10) *** 0.264 (0.08) *** 0.291 (0.09) *** 0.276 (0.10) ***
Expected growth 0.052 (0.07) 0.045 (0.07) 0.099 (0.09) 0.084 (0.07) 0.020 (0.07) 0.090 (0.09)
Product dev. time 0.169 (0.06) *** 0.139 (0.06) ** 0.118 (0.07) * 0.161 (0.06) *** 0.143 (0.06) ** 0.110 (0.07) Competitors (Log) -0.072 (0.06) -0.055 (0.06) -0.100 (0.08) -0.040 (0.06) -0.070 (0.06) -0.095 (0.08)
Intercept -3.342 (0.52) *** -2.927 (0.57) *** -3.346 (0.71) *** -3.307 (0.74) *** -2.945 (0.58) *** -3.295 (0.70) ***
VC/BA investment
Patent applications (Log) -0.103 (0.08)
-0.104 (0.08) -0.123 (0.09)
-0.117 (0.09)
Patent applications >0 0.644 (0.20) ***
0.632 (0.20) *** 0.721 (0.21) ***
0.675 (0.21) ***
Patent grants (Log)
-0.159 (0.12)
-0.241 (0.12) * Patent grants >0
0.402 (0.24) *
0.439 (0.25) *
Age (Log) -0.338 (0.09) *** -0.348 (0.09) *** -0.344 (0.09) *** -0.281 (0.11) *** -0.303 (0.10) *** -0.303 (0.10) ***
Size (Log(Employees)) 0.197 (0.07) *** 0.205 (0.06) *** 0.204 (0.07) *** 0.174 (0.08) ** 0.184 (0.07) ** 0.179 (0.07) ** US firm -0.345 (0.14) ** -0.317 (0.14) ** -0.328 (0.14) ** -0.407 (0.17) ** -0.336 (0.15) ** -0.355 (0.15) **
Manufacturing sector -0.377 (0.13) *** -0.364 (0.13) *** -0.385 (0.13) *** -0.367 (0.14) ** -0.347 (0.15) ** -0.372 (0.15) **
R&D expend. (yes/no) 0.459 (0.21) ** 0.484 (0.21) ** 0.461 (0.22) ** 0.713 (0.27) *** 0.770 (0.26) *** 0.762 (0.27) *** R&D staff (in %) 0.651 (0.33) ** 0.793 (0.33) ** 0.612 (0.33) * 0.793 (0.35) ** 1.004 (0.34) *** 0.755 (0.35) **
CEO has a degree 0.379 (0.16) ** 0.367 (0.17) ** 0.361 (0.17) ** 0.402 (0.17) ** 0.364 (0.18) ** 0.364 (0.18) **
University spin-off 0.449 (0.33) 0.471 (0.34) 0.450 (0.33) 0.314 (0.34) 0.361 (0.37) 0.306 (0.35)
Market size 0.208 (0.09) ** 0.223 (0.09) ** 0.218 (0.09) ** 0.192 (0.10) ** 0.208 (0.10) ** 0.204 (0.10) **
Expected growth 0.045 (0.08) 0.010 (0.07) 0.018 (0.07) 0.103 (0.10) 0.049 (0.08) 0.056 (0.08) Product dev. time 0.049 (0.07) 0.061 (0.07) 0.054 (0.07) 0.036 (0.07) 0.061 (0.07) 0.052 (0.07)
Competitors (Log) -0.054 (0.07) -0.062 (0.07) -0.047 (0.07) -0.035 (0.09) -0.029 (0.08) -0.011 (0.08)
Intercept -2.069 (0.49) *** -1.969 (0.49) *** -2.021 (0.49) *** -2.612 (0.56) *** -2.484 (0.57) *** -2.530 (0.56) *** Observations 940
940
940
888
888
888
Log-Likelihood -493.3
-465.5
-401.2
-432.9
-413.5
-361.4
Chi-sq. test 350.6
310.2
348.3
337.8
274.3
316.7 P-value 0.000
0.000
0.000
0.000
0.000
0.000
0.572
0.337
0.403
0.866
0.310
0.415 P-value for (Wald test) 0.012
0.187
0.005
0.358
0.319
0.010
Pseudo- R² 0.327
0.347
0.437
0.359
0.347
0.429
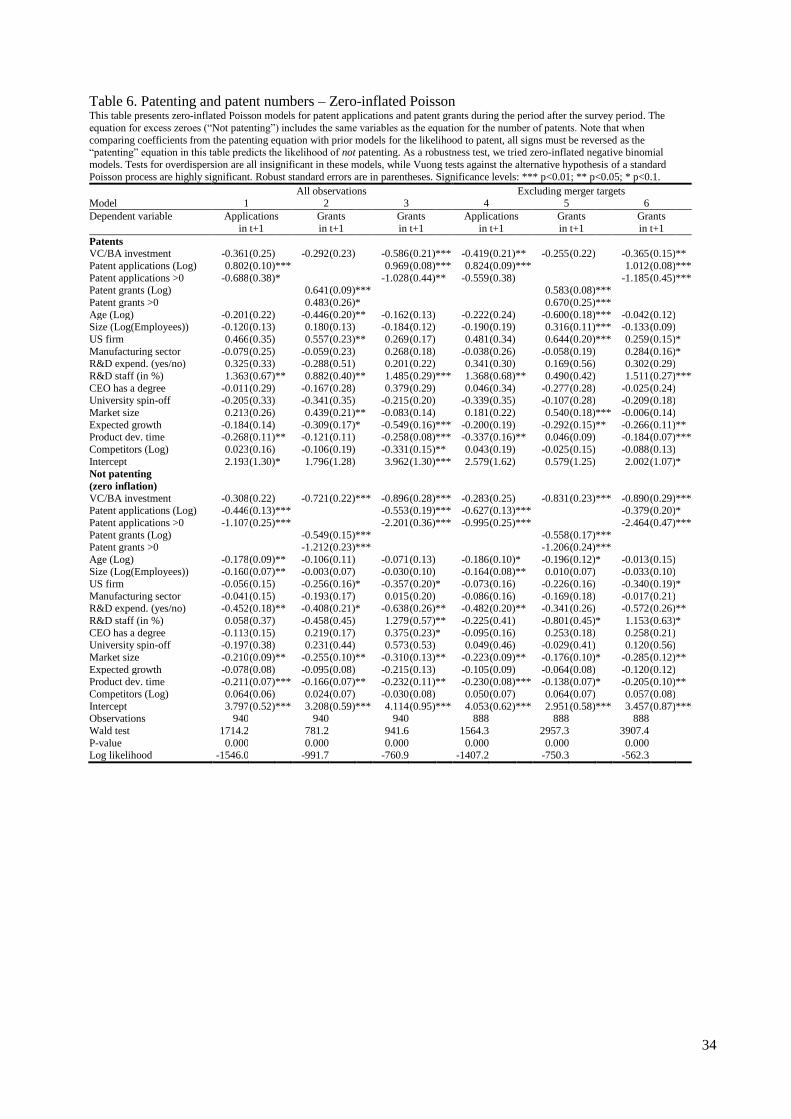
34
Table 6. Patenting and patent numbers – Zero-inflated Poisson This table presents zero-inflated Poisson models for patent applications and patent grants during the period after the survey period. The
equation for excess zeroes (“Not patenting”) includes the same variables as the equation for the number of patents. Note that when
comparing coefficients from the patenting equation with prior models for the likelihood to patent, all signs must be reversed as the “patenting” equation in this table predicts the likelihood of not patenting. As a robustness test, we tried zero-inflated negative binomial
models. Tests for overdispersion are all insignificant in these models, while Vuong tests against the alternative hypothesis of a standard
Poisson process are highly significant. Robust standard errors are in parentheses. Significance levels: *** p<0.01; ** p<0.05; * p<0.1.
All observations Excluding merger targets
Model 1
2
3
4
5
6
Dependent variable
Applications
in t+1
Grants
in t+1
Grants
in t+1
Applications
in t+1
Grants
in t+1
Grants
in t+1
Patents
VC/BA investment -0.361 (0.25) -0.292 (0.23) -0.586 (0.21) *** -0.419 (0.21) ** -0.255 (0.22) -0.365 (0.15) **
Patent applications (Log) 0.802 (0.10) ***
0.969 (0.08) *** 0.824 (0.09) ***
1.012 (0.08) ***
Patent applications >0 -0.688 (0.38) *
-1.028 (0.44) ** -0.559 (0.38)
-1.185 (0.45) *** Patent grants (Log)
0.641 (0.09) ***
0.583 (0.08) ***
Patent grants >0
0.483 (0.26) *
0.670 (0.25) ***
Age (Log) -0.201 (0.22) -0.446 (0.20) ** -0.162 (0.13) -0.222 (0.24) -0.600 (0.18) *** -0.042 (0.12) Size (Log(Employees)) -0.120 (0.13) 0.180 (0.13) -0.184 (0.12) -0.190 (0.19) 0.316 (0.11) *** -0.133 (0.09)
US firm 0.466 (0.35) 0.557 (0.23) ** 0.269 (0.17) 0.481 (0.34) 0.644 (0.20) *** 0.259 (0.15) *
Manufacturing sector -0.079 (0.25) -0.059 (0.23) 0.268 (0.18) -0.038 (0.26) -0.058 (0.19) 0.284 (0.16) * R&D expend. (yes/no) 0.325 (0.33) -0.288 (0.51) 0.201 (0.22) 0.341 (0.30) 0.169 (0.56) 0.302 (0.29)
R&D staff (in %) 1.363 (0.67) ** 0.882 (0.40) ** 1.485 (0.29) *** 1.368 (0.68) ** 0.490 (0.42) 1.511 (0.27) ***
CEO has a degree -0.011 (0.29) -0.167 (0.28) 0.379 (0.29) 0.046 (0.34) -0.277 (0.28) -0.025 (0.24) University spin-off -0.205 (0.33) -0.341 (0.35) -0.215 (0.20) -0.339 (0.35) -0.107 (0.28) -0.209 (0.18)
Market size 0.213 (0.26) 0.439 (0.21) ** -0.083 (0.14) 0.181 (0.22) 0.540 (0.18) *** -0.006 (0.14)
Expected growth -0.184 (0.14) -0.309 (0.17) * -0.549 (0.16) *** -0.200 (0.19) -0.292 (0.15) ** -0.266 (0.11) ** Product dev. time -0.268 (0.11) ** -0.121 (0.11) -0.258 (0.08) *** -0.337 (0.16) ** 0.046 (0.09) -0.184 (0.07) ***
Competitors (Log) 0.023 (0.16) -0.106 (0.19) -0.331 (0.15) ** 0.043 (0.19) -0.025 (0.15) -0.088 (0.13)
Intercept 2.193 (1.30) * 1.796 (1.28) 3.962 (1.30) *** 2.579 (1.62) 0.579 (1.25) 2.002 (1.07) *
Not patenting
(zero inflation)
VC/BA investment -0.308 (0.22) -0.721 (0.22) *** -0.896 (0.28) *** -0.283 (0.25) -0.831 (0.23) *** -0.890 (0.29) *** Patent applications (Log) -0.446 (0.13) ***
-0.553 (0.19) *** -0.627 (0.13) ***
-0.379 (0.20) *
Patent applications >0 -1.107 (0.25) ***
-2.201 (0.36) *** -0.995 (0.25) ***
-2.464 (0.47) ***
Patent grants (Log)
-0.549 (0.15) ***
-0.558 (0.17) *** Patent grants >0
-1.212 (0.23) ***
-1.206 (0.24) ***
Age (Log) -0.178 (0.09) ** -0.106 (0.11) -0.071 (0.13) -0.186 (0.10) * -0.196 (0.12) * -0.013 (0.15)
Size (Log(Employees)) -0.160 (0.07) ** -0.003 (0.07) -0.030 (0.10) -0.164 (0.08) ** 0.010 (0.07) -0.033 (0.10)
US firm -0.056 (0.15) -0.256 (0.16) * -0.357 (0.20) * -0.073 (0.16) -0.226 (0.16) -0.340 (0.19) *
Manufacturing sector -0.041 (0.15) -0.193 (0.17) 0.015 (0.20) -0.086 (0.16) -0.169 (0.18) -0.017 (0.21) R&D expend. (yes/no) -0.452 (0.18) ** -0.408 (0.21) * -0.638 (0.26) ** -0.482 (0.20) ** -0.341 (0.26) -0.572 (0.26) **
R&D staff (in %) 0.058 (0.37) -0.458 (0.45) 1.279 (0.57) ** -0.225 (0.41) -0.801 (0.45) * 1.153 (0.63) *
CEO has a degree -0.113 (0.15) 0.219 (0.17) 0.375 (0.23) * -0.095 (0.16) 0.253 (0.18) 0.258 (0.21) University spin-off -0.197 (0.38) 0.231 (0.44) 0.573 (0.53) 0.049 (0.46) -0.029 (0.41) 0.120 (0.56)
Market size -0.210 (0.09) ** -0.255 (0.10) ** -0.310 (0.13) ** -0.223 (0.09) ** -0.176 (0.10) * -0.285 (0.12) **
Expected growth -0.078 (0.08) -0.095 (0.08) -0.215 (0.13) -0.105 (0.09) -0.064 (0.08) -0.120 (0.12) Product dev. time -0.211 (0.07) *** -0.166 (0.07) ** -0.232 (0.11) ** -0.230 (0.08) *** -0.138 (0.07) * -0.205 (0.10) **
Competitors (Log) 0.064 (0.06) 0.024 (0.07) -0.030 (0.08) 0.050 (0.07) 0.064 (0.07) 0.057 (0.08)
Intercept 3.797 (0.52) *** 3.208 (0.59) *** 4.114 (0.95) *** 4.053 (0.62) *** 2.951 (0.58) *** 3.457 (0.87) *** Observations 940
940
940
888
888
888
Wald test 1714.2
781.2
941.6
1564.3
2957.3
3907.4
P-value 0.000
0.000
0.000
0.000
0.000
0.000 Log likelihood -1546.0
-991.7
-760.9
-1407.2
-750.3
-562.3

35
Table 7. Patenting, patent numbers and VC investment This table presents zero-inflated Poisson models for patent applications and patent grants during the period following the survey period,
including an endogenous equation for venture capital investment. Robust standard errors (estimated using the sandwich estimator) are shown
in parentheses. Significance levels: *** p<0.01; ** p<0.05; * p<0.1.
All observations Excluding merger targets
Model 1
2
3
4
5
6
Dependent variable in
patenting equations
Applications
in t+1
Grants
in t+1
Grants
in t+1
Applications
in t+1
Grants
in t+1
Grants
in t+1
Patents
VC/BA investment 0.121 (0.12)
0.219 (0.20)
0.066 (0.23)
-0.742 (0.22) *** 0.071 (0.20)
-0.331 (0.18) *
Patent applications (Log) 0.954 (0.04) ***
1.009 (0.08) *** 0.945 (0.06) ***
1.008 (0.06) ***
Patent applications >0 -0.777 (0.18) ***
-0.584 (0.29) ** -0.052 (0.24)
-0.637 (0.30) ** Patent grants (Log)
0.701 (0.05) ***
0.762 (0.08) ***
Patent grants >0
0.511 (0.21) **
0.561 (0.24) **
Age (Log) -0.021 (0.07)
-0.307 (0.13) ** 0.030 (0.09)
-0.223 (0.11) ** -0.506 (0.14) *** -0.023 (0.10) Size (Log(Employees)) 0.020 (0.05)
0.133 (0.11)
-0.109 (0.07)
0.040 (0.08)
0.150 (0.11)
-0.179 (0.07) **
US firm 0.427 (0.12) *** 0.017 (0.18)
0.313 (0.15) ** 0.495 (0.15) *** 0.152 (0.17)
0.317 (0.14) **
Manufacturing sector 0.583 (0.08) *** 0.057 (0.13)
0.365 (0.23)
0.547 (0.09) *** 0.382 (0.17) ** 0.453 (0.15) *** R&D expend. (yes/no) -0.278 (0.37)
-0.442 (0.60)
0.233 (0.30)
-0.048 (0.44)
-0.312 (0.62)
0.527 (0.33)
R&D staff (in %) 1.741 (0.11) *** 0.886 (0.32) *** 0.858 (0.25) *** 1.680 (0.16) *** 0.890 (0.20) *** 1.006 (0.22) ***
CEO has a degree -0.436 (0.32)
0.047 (0.31)
0.010 (0.20)
-0.691 (0.29) ** -0.113 (0.28)
-0.049 (0.19) University spin-off 0.128 (0.12)
0.070 (0.28)
-0.147 (0.31)
0.198 (0.24)
-0.001 (0.19)
-0.190 (0.18)
Market size 0.037 (0.10)
0.281 (0.18)
-0.150 (0.08) * 0.004 (0.16)
0.249 (0.11) ** -0.179 (0.11) *
Expected growth 0.023 (0.04)
-0.227 (0.09) ** -0.208 (0.07) *** -0.107 (0.07)
-0.367 (0.12) *** -0.177 (0.09) ** Product dev. time -0.055 (0.05)
0.059 (0.07)
-0.061 (0.05)
-0.068 (0.05)
0.105 (0.06) * -0.078 (0.06)
Competitors (Log) 0.030 (0.08)
0.186 (0.12)
-0.069 (0.09)
0.029 (0.12)
0.181 (0.14)
0.030 (0.11)
Intercept -0.207 (0.66)
0.503 (0.81)
0.908 (0.59)
0.461 (0.91)
1.210 (0.88)
0.973 (0.74) Not patenting
(zero inflation)
VC/BA investment 0.057 (0.47)
-1.003 (0.94)
-1.501 (0.74) ** 1.005 (0.99)
-0.274 (0.78)
-0.177 (0.47) Patent applications (Log) -0.128 (0.28)
-0.410 (0.26)
-0.658 (0.30) **
-0.308 (0.27)
Patent applications >0 -2.340 (0.78) ***
-2.577 (0.60) *** -2.074 (1.05) **
-2.831 (0.75) ***
Patent grants (Log)
-0.531 (0.17) ***
-0.503 (0.23) ** Patent grants >0
-1.217 (0.26) ***
-1.418 (0.36) ***
Age (Log) -0.148 (0.13)
-0.123 (0.13)
-0.033 (0.15)
-0.202 (0.21)
-0.178 (0.14)
0.057 (0.18)
Size (Log(Employees)) -0.179 (0.09) * 0.002 (0.08)
-0.007 (0.11)
-0.221 (0.15)
-0.042 (0.09)
-0.076 (0.11) US firm 0.087 (0.19)
-0.399 (0.19) ** -0.352 (0.22)
0.204 (0.31)
-0.335 (0.19) * -0.262 (0.24)
Manufacturing sector 0.173 (0.21)
-0.204 (0.19)
0.009 (0.25)
0.279 (0.30)
0.022 (0.22)
0.123 (0.23)
R&D expend. (yes/no) -0.687 (0.24) *** -0.483 (0.23) ** -0.672 (0.30) ** -0.967 (0.48) ** -0.563 (0.29) * -0.657 (0.31) **
R&D staff (in %) 0.714 (0.53)
-0.358 (0.54)
1.573 (0.72) ** -0.187 (0.70)
-1.005 (0.62)
1.041 (0.69)
CEO has a degree -0.351 (0.22)
0.302 (0.22)
0.334 (0.23)
-0.571 (0.39)
0.277 (0.21)
0.204 (0.24) University spin-off -0.440 (0.52)
0.362 (0.50)
0.473 (0.74)
0.061 (0.91)
-0.094 (0.62)
0.053 (0.66)
Market size -0.285 (0.13) ** -0.272 (0.12) ** -0.357 (0.13) *** -0.417 (0.17) ** -0.274 (0.13) ** -0.389 (0.14) ***
Expected growth -0.035 (0.10)
-0.094 (0.08)
-0.157 (0.12)
-0.140 (0.14)
-0.099 (0.09)
-0.121 (0.13) Product dev. time -0.260 (0.09) *** -0.134 (0.08) * -0.194 (0.11) * -0.328 (0.14) ** -0.129 (0.10)
-0.197 (0.12) *
Competitors (Log) 0.067 (0.09)
0.087 (0.07)
0.051 (0.09)
0.060 (0.14)
0.111 (0.09)
0.103 (0.10)
Intercept 3.691 (0.77) *** 3.130 (0.67) *** 3.679 (0.89) *** 5.136 (1.32) *** 3.348 (0.77) *** 3.423 (0.91) ***
VC/BA investment
Patent applications (Log) -0.089 (0.08)
-0.090 (0.09)
-0.115 (0.09)
-0.108 (0.09)
Patent applications >0 0.592 (0.21) ***
0.582 (0.21) *** 0.660 (0.21) ***
0.635 (0.21) *** Patent grants (Log)
-0.168 (0.13)
-0.242 (0.12) **
Patent grants >0
0.371 (0.25)
0.437 (0.24) *
Age (Log) -0.338 (0.09) *** -0.343 (0.09) *** -0.315 (0.10) *** -0.302 (0.10) *** -0.306 (0.10) *** -0.304 (0.10) *** Size (Log(Employees)) 0.206 (0.07) *** 0.196 (0.06) *** 0.205 (0.07) *** 0.184 (0.07) ** 0.184 (0.07) *** 0.177 (0.07) **
US firm -0.327 (0.14) ** -0.310 (0.14) ** -0.319 (0.14) ** -0.374 (0.15) ** -0.336 (0.15) ** -0.357 (0.15) **
Manufacturing sector -0.381 (0.13) *** -0.343 (0.13) ** -0.375 (0.13) *** -0.356 (0.14) ** -0.346 (0.15) ** -0.366 (0.14) ** R&D expend. (yes/no) 0.455 (0.21) ** 0.478 (0.21) ** 0.439 (0.21) ** 0.733 (0.26) *** 0.770 (0.26) *** 0.758 (0.26) ***
R&D staff (in %) 0.656 (0.32) ** 0.864 (0.33) *** 0.664 (0.34) ** 0.808 (0.35) ** 1.016 (0.34) *** 0.795 (0.35) **
CEO has a degree 0.352 (0.17) ** 0.348 (0.17) ** 0.352 (0.17) ** 0.358 (0.18) ** 0.355 (0.18) ** 0.355 (0.18) ** University spin-off 0.458 (0.34)
0.508 (0.34)
0.490 (0.32)
0.308 (0.33)
0.353 (0.37)
0.291 (0.35)
Market size 0.218 (0.09) ** 0.226 (0.09) ** 0.218 (0.09) ** 0.182 (0.10) * 0.211 (0.10) ** 0.194 (0.10) *
Expected growth 0.025 (0.07)
0.014 (0.07)
0.032 (0.07)
0.065 (0.08)
0.051 (0.08)
0.048 (0.08) Product dev. time 0.045 (0.07)
0.058 (0.07)
0.048 (0.07)
0.045 (0.07)
0.062 (0.07)
0.054 (0.07)
Competitors (Log) -0.056 (0.07)
-0.068 (0.07)
-0.055 (0.07)
-0.015 (0.08)
-0.030 (0.08)
-0.011 (0.08)
Intercept -2.027 (0.49) *** -1.946 (0.48) *** -2.107 (0.50) *** -2.489 (0.55) *** -2.487 (0.56) *** -2.461 (0.55) ***
Var( ) 1.517 (0.19) *** 0.515 (0.08) *** 0.435 (0.07) *** 1.405 (0.18) *** 0.594 (0.11) *** 0.395 (0.09) ***
-0.296 (0.17) ** 0.137 (0.42)
0.264 (0.26)
-0.676 (0.22) *** -0.358 (0.33)
-0.364 (0.15) ***
-0.195 (0.03) *** -0.291 (0.12) *** -0.306 (0.12) *** 0.227 (0.06) *** -0.167 (0.08) ** 0.167 (0.16)
Observations 940
940
940
888
888
888 Wald test 11084
9115
12232
11664
8187
12486
P-value 0.000
0.000
0.000
0.000
0.000
0.000
Log likelihood -980.7
-864.6
-775.8
-864.9
-751.3
-678.2