Leadership Agility Leadership Agility Leadership Agility 360™

Coaching for learning agility: The importance of leader behavior, learning goal orientation, and
psychological safety
Ginevra A. O. Drinka
Submitted in partial fulfillment of the requirements for the degree of Doctor of Philosophy under
the Executive Committee of the Graduate School of Arts and Sciences
Columbia University
2018

© 2018
Ginevra A. O. Drinka
All rights reserved

ABSTRACT
Coaching for learning agility: The importance of leader behavior, learning goal orientation, and
psychological safety
Ginevra A. O. Drinka
The present research explored associations between potential antecedents of subordinate
learning agility and subordinate performance (perceived manager coaching behavior, subordinate
learning goal orientation, and perceived manager-subordinate psychological safety). Two studies
were conducted: one in a healthcare organization and another using crowd-sourced data. Findings
demonstrated significant associations between study constructs. Specifically, structural equation
modeling and regression results demonstrated that perceived manager coaching behavior was
associated with perceived manager-subordinate psychological safety and with subordinate learning
agility. Analyses also established that subordinate learning goal orientation was associated with
subordinate learning agility. Additionally, results demonstrated that perceived manager-subordinate
psychological safety was associated with subordinate learning agility. Finally, results did not verify
an association between subordinate learning agility and subordinate performance, although this may
have been due to methodological issues rather than empirical ones. Future research should assess
causal mechanisms, other antecedents, and contextual elements such as the level of change in an
organization. A fuller study of these constructs may provide more understanding of the importance
of learning agility in the workplace. Implications for organizations are discussed.

i
TABLE OF CONTENTS
LIST OF TABLES........................................................................................................ iii
LIST OF FIGURES...................................................................................................... v
ACKNOWLEDGEMENTS.......................................................................................... vi
DEDICATION............................................................................................................. viii
CHAPTER I: PROBLEM AND PURPOSE............................................................... 1
CHAPTER II: LITERATURE REVIEW AND HYPOTHESES............................... 7
Learning agility and performance...................................................................................................... 7
The importance of psychological safety........................................................................................... 13
The importance of leader and manager coaching behavior.......................................................... 17
Learning goal orientation and learning agility.................................................................................. 22
CHAPTER III: METHOD.......................................................................................... 24
Organizational sample participants................................................................................................... 24
Organizational sample procedure...................................................................................................... 25
Organizational sample measures....................................................................................................... 26
Crowd-sourced sample participants.................................................................................................. 27
Crowd-sourced sample procedure.................................................................................................... 27
Crowd-sourced sample measures...................................................................................................... 28
CHAPTER IV: RESULTS............................................................................................ 29
Organizational sample results............................................................................................................ 29
Reliability analysis – Organizational sample.................................................................................... 29
Covariate analysis – Organizational sample..................................................................................... 29
Hypothesis testing – Organizational sample................................................................................... 31
Crowd-sourced sample results........................................................................................................... 35

ii
Reliability analysis – Crowd-sourced sample................................................................................... 35
Covariate analysis – Crowd-sourced sample.................................................................................... 35
Hypothesis testing – Crowd-sourced sample.................................................................................. 36
Exploratory analyses............................................................................................................................ 38
Organizational sample.................................................................................................. ....................... 38
Crowd-sourced sample........................................................................................................................ 39
CHAPTER V: DISCUSSION....................................................................................... 40
Overview............................................................................................................................. ................... 40
Directions for future research............................................................................................................ 41
Limitations............................................................................................................................. ................ 43
Implications for organizations........................................................................................................... 44
REFERENCES............................................................................................................. 46
APPENDICES.............................................................................................................. 53
Appendix A: Informed consent and participant’s rights script – Organizational sample........ 53
Appendix B: Informed consent and participant’s rights script – Crowd-sourced sample........ 55
Appendix C: Letter of intent and express permission from organization................................... 57
Appendix D: Institutional Review Board approval........................................................................ 58
Appendix E: Stimulus materials......................................................................................................... 59

iii
LIST OF TABLES
DESCRIPTION PAGE
TABLE 1 Learning agility dimensions.............................................................................. 61
TABLE 2 Learning agility sample items........................................................................... 62
TABLE 3 Performance data collected for corresponding job types............................ 63
TABLE 4 Organizational sample study variable correlations....................................... 64
TABLE 5 (a-c) Organizational sample job status ANOVAs for study outcomes.............. 65
TABLE 6 (a-c) Organizational sample job type ANOVAs for study outcomes................ 66
TABLE 7 Effect of learning agility on performance controlling for job type............ 67
TABLE 8 Effect of psychological safety on learning agility controlling for
job type................................................................................................................
68
TABLE 9 Psychological safety as a potential mediator between learning agility
and performance................................................................................................
69
TABLE 10 Effect of manager coaching behavior on psychological safety
controlling for job type.....................................................................................
70
TABLE 11 Psychological safety as a potential mediator between manager coaching
behavior and learning agility............................................................................
71
TABLE 12 Effect of manager coaching behavior on leaning agility controlling for
job type................................................................................................................
72
TABLE 13 Effect of learning goal orientation on learning agility controlling for job
type.......................................................................................................................
73
TABLE 14 Crowd-sourced sample study variable correlations...................................... 74
iv
TABLE 15 (a
& b)
Crowd-sourced sample job status ANOVAs for study outcomes............. 75
TABLE 16 Effect of psychological safety, manager coaching behavior, and
learning goal orientation on learning agility controlling for employment
status, education level & job level...................................................................
76
TABLE 17 Effect of manager coaching behavior on psychological safety
controlling for employment status, education level & job level.................
77
TABLE 18 Mediation of manager coaching behavior to learning agility...................... 78
TABLE 19 Model R2 values.................................................................................................. 79
TABLE 20 Organizational sample: Effect of learning goal orientation x
psychological safety on learning agility controlling for job type................
80
TABLE 21 Crowd-sourced sample: Effect of learning goal orientation x
psychological safety on learning agility controlling for job type................
81

v
LIST OF FIGURES
DESCRIPTION PAGE
FIGURE 1 A model of interpersonal learning processes in organizations....................... 82
FIGURE 2 Edmondson’s (1999) model of team learning................................................... 83
FIGURE 3 Overview of data collection process................................................................... 84
FIGURE 4 Q-Q performance plot – Organizational sample.............................................. 85
FIGURE 5 Q-Q learning agility plot – Organizational sample........................................... 86
FIGURE 6 Q-Q learning goal orientation plot – Organizational sample......................... 87
FIGURE 7 Q-Q psychological safety plot – Organizational sample................................. 88
FIGURE 8 Q-Q manager coaching behavior plot – Organizational sample.................... 89
FIGURE 9 Summary of study results – Organizational sample......................................... 90
FIGURE 10 Q-Q learning agility plot – Crowd-sourced sample.......................................... 91
FIGURE 11 Q-Q psychological safety plot – Crowd-sourced sample................................ 92
FIGURE 12 Q-Q learning goal orientation plot – Crowd-sourced sample........................ 93
FIGURE 13 Q-Q manager coaching behavior plot – Crowd-sourced sample................... 94
FIGURE 14 Summary of study results – Crowd-sourced sample........................................ 95
FIGURE 15 Proposed model of interpersonal learning processes in
Organizations..........................................................................................................
96

vi
ACKNOWLEDGEMENTS
It is hard to synthesize this learning journey and put it into words. I remember, while
studying for my master’s degree at University College London, feeling incredibly bogged down and
overwhelmed by where to start with a research question and how to relevant statistics to articulate
my findings. At that point I felt completely lost in all the numbers, requirements for APA
formatting, and I did not think I had the ability to ask relevant original questions. However, during
the last five years I have undergone a professional transformation to get me to a place in which I feel
confident and secure in my knowledge and my ability to provide value to organizations and the
people in them.
My interests in organizational psychology remain diverse. I am so glad I have engaged in
several different content and research areas that have allowed me the opportunity to explore
diversity and inclusion, cognitive structures, as well as individual difference/personality traits and
assessments specifically for this dissertation.
I am immensely grateful to the faculty and staff within the Social-Organizational Psychology
program at Teachers College for their inspiration and guidance. W. Warner Burke has provided me
with a sounding board over the years and I am so thankful for his support and copious knowledge in
this area of literature. Caryn Block has also been very important to me during this journey – her
challenging and thoughtful critiques have enabled me to feel confident and competent in designing
research studies. Debra Noumair and William Pasmore have been instrumental in helping me think
about the broader implications of research findings and how to convey them to people in
organizations. Kate Roloff was influential in helping me to formulate my research question and
providing guidance on the relevant literature. Other important support has been provided by John
Handal, Ambar Urena, and Lebab Fallin. The hours they have spent aiding doctoral students does
not go unnoticed – thank you!

vii
The psychological safety I have experienced in both my personal life and within the broader
doctoral community has enabled me to complete this task. My parents have both urged and
supported me to pursue this degree from an early age and I am so happy to be able to make them
proud. My husband, Jonathan, has sustained me in more ways than he can possibly know. Going
through this experience has been nearly as challenging for him as it has been for me and I am
immensely grateful for him. My cohort – Ariel Bernstein, Joe Dillard, and Danielle Pfaff – have
been supportive and encouraging. While I was living in New York, they felt like a second family.
Together, we have experienced both highs and lows throughout our time in the doctoral program
and I am so thankful for their friendship as well as the fact that they have been important sources of
academic collaboration and intellectual stimulation. Lauren Catenacci-Francois, while not a member
of my cohort might as well be, because her friendship and support has been very meaningful to me,
especially in the later years of my time in the doctoral program. Getting lunch and coffee with her
while talking shop (as well as life in general!) has been so helpful and has provided an opportunity
for much needed stress relief through laughter. Other former and current students Dyan Ferraris,
Rachel Fudman, Asha Gipson, Jenny Kim, Dave Mendelsohn, DeMarcus Pegues, Brad Smith,
Naomi Stutzman, and others, have made the program and my time in it meaningful – both for the
friendship they have offered as well as their knowledge of the content. I also count myself lucky to
have such a strong group of friends back on the West Coast who have provided so much stress
relief over the past few years: Matt, Patrick, Anna, Megan, and Alicia. Thank you to all!

viii
DEDICATION
For my husband, Jonathan, and my parents, Barbara & George, who have taught me about the true meaning of psychological safety.

1
Chapter I: Problem and Purpose
Organizations are facing the need to change today more rapidly than ever before. Recent
change in the external environment has created several new streams of research that have
demonstrated the importance of the ability to learn quickly and to adequately deal with this shifting
environment (Dai, De Meuse, & Tang, 2013; DeRue, Ashford & Myers, 2012; De Meuse et al., 2011;
Lombardo & Eichinger, 2000; Mitchinson, Gerard, Roloff, & Burke, 2012). Indeed, the study of
learning agility, the ability to quickly physically or mentally reconfigure activities in light of change as
new needs arise, suggests that learning agility could be critical to differentiating between average and
high potential employees. Furthermore, it may help organizations make the best possible decisions
about all employees in both selection and development contexts (Lombardo & Eichinger, 2000;
Mitchinson et al., 2012).
While research in the area of learning agility is relatively new, researchers have begun to learn
several important lessons. Learning agility is an important construct due to its purported link with
performance. Indeed, one study recently showed a link between learning agility and performance
(Smith, 2015). A meta-analysis on outcomes related to learning agility also supported this
association (De Meuse, 2017). Additionally, in another recent study (Drinka, Catenacci & Burke,
2016), goal orientation was associated with learning agility as theorized by other researchers (DeRue
et al., 2012), which may further provide support for the link between performance and learning
agility and demonstrate that one’s mindset going into a task has an impact on one’s performance in
that task.
The construct of learning agility itself is becoming clearer due to an increased research focus. A
research team at Teachers College, Columbia University proposed that learning agility can be
understood via the measurement of 38 specific behavioral practices (Burke et al., 2016). These
behavioral practices can be further described by nine behavioral dimensions: Seven dimensions

2
measure “learning” processes, and the remaining two dimensions measure “agility.” The learning
dimensions cover feedback seeking, information seeking, interpersonal risk-taking, collaborating,
performance risk-taking, reflection, and experimenting behavior. The agility dimensions describe
speed and flexibility as important facets of behavior that influence one’s learning agility capacity.
While learning agility is becoming better understood than ever before, antecedents and
contextual elements are not as well defined and remain relatively unknown. Several models have
been proposed in the learning agility and psychological safety literatures that may help shed light on
the contextual and antecedent elements of learning agility. DeRue et al. (2012) noted that individual
differences, such as learning goal orientation, are important antecedents to consider. Learning goal
orientation, a personality trait, is the capacity to view opportunities as a desired challenge in order to
demonstrate capabilities. Carol Dweck’s seminal (1986) work, when applied to organizations,
demonstrated that people with a high degree of learning goal orientation are more likely to be high
performers (Colquitt & Simmering, 1998). Originally, she conducted her research on children and
posited that there are two distinct motivational processes that undergirded how individuals achieve
goals and how they view those goals. One of these processes is known as having a learning goal
orientation, in which individuals seek to increase their competence and knowledge in a particular
task domain out of the genuine desire to learn more. The other process is known as having a
performance orientation in which individuals desire to gain positive judgments of their competence
in a task domain or strive to avoid negative judgments of their competence. When Dweck’s work
was applied to organizations, people with a learning goal orientation were more likely to perform
highly on tasks than their performance-oriented peers (Colquitt & Simmering, 1998).
Recent studies (e.g., Drinka et al., 2016) demonstrated significant associations between learning
goal orientation and learning agility, which may support the notion that when one has a mindset
intent upon learning when going into a specific task, one behaves in a way that is more learning

3
agile. However, the difference between these two constructs is unclear. At this juncture, learning
goal orientation is most likely a personality trait that is an antecedent of learning agility, although
further research seeks to understand this relationship to a greater extent.
Another important contextual element relates to psychological safety. Psychological safety is
defined as the belief among individuals on a team that engaging in interpersonal risk-taking is
acceptable (Edmondson, 1999). Furthermore, the belief is primarily a tacit one that is taken for
granted and usually not discussed explicitly. Edmondson’s work on teams has focused on general
contextual constraints needed for a leader to support his or her followers effectively. One factor
Edmondson takes into account is learning behaviors, which are similar to the 38 behavioral practices
defined by researchers at Teachers College. Indeed, Edmondson’s work showed that teams that
have a shared belief that their climate is psychologically safe are more likely to learn in the
workplace. Edmondson’s work on psychological safety was studied at the team level of analysis,
however, some work was done to understand psychological safety at the dyadic level of analysis
(Edmondson & Woolley, 2003). For example, this phenomenon can be extended to understanding
both the shared beliefs between a manager and subordinate or the perception of psychological safety
that a subordinate directs towards his or her manager. In a relationship characterized as having a
high degree of psychological safety, a subordinate might believe that he or she can propose solutions
that “push the envelope” to his or her manager in order to solve a particular problem.
Psychological safety has many practical implications. Edmondson (2004), and other scholars
before her (e.g., Argyris, 1993; Schein, 1993a) argued that psychological safety between a leader and
his or her subordinates has practical implications for the workplace. Early on, the construct was
rooted in research indicating that psychological safety was necessary for people to feel safe and able
to change. Argyris (1993) was interested in understanding how individuals and organizations could
learn from their actions. He proposed that a context in which individuals are able to say what they

4
really mean – that they do not fall into “defensive routines” in which people say whatever is the
politest thing to say – is important to organizational learning. He believed that people are likely to
behave in ways that reduce their learning when they see the threat of embarrassment. At the same
time, Schein (1993a) noted that “containment” is important for organizational learning, in which
people can express emotionality and tension without a detrimental impact on relationships.
Another important contextual element in the study of learning agility is the fact that one’s
manager or leader* may have an impact on a subordinate’s motivation to learn on-the-job. Further
research may be able to elucidate the ongoing dynamics between manager effectiveness and a
subordinate’s ability to learn. Some research has resulted in a better understanding of specific
behavioral styles that leaders exude (e.g., coaching) and how it may help subordinates learn
(Edmondson, 1999; Hackman & Wageman, 2005). A coaching stance links to learning agility
because when a manager enacts a coaching stance, subordinates may feel more interpersonally
supported and be able to learn more quickly. Part of this learning may be exhibited by feeling freer
to experiment with new ideas to solve problems, which is a critical component of learning agility.
Similarly, research shows that leaders who are empathetic and exhibit emotional intelligence have
more effective teams than leaders who do not demonstrate these traits (Hogan, Curphy & Hogan,
1994; Kellett, Humphrey & Sleeth, 2002). Finally, other applicable research relates to how leaders
influence the specific psychological states of followers in a way that supports risk-taking, a key facet
of learning agility (Amabile, Schatzel, Moneta, & Kramer, 2004). In Amabile and colleagues’ study,
perceived leader support was related to increased creativity in subordinates who worked on creative
* In the current study, the terms manager and leader are used interchangeably. They are used to refer to anyone who manages and/or leads people broadly. While there is a theoretical and practical distinction between the two (Kotterman, 2006), that is not the scope of the present research.
5
projects at seven different companies. Support was defined as perceived encouragement from a
leader.
While the efficacy of coaching in driving performance has been demonstrated in general (e.g.,
Smither et al., 2003), the specific behaviors managers engage in with their subordinates in order to
coach them to learn has not been studied extensively. Edmondson (1996; 1999) found that when
leaders are supportive and coaching-oriented, they were able to create a safe space that enables
learning. For example, in a study in hospitals, employees were more willing to report mistakes when
leaders adopted a particular behavioral style. These leaders reduced the climate of fear on the team
so that employees could discuss and identify problems and seek feedback from leaders that allowed
them to learn from their mistakes. When employees learned from their mistakes, they were likely to
perform at a higher level.
Other research on a similar topic has pointed to specific coaching behaviors that enhance
learning in a dyadic relationship (e.g., Parker, Hall & Kram, 2014). Parker, Hall & Kram focused
their work on peer coaches. While peer coaches have a different level of authority from manager
coaches that may have an impact on outcomes, their work may be illustrative because the coaching
process is a similar type of supportive dyadic relationship. Parker and colleagues found that when
peer coaches act out specific behaviors, they can drive learning through creating a safe holding
environment. Behaviors that may contribute to psychological safety were defined as honoring
confidentiality of discussion and mutually agreeing upon the scope of the engagement. They also
noted that effective peer coaches listened more than they spoke and were able to engage in
reflection with their peer coachee. Furthermore, effective peer coaches posed thoughtful questions
that surfaced assumptions rather than only giving advice. While this work is helpful to get a better

6
grasp of coaching behaviors, at this juncture, the nature of effective coaching behavior, especially in
a manager relationship, is not entirely clear.
In sum, organizational outcomes may be related to learning agility. Specifically, performance is
one of these that is considered in the present study, but performance may also be sub-divided
further to encompass other essential facets like complex problem solving and innovation. Other
antecedents may be related to learning agility, as well. At the individual level this may be composed
of personality dimensions like learning goal orientation as well as an employee’s level of experience
and development. Leadership may also have an impact on learning agility – for example, leaders
may be able to create psychological safety by coaching subordinates and also increase their learning
agility directly. Finally, while not the focus of this study, organizational culture, organizational
strategy, and the need to adapt may be other important factors that have an impact on learning
agility in organizations.
A key purpose of this research is to discern what coaching behaviors managers engage in with
their subordinates that drive effective performance. Coaching is an important behavioral style to
focus on because managers have a considerable impact on creating a climate of safety in which
learning behavior can take place. When managers support the learning of their subordinates, they
may help their subordinates grow, and subordinates may be more likely to create high quality work.
Furthermore, organizations might want to focus on this particular behavioral style in managers
because it can be increased through learning and development efforts. The impetus of this study
may demonstrate the need for leaders to coach for greater learning agility in their subordinates.
Finally, the purpose of this research is to develop a model to better understand the process of how
dyadic-level learning between a manager and subordinate occurs.
7
Chapter II: Literature Review and Hypotheses
Learning agility & performance
Our current understanding of learning agility came from earlier studies related to how employees
learn from experience. The capacity to learn quickly from experience sets high performing
employees apart from their peers. Two CCL studies found that when employees have powerful
experiences on-the-job, they are able take lessons from these experiences in order to increase their
long-term success (McCall, Lombardo & Morrison, 1988; Morrison, White & Van Velsor, 1992). In
the McCall et al. (1988) study, high-performing executives displayed similar patterns of behavior that
demonstrated their learning from particular job appointments. Examples of job assignments in
which executives demonstrated new learning were career transitions such as an increase in the scope
of their current assignment or moving from a line to a staff job. In the Morrison, White & Van
Velsor (1992) study, employees learned lessons that required new skills and they were more likely to
be successful. Those who failed to adapt to new experiences were more likely to become stuck and
were hindered from career progression. Later studies demonstrated similar findings.
One such study demonstrated the importance of learning from experience and was conducted
by Spreitzer, McCall & Mahoney (1997). They illustrated that learning in an expatriate sample was
related to employee ability to learn quickly from experience. Those managers and executives who
were decidedly curious, adventurous, and who enjoyed learning new things were more likely to be
higher performers than their peers. Specifically, these employees who initially paid the “price of
admission” to get initial attention from peers and superiors, in part by taking risks, were more likely
to be identified as being “high potential” to advance within the organization. Once in a new role, if
they took specific opportunities to learn, in part by learning from other cultures to understand new
ways of accomplishing tasks and by seeking out feedback, they were more likely to be successful in
the future. Finally, high-performing managers and executives were able to reflect on their
8
experience in order to further understand which behaviors were useful and which behaviors were
not in order to increase future effectiveness.
Lombardo & Eichinger (2000) noted in their research that those who learned from experience
tended to have more task variety from which to learn new things. In order to tackle new challenges,
leaders learned new skills and acquired new patterns of thinking. Successful leaders were more likely
to seek out feedback on what they could do to perform better in future. They also found that those
who experienced failure were unable to learn new things. Lombardo & Eichinger thought of the
high performers as “high learners.” They posited that these were people who had the capacity to
learn quickly in the face of changing situations.
In light of studies in which executives learn from experience, learning agility can been thought of
as the ability to reconfigure activities, either physically or mentally, to quickly meet changing
demands in the face of new tasks or a shifting environment. Individuals who possess a high level of
learning agility engage in behaviors that help them both efficiently execute and thoughtfully learn in
unfamiliar contexts. Put succinctly, these individuals are both adept at understanding the
requirements of a specific task and can quickly and flexibly deploy a solution that works. Learning
agility is more than just trial-and-error learning to throw a solution at a problem until something
works: It involves taking in new information from one’s environment through feedback,
collaboration with others, and keeping up-to-date with emerging trends, as well as other strategies,
to make an informed decision about what will work and making that decision quickly.
In consideration of previous studies, several researchers have worked to develop a tool to
measure what they purport to be learning agility. De Meuse et al. (2011) and Dai et al. (2013)
developed a tool to measure learning agility that was linked to some performance outcomes,
however, their tool was not theoretically grounded in a current understanding of learning agility
(DeRue et al., 2012). Several criticisms have been lodged against this specific assessment. One

9
criticism is that a dimension (“results agility”) appears to confound purported learning agility with
performance. Many of the items that measure learning agility appear to also tap into performance
directly, giving the impression that their measure of learning agility is not assessing the construct
itself. This issue poses a challenge in order to accurately gauge content validity. Additionally, the
measure is problematic when considering whether learning agility is a unique construct that predicts
performance. For example, a sample item is “Performs well under first-time conditions.” Clearly,
this item taps into the perception of performance. The other criticism with this tool is that it is not
behavioral in nature and therefore, it is not well positioned for those seeking to change their learning
agility through development.
DeRue and colleagues (2012) proposed a more comprehensive model of learning agility. They
indicated that several important processes – learning from experience and unlearning challenging
patterns of behavior effectively, for example, undergird learning agility. Additionally, they asserted
that both cognitive and behavioral processes are factors that should be considered. Specifically,
important cognitive processes are cognitive simulations, counterfactual thinking and pattern
recognition. Cognitive simulations are similar to visualization: A cognitive process that allows
individuals to think about situations they may encounter in the future in which they can build upon
and experiment with considering their previous experience. Cognitive simulations are significant
because they allow people to think about behavioral strategies they can use in future situations.
Counterfactual thinking, another cognitive process, is a retrospective form of cognitive simulation.
It allows individuals to generate ideas to help them understand why a particular outcome might have
occurred and also allows them to strategize about how to change their behavior for the next time
they encounter such a situation. Finally, pattern recognition is a process through which individuals
detect commonalities of relationships when they are faced with large amounts of complex
information. When individuals quickly perceive patterns within a complex array of information,

10
they can apply their learning to the next situation. Individuals who are adept in recognizing patterns
quickly may be able to apply the information they have gleaned from previous experience to similar
situations. Therefore, an individual who has these capacities may be able to apply lessons they have
learned from patterns they have perceived across a broad range of experiences and situations.
Understanding cognitive factors are important in order to understand how learning agility works;
also important in DeRue and his colleagues’ model of learning agility are behavioral processes. The
behavioral processes that play a role and are potential ingredients are feedback seeking,
experimentation and reflection, similar to dimensions of the model developed at Teachers College.
These cognitive and behavioral factors work in concert to influence one’s learning agility capacity.
A behavioral model to explain learning agility was developed by a team of researchers at
Teachers College into a 38-item inventory (Burke et al., 2016). The authors who developed this
assessment conceptualize learning agility as a unique construct – one that sits at the intersection of
personality traits, cognitive constructs, and behavioral tendencies. The measure is based on nine
dimensions of learning agility. The authors of this learning agility model conceived of seven
dimensions that measure “learning”, and the remaining two dimensions that measure “agility” for a
nine-factor model. The learning dimensions are as follows: information seeking, feedback seeking,
performance risk-taking, reflecting, experimenting, interpersonal risk-taking and collaborating.
Additionally, the agility dimensions are speed and flexibility. The learning factors can be further
defined (Burke et al., 2016); please see Table 1. For examples of each dimension, please see sample
items in Table 2.
A unique aspect of this model is that test-makers developed it for individuals to become more
aware of and develop their ability for learning agility over time. Part of how the tool seeks to do this
is through providing developmental feedback on specific behavioral dimensions. Once assessed, an
individual is scored as being either low, average, or high on each of the nine dimensions and

11
corresponding feedback is disseminated so that the test-taker can modify his or her behavior on
each dimension. Then, the individual can 1) become more aware of their behavior in order to
develop their ability over time and 2) become more aware of the effort they put into tasks in order
to increase their learning agility (both of which, effort and ability, are known to have a significant
impact on performance (Anderson & Butzin, 1974)).
Another vein of research that is relevant to the broader discussion of learning agility relates to
innovation and creativity. A good deal of research has pointed to the finding that when leaders
engage in specific behaviors, they can drive follower performance through innovation (e.g., Amabile,
Schatzel, Moneta and Kramer, 2004; Howell & Avolio, 1993; Krause, 2004). Howell & Avolio
(1993) measured the impact of perceived supportive leader behavior on subordinate innovation
behavior using items that asked about, among other things, the extent to which leaders had coached
subordinates. Perceived leader support was significantly associated with an increase in performance.
This relationship was moderated by an increase in support for innovation. Amabile, Schatzel,
Moneta and Kramer (2004) found that perceived leader support was essential in helping followers
innovate. Supportive leader behaviors encompassed activities like providing encouragement for a
subordinate overseeing a project and providing clear goals to complete necessary work. A similar
finding was supported by work by Krause (2004) who found that when leaders granted autonomy
and freedom and used expert knowledge and information, their subordinates engaged in innovation
behavior more frequently.
The research on innovation and creativity is important because there are several parallels with
research on learning agility. The psychological state an individual is in when they innovate can be
characterized as being learning agile. Specifically, innovative behaviors are described as a process in
which individuals explore opportunities to innovate, for example, through gathering information
(Klysen & Street, 2001) – similar to the information seeking dimension in the Teachers College nine-

12
factor learning agility model. When an individual innovates, he or she engages in formative
investigation – a process by which a person formulates ideas, experiments with them, and evaluates
them. This process is similar to the experimentation dimension of the nine-factor learning agility
model. Additionally, the whole process of innovating can be characterized as risky – indeed, when
someone innovates they do not know the outcome of their proposed new solution (Krause, 2004).
For this reason, the innovation process is similar to the performance risk-taking dimension in the
nine-factor model. Furthermore, when individuals engage in innovation behavior, performance
typically increases (e.g., Gong, Huang & Farh, 2009). Gong, Huang & Farh (2009) found that
employee innovation (measured as the extent to which employees were perceived as creative and
developed custom-made services for clients) was related to an increase in sales (performance) and
supervisors also rated employees as being more productive. Taken together, these studies
demonstrate a clear association between learning agility and innovation.
Other research has explicitly tied learning agility to performance. Smith (2015) empirically
linked the model of learning agility developed at Teachers College to performance in the financial
services industry. He demonstrated that there were significant associations between a leader’s ability
to be learning agile and performance on-the-job. Additionally, in a recent meta-analysis, De Meuse
(2017) noted that based on Smith (2015) and other studies, there is a robust relationship between
leader performance and learning agility. In De Meuse’s (2017) meta-analysis, he reviewed 19 field
studies that examined the associations between learning agility and leader success. He found that
there is a relationship between learning agility and both leader performance and leader potential on
the magnitude of nearly r=0.50 for both indicators of leader success. In these studies, it should be
noted that tasks that individuals were rated on, as part of their performance in a particular role, were
likely to be complex tasks. For example, in the De Meuse meta-analysis, he noted that performance
could be indicated by the number of promotions over a period of time. In order to be promoted,
13
one surely has to perform well at a range of complex tasks. In other studies, as part of the meta-
analysis, competency ratings were used to understand leader success. The tasks that individuals
engaged in were not rote nor were they repetitive. Instead, they were complicated and required
synthesis of information from multiple sources to make informed decisions. In these circumstances,
learning agility is likely to be associated with performance.
Hypothesis 1: Subordinate learning agility is positively associated with subordinate performance. Those individuals
with high learning agility are likely to have associated high performance.
For a model of interpersonal learning processes in organizations, please see Figure 1. The model
is a process that may occur over time in line with study hypotheses.
The importance of psychological safety
In order to fully develop one’s capacity to be learning agile, several antecedent elements need to
be better understood. One of these antecedents is psychological safety. Kahn (1990) defined
psychological safety as, "being able to show and employ one's self without fear of negative
consequences of self-image, status or career" (p. 708) and noted its importance in promoting
workplace engagement. Later on, Argyris (1993) and Schein (1993a) argued the importance of
psychological safety for learning and for facilitating teamwork. They posited that a climate in which
an individual feels psychologically safe enables him or her to have learning-oriented conversations
with others. They also said that a psychologically safe climate is necessary in order for learning and
information transfer to occur between individuals in a group. Elaborating on this point, Schein
(1993b) stressed the importance of psychological safety in order to learn – because learning cannot
occur when an individual is highly anxious or fearful about task failure:

14
For change to happen, people have to feel psychologically safe; that is, they have to see a
manageable path forward, a direction that will not be catastrophic. They have to feel that a
change will not jeopardize their current sense of identity and wholeness. They must feel that new
habits are possible, that they can learn something new.
Edmondson (1999; 2003) noted that several factors underlie her definition of psychological
safety. Psychological safety, in large part, depends on others: when one feels psychologically safe, he
or she relies on others who will continue to trust him or her, even if an error arises. Additionally,
psychological safety spans very narrow temporal boundaries. It covers interactions between
individuals in the short-term when one interacts with another in a particular manner. It describes an
interpersonal sense of safety that emerges over a short period of time for a given group of people.
Psychological safety can vary across a group – for example, one group member may feel very safe in
a particular group, and another may not. In other groups, the level of psychological safety may be
more uniform.
Psychological safety mat be most potent at the group level of analysis. Edmondson (1999; 2004)
developed a model of team-level learning that links psychological safety to specific learning
behaviors in order to maximize information transfer within a group. Please see figure 2 for her
original model. Argyris (1993) and Schein (1993b) originally argued that the importance of
psychological safety is relevant for information transfer within a group. Schein noted that
The key to reducing anxiety in organizations is based on the psychological fact that it is easier to
tolerate anxiety in the presence of sympathetic others than alone. To speed up learning,
therefore, we must create psychological safety by creating … systems in which to develop new
norms that favor learning, and these…systems must be built around supportive groups that help
to contain and reduce anxiety… the anxieties inherent in this new learning are manageable only

15
if they are shared and managed jointly in a group that is accountable for the organization's
ultimate welfare. A trusting group can help leaders to own up to and deal with their anxieties,
which is a necessary process if realistic planning and learning are to take place.
While psychological safety is usually studied at the group level of analysis because it is a group
phenomenon (Edmondson & Lei, 2014; Frazier et al. 2017; Newman, Donohue & Eva, 2017).
Some studies have measured it by examining only manager-subordinate dyads. Such research has
captured the perception that one individual may have about how their manager’s behavior had an
impact on their individual feelings of safety. One problem with this is that it may miss out on the
feelings the entire group shares, and it may also not take into account how peers and other team
members may make an individual safe. For example, asking about an individual’s perception of
psychological safety in terms of how their manager behaves may neglect to understand the notion
that a peer can have an impact on another individual’s perception of psychological safety within the
same team. Edmondson and Wooley (2003) carried out research by examining perceptions through
a dyadic level of analysis in order to understand learning and information transfer between a
subordinate and manager. They noted that, “if the interpersonal climate is characterized by
psychological safety, individuals are more likely to experiment with new behaviors, ideas, or tools.
Thus, an interpersonal climate in which it is safe to take the risks involved for learning is critical to
encouraging new behaviors” (p. 5). This justified the use of the construct at the dyadic level.
Furthermore, while scholars argue that understanding psychological safety may be the most potent
at the team level (Newman et al., 2017), researchers have measured it at the individual level, in which
individuals are asked to recall their perceptions of team-level psychological safety based on
Edmondson & Wooley’s (2003) measure (Carmeli & Gittell, 2009; Carmeli, Reiter-Palmon, & Ziv,
2010; Madjar & Ortiz-Walters, 2009).

16
Another important dimension of psychological safety is that it provides an opportunity to learn
from mistakes. According to Schein (1993b), this is essential. He noted that
The culture of management is built around the assumption that mistakes will occur but that one
should not make the same mistake twice. To learn a complex new skill, however, we will make
mistakes over and over again as we practice and slowly get better. To speed up this kind of
learning we have to provide practice fields and coaching in a psychologically safe environment.
De Meuse et al. (2010) also noted that when one learns from experience, he or she may very well
fail. When failure is added to a culture that punishes people for making errors, this context for
learning can have a negative impact upon one’s motivation to learn. Indeed, research has found that
in organizations in which failure is tolerated so that individuals can learn from the experience to
quickly root out errors, performance is higher. In this particular research, toleration of failure was
defined as the ability to talk about failure and communicate how to remedy it with others on one’s
team (Van Dyck et al, 2005). Taken together, individuals who want to learn from failure, especially
quickly and from experience, need to feel psychologically safe.
Hypothesis 2: Perceived manager-subordinate psychological safety is positively associated with subordinate learning
agility. Manager-subordinate relationships with higher perceived psychological safety are more likely to be associated
with higher subordinate learning agility.
Psychological safety, a construct that can characterize the beliefs about the relationship
between subordinate and manager, may not play a direct role in shaping individual outcomes like
subordinate performance (Edmondson, 1999, Edmondson & Lei, 2014; Frazier et al. 2017; Newman
et al., 2017). Instead, psychological safety allows the subordinate to take the necessary steps in order

17
to accomplish the work they need to be effective in their role. Therefore, learning agility may
mediate the effects of psychological safety on performance outcomes.
Research on innovation may help to explain the mechanisms behind this potential mediation.
Baer & Frese (2003) noted that psychological safety is related to firm performance. They also
argued that psychological safety is a key ingredient needed for innovation. Given the link between
innovation, risk-taking, and other learning agility dimensions, these factors might be indicative of the
importance of the presence of learning and its relationship with psychological safety in order to yield
performance.
Hypothesis 3: Subordinate learning agility mediates the relationship between perceived psychological safety and
subordinate performance.
The importance of leader and manager coaching behavior
Research has supported the finding that coaching is important for predicting learning and
performance (Smither et al., 2003) however, the exact behaviors managers engage in to encourage
their subordinates’ performance are not as well understood. Coaching behaviors may be an
antecedent for subordinate beliefs of psychological safety about the manager-subordinate
relationship. Edmondson (1996; 1999; 2004) noted that the coaching behaviors a manager engages
in with his or her subordinates predicted beliefs about the psychological safety of the relationship,
that enhanced group learning. Specifically, she found that leaders who were coaching-oriented,
provided support, and were non-defensive in receiving feedback from others in order to create a
safe environment were most supportive of learning. In the same vein, Marsick & Watkins (2001)
established that informal and supportive learning processes, like coaching, that they call “informal
and incidental learning” is an important process for adults to engage in to help review and expand

18
their learning. In their research, coaching provided an avenue for individuals to review learning
needs. Their learning could be taken for granted but can be probed and then explored and
expanded. Informal learning processes, like those that take place in coaching relationships, can be
classified as having the following characteristics: They are integrated into daily routines, they are an
inductive process of reflection and action, and they are linked to learning through others.
In the innovation literature, Amabile et al. (2004) examined specific behaviors leaders enact to
create environments characterized as being psychologically safe, that in turn allowed their
subordinates to take risks and innovate. Some of these specific behaviors the researchers observed
and termed were the following: Showing support for a team member’s actions or decisions, helping
alleviate stressful situations for subordinates, maintaining regular contact with and providing general
guidance to subordinates, disclosing personal information, reacting to problems at work with both
understanding and help, asking for team members’ ideas and opinions, and collaborating with
subordinates.
Similar to the work of Amabile et al. (2004), Carmeli, Reiter-Palmon, and Ziv (2010) found that
leaders perceived as inclusive by their subordinates created climates that were also perceived as
psychologically safe, which in turn had an impact upon and helped to produce creative and
innovative work. Inclusive behaviors that leaders enacted were openness (such as a manager being
open to hearing new ideas about how to solve a problem), availability (such as a manager being
ready to listen to subordinate requests), and accessibility (such as a manager being accessible to
discuss emerging problems). All together, these results suggest that specific leader and manager
behaviors are related to creating the perception of psychological safety for subordinates.
An important caveat to note is the following: An assumption underlying the link between
learning agility and performance is that a performance increase is indicative that some form of
learning has occurred. However, a well-known conceptualization of output sees performance as a

19
combination of one’s effort and one’s ability (Anderson & Butzin, 1974). Therefore, an alternative
argument is that instead, individual effort, rather than just ability, has increased to have an impact
upon performance.
It is important to note that in this supposition, ability is more powerful than effort (Nicholls,
1976); however, effort is still an important factor to account for. While learning agility may play an
indirect role in the relationship between psychological safety and performance, it is hard to tease
these two facets of performance (effort and ability) apart. When someone is being coached, a
performance increase, rather than a learning increase, may be what’s salient in that relationship and
such a performance increase may be a goal of coaching. Within the conceptualization of
performance being a combination of effort and ability, effort, rather than ability, may be what a
coach and coachee may focus on and want to increase instead of ability in the short term. However,
over time, performance as a result of increased ability may occur. For example, if a subordinate is
being coached by her manager and she understands that increased learning may be indicative of
increases in her performance, she may choose to focus on the amount of effort she puts into
completing tasks in the short term. In this way, her performance (due to increased learning) may
increase as a result of more effort. However, though coaching with her manager in the long term,
she may become more self-reflective, ask for more feedback, seek out new information to make
decisions with, and take risks with her performance, and she may do this without much effort and it
might become something she does subconsciously. In this way, her performance may increase as a
result of greater ability. Therefore, due to the fact that both effort and ability are difficult to tease
apart in this context, coaching may or may not focus on increases in effort, but it is difficult to
isolate from ability since performance is a combination of both elements.

20
Hypothesis 4: In the manager-subordinate relationship, perceived manager coaching behaviors are positively associated
with perceived manager-subordinate psychological safety. Higher perceived manager coaching behavior is associated with
higher perceived psychological safety.
Another mediation relationship may occur. Edmondson’s (1999, 2003) research has
demonstrated that both creating the belief of psychological safety within the manager-subordinate
relationship and perceived manager coaching behaviors were likely to facilitate subordinate learning
agility and learning capacity. Perceived psychological safety within the manager-subordinate
relationship therefore may be a mechanism that translates perceived manager coaching behaviors
into behavioral outcomes for the subordinate. But, the mechanism between perceived manager
coaching behaviors and learning agility is likely to be indirect.
Research on innovation is also important to take into account given its similarity with
learning agility to more fully understand the mechanisms behind this potential mediation. When
individuals innovate, they take risks – similar to several specific facets of learning agile behavior.
Carmeli et al. (2010) specifically found that psychological safety mediated the relationship between
inclusive leader behaviors and innovation and creativity. Inclusive leader behaviors cultivated
psychological safety between the leader and his or her subordinate, which in turn, was related to
them taking risks and experimenting with new ideas at work.
Hypothesis 5: Perceived manager-subordinate psychological safety mediates the relationship between perceived manager
coaching behavior and subordinate learning agility.
Coaching behaviors that leaders and managers engage in with their subordinates may have
an impact on learning agility directly, in addition to the potential conduit provided by psychological

21
safety. In a qualitative study, Ellinger and Bostrom (1999) point to specific behaviors that managers
engage in that motivate their employees to learn. Some of these behaviors, similar to those
espoused in a learner-centered coaching paradigm, included asking thought-provoking questions to
encourage their subordinates to develop their own solutions rather than relying on their managers to
provide answers. Other behaviors included offering feedback to subordinates to help them analyze
and understand their performance. Finally, effective managers facilitated meetings with employees
with the aim of discussing any potential problems or roadblocks in order to find solutions together
and bring closure to issues.
The manager coaching behaviors of importance noted by Ellinger & Bostrom (1999) are
paralleled in other frameworks. Heslin, Vandewalle & Latham (2006) focused on manager coaching
behaviors such as providing guidance and feedback to subordinates. They noted that when
managers held a view that is similar to learning goal orientation (that an individual’s capacities can be
developed), they were more likely to engage in coaching with their line reports. When they did not
view their subordinates as having the capacity to grow, they were less likely to coach and provide
feedback. Part of the learning process that managers and their subordinates engaged in included
collaborating with subordinates by offering advice and suggestions help them develop their ideas
and to facilitate the creative thinking process. Of note is that many of these behaviors are similar to
learning agility. Indeed, feedback seeking and collaboration with others to develop ideas are two
important components of learning agility. Therefore, in addition to the importance of psychological
safety to promote increased learning agility, managers may directly increase subordinate learning
behavior through coaching.
Hypothesis 6: Perceived manager coaching behavior is positively associated with subordinate learning agility. Higher
perceived manager coaching behavior is associated with higher subordinate learning agility.

22
Learning goal orientation & learning agility
DeRue et al. (2012) hypothesized that learning goal orientation, which has been studied for
many years (Dweck, 1986), may be an antecedent of learning agility. DeRue et al.’s rationale was
that individuals with high learning goal orientation may be less focused on one stream of thought
when solving problems and such cognitive flexibility may help them seek out new opportunities to
learn quickly. These two attributes are similar to the speed and flexibility factors within the learning
agility model developed at Teachers College.
Furthermore, one’s capacity for adopting a learning goal orientation may influence individual
feedback-seeking behavior (VandeWalle & Cummings, 1997; VandeWalle et al., 2000). VandeWalle
and colleagues assessed this relationship and found that specific types of goals, such as having a
learning goal, could shape one’s feedback-seeking process. Individuals who were highly motivated
to learn from new experiences were far more likely to seek out feedback from others. When one
held a learning goal orientation, he or she was more likely to put in effort to solve a problem. He or
she was also more likely to hold strong feelings of self-efficacy. Both self-efficacy and effort were
related to performance increases over time. Individuals who did not hold a learning goal orientation
were far less likely to achieve these outcomes.
Additionally, having a learning goal orientation is associated with a greater motivation to learn
(Colquitt & Simmering, 1998). Those who had a learning goal orientation (compared to those who
held performance orientations) were far more likely to be motivated to learn both before and after
receiving feedback. Furthermore, those with learning goal orientations were more likely to make a
cognitive association between the effort they put into the task and the performance such effort
would yield. Finally, they were more likely to value performance increases on a task.
Similarly, McKenna, Boyd & Yost (2007) found evidence, like that of Eichinger and Lombardo
(2000), which suggested that people who adopt a learning focus and are willing to admit to their

23
mistakes are better able to learn from experience. In their study, the researchers examined religious
leaders. They noted that those clergy members who pushed themselves to the edge of their comfort
zones to learn from formative experiences, including taking feedback and learning from errors, were
more likely to manage change and complexity while in their roles. The most effective strategy clergy
members used was composed of taking a learning agile stance.
Research on innovation within teams sheds light on some of these relationships. Gong et al.
(2009) demonstrated that specific facets of follower beliefs have an impact on the climate for
learning. They found that when employees have a learning orientation, teams tended to support
workplace creativity. Creativity was measured as the extent to which employees were perceived as
creative by others and developed custom-made services for clients. Gong and colleagues also found
that employee innovation was related to an increase in actual sales performance and perceived
performance (as rated by supervisors).
Recent research has also shown that learning agility and learning goal orientation are highly
correlated: Individuals who perceived goals as a learning opportunity rather than as a threatening
situation in which they could fail were more likely to be learning agile (Drinka et al., 2016).
Therefore, the perception of learning as an opportunity to develop may have an impact on one’s
behavioral practices. This may happen when such an individual can quickly reconfigure behavioral
patterns to find one that yields successful outcomes. While such a study is compelling because
learning goal orientation seems to be a personality trait related to learning behaviors, such findings
show an association, rather than how one construct might be an antecedent of one another. Yet,
these results suggest that learning goal orientation could be an antecedent to learning agility.
Hypothesis 7: Subordinate learning goal orientation is positively associated with subordinate learning agility. Higher
subordinate learning goal orientation is associated with higher subordinate learning agility.

24
Chapter III: Methodology
Data for this study came from two sources. The first was from a healthcare organization in
a metropolitan area in the Northeast US. Data were collected in two phases (June 2016 and October
2016). A second source of data was from Amazon’s crowd-sourced data-collection platform,
MTurk. Both sets of data were collected under IRB protocols 16-308 and 17-279. Please see Figure
3 for an overview.
Organizational data collection
Participants – June 2016
A sample of n=465 participants were recruited based on a previous partnership with the
organization. 200 participants were dropped from the total sample because they did not pass the
attention check, bringing the sample to n=265. Participants were removed from the sample if they
failed at least one attention check, of which there were three. Attention check items, for example,
were questions such as, “if you’re still paying attention, please select ‘always.’” This suggests that
many participants who entered the survey were not paying attention during the survey and were
clicking at random. Furthermore, when examining identifying information that those who entered
the survey provided, several participants appeared to enter the survey multiple times or partially
enter the survey (by responding to very few items). This led to hypotheses about two potential
issues that may have had an impact on survey attrition: 1) an online connection that may have timed
out, resulting in participants needing to enter the survey more than once and 2) participants who
hoped to increase their chances of winning an incentive (explained in the next section), also resulting
in their entering the survey more than once. Furthermore, the physical design of a survey is known
to have an impact on participant drop-off rates (Tourangeau, Conrad, & Couper, 2013) which may
partially explain why the pool of participants removed from the sample was so high.

25
Participants on average were about 40 years of age (M=42.30, SD=26.58) and had just over
20 years of work experience (M=20.16, SD=13.32). The sample was almost two-thirds female
(62.9%, n=298). Males made up 16.5% (n=78) of the sample and 20.7% of participants did not
respond to this question (n=98). Most participants identified as White/Caucasian (66.2%, n=314).
Only 7% identified as Latino(a)/Hispanic (n=33), 2.3% identified as Asian/Asian-American (n=11),
2.1% identified as Black/African-American (n=10), and1.3% identified as Biracial/Multiracial (n=6)
while 20.7% did not respond (n=98). Most participants stated they were individual contributors that
managed only their own work (61%, n=289). A small proportion of participants (17%, n= 81) said
they worked in a manager or managerial capacity while 21.9% did not respond (n=104).
When a similar analysis was completed for those who failed the attention check items only,
all participants were noted as having “system missing” data. Therefore, it is highly likely that those
participants who failed the attention check items were merely clicking through and sporadically
answering the questions, which may be in line with the earlier hypotheses proposed. Participants
may have experienced an online connection that could have timed out, resulting in their needing to
enter the survey more than once. In this instance, a participant may have clicked through or skipped
over questions to get to where he or she had been previously within the survey before the
connection timed out. Participants may have been motivated to re-enter the survey in order to
increase their chances of winning an incentive.
Procedure
Data collection occurred during late June 2016. Performance data was collected in October
2016 covering the months of July, August, and September 2016. During the data collection in June
2016, data were collected using a survey link. The link was sent out by the CEO of the organization
via email who encouraged employees to respond to survey that would help researchers understand
how people learn in the workplace. In the email, the CEO noted that there was an incentive for

26
participation in the study: A chance to win a $50 gift card would be provided. Once the study was
complete, an employee was chosen at random and sent information for an Amazon $50 gift card.
Measures – June 2016
Learning Goal Orientation is a 5-item subscale of VandeWalle’s (1997) Goal Orientation
measure. Each item was assessed on a 6-point Likert scale (1 = strongly disagree to 7 = strongly
agree). A sample item was, “I am willing to select a challenging work assignment that I can learn a
lot from.”
Leader coaching behaviors is a 3-item scale developed by Edmondson (1999). The items were
measured on a 7-point Likert scale (1 = never to 7 = always). A sample item was, “My manager is
available for consultation on problems.”
Psychological safety was assessed using a set of 6 items on a 7-point Likert scale (1 = very
inaccurate to 7 = very accurate) developed by Edmondson & Wooley (2003) to measure perceived
dyadic psychological safety. A sample item was, “If I was thinking about leaving this company to
pursue a better job elsewhere, I would talk to my manager about it.” This measure is based on an
instrument by Edmondson (1999) that has been rigorously validated and used in many studies
(Carmeli & Gittell, 2009; Carmeli, Reiter-Palmon, & Ziv, 2010; Madjar & Ortiz-Walters, 2009;
Roussin & Webber, 2012). Indeed, Newman et al., 2017 have posited that this is the assessment of
choice among psychological safety researchers because of its sound and rigorous psychometric
properties.
Burke Learning Agility Inventory (BLAI). Participants were prompted to consider how
frequently they engaged in various behaviors at work. Items were assessed on a 7-point scale (1=not
at all to 7=very frequently). A sample item was, “I discuss my mistakes with others.”

27
Measures – October 2016
Performance. Information on participant performance was collected and varied depending on
participant role. For example, lab technologist performance was indicated by the number of patients
scanned per hour and physician performance was indicated by the number of patient charts read per
day. Performance data was collected for six different types of roles present throughout the
organization (see table 3 for specific information). This information was collected through an online
system in which employees recorded their outputs. For example, if a lab technologist had
completed a patient scan, this was indicated in an online system so that they could proceed with the
next patient scan. Then, all performance information was captured so that it could be accessed by
organization administers. For the current research, the administration collected aggregated
information and sent it to researchers. For the performance measures, researchers took the mean
value across the three months of data collection.
Crowd-sourced data collection
Participants
A sample of n=247 participants were recruited through Amazon’s crowd-sourced
Mechanical Turk online platform. All participants were U.S.-based adults. 48 participants were
dropped from the total sample because they did not pass the attention check items, bringing the
n=199 (89 female; 110 male). Participants were M = 34.96 years old (SD=9.58) and had M = 13.87
years of work experience (SD= 9.53). The majority of those in the sample were White (75.9%), 9.0%
were Black, 6.0% were Hispanic, and 6.0% were Asian. Most respondents were employed (96.00%,
n=191) when the survey was administered.
Procedure
The survey was hosted on Amazon’s MTurk and launched in November 2016. After
obtaining informed consent, participants were presented with all measures (except for the BLAI) at

28
random. After completing the randomized items, participants completed the BLAI. Following this,
they answered demographic questions. The survey took approximately 20 minutes and participants
were paid $2.50 for their time.
Measures
All measures previously collected from the organization-based study were administered, with
the exception of performance information. Additionally, more items on coaching behavior were
collected.
Detailed coaching behaviors were measured using a 10-item scale developed by Heslin et al.
(2006). Items utilized a 7-point Likert scale (1 = not at all to 7 = to a very great extent). A sample
item was, “To what extent does your manager help you analyze your performance?”

29
Chapter IV: Results
Prior to data collection, a power analysis revealed that in order for an effect to be detected
with 80% certainty and a medium effect size (0.3), a sample of 165 participants was needed (Soper,
n.d.).
In order to analyze the data, two separate analyses were conducted. One, composed of
regression models, was completed for the organizational data and the other, composed of structural
equation modelling, was completed using only the crowd-sourced data.
Organizational sample results
A visual scan of Q-Q plots, or Quantile-Quantile plots, which indicate the extent to which a
variable is normally distributed (Ford, 2015), was performed in order to assess normality of study
variables. One outlier was removed on performance data that was abnormal because its observed
value was much higher when compared to its expected value (figures 4-8). After removal, the final
sample was N = 264.
Reliability analysis
A Cronbach’s alpha analysis was conducted in order to assess scale reliability. The 5-item
learning goal orientation scale yielded α = 0.71 (M = 5.73, SD=0.80). The 6-item psychological
safety scale yielded α = 0.73 (M = 5.15, SD=1.21). The 3-item manager coaching behavior scale
yielded α = 0.80 (M = 4.99, SD=1.57). Finally, the 38-item learning agility scale yielded α = 0.94 (M
= 4.86, SD=0.88). Given that all Cronbach’s alpha coefficients were greater than 0.70, all scales as
they were analyzed were considered sufficient to move forward with subsequent analyses (Hinkin,
1998).
Covariate analysis
The possibility of including covariates was explored through non-parametric Spearman
correlations for continuous data. Spearman correlations were used in order to err on the side of

30
caution due to the fact that some data appeared to violate normality assumptions. Learning agility,
learning goal orientation, psychological safety, and manager coaching behavior were all significantly
inter-correlated. There was one exception, however: learning goal orientation and manager coaching
behavior were not significantly correlated with each other (table 4).
Additionally, job type and job status, which were categorically coded, were analyzed using
one-way ANOVAs on study outcome variables. Job type included eight different types of roles
present at the organization including nurses, radiologists, lab technicians, and schedulers. Job status
included whether an individual was a full-time employee, a part-time employee or a seasonal/per
diem employee.
The ANOVA for job status on study outcome variables (performance, learning agility, and
psychological safety) did not yield any significant results (tables 5a, b, c). The ANOVA for job type
did, however, yield significant results for study outcome variables (tables 6a, b, c). Specifically, the
ANOVA for performance displayed significant differences between groups (F(4, 124) = 34.73, p <
.001, table 6a). Radiologists demonstrated the highest levels of performance (M = 865.67) followed
by schedulers/operators (M=579.04), which was then followed by front desk employees (M =
321.67) and lab technicians (M=209.51). Other leadership had, on average, the lowest performance
values (M=32.33). Other job types did not have enough employees within each group to run this
analysis. These differences between job types may have been due to the range of performance
measures that were collected. For example, the performance of radiologists was not assessed using
the same performance indicators as other staff positions such as medical billers.
Additionally, the ANOVA for learning agility also yielded significant differences between
groups (F(7, 211) = 3.77, p = .001, table 6b). Other leadership demonstrated the highest levels of
learning agility (M=5.71) followed by other administrators (M=5.15), which was then followed by
front desk employees (M = 4.93). These employees were then followed by lab technicians

31
(M=4.72), nurses (M=4.63), miscellaneous employees (M=4.54), and then schedulers/operators and
radiologists (who shared the same group mean, M = 3.92). This finding may support the notion that
learning agility may be an important capability for more complex tasks such as leadership, while
employees who may be engaged in less complex tasks like schedulers/operators do not need to rely
on learning agility to such a great extent.
The ANOVA for psychological safety did not yield significant differences between groups.
Given the results of these analyses, job type, but not job status, was included as a covariate in
subsequent analyses.
Hypothesis testing
For the organizational sample, regression analyses were completed. In order to test H1 (that
subordinate learning agility is positively associated with subordinate performance), a regression
model was created. The first block of all regression models needed to be allotted to the control
variables in order to understand how hypothesized variables would have an impact on outcome
variables over and above control variables. Since covariate (job type) was categorically measured, it
needed to be dummy coded and then input to the regression model. Therefore, the first block of
the model was allotted to the control variable, job type. Since there were eight job types, seven
dummy variables were created. The dummy variables are as follows: front desk vs. others,
schedulers/operators vs. others, radiologists vs. others, technicians vs. others, leadership vs. others,
admin vs. others, miscellaneous vs. others.
In similar research, significant results of covariates are typically reported. In this study,
schedulers/operators vs. others (β = 0.50, p < 0.001, table 7), radiologists vs. others (β = 0.38, p <
0.001), technicians vs. others (β = -0.34, p < 0.001) and leadership vs. others (β = -0.14 p < 0.05)
were all significant covariates. While there were two additional dummy variables in the broader
analysis (admin vs. others and miscellaneous vs. others), they were not allowed to be included in this

32
particular analysis because too many cells were missing. The significant covariates indicated that
schedulers/operators, compared to other job types, were more likely to achieve higher levels of
performance. Additionally, radiologists, compared to other job types, were more likely to achieve
higher levels of performance. Technicians, compared to other job types, were more likely to achieve
lower levels of performance. Finally, leadership positions were more likely to achieve lower levels of
performance compared to other job types.
Then, the next block in the regression was allotted to learning agility. The omnibus model
accounted for a significant proportion of variance: adjusted R2 = 0.57, F (6, 122) = 29.27, p < 0.001.
In the second step of the model, learning agility was not significantly associated with performance (β
= 0.08, p = ns, table 7). Given some potential issues with normality of study variables, the
magnitude of the slope should be taken into account. For every one standardized unit increase in
learning agility, performance scores increased by 0.08 standardized units.
In order to test H2 (that perceived subordinate psychological safety is positively associated
with subordinate learning agility), a regression analysis was completed. The first block was allotted to
the control variable, job type. Job type radiologists vs. others (β = -0.17, p < 0.01, table 8) was a
significant covariate. The significant covariate indicated that radiologists, compared to other job
types, were more likely to achieve lower levels of learning agility.
Then, the next block in the regression was allotted to psychological safety. The omnibus
model accounted for a significant proportion of variance: adjusted R2 = 0.13, F (8, 182) = 3.38, p <
0.01. In the second step of the model, psychological safety was significantly associated with learning
agility (β = .18, p < 0.05, table 8). Given some potential issues with normality of study variables,
the magnitude of the slope should be taken into account. For every one standardized unit increase
in psychological safety, learning agility scores increased by 0.18 standardized units.
In order to test for H3 (that perceived subordinate psychological safety enhances

33
subordinate learning agility and may in turn be positively associated with subordinate performance),
a mediation analysis was completed (table 9). The indirect path was not significant, demonstrating
that learning agility did not mediate the relationship between psychological safety and performance
(β = 0.00, p = ns).
In order to test H4 (that perceived manager coaching behaviors are positively associated
with perceived psychological safety), a regression analysis was completed. The first block was
allotted to the control variable, job type. Front desk vs. others (β = -0.19, p < 0.05, table 10) and
admin vs. others (β = -0.20, p < 0.05) were significant covariates. The significant covariates
indicated that front desk employees, compared to other job types, were more likely to achieve lower
levels of psychological safety. Additionally, the other significant covariate meant that other
administrative staff, compared to employees in all other types of jobs, were more likely to achieve
lower levels of psychological safety.
Then, the next block in the regression model was allotted to manager coaching behavior.
The omnibus model accounted for a significant proportion of variance: adjusted R2 = 0.53, F(8, 120)
= 18.93, p < 0.001. In the second step of the model, manager coaching behavior was a significantly
associated with psychological safety (β = .75, p < 0.001, table 10). Given some potential issues with
normality of study variables, the magnitude of the slope should be taken into account. For every
one standardized unit increase in manager coaching behavior, psychological safety scores increased
by 0.75 standardized units.
In order to test for H5 (that perceived manager coaching behavior is associated with
perceived manager-subordinate psychological safety and was also associated with subordinate
learning agility), a mediation analysis was completed (table 11). The indirect path was not significant,
demonstrating that perceived manager-subordinate psychological safety did not mediate the
relationship between perceived manager coaching behavior and subordinate learning agility (β =

34
0.00, p = ns). Interestingly, the direct path was significant (β = 0.22, p < 0.001) indicating that
perceived manager coaching behavior was significantly associated with learning agility directly.
In order to test H6 (that perceived manager coaching behavior is positively associated with
subordinate learning agility), a regression analysis was completed. The first block was allotted to the
control variable, job type. Leadership vs. others (β = 0.14, p < 0.05, table 12) was a significant
covariate. The significant covariate indicated that other leadership positions were more likely to
achieve higher levels of learning agility compared to other job types.
Then, the next block in the regression model was allotted to manager coaching behavior.
The omnibus model accounted for a significant proportion of variance: adjusted R2 = 0.12, and the
omnibus model was significant: F (8, 189) = 4.45, p < 0.001. Manager coaching behavior was
significantly associated with learning agility (β = .28, p < 0.001, table 12). Given some potential
issues with normality of study variables, the magnitude of the slope should be taken into account.
For every one standardized unit increase in manager coaching behavior, learning agility scores
increased by 0.28 standardized units.
In order to test H7 (that subordinate learning goal orientation is positively associated with
perceived manager-subordinate learning agility), a regression analysis was completed. The first block
was allotted to the control variable, job type. Radiologists vs. others (β = -0.19, p < 0.01, table 13)
and leadership vs. others (β = 0.30, p < 0.05) were significant covariates. The significant covariates
indicated that radiologists, compared to other job types, were more likely to achieve lower levels of
learning agility. Finally, other leadership positions were more likely to achieve higher levels of
learning agility compared to other job types.
Then, the next block in the regression was allotted to learning goal orientation. The
omnibus model accounted for a significant proportion of variance: adjusted R2 = 0.28, F (8, 254) =
13.93 p < 0.01. In the second step of the model, learning goal orientation was significantly

35
associated with learning agility (β = .46, p < 0.001, table 13). Given some potential issues with
normality of study variables, the magnitude of the slope should be taken into account. For every
one standardized unit increase in learning goal orientation, learning agility scores increased by 0.46
standardized units.
For an overview of results, see figure 9.
Crowd-sourced sample results
Before analyzing the data, a visual scan of normality was completed. The visual scan
through the use of Q-Q plots demonstrated some normality aberrations, however, no outliers were
removed as data points did not appear to have extreme points that differed when comparing
expected to actual residuals (figures 10-13).
Reliability analysis
Cronbach’s alpha was completed in order to assess scale reliability of study variables. The 5-
item learning goal orientation scale yielded α = 0.93 (M = 5.01, SD=1.27). The 6-item psychological
safety scale yielded α = 0.81 (M = 4.62, SD=1.22). The 13-item manager coaching behavior scale
yielded α = 0.97 (M = 4.86, SD=1.41). Finally, the 38-item learning agility scale yielded α = 0.96 (M
= 4.89, SD=1.01). Given that all Cronbach’s alpha coefficients were greater than 0.70, all scales as
were considered sufficient to move forward with subsequent analyses.
Covariate analysis
The possibility of including covariates was explored through non-parametric correlations
(due to the fact that some data did not appear to be normally distributed). Spearman correlations
were conducted on study variables and potential covariates. Level of education received, and
current job level were significantly correlated with study variables. Level of education was
continuously coded and ranged from 1 =high school/GED received to 6 = professional degree

36
received. Job level ranged from 1 = individual contributor to 6 = senior leadership position.
Learning agility, psychological safety, learning goal orientation, and manager coaching behavior were
all significantly inter-correlated (table 14).
Employment status, which was categorically coded, was analyzed using a one-way ANOVA
on study outcome variables that yielded some significant results (tables 15 a & b). Specifically, the
ANOVA for learning agility displayed significant differences between groups (F(1, 197) = 11.09, p =
.001, table 15a). Those who were currently employed demonstrated the highest levels of learning
agility (M=4.64) compared to those who were not currently employed (M=3.45).
The ANOVA for psychological safety did not yield significant differences between groups.
(table 16b) Given the results of these analyses, employment status, level of education received, and
current job level were included as covariates in subsequent analyses.
Hypothesis testing
For the crowd-sourced sample, a path model was analyzed. The analysis was demonstrated
the following overall fit indices F2=290.08 (1, N=198), (CFI=0.99, RMSEA=0.07, SRMR=0.011).
The model shows good fit as indicated by the various fit indices (Kenny, 2015).
In order to test H2, H6, and H7 (that perceived subordinate psychological safety, perceived
manager coaching behavior, and subordinate learning goal orientation are positively associated with
subordinate learning agility, respectively), the specific path between subordinate psychological safety,
subordinate learning agility, and subordinate learning goal orientation was examined within the path
model. No covariates were significant. Psychological safety was not significantly associated with
learning agility (β = 0.00, p = ns, table 16). Manager coaching behavior was significantly associated
with learning agility (β = 0.43, p<0.1). Learning goal orientation was a significantly associated with
learning agility (β = .39, p < 0.001). Given potential issues with normality, it is important to take the

37
magnitude of the slope into account. For every one-unit increase in manager coaching behavior and
learning goal orientation, learning agility scores increased by 0.43 and 0.39 standardized units,
respectively. All variables were measured on 7-point scales, so the associated increases may be
noteworthy.
In order to test H4 (that perceived manager coaching behaviors is positively associated with
perceived manager-subordinate psychological safety) the specific path between perceived manager
coaching behavior and subordinate learning goal orientation was examined within the path model.
No covariates were significantly associated with psychological safety. Manager coaching behavior
was significantly associated with psychological safety (β = .74, p < .001, table 17). This meant that
for every one-unit increase in manager coaching behavior, psychological safety scores increased by
0.74 standardized units. Both of these variables were measured on 7-point scales, so the associated
0.74 unit increase may be noteworthy.
In order to test the mediation hypotheses, indirect effects in the path model were examined.
H5 (that perceived manager coaching behavior is associated with perceived manager-subordinate
psychological safety and with subordinate learning agility) was tested and revealed a non-significant
indirect path (β = 0.00, p = ns, table 18).
Furthermore, an R2 analysis indicated that of the dependent variables tested in the model,
both learning agility and psychological safety accounted for a significant proportion of variance.
Learning agility accounted for 50% of model variance; psychological safety accounted for 54% of
model variance (table 19).
For an overview of results, see figure 14.

38
Exploratory analyses
Upon analyzing both the organization and crowd-sourced data, contradictory results on H2
(that perceived subordinate psychological safety is positively associated with subordinate learning
agility) emerged. In the organizational sample, the result was statistically significant, while in the
crowd-sourced sample, the result was not statistically significant. Furthermore, significant
correlations occurred between psychological safety and learning goal orientation, in addition to
significant correlations between psychological safety and learning agility. Therefore, further analysis
was required to attempt to explain the results that were not in line with theory. Given the significant
correlations, a moderation relationship may exist between psychological safety, learning goal
orientation, and learning agility as a dependent variable, instead of a mediation relationship. A final
regression analysis was conducted in light of this exploratory research question.
Organizational sample
The first block was allotted to control variables. Several covariates were significant:
radiologists vs. others (β = -0.22, p = 0.001) and miscellaneous vs. others (β = -.17, p = 0.01, table
20). The significant covariates indicated that radiologists, compared to other job types, were more
likely to achieve higher levels of learning agility. Additionally, miscellaneous roles, compared to
other job types, were more likely to achieve higher levels of learning agility.
Then, the next block in the regression was allotted to learning goal orientation and
psychological safety. Learning goal orientation was significantly associated with learning agility (β =
0.44, p < 0.001, table 20). Given some potential issues with normality of study variables, the
magnitude of the slope should be taken into account. For every one standardized unit increase in
learning goal orientation, learning agility scores increased by 0.44 standardized units.
In the third and final block of the regression, an interaction term between learning goal
orientation and psychological safety was created. The omnibus model accounted for a significant

39
proportion of variance: adjusted R2 = 0.33, F (1, 180) = 10.53, p < 0.001. The interaction term was
not significantly associated with learning agility (β = -0.03, p = ns, table 20).
Crowd-sourced sample
The first block was allotted to control variables. One covariate was significant: employment
status (β = -0.12, p < 0.05, table 21). The significant covariate indicated that those who were
currently employed demonstrated the highest levels of learning agility.
Then, the next block in the regression was allotted to learning goal orientation and
psychological safety. Learning goal orientation was significantly associated with learning agility (β =
0.43, p < 0.001). Psychological safety was significantly associated with learning agility (β = 0.31, p <
0.001). Given some potential issues with normality of study variables, the magnitude of the slope
should be taken into account. For every one standardized unit increase in learning agility, learning
goal orientation scores increased by 0.43 standardized units and psychological safety scores increased
by 0.31 standardized units.
In the third and final block of the regression, an interaction term between learning goal
orientation and psychological safety was created. The omnibus model accounted for a significant
proportion of variance: adjusted R2 = 0.33, F (1, 180) = 10.53, p < 0.001. The interaction term was
marginally significantly associated with learning agility (β = -0.10, p = 09, table 21).
In light of these findings, an updated proposed model of interpersonal learning processes in
organizations may be more appropriate (figure 15).

40
Chapter V: Discussion
The results of the present study indicated several key findings that may have an impact upon
how individuals learn in organizations. The role of psychological safety in the present research
revealed several results. Specifically, psychological safety had a direct relationship with learning
agility as was noted in the organizational sample study. This finding is in line with current theory –
an individual is likely to learn when he or she perceives a psychologically safe environment in which
to learn, experiment, take risks, and try new things. Additionally, both studies in the present
research did not demonstrate that psychological safety mediated the relationship between manager
coaching behavior and learning agility, however, there were significant associations between manager
coaching behavior, psychological safety, and learning agility.
The lack of support for the mediation hypotheses suggests that some variance in scores results
from the direct relationship between manager coaching behavior and learning agility, negating the
possibility of psychological safety mediating the relationship between these two variables.
Therefore, some proportion of variance did not appear to depend on perceived psychological safety
between a subordinate and his or her manager, while some proportion of variance did depend on
the perceived psychological safety between a subordinate and his or her manager.
Results did not corroborate the notion that learning agility has a significant association with
performance. However, the lack of associations between these two constructs may be due to
methodological reasons rather than empirical ones, which was a limitation of the present research.
The methods used to measure performance may tap into quantity, rather than quality of
performance. Previous studies, when performance was measured based on quality, do support this
relationship (Smith, 2015). Additionally, a meta-analysis on the topic has noted a robust relationship
between both leader performance and potential with learning agility (De Meuse, 2017). The reason
for the current finding may be that learning agility is more likely to affect performance on tasks that

41
require learning (more complex tasks) rather than rote performance on repetitive tasks such as was
measured in the present study.
An interesting finding also occurred in the organizational sample in which leadership positions
demonstrated the highest levels of learning agility compared to other roles. This may support the
notion that learning agility is an important capability for more complex tasks such as leadership.
Employees who may be engaged in less complex tasks like schedulers/operators did not need to rely
on learning agility to such a great extent in order to complete tasks.
The role of psychological safety may not be clear cut in terms of its relationship with learning
agility and other constructs. In the exploratory analysis conducted on the crowd-sourced sample, a
marginally significant interaction term was detected. However, in the organizational sample, no
interaction term of significance was detected. Therefore, the role of psychological safety may need
to be explored further in terms of how it is related to learning agility and learning goal orientation.
Directions for future research
An important research question pertains to exploring other antecedents of learning agility,
and specifically leader behaviors (via psychological safety). For example, Edmondson (2004)
suggested that leaders who both invite input from followers and model openness and fallibility may
be important antecedents to psychological safety, which may be antecedent of learning agility. Some
dimensions of manager coaching behavior seem to tap into the construct of servant leadership,
which may be an antecedent of learning agility (again, via psychological safety). Schaubroeck, Lam &
Peng (2011) noted that leader behaviors that engendered psychological safety and increased team
performance were servant leader behaviors. The association between these behaviors, like
emotional healing, empowering others, putting subordinates first, and developing relationships may
be important to understand in more depth than has been studied currently (Liden et al., 2008).

42
Other leader behaviors may be important such as leader inclusiveness (Bienefeld & Grote, 2014;
Carmeli et al., 2010), leader support (May et al., 2004), leader trustworthiness (Madjar & Ortiz-
Walters, 2009), the capacity for leaders to be open to new ideas and suggestions (Detert & Burris,
2007), leader behavioral integrity and honesty (Palanski & Vogelgesang, 2011), and the propensity
for leaders to conduct themselves in an ethical manner (Walumbwa & Schaubroeck, 2009). These
potential antecedents may be part of the same nomological network, defined as a representation of
related constructs and their observable expressions as well as interrelationships between similar
constructs.
Another dimension that is ripe for future research that is also related to psychological safety
is what some psychologists term the tensility of relationships. Tensility of relationships is defined as
the capacity of interpersonal relationships to withstand strain (Carmeli, et al., 2009). This construct
is slightly different from psychological safety, so measuring it more specifically may be another
direction for future research. Psychological safety captures the perception that individuals in a
group feel safe to experiment with new behaviors; tensility captures the behaviors that individuals
engage in as part of high quality relationships when they feel as though their relationships can
withstand strain. High quality relationships are associated with the perception of psychological
safety (Carmeli et al, 2009). It is likely that relationships between managers and subordinates that are
highly tensile may be associated with higher subordinate learning agility.
Future research on learning goal orientation may want to focus on differences between
individuals with a performance orientation and those with a learning goal orientation in terms of
subsequent associations with learning agility and performance (DeRue et al., 2012). Previous
research demonstrated that there may be links between these personality trait antecedents and
psychological safety, even though this research did not support such links. Specifically, previous
work has shown that when individuals perceived their workplace as psychologically safe, they were

43
less likely to rely on an achievement (or performance) orientation. (Tangirala, Kamdar,
Venkataramani, and Parke, 2013).
Future studies might also focus these potential antecedents in environments with both high
and low levels of change. In an environment with high levels of change, change can create fear.
Fear usually works against the creation of psychological safety. Merrill & Reid (1981) note that when
leaders are under stress as a result of a high level of change in either their organization or the
external environment, their behavior changes. Under these conditions, they are more likely to go
into an authoritarian and controlling mode of behavior. In these types of situations, there is likely
little psychological safety present. Therefore, an interesting research question would focus on what
happens to the learning agility of subordinates in such situations. Subordinates who have high levels
of learning goal orientation may be able to override challenging situations and directly exhibit their
learning agility while individuals with low learning goal orientation may not get the opportunity to be
coached on their learning agility nor might they perceive psychological safety in the presence of an
authoritarian leader to exhibit their learning agility successfully.
In a similar vein, in organizations in which there is a great deal of safety, the need for
learning agility needs to be better understood. In environments where there is little change and the
business is thriving, the extent and need of learning agility is not known. It is possible that learning
agility may be conditional upon the level of psychological safety present in a given environment.
Therefore, such a question should be explored further.
Limitations
Given the known importance of organizational culture and how it can have an impact on
behavior, one flaw in the crowd-sourced sample study was how little was known about these
participants. They were U.S.-based adults, but their work history and exposure to various types of
44
organizational cultures was not known. Compared to the organizational sample, in which all
participants came from within the same organization, the culture could not be accounted for or held
constant, which may have led to additional error within the sample.
Another limitation in the present study was how performance data was measured.
Performance data can be measured in a multitude of ways, and has been in previous research (e.g.,
Church, 1997). The performance data appeared to be based on rote measures of productivity, rather
than creativity or solving complex problems. This may be an issue when studying learning agility,
because measuring the extent to which completing a specific task requires the involvement of
learning is essential. For future research, quality-based measures in which individuals have solved
complex and creative problems may be ideal measures of performance.
In the organizational study, a smaller set of items was used to measure coaching behavior,
although these items have less face-validity than the measure utilizing more detailed behaviors. This
smaller set of items had to do with manager-coach availability in terms of time a manager may have
to support subordinates, rather than the coaching behavior itself. The shorter set of items seemed
to be a more passive measure of coaching rather than measuring the extent to which a manager
really sits with and questions the assumptions of a subordinate in an effort to increase their learning.
The reliability between these items and the broader coaching behavior measure used in the crowd-
sourced sample was high, however, the nomological network of constructs may be somewhat
different.
Implications for organizations
The overarching finding of the current research is that manager coaching behavior is important
for augmenting learning agility. Two mechanisms occur by which managers can increase
subordinate learning. Managers who coach are able to directly teach their subordinates how to learn

45
and think more critically in support of successful future learning. Managers who coach also create
more psychological safety between themselves and their subordinates, which also has a positive
impact on subordinate learning agility. Ultimately, individuals with high learning agility are more
likely to have high performance (Smith, 2015), which has a positive impact on the bottom line for
organizations.
The importance of this research may be mostly in situations in which leader coaching can make
a difference. When the work product does not involve creativity, manager coaching behavior may
not have an impact on performance. When the work is innovative and requires creative problem-
solving, manager coaching behavior may be an important driver of subordinate learning agility and
performance. Therefore, the impact of manager coaching behavior is likely to be significant in these
types of situations. For organizations, this may be an opportunity for learning and development
efforts in order to grow and develop future leaders.

46
References
Amabile, T. M., Schatzel, E. A., Moneta, G. B., & Kramer, S. J. (2004). Leader behaviors and the
work environment for creativity: Perceived leader support. The Leadership Quarterly, 15(1),
5-32.
Anderson, N. H., & Butzin, C. A. (1974). Performance= Motivation × Ability: An integration-
theoretical analysis. Journal of Personality and Social Psychology, 30(5), 598.
Argyris, C. (1993) Knowledge for Action: A Guide to Overcoming Barriers to Organizational Change. San
Francisco: Jossey-Bass.
Baer, M., & Frese, M. (2003). Innovation is not enough: Climates for initiative and psychological
safety, process innovations, and firm performance. Journal of Organizational Behavior,
24(1), 45-68.
Bienefeld, N., & Grote, G. (2014). Speaking up in ad hoc multiteam systems: Individual level effects
of psychological safety, status, and leadership within and across teams. European Journal
of Work and Organizational Psychology, 23, 930–945.
Burke, W. W., Roloff, K., Mitchinson, A., Catenacci, L., Drinka., G. O., Kim, J. (2016). To live is to
learn: A behavioral model and measurement of learning agility. Unpublished manuscript,
Department of Organization & Leadership, Teachers College, Columbia University,
New York, NY, USA.
Byrne, Z. S., Stoner, J., Thompson, K. R., & Hockwarter, W. (2005). The interactive effects of
conscientiousness, work effort, and psychological climate on job performance. Journal of
Vocational Behavior, 66, 326–338.
Carmeli, A., & Gittell, J. H. (2009). High‐quality relationships, psychological safety, and learning
from failures in work organizations. Journal of Organizational Behavior, 30(6), 709-729.

47
Carmeli, A., Reiter-Palmon, R., & Ziv, E. (2010). Inclusive leadership and employee involvement in
creative tasks in the workplace: The mediating role of psychological safety. Creativity
Research Journal, 22(3), 250-260.
Colquitt, J. A., & Simmering, M. J. (1998). Conscientiousness, goal orientation, and motivation to
learn during the learning process: A longitudinal study. Journal of Applied Psychology, 83(4),
654.
Dai, G., De Meuse, K. P., & Tang, K. Y. (2013). The role of learning agility in executive career
success: The results of two field studies. Journal of Managerial Issues, 25(2), 108.
De Meuse, K. P. Guangrong, D., & Hallenbeck, G. S. (2010). Learning agility: A construct whose
time has come. Consulting Psychology Journal, 62, 119 – 130.
De Meuse, K. P., G. Dai, R. W. Eichinger, R. C. Page, L. P. Clark, & S. Zewdie. (2011). The
Development and Validation of a Self-assessment of Learning Agility [Technical
Report]. Minneapolis, MN: Korn/Ferry International.
De Meuse, K. P. (2017). Learning agility and leader success. Consulting Psychology Journal, 69 (4), 267 –
295.
DeRue, D. S., Ashford, S. J., & Myers, C. G. (2012). Learning agility: In search of conceptual clarity
and theoretical grounding. Industrial and Organizational Psychology, 5(3), 258-279.
Detert, J. R., & Burris, E. R. (2007). Leadership behavior and employee voice: Is the door really
open? Academy of Management Journal, 50, 869–884.
Drinka, G. O., Catenacci, L. C. & Burke, W. W. (2017). Assessing potential: Validating a new learning
agility inventory. Poster session presented at the Society of Industrial/Organizational
Psychology Annual Conference, Orlando, FL.

48
Dvir, T., Eden, D., Avolio, B. J., & Shamir, B. (2002). Impact of transformational leadership on
follower development and performance: A field experiment. Academy of Management
Journal, 45(4), 735-744.
Dweck, C. S. (1986). Motivational processes affecting learning. American Psychologist, 41, 1040–1048.
Edmondson, A. C. (1996). Learning from mistakes is easier said than done: Group and
organizational influences on the detection and correction of human error. The Journal of
Applied Behavioral Science, 32(1), 5-28.
Edmondson, A. (1999). Psychological safety and learning behavior in work teams. Administrative
Science Quarterly, 44(2), 350-383.
Edmondson, A. C., & Woolley, A. W. (2003). Understanding outcomes of organizational learning
interventions. International Handbook of Organizational Learning and Knowledge Management.
London: Blackwell, 185-211.
Edmondson, A. C., Kramer, R. M., & Cook, K. S. (2004). Psychological safety, trust, and learning in
organizations: A group-level lens. Trust and Distrust in Organizations: Dilemmas and
Approaches, 12, 239-272.
Edmondson, A. C., & Lei, Z. (2014). Psychological safety: The history, renaissance, and future of an
interpersonal construct. Annual Review of Organizational Psychology & Organizational
Behavior, 1(1), 23-43.
Ellinger, A. D., & Bostrom, R. P. (1999). Managerial coaching behaviors in learning
organizations. Journal of Management Development, 18(9), 752-771.
Ford, C. (2015, August 26). University of Virginia Library. Retrieved September 25, 2017, from
http://data.library.virginia.edu/understanding-q-q-plots/
Frazier, M. L., Fainshmidt, S., Klinger, R. L., Pezeshkan, A., & Vracheva, V. (2017). Psychological
safety: A meta‐analytic review and extension. Personnel Psychology, 70(1), 113-165.

49
Gong, Y., Huang, J. C., & Farh, J. L. (2009). Employee learning orientation, transformational
leadership, and employee creativity: The mediating role of employee creative self-
efficacy. Academy of Management Journal, 52(4), 765-778.
Hackman, J. R., & Wageman, R. (2005). A theory of team coaching. Academy of Management Review,
30(2), 269-287.
Heslin, P. A., Vandewalle, D., & Latham, G. P. (2006). Keen to help? Managers’ implicit person
theories and their subsequent employee coaching. Personnel Psychology, 59(4), 871-902.
Hinkin, T. R. (1998). A brief tutorial on the development of measures for use in survey
questionnaires. Organizational Research Methods, 1(1), 104-121.
Hogan, R., Curphy, G. J., & Hogan, J. (1994). What we know about leadership: Effectiveness and
personality. American Psychologist, 49(6), 493.
Kahn, W. A. (1990). Psychological conditions of personal engagement and disengagement at work.
Academy of Management Journal, 33(4), 692-724.
Kellett, J. B., Humphrey, R. H., & Sleeth, R. G. (2002). Empathy and complex task performance:
Two routes to leadership. The Leadership Quarterly, 13(5), 523-544.
Kenny, D. A. (2015, November 24). Measuring model fit. Retrieved August 07, 2017, from
http://davidakenny.net/cm/fit.htm
Kleysen, R. F., & Street, C. T. (2001). Toward a multi-dimensional measure of individual innovative
behavior. Journal of Intellectual Capital, 2(3), 284-296.
Kotterman, J. (2006). Leadership versus management: What's the difference? The Journal for Quality
and Participation, 29(2), 13-17.
Krause, D. E. (2004). Influence-based leadership as a determinant of the inclination to innovate and
of innovation-related behaviors: An empirical investigation. The Leadership Quarterly,
15(1), 79-102.

50
Liden, R. C., Wayne, S. J., Zhao, H., & Henderson, D. (2008). Servant leadership: Development of a
multidimensional measure and multi-level assessment. The Leadership Quarterly, 19(2),
161-177.
Lombardo, M. M., & Eichinger, R. W. (2000). High potentials as high learners. Human Resource
Management, 39(4), 321-329.
Madjar, N., & Ortiz-Walters, R. (2009). Trust in supervisors and trust in customers: Their
independent, relative, and joint effects on employee performance and creativity. Human
Performance, 22(2), 128-142.
May, D. R., Gilson, R. L., & Harter, L. M. (2004). The psychological conditions of meaningfulness,
safety and availability and the engagement of the human spirit at work. Journal of
Occupational and Organizational Psychology, 77, 11–37.
Marsick, V. J., & Watkins, K. E. (2001). Informal and incidental learning. New Directions for Adult and
Continuing Education, 2001(89), 25-34.
McCall, M.W., Lombardo, M. M. & Morrison, A. M. (1988). Lessons of experience: How Successful
Executives Develop on the Job. Simon and Schuster.
McKenna, R. M., Boyd T. N., & Yost, P. R. (2007). Learning agility in clergy: Understanding the
personal strategies and situational factors that enable pastors to learn from experience.
Journal of Psychology and Theology, 35, 190–201.
Merrill, D. W., & Reid, R. H. (1981). Personal Styles & Effective Performance. CRC Press.
Mitchinson, A., Gerard, N. M., Roloff, K. S., & Burke, W. W. (2012). Learning agility: Spanning the
rigor–relevance divide. Industrial and Organizational Psychology, 5(3), 287-290.
Morrison, A. M., White, R. P., & Van Velsor, E. (1992). Breaking the Glass Ceiling: Can Women Reach
the Top of America's Largest Corporations?. Basic Books.

51
Newman, A., Donohue, R., & Eva, N. (2017). Psychological safety: A systematic review of the
literature. Human Resource Management Review, 27(3), 521-535.
Nicholls, J. G. (1976). Effort is virtuous, but it's better to have ability: Evaluative responses to
perceptions of effort and ability. Journal of Research in Personality, 10(3), 306-315.
Palanski, M. E., & Vogelgesang, G. R. (2011). Virtuous creativity: The effects of leader behavioural
integrity on follower creative thinking and risk taking. Canadian Journal of
Administrative Sciences, 28, 259–269.
Parker, P., Kram, K. E., & Hill, D. T. T. (2014). Peer coaching: An untapped resource for
development. Organizational Dynamics, 43(2), 122-129.
Roussin, C. J., & Webber, S. S. (2012). Impact of organizational identification and psychological
safety on initial perceptions of co-worker trustworthiness. Journal of Business and
Psychology, 27, 317–329.
Schaubroeck, J., Lam, S. S., & Peng, A. C. (2011). Cognition-based and affect-based trust as
mediators of leader behavior influences on team performance. Journal of Applied
Psychology, 96(4), 863.
Schein, E. H. (1993a). On dialogue, culture, and organizational learning. Organizational Dynamics,
22(2), 40–51.
Schein, E. H. (1993b). How can organizations learn faster? The challenge of entering the green
room. Sloan Management Review, 34 (2).
Smith, B.C. (2015). How Does Learning Agile Business Leadership Differ? Exploring a Revised Model of the
Construct of Learning Agility in Relation to Executive Performance. (Doctoral dissertation).
Retrieved from Academic Commons (http://dx.doi.org/10.7916/D8765D95).

52
Smither, J. W., London, M., Flautt, R., Vargas, Y., & Kucine, I. (2003). Can Working With An
Executive Coach Improve Multisource Feedback Ratings Over Time? A Quasi-
Experimental Field Study. Personnel Psychology, 56(1), 23-44.
Soper, D. (n.d.). Calculator: A-priori Sample Size for Structural Equation Models. Retrieved October
19, 2016, from http://www.danielsoper.com/statcalc/calculator.aspx?id=89
Spreitzer, G. M., McCall, M. W., & Mahoney, J. D. (1997). Early identification of international
executive potential. Journal of Applied Psychology, 82(1), 6.
Tangirala, S., Kamdar, D., Venkataramani, V., & Parke, M. R. (2013). Doing right versus getting
ahead: The effects of duty and achievement orientations on employees’ voice. Journal of
Applied Psychology, 98(6), 1040-1050.
Tourangeau, R., Conrad, F. G., & Couper, M. P. (2013). The science of web surveys. Oxford University
Press.
VandeWalle, D., & Cummings, L. L. (1997). A test of the influence of goal orientation on the
feedback- seeking process. Journal of Applied Psychology, 82, 390–400.
VandeWalle, D., Ganesan, S., Challagalla, G. N., & Brown, S. P. (2000). An integrated model of
feedback-seeking behavior: Disposition, context, and cognition. Journal of Applied
Psychology, 85, 996 – 1003.
Van Dyck, C., Frese, M., Baer, M., & Sonnentag, S. (2005). Organizational error management culture
and its impact on performance: A two-study replication. Journal of Applied Psychology,
90(6), 1228.
Walumbwa, F. O., & Schaubroeck, J. (2009). Leader personality traits and employee voice behavior:
Mediating roles of ethical leadership and work group psychological safety. Journal of
Applied Psychology, 94, 1275–1286.

53
Appendices Appendix A: Informed consent and participant’s rights script – Organizational sample
Teachers College, Columbia University
525 West 120th Street New York NY 10027
212 678 3000
www.tc.edu
INFORMED CONSENT
DESCRIPTION OF THE RESEARCH: You are invited to participate in a research study on
personality and learning differences in members of the U.S. workforce. You will be asked to fill out
several personality and behavioral assessments. The research will be conducted by Dr. Warner
Burke, and his research team associates: Lauren Catenacci, Ginevra Drinka, and Dr. Kathryn Roloff.
The researchers are partnering with your organization to collect data, however, all data will be
collected online.
RISKS AND BENEFITS: There is minimal risk associated with participation in this study.
Participants might benefit from reflecting on their emotions and behaviors.
PAYMENTS: You will be entered into a drawing for a $50 Amazon Gift Card. One raffle winner
will be drawn from the pool of employees participating from your company at the conclusion of the
study.
DATA STORAGE TO PROTECT CONFIDENTIALITY: Your responses are confidential.
However, the data will be stored in a password-protected file only accessible to the research team.
This data will be stored for seven years.
TIME INVOLVEMENT: Your participation will take approximately 20-30 minutes.

54
HOW WILL RESULTS BE USED: The results of the study will possibly be published in academic
journals and/or presented at conferences. The results will be aggregately reported to your
organization. Your individual responses will not be reported back to your organization.
PARTICIPANT'S RIGHTS: Principal Investigator: W. Warner Burke, PhD Research Title:
"Reactions to workplace challenges" I have read and discussed the Research Description with the
researcher. I have had the opportunity to ask questions about the purposes and procedures
regarding this study. My participation in research is voluntary. I may refuse to participate or
withdraw from participation at any time without jeopardy to future medical care, employment,
student status or other entitlements. The researcher may withdraw me from the research at his/her
professional discretion. If, during the course of the study, significant new information that has been
developed becomes available which may relate to my willingness to continue to participate, the
investigator will provide this information to me. Any information derived from the research project
that personally identifies me will not be voluntarily released or disclosed without my separate
consent, except as specifically required by law. If at any time I have any questions regarding the
research or my participation, I can contact the investigator, who will answer my questions. The
investigator's phone number is (212) 678-3249. If at any time I have comments, or concerns
regarding the conduct of the research or questions about my rights as a research subject, I should
contact the Teachers College, Columbia University Institutional Review Board /IRB. The phone
number for the IRB is (212) 678-4105. Or, I can write to the IRB at Teachers College, Columbia
University, 525 W. 120th Street, New York, NY, 10027, Box 151. I should print a copy of the
Research Description and this Participant's Rights document. If I have any questions, I may contact
the research investigators at [email protected]

55
Appendix B: Informed consent and participant’s rights script – Crowd-sourced sample
Teachers College, Columbia University
525 West 120th Street
New York NY 10027
212 678 3000
www.tc.edu
DESCRIPTION OF THE RESEARCH: You are invited to participate in a research study on how
personality is related to behaviors at work among members of the U.S. workforce. You will be asked
to fill out several personality and behavioral assessments. The research will be conducted by Dr.
Warner Burke, and his research team associates: Lauren Catenacci, Ginevra Drinka, Jennifer Kim,
and Kathryn Roloff. The research will be conducted online using your mTurk account.
RISKS AND BENEFITS: There is minimal risk associated with participation in this study.
Participants might benefit from reflecting on their emotions and behaviors.
PAYMENTS: You will receive $2.75 deposited to your Mturk account for participating.
DATA STORAGE TO PROTECT CONFIDENTIALITY: Your responses are completely
anonymous. However, the data will be stored in a password-protected file only accessible to the
research team.
TIME INVOLVEMENT: Your participation will take approximately 30-35 minutes.
HOW WILL RESULTS BE USED: The results of the study will possibly be published in academic
journals and/or presented at conferences.
PARTICIPANT’S RIGHTS
I have read and discussed the informed consent with the researcher. I have had ample opportunity
to ask questions about the purposes, procedures, risks and benefits regarding this research study. I

56
understand that my participation is voluntary. I may refuse to participate or withdraw participation
at any time without penalty. The researcher may withdraw me from the research at his or her
professional discretion. If, during the course of the study, significant new information that has been
developed becomes available which may relate to my willingness to continue my participation, the
investigator will provide this information to me. Any information derived from the research study
that personally identifies me will not be voluntarily released or disclosed without my separate
consent, except as specifically required by law. I should print a copy of the Informed Consent
document. If I have any questions, I may contact the research investigators at

57
Appendix C: Letter of Intent and Express Permission from Organization

58
Appendix D: Institutional Review Board approval

59
Appendix E: Stimulus materials
Detailed coaching behavior From: Heslin, P. A., Vandewalle, D., & Latham, G. P. (2006). Keen to help? Managers’ implicit person theories and their subsequent employee coaching. Personnel Psychology, 59(4), 871-902.
• To what extent does your manager… (actual prompt was “to what extent does the person to whom you are providing feedback”
• 1 = not at all; 7 = to a very great extent ▪ Guidance
• Provide guidance regarding performance expectations? • Help you analyze your performance? • Provide constructive feedback regarding areas for improvement? • Offer useful suggestions regarding how you can improve your performance?
▪ Facilitation • Act as a sounding board for you to develop your ideas? • Facilitate creative thinking to help solve problems? • Encourage you to explore and try out new alternatives?
▪ Inspiration • Express confidence that you can develop and improve? • Encourage you to continuously develop and improve? • Support you in taking on new challenges?
Shortened coaching behavior: From: Edmondson, A. (1999). Psychological safety and learning behavior in work teams. Administrative Science Quarterly, 44(2), 350-383. • All items had textual anchors ranging from "never" (1) to "always” (7). • My manager…
1. Initiates meetings to discuss my progress. 2. Is available for consultation on problems. 3. Is an ongoing "presence" at work - someone who is readily available.
Perceived dyadic psychological safety • From: Edmondson, A. C., & Woolley, A. W. (2003). Understanding outcomes of organizational
learning interventions. International Handbook of Organizational Learning and Knowledge Management. London: Blackwell, 185-211.
• Doesn’t say what point-scale, but it is a Likert-type scale, and it should be an agreement scale. 1. If I make a mistake in this job, it is often held against me (R) 2. It is difficult to ask others in this department for help (R) 3. My manager often encourages me to take on new tasks or to learn how to do things I have
never done before 4. If I was thinking about leaving this company to pursue a better job elsewhere, I would talk
to my manager about it 5. If I had a problem in this company, I could depend on my manager to be my advocate

60
6. Often when I raise a problem with my manager, s/he does not seem very interested in helping me find a solution (R)
Learning goal orientation • VandeWalle, D. (1997). Development and validation of a work domain goal orientation
instrument. Educational and Psychological Measurement, 57(6), 995-1015. • 1 = strongly disagree; 7 = strongly agree
1. I am willing to select a challenging work assignment from which I can learn a lot. 2. I often look for opportunities to develop new skills and knowledge. 3. I enjoy challenging and difficult tasks at work where I will learn new skills. 4. For me, development of my work ability is important enough to take risks. 5. I prefer to work in situations that require a high level of ability and talent.

61
Table 1
Learning agility dimensions
Learning agility dimension
Definition
Learning
dimensions
Feedback seeking The extent to which an individual solicits feedback about his or her performance.
Information seeking The extent to which an individual updates continuously updates preexisting knowledge with new information.
Interpersonal risk-taking The extent to which a person admits failings, mistakes, and other issues on-the-job and tries to get help to right these issues.
Collaborating The extent to which an individual tries to broker the learning process for others in their environment.
Performance risk-taking The degree to which a person places himself or herself in ambiguous situations and are unclear about the process or the outcome of the situation
Reflecting The degree to which a person reflects on an experience – how something happened, why it happened, how the outcome could have been different, and how to make changes in the future.
Experimenting The degree to which a person tries out new ideas or ways to get work done, usually through seeking out new information in their environment.
Agility Dimensions Speed The extent to which an individual is a “quick study” and is swift but not hasty while operating at their full potential.
Flexibility The extent to which an individual displays adaptation, fluidity, resilience, the ability to bend under pressure, and the ability to switch between different modes of operating in their work.

62
Table 2
Learning agility sample items Burke Learning Agility Inventory
• Prompt: Below you will find a list of behaviors that can describe how people perform their work. Please evaluate how well each statement describes how you engage your work.
• Scale: 1 = not at all; 4 = somewhat; 7 = very much • Sample items
Learning agility
dimension Sample item
Learning
dimensions
Feedback seeking Ask my peers to provide me with feedback on my performance
Information seeking Update my knowledge and expertise through formal training or education
Interpersonal risk-taking Discuss my mistakes with others
Collaborating Ask a variety of stakeholders for their points of view
Performance risk-taking Try different approaches to see which one generates the best results
Reflecting Take time to reflect on how to be more effective
Experimenting Experiment with unproven ideas by testing them out
Agility Dimensions Speed Readily grasp new ideas or concepts
Flexibility Switch between different tasks or jobs as needed

63
Table 3
Performance data collected for corresponding job types
Job type Performance data collected
Technologists Number of patients scanned per hour
Physicians
Number of exams read per day
Front desk receptionist
Number of patients registered per hour
Billing department personnel
How many exams are coded each day (coders only)
Schedulers/operators
1) Number answered calls per day
2) Percent work time spent on the phone with patients
IT staff
Number of help desk tickets closed per day

64
Table 4
Organizational sample study variable correlations
M SD N 1 2 3 4 5
1. Learning agility 4.86 0.88 263 -
2. Learning goal
orientation 5.73 0.8 264 .51** -
3. Psychological
safety 5.15 1.21 192 .19** .21** -
4. Managerial coaching behavior
4.99 1.57 198 .28** .10 .67**
5. Performance 299.69 189.43 130 .08 .14 .16 0.13 -
*p < .05. **p < .01. ***p < .001.

65
Tables 5 (a-c) Job Status ANOVAs for Study Outcomes
a) Performance
Source df SS MS F p Between groups 2 10151.72 5075.86
.13 .88
Within groups 116 4445008.13 38319.04 Total 118 4455159.85
Full-time (M = 307.14); part-time (M=287.70); per diem/seasonal (M=223.33).
*p < .05. **p < .01. ***p < .001. b) Learning agility
Source df SS MS F p Between groups 2 1.00 .50
.64 .53
Within groups 219 172.71 .79 Total 221 173.72
Full-time (M = 4.89); part-time (M=4.68); per diem/seasonal (M=5.11).
*p < .05. **p < .01. ***p < .001. c) Psychological safety
Source df SS MS F p Between groups 2 .33 .17
.11 .90
Within groups 158 234.74 1.49 Total 160 235.07
Full-time (M = 5.10); part-time (M=5.29); per diem/seasonal (M=5.42).
*p < .05. **p < .01. ***p < .001.
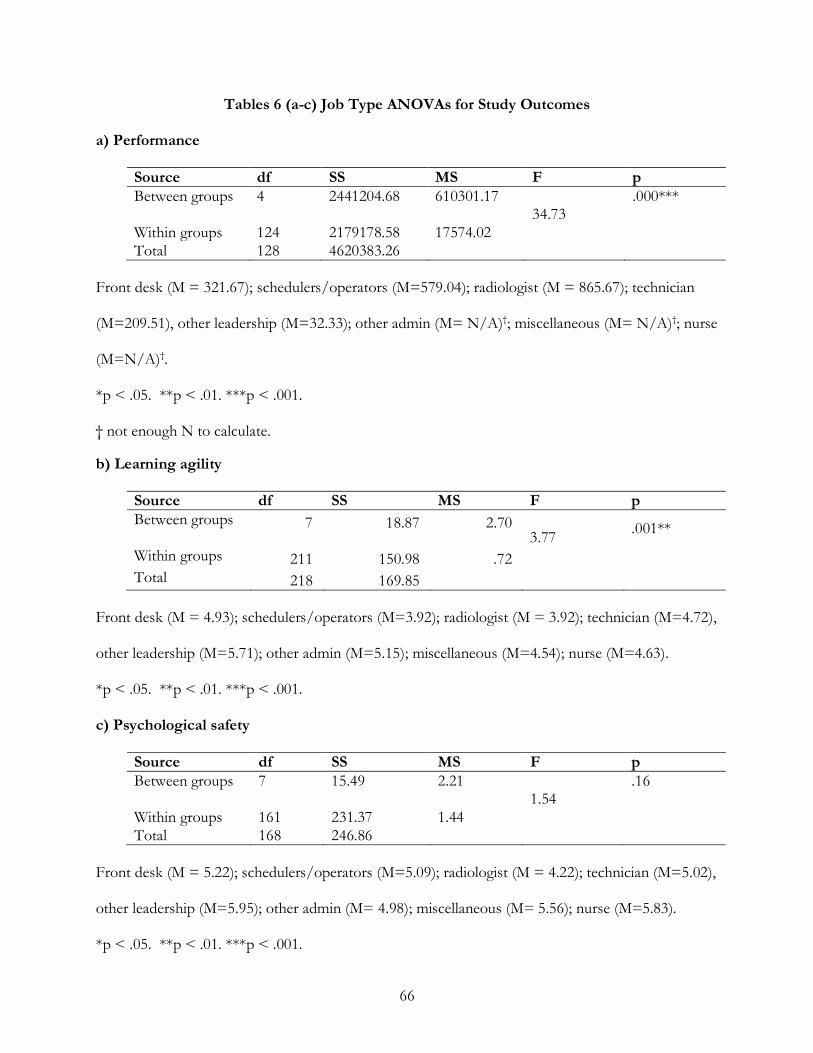
66
Tables 6 (a-c) Job Type ANOVAs for Study Outcomes
a) Performance
Source df SS MS F p Between groups 4 2441204.68 610301.17
34.73 .000***
Within groups 124 2179178.58 17574.02 Total 128 4620383.26
Front desk (M = 321.67); schedulers/operators (M=579.04); radiologist (M = 865.67); technician
(M=209.51), other leadership (M=32.33); other admin (M= N/A)†; miscellaneous (M= N/A)†; nurse
(M=N/A)†.
*p < .05. **p < .01. ***p < .001.
† not enough N to calculate. b) Learning agility
Source df SS MS F p Between groups 7 18.87 2.70
3.77 .001**
Within groups 211 150.98 .72 Total 218 169.85
Front desk (M = 4.93); schedulers/operators (M=3.92); radiologist (M = 3.92); technician (M=4.72),
other leadership (M=5.71); other admin (M=5.15); miscellaneous (M=4.54); nurse (M=4.63).
*p < .05. **p < .01. ***p < .001.
c) Psychological safety
Source df SS MS F p Between groups 7 15.49 2.21
1.54 .16
Within groups 161 231.37 1.44 Total 168 246.86
Front desk (M = 5.22); schedulers/operators (M=5.09); radiologist (M = 4.22); technician (M=5.02),
other leadership (M=5.95); other admin (M= 4.98); miscellaneous (M= 5.56); nurse (M=5.83).
*p < .05. **p < .01. ***p < .001.

67
Table 7
Regression: Effect of learning agility on performance controlling for job type
Predictor IV Coefficient a Standard Error Adjusted R2 Fb F
Step 1 Front desk vs. others
0.06 31.28
0.91
Schedulers/ operators vs. others
0.50 43.91
65.12***
Radiologists vs. others
0.38 71.00
38.75***
Technicians vs. others
-0.34 26.76
26.37***
Leadership vs. others
-0.14 70.23
5.17*
Step 2 Learning agility
0.08 12.94
1.59 29.27***
Total 0.57
a Regression weights are standardized coefficients obtained at step 2. b Individual F values are at step of entry. *p < .05. **p < .01. ***p < .001.
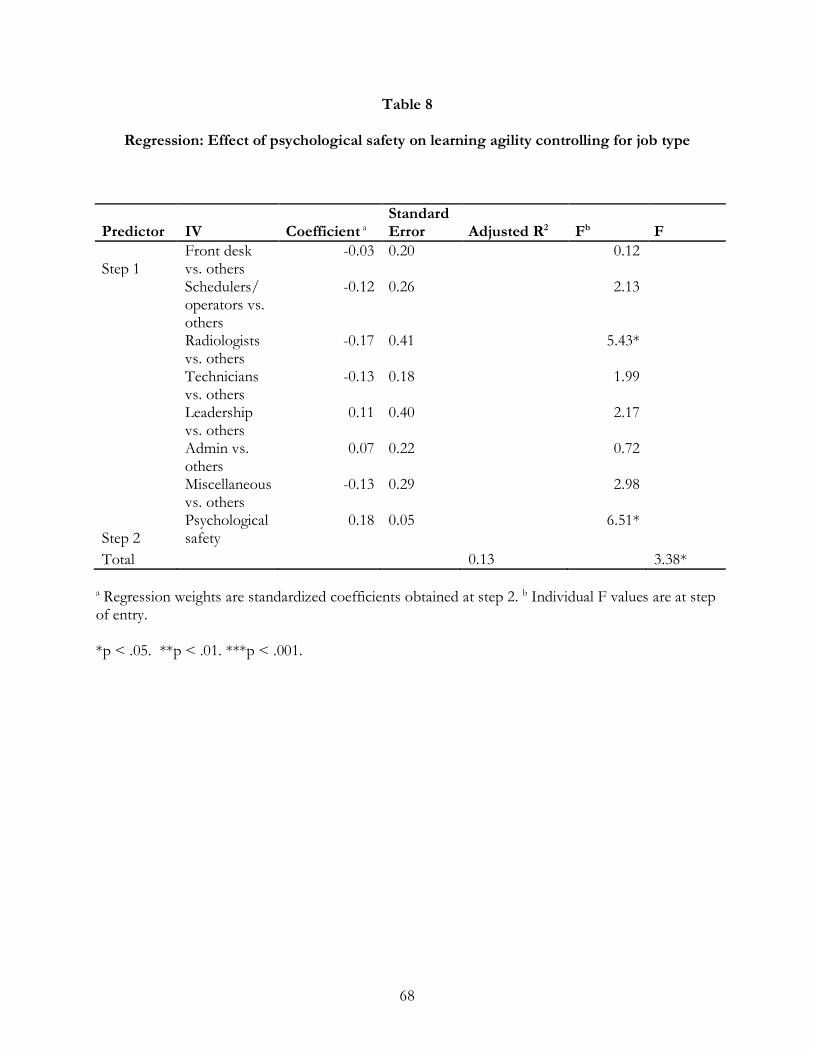
68
Table 8
Regression: Effect of psychological safety on learning agility controlling for job type
Predictor IV Coefficient a Standard Error Adjusted R2 Fb F
Step 1 Front desk vs. others
-0.03 0.20
0.12
Schedulers/ operators vs. others
-0.12 0.26
2.13
Radiologists vs. others
-0.17 0.41
5.43*
Technicians vs. others
-0.13 0.18
1.99
Leadership vs. others
0.11 0.40
2.17
Admin vs. others
0.07 0.22
0.72
Miscellaneous vs. others
-0.13 0.29
2.98
Step 2 Psychological safety
0.18 0.05
6.51*
Total 0.13 3.38*
a Regression weights are standardized coefficients obtained at step 2. b Individual F values are at step of entry. *p < .05. **p < .01. ***p < .001.

69
Table 9
Psychological safety as a potential mediator between learning agility and performance
Standardized
coefficient
Standard error p-value
Indirect effects 0.00 0.00 0.80

70
Table 10
Regression: Effect of manager coaching behavior on psychological safety controlling for job
type
Predictor IV Coefficient a Standard Error Adjusted R2 Fb F
Step 1 Front desk vs. others
-0.19 0.25
5.87*
Schedulers/ operators vs. others
-0.11 0.32
2.69
Radiologists vs. others
-0.08 0.49
1.38
Technicians vs. others
-0.08 0.22
0.84
Leadership vs. others
0.11 0.48
2.67
Admin vs. others
-0.20 0.27
7.09*
Miscellaneous vs. others
-0.03 0.35
0.13
Step 2
Manager coaching behavior
0.75 0.05
137.15***
Total 0.53 18.93***
a Regression weights are standardized coefficients obtained at step 2. b Individual F values are at step of entry. *p < .05. **p < .01. ***p < .001.

71
Table 11
Psychological safety as a potential mediator between manager coaching behavior and
learning agility
Standardized
coefficient
Standard Error p-value
Indirect effects -0.02 0.08 0.79
Direct effects 0.22 0.06 0.00

72
Table 12
Regression: Effect of manager coaching behavior on leaning agility controlling for job type
Predictor IV Coefficient a Standard Error Adjusted R2 Fb F
Step 1 Front desk vs. others
-0.04 0.20 0.23
Schedulers/ operators vs. others
-0.13 0.26
2.86
Radiologists vs. others
-0.12 0.40 2.84
Technicians vs. others
-0.11 0.17 1.48
Leadership vs. others
0.14 0.40 3.97*
Admin vs. others
0.04 0.22 0.26
Miscellaneous vs. others
-0.15 0.28 3.88
Step 2
Manager coaching behavior
0.28 0.04
15.79*** Total 0.12 4.45***
a Regression weights are standardized coefficients obtained at step 2. b Individual F values are at step of entry. *p < .05. **p < .01. ***p < .001.

73
Table 13
Regression: Effect of learning goal orientation on learning agility controlling for job type
Predictor IV Coefficient a Standard Error Adjusted R2 Fb F
Step 1 Front desk vs. others
0.02 0.15
0.13
Schedulers/ operators vs. others
-0.10 0.20
2.60
Radiologists vs. others
-0.19 0.30
11.42**
Technicians vs. others
-0.08 0.14
1.39
Leadership vs. others
0.12 0.30
4.46*
Admin vs. others
0.05 0.17
0.64
Miscellaneous vs. others
-0.07 0.22
1.30
Step 2 Learning goal orientation
0.46 0.06
75.53***
Total 0.28 13.93** a Regression weights are standardized coefficients obtained at step 2. b Individual F values are at step of entry. *p < .05. **p < .01. ***p < .001.

74
Table 14
Study variable correlations
M SD N 1 2 3 4 5 6
1. Learning agility 4.59 1.01 199 -
2. Learning goal
orientation 5.01 1.27 199 .59** -
3. Psychological
safety 4.62 1.22 199 .41** .35** -
4. Managerial coaching behavior
4.86 1.41 199 .60** .41** .70** -
5. Education 4.36 1.2 199 .15* .17* 0.07 0.13 -
6. Job level 2.02 1.13 199 .20** .21** 0.08 .15* -0.01 -
*p < .05. **p < .01. ***p < .001.

75
Tables 15 (a & b) Job Status ANOVAs for Study Outcomes
a) Learning agility
Source df SS MS F p Between groups 1 10.83 10.83
11.09** .001
Within groups 197 192.45 0.98 Total 198 203.28
Employed (M = 4.63); unemployed (M=3.44).
*p < .05. **p < .01. ***p < .001. b) Psychological safety
Source df SS MS F p Between groups 1 .05 .05
.04 .85
Within groups 197 292.28 1.48 Total 198 292.33
Employed (M = 4.62); unemployed (M=4.54).
*p < .05. **p < .01. ***p < .001.

76
Table 16
Path model: Effect of psychological safety, manager coaching behavior, and learning goal
orientation on learning agility controlling for employment status, education level & job level
Predictor IV
Estimated Coefficient β
Standard Error
p Education level 0.03 0.05 0.60 Job level 0.05 0.05 0.33 Employment status -0.09 0.05 0.09 Learning goal orientation 0.39 0.05 0.00 Psychological safety 0.00 0.07 0.93 Manager coaching behavior 0.43 0.07 0.00
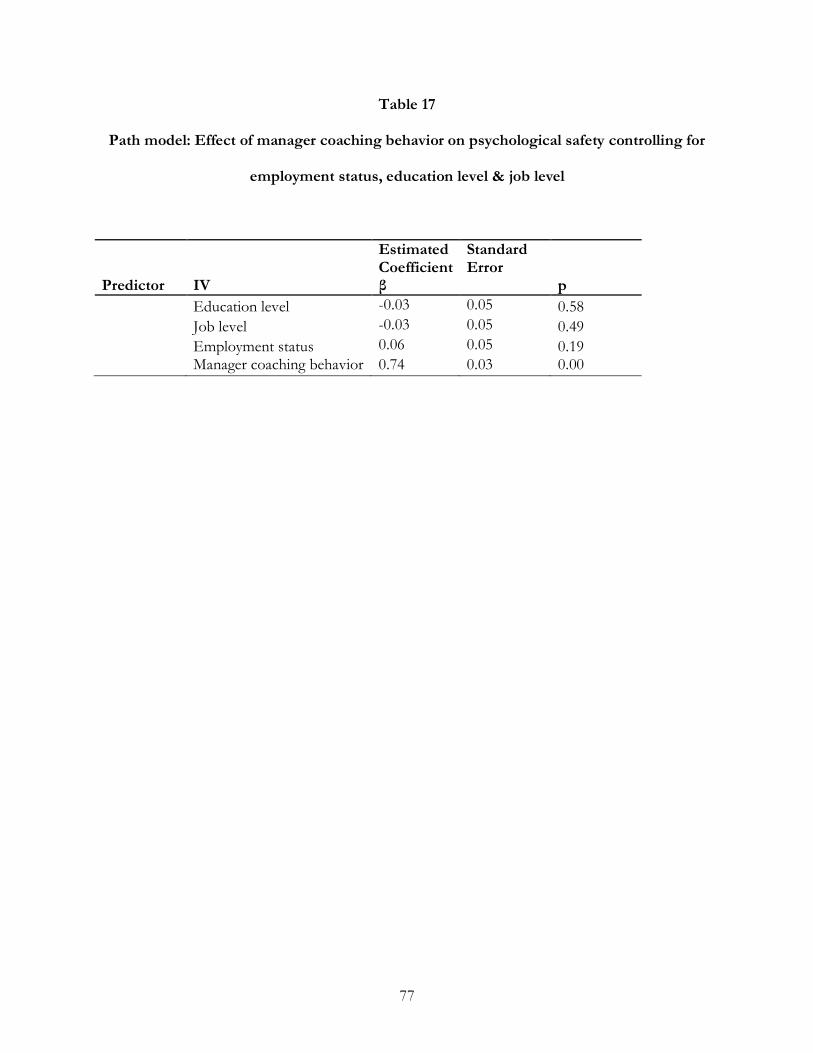
77
Table 17
Path model: Effect of manager coaching behavior on psychological safety controlling for
employment status, education level & job level
Predictor IV
Estimated Coefficient β
Standard Error
p Education level -0.03 0.05 0.58 Job level -0.03 0.05 0.49 Employment status 0.06 0.05 0.19 Manager coaching behavior 0.74 0.03 0.00

78
Table 18
Indirect effects: Mediation of manager coaching behavior to learning agility
β p Total 0.42 0.00 Total indirect 0.00 0.93

79
Table 19
Model R2 values
Predictor IV β p Learning agility 0.50 0.00 Psychological safety 0.54 0.00

80
Table 20
Organizational sample: Effect of learning goal orientation x psychological safety on learning
agility controlling for job type
Predictor IV Coefficient a Standard Error
Adjusted R2 Fb F
Step 1 Front desk vs. others -0.09 0.21 1.14
Schedulers/ operators vs. others
-0.12 0.26 2.94
Radiologists vs. others -0.22 0.38 11.35**
Technicians vs. others -0.15 0.19 2.78
Leadership vs. others 0.10 0.35 2.14
Admin vs. others 0.03 0.23 0.13
Miscellaneous vs. others -0.17 0.29 6.22*
Step 2 Learning goal orientation 0.44 0.06 51.14***
Psychological safety 0.10 0.06 2.84
Step 3
Learning goal orientation x Psychological safety
-0.03 0.06
0.25 Total 0.33 1.14 10.53***
a Regression weights are standardized coefficients obtained at step 3. b Individual F values are at step of entry. *p < .05. **p < .01. ***p < .001.

81
Table 21
Crowd-sourced sample: Effect of learning goal orientation x psychological safety on
learning agility controlling for job type
Predictor IV Coefficient a Standard Error Adjusted R2 Fb F
Step 1 Education 0.05 0.05 0.91 Job level 0.06 0.05 1.20
Employment status
-0.12 0.29 4.45*
Step 2
Learning goal orientation
0.43 0.05
49.53***
Psychological safety
0.31 0.05 27.42***
Step 3
Learning goal orientation x Psychological Safety
-0.10 0.05
2.86 Total 0.41 23.46***
a Regression weights are standardized coefficients obtained at step 3. b Individual F values are at step of entry. *p < .05. **p < .01. ***p < .001.

82
Figure 1
A model of interpersonal learning processes in organizations
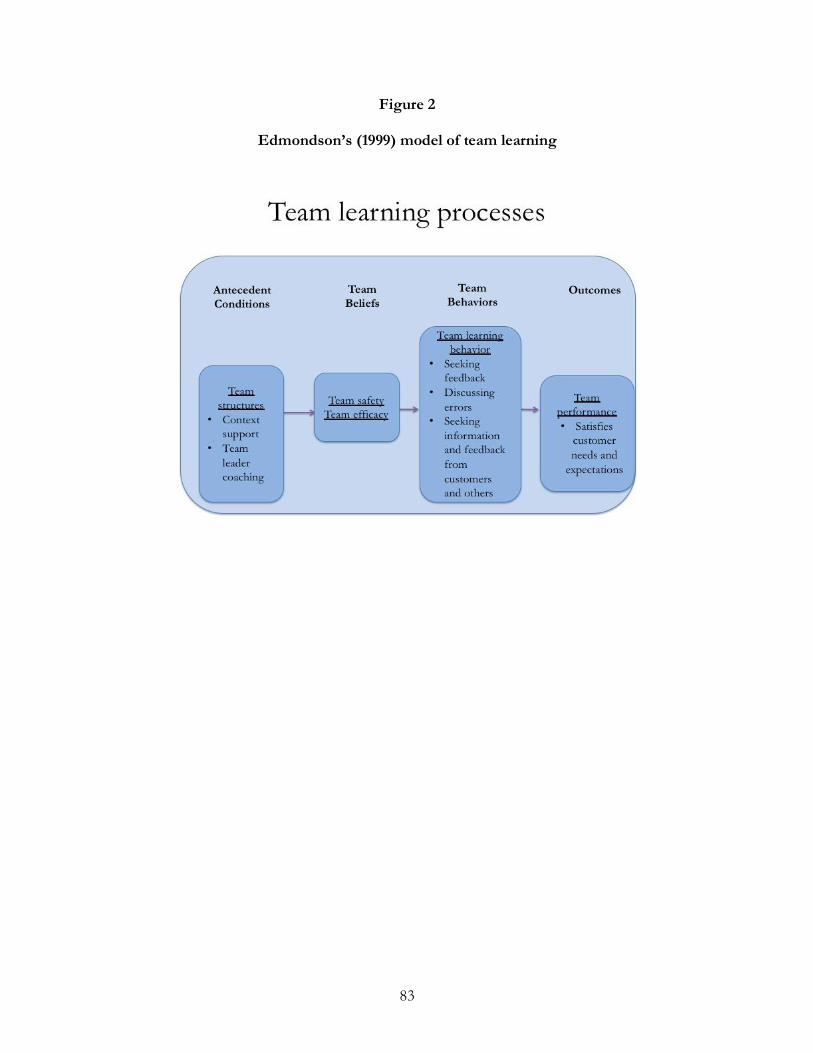
83
Figure 2
Edmondson’s (1999) model of team learning

84
Figure 3
Overview of data collection process

85
Figure 4
Q-Q Performance plot – Organizational sample

86
Figure 5
Q-Q learning agility plot – Organizational sample

87
Figure 6
Q-Q learning goal orientation plot – Organizational sample
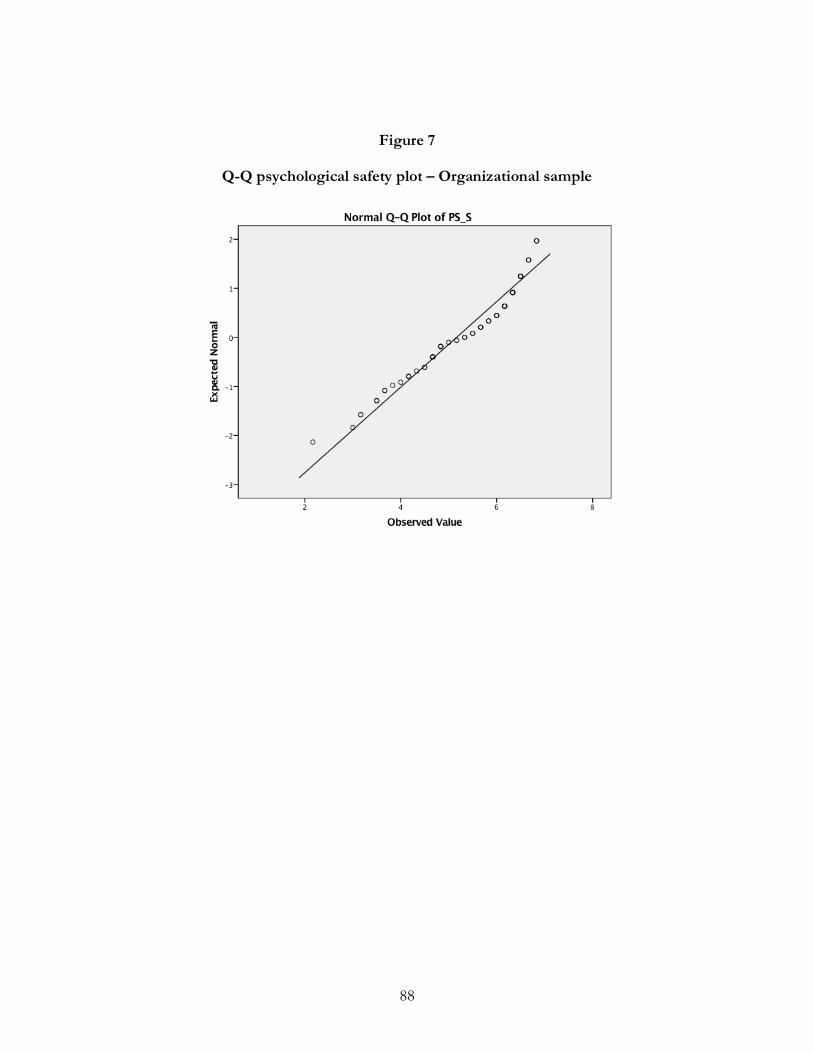
88
Figure 7
Q-Q psychological safety plot – Organizational sample

89
Figure 8
Q-Q manager coaching behavior plot – Organizational sample
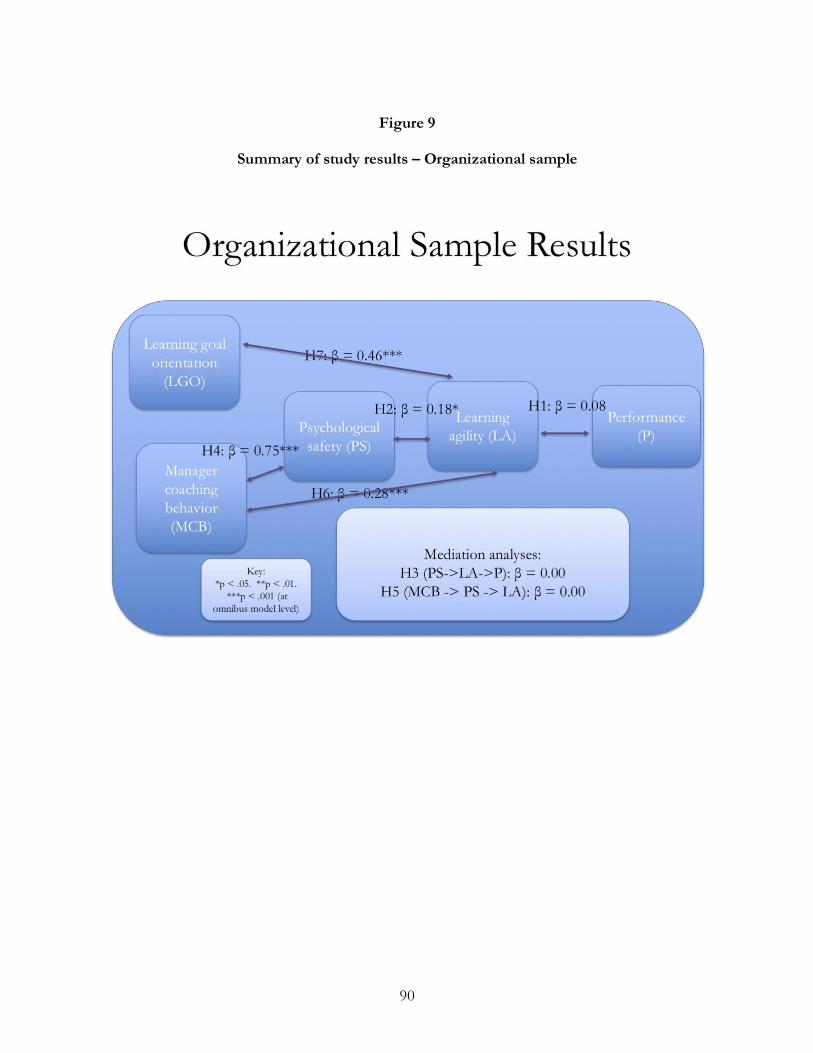
90
Figure 9
Summary of study results – Organizational sample

91
Figure 10
Q-Q learning agility plot – Crowd-sourced sample
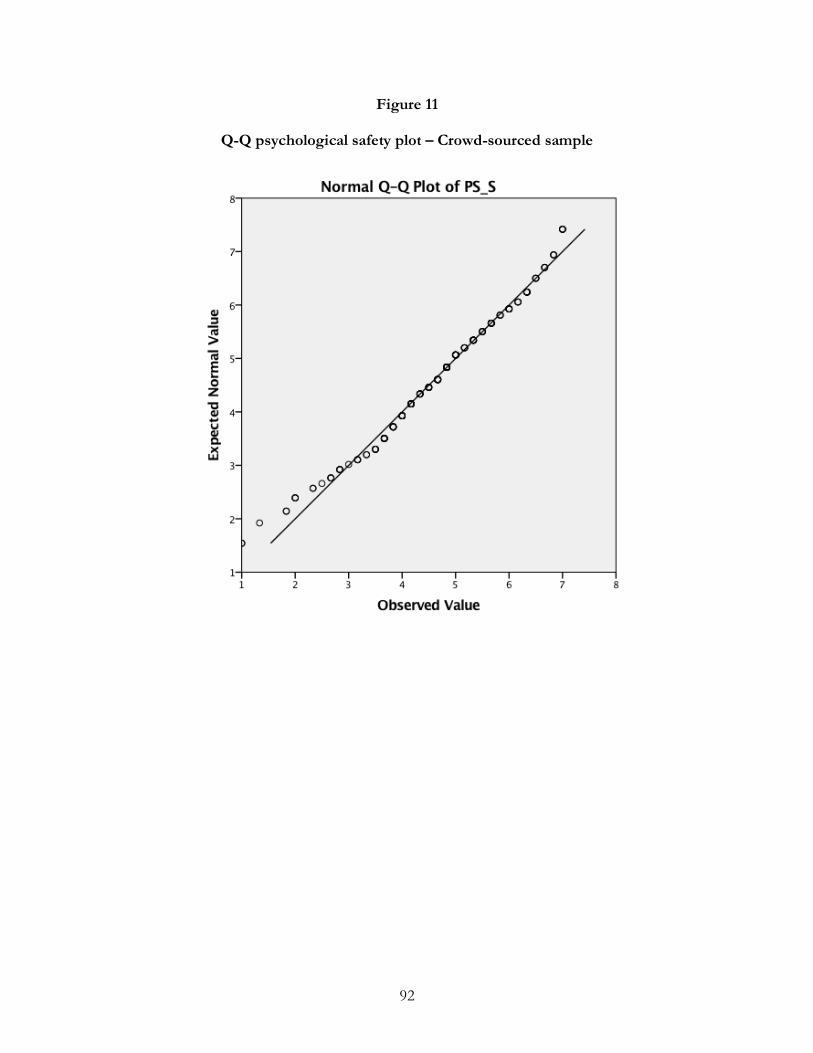
92
Figure 11
Q-Q psychological safety plot – Crowd-sourced sample

93
Figure 12
Q-Q learning goal orientation plot – Crowd-sourced sample

94
Figure 13
Q-Q manager coaching behavior – Crowd-sourced sample

95
Figure 14
Summary of study results – Crowd-sourced sample

96
Figure 15
Proposed model of interpersonal learning processes in organizations