COACHELLA VALLEY Q3 2016 SINGLE FAMILY HOMES MARKET … · Q3 2016 MARET REORT COACHELLA ALLEY See...
11
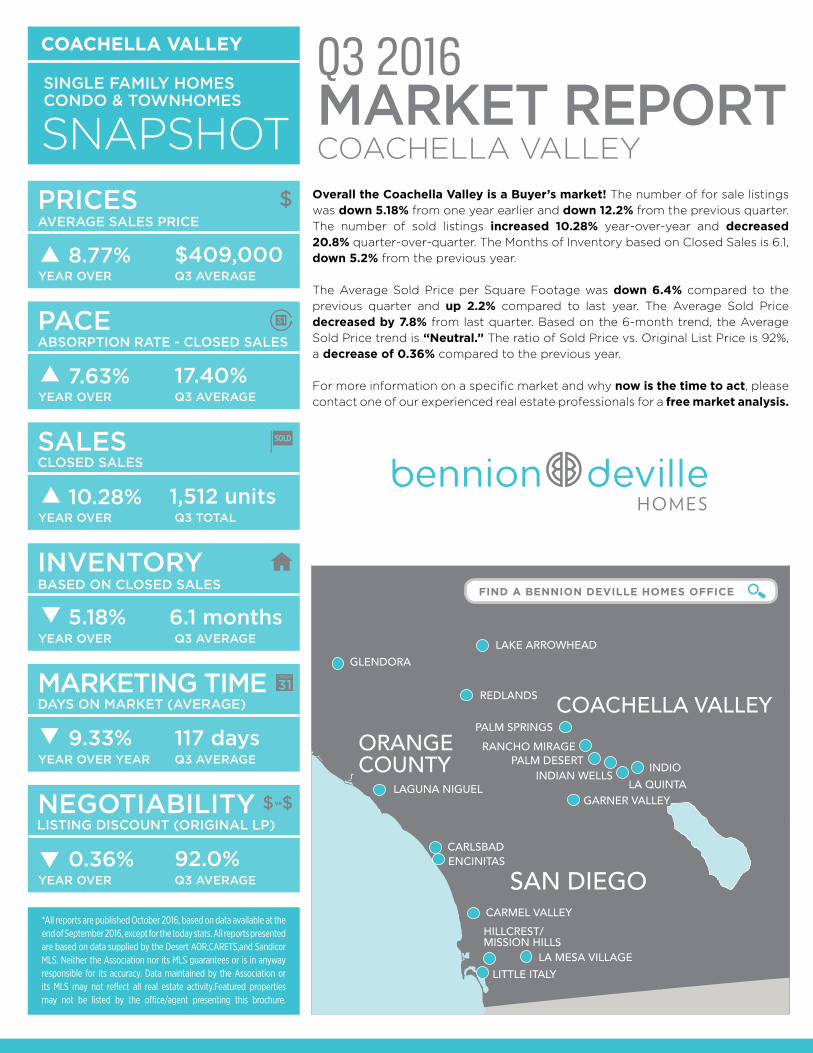
Q3 2016 MARKET REPORT COACHELLA VALLEY *All reports are published October 2016, based on data available at the end of September 2016, except for the today stats. All reports presented are based on data supplied by the Desert AOR,CARETS,and Sandicor MLS. Neither the Association nor its MLS guarantees or is in anyway responsible for its accuracy. Data maintained by the Association or its MLS may not reflect all real estate activity.Featured properties may not be listed by the office/agent presenting this brochure. PRICES AVERAGE SALES PRICE 8.77% YEAR OVER Q3 AVERAGE $409,000 PACE ABSORPTION RATE - CLOSED SALES 7.63% YEAR OVER Q3 AVERAGE 17.40% SALES CLOSED SALES 10.28% s YEAR OVER Q3 TOTAL 1,512 units INVENTORY BASED ON CLOSED SALES 5.18% YEAR OVER Q3 AVERAGE 6.1 months t MARKETING TIME DAYS ON MARKET (AVERAGE) 9.33% YEAR OVER YEAR Q3 AVERAGE 117 days NEGOTIABILITY LISTING DISCOUNT (ORIGINAL LP) 0.36% s YEAR OVER Q3 AVERAGE 92.0% PALM DESERT PALM SPRINGS LA QUINTA RANCHO MIRAGE INDIAN WELLS LA MESA VILLAGE INDIO LAKE ARROWHEAD LAGUNA NIGUEL GARNER VALLEY REDLANDS ENCINITAS COACHELLA VALLEY SAN DIEGO ORANGE COUNTY CARLSBAD CARMEL VALLEY HILLCREST/ MISSION HILLS LITTLE ITALY GLENDORA Overall the Coachella Valley is a Buyer’s market! The number of for sale listings was down 5.18% from one year earlier and down 12.2% from the previous quarter. The number of sold listings increased 10.28% year-over-year and decreased 20.8% quarter-over-quarter. The Months of Inventory based on Closed Sales is 6.1, down 5.2% from the previous year. The Average Sold Price per Square Footage was down 6.4% compared to the previous quarter and up 2.2% compared to last year. The Average Sold Price decreased by 7.8% from last quarter. Based on the 6-month trend, the Average Sold Price trend is “Neutral.” The ratio of Sold Price vs. Original List Price is 92%, a decrease of 0.36% compared to the previous year. For more information on a specific market and why now is the time to act, please contact one of our experienced real estate professionals for a free market analysis. SNAPSHOT SINGLE FAMILY HOMES CONDO & TOWNHOMES COACHELLA VALLEY s s s FIND A BENNION DEVILLE HOMES OFFICE
Transcript of COACHELLA VALLEY Q3 2016 SINGLE FAMILY HOMES MARKET … · Q3 2016 MARET REORT COACHELLA ALLEY See...
Q3 2016MARKET REPORTCOACHELLA VALLEY
*All reports are published October 2016, based on data available at the end of September 2016, except for the today stats. All reports presented are based on data supplied by the Desert AOR,CARETS,and Sandicor MLS. Neither the Association nor its MLS guarantees or is in anyway responsible for its accuracy. Data maintained by the Association or its MLS may not reflect all real estate activity.Featured properties may not be listed by the office/agent presenting this brochure.
PRICESAVERAGE SALES PRICE
8.77%YEAR OVER Q3 AVERAGE
$409,000
PACEABSORPTION RATE - CLOSED SALES
7.63%YEAR OVER Q3 AVERAGE
17.40%
SALESCLOSED SALES
10.28%sYEAR OVER Q3 TOTAL
1,512 units
INVENTORYBASED ON CLOSED SALES
5.18%YEAR OVER Q3 AVERAGE
6.1 monthst
MARKETING TIMEDAYS ON MARKET (AVERAGE)
9.33%YEAR OVER YEAR Q3 AVERAGE
117 days
NEGOTIABILITYLISTING DISCOUNT (ORIGINAL LP)
0.36%
s
YEAR OVER Q3 AVERAGE92.0%
PALM DESERT
PALM SPRINGS
LA QUINTA
RANCHO MIRAGE
INDIAN WELLS
LA MESA VILLAGE
INDIO
LAKE ARROWHEAD
LAGUNA NIGUELGARNER VALLEY
REDLANDS
ENCINITAS
COACHELLA VALLEY
SAN DIEGO
ORANGECOUNTY
CARLSBAD
CARMEL VALLEY
HILLCREST/MISSION HILLS
LITTLE ITALY
GLENDORA
Overall the Coachella Valley is a Buyer’s market! The number of for sale listings was down 5.18% from one year earlier and down 12.2% from the previous quarter. The number of sold listings increased 10.28% year-over-year and decreased 20.8% quarter-over-quarter. The Months of Inventory based on Closed Sales is 6.1, down 5.2% from the previous year.
The Average Sold Price per Square Footage was down 6.4% compared to the previous quarter and up 2.2% compared to last year. The Average Sold Price decreased by 7.8% from last quarter. Based on the 6-month trend, the Average Sold Price trend is “Neutral.” The ratio of Sold Price vs. Original List Price is 92%, a decrease of 0.36% compared to the previous year.
For more information on a specific market and why now is the time to act, please contact one of our experienced real estate professionals for a free market analysis.
SNAPSHOTSINGLE FAMILY HOMESCONDO & TOWNHOMES
COACHELLA VALLEY
s
s
s
FIND A BENNION DEVILLE HOMES OFFICE

Q3 2016 MARKET REPORT COACHELLA VALLEY
See Active Listings
See Active Listings
UnitsSold 2 5 6 3 4 7 11 13 22 29 29 15 14 15 8 13 4 8 14 8 10AverageSoldPrice 218,000 319,000 248,000 182,000 156,000 162,000 110,000 130,000 73,000 100,000 64,000 93,000 113,000 112,000 185,000 189,000 158,000 121,000 127,000 178,000 227,000
2005
0
5
10
15
20
25
30
35
0
50,000
100,000
150,000
200,000
250,000
300,000
350,000
AverageSoldPrice
UnitsSold
10 YEAR HISTORY
20162015201420132012201120102006 2007 2008 2009
20162015201420132012201120102006 2007 2008 2009
AVERAGE NUMBEROF SALES
AVERAGE SALES PRICE
Bermuda Dunes Single Family Detached Homes is a Buyer’s market! The number of for sale listings was down 8.1% from one year earlier and down 16.2% from the previous quarter. The number of sold listings increased 5% year-over-year and decreased 34.4% quarter-over-quarter. The Months of Inventory based on Closed Sales is 8.4, down 11.6% from the previous year. The Average Sold Price increased by 8.1% from last quarter. Based on the 6-month trend, the Average Sold Price trend is “Neutral.”
SINGLE FAMILY HOME
UnitsSold 13 17 20 14 19 17 21 25 19 45 37 37 38 19 29 24 21 18 20 15 21AverageSoldPrice 547,000 608,000 488,000 510,000 364,000 288,000 343,000 306,000 395,000 270,000 252,000 282,000 347,000 334,000 360,000 425,000 402,000 362,000 485,000 353,000 455,000
2005
0
5
10
15
20
25
30
35
40
45
50
0
100,000
200,000
300,000
400,000
500,000
600,000
700,000
AverageSoldPrice
UnitsSold
10 YEAR HISTORY
AVERAGE NUMBEROF SALES
AVERAGE SALES PRICE
CONDOMINIUM / TOWNHOME
BERMUDA DUNES 92203
MLS#: 216029718
MLS#: 216035314
CONDO/TOWNHOME SALES
Bermuda Dunes Condominium/Townhome is a Buyer’s market! The number of for sale listings was up 44.4% from one year earlier and the same as the previous quarter. The number of sold listings decreased 28.6% year-over-year and increased 11.1% quarter-over-quarter. The Months of Inventory based on Closed Sales is 7.2, up 89.5% from the previous year. The Average Sold Price increased by 58.0% from last quarter. Based on the 6-month trend, the Average Sold Price trend is “Appreciating.”
SINGLE FAMILY SALESQ32016
Q22016
Q32015
Q%CHG
YR%CHG
LISTING INVENTORYMONTHS TO SELL INVENTORYAVERAGE PRICE PER SFAVERAGE SP/AVERAGE LPAVERAGE DAYS ON MARKETAVERAGE SALE PRICEUNITS SOLD
s
s
t
s
t
21 32 20454,900 420,800 485,100
34.4 5.0s
8.1 6.26.8 30.50.7 0.63.6 8.6t
25.4s 11.6t
16.2 8.1t
124 133 9596.1% 95.4% 95.5%170.6 176.9 186.68.4 6.7 9.557 68 62
t
ts
t
Q32016
Q22016
Q32015
Q%CHG
YR%CHG
LISTING INVENTORYMONTHS TO SELL INVENTORYAVERAGE PRICE PER SFAVERAGE SP/AVERAGE LPAVERAGE DAYS ON MARKETAVERAGE SALE PRICEUNITS SOLD
s
st
s
t
s
t
ss
s
10 9 14227,000 143,700 126,900
11.1s 28.658.0 78.927.4 3.81.3 0.8s
0.9 11.427.3 89.50 44.4
82 113 7996.9% 98.2% 96.1%125.7 124.6 112.87.2 9.9 3.826 26 18
t

Q3 2016 MARKET REPORT COACHELLA VALLEY
See Active Listings
See Active Listings
SINGLE FAMILY SALES
UnitsSold 35 30 31 47 41 19 54 44 31 52 34 65 38 38 46 38 33 37 28 44 36AverageSoldPrice 235,000 265,000 207,000 192,000 178,000 135,000 123,000 125,000 127,000 125,000 104,000 114,000 105,000 128,000 127,000 144,000 138,000 127,000 158,000 136,000 152,000
0
10
20
30
40
50
60
70
0
50,000
100,000
150,000
200,000
250,000
300,000
AverageSoldPrice
UnitsSold
10 YEAR HISTORY
AVERAGE NUMBEROF SALES
AVERAGE SALES PRICE
Cathedral City Single Family Detached Homes is a Neutral market! The number of for sale listings was up 4.1% from one year earlier and down 8.3% from the previous quarter. The number of sold listings increased 34.2% year-over-year and increased 11.3% quarter-over-quarter. The Months of Inventory based on Closed Sales is 3.4, down 15% from the previous year. The Average Sold Price increased by 7.1% from last quarter. Based on the 6-month trend, the Average Sold Price trend is “Neutral.”
SINGLE FAMILY HOMES
CONDO/TOWNHOME SALES
UnitsSold 153 143 84 104 220 257 278 254 247 196 248 235 202 178 148 102 143 147 117 120 157AverageSoldPrice 384,000 367,000 360,000 349,000 240,000 183,000 176,000 178,000 192,000 194,000 153,000 162,000 177,000 206,000 224,000 245,000 249,000 262,000 287,000 277,000 289,000
2005
0
50
100
150
200
250
300
0
50,000
100,000
150,000
200,000
250,000
300,000
350,000
400,000
450,000
AverageSoldPrice
UnitsSold
10 YEAR HISTORY
AVERAGE NUMBEROF SALES
AVERAGE SALES PRICE
Cathedral City Condominium/Townhome is a Buyer’s market! The number of for sale listings was down 28.9% from one year earlier and down 14.2% from the previous quarter. The number of sold listings increased 28.6% year-over-year and decreased 33.3% quarter-over-quarter. The Months of Inventory based on Closed Sales is 7.6, down 40.6% from the previous year. The Average Sold Price was down 0.3% from last quarter. Based on the 6-month trend, the Average Sold Price trend is “Neutral.”
CONDOMINIUM / TOWNHOME
CATHEDRAL CITY 92234, 92235, 92236
MLS#: 216033594
MLS#: 216026506Courtesy: Tarbell Realtors
Q32016
Q22016
Q32015
Q%CHG
YR%CHG
LISTING INVENTORYMONTHS TO SELL INVENTORYAVERAGE PRICE PER SFAVERAGE SP/AVERAGE LPAVERAGE DAYS ON MARKETAVERAGE SALE PRICEUNITS SOLD
s
t t
s
s
s
s
t
157 141 117289,200 270,100 286,600
11.3 34.2s
7.1 0.9s
16.5 8.50.6 0.2s
1.7 0.5s
26.1 15.0t
8.3t 4.1
86 103 9497.6% 97.0% 97.4%159.3 156.7 158.53.4 4.6 4176 192 169
Q32016
Q22016
Q32015
Q%CHG
YR%CHG
LISTING INVENTORYMONTHS TO SELL INVENTORYAVERAGE PRICE PER SFAVERAGE SP/AVERAGE LPAVERAGE DAYS ON MARKETAVERAGE SALE PRICEUNITS SOLD
t
t
s s
s
t t
t
s
s
t
st36 54 28151,700 152,100 157,900
33.3 28.60.3 3.96.5 38.22.8 1.40.1 1.916.9 40.614.2 28.9t
115 123 18696.6% 94.0% 95.3%119 118.9 116.87.6 6.5 12.891 106 128
20162015201420132012201120102006 2007 2008 2009
20162015201420132012201120102006 2007 2008 2009
Q3 2016 MARKET REPORT COACHELLA VALLEY
See Active Listings
See Active Listings
SINGLE FAMILY SALES
UnitsSold 279 148 121 108 319 409 380 332 284 269 256 229 184 176 143 129 124 109 166 120 132AverageSoldPrice 281,000 278,000 254,000 191,000 140,000 88,000 99,000 100,000 102,000 95,000 86,000 94,000 98,000 119,000 144,000 138,000 146,000 145,000 166,000 176,000 189,000
2005
0
50
100
150
200
250
300
350
400
450
0
50,000
100,000
150,000
200,000
250,000
300,000
AverageSoldPrice
UnitsSold
10 YEAR HISTORY
AVERAGE NUMBEROF SALES
AVERAGE SALES PRICE
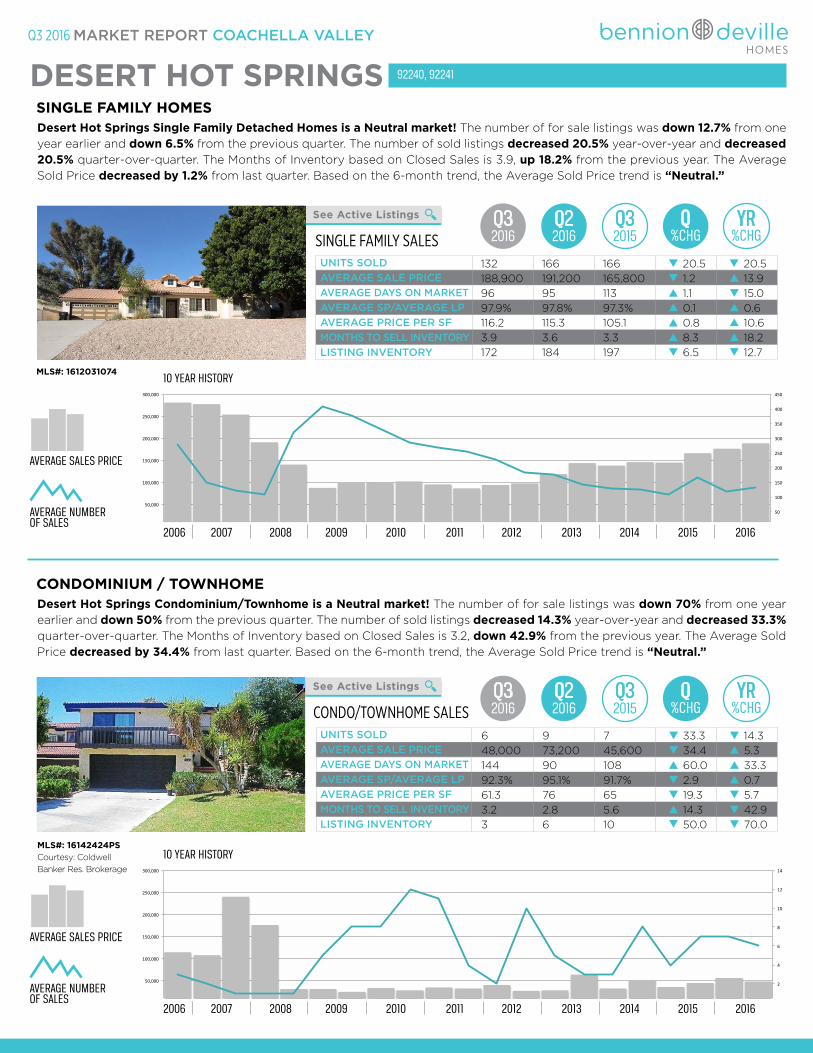
Desert Hot Springs Single Family Detached Homes is a Neutral market! The number of for sale listings was down 12.7% from one year earlier and down 6.5% from the previous quarter. The number of sold listings decreased 20.5% year-over-year and decreased 20.5% quarter-over-quarter. The Months of Inventory based on Closed Sales is 3.9, up 18.2% from the previous year. The Average Sold Price decreased by 1.2% from last quarter. Based on the 6-month trend, the Average Sold Price trend is “Neutral.”
SINGLE FAMILY HOMES
UnitsSold 3 2 1 1 1 5 8 8 12 11 4 2 10 5 3 3 8 4 7 7 6AverageSoldPrice 114,000 108,000 240,000 176,000 31,000 31,000 25,000 33,000 28,000 35,000 32,000 40,000 27,000 28,000 64,000 32,000 52,000 36,000 45,000 56,000 48,000
2005
0
2
4
6
8
10
12
14
0
50,000
100,000
150,000
200,000
250,000
300,000
AverageSoldPrice
UnitsSold
10 YEAR HISTORY
AVERAGE NUMBEROF SALES
AVERAGE SALES PRICE
Desert Hot Springs Condominium/Townhome is a Neutral market! The number of for sale listings was down 70% from one year earlier and down 50% from the previous quarter. The number of sold listings decreased 14.3% year-over-year and decreased 33.3% quarter-over-quarter. The Months of Inventory based on Closed Sales is 3.2, down 42.9% from the previous year. The Average Sold Price decreased by 34.4% from last quarter. Based on the 6-month trend, the Average Sold Price trend is “Neutral.”
CONDOMINIUM / TOWNHOME
DESERT HOT SPRINGS 92240, 92241
CONDO/TOWNHOME SALES
MLS#: 1612031074
MLS#: 16142424PSCourtesy: Coldwell Banker Res. Brokerage
Q32016
Q22016
Q32015
Q%CHG
YR%CHG
LISTING INVENTORYMONTHS TO SELL INVENTORYAVERAGE PRICE PER SFAVERAGE SP/AVERAGE LPAVERAGE DAYS ON MARKETAVERAGE SALE PRICEUNITS SOLD
s
s s
s
t
s
t
t
t
132 166 166188,900 191,200 165,800
20.5 20.5t
1.2 13.9s
1.1 15.00.1 0.60.8 10.6s
8.3 18.2s
6.5 12.7t
96 95 11397.9% 97.8% 97.3%116.2 115.3 105.13.9 3.6 3.3172 184 197
Q32016
Q22016
Q32015
Q%CHG
YR%CHG
LISTING INVENTORYMONTHS TO SELL INVENTORYAVERAGE PRICE PER SFAVERAGE SP/AVERAGE LPAVERAGE DAYS ON MARKETAVERAGE SALE PRICEUNITS SOLD
s
t
st
s
t
t
s
st
t6 9 748,000 73,200 45,600
33.3 14.334.4 5.360.0 33.32.9 0.719.3 5.7t
14.3 42.950.0 70.0t
144 90 10892.3% 95.1% 91.7%61.3 76 653.2 2.8 5.63 6 10
t
20162015201420132012201120102006 2007 2008 2009
20162015201420132012201120102006 2007 2008 2009
Q3 2016 MARKET REPORT COACHELLA VALLEY
See Active Listings
See Active Listings
SINGLE FAMILY SALES
UnitsSold 19 42 28 17 21 20 31 38 30 57 35 77 35 76 34 56 37 45 35 51 41AverageSoldPrice 1,334,000 1,335,000 1,530,000 1,175,000 1,366,000 928,000 829,000 821,000 858,000 907,000 755,000 974,000 950,000 1,186,000 959,000 1,191,000 1,008,000 1,104,000 1,099,000 934,000 1,114,000
2005
0
10
20
30
40
50
60
70
80
90
0
200,000
400,000
600,000
800,000
1,000,000
1,200,000
1,400,000
1,600,000
1,800,000
AverageSoldPrice
UnitsSold
10 YEAR HISTORY
AVERAGE NUMBEROF SALES
AVERAGE SALES PRICE
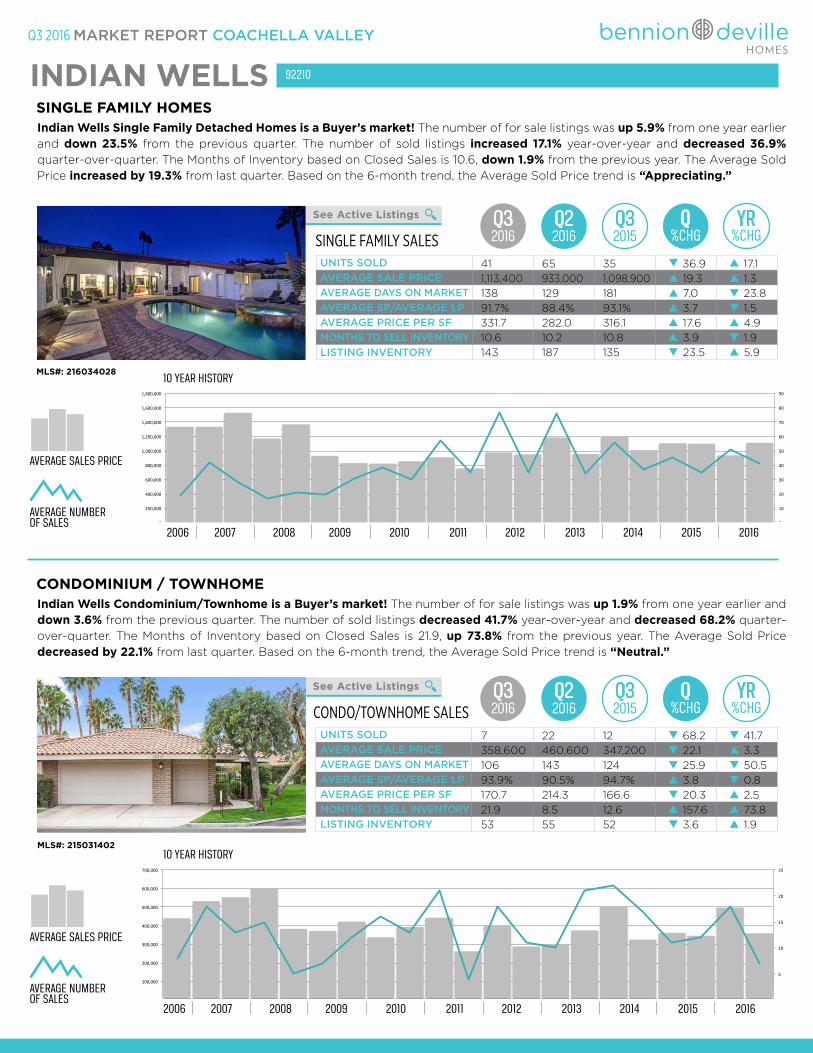
Indian Wells Single Family Detached Homes is a Buyer’s market! The number of for sale listings was up 5.9% from one year earlier and down 23.5% from the previous quarter. The number of sold listings increased 17.1% year-over-year and decreased 36.9% quarter-over-quarter. The Months of Inventory based on Closed Sales is 10.6, down 1.9% from the previous year. The Average Sold Price increased by 19.3% from last quarter. Based on the 6-month trend, the Average Sold Price trend is “Appreciating.”
SINGLE FAMILY HOMES
CONDO/TOWNHOME SALES
UnitsSold 8 18 13 15 5 7 12 16 13 21 4 18 11 10 21 22 17 11 12 18 7AverageSoldPrice 440,000 532,000 552,000 600,000 383,000 371,000 421,000 338,000 393,000 444,000 261,000 398,000 287,000 302,000 375,000 505,000 324,000 361,000 347,000 497,000 359,000
0
5
10
15
20
25
0
100,000
200,000
300,000
400,000
500,000
600,000
700,000
AverageSoldPrice
UnitsSold
10 YEAR HISTORY
AVERAGE NUMBEROF SALES
AVERAGE SALES PRICE
Indian Wells Condominium/Townhome is a Buyer’s market! The number of for sale listings was up 1.9% from one year earlier and down 3.6% from the previous quarter. The number of sold listings decreased 41.7% year-over-year and decreased 68.2% quarter-over-quarter. The Months of Inventory based on Closed Sales is 21.9, up 73.8% from the previous year. The Average Sold Price decreased by 22.1% from last quarter. Based on the 6-month trend, the Average Sold Price trend is “Neutral.”
CONDOMINIUM / TOWNHOME
INDIAN WELLS 92210
MLS#: 216034028
MLS#: 215031402
Q32016
Q22016
Q32015
Q%CHG
YR%CHG
LISTING INVENTORYMONTHS TO SELL INVENTORYAVERAGE PRICE PER SFAVERAGE SP/AVERAGE LPAVERAGE DAYS ON MARKETAVERAGE SALE PRICEUNITS SOLD
t
ts
s
ts
t
s
s
s
s
st41 65 351,113,400 933,000 1,098,900
36.9 17.119.3 1.37.0 23.83.7 1.517.6 4.93.9 1.923.5 5.9s
138 129 18191.7% 88.4% 93.1%331.7 282.0 316.110.6 10.2 10.8143 187 135
Q32016
Q22016
Q32015
Q%CHG
YR%CHG
LISTING INVENTORYMONTHS TO SELL INVENTORYAVERAGE PRICE PER SFAVERAGE SP/AVERAGE LPAVERAGE DAYS ON MARKETAVERAGE SALE PRICEUNITS SOLD
s
s
s
t
s
t
t
s
t
t
t7 22 12358,600 460,600 347,200
68.2 41.722.1 3.325.9 50.5t
3.8 0.8t
20.3 2.5157.6 73.83.6 1.9s
106 143 12493.9% 90.5% 94.7%170.7 214.3 166.621.9 8.5 12.653 55 52
20162015201420132012201120102006 2007 2008 2009
20162015201420132012201120102006 2007 2008 2009
Q3 2016 MARKET REPORT COACHELLA VALLEY
See Active Listings
See Active Listings
UnitsSold 234 159 104 174 372 406 441 450 367 432 385 413 337 341 279 266 237 276 282 292 309AverageSoldPrice 392,000 394,000 428,000 342,000 233,000 190,000 183,000 209,000 202,000 200,000 175,000 197,000 194,000 225,000 265,000 280,000 291,000 298,000 302,000 296,000 321,000
2005
0
50
100
150
200
250
300
350
400
450
500
0
50,000
100,000
150,000
200,000
250,000
300,000
350,000
400,000
450,000
AverageSoldPrice
UnitsSold
10 YEAR HISTORY
AVERAGE NUMBEROF SALES
AVERAGE SALES PRICE
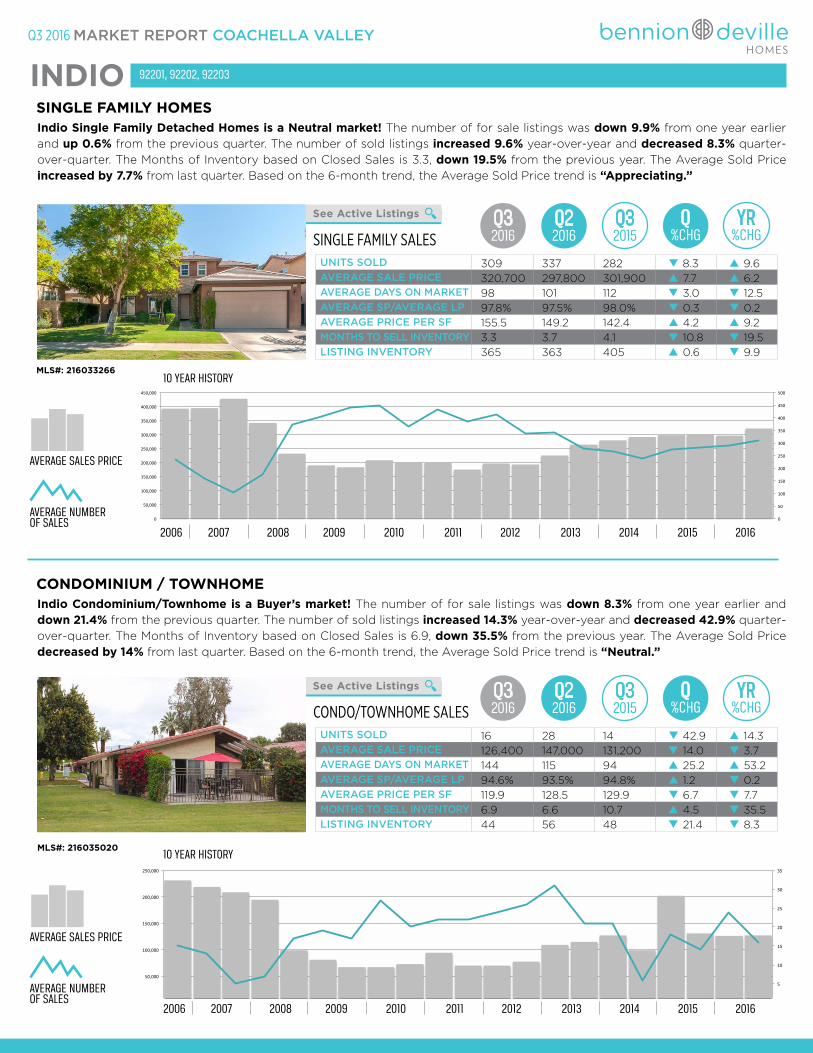
Indio Single Family Detached Homes is a Neutral market! The number of for sale listings was down 9.9% from one year earlier and up 0.6% from the previous quarter. The number of sold listings increased 9.6% year-over-year and decreased 8.3% quarter-over-quarter. The Months of Inventory based on Closed Sales is 3.3, down 19.5% from the previous year. The Average Sold Price increased by 7.7% from last quarter. Based on the 6-month trend, the Average Sold Price trend is “Appreciating.”
SINGLE FAMILY HOMES
UnitsSold 15 13 5 7 17 19 17 27 20 22 22 24 26 31 21 21 6 18 14 24 16AverageSoldPrice 231,000 219,000 209,000 195,000 99,000 81,000 67,000 67,000 73,000 94,000 70,000 70,000 78,000 109,000 115,000 127,000 99,000 202,000 131,000 126,000 127,000
2005
0
5
10
15
20
25
30
35
0
50,000
100,000
150,000
200,000
250,000
AverageSoldPrice
UnitsSold
10 YEAR HISTORY
AVERAGE NUMBEROF SALES
AVERAGE SALES PRICE
Indio Condominium/Townhome is a Buyer’s market! The number of for sale listings was down 8.3% from one year earlier and down 21.4% from the previous quarter. The number of sold listings increased 14.3% year-over-year and decreased 42.9% quarter-over-quarter. The Months of Inventory based on Closed Sales is 6.9, down 35.5% from the previous year. The Average Sold Price decreased by 14% from last quarter. Based on the 6-month trend, the Average Sold Price trend is “Neutral.”
CONDOMINIUM / TOWNHOME
INDIO 92201, 92202, 92203
MLS#: 216033266
MLS#: 216035020
CONDO/TOWNHOME SALES
SINGLE FAMILY SALES
Q32016
Q22016
Q32015
Q%CHG
YR%CHG
LISTING INVENTORYMONTHS TO SELL INVENTORYAVERAGE PRICE PER SFAVERAGE SP/AVERAGE LPAVERAGE DAYS ON MARKETAVERAGE SALE PRICEUNITS SOLD
t
s
s
t t
s
s
t16 28 14126,400 147,000 131,200
42.9 14.314.0 3.725.2 53.2s
t1.2 0.2t6.7 7.7
4.5 35.521.4 8.3t
144 115 9494.6% 93.5% 94.8%119.9 128.5 129.96.9 6.6 10.744 56 48
t
t
Q32016
Q22016
Q32015
Q%CHG
YR%CHG
LISTING INVENTORYMONTHS TO SELL INVENTORYAVERAGE PRICE PER SFAVERAGE SP/AVERAGE LPAVERAGE DAYS ON MARKETAVERAGE SALE PRICEUNITS SOLD
s
t
t
s s
s
t
t309 337 282320,700 297,800 301,900
8.3 9.67.7 6.23.0 12.5t
t0.3 0.2s4.2 9.2
10.8 19.50.6 9.9t
98 101 11297.8% 97.5% 98.0%155.5 149.2 142.43.3 3.7 4.1365 363 405
t
s
20162015201420132012201120102006 2007 2008 2009
20162015201420132012201120102006 2007 2008 2009

Q3 2016 MARKET REPORT COACHELLA VALLEY
See Active Listings
See Active Listings
SINGLE FAMILY SALES
UnitsSold 187 252 190 219 261 220 276 272 269 294 336 340 277 320 268 313 244 251 244 237 268AverageSoldPrice 698,000 906,000 658,000 786,000 499,000 460,000 443,000 546,000 500,000 474,000 377,000 481,000 449,000 500,000 544,000 670,000 496,000 767,000 483,000 698,000 564,000
0
50
100
150
200
250
300
350
400
0
100,000
200,000
300,000
400,000
500,000
600,000
700,000
800,000
900,000
1,000,000
AverageSoldPrice
UnitsSold
10 YEAR HISTORY
TOTAL NUMBEROF SALES
AVERAGE SALES PRICE
La Quinta Single Family Detached Homes is a Buyer’s market! The number of for sale listings was up 4.3% from one year earlier and down 16.9% from the previous quarter. The number of sold listings increased 9.8% year-over-year and decreased 23.2% quarter-over-quarter. The Months of Inventory based on Closed Sales is 6.5, down 4.4% from the previous year. The Average Sold Price decreased by 7.7% from last quarter. Based on the 6-month trend, the Average Sold Price trend is “Neutral.”
SINGLE FAMILY HOMES
UnitsSold 27 35 14 29 32 31 57 69 34 65 32 57 52 85 47 72 37 54 44 61 59AverageSoldPrice 394,000 537,000 372,000 432,000 396,000 325,000 290,000 299,000 283,000 302,000 312,000 292,000 281,000 305,000 325,000 361,000 413,000 335,000 305,000 311,000 331,000
0
10
20
30
40
50
60
70
80
90
0
100,000
200,000
300,000
400,000
500,000
600,000
AverageSoldPrice
UnitsSold
10 YEAR HISTORY
AVERAGE NUMBEROF SALES
AVERAGE SALES PRICE
La Quinta Condominium/Townhome is a Buyer’s market! The number of for sale listings was up 4.2% from one year earlier and down 22.8% from the previous quarter. The number of sold listings increased 34.1% year-over-year and decreased 9.2% quarter-over-quarter. The Months of Inventory based on Closed Sales is 7.7, down 18.9% from the previous year. The Average Sold Price decreased by 0.7% from last quarter. Based on the 6-month trend, the Average Sold Price trend is “Neutral.”
CONDOMINIUM / TOWNHOME
LA QUINTA 92247, 92248, 92253
MLS#: 216029110
MLS#: 216024196
CONDO/TOWNHOME SALES
Q32016
Q22016
Q32015
Q%CHG
YR%CHG
LISTING INVENTORYMONTHS TO SELL INVENTORYAVERAGE PRICE PER SFAVERAGE SP/AVERAGE LPAVERAGE DAYS ON MARKETAVERAGE SALE PRICEUNITS SOLD
s
t
s
st
s
t
t
t
t
t t
t
268 349 244563,900 610,700 483,100
23.2 9.87.7 16.710.1 6.50.4 0.4t
5.6 7.18.5 4.416.9 4.3
116 129 12495.6% 96.0% 96.0%234.5 248.3 219.06.5 7.1 6.8588 708 564
Q32016
Q22016
Q32015
Q%CHG
YR%CHG
LISTING INVENTORYMONTHS TO SELL INVENTORYAVERAGE PRICE PER SFAVERAGE SP/AVERAGE LPAVERAGE DAYS ON MARKETAVERAGE SALE PRICEUNITS SOLD
t
t
s
t s
t s
t
t
59 65 44331,100 333,600 304,400
9.2 34.10.7 8.89.8 11.01.6 1.2t
4.8t 8.5t
23.0 18.922.8 4.2s
146 133 16493.8% 95.3% 94.9%179.1 188.2 195.87.7 10 9.5149 193 143
t
20162015201420132012201120102006 2007 2008 2009
20162015201420132012201120102006 2007 2008 2009

Q3 2016 MARKET REPORT COACHELLA VALLEY
See Active Listings
See Active Listings
SINGLE FAMILY SALES
UnitsSold 173 194 141 171 178 142 206 216 205 244 241 272 238 301 229 231 214 237 242 235 265AverageSoldPrice 569,000 643,000 658,000 719,000 541,000 413,000 413,000 456,000 348,000 409,000 340,000 422,000 318,000 460,000 439,000 508,000 422,000 477,000 442,000 451,000 429,000
0
50
100
150
200
250
300
350
0
100,000
200,000
300,000
400,000
500,000
600,000
700,000
800,000
AverageSoldPrice
UnitsSold
10 YEAR HISTORY
AVERAGE NUMBEROF SALES
AVERAGE SALES PRICE
Palm Desert Single Family Detached Homes is a Neutral market! The number of for sale listings was up 1.8% from one year earlier and down 9.8% from the previous quarter. The number of sold listings increased 9.5% year-over-year and decreased 25.4% quarter-over-quarter. The Months of Inventory based on Closed Sales is 4.5, down 10.0% from the previous year. The Average Sold Price decreased by 12.2% from last quarter. Based on the 6-month trend, the Average Sold Price trend is “Neutral.”
SINGLE FAMILY HOMES
UnitsSold 116 151 116 150 118 62 136 175 151 194 151 207 169 216 179 202 151 194 145 187 182AverageSoldPrice 386,000 416,000 388,000 379,000 327,000 332,000 216,000 248,000 199,000 237,000 210,000 225,000 220,000 241,000 252,000 287,000 279,000 291,000 277,000 283,000 267,000
0
50
100
150
200
250
0
50,000
100,000
150,000
200,000
250,000
300,000
350,000
400,000
450,000
AverageSoldPrice
UnitsSold
10 YEAR HISTORY
AVERAGE NUMBEROF SALES
AVERAGE SALES PRICE
Palm Desert Condominium/Townhome is a Buyer’s market! The number of for sale listings was down 1.2% from one year earlier and down 16.3% from the previous quarter. The number of sold listings increased 25.5% year-over-year and decreased 31.1% quarter-over-quarter. The Months of Inventory based on Closed Sales is 6.8, down 17.1% from the previous year. The Average Sold Price decreased by 3.7% from last quarter. Based on the 6-month trend, the Average Sold Price trend is “Depreciating.”
CONDOMINIUM / TOWNHOME
PALM DESERT 92211, 92260
MLS#: 216030186
MLS#: 216026896
CONDO/TOWNHOME SALES
Q32016
Q22016
Q32015
Q%CHG
YR%CHG
LISTING INVENTORYMONTHS TO SELL INVENTORYAVERAGE PRICE PER SFAVERAGE SP/AVERAGE LPAVERAGE DAYS ON MARKETAVERAGE SALE PRICEUNITS SOLD
st
t
t s
t s
t
t
265 355 242428,500 487,800 441,400
25.4 9.512.2 2.91.7 10.30 0.3s
7.3 0.50 10.09.8 1.8
122 120 13695.8% 95.8% 95.5%206.8 223.1 205.84.5 4.5 5405 449 398
Q32016
Q22016
Q32015
Q%CHG
YR%CHG
LISTING INVENTORYMONTHS TO SELL INVENTORYAVERAGE PRICE PER SFAVERAGE SP/AVERAGE LPAVERAGE DAYS ON MARKETAVERAGE SALE PRICEUNITS SOLD
s
t
t t
t
tt492
t
t182 264 145266,700 277,000 277,000
31.1 25.5s
3.7 3.71.6 13.8t
0.7 1.0t
4.4 5.8t
7.9 17.116.3 1.2
125 127 14594.4% 95.1% 95.4%168.7 176.5 179.06.8 6.3 8.2412 417
t
s t
20162015201420132012201120102006 2007 2008 2009
20162015201420132012201120102006 2007 2008 2009
Q3 2016 MARKET REPORT COACHELLA VALLEY
See Active Listings
See Active Listings
UnitsSold 258 275 228 174 260 208 338 324 312 324 306 329 407 271 235 212 213 206 201 208 270AverageSoldPrice 723,000 686,000 681,000 662,000 533,000 431,000 411,000 417,000 421,000 460,000 430,000 438,000 460,000 461,000 512,000 616,000 641,000 580,000 624,000 650,000 702,000
0
50
100
150
200
250
300
350
400
450
0
100,000
200,000
300,000
400,000
500,000
600,000
700,000
800,000
AverageSoldPrice
UnitsSold
10 YEAR HISTORY
AVERAGE NUMBEROF SALES
AVERAGE SALES PRICE
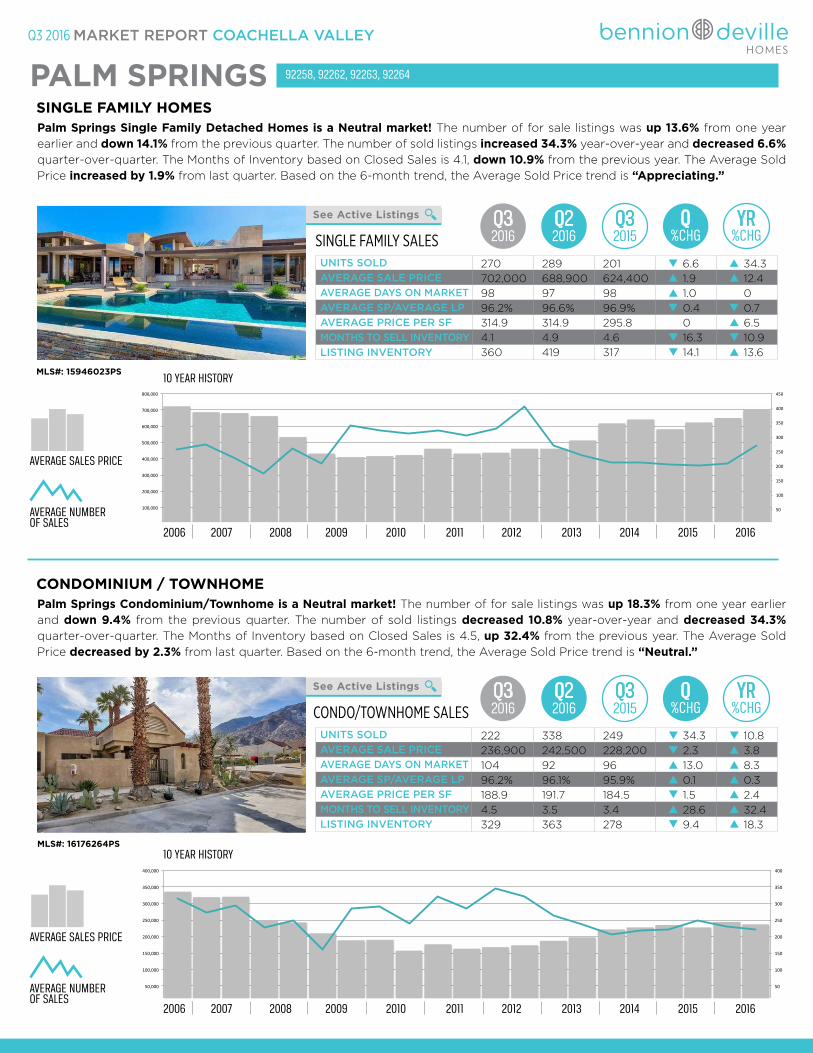
Palm Springs Single Family Detached Homes is a Neutral market! The number of for sale listings was up 13.6% from one year earlier and down 14.1% from the previous quarter. The number of sold listings increased 34.3% year-over-year and decreased 6.6% quarter-over-quarter. The Months of Inventory based on Closed Sales is 4.1, down 10.9% from the previous year. The Average Sold Price increased by 1.9% from last quarter. Based on the 6-month trend, the Average Sold Price trend is “Appreciating.”
SINGLE FAMILY HOMES
CONDO/TOWNHOME SALES
UnitsSold 314 272 294 226 248 162 285 290 241 321 286 344 320 263 237 206 219 222 250 230 222AverageSoldPrice 336,000 319,000 321,000 247,000 243,000 209,000 189,000 190,000 157,000 176,000 163,000 167,000 174,000 187,000 197,000 222,000 228,000 235,000 228,000 244,000 237,000
0
50
100
150
200
250
300
350
400
0
50,000
100,000
150,000
200,000
250,000
300,000
350,000
400,000
AverageSoldPrice
UnitsSold
10 YEAR HISTORY
AVERAGE NUMBEROF SALES
AVERAGE SALES PRICE
Palm Springs Condominium/Townhome is a Neutral market! The number of for sale listings was up 18.3% from one year earlier and down 9.4% from the previous quarter. The number of sold listings decreased 10.8% year-over-year and decreased 34.3% quarter-over-quarter. The Months of Inventory based on Closed Sales is 4.5, up 32.4% from the previous year. The Average Sold Price decreased by 2.3% from last quarter. Based on the 6-month trend, the Average Sold Price trend is “Neutral.”
CONDOMINIUM / TOWNHOME
PALM SPRINGS 92258, 92262, 92263, 92264
MLS#: 15946023PS
MLS#: 16176264PS
SINGLE FAMILY SALESQ32016
Q22016
Q32015
Q%CHG
YR%CHG
LISTING INVENTORYMONTHS TO SELL INVENTORYAVERAGE PRICE PER SFAVERAGE SP/AVERAGE LPAVERAGE DAYS ON MARKETAVERAGE SALE PRICEUNITS SOLD
s
s
t
st
s
270 289 201702,000 688,900 624,400
6.6 34.3s
1.9 12.41.0 00.4 0.7t
0 6.5s
16.3t 10.914.1 13.6
98 97 9896.2% 96.6% 96.9%314.9 314.9 295.84.1 4.9 4.6360 419 317
t
Q32016
Q22016
Q32015
Q%CHG
YR%CHG
LISTING INVENTORYMONTHS TO SELL INVENTORYAVERAGE PRICE PER SFAVERAGE SP/AVERAGE LPAVERAGE DAYS ON MARKETAVERAGE SALE PRICEUNITS SOLD
s
t t
st
s
s
t
t
s
222 338 249236,900 242,500 228,200
34.3 10.82.3 3.813.0 8.30.1 0.3s
1.5 2.4s
28.6s 32.49.4 18.3
104 92 9696.2% 96.1% 95.9%188.9 191.7 184.54.5 3.5 3.4329 363 278
t
s
20162015201420132012201120102006 2007 2008 2009
20162015201420132012201120102006 2007 2008 2009
Q3 2016 MARKET REPORT COACHELLA VALLEY
See Active Listings
See Active Listings
SINGLE FAMILY SALES
UnitsSold 110 115 105 104 99 72 110 129 112 126 126 126 119 135 112 100 109 94 78 111 101AverageSoldPrice 1,020,000 1,045,000 1,038,000 934,000 642,000 793,000 715,000 692,000 650,000 677,000 657,000 638,000 606,000 579,000 754,000 802,000 741,000 756,000 677,000 884,000 732,000
0
20
40
60
80
100
120
140
160
0
200,000
400,000
600,000
800,000
1,000,000
1,200,000
AverageSoldPrice
UnitsSold
10 YEAR HISTORY
AVERAGE NUMBEROF SALES
AVERAGE SALES PRICE
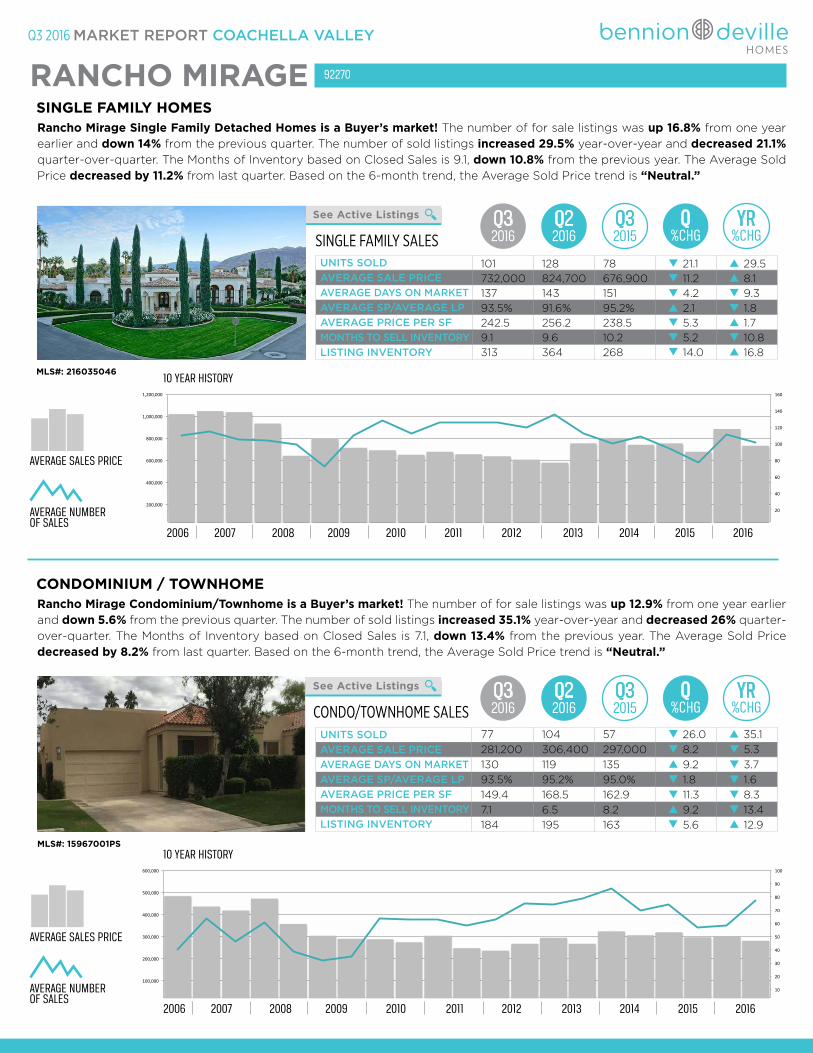
Rancho Mirage Single Family Detached Homes is a Buyer’s market! The number of for sale listings was up 16.8% from one year earlier and down 14% from the previous quarter. The number of sold listings increased 29.5% year-over-year and decreased 21.1% quarter-over-quarter. The Months of Inventory based on Closed Sales is 9.1, down 10.8% from the previous year. The Average Sold Price decreased by 11.2% from last quarter. Based on the 6-month trend, the Average Sold Price trend is “Neutral.”
SINGLE FAMILY HOMES
CONDO/TOWNHOME SALES
UnitsSold 40 64 46 61 39 32 35 64 63 63 58 63 75 74 79 86 70 74 57 58 77AverageSoldPrice 483,000 435,000 418,000 471,000 358,000 304,000 290,000 288,000 274,000 303,000 247,000 235,000 267,000 295,000 267,000 323,000 306,000 319,000 297,000 299,000 281,000
0
10
20
30
40
50
60
70
80
90
100
0
100,000
200,000
300,000
400,000
500,000
600,000
AverageSoldPrice
UnitsSold
10 YEAR HISTORY
AVERAGE NUMBEROF SALES
AVERAGE SALES PRICE
Rancho Mirage Condominium/Townhome is a Buyer’s market! The number of for sale listings was up 12.9% from one year earlier and down 5.6% from the previous quarter. The number of sold listings increased 35.1% year-over-year and decreased 26% quarter-over-quarter. The Months of Inventory based on Closed Sales is 7.1, down 13.4% from the previous year. The Average Sold Price decreased by 8.2% from last quarter. Based on the 6-month trend, the Average Sold Price trend is “Neutral.”
CONDOMINIUM / TOWNHOME
RANCHO MIRAGE 92270
MLS#: 216035046
MLS#: 15967001PS
Q32016
Q22016
Q32015
Q%CHG
YR%CHG
LISTING INVENTORYMONTHS TO SELL INVENTORYAVERAGE PRICE PER SFAVERAGE SP/AVERAGE LPAVERAGE DAYS ON MARKETAVERAGE SALE PRICEUNITS SOLD
t
st
t
t s
t s
ts
t
s
101 128 78732,000 824,700 676,900
21.1 29.511.2 8.14.2 9.3t
2.1 1.85.3 1.75.2 10.8t
14.0 16.8
137 143 15193.5% 91.6% 95.2%242.5 256.2 238.59.1 9.6 10.2313 364 268
Q32016
Q22016
Q32015
Q%CHG
YR%CHG
LISTING INVENTORYMONTHS TO SELL INVENTORYAVERAGE PRICE PER SFAVERAGE SP/AVERAGE LPAVERAGE DAYS ON MARKETAVERAGE SALE PRICEUNITS SOLD
tt
ts
t
t
st
t
77 104 57281,200 306,400 297,000
26.0 35.1s
8.2 5.3t
9.2 3.71.8t 1.611.3 8.39.2s 13.4t
5.6 12.9
130 119 13593.5% 95.2% 95.0%149.4 168.5 162.97.1 6.5 8.2184 195 163
20162015201420132012201120102006 2007 2008 2009
20162015201420132012201120102006 2007 2008 2009

Q3 2016 MARKET REPORT COACHELLA VALLEY
See Active Listings
SINGLE FAMILY SALES
UnitsSold 20 12 3 16 14 38 32 24 25 25 21 29 26 15 16 9 11 5 12 13 12AverageSoldPrice 315,000 328,000 184,000 231,000 172,000 130,000 125,000 111,000 114,000 160,000 121,000 116,000 111,000 176,000 155,000 140,000 240,000 292,000 182,000 204,000 200,000
0
5
10
15
20
25
30
35
40
0
50,000
100,000
150,000
200,000
250,000
300,000
350,000
AverageSoldPrice
UnitsSold
10 YEAR HISTORY
AVERAGE NUMBEROF SALES
AVERAGE SALES PRICE
Thousand Palms Single Family Detached Homes is a Neutral market! The number of for sale listings was up 40.0% from one year earlier and up 31.3% from the previous quarter. The number of sold listings was the same year-over-year and decreased 25% quarter-over-quarter. The Months of Inventory based on Closed Sales is 4.7, up 23.7% from the previous year. The Average Sold Price decreased by 16% from last quarter. Based on the 6-month trend, the Average Sold Price trend is “Neutral.”
SINGLE FAMILY HOMES
THOUSAND PALMS 92276
MLS#: 21608528Courtesy: Tarbell Realtors
Q32016
Q22016
Q32015
Q%CHG
YR%CHG
LISTING INVENTORYMONTHS TO SELL INVENTORYAVERAGE PRICE PER SFAVERAGE SP/AVERAGE LPAVERAGE DAYS ON MARKETAVERAGE SALE PRICEUNITS SOLD
s
s s
s
s t
t
t s
t
s
12 16 12199,600 237,600 182,500
25.0 016.0 9.411.0 4.74.6 1.57.7 20.762.1 23.731.3 40.0s
89 100 8597.9% 93.6% 99.4%134.8 146.0 111.74.7 2.9 3.821 16 15
t
20162015201420132012201120102006 2007 2008 2009