CO Pork VR-turbine final.doc | US EPA ARCHIVE … of programmable interlocks, grid synchronization,...
61
Transcript of CO Pork VR-turbine final.doc | US EPA ARCHIVE … of programmable interlocks, grid synchronization,...

SRIUSEPA-GHG-VR-22 September 2004
Environmental Technology Verification Report
Swine Waste Electric Power and Heat Production ndash Capstone 30 kW Microturbine System
Prepared by
Greenhouse Gas Technology CenterSouthern Research Institute
Under a Cooperative Agreement With US Environmental Protection Agency
and
Under Agreement With Colorado Governorrsquos Office of Energy Management and
Conservation
EPA REVIEW NOTICE
This report has been peer and administratively reviewed by the US Environmental Protection Agency and approved for publication Mention of trade names or commercial products does not constitute endorsement or recommendation for use
THE ENVIRONMENTAL TECHNOLOGY VERIFICATION PROGRAM
SOUTHERN RESEARCH US Environmental Protection Agency I N S T I T U T E
ETV Joint Verification Statement TECHNOLOGY TYPE Biogas-Fired Microturbine Combined With Heat
Recovery System
APPLICATION Distributed Electrical Power and Heat Generation
TECHNOLOGY NAME Capstone 30 kW Microturbine System
COMPANY Colorado Pork LLC
ADDRESS Lamar Colorado
The US Environmental Protection Agency (EPA) has created the Environmental Technology Verification (ETV) program to facilitate the deployment of innovative or improved environmental technologies through performance verification and dissemination of information The goal of the ETV program is to further environmental protection by accelerating the acceptance and use of improved and cost-effective technologies ETV seeks to achieve this goal by providing high-quality peer-reviewed data on technology performance to those involved in the purchase design distribution financing permitting and use of environmental technologies
ETV works in partnership with recognized standards and testing organizations stakeholder groups that consist of buyers vendor organizations and permitters and with the full participation of individual technology developers The program evaluates the performance of technologies by developing test plans that are responsive to the needs of stakeholders conducting field or laboratory tests collecting and analyzing data and preparing peer-reviewed reports All evaluations are conducted in accordance with rigorous quality assurance protocols to ensure that data of known and adequate quality are generated and that the results are defensible
The Greenhouse Gas Technology Center (GHG Center) one of six verification organizations under the ETV program is operated by Southern Research Institute in cooperation with EPArsquos National Risk Management Research Laboratory A technology of interest to GHG Center stakeholders is the use of microturbines and engines as distributed generation sources Distributed generation (DG) refers to power-generation equipment that provides electric power at a site much closer to customers than central station generation Recently biogas production from livestock manure management facilities has become a promising alternative for fueling DG technologies These technologies commonly referred to as anaerobic digesters decompose manure in a controlled environment and recover methane produced from the manure digestion The recovered methane can fuel power generators to produce electricity heat and hot water Digesters also reduce foul odor and can reduce the risk of ground- and surface-water pollution
S-1
The GHG Center collaborated with the Colorado Governorrsquos Office of Energy Management and Conservation (OEMC) to evaluate the performance of two combined heat and power systems (CHP systems) that operate on biogas recovered from swine waste generated at the Colorado Pork facility in Lamar Colorado This verification statement provides a summary of the test results for the Capstone 30 kW Microturbine CHP system
TECHNOLOGY DESCRIPTION
The following technology description is based on information provided by Capstone and OEMC and does not represent verified information The microturbine system tested at Colorado Pork consists of a Capstone Model 330 Microturbine and a heat-recovery system developed by Cain Industries The CHP system also includes a CompAir gas compressor which is needed to boost the gas pressure to about 100 psig A permanent magnet generator produces high-frequency alternating current which is rectified inverted and filtered by the line power unit into conditioned 480 volts alternating current (VAC) The unit supplies an electrical frequency of 60 hertz (Hz) and is equipped with a control system that allows for automatic and unattended operation An active filter in the generator is reported by the turbine manufacturer to provide power free of spikes and unwanted harmonics All operations including startup setting of programmable interlocks grid synchronization operational setting dispatch and shutdown can be performed manually or remotely using the internal power-controller system
The gas booster compressor is a CompAir Hydrovane Model 704PKGS with a nominal volume capacity of 48 standard cubic feet per minute (scfm) and the capability of compressing gas from inlet pressures ranging from 025 to 15 pounds per square inch gauge (psig) to outlet pressures of 60 to 100 psig The compressor is boosting gas pressure from approximately 1 to 100 psig in this application The compressor imposes a parasitic load of approximately 4 kW on the overall CHP system generating capacity
Waste heat from the microturbine exhaust is recovered using a Cain Industries heat recovery and control system It is a steel fin-and-tube Heat Recovery Silencer (HRS) radial heat exchanger and silencer (Model 112B28SSS) suitable for up to 700 degF exhaust gas Potable water is used as the heat-transfer media to recover energy from the microturbine exhaust gas The water is circulated at a rate of approximately 28 gallons per minute (gpm) A digital controller monitors the water outlet temperature When the temperature exceeds the user set point a damper automatically opens and allows the hot exhaust gas to bypass the heat exchanger and release the heat through the stack The damper allows hot gas to circulate through the heat exchanger when heat recovery is required (ie the water outlet temperature is less than user setpoint) This design allows the system to protect the heat recovery components from the full heat of the turbine exhaust while still maintaining full electrical generation from the microturbine
The Colorado Pork facility is a sow farrow-to-wean farm in Lamar Colorado that began operation in 1999 and houses up to 5000 sows The facility employs a complete mix anaerobic digester to reduce odor and meet water quality regulations mandated by the Colorado Department of Public Health and Environment The anaerobic digester promotes bacterial decomposition of volatile solids in animal wastes The resulting effluent stream consists of mostly water which is allowed to evaporate from a secondary lagoon Solids produced by the process accumulate in the digester and are manually removed Recovered heat from the microturbine CHP is circulated through the waste in the digester to maintain the digester temperature at approximately 100 degF Cool water returning from the digester remains relatively constant throughout the year A temperature sensor continuously monitors this temperature and in the event this temperature exceeds 105 degF an automated mixing valve reduces the flow of hot water entering the digester
S-2
VERIFICATION DESCRIPTION
Testing was conducted on February 14 and 15 2004 The verification included a series of controlled test periods in which the GHG Center intentionally controlled the unit to produce electricity at nominal power output levels of 30 24 20 and 15 kW Three replicate test runs were conducted at each setting A 7-day extended monitoring period was planned to verify power and heat production power quality performance and emissions offsets during normal site operations However this could not be completed due to system startup and shakedown delays that resulted in GHG Center scheduling conflicts Instead the CHP performance was monitored continuously for a period of approximately 35 hours to evaluate power and heat production and power quality In light of this the emission offsets analysis was not conducted and the completeness data quality objective of 7-days was not met During all test periods waste heat was recovered and routed through the digester at temperatures of approximately 100 degF The classes of verification parameters evaluated were
bull Heat and Power Production Performance bull Emissions Performance (NOx CO THC CH4 SO2 TRS TPM NH3 and CO2) bull Power Quality Performance
Evaluation of heat and power production performance included verification of power output heat recovery rate electrical efficiency thermal efficiency and total system efficiency Electrical efficiency was determined according to the ASME Performance Test Code for Gas Turbines (ASME PTC-22) Tests consisted of direct measurement of fuel flow rate fuel lower heating value (LHV) and power output Heat recovery rate and thermal efficiency were determined according to ANSIASHRAE test methods and consisted of direct measurement of heat-transfer fluid flow rate and differential temperatures Ambient temperature barometric pressure and relative humidity measurements were also collected to characterize the condition of the combustion air used by the microturbine All measurements were recorded as 1-minute averages during the controlled test periods and throughout the 7-day monitoring period
The evaluation of emissions performance occurred simultaneously with efficiency testing Pollutant concentration and emission rate measurements for nitrogen oxides (NOX) carbon monoxide (CO) total hydrocarbons (THC) methane (CH4) sulfur dioxide (SO2) total reduced sulfur (TRS) total particulate matter (TPM) ammonia (NH3) and carbon dioxide (CO2) were conducted in the turbine exhaust stack All test procedures used in the verification were US EPA reference methods recorded in the Code of Federal Regulations (CFR) Pollutant emissions are reported as concentrations in parts per million volume dry (ppmvd) corrected to 15-percent oxygen (O2) and as mass per unit time (lbhr) The mass emission rates are also normalized to microturbine power output and reported as pounds per kilowatt hour (lbkWh)
Electrical power quality parameters including electrical frequency and voltage output were measured during the controlled tests and the 35-hour monitoring period Current and voltage total harmonic distortions (THD) and power factors were also monitored to characterize the quality of electricity supplied to the end user The guidelines listed in ldquoThe Institute of Electrical and Electronics Engineersrsquo (IEEE) Recommended Practices and Requirements for Harmonic Control in Electrical Power Systemsrdquo were used to perform power quality testing
Quality Assurance (QA) oversight of the verification testing was provided following specifications in the ETV Quality Management Plan (QMP) The GHG Centerrsquos QA Manager conducted an audit of data quality on at least 10 percent of the data generated during this verification and a review of this report Data review and validation was conducted at three levels including the field team leader (for data
S-3
generated by subcontractors) the project manager and the QA manager Through these activities the QA manager has concluded that with the exception of the extended monitoring completeness goal described earlier the data meet the data quality objectives that are specified in the Test and Quality Assurance Plan
VERIFICATION OF PERFORMANCE
Heat and Power Production Performance
MICROTURBINE CHP HEAT AND POWER PRODUCTION
Test Condition (Power
Command)
Electrical Power Generation Heat Recovery Performance Total CHP System Efficiency
() Net Power Delivered
(kW)
Net Efficiency ()
Heat Recovery (103Btuhr)
Thermal Efficiency
() 30 kW 199 204 111 333 537 24 kW 193 203 116 358 562 20 kW 150 186 108 392 577 15 kW 101 157 969 441 598
bull The relatively high altitude of the facility (roughly 3700 feet) and the parasitic load introduced by the gas compressor limit the turbinersquos power output performance At the full power output command of 30 kW the average net power delivered to the facility was 199 kW Corresponding electrical efficiency at full load was 204 percent
bull Average electrical efficiencies at the reduced power commands of 24 20 and 15 kW decreased to 203 186 and 157 percent respectively
bull Total CHP efficiency during the controlled test periods ranged from a low of 537 percent at the 30 kW load to a high of 598 percent at 15 kW Normal heat recovery operations were maintained during the controlled test periods with the system configured to maintain the digester temperature at approximately 100oF
Emissions Performance
MICROTURBINE EMISSIONS (lbkWh) Power
Command NOX CO THC CH4 SO2 TRS TPM NH3 CO2
30 kW 821x10ndash5 0009 00027 00022 0037 00008 00006 607x10ndash7 345 24 kW 947x10ndash5 0010 00032 00027 0039 00002 Not tested Not tested 361 20 kW 195x10ndash3 0010 00035 00028 0040 00005 Not tested Not tested 379 15 kW 219x10ndash3 0017 00105 00087 0042 00002 Not tested Not tested 390
bull NOX emissions at 30 kW were 821 x 10ndash5 lbkWh and increased as power output decreased CO emissions averaged 0009 lbkWh at 30 kW and also increased slightly at the reduced loads
bull THC emissions at full load averaged 269 x 10ndash3lbkWh and increased as the power output was decreased CH4 emissions were similar averaging 223 x 10ndash3 at full load and representing approximately 80 percent of the THC emission rate
S-4
bull Emissions of SO2 and TRS averaged 0037 and 00008 lbkWh respectively at full load and were not significantly impacted by load changes Emissions of TPM and NH3 were very low during the full load tests
NOX emissions per unit electrical power output at 30 kW (000008 lbkWh) were well below the published weighted average US and Colorado regional fossil fuel emission factors of 00066 and 00077 lbkWh The generator system CO2 emission rate at full load is higher than the weighted average fossil fuel emission factors for both the US and Colorado regional grids (202 and 213 lbkWh respectively) This indicates a likely increase in annual CO2 emissions for power production from this system based solely on electrical generation Due to the reduction in the extended monitoring period a true estimation of annual emissions offsets could not be completed
Power Quality Performance
bull Average electrical frequency was 59999 Hz and average voltage output was 48725 volts bull The power factor remained relatively constant at full load averaging 9453 percent bull The average current total harmonic distortion was 321 percent and the average voltage THD was 189
both well below the threshold specified in IEEE 519 of plusmn 5 percent
S-5
Details on the verification test design measurement test procedures and Quality AssuranceQuality Control (QAQC) procedures can be found in the Test plan titled Test and Quality Assurance Plan for Swine Waste Electric Power and Heat Production Systems Capstone Microturbine and Martin Machinery Internal Combustion Engine (SRI 2002) Detailed results of the verification are presented in the Final Report titled Environmental Technology Verification Report for Swine Waste Electric Power and Heat Production ndash Capstone 30 kW Microturbine System (SRI 2004) Both can be downloaded from the GHG Centerrsquos web-site (wwwsri-rtpcom) or the ETV Program web-site (wwwepagovetv)
Signed by Lawrence W Reiter PhD 92704 Signed by Stephen D Piccot 91304
Lawrence W Reiter PhD Stephen D Piccot Acting Director Director National Risk Management Research Laboratory Greenhouse Gas Technology Center Office of Research and Development Southern Research Institute
Notice GHG Center verifications are based on an evaluation of technology performance under specific predetermined criteria and the appropriate quality assurance procedures The EPA and Southern Research Institute make no expressed or implied warranties as to the performance of the technology and do not certify that a technology will always operate at the levels verified The end user is solely responsible for complying with any and all applicable Federal State and Local requirements Mention of commercial product names does not imply endorsement or recommendation
EPA REVIEW NOTICE
This report has been peer and administratively reviewed by the US Environmental Protection Agency and approved for publication Mention of trade names or commercial products does not constitute endorsement or recommendation for use
S-6
SRIUSEPA-GHG-VR-22 September 2004
Greenhouse Gas Technology Center A US EPA Sponsored Environmental Technology Verification ( ) Organization
Environmental Technology Verification Report
Swine Waste Electric Power and Heat Production ndash Capstone 30 kW Microturbine System
Prepared By Greenhouse Gas Technology Center
Southern Research Institute PO Box 13825
Research Triangle Park NC 27709 USA Telephone 919806-3456
Under EPA Cooperative Agreement CR 829478
US Environmental Protection Agency Office of Research and Development
National Risk Management Research Laboratory Air Pollution Prevention and Control Division
Research Triangle Park NC 27711 USA
EPA Project Officer David A Kirchgessner Colorado Governorrsquos Office Project Officer Edward Lewis
TABLE OF CONTENTS Page
LIST OF FIGURES iii LIST OF TABLES iii ACKNOWLEDGMENTS iv ACRONYMS AND ABBREVIATIONSv
10 INTRODUCTION 1-111 BACKGROUND 1-112 COMBINED HEAT AND POWER TECHNOLOGY DESCRIPTION 1-213 TEST FACILITY DESCRIPTION 1-514 PERFORMANCE VERIFICATION OVERVIEW1-7
141 Heat and Power Production Performance 1-9142 Power Quality Performance 1-13143 Emissions Performance1-14144 Estimated Annual Emission Reductions 1-15
20 VERIFICATION RESULTS2-121 OVERVIEW 2-122 HEAT AND POWER PRODUCTION PERFORMANCE 2-2
221 Electrical Power Output Heat Recovery Rate and Efficiency During Controlled Tests 2-2
222 Electrical and Thermal Energy Production During the Continuous Monitoring Period 2-5
23 POWER QUALITY PERFORMANCE 2-8231 Electrical Frequency 2-8232 Voltage Output2-9233 Power Factor 2-10234 Current and Voltage Total Harmonic Distortion 2-11
24 EMISSIONS PERFORMANCE 2-12241 Microturbine CHP System Emissions2-12
30 DATA QUALITY ASSESSMENT3-131 DATA QUALITY OBJECTIVES 3-132 RECONCILIATION OF DQOs AND DQIs 3-2
321 Power Output 3-5322 Electrical Efficiency3-6323 PTC-22 Requirements for Electrical Efficiency Determination 3-7324 Ambient Measurements 3-8325 Fuel Flow Rate 3-8326 Fuel Lower Heating Value3-8327 Heat Recovery Rate and Efficiency 3-9328 Total Efficiency3-10329 Exhaust Stack Emission Measurements3-10
3291 NOX CO CO2 SO2 TRS and O2 Concentrations 3-113292 THC Concentrations3-123293 CH4 Concentrations 3-123294 Total Particulate Matter and Exhaust Gas Volumetric Flow Rate 3-123295 NH3 Concentrations3-13
40 REFERENCES 1
i
LIST OF FIGURES Page
Figure 1-1 The Colorado Pork Capstone 330 Microturbine CHP System 1-3 Figure 1-2 Colorado Pork Microturbine CHP System Process Diagram 1-4 Figure 1-3 Colorado Pork Anaerobic Digester 1-6 Figure 1-4 Colorado Pork Waste-to-Energy Process Diagram 1-7 Figure 1-5 Schematic of Measurement System 1-12 Figure 2-1 Electrical and Thermal Efficiency During Controlled Test Periods 2-5 Figure 2-2 Heat and Power Production During the Monitoring Period 2-6 Figure 2-3 Power Output and Ambient Temperature During the Verification Period 2-7 Figure 2-4 Ambient Temperature Effects on Power Production During Verification Period 2-7 Figure 2-5 Microturbine Frequency During Verification Period 2-8 Figure 2-6 Microturbine Voltage During Verification Period 2-9 Figure 2-7 Microturbine Power Factor During Verification Period 2-10 Figure 2-8 Microturbine Current and Voltage THD During Verification Period 2-11
LIST OF TABLES Page
Table 1-1 Capstone Microturbine Model 330 Specifications 1-5 Table 1-2 Controlled and Continuous Test Periods 1-9 Table 1-3 Summary of Emissions Testing Methods 1-14 Table 2-1 Heat and Power Production Performance 2-3 Table 2-2 Fuel Input and Heat Recovery Unit Operating Conditions 2-4 Table 2-3 Electrical Frequency During Monitoring Period 2-8 Table 2-4 Microturbine Voltage During Monitoring Period 2-9 Table 2-5 Power Factors During Monitoring Period 2-10 Table 2-6 Microturbine THD During Extended Period 2-11 Table 2-7 Microturbine CHP Emissions During Controlled Periods 2-13 Table 2-8 Emissions Offsets From On-Site Electricity Production 2-17 Table 2-9 Estimated Annual Emission Reductions using the CHP System 2-18 Table 3-1 Verification Parameter Data Quality Objectives 3-1 Table 3-2 Summary of Data Quality Goals and Results 3-3 Table 3-3 Results of Additional QAQC Checks 3-6 Table 3-4 Variability Observed in Operating Conditions 3-8 Table 3-5 Summary of Emissions Testing Calibrations and QC Checks 3-11
ii
ACKNOWLEDGMENTS
The Greenhouse Gas Technology Center wishes to thank the Colorado Governorrsquos Office of Energy Management and Conservation especially Edward Lewis for providing funding for this project and for reviewing and providing input on the testing strategy and this Verification Report Thanks are also extended to the Colorado Pork Farm (a subsidiary of Custom Swine Corporation) for hosting the verification Finally special thanks to Gerald Licano of Colorado Pork for his assistance with site operation and execution of the verification testing
iii
ACRONYMS AND ABBREVIATIONS
Abs Diff absolute difference AC alternating current acf actual cubic feet ADQ Audit of Data Quality amp amperes ANSI American National Standards Institute APPCD Air Pollution Prevention and Control Division ASHRAE American Society of Heating Refrigerating and Air-Conditioning Engineers Inc ASME American Society of Mechanical Engineers Btu British thermal units Btuhr British thermal units per hour Btulb British thermal units per pound Btumin British thermal units per minute Btuscf British thermal units per standard cubic foot CAR Corrective Action Report C1 quantification of methane CH4 methane CHP combined heat and power CO carbon monoxide CO2 carbon dioxide CT current transformer DAS data acquisition system DG distributed generation DOE US Department of Energy DP differential pressure DQI data quality indicator DQO dscf106Btu
data quality objective dry standard cubic feet per million British thermal units
EA Engineering Assistant EIA Energy Information Administration EPA Environmental Protection Agency ETV Environmental Technology Verification degC degrees Celsius degF degrees Fahrenheit FID flame ionization detector fps ft3
feet per second cubic feet
gal US gallons GC gas chromatograph GHG Center Greenhouse Gas Technology Center gpm gallons per minute GU generating unit HHV higher heating value hr hour Hz hertz IC internal combustion
(continued)
iv
ACRONYMSABBREVIATIONS (continued)
IEEE Institute of Electrical and Electronics Engineers ISO International Standards Organization kVA kilovolt-amperes kVAr kilovolt reactive kW kilowatts kWh kilowatt hours kWhe kilowatt hours electrical kWhth kilowatt hours thermal kWhyr kilowatt hours per year lb pounds lbBtu pounds per British thermal unit lbdscf lbft3
pounds per dry standard cubic foot pounds per cubic feet
lbhr pounds per hour lbkWh pounds per kilowatt-hour lbyr pounds per year LHV 103Btuhr 106Btuhr 106cf
lower heating value thousand British thermal units per hour million British thermal units per hour
million cubic feet mol mole N2 nitrogen NDIR nondispersive infrared NIST National Institute of Standards and Technology NO nitrogen oxide NO2 nitrogen dioxide NOX nitrogen oxides NSPS New Source Performance Standards O2 oxygen O3 ozone ORD Office of Research and Development PEA Performance Evaluation Audit ppmv parts per million volume ppmvw Parts per million volume wet ppmvd parts per million volume dry psia pounds per square inch absolute psig pounds per square inch gauge PT potential transformer QAQC Quality AssuranceQuality Control
(continued)
v
ACRONYMSABBREVIATIONS (continued)
QMP Quality Management Plan Rel Diff relative difference Report Environmental Technology Verification Report RH relative humidity rms root mean square rpm revolutions per minute RTD resistance temperature detector scf standard cubic feet scfh standard cubic feet per hour scfm standard cubic feet per minute Southern Southern Research Institute TampD transmission and distribution Test plan Test and Quality Assurance Plan THCs total hydrocarbons THD total harmonic distortion TSA technical systems audit US United States VAC volts alternating current
vi
10 INTRODUCTION
11 BACKGROUND
The US Environmental Protection Agencyrsquos Office of Research and Development (EPA-ORD) operates the Environmental Technology Verification (ETV) program to facilitate the deployment of innovative technologies through performance verification and information dissemination The goal of ETV is to further environmental protection by accelerating the acceptance and use of improved and innovative environmental technologies Congress funds ETV in response to the belief that there are many viable environmental technologies that are not being used for the lack of credible third-party performance data With performance data developed under this program technology buyers financiers and permitters in the United States and abroad will be better equipped to make informed decisions regarding environmental technology purchase and use
The Greenhouse Gas Technology Center (GHG Center) is one of six verification organizations operating under the ETV program The GHG Center is managed by EPArsquos partner verification organization Southern Research Institute (Southern) which conducts verification testing of promising greenhouse gas mitigation and monitoring technologies The GHG Centerrsquos verification process consists of developing verification protocols conducting field tests collecting and interpreting field and other data obtaining independent peer-reviewed input and reporting findings Performance evaluations are conducted according to externally reviewed verification Test and Quality Assurance Plans (test plan) and established protocols for quality assurance
The GHG Center is guided by volunteer groups of stakeholders These stakeholders guide the GHG Center on which technologies are most appropriate for testing help disseminate results and review Test plans and Technology Verification Reports (report) The GHG Centerrsquos Executive Stakeholder Group consists of national and international experts in the areas of climate science and environmental policy technology and regulation It also includes industry trade organizations environmental technology finance groups governmental organizations and other interested groups The GHG Centerrsquos activities are also guided by industry specific stakeholders who provide guidance on the verification testing strategy related to their area of expertise and peer-review key documents prepared by the GHG Center
A technology of interest to GHG Center stakeholders is the use of microturbines as a distributed generation source Distributed generation (DG) refers to power-generation equipment typically ranging from 5 to 1000 kilowatts (kW) that provide electric power at a site much closer to customers than central station generation A distributed power unit can be connected directly to the customer or to a utilityrsquos transmission and distribution system Examples of technologies available for DG include gas turbine generators internal combustion engine generators (eg gas diesel) photovoltaics wind turbines fuel cells and microturbines DG technologies provide customers one or more of the following main services stand-by generation (ie emergency backup power) peak shaving capability (generation during highshydemand periods) baseload generation (constant generation) or cogeneration combined heat and power (CHP) generation
Recently biogas production from livestock manure management facilities has become a promising alternative for fueling DG technologies EPA estimates US methane emissions from livestock manure management at 170 million tons carbon equivalent which accounts for 10 percent of total 1997 methane emissions The majority of methane emissions come from large swine and dairy farms that manage manure as slurry EPA expects US methane emissions from livestock manure to grow by over 25
1-1
percent from 2000 to 2020 Cost effective technologies are available that can stem this emission growth by recovering methane and using it as an energy source These technologies commonly referred to as anaerobic digesters decompose manure in a controlled environment and recover methane produced from the manure The recovered methane can fuel power generators to produce electricity heat and hot water Digesters also reduce foul odor and can reduce the risk of ground- and surface-water pollution
The GHG Center and the Colorado Governorrsquos Office of Energy Management and Conservation (OEMC) agreed to collaborate and share the cost of verifying two DG technologies that operate on biogas recovered from swine waste These verifications evaluated the performance of a microturbine combined heat and power (CHP) system offered by Capstone Turbine Corporation and an internal combustion (IC) engine CHP system offered by Martin Machinery Inc Both units are currently in operation at an anaerobic digestion facility managed by Colorado Pork LLC near Lamar Colorado This is the only swine farm in Colorado that is producing electrical power from animal waste The electricity is used by Colorado Pork to offset electricity purchases from the local electric cooperative Some of the recovered heat is used to control digester temperature which optimizes and enhances biogas production Both CHP systems are interconnected to the electric utility grid but excess power is not presently exported
The GHG Center evaluated the performance of the two CHP systems by conducting field tests over a fourteen-day verification period (February 2 ndash 15 2004) These tests were planned and executed by the GHG Center to independently verify the electricity generation and use rate thermal energy recovery rate electrical power quality energy efficiency emissions and greenhouse gas emission reductions for the Colorado Pork farm This verification statement and report provides the results of the Capstone 30 microturbine CHP performance evaluation Results of the testing conducted on the IC engine CHP system are reported in a separate report titled Environmental Technology Verification Report ndash Swine Waste Electric Power and Heat Production ndash Martin Machinery Internal Combustion Engine [1]
Details on the verification test design measurement test procedures and Quality AssuranceQuality Control (QAQC) procedures can be found in the test plan titled Test and Quality Assurance Plan ndash Swine Waste Electric Power and Heat Production Systems Capstone Microturbine and Martin Machinery Internal Combustion Engine [2] It can be downloaded from the GHG Centerrsquos web-site (wwwsrishyrtpcom) or the ETV Program web-site (wwwepagovetv) The Test plan describes the rationale for the experimental design the testing and instrument calibration procedures planned for use and specific QAQC goals and procedures The Test plan was reviewed and revised based on comments received from OEMC and the EPA Quality Assurance Team The Test plan meets the requirements of the GHG Centers Quality Management Plan (QMP) and satisfies the ETV QMP requirements Deviations from the Test plan were required in some cases These deviations and the alternative procedures selected for use were initially documented in Corrective Action Reports (CARs) and are discussed in this report
The remainder of Section 10 describes the microturbine CHP system technology and test facility and outlines the performance verification procedures that were followed Section 20 presents test results and Section 30 assesses the quality of the data obtained
12 COMBINED HEAT AND POWER TECHNOLOGY DESCRIPTION
The microturbine system verified at Colorado Pork consists of a Capstone Model 330 Microturbine and a Cain Industries heat-recovery system These primary system components are shown in separate photos in Figure 1-1 The CHP system also includes a CompAir gas compressor which is needed to boost the delivered gas pressure to about 100 psig Figure 1-2 illustrates a simplified process flow diagram of the microturbine CHP system at this site and a discussion of each component is provided below
1-2
Capstone 30 kW Microturbine Cain Industries Heat Recovery SystemCapstone 30 kW Microturbine Cain Industries Heat Recovery System
Figure 1-1 The Colorado Pork Capstone 330 Microturbine CHP System
Electric power is generated from a high-speed single-shaft recuperated air-cooled turbine generator with a nominal rated power output of 30 kW net (59 degF sea level) Table 1-1 provides Capstone 330 microturbine specifications The Capstone 330 is designed to operate on biogas and consists of an air compressor recuperator combustor turbine and a permanent magnet generator The recuperator is a heat exchanger that recovers some of the heat from the exhaust stream and transfers it to the incoming compressed air stream The preheated air is then mixed with the fuel and this compressed fuel and air mixture is burned in the combustor under constant pressure conditions The resulting hot gas is allowed to expand through the turbine section to perform work rotating the turbine blades to turn a generator which produces electricity The need for a gearbox and associated moving parts is eliminated because of the inverter-based electronics that enable the generator to operate at high speeds and frequencies The rotating components are mounted on a single shaft ndash supported by patented air bearings ndash that rotates at over 96000 revolutions per minute (rpm) at full load The exhaust gas exits the turbine and enters the recuperator which pre-heats the air entering the combustor to improve the efficiency of the system The exhaust gas then exits the recuperator and is directed to a heat-recovery unit
1-3
FuelGas Compressor
Capstone 330Microturbine Heat
Exchanger
480 220Volt Transformer
PrimaryDesiccant
Dryer
WaterKnock-
Out CanisterElectricChiller
Microturbine Exhaust
Hot Water Supply
Water Return
To Digester Heating Loop
To Engine Raw Biogas Input
(nominal 17 in wc) Utility Grid
Fuel Gas Compressor
Capstone 330 Microturbine Heat
Exchanger
480 220 Volt Transformer
Microturbine Exhaust
Hot WaterSupply
Water Return
To DigesterHeating Loop
To EngineRaw Biogas Input
(nominal 17 in wc)
Primary Desiccant
Dryer
Utility Grid
Water Knock-
Out Canister Electric Chiller
CHP SystemCHP SystemExhaustExhaust
Heat ExchangerHeat Exchanger
Figure 1-2 Colorado Pork Microturbine CHP System Process Diagram
The permanent magnet generator produces high-frequency alternating current which is rectified inverted and filtered by the line power unit into conditioned 480 volts alternating current (VAC) The unit supplies an electrical frequency of 60 hertz (Hz) and is supplied with a control system which allows for automatic and unattended operation An active filter in the generator is reported by the turbine manufacturer to provide power free of spikes and unwanted harmonics All operations including startup setting of programmable interlocks grid synchronization operational setting dispatch and shutdown can be performed manually or remotely using the internal power-controller system
The gas booster compressor is a CompAir Hydrovane Model 704PKGS with a nominal volume capacity of 48 standard cubic feet per minute (scfm) and the capability of compressing natural gas from inlet pressures ranging from 025 to 15 pounds per square inch gauge (psig) to outlet pressures of 60 to 100 psig The compressor is boosting gas pressure from approximately 1 to 100 psig in this application The compressor imposes a parasitic load of approximately 4 kW on the overall CHP system generating capacity
Figure 1-2 shows that waste heat from the microturbine exhaust at approximately 580 degF is recovered using a heat recovery and control system developed by Cain Industries It is a steel fin-and-tube Heat Recovery Silencer (HRS) radial heat exchanger and silencer (Model 112B28SSS) suitable for up to 700 degF exhaust gas Potable water is used as the heat-transfer media to recover energy from the microturbine exhaust gas stream The water is circulated at a rate of approximately 28 gallons per minute (gpm) A digital controller monitors the water outlet temperature and when the temperature exceeds user set point a damper automatically opens and allows the hot exhaust gas to bypass the heat exchanger and release the heat through the stack The damper allows hot gas to circulate through the heat exchanger when heat recovery is required (ie the water outlet temperature is less than user setpoint) This design allows the system to protect the heat recovery components from the full heat of the turbine exhaust while still maintaining full electrical generation from the microturbine
1-4
Table 1-1 Capstone Microturbine Model 330 Specifications (Source Capstone Microturbine Corporation Colorado Pork)
Dimensions Width Depth Height
281 in 529 in 748 in
Weight Microturbine only 1052 lb
Electrical inputs Power (startup) communications
Utility grid or black start battery Ethernet IP or modem
Electrical outputs Power at ISO conditions (59 oF sea level) 30 kW 400-480 VAC 5060 Hz 3-phase
Noiselevel Typical reported by Capstone 58 dBA at 33 ft Fuel pressure required
wo compressor w compressor
50 to 100 psig 5 to 15 psig
Fuel heat content Higher heating value 350 to 1200 Btuscf
Electrical performance at full load (landfill or digester gas)
Heat input Power output Efficiency - wo compressor Efficiency - w compressor Heat rate
378000 Btuhr LHV basis 30 kW plusmn1 kW 27 plusmn 2 ISO conditions LHV basis 26 plusmn 2 ISO conditions LHV basis 12600 BtukWh LHV basis
Heat recovery potential at full load
Exhaust gas temperature Exhaust energy available for heat recovery
500 oF 290000 Btuhr
Emissions (full load)
Nitrogen oxides (NOX) Carbon monoxide (CO) Total hydrocarbon (THCs)
lt 9 ppmv at 15 O2 lt 40 ppmv at 15 O2 lt 9 ppmv at 15 O2
13 TEST FACILITY DESCRIPTION
The Colorado Pork facility is a sow farrow-to-wean farm in Lamar Colorado that began operation in 1999 and houses up to 5000 sows The facility employs a complete mix anaerobic digester (Figure 1-3) to reduce odor and meet water quality regulations mandated by the Colorado Department of Public Health and Environment The anaerobic digester promotes bacterial decomposition of volatile solids in animal wastes The resulting effluent stream mostly consists of water which is allowed to evaporate from a secondary lagoon
Waste from the 5000 sows is collected in shallow pits below the slatted floors of the hog barns These pits are connected via sewer lines to an in-ground concrete holding tank (50000 gallon capacity) Each morning the pits are drained on a rotating basis to flush about 15000 gallons of waste to the holding tank The holding tank is equipped with a 17 horsepower (Hp) chopper pump that breaks up large pieces of waste Each morning about 15000 gallons of waste is pumped from the holding tank into the digester (requires approximately 20 minutes)
1-5
Figure 1-3 Colorado Pork Anaerobic Digester
The digester is a 70 x 80 x 14 foot deep in-ground concrete tank with a capacity of 500000 gallons The digester is equipped with two propeller type mixers on each end The mixers normally operate for 30 minutes daily to rejuvenate gas production that would otherwise decline between waste charging events Hot water is circulated through the digester using a matrix of 3-inch black steel pipe (total length of about 05 mile) to maintain the digester temperature at 100 degF Small adjustments to the water flow rate are required periodically and are conducted manually by the site operator The retention time in the digester is about 40 days
The effluent exits the digester over a weir and is directed gravimetrically to a lagoon for sludge settling and water evaporation The lagoon is designed to hold up to 20 years of sludge production Tests performed by environmental regulatory personnel have determined the site meets current odor and discharge requirements
The biogas produced from the decomposed waste is collected under a high-density polyethylene (HDPE) cover at a pressure of 15 to 20 inches water column A manifold collects the biogas and routes it to the engineturbine building A pressure relief valve senses pressure buildup when neither the engine nor turbine are operating and diverts the biogas to a flare The digester is currently producing about 20000 cubic feet of biogas per day The primary gas constituents of the raw biogas are CH4 (around 67) and CO2 (approximately 32) Analysis of samples collected at the site show hydrogen sulfide (H2S) concentrations in the gas ranging from 700 to 6800 parts per million (ppm) and averaging about 6000 ppm The gas also contains trace amounts of ammonia (NH3) mercaptans and other noxious gases and is saturated with water vapor The lower heating value (LHV) of the biogas is approximately 625 Btuscf
Figure 1-4 is a schematic of the waste-to-energy production process at Colorado Pork showing integration of the digester microturbine CHP and engine CHP In May 2000 the IC engine CHP system was installed first to offset electricity purchase costs The microturbine CHP system was installed in February 2002 to evaluate the feasibility and economics of the two different power generation technologies Both systems are currently housed in a building adjacent to the digester
1-6
AnaerobicDigester
Microturbine
Heat RecoveryUnit
IC Engine
Heat RecoveryUnit
With the microturbine CHP system the biogas is treated and compressed to produce high-pressure dry biogas for electricity production The site operator sets the heat recovery unit at 110 degF during normal operations Any unused heat is discarded automatically through the exhaust stack With the IC engine CHP system biogas is not pre-treated The IC enginersquos heat recovery system produces hot water at approximately 105 degF In the event this temperature exceeds 185 degF (ie during extremely hot summer days) an automatic valve is activated which discards some of the excess heat through a radiator The radiatorrsquos return water line is used to cool the engine water jacket and prevent overheating the engine
Raw Biogas (nominal 17 in wc
5 H2O)
Desiccant Dryer
Excess Heat
Radiator
Emissions to Atmosphere
Hot Exhaust
Emissions to Atmosphere
Hot Exhaust
Compressor
Knockout And chiller
Treated Biogas (nominal 55 psig dry)
Waste from holding tank 15000 gallons
per day
Effluent to lagoon If water temperature at this
point is gt185oF then valve is opened to reject heat and cool
engine water jacket
If water temperature at this point is gt105oF then valve is
opened to divert hot water from entering digester loop
Cool Water
Hot Water
Biogas
Raw Biogas(nominal 17 in wc
5 H2O)
DesiccantDryer
ExcessHeat
Radiator
Emissions toAtmosphere
Ho
Anaerobic Digester
Microturbine
Heat Recovery Unit
IC Engine
Heat Recovery Unit
t Exhaust
Emissions toAtmosphere
Hot Exhaust
Compressor
KnockoutAnd chiller
Treated Biogas(nominal 55 psig dry)
Waste from holdingtank 15000 gallons
per day
Effluent to lagoonIf water temperature at this
point is gt185oF then valve isopened to reject heat and cool
engine water jacket
If water temperature at thispoint is gt105oF then valve is
opened to divert hot waterfrom entering digester loop
Cool Water
Hot Water
Biogas
Cool WaterCool Water
Hot WaterHot Water
Biogas
Figure 1-4 Colorado Pork Waste-to-Energy Process Diagram
The IC engine hot water line combines with the microturbine hot water line and the mixture is circulated through the waste in the digester to maintain the digester temperature at 100 degF Cool water returning from the digester remains relatively constant throughout the year (approximately 100 degF) A temperature sensor continuously monitors this temperature and in the event this temperature exceeds 105 degF an automated mixing valve reduces the flow of hot water entering the digester This adjustment is performed only a few times per year as digester temperatures remain relatively stable
Typically the engine is run at 45 kW and switched to run on natural gas overnight to avoid reducing biogas pressure and collapsing the digester cover When the microturbine is used it can be run on biogas continuously The system is fully grid parallel When power demand of the farm operations exceed the available capacity of the power generation systems power is drawn from the utility grid Colorado Pork purchases electricity from the Southeast Colorado Power Association a rural electric cooperative
14 PERFORMANCE VERIFICATION OVERVIEW
This verification test was designed to evaluate the performance of the microturbine CHP systemmdashnot the overall system integration or specific management strategy The test plan specified a series of controlled test periods in which the GHG Center intentionally modulated the unit to produce electricity at nominal
1-7
power output commands of 15 20 24 and 30 kW Three replicate test runs were conducted at each of these power commands These tests are identified herein as controlled test periods During these controlled test periods the engine was shut down to make maximize biogas availability
Originally the test plan specified that these tests would be conducted with the heat recovery potential maximized by increasing the hot water supply temperature from the heat recovery unit to approximately 125 oF However changes in CHP system operations at the farm have occurred since development of the test plan Specifically hot water supply temperatures are controlled at about 105 oF to maintain the optimum digester temperature of approximately 100 oF It was not possible during the verification testing to reach the supply temperatures originally proposed without adversely affecting digester operations All of the heat generated by the heat recovery unit was being used to warm the digester These test conditions represent normal site operations with the amount of biogas currently available and the maximum achievable heat recovery rate for this application (that is heat is only recovered and used to maintain the optimum digester temperature)
The test plan also specified that the controlled test periods would be followed by a 1-week period of extended monitoring to evaluate power and heat production and power quality over a range of ambient conditions and farm operations However numerous delays and false starts to this test program caused by problems with microturbine operations (primarily gas compressor functionality) produced serious scheduling conflicts for the GHG Centerrsquos operations In response to this the center was forced to deviate from the test plan on this monitoring After consultation with the GHG QA manager and the GHG Center director it was decided to conduct an abbreviated evaluation of power and heat production and power quality using data collected continuously over a limited time period of 35 hours This 35-hour period includes the controlled test periods
The specific verification parameters associated with the test are listed below Brief discussions of each verification parameter and its method of determination are presented in Sections 141 through 145 Detailed descriptions of testing and analysis methods are not provided here but can be found in the test plan
Heat and Power Production Performance bull Electrical power output and heat recovery rate at selected loads bull Electrical thermal and total system efficiency at selected loads
Power Quality Performance bull Electrical frequency bull Voltage output bull Power factor bull Voltage and current total harmonic distortion
Emissions Performance bull Nitrogen oxides (NOX) carbon monoxide (CO) total hydrocarbons (THC)
ammonia (NH3) total reduced sulfur (TRS) total particulate matter (TPM) carbon dioxide (CO2) and methane (CH4) concentrations at selected loads
bull NOX CO THC NH3 TRS TPM CO2 and CH4 emission rates at selected loads
Each of the verification parameters listed were evaluated during the controlled or continuous monitoring periods as summarized in Table 1-2 This table also specifies the dates and time periods during which the testing was conducted
1-8
Table 1-2 Controlled and Continuous Test Periods
Controlled Test Periods Start Date
Time End Date
Time Test Condition Verification Parameters Evaluated
021404 0926 021404 1645 Power command of 30 kW three 30-minute test runs (120 minutes for TPM and NH3)
NOX CO SO2 THC TRS TPM NH3 CH4 CO2 emissions and electrical thermal and total efficiency
021404 1653 021404 1823 Power command of 24 kW three 30-minute test runs NOX CO SO2 THC TRS CH4 CO2 emissions and electrical thermal and total efficiency
021504 1000 021504 1130 Power command of 20 kW three 30-minute test runs
021504 1200 021504 1330 Power command of 15 kW three 30-minute test runs
Continuous Test Period Start Date Time End Date Time Verification Parameters Evaluated
021404 1130 021504 2226 Power and heat generation rate and power quality
Simultaneous monitoring for power output heat recovery rate heat input ambient meteorological conditions and exhaust emissions were performed during each of the controlled test periods Manual samples of biogas were collected to determine fuel lower heating value and other gas properties Replicate and average electrical power output heat recovery rate energy conversion efficiency (electrical thermal and total) and exhaust stack emission rates are reported for each test period
Results from the continuous monitoring period are used to report the average power and heat production rate during normal facility operations and power quality performance
141 Heat and Power Production Performance
Electrical efficiency determination was based upon guidelines listed in ASME Performance Test Code for Gas Turbines (PTC-22) [3] and was calculated using the average measured net power output fuel flow rate and fuel lower heating value (LHV) during each controlled test period PTC-22 specifies that test runs be over time intervals of not less than 4 minutes and not greater than 30 minutes to compute electrical efficiency
These restrictions minimize electrical efficiency determination uncertainties due to changes in operating conditions (eg turbine or engine speed ambient conditions) Within this time period PTC-22 specifies the maximum permissible limits in power output fuel input atmospheric conditions and other parameters to be less than the values shown in Table 3-4 The CHP system has one primary internal parasitic load at this facility ndash the gas-pressure booster compressor which is rated to draw about 4 kW The water fluid circulation pump also introduces a small internal parasitic load (approximately 500 watts) The chiller used to help in biogas moisture removal also draws about 500 watts but this parasitic load is external to the CHP system This verification did not include separate measurement of these parasitic loads and therefore reports the net system power output and efficiency (based on the usable power delivered by the system) Comparison of the net power output measured by the GHG Center and
1-9
the microturbinersquos indicated power output (gross power generated is displayed on the control panel) however confirms that the parasitic load was approximately 45 kW during all test periods
The electrical power output (in kW) was measured continuously throughout the verification period with a 7500 ION Power Meter (Power Measurements Ltd) and logged on the Centers data acquisition system (DAS) as 1-minute averages Biogas fuel input was determined by recording manual meter readings during each of the controlled test periods The biogas used to fuel the microturbine is metered on a wet basis but fired on a dry basis after moisture removal and compression Measured biogas flow to the microturbine was corrected for moisture content as well as temperature and pressure to determine fuel consumption as dry standard cubic feet per hour (scfh)
Fuel gas sampling and energy content analysis (via gas chromatograph) was conducted according to ASTM procedures to determine the lower heating value of the biogas Ambient temperature relative humidity and barometric pressure were measured near the turbine air inlet to support the determination of electrical conversion efficiency as specified in PTC-22 Electricity conversion efficiency was computed by dividing the average electrical energy output by the average energy input using Equation 1
η =341214 kW (Equation 1)
HI
where
η = efficiency () kW = average net electrical power output measured over the test interval (kW)
(Capstone 330 power output minus power consumed by gas compressor and water circulation pump)
HI = average heat input using LHV over the test interval (Btuhr) determined by multiplying the average mass flow rate of biogas to the system converted to standard cubic feet per hour (scfh) times the gas LHV (Btu per standard cubic foot Btuscf)
341214 = converts kW to Btuhr
Simultaneous with electrical power measurements heat recovery rate was measured using a heat meter (Controlotron Model 1010EP) The meter enabled 1-minute averages of differential heat exchanger temperatures and water flow rates to be monitored Published fluid density and specific heat values for water were used so that heat recovery rates could be calculated at actual conditions per ANSIASHRAE Standard 125 [4]
Heat Recovery Rate (Btumin) = Vρ Cp (T1-T2) (Equation 2)
where
V = total volume of liquid passing through the heat meter flow sensor during a minute (ft3) ρ = density of water solution (lbft3) evaluated at the avg temp (T2 plus T1)2 Cp = specific heat of water solution (Btulb oF) evaluated at the avg temp (T2 plus T1)2 T1 = temperature of heated liquid exiting heat exchanger (oF) (see Figure 1-4) T2 = temperature of cooled liquid entering heat exchanger (oF) (see Figure 1-4)
The average heat recovery rates measured during the controlled tests and the continuous monitoring period represent the heat recovery performance of the CHP system Thermal energy conversion efficiency was computed as the average heat recovered divided by the average energy input
1-10
ηT = 60 Qavg HI (Equation 3)
where
ηT = thermal efficiency () Qavg = average heat recovered (Btumin) HI = average heat input using LHV (Btuhr) determined by multiplying the average mass
flow rate of biogas to the system (converted to scfh) times the gas LHV (Btuscf)
Figure 1-5 illustrates the location of measurement variables contained in Equations 1 through 3 Power output was measured using a 7500 ION Power Meter (Power Measurements Ltd) at a rate of approximately one reading every 8 to 12 milliseconds and logged on the centers data acquisition system (DAS) as 1-minute averages The power meter was located in the main switchbox connecting the electrical output of the CHP system to the host site This location represented net power delivered to the farm after internal parasitic loads The logged one-minute average power output (kW) readings were averaged over the duration of each controlled test period for use in computing electrical efficiency The kW readings were integrated over the duration of the 35-hour verification period to calculate total electrical energy generated in units of kilowatt hours (kWh)
Biogas fuel input was measured with an in-line Dresser-Roots Series B Model 3M175 rotary displacement meter Meter readings were recorded manually at 10-minute intervals during the controlled test periods Gas temperature and pressure sensors were installed to enable flow rate compensation to provide mass flow output at standard conditions (60 oF 14696 psia)
The biogas flow rates metered on a wet basis were corrected to dry basis to represent the volume of gas actually consumed by the microturbine Biogas moisture content was determined for each controlled test run using the average measured biogas temperature and pressure and the published partial pressure of saturated gas [5] It was then assumed that the biogas as fired was dry (after the 3-stage moisture removal system and compression to 100 psig) Dry biogas flow rate was then calculated as
Vd = Vw (1- Bw) (Equation 4)
where
Vd = biogas volume wet basis (dscf) Vw = biogas volume dry basis (wscf) Bw = biogas moisture content ()
The TQAP specified a stain tube method of moisture determination that has an estimated 25 percent uncertainty However the GHG Center has learned on similar verifications conducted since the TQAP was written that the approach used here is more reliable and has less uncertainty than the stain tube procedure
1-11
Gas Dryers and Compressor
Capstone 330Microturbine Heat
Exchanger
480 208Volt Transformer
DC
A
B
EI
J
G
H
F
D
C
A
B I
J
HE
F
G
480 208Volt Transformer
DC
A
B
EI
J
G
H
F
D
C
A
B
D
C
A
B
D
C
A
B I
J
HE
F
G
EE
CHP SystemCHP SystemAir IntakeAir Intake ExhausEx thaust
Raw Biogas Utility GridRaw Biogas Utility GridInputInput
Measurement LocationsMeasurement Locations
D
C
A
B
Power ProductionPower ProductioPoPo nwer Productionwer ProductionE
F
G
I
J
H Water SupplyWWater Supplyater SupplyFuel Gas PressureFuel Gas PressureFFFuel Gas Pressureuel Gas Pressureuel Gas Pressure (T1)(T(T1)1)And Power Quality (kW)A ower Quality (kAAnd P W)nd Power Qualitynd Power Quality (kW) TemperatureTeTemperaturemperature
MeasurementsMeasurementsFuel Gas FlowFuel Gas FlowFuFuFuel Gas Flowel Gas Flowel Gas Flow Water ReturnWater ReturWatWat ner Returner ReturnAmbient TemperatureAAmbient Temperaturembient Temperature (T2)(T2(T(T )2)2)for heat inputfor heat input TemperatureTemperatTeTe uremperaturemperaturePressure and HumidityPPressure and Humidityressure and HumidityGas Samples for LHVGas Samples for LHVGasGasGas Samples for LHVSamples for LHVSamples for LHV (HI(H )I)
Emissions TestingEEmissions Testingmissions TestingWater Circulation (V)WWater Circulation (V)ater Circulation (V)Fuel Gas TemperatureFuel Gas TemperatureFFFuel Gas Temperatureuel Gas Temperatureuel Gas Temperature RateRaRatete
Microturbine Exhaust
Hot Water Supply
Water Return
Digester Heating Loop
Engine Heat Exchanger
System Boundary
Gas Dryers and Compressor
Capstone 330 Microturbine Heat
Exchanger
480 208 Volt Transformer
Microturbine Exhaust
Hot WaterSupply
Water Return
DigesterHeating Loop
EngineHeat Exchanger
DigesterHeating Loop
EngineHeat Exchanger
D C
A
B
JF
System Boundary
E I
G
H
Figure 1-5 Schematic of Measurement System
A total of six biogas samples were collected and analyzed during the controlled test periods to determine gas composition and heating value Samples were collected at a point in the biogas delivery line downstream of the meter but upstream of the gas drying system and compressor due to sampling restrictions (high gas pressure and the absence of sampling ports) The samples were submitted to Empact Analytical Systems Inc of Brighton CO for compositional analysis in accordance with ASTM Specification D1945 for quantification of methane (C1) to hexane plus (C6+) nitrogen oxygen and carbon dioxide [6] The compositional data were then used in conjunction with ASTM Specification D3588 to calculate LHV and the relative density of the gas [7]
In addition to the ASTM D1945 compositional analyses ASTM Method 5504 provided an extended analysis to quantify biogas concentrations of H2S [8] This method is essentially an extension of the ASTM D1945 procedures that uses additional chromatographic columns to separate H2S and heavier hydrocarbons
1-12
A Controlotron Model 1010EP1 energy meter was used to monitor water flow and supply and return temperatures This meter is a digitally integrated system that includes a portable computer ultrasonic fluid flow transmitters and 1000-ohm platinum resistance temperature detectors (RTDs) The meter has an overall rated accuracy of plusmn 2 percent of reading and provides a continuous 4-20 mA output signal over a selectable range The meter was installed in the 1-12-inch carbon steel water supply line
The water flow rate and supply and return temperature data used to determine heat recovery rates were logged as one-minute averages throughout all test periods The heat transfer fluid density and specific heat were determined by using ASHRAE and ASME density and specific heat values for water corrected to the average water temperature measured by the RTDs
142 Power Quality Performance
The GHG Center and its stakeholders developed the following power quality evaluation approach to account for these issues Three documents [9 10 11] formed the basis for selecting the power quality parameters of interest and the measurement methods used The GHG Center measured and recorded the following power quality parameters during the continuous monitoring period
bull Electrical frequency bull Voltage bull Voltage THD bull Current THD bull Power factor
The 7500 ION power meter used for power output determinations was used to perform these measurements as described below and detailed in the test plan The ION power meter continuously measured electrical frequency at the generatorrsquos distribution panel and the DAS was used to record oneshyminute averages throughout the verification The mean maximum and minimum frequencies as well as the standard deviation are reported
The CHP unit generates power at nominal 480 volts (AC) The electric power industry accepts that voltage output can vary within plusmn 10 percent of the standard voltage (480 volts) without causing significant disturbances to the operation of most end-use equipment [11] Deviations from this range are often used to quantify voltage sags and surges The ION power meter continuously measured true root mean square (rms) line-to-line voltage at the generatorrsquos distribution panel for each phase pair True rms voltage readings provide the most accurate representation of AC voltages The DAS recorded one-minute averages for each phase pair throughout the monitoring period as well as the average of the three phases The mean maximum and minimum voltages as well as the standard deviation for the average of the three phases are reported
THD is created by the operation of non-linear loads Harmonic distortion can damage or disrupt many kinds of industrial and commercial equipment Voltage harmonic distortion is any deviation from the pure AC voltage sine waveform THD gives a useful summary view of the generatorrsquos overall voltage quality The specified value for total voltage harmonic is a maximum THD of 50 percent based on ldquorecommended practices for individual customersrdquo in the IEEE 519 Standard The ION meter continuously measured voltage THD up to the 63rd harmonic for each phase The DAS recorded oneshyminute voltage THD averages for each phase throughout the test period and reported the mean minimum maximum and standard deviation for the average THD for the three phases
1-13
Current THD is any distortion of the pure current AC sine waveform The current THD limits recommended in the IEEE 519 standard range from 50 to 200 percent depending on the size of the CHP generator the test facilityrsquos demand and its distribution network design as compared to the capacity of the local utility grid Detailed analysis of the facilityrsquos distribution network and the local grid are beyond the scope of this verification The GHG Center therefore reported current THD data without reference to a particular recommended THD limit The ION power meter as with voltage THD continuously measured current THD for each phase and reported the average minimum and maximum values for the period
The ION power meter also continuously measured average power factor across each generator phase The DAS recorded one-minute averages for each phase during all test periods The GHG Center reported maximum minimum mean and standard deviation power factors averaged over all three phases
143 Emissions Performance
Pollutant concentration and emission rate measurements for NOX CO THCs SO2 TRS CH4 and CO2 were conducted on the turbine exhaust stack during all of the controlled test periods Testing for determination of TPM and NH3 was conducted at full load only Emissions testing coincided with the efficiency determinations described earlier The test procedures used are US EPA reference methods which are well documented in the Code of Federal Regulations (CFR) The reference methods include procedures for selecting measurement system performance specifications and test procedures quality control procedures and emission calculations (40CFR60 Appendix A) [12] Table 1-3 summarizes the standard test methods that were followed A complete discussion of the data quality requirements for example NOX analyzer interference test nitrogen dioxide [NO2] converter efficiency test sampling system bias and drift tests is presented in the test plan
Table 1-3 Summary of Emissions Testing Methods
Pollutant EPA Reference Method Analyzer Type Range
NOX 7E California Analytical Instruments (CAI) 400-CLD (chemiluminescense) 0 ndash 50 ppm
CO 10 TEI Model 48 (NDIR) 0 - 300 ppm
SO2 6C Bovar 721-AT (NDUV) 0 ndash 300 ppm
THC 25A California Analytical Instruments (FID) 0 ndash 300 ppm
CH4 18 Hewlett-Packard 5890 GCFID 0 - 300 ppm
CO2 3A CAI 200 (NDIR) 0 ndash 25
O2 3A CAI 200 (electrochemical) 0 ndash 25
TRS EPA 16A Ametek 921 White Cell (NDUV) 0 - 25 ppm
NH3 BAAQMD ST-1B Ion Specific Electrode Not specified
TPM EPA 5 Gravimetric Not specified
1-14
Emissions testing was conducted by Cubix Corporation of Austin Texas under the on-site supervision of the GHG Center field team leader A detailed description of the sampling system used for each parameter listed is provided in the test plan and is not repeated in this report Sampling was conducted during each test for approximately 30 minutes at a single point near the center of the 10-inch diameter stack Results of the gaseous pollutant testing are reported in units of parts per million volume dry (ppmvd) and ppmvd corrected to 15-percent O2 Concentrations of TPM are reported in units of grains per standard cubic foot (grdscf)
To convert measured pollutant concentrations to mass emissions exhaust gas flow rate determinations were conducted during each test run in accordance with EPA Method 2C Stack gas velocity and temperature traverses were conducted using a calibrated thermocouple a standard pitot tube and an inclined oil manometer The number and location of traverse points sampled was selected in accordance with EPA Method 1 At the conclusion of each test run equations specified in the reference methods were used to calculate exhaust gas velocity actual volumetric flow rate and volumetric flow rate at standard conditions
After converting measured pollutant concentrations to mass units of lbdscf emission rate values were calculated in units of lbhr using the standardized volumetric flow rates The mean of the three test results at each load factor is reported as the average emission rate for that load factor Emission rates for each pollutant are then normalized to system power and reported in terms of lbkWh
144 Estimated Annual Emission Reductions
The electric energy generated by the microturbine offsets electricity otherwise supplied by the utility grid Consequently the reduction in electricity demand from the grid caused by this offset will result in changes in CO2 and NOX emissions associated with producing an equivalent amount of electricity at central power plants If the CHP emissions per kWh are less than the emissions per kWh produced by an electric utility it can be inferred that a net reduction in emissions will occur at the site If the emissions from the on-site generators are greater than the emissions from the grid possibly due to the use of higher efficiency power generation equipment or zero emissions generating technologies (nuclear and hydroelectric) at the power plants a net increase in emissions may occur
The test plan included a detailed approach for estimating the emission reductions that this CHP system can provide Briefly the proposed approach estimated the annual microturbine NOX and CO2 emissions using the emission rates measured during the full load testing and the average generating rate measured during an extended test period The estimated annual CHP emissions could then be calculated in units of tons per year and compared to average emission rates published by the Energy Information Administration (EIA) for the US and Colorado The proposed approach did not include emission reductions associated with heat recovery as this process requires baseline GHG emission assessment from standard waste management practices Due to the significant resources required to do this OEMC elected to verify emission reductions from electricity generation only
Due to the cancellation of the extended test period estimation of annual power production CHP emissions could not be completed For this reason results of the microturbine CHP testing only provide measured emission rates A simple comparison of these emission rates for NOX and CO2 to the US and Colorado regional fossil fuel emission factors is all that the GHG Center can report here with the limited data set collected during this verification
1-15
20 VERIFICATION RESULTS
21 OVERVIEW
The verification testing was conducted on February 14 and 15 2004 This included the controlled tests at the four operating loads and the abbreviated continuous monitoring period to examine heat and power output and power quality The GHG Center acquired several types of data that represent the basis of verification results presented here The following types of data were collected and analyzed during the verification
bull Continuous measurements (biogas pressure biogas temperature power output and quality heat recovery rate and ambient conditions)
bull Manual biogas flow meter readings bull Biogas compositional data bull Emissions testing data bull CHP and facility operating data
The field team leader reviewed verified and validated some data such as DAS file data and reasonableness checks while on site The team leader reviewed collected data for reasonableness and completeness in the field The data from each of the controlled test periods was reviewed on site to verify that PTC-22 variability criteria were met The emissions testing data was validated by reviewing instrument and system calibration data and ensuring that those and other reference method criteria were met Factory calibrations for fuel flow pressure temperature electrical and thermal power output and ambient monitoring instrumentation were reviewed on site to validate instrument functionality Other data such as biogas analysis results were reviewed verified and validated after testing had ended All collected data was classed as either valid suspect or invalid upon review using the QAQC criteria specified in the test plan Review criteria are in the form of factory and on-site calibrations maximum calibration and other errors audit gas analyses results and lab repeatability results Results presented here are based on measurements which met the specified Data Quality Indicators (DQIs) and QC checks and were validated by the GHG Center
With the exception of the reduced load test conditions the microturbine CHP performance data collected during the 35-hour verification period are representative of normal site operations Due to the cancellation of the extended monitoring period the GHG Center was unable to obtain a reasonable set of data to examine daily trends in atmospheric conditions and their impact on electricity and heat production It should be noted that the results presented here may not represent performance over longer operating periods or at significantly different operating conditions
Test results are presented in the following subsections
Section 21 ndash Heat and Power Production Performance (controlled testing and monitoring period)
Section 22 ndash Power Quality Performance (continuous monitoring)
Section 23 ndash Emissions Performance and Reductions (controlled test periods)
2-1
The results show that the quality of power generated by the CHP system is generally high and that the unit is capable of operating in parallel with the utility grid The unit produced between 19 and 24 kW of net electrical power depending on ambient temperature (35 to 60 oF) during the monitoring period The highest heat recovery rate measured during the extended monitoring period was approximately 138 x 103Btuhr Electrical and thermal efficiencies at full power averaged 204 and 333 percent respectively with a corresponding total CHP system efficiency of 537 percent NOX emissions were very low at full load averaging 18 ppmvd at 15 O2 and 82 x 10 ndash 5 lbkWh
In support of the data analyses the GHG Center conducted an audit of data quality (ADQ) following procedures specified in the QMP A full assessment of the quality of data collected throughout the verification period is provided in Section 30 The data quality assessment was used to demonstrate that the data quality objectives (DQOs) introduced in the test plan were met for this verification
22 HEAT AND POWER PRODUCTION PERFORMANCE
The heat and power production performance evaluation included electrical power output heat recovery and CHP efficiency determinations during controlled test periods The performance evaluation also included determination of total electrical energy generated and used and thermal energy recovered over the continuous monitoring period
221 Electrical Power Output Heat Recovery Rate and Efficiency During Controlled Tests
Table 2-1 summarizes the power output heat recovery rate and efficiency performance of the CHP system Ambient temperature ranged from 45 to 58 oF relative humidity ranged from 23 to 41 percent and barometric pressure was between 1269 and 1271 psia during the controlled test periods The results shown in Table 2-1 and the discussion that follows are representative of conditions encountered at this site and are not intended to indicate performance at other operating conditions such as cooler temperatures and different elevations Biogas fuel conditions and heat recovery unit operation data corresponding to the test results are summarized in Table 2-2
Biogas fuel conditions and heat recovery unit operation data corresponding to the test results are summarized in Table 2-2 A total of 12 samples were collected for compositional analysis and determination of LHV There was very little variability in the biogas composition Average biogas CH4 and CO2 concentrations were 681 and 312 percent respectively The average LHV was 625 Btuscf and biogas compressibility averaged 0997 H2S concentrations in the biogas averaged 3730 ppm
The average net electrical power delivered to the farm was 199 kWe at full load The average electrical efficiency corresponding to these measurements was 204 percent Electrical efficiencies at the 24 20 and 15 kW power commands averaged 203 186 and 157 percent respectively Electric power generation heat rate which is an industry-accepted term to characterize the ratio of heat input to electrical power output averaged 16726 BtukWhe at full power
The average heat-recovery rate at full power was 111 x 103 Btuhr or 324 kWthhr and thermal efficiency was 333 percent The average total efficiency (electrical and thermal combined) was 537 percent for the three test runs The net heat rate which includes energy from heat recovery was 6354 BtukWht
2-2
Table 2-1 Microturbine Heat and Power Production Performance
Test ID Test
Condition
Heat Input HI
(103Btuhr)
Electrical Power Generation Performance
Heat Recovery Performance Total CHP
System Efficiency
()
Ambient Conditions c
Power Delivered a
(kWe)
Efficiency ()
Heat Recovery
Rate b
(103Btuhr)
Thermal Efficiency
() Temp (oF) RH ()
Run 1 Run 2 Run 3
Avg
30 kW power command
330 336 330
332
197 201 198
199
204 204 204
204
113 105 113
111
344 314 341
333
548 518 545
537
554 584 568
569
261 241 245
249 Run 4 Run 5 Run 6
Avg
24 kW power command
323 324 322
323
192 193 193
193
203 203 204
203
111 117 119
116
343 361 371
358
546 564 575
562
563 531 497
530
234 259 294
262 Run 7 Run 8 Run 9
Avg
20 kW power command
279 274 274
276
150 150 150
150
183 187 187
186
110 108 106
108
394 396 385
392
577 583 572
577
450 461 476
462
411 398 380
396 Run 10 Run 11 Run 12
Avg
15 kW power command
221 220 219
220
101 101 102
101
156 157 158
157
935 978 996
969
424 444 454
441
580 602 612
598
506 508 506
506
346 349 352
349
a Represents actual power available for consumption at the test site b Divide by 3412 to convert to equivalent kilowatts (kWth) c Barometric pressure was within the range of 1269 to 1271 psia throughout the test period
2-3
Table 2-2 Fuel Input and Heat Recovery Unit Operating Conditions
Test ID Test
Condition
Biogas Fuel Input Heating Loop Fluid Conditions
Gas Flow Rate (scfm)
LHV (Btuscf)
Gas Pressure
(psia)
Gas Temp (oF)
Fluid Flow Rate V (gpm)
Outlet Temp T1
(oF)
Inlet Temp T2
(oF)
Temp Diff (oF)
Run 1 Run 2 Run 3
Avg
30 kW power command
876 891 877
881 6276a
1389 1385 1383
1386
945 966 968
959
283 284 284
284
1013 1008 1008
1010
932 933 928
931
81 75 80
79 Run 4 Run 5 Run 6
Avg
24 kW power command
859 860 855
858
1384 1384 1385
1384
958 947 927
944
284 283 284
284
1011 1012 1008
1010
933 929 923
928
79 83 85
82 Run 7 Run 8 Run 9
Avg
20 kW power command
735 721 723
726 6325b
1396 1395 1395
1395
881 891 900
891
285 284 284
284
969 973 975
976
891 896 900
896
78 77 75
77 Run 10 Run 11 Run 12
Avg
15 kW power command
581 580 578
580
1397 1397 1394
1396
935 947 949
944
284 284 284
284
973 978 979
977
906 908 909
908
66 70 71
69 a Average of three separate samples collected on February 14 2004 b Average of three separate samples collected on February 15 2004
2-4
0
5
10
15
20
25
30
35
40
45
50
Effic
ienc
y (
)
0
5
10
15
20
25
Pow
er O
utpu
t(kW
)
30 kW Power Command 20 kW Power 15 kW Power Command24 kW Power
Power Output
ElectricalEfficiency
ThermalEfficiency
Results of the reduced load tests are also included in the tables Results show that electrical efficiency decreases slightly as the power output is reduced Thermal efficiency however increases as power output (and biogas consumption) decreases These trends are illustrated in Figure 2-1 which displays the electrical and thermal CHP system efficiency at each of the controlled test conditions
CommandCommand
0
5
10
15
20
25
30
35
40
45
50
Effic
ienc
y (
)
0
5
10
15
20
25
Pow
er O
utpu
t (kW
)
30 kW Power Command 20 kW Power Command
15 kW Power Command24 kW Power Command
Power Output
Electrical Efficiency
Thermal Efficiency
Figure 2-1 Electrical and Thermal Efficiency During Controlled Test Periods
As expected the high altitude of the test location (approximately 3700 feet above sea level) derated microturbine power output Table 2-1 and Figure 2-1 show that the power delivered at full load (after parasitic loads) was only 199 kW Power delivered at the 24 kW power command was nearly the same at 193 kW
222 Electrical and Thermal Energy Production During the Continuous Monitoring Period
Figure 2-2 presents a time series plot of power production and heat recovery during the abbreviated 35shyhour monitoring period The system was operated continuously at a power command of 30 kW except for periods when reduced load tests were conducted The CHP system was operated under typical farm conditions with the engine shut down and the heat recovery system configured to maintain digester temperature at around 100 oF A total of 6834 kWhe electricity and 1025 kWhth of thermal energy were generated over the 35-hour operating period The average power generated over the continuous monitoring period (excluding the reduced load testing) was 206 kWe and the average heat recovery rate was 1177 x 103 Btuhr
2-5
0
5
10
15
20
25
30Po
wer
Out
put (
kW)
70
90
110
130
150
170
Heat
Rec
over
y R
ate
(10
3 Btu
hr)
35 Consecutive Hours of Monitorin
Power Output
HeatRecoveryRate
Reduced LoadControlled TestPeriods
g 0
5
10
15
20
25
30Po
wer
Out
put (
kW)
70
90
110
130
150
170
Heat
Rec
over
y R
ate
(10
3 Btu
hr)
35 Consecutive Hours of Monitoringg35 Consecutive Hours of Monitorin
Power Output
Heat Recovery Rate
Reduced Load Controlled Test Periods
21404 21504221404 215041404 215041130 2230111130 223030 2230
Figure 2-2 Heat and Power Production During the Monitoring Period
The power output trace shows periodic trips at intervals of approximately four hours This was caused by the manner in which the facility was operating the biogas compressor To prevent damage to the compressor caused by moisture buildup in the condensate trap the trap was configured to automatically open momentarily to drain every four hours This caused a brief loss of fuel pressure thereby causing the microturbine to trip and restart The entire sequence normally took about 4 minutes to complete and in most cases the turbine was back to full power in 4 minutes The farm reports that the microturbine is no longer operated in this way
As is typical for gas fired turbines power output was also affected by ambient temperature The impact of temperature on this turbine is illustrated in Figures 2-3 and 2-4
2-6
0
5
10
15
20
25
Pow
er O
utpu
t (kW
)
20
40
60
80
Inle
t Air
Tem
pera
ture
(o F)
35 Consecutive Hours of Monitorin
Inlet AirTemperature
Power Output
25
Inlet Air Temperature
Power Output
80
Pow
er O
utpu
t (kW
)
20
60
15
10
40
Inle
t Air
Tem
pera
ture
( o F)
5
0 20 35 Consecutive Hours of Monitorin 35 Consecutive Hours of Monitoringgg
21404 21504221404 215041404 215041130 2230111130 223030 2230
Figure 2-3 Power Output and Ambient Temperature During the Verification Period
15
16
17
18
19
20
21
22
23
24
25
Pow
er O
utpu
t (kW
)
30 35 40 45 50 55 60 65
Ambient Temperature (oF)
Figure 2-4 Ambient Temperature Effects on Power Production During the Verification Period
Figure 2-4 plots power output at full load over the limited test period as a function of ambient temperature and indicates a generally linear relationship The generating rate ranged from about 19 to 235 kW across a temperature range of 349 to 596 oF
2-7
23 POWER QUALITY PERFORMANCE
231 Electrical Frequency
Electrical frequency measurements (voltage and current) were monitored continuously during the verification period The one-minute average data collected by the electrical meter were analyzed to determine maximum frequency minimum frequency average frequency and standard deviation for the verification period These results are illustrated in Figure 2-5 and summarized in Table 2-3 The average electrical frequency measured was 59999 Hz and the standard deviation was 0010 Hz
60060 606
60060 404
60060 202
60060 000
59959 898
59959 696
59959 494
59599922
222111444000444111111333000
35 C35 C35 Consonsonseeecccutututiiivvveee HHHooouuursrsrs ofofof MoMoMonininitttooorrriiingngng 222111555000444222222303030
Figure 2-5 Microturbine Frequency During Verification Period
Table 2-3 Electrical Frequency During Monitoring Period
Parameter Frequency (Hz) Average Frequency 59999 Minimum Frequency 59959 Maximum Frequency 60037 Standard Deviation 0010
Freq
uenc
y (H
z)Fr
eque
ncy
(Hz)
2-8
232 Voltage Output
It is typically accepted that voltage output can vary within plusmn 10 percent of the standard voltage (480 volts) without causing significant disturbances to the operation of most end-use equipment (ANSI 1996) The 7500 ION electric meter was configured to measure 0 to 600 VAC The turbine was grid-connected and operated as a voltage-following current source The voltage levels measured are therefore more indicative of the grid voltage levels that the Capstone tried to respond to
Figure 2-6 plots one-minute average voltage readings and Table 2-4 summarizes the statistical data for the voltages measured on the turbine throughout the verification period The voltage levels were well within the normal accepted range of plusmn 10 percent
460
470
480
490
500
Vol
tage
35 Consecutive Hours of Monitoring
460
470
480
490
500
Vol
tage
35 Consecutive Hours of Monitoring35 Consecutive Hours of Monitoring222111444000444111111333000
222111555000444222222333000
Figure 2-6 Microturbine Voltage During Verification Period
Table 2-4 Microturbine Voltage During Monitoring Period
Parameter Volts Average Voltage 48725 Minimum Voltage 47843 Maximum Voltage 49186 Standard Deviation 245
2-9
233 Power Factor
Figure 2-7 plots one-minute average power factor readings and Table 2-5 summarizes the statistical data for power factors measured on the turbine throughout the verification period The data include only periods when the microturbine was operating Data collected during the periodic trips are not included in the figure or summary table Test results show that the power factor was very stable throughout the period with the turbine at full load The power factor decreased during the low load controlled test periods
Figure 2-7 Microturbine Power Factor During Verification Period
88
90
92
94
96
98
Pow
er F
acto
r (
)
35 Consecutive Hours of Monitoring 88
90
92
94
96
98
Pow
er F
acto
r (
)
35 Consecutive Hours of Monitoring35 Consecutive Hours of Monitoring21404 215042121404 21504404 215041130 2230111130 223030 2230
Table 2-5 Power Factors During Monitoring Period
Parameter Average at full load 9453 Minimum at full load 9177 Maximum at full load 9493 Standard Deviation at full load 0240 Average at 20 kW 9280 Average at 15 kW 8987
2-10
234 Current and Voltage Total Harmonic Distortion
The turbine total harmonic distortion up to the 63rd harmonic was recorded for current and voltage output using the 7500 ION The average current and voltage THD were 321 and 189 percent respectively (Table 2-6) Both were well within the IEEE 519 specification of plusmn 5 percent Figure 2-8 plots the current and voltage THD throughout the verification period Figure 2-8 clearly shows a spike in current THD each time the microturbine was tripped by the biogas pressure loss The highest of the spikes was 32 percent
Table 2-6 Microturbine THD During Monitoring Period
Parameter Current THD () Voltage THD () Average 321 189 Minimum 222 160 Maximum 325 316 Standard Deviation 115 018
Figure 2-8 Microturbine Current and Voltage THD During Verification Period
0
2
4
6
8
10
12
THD
()
35 Consecutive Hours of Monitoring
Voltage THD
Current THD
0
2
4
6
8
10
12
THD
()
35 Consecutive Hours of Monitoring35 Consecutive Hours of Monitoring
Voltage THD
CurrentTHD
21404 21504221404 215041404 215041130 2230111130 223030 2230
2-11
24 EMISSIONS PERFORMANCE
241 Microturbine CHP System Emissions
Testing was conducted on the turbine exhaust stack to determine emission rates for NOX CO THC SO2 TRS CH4 and CO2 at each of the four controlled test conditions Testing for determination of TPM and NH3 was conducted at full load only Stack emission measurements were conducted using the reference methods summarized in Table 1-3 and detailed in the test plan The CHP system was maintained in a stable mode of operation during each test run based on PTC-22 variability criteria
Sampling system QAQC checks were conducted in accordance with test plan specifications to ensure the collection of adequate and accurate emissions data These included analyzer linearity tests and sampling system bias and drift checks Results of the QAQC checks are discussed in Section 325 The results show that DQOs for all gas species met the reference method requirements Table 2-7 summarizes the emission rates measured during each run and the overall average emissions for each set of tests
NOX concentrations averaged 175 ppmvd at 15 O2 at full load and increased to 346 ppmvd at the lowest load tested (setting of 15 kW) The overall average NOX emission rate at full load normalized to power output was 000008 lbkWh The benefits of lower NOX emissions from the CHP system are further enhanced by the fact that some of the exhaust heat is recovered and used Annual published data from Energy Information Administration (EIA) reveal that the measured CHP system NOX emission rate is well below the weighted average US and Colorado regional grid emission factors identified in the test plan which are 00066 and 00077 lbkWh respectively As stated earlier the center could not estimate annual emission reductions due to insufficient power production data but the emissions testing results clearly indicate that reductions will be realized through use of this CHP system The emission reductions are further increased when transmission and distribution system losses are accounted for
Average exhaust gas CO concentrations ranged from a low of 305 ppmvd at 15 O2 at full load to a high of 451 ppmvd at 15 O2 at the 15 kW power command Corresponding average CO emission rates at these power commands were approximately 0009 and 0017 lbkWh respectively
Similarly THC (and CH4) concentrations increased as power output decreased and ranged from 165 ppmvd at 15 O2 at full load to 475 ppmvd at 15 O2 at the 15 kW power command Corresponding average THC emission rates at these power commands were approximately 0003 and 0011 lbkWh respectively The CH4 emissions consistently comprised about 80 percent of the THC emissions
Concentrations of CO2 in the CHP system exhaust gas averaged 23 percent at full load and decreased as power output was reduced to a low of 20 percent These concentrations correspond to average CO2 emission rates of 345 lbkWh and 390 lbkWh respectively The CHP system CO2 emission rate at full load is higher than the weighted average fossil fuel emission factors for both the US and Colorado regional grids (202 and 213 lbkWh respectively) This indicates a likely increase in annual CO2 emissions for power production from this system but this increase would likely be offset by efficiency gains resulting from heat recovery and use and elimination of transmission and distribution system losses
2-12
Table 2-7 Microturbine CHP System Emissions During Controlled Test Periods
Pow
erC
omm
and
(kW
)
Elec
tric
alPo
wer
Out
put
(kW
) Exhaust
O2 ()
NOx Emissions CO Emissions THC Emissions CH4 Emissions CO2 Emissions
(ppm at
15 O2) (lbhr) (lbkWh)
(ppm at
15 O2) (lbhr) (lbkWh)
(ppm at
15 O2) (lbhr) (lbkWh)
(ppm at
15 O2) (lbhr) (lbkWh) () (lbhr) (lbkWh)
Run 1
Run 2
Run 3
AVG
30
197
201
198
199
191
191
192
191
170
180
174
175
161E-03
167E-03
161E-03
163E-03
817E-05
831E-05
814E-05
821E-05
250
310
354
305
0144
0175
0199
0173
0007
0009
0010
0009
141
163
190
165
0046
0052
0061
0053
235E-03
261E-03
310E-03
269E-03
112
141
157
137
0037
0045
0051
0044
187E-03
226E-03
256E-03
223E-03
23
23
23
23
682
668
707
686
346
332
358
345
Run 4
Run 5
Run 6
AVG
24
192
193
193
193
191
192
192
192
190
201
198
196
184E-03
184E-03
180E-03
183E-03
954E-05
952E-05
936E-05
947E-05
319
345
364
343
0188
0191
0202
0194
0010
0010
0010
0010
184
194
200
193
0062
0061
0063
0062
321E-03
319E-03
328E-03
323E-03
141
155
183
160
0047
0049
0058
0051
246E-03
254E-03
300E-03
267E-03
23
23
23
23
696
696
696
696
362
361
361
361
Run 7a
Run 8
Run 9
AVG
20
150
150
150
150
193
193
193
193
505
575
572
399
0004
0042
0042
0029
248E-04
281E-03
279E-03
195E-03
590
192
199
327
0263
0086
0089
0146
0018
0006
0006
0010
365
132
126
208
0093
0034
0032
0053
622E-03
225E-03
214E-03
354E-03
293
97
105
165
0075
0025
0027
0042
499E-03
165E-03
179E-03
281E-03
22
22
22
22
569
569
569
569
380
379
378
379
Run 10
Run 11
Run 12
AVG
15
101
101
102
101
190
191
191
191
332
351
354
346
0022
0022
0022
0022
219E-03
218E-03
220E-03
219E-03
441
459
452
451
0179
0176
0174
0176
0018
0017
0017
0017
483
484
457
475
0112
0106
0100
0106
110E-02
105E-02
987E-03
105E-02
360
413
410
394
0083
0091
0090
0088
824E-03
893E-03
885E-03
867E-03
20
20
20
20
395
395
395
395
391
390
390
390
a The NOX CO and CH4 concentrations during run 7 are questionable when compared to the data collected during runs 8 and 9 A brief 4-minute microturbine shutdown occurred at the conclusion of run 7 but the GHG Center was unable to resolve this anamoly after reviewing all available system operating data
2-13
Table 2-7 Microturbine CHP System Emissions During Controlled Test Periods (Continued)
Pow
erC
omm
and
(kW
)
Elec
tric
alPo
wer
Out
put
(kW
) Exhaust
O2 ()
Particulate Emissions NH3 Emissions SO2 Emissions TRS Emissions
(grdscf) (lbhr) (lbkWh)
(ppm at
15 O2) (lbhr) (lbkWh)
(ppm at
15 O2) (lbhr) (lbkWh)
(ppm at
15 O2) (lbhr) (lbkWh)
Run 1
Run 2
Run 3
AVG
30
197
201
198
199
191
191
192
191
00055
00053
00022
00043
0016
0015
0006
0012
811E-04
746E-04
304E-04
620E-04
005
004
002
004
170E-05
131E-05
600E-06
120E-05
862E-07
654E-07
304E-07
607E-07
488
582
614
561
064
073
081
073
0032
0036
0041
0037
155
144
570
119
0020
0018
0008
0015
101E-03
913E-04
406E-04
778E-04
Run 4
Run 5
Run 6
AVG
24
192
193
193
193
191
192
192
192
ND
ND
ND
NA
ND
ND
ND
NA
ND
ND
ND
NA
ND
ND
ND
NA
ND
ND
ND
NA
ND
ND
ND
NA
560
596
584
580
077
076
075
076
0040
0039
0039
0039
483
327
196
335
00067
00042
00025
00045
348E-04
218E-04
130E-04
232E-04
Run 7
Run 8
Run 9
AVG
20
150
150
150
150
193
193
193
193
ND
ND
ND
NA
ND
ND
ND
NA
ND
ND
ND
NA
ND
ND
ND
NA
ND
ND
ND
NA
ND
ND
ND
NA
594
590
588
591
061
060
061
061
0041
0040
0041
0040
820
678
581
693
00084
00069
00060
00071
561E-04
461E-04
401E-04
474E-04
Run 10
Run 11
Run 12
AVG
15
101
101
102
101
190
191
191
191
ND
ND
ND
NA
ND
ND
ND
NA
ND
ND
ND
NA
ND
ND
ND
NA
ND
ND
ND
NA
ND
ND
ND
NA
477
500
496
491
043
043
043
043
0043
0042
0042
0042
268
229
228
242
00024
00020
00020
00021
237E-04
198E-04
198E-04
211E-04
ND = No data collected These pollutants not tested at reduced loads NA = Not applicable
2-14
Emissions of total particulate matter and NH3 were extremely low during each of the three test replicates conducted at full power SO2 emissions from the CHP were fairly consistent throughout the range of operation At full load SO2 concentrations averaged 561 ppmvd at 15 O2 and corresponding emission rates averaged 0037 lbkWh Emissions of TRS the sulfurous compounds in the fuel that were not oxidized during combustion averaged approximately 780 ppmvd at 15 O2 and 0005 lbkWh during the full load tests
2-15
30 DATA QUALITY ASSESSMENT
31 DATA QUALITY OBJECTIVES
The GHG Center selects methodologies and instruments for all verifications to ensure a stated level of data quality in the final results The GHG Center specifies data quality objectives (DQOs) for each verification parameter before testing commences Each test measurement that contributes to the determination of a verification parameter has stated data quality indicators (DQIs) which if met ensure achievement of that verification parameterrsquos DQO
The establishment of DQOs begins with the determination of the desired level of confidence in the verification parameters Table 3-1 summarizes the DQOs established in the test planning stage for each verification parameter The actual data quality achieved during testing is also shown The next step is to identify all measured values which affect the verification parameter and determine the levels of error which can be tolerated These DQIs most often stated in terms of measurement accuracy precision and completeness are used to determine if the stated DQOs are satisfied The DQIs for this verification shyused to support the DQOs listed in Table 3-1 - are summarized in Table 3-2
Table 3-1 Verification Parameter Data Quality Objectives
Verification Parameter Original DQO Goala
Relative () Absolute (units) Achievedb
Relative () Absolute (units) Power and Heat Production Performance
Electrical power output (kW) plusmn 15 098 kW plusmn 10 020 kW Electrical efficiency () plusmn 15 041c plusmn 13 027c
Heat recovery rate (103Btuhr) plusmn 17 575 x 103Btuhrc plusmn 24 27 x 103Btuhrc
Thermal energy efficiency () plusmn 17 071c plusmn 25 083c
CHP production efficiency () plusmn 12 082c plusmn 16 087c
Power Quality Performance Electrical frequency (Hz) plusmn 001 0006 Hz plusmn 001 0006 Hz Voltage 10 48 Vc 10 49 Vc
Power factor () plusmn 050 TBD plusmn 050 047 Voltage and current total harmonic distortion (THD) () plusmn 100 TBD plusmn 100 003
Emissions Performance NOX CO CO2 O2 TRS and SO2 concentration accuracy plusmn 20 of spand plusmn 20 of spand
CH4 and THC concentration accuracy plusmn 50 of spand plusmn 50 of spand
TPM and NH3 concentration accuracy plusmn 50 plusmn 100 a Original DQO goals as stated in test plan Absolute errors were provided in the test plan where applicable based on anticipated
values b Overall measurement uncertainty achieved during verification The absolute errors listed are based on these uncertainties and the
average values measured during the verification c Calculated composite errors were derived using the procedures described in the corresponding subsections (Sections 322 through
325) d Qualitative data quality indicators based on conformance to reference method requirements
The DQIs specified in Table 3-2 contain accuracy precision and completeness levels that must be achieved to ensure that DQOs can be met Reconciliation of DQIs is conducted by performing independent performance checks in the field with certified reference materials and by following approved reference methods factory calibrating the instruments prior to use and conducting QAQC procedures in
3-1
the field to ensure that instrument installation and operation are verified The following sections address reconciliation of each of the DQI goals
This verification was supported by an Audit of Data Quality (ADQ) conducted by the GHG Center QA manager During the ADQ the QA manager randomly selected data supporting each of the primary verification parameters and followed the data through the analysis and data processing system The ADQ confirmed that no systematic errors were introduced during data handling and processing A performance evaluation audit (PEA) and a technical systems audit (TSA) were planned but not conducted Similar PEAs were recently conducted on two recent CHP verifications [13 14] and it was decided to not repeat the PEA a third time Likewise a full TSA was recently completed on a similar verification [13] where the same measurement systems were used so this QA activity was not repeated here Instead the GHG Center QA manager conducted an abbreviated project review to ensure that the verification approach and analytical procedures specified in the TQAP were followed or in cases where changes to the verification were necessary these changes were justified and documented Corrective action reports (CARs) are completed signed by the GHG Center QA manager and filed at the GHG Center that document significant changes to the verification approach or methodologies that occurred during the verification
32 RECONCILIATION OF DQOs AND DQIs
Table 3-2 summarizes the range of measurements observed in the field and the completeness goals Completeness is the number or percent of valid determinations actually made relative to the number or percent of determinations planned The completeness goals for the controlled tests were to obtain electrical and thermal efficiency as well as emission rate data for three test runs conducted at each of four different load conditions This completeness goal was achieved
Completeness goals for the extended tests were to obtain 90 percent of 7 days of power quality power output heat recovery rate and ambient measurements This goal was not achieved As explained in Section 21 the Center was not able to complete the entire 7-day extended monitoring period A total of 35 hours of data were logged including the controlled test periods
Table 3-2 also includes accuracy goals for measurement instruments Actual measurement accuracy achieved is also reported based on instrument calibrations conducted by manufacturers field calibrations reasonableness checks or independent performance checks with a second instrument Table 3-3 includes the QAQC procedures that were conducted for key measurements in addition to the procedures used to establish DQIs The accuracy results for each measurement and their effects on the DQOs are discussed below
3-2
3-3
Table 3-2 Summary of Data Quality Indicator Goals and Results
Measurement Variable Instrument Type and
Manufacturer
Instrument Range
Range Observed in
Field
Accuracy Completeness
Goal Actual How Verified or Determined Goal Actual
CHP System Power Output and Quality
Power
Electric Meter Power Measurements 7500 ION
0 to 100 kW 0 to 242 kW plusmn 15 reading plusmn 10 reading
Instrument calibration from manufacturer prior to testing
Controlled tests three valid runs per load meeting PTC 22 criteria
Extended test 90 of one minute readings for 7 days
Controlled tests three valid runs at each load
Extended test 35 consecutive hours of one minute readings
Voltage 0 to 600 V 478 to 492 V plusmn 10 reading plusmn 10 reading Frequency 55 to 65 Hz 599 to 600 Hz plusmn 001 reading plusmn 001 reading Current 0 to 200A 5 to 29 A plusmn 10 reading plusmn 10 reading Voltage THD 0 to 100 16 to 32 plusmn 10 full scale plusmn 10 full scale Current THD 0 to 100 22 to 325 plusmn 10 full scale plusmn 10 full scale
Power Factor 0 to 100 918 to 949 plusmn 05 reading plusmn 05 reading
CHP System Heat Recovery Rate
Inlet Temperature
Controlotron Model 1010EP
80 to 150 oF 89 to 94 oF Temps must be plusmn 15 oF of ref Thermocouples
plusmn 07 oF for outlet plusmn 08 oF for inlet
Independent check with calibrated thermocoupleOutlet
Temperature 80 to 150 oF 93 to 102 oF
Water Flow 0 to 150 gpm 281 to 286 gpm plusmn 10 reading plusmn 01 reading Instrument calibration from manufacturer prior to testing
Ambient Conditions
Ambient Temperature
RTD Vaisala Model HMD 60YO
-50 to 150 oF 35 to 60 o F plusmn 02 oF plusmn 02 oF
Instrument calibration from manufacturer prior to testing
Ambient Pressure
Setra Model 280E 0 to 25 psia 1268 to 1272
psia plusmn 01 full scale plusmn 005 full scale
Relative Humidity
Vaisala Model HMD 60YO 0 to 100 RH 21 to 49 RH plusmn 2 plusmn 02
(continued)
3-3
3-4
Table 3-2 Summary of Data Quality Indicator Goals and Results (continued)
Measurement Variable Instrument Type and Manufacturer
Instrument Range
Measurement Range
Observed
Accuracy Completeness
Goal Actual How Verified or Determined Goal Actual
Fuel Input
Gas Flow Rate Dresser-Roots Model 2M175 SSM Series B3 rotary displacement
0 to 30 scfm 5 to 10 scfm 10 of reading plusmn 03 of reading
Factory calibration with volume prover
Controlled tests three valid runs per load meeting PTC 22 criteria Extended test 90 of one- minute readings for 7 days
Controlled tests three valid runs at each load
Extended test 35 hours of one-minute readings
Gas Pressure Omega Model PX205shy030AI transducer 0 to 30 psia 12 to 14 psia plusmn 075 full
scale plusmn 025 full scale Instrument calibration to NIST traceable standards
Gas Temperature
Omega TX-93 Type K thermocouple 0 to 200 oF 75 to 97 oF plusmn 010 reading plusmn 010 reading
LHV Gas Chromatograph HP 589011
0 to 100 CH4
67 to 69 CH4 plusmn 30 accuracy plusmn 02 repeatability
plusmn 05 accuracy plusmn 005 repeatability
analysis of NIST-traceable CH4 standard and duplicate analysis on 3 samples
Controlled tests two valid samples per load
Controlled tests two valid samples per load627 to 633
Btuft3 01 repeatability
plusmn 006 repeatability
Conducted duplicate analyses on 3 samples
Exhaust Stack Emission
NOX Levels Chemiluminescent CAI 400-CLD
0 to 50 ppmvd 0 to 3 ppmvd plusmn 2 full scale le 2 full scale
Calculated following EPA Reference Method calibrations (Before and after each test run)
Controlled tests three valid runs per load
Controlled tests three valid runs per load
CO Levels NDIR TEI Model 48 0 to 300 ppmvd
50 to 160 ppmvd plusmn 2 full scale le 2 full scale
CH4 levels HP 5890 0 to 300 ppmv 30 to 130 ppmv plusmn 5 full scale le 5 reading
THC levels HP 5890 0 to 300 ppmv 40 to 160 ppmv plusmn 5 full scale le 5 full scale
SO2 Levels Bovar 721-AT 0 to 300 ppmvd
145 to 185 ppmvd plusmn 2 full scale le 2 full scale
O2 CO2 Levels CAI 200 0 to 25 10 to 20 O2
20 to 25 CO2 plusmn 2 full scale le 2 full scale
TRS Levels Ametek 921 0 to 25 ppmvd 0 to 5 ppmvd plusmn 2 full scale le 2 full scale
NH3 Levels Ion specific electrode 0 to 5 ugml 0 to 42 ugml plusmn 5 full scale le 5 full scale
TPM concentrations gravimetric Not specified 001 to 004 g plusmn 1 mg plusmn 05 mg
Stack gas velocity
Pitot and thermocouple Not specified 3552 to 3753
fpm plusmn 5 reading le 5 reading
3-4
321 Power Output
Instrumentation used to measure power was introduced in Section 10 and included a Power Measurements Model 7500 ION The data quality objective for power output was plusmn 15 percent of reading which includes compounded error of the instrument and the current transformers (CTs) The test plan specified factory calibration of the ION meter with a NIST-traceable standard to determine if the power output DQO was met The Test plan also required the GHG Center to perform several reasonableness checks in the field to ensure that the meter was installed and operating properly The following summarizes the results
The meter was factory calibrated by Power Measurements in April 2003 Calibrations were conducted in accordance with Power Measurementsrsquo standard operating procedures (in compliance with ISO 90021994) and are traceable to NIST standards The meters were certified by Power Measurements to meet or exceed the accuracy values summarized in Table 3-2 for power output voltage current and frequency NIST-traceable calibration records are archived by the GHG Center Pretest factory calibrations on the meters indicated that accuracy was within plusmn 005 percent of reading and this value combined with the 10-percent error inherent to the current transformers resulted in an overall error of plusmn 101 percent Using the manufacturer-certified calibration results and the average power output measured during the full-load testing the absolute error during all testing is plusmn 020 kW
Additional QC checks were performed on the 7500 ION to verify the operation after installation of the meters at the site and prior to the start of the verification test The results of these QC checks (summarized in Table 3-3) are not used to reconcile the DQI goals but to document proper operation in the field Current and voltage readings were checked for reasonableness using a hand-held Fluke multimeter These checks confirmed that the voltage and current readings between the 7500 ION and the Fluke were within the range specified in the test plan as shown in Table 3-3
These results led to the conclusion that the 7500 ION was installed and operating properly during the verification test The plusmn 10-percent error in power measurements as certified by the manufacturer was used to reconcile the power output DQO (discussed above) and the electrical efficiency DQO (discussed in Section 322)
3-5
Table 3-3 Results of Additional QAQC Checks
Measurement Variable QAQC Check When
PerformedFrequency Expected or Allowable
Result Results Achieved
Power Output
Sensor diagnostics in field Beginning and end of test Voltage and current checks
within plusmn 1 reading plusmn 01 voltage plusmn 09 current
Reasonableness checks Throughout test Readings should be around 22 kW net power output at full load
Readings were 20 to 24 kW at full load
Fuel Heating Value
Calibration with gas standards by laboratory
Prior to analysis of each lot of samples submitted
plusmn 10 for each gas constituent Results satisfactory see
Section 3224 Independent performance checks with blind audit sample
Twice during previous year
plusmn 30 for each major gas constituent (methane CO2)
Heat Recovery Rate
Meter zero check Prior to testing Reported water flow rate lt 01 gpm ndash006 gpm recorded
Independent performance check of temperature readings
Beginning of test period Difference in temperature readings should be lt 15 degF
Temperature readings within 08 degF of reference
322 Electrical Efficiency
The DQO for electrical efficiency was to achieve an uncertainty of plusmn 152 percent at full electrical load or less Recall from Equation 1 (Section 141) that the electrical efficiency determination consists of three direct measurements power output fuel flow rate and fuel LHV The accuracy goals specified to meet the electrical efficiency DQO consisted of plusmn 15 percent for power output plusmn 10 percent for fuel flow rate and plusmn 02 percent for LHV The accuracy goals for each measurement were met The following summarizes actual errors achieved and the methods used to compute them
Power Output As discussed in Section 321 factory calibrations of the 7500 ION with a NISTshytraceable standard and the inherent error in the current and potential transformers resulted in plusmn 10-percent error in power measurements Reasonableness checks in the field verified that the meter was functioning properly The average power output at full load was approximately 20 kW with a measurement error of plusmn 020 kW
Heat Input Heat input is the product of measured fuel flow rate and LHV The DQI goal for fuel flow rate was reconciled through calibration of the gas meter and the gas temperature and pressure sensors used to correct measured gas volumes to standard conditions All three components were calibrated with NIST-traceable standards As shown in Table 3-2 the individual instruments errors were 03 025 and 01 percent for flow pressure and temperature respectively The overall error in biogas flow rate on a wet basis then is 040 percent of reading
Since biogas flow rate was metered on a wet and low pressure basis but combusted by the microturbine on a dry high pressure basis measured flow rates were corrected for moisture content (Section 142) Since the actual moisture content of the as-fired biogas was not directly measured the assumption that the gas was completely dry introduced additional error into the heat input determination The center
3-6
conducted an analysis of this assumption and knowing the temperature and pressure of the gas as fired determined that the worst case error introduced by the assumption that the gas is totally dry is 07 percent Combining that uncertainty with the heat input wet basis error of 040 percent the overall error on determination of biogas flow rate on a dry basis is then 081 percent of reading
The average flow rate at full load was 881 scfm with an associated measurement error of plusmn 007 scfm Complete documentation of data quality results for fuel flow rate is provided in Section 325
Uncertainty in the biogas LHV results was within the 02 percent DQI goal (Section 326) The average LHV during testing was 630 Btuft3 and the measurement error corresponding to this heating value is plusmn 13 Btuft3 The heat input compounded error then is
Error in Heat Input = ( flowmetererror )2 + (LHVerror)2 (Equation 5)
= (00081)2 + (0002)2 = 00083
The measurement error amounts to approximately plusmn 27 x 103Btuhr or 083 percent relative error at the average measured heat input of 332 x 103Btuhr
The errors in the divided values compound similarly for the electrical efficiency determination The electrical power measurement error is plusmn 10 percent relative (Table 3-2) and the heat input error is plusmn 083 percent relative Therefore compounded relative error for the electrical efficiency determination is
Error in Elec Power Efficiency = (powermetererror)2 + (heatinputerror)2 (Equation 6)
= (0010)2 + (00083)2 = 00130
Electrical efficiency for the controlled test periods at full load was 204 plusmn 027 percent or a relative compounded error of 13 percent
323 PTC-22 Requirements for Electrical Efficiency Determination
PTC-22 guidelines state that efficiency determinations were to be performed within 60 minute test periods in which maximum variability in key operational parameters did not exceed specified levels Table 3-4 summarizes the maximum permissible variations observed in power output ambient temperature ambient pressure biogas pressure at the meter and biogas temperature at the meter for each test run The table shows that the requirements for all parameters were met for all test runs and the efficiency determinations were representative of stable operating conditions
3-7
Table 3-4 Variability Observed in Operating Conditions Maximum Observed Variationa in Measured Parameters
Power Output ()
Ambient Temp (oF)
Ambient Pressure ()
Biogas pressure
(psia)
Power Factor ()
Maximum Allowable Variation plusmn 2 plusmn 4 plusmn 05 plusmn 1 plusmn 2
Run 1 06 11 003 02 02 Run 2 17 07 003 01 01 Run 3 18 06 002 01 01 Run 4 03 22 001 02 01 Run 5 03 09 001 02 01 Run 6 04 25 002 02 02 Run 7 03 03 001 03 01 Run 8 04 07 001 01 01 Run 9 02 08 001 02 01
Run 10 04 05 002 01 01 Run 11 04 04 003 02 01 Run 12 03 04 002 03 01
a Maximum (Average of Test Run ndash Observed Value) Average of Test Run 100
324 Ambient Measurements
Ambient temperature relative humidity and barometric pressure at the site were monitored throughout the verification period and the controlled tests The instrumentation used is identified in Table 3-2 along with instrument ranges data quality goals and data quality achieved All three sensors were factoryshycalibrated using reference materials traceable to NIST standards The pressure sensor was calibrated prior to the verification testing confirming the plusmn 01 percent accuracy The temperature and relative humidity sensors were also calibrated within a year prior to testing which verified that the plusmn 02 degF accuracy goal for temperature and plusmn 2 percent accuracy goal for relative humidity were met
325 Fuel Flow Rate
The Dresser-Roots Model 2M175 rotary displacement gas meter was factory-calibrated prior to installation in 1999 Calibration records were obtained and reviewed to ensure that the plusmn 10-percent instrument accuracy goal was satisfied The original calibration for the Roots meter indicating an accuracy of plusmn 032 percent is a permanent calibration This error combines with the errors in the gas temperature pressure and moisture determinations for an overall biogas flow rate measurement error of plusmn 081 percent
326 Fuel Lower Heating Value
Biogas sample collection date time run number and canister ID were logged along with laboratory chain of custody forms and were shipped along with the samples Copies of the chain of custody forms and results of the analyses are stored in the GHG Center project files Collected samples were shipped to Empact Analytical Laboratories of Brighton CO for compositional analysis and determination of LHV
3-8
per ASTM test Methods D1945 [6] and D3588 [7] respectively The DQI goals were to measure methane concentrations within plusmn 30 percent of a NIST-traceable blind audit sample and to achieve less than plusmn 02 percent difference in LHV duplicate analyses results Blind audits were submitted to Empact on two similar verifications within the past year to evaluate analytical accuracy on the methane analyses [13 14] Both audits indicated analytical accuracy within 05 percent and repeatability of within plusmn 02 percent Since the same sampling and analytical procedures were used here by the same analyst the audit was not repeated a third time
Duplicate analyses in addition to the blind audit samples were conducted on three of the samples collected during the controlled test periods Duplicate analysis is defined as the analysis performed by the same operating procedure and using the same instrument for a given sample volume Results of the duplicate analyses showed an average analytical repeatability of 006 percent for methane and 006 percent for LHV The results demonstrate that the plusmn 02 percent LHV accuracy goal was achieved As such both DQIs were met with the methane accuracy at plusmn 05 percent and the LHV repeatability at plusmn 006 percent
327 Heat Recovery Rate and Efficiency
Several measurements were conducted to determine CHP system heat-recovery rate and thermal efficiency These measurements include water flow rate water supply and return temperatures and CHP system heat input The individual errors in each of the measurements is then propagated to determine the overall error in heat-recovery rate and efficiency The Controlotron ultrasonic heat meter was used to continuously monitor water flow rate This meter has a NIST-traceable factory-calibrated accuracy of plusmn 10 percent of reading (this flow through calibration was conducted on October 9 2002) This certification serves as the primary DQI A zero check was also performed on the flow meter The meter reading was -006 gpm with the CHP system shut down and the circulation pump off
Table 3-2 showed that the DQI for supply and return temperatures (delta T) was achieved Each temperature sensor was calibrated against a reference thermocouple with NIST-traceable accuracy The error in the two temperature sensors resulted in an overall delta T uncertainty of 08 oC This absolute error equates to a relative error of 22 percent at the average fluid temperatures measured during the fullshyload testing (about 361 oC) The overall error in heat recovery rate is then the combined error in flow rate and temperature differential This error compounds multiplicatively as follows
Overall Heat Meter Error = (Flow rate error)2 + (compositional error) 2 (Equation 7)
( ) 0240)0220(0100 22 =+=
The heat recovery rate determination therefore has a relative compounded error of plusmn 24 percent The absolute error in the average heat recovery rate at full load (111 x 103Btuhr) then is plusmn 27 x 103Btuhr
This error in heat-recovery rate and the heat input error (083 percent) compound similarly to determine the overall uncertainty in the thermal efficiency determination as follows
Error in Heat Recovery Efficiency = (0024)2 + (00083)2 = 0025 (Equation 8)
Average heat recovery rate (thermal) efficiency at full load then is 333 plusmn 083 percent or a relative compounded error of 25 percent This compounded relative error exceeds the data quality objective
3-9
slightly but the absolute error is within the goal for this verification parameter (measured values were lower than anticipated)
328 Total Efficiency
Total efficiency is the sum of the electrical power and heat-recovery efficiencies Total efficiency is defined as 204 plusmn 027 percent (plusmn 130-percent relative error) plus 333 plusmn 063 percent (plusmn 19-percent relative error) This is based on the determined errors in electrical and thermal efficiency at full load The absolute errors compound as follows
errcabs = err12 + err2
2 (Equation 9)
870830270 22 =+=
Relative error is
errcrel =errcabs (Equation 10)
Value1 +Value2
087 = = 0016
204 + 333 where
errcabs = compounded error absolute err1 = error in first added value absolute value err2 = error in second added value absolute value errcrel = compounded error relative value1 = first added value value2 = second added value
The total CHP efficiency at full load is then 537 plusmn 087 percent or 16 percent relative error Again this compounded relative error exceeds the data quality objective slightly
329 Exhaust Stack Emission Measurements
EPA reference method requirements form the basis for the qualitative DQIs specified in the Test plan and listed in Tables 3-1 and 3-2 Each method specifies sampling and calibration procedures and data quality checks These specifications when properly implemented ensure the collection of high quality and representative emissions data The specific sampling and calibration procedures vary by method and class of pollutants and are summarized in Table 3-5 The table lists the method quality requirements the acceptable criteria and the results for the test conducted here It is generally accepted that conformance to the reference method quality requirements demonstrates that the qualitative DQIs have been met
All of the emissions testing and reference method quality control procedures were conducted by Cubix Corporation either in the field during testing or in their calibration and analytical laboratories in Austin Texas All of the field sampling procedures and calibrations were closely monitored by GHG Center personnel In addition documentation of all sampling and analytical procedures data collection and
3-10
calibrations have been procured reviewed and filed by the GHG Center Table 3-5 is followed by a brief explanation of the QAQC procedures implemented for each class of pollutant quantified during this verification
Table 3-5 Summary of Emissions Testing Calibrations and QC Checks
Measurement Variable
Calibration or QC Check
When Performed and Frequency
Expected or Allowable Result
Result of Calibration(s) or Check(s)
NOX CO CO2 SO2 TRS and O2 concentrations
Analyzer calibration error test
Daily before testing plusmn 2 of analyzer span All within allowable level for each day
System bias checks Before each test run plusmn 5 of analyzer span All within allowable level for each test run Calibration drift test After each test run plusmn 3 of analyzer span
THC concentrations System calibration error test
Daily before testing plusmn 5 of analyzer span All within allowable level for each day
System calibration drift test
After each test run plusmn 3 of analyzer span All within allowable level for each test run
CH4 concentrations Triplicate injections Each test run plusmn 5 difference All within allowable level for each test run
Calibration of GC with gas standards by certified laboratory
Immediately prior to sample analyses andor at least once per day
plusmn 5 for each compound
All within allowable level for each day
TPM emissions Pre and post test sampling system leak checks
Before and after each test run
Sampling system leak rate lt 002 cfm
All checks lt 002 cfm
Minimum sample volume After each test run Corrected Vol gt 600 dscf
Volumes ranged from 694 to 796 dscf
Percent isokinetic sampling rate (I)
After each test run 90 lt I lt 110 91 lt I lt 102
Analytical balance calibration
Once before analysis plusmn 00001 g Within allowable level
Filter and reagent blanks Once during testing after first test run
lt 10 of particulate catch for first test run
Blank weights lt 10 of each sample catch
Dry gas meter calibration Once before and once after testing
plusmn 5 Pre and post test calibrations within 1
Thermocouple calibration Once after testing plusmn 15 of average stack temperature
Within 03 of reference TC
NH3 concentrations Calibration of instrument with NH3 standards
Immediately prior to sample analyses at least once a day
plusmn 5 Pre test calibrations within 1 of working standards
Dry gas meter calibration Once before and once after testing
plusmn 5 Pre and post test calibrations within 1
Exhaust gas volumetric flow rate
Pitot tube dimensional calibration inspection
Once before and once after testing
See 40CFR60 Method 2 Section 100
Calibration criteria met
Thermocouple calibration Once after testing plusmn 15 of average stack temperature
Within 03 of reference TC
3291 NOX CO CO2 SO2 TRS and O2 Concentrations
Test personnel performed sampling system calibration error tests prior to each test run All calibrations employed a suite of three EPA Protocol No 1 calibration gases (four for CO) that spanned the instrument ranges Appropriate calibration ranges were selected for each pollutant based on exhaust gas screening (ranges are summarized in Table 3-2) The daily analyzer calibration error goal for each instrument was plusmn 20 percent of span It was met for each analyzer during each day of testing
3-11
Sampling system bias was evaluated for each parameter at the beginning of each test run using the zero and mid-level calibration gases System response to the zero and mid-level calibration gases also provided a measure of drift and bias at the end of each test run The maximum allowable sampling system bias and drift values were plusmn 5 and plusmn 3 percent of span respectively These specifications were met for each parameter and for each test run Testers also performed a NOX converter efficiency test as described in Section 35 of the test plan The converter efficiency was 9998 percent which meets the 98shypercent goal specified in the method
3292 THC Concentrations
Following Method 25A criteria the analyzer calibration error test is not performed on the THC analyzer Instead a 4-point system bias test is conducted at the beginning of each test day System response must be within plusmn 5 percent of the calibration standard at each point System response to the zero and mid-level calibration gases also provided a measure of drift and bias at the end of each test run The maximum allowable sampling system bias and drift values were plusmn 5 and plusmn 3 percent of span respectively These specifications were met for test run
3293 CH4 Concentrations
The test plan specified EPA Method 18 for determining stack gas methane concentrations This testing was conducted on-site eliminating the need to collect bag samples for transport to a laboratory Test operators injected calibration gas standards into the gas chromatograph (GC) to establish a concentration standard curve prior to sample analysis The operator repeated the injections until the average of all desired compounds from three separate injections agreed to within 50 percent of the certified value The acceptance criterion was met for all runs
The analysts injected the mid-range standard to quantify instrument drift at the completion of each test The analyst would repeat the calibration process used for the average of the two calibration curves to determine concentrations if he observed a variance larger than 50 percent
3294 Total Particulate Matter and Exhaust Gas Volumetric Flow Rate
Reference Methods 1 through 5 used for determination of exhaust gas volumetric flow rate and total particulate emissions include numerous quality control and quality assurance procedures that are required to ensure collection of representative data The most important of these procedures are listed in Table 3-5 along with the results for these tests These methods do not specify overall uncertainties but it is generally accepted that conformance to the control and quality assurance procedures will result in an overall method uncertainty ranging from 5 to 30 percent depending on the mass of the particulate catch the quality of the sampling system and the length of the sampling probe [15] For these tests TPM catches were in the range of 10 to 20 mg the sampling system surfaces contacting the exhaust gases were constructed entirely of glass or Teflon and the probe was less than 3-feet in length In addition testers documented that all of the key method criteria were met It is therefore expected that the overall error for tests conducted here is plusmn 10 percent of reading This exceeds the original goal of plusmn 5 percent but this deviation from the plan is not believed to impact results significantly because TPM emissions were very low
3-12
3295 NH3 Concentrations
Ammonia samples were collected in the back-half of the total particulate sampling train and therefore all of the sampling system criteria are the same as for TPM measurements Sampling error for the NH3 samples should be the same as sampling error for the TPM samples In the laboratory analytical instrumentation was calibrated using nine working standards A calibration curve for the instrument was developed using this nine-point calibration The R2 for the calibration curve was 09997 indicating excellent analytical linearity Based on this the same uncertainty used for the TPM determination (plusmn10 percent) is assigned Again this level of uncertainty exceeds the original goal of plusmn 5 percent but as with the TPM emissions this deviation from the plan is not believed to impact results significantly because NH3 emissions were also very low
3-13
40 REFERENCES
[1] Southern Research Institute Environmental Technology Verification Report Swine Waste Electric and Heat Production ndash Martin Machinery Internal Combustion Engine SRIUSEPA-GHG-QAP-27 wwwsri-rtpcom Greenhouse Gas Technology Center Southern Research Institute Research Triangle Park NC September 2004
[2] Southern Research Institute Test and Quality Assurance Plan - Swine Waste Electric Power and Heat Production Systems Capstone MicroTurbine and Martin Machinery Internal Combustion Engine SRIUSEPA-GHG-QAP-22 wwwsri-rtpcom Greenhouse Gas Technology Center Southern Research Institute Research Triangle Park NC November 2002
[3] American Society of Mechanical Engineers Performance Test Code for Gas Turbines ASME PTC-22 New York NY 1997
[4] American National Standards Institute American Society of Heating Refrigeration and Airshy conditioning Engineers Method of Testing Thermal Energy Meters for Liquid Streams in HVAC
Systems ANSIASHRAE 125-1992 Atlanta GA 1995
[5] CRC Press Handbook of Chemistry and Physics ndash 60th Edition CRC Press Inc Boca Raton Florida 1980
[6] American Society for Testing and Materials Standard Test Method for Analysis of Natural Gas by Gas Chromatography ASTM D1945-98 West Conshohocken PA 2001
[7] American Society for Testing and Materials Standard Practice for Calculating Heat Value Compressibility factor and Relative Density of Gaseous Fuels ASTM D3588-98 West Conshohocken PA 2001
[8] American Society for Testing and Materials Standard Practice for Determination of Sulfur Compounds in Natural Gas by Gas Chromatography and Chemiluminescense ASTM D5504-01 West Conshohocken PA 2001
[9] American National Standards Institute ANSI Institute of Electrical and Electronics Engineers IEEE Master Test Guide for Electrical Measurements in Power Circuits ANSIIEEE Std 120shy1989 New York NY October 1989
[10] American National Standards Institute ANSI Institute of Electrical and Electronics Engineers IEEE Recommended Practices and Requirements for Harmonic Control in Electrical Power Systems IEEE Std 519-1992 New York NY April 1993
[11] American National Standards Institute ANSI Institute of Electrical and Electronics Engineers National Standards for Electric Power Systems and Equipment - Voltage Ratings (Hertz) ANSI C841-1995 American National Standards Institute National Electrical Manufacturers Association Rosslyn VA 1996
[12] US Environmental Protection Agency Code of Federal Regulations Title 40 Part 60 New Source Performance Standards Appendix A US EPA Washington DC 1999
[13] Southern Research Institute Environmental Technology Verification Report Combined Heat and Power at a Commercial Supermarket ndash Capstone 60 kW Microturbine CHP System SRIUSEPA-GHG-QAP-27 wwwsri-rtpcom Greenhouse Gas Technology Center Southern Research Institute Research Triangle Park NC September 2003
[14] Southern Research Institute Environmental Technology Verification Report Residential Electric Power Generation Using the Plug Power SU1 Fuel Cell System SRIUSEPA-GHG-QAP-25 wwwsri-rtpcom Greenhouse Gas Technology Center Southern Research Institute Research Triangle Park NC September 2003
[15] Shigehara RT Measurement Uncertainty of Selected EPA Test Methods Emission Monitoring Inc Presented at Stationary Source Sampling and Analysis for Air Pollutants XXV Conference March 2001

EPA REVIEW NOTICE
This report has been peer and administratively reviewed by the US Environmental Protection Agency and approved for publication Mention of trade names or commercial products does not constitute endorsement or recommendation for use
THE ENVIRONMENTAL TECHNOLOGY VERIFICATION PROGRAM
SOUTHERN RESEARCH US Environmental Protection Agency I N S T I T U T E
ETV Joint Verification Statement TECHNOLOGY TYPE Biogas-Fired Microturbine Combined With Heat
Recovery System
APPLICATION Distributed Electrical Power and Heat Generation
TECHNOLOGY NAME Capstone 30 kW Microturbine System
COMPANY Colorado Pork LLC
ADDRESS Lamar Colorado
The US Environmental Protection Agency (EPA) has created the Environmental Technology Verification (ETV) program to facilitate the deployment of innovative or improved environmental technologies through performance verification and dissemination of information The goal of the ETV program is to further environmental protection by accelerating the acceptance and use of improved and cost-effective technologies ETV seeks to achieve this goal by providing high-quality peer-reviewed data on technology performance to those involved in the purchase design distribution financing permitting and use of environmental technologies
ETV works in partnership with recognized standards and testing organizations stakeholder groups that consist of buyers vendor organizations and permitters and with the full participation of individual technology developers The program evaluates the performance of technologies by developing test plans that are responsive to the needs of stakeholders conducting field or laboratory tests collecting and analyzing data and preparing peer-reviewed reports All evaluations are conducted in accordance with rigorous quality assurance protocols to ensure that data of known and adequate quality are generated and that the results are defensible
The Greenhouse Gas Technology Center (GHG Center) one of six verification organizations under the ETV program is operated by Southern Research Institute in cooperation with EPArsquos National Risk Management Research Laboratory A technology of interest to GHG Center stakeholders is the use of microturbines and engines as distributed generation sources Distributed generation (DG) refers to power-generation equipment that provides electric power at a site much closer to customers than central station generation Recently biogas production from livestock manure management facilities has become a promising alternative for fueling DG technologies These technologies commonly referred to as anaerobic digesters decompose manure in a controlled environment and recover methane produced from the manure digestion The recovered methane can fuel power generators to produce electricity heat and hot water Digesters also reduce foul odor and can reduce the risk of ground- and surface-water pollution
S-1
The GHG Center collaborated with the Colorado Governorrsquos Office of Energy Management and Conservation (OEMC) to evaluate the performance of two combined heat and power systems (CHP systems) that operate on biogas recovered from swine waste generated at the Colorado Pork facility in Lamar Colorado This verification statement provides a summary of the test results for the Capstone 30 kW Microturbine CHP system
TECHNOLOGY DESCRIPTION
The following technology description is based on information provided by Capstone and OEMC and does not represent verified information The microturbine system tested at Colorado Pork consists of a Capstone Model 330 Microturbine and a heat-recovery system developed by Cain Industries The CHP system also includes a CompAir gas compressor which is needed to boost the gas pressure to about 100 psig A permanent magnet generator produces high-frequency alternating current which is rectified inverted and filtered by the line power unit into conditioned 480 volts alternating current (VAC) The unit supplies an electrical frequency of 60 hertz (Hz) and is equipped with a control system that allows for automatic and unattended operation An active filter in the generator is reported by the turbine manufacturer to provide power free of spikes and unwanted harmonics All operations including startup setting of programmable interlocks grid synchronization operational setting dispatch and shutdown can be performed manually or remotely using the internal power-controller system
The gas booster compressor is a CompAir Hydrovane Model 704PKGS with a nominal volume capacity of 48 standard cubic feet per minute (scfm) and the capability of compressing gas from inlet pressures ranging from 025 to 15 pounds per square inch gauge (psig) to outlet pressures of 60 to 100 psig The compressor is boosting gas pressure from approximately 1 to 100 psig in this application The compressor imposes a parasitic load of approximately 4 kW on the overall CHP system generating capacity
Waste heat from the microturbine exhaust is recovered using a Cain Industries heat recovery and control system It is a steel fin-and-tube Heat Recovery Silencer (HRS) radial heat exchanger and silencer (Model 112B28SSS) suitable for up to 700 degF exhaust gas Potable water is used as the heat-transfer media to recover energy from the microturbine exhaust gas The water is circulated at a rate of approximately 28 gallons per minute (gpm) A digital controller monitors the water outlet temperature When the temperature exceeds the user set point a damper automatically opens and allows the hot exhaust gas to bypass the heat exchanger and release the heat through the stack The damper allows hot gas to circulate through the heat exchanger when heat recovery is required (ie the water outlet temperature is less than user setpoint) This design allows the system to protect the heat recovery components from the full heat of the turbine exhaust while still maintaining full electrical generation from the microturbine
The Colorado Pork facility is a sow farrow-to-wean farm in Lamar Colorado that began operation in 1999 and houses up to 5000 sows The facility employs a complete mix anaerobic digester to reduce odor and meet water quality regulations mandated by the Colorado Department of Public Health and Environment The anaerobic digester promotes bacterial decomposition of volatile solids in animal wastes The resulting effluent stream consists of mostly water which is allowed to evaporate from a secondary lagoon Solids produced by the process accumulate in the digester and are manually removed Recovered heat from the microturbine CHP is circulated through the waste in the digester to maintain the digester temperature at approximately 100 degF Cool water returning from the digester remains relatively constant throughout the year A temperature sensor continuously monitors this temperature and in the event this temperature exceeds 105 degF an automated mixing valve reduces the flow of hot water entering the digester
S-2
VERIFICATION DESCRIPTION
Testing was conducted on February 14 and 15 2004 The verification included a series of controlled test periods in which the GHG Center intentionally controlled the unit to produce electricity at nominal power output levels of 30 24 20 and 15 kW Three replicate test runs were conducted at each setting A 7-day extended monitoring period was planned to verify power and heat production power quality performance and emissions offsets during normal site operations However this could not be completed due to system startup and shakedown delays that resulted in GHG Center scheduling conflicts Instead the CHP performance was monitored continuously for a period of approximately 35 hours to evaluate power and heat production and power quality In light of this the emission offsets analysis was not conducted and the completeness data quality objective of 7-days was not met During all test periods waste heat was recovered and routed through the digester at temperatures of approximately 100 degF The classes of verification parameters evaluated were
bull Heat and Power Production Performance bull Emissions Performance (NOx CO THC CH4 SO2 TRS TPM NH3 and CO2) bull Power Quality Performance
Evaluation of heat and power production performance included verification of power output heat recovery rate electrical efficiency thermal efficiency and total system efficiency Electrical efficiency was determined according to the ASME Performance Test Code for Gas Turbines (ASME PTC-22) Tests consisted of direct measurement of fuel flow rate fuel lower heating value (LHV) and power output Heat recovery rate and thermal efficiency were determined according to ANSIASHRAE test methods and consisted of direct measurement of heat-transfer fluid flow rate and differential temperatures Ambient temperature barometric pressure and relative humidity measurements were also collected to characterize the condition of the combustion air used by the microturbine All measurements were recorded as 1-minute averages during the controlled test periods and throughout the 7-day monitoring period
The evaluation of emissions performance occurred simultaneously with efficiency testing Pollutant concentration and emission rate measurements for nitrogen oxides (NOX) carbon monoxide (CO) total hydrocarbons (THC) methane (CH4) sulfur dioxide (SO2) total reduced sulfur (TRS) total particulate matter (TPM) ammonia (NH3) and carbon dioxide (CO2) were conducted in the turbine exhaust stack All test procedures used in the verification were US EPA reference methods recorded in the Code of Federal Regulations (CFR) Pollutant emissions are reported as concentrations in parts per million volume dry (ppmvd) corrected to 15-percent oxygen (O2) and as mass per unit time (lbhr) The mass emission rates are also normalized to microturbine power output and reported as pounds per kilowatt hour (lbkWh)
Electrical power quality parameters including electrical frequency and voltage output were measured during the controlled tests and the 35-hour monitoring period Current and voltage total harmonic distortions (THD) and power factors were also monitored to characterize the quality of electricity supplied to the end user The guidelines listed in ldquoThe Institute of Electrical and Electronics Engineersrsquo (IEEE) Recommended Practices and Requirements for Harmonic Control in Electrical Power Systemsrdquo were used to perform power quality testing
Quality Assurance (QA) oversight of the verification testing was provided following specifications in the ETV Quality Management Plan (QMP) The GHG Centerrsquos QA Manager conducted an audit of data quality on at least 10 percent of the data generated during this verification and a review of this report Data review and validation was conducted at three levels including the field team leader (for data
S-3
generated by subcontractors) the project manager and the QA manager Through these activities the QA manager has concluded that with the exception of the extended monitoring completeness goal described earlier the data meet the data quality objectives that are specified in the Test and Quality Assurance Plan
VERIFICATION OF PERFORMANCE
Heat and Power Production Performance
MICROTURBINE CHP HEAT AND POWER PRODUCTION
Test Condition (Power
Command)
Electrical Power Generation Heat Recovery Performance Total CHP System Efficiency
() Net Power Delivered
(kW)
Net Efficiency ()
Heat Recovery (103Btuhr)
Thermal Efficiency
() 30 kW 199 204 111 333 537 24 kW 193 203 116 358 562 20 kW 150 186 108 392 577 15 kW 101 157 969 441 598
bull The relatively high altitude of the facility (roughly 3700 feet) and the parasitic load introduced by the gas compressor limit the turbinersquos power output performance At the full power output command of 30 kW the average net power delivered to the facility was 199 kW Corresponding electrical efficiency at full load was 204 percent
bull Average electrical efficiencies at the reduced power commands of 24 20 and 15 kW decreased to 203 186 and 157 percent respectively
bull Total CHP efficiency during the controlled test periods ranged from a low of 537 percent at the 30 kW load to a high of 598 percent at 15 kW Normal heat recovery operations were maintained during the controlled test periods with the system configured to maintain the digester temperature at approximately 100oF
Emissions Performance
MICROTURBINE EMISSIONS (lbkWh) Power
Command NOX CO THC CH4 SO2 TRS TPM NH3 CO2
30 kW 821x10ndash5 0009 00027 00022 0037 00008 00006 607x10ndash7 345 24 kW 947x10ndash5 0010 00032 00027 0039 00002 Not tested Not tested 361 20 kW 195x10ndash3 0010 00035 00028 0040 00005 Not tested Not tested 379 15 kW 219x10ndash3 0017 00105 00087 0042 00002 Not tested Not tested 390
bull NOX emissions at 30 kW were 821 x 10ndash5 lbkWh and increased as power output decreased CO emissions averaged 0009 lbkWh at 30 kW and also increased slightly at the reduced loads
bull THC emissions at full load averaged 269 x 10ndash3lbkWh and increased as the power output was decreased CH4 emissions were similar averaging 223 x 10ndash3 at full load and representing approximately 80 percent of the THC emission rate
S-4
bull Emissions of SO2 and TRS averaged 0037 and 00008 lbkWh respectively at full load and were not significantly impacted by load changes Emissions of TPM and NH3 were very low during the full load tests
NOX emissions per unit electrical power output at 30 kW (000008 lbkWh) were well below the published weighted average US and Colorado regional fossil fuel emission factors of 00066 and 00077 lbkWh The generator system CO2 emission rate at full load is higher than the weighted average fossil fuel emission factors for both the US and Colorado regional grids (202 and 213 lbkWh respectively) This indicates a likely increase in annual CO2 emissions for power production from this system based solely on electrical generation Due to the reduction in the extended monitoring period a true estimation of annual emissions offsets could not be completed
Power Quality Performance
bull Average electrical frequency was 59999 Hz and average voltage output was 48725 volts bull The power factor remained relatively constant at full load averaging 9453 percent bull The average current total harmonic distortion was 321 percent and the average voltage THD was 189
both well below the threshold specified in IEEE 519 of plusmn 5 percent
S-5
Details on the verification test design measurement test procedures and Quality AssuranceQuality Control (QAQC) procedures can be found in the Test plan titled Test and Quality Assurance Plan for Swine Waste Electric Power and Heat Production Systems Capstone Microturbine and Martin Machinery Internal Combustion Engine (SRI 2002) Detailed results of the verification are presented in the Final Report titled Environmental Technology Verification Report for Swine Waste Electric Power and Heat Production ndash Capstone 30 kW Microturbine System (SRI 2004) Both can be downloaded from the GHG Centerrsquos web-site (wwwsri-rtpcom) or the ETV Program web-site (wwwepagovetv)
Signed by Lawrence W Reiter PhD 92704 Signed by Stephen D Piccot 91304
Lawrence W Reiter PhD Stephen D Piccot Acting Director Director National Risk Management Research Laboratory Greenhouse Gas Technology Center Office of Research and Development Southern Research Institute
Notice GHG Center verifications are based on an evaluation of technology performance under specific predetermined criteria and the appropriate quality assurance procedures The EPA and Southern Research Institute make no expressed or implied warranties as to the performance of the technology and do not certify that a technology will always operate at the levels verified The end user is solely responsible for complying with any and all applicable Federal State and Local requirements Mention of commercial product names does not imply endorsement or recommendation
EPA REVIEW NOTICE
This report has been peer and administratively reviewed by the US Environmental Protection Agency and approved for publication Mention of trade names or commercial products does not constitute endorsement or recommendation for use
S-6
SRIUSEPA-GHG-VR-22 September 2004
Greenhouse Gas Technology Center A US EPA Sponsored Environmental Technology Verification ( ) Organization
Environmental Technology Verification Report
Swine Waste Electric Power and Heat Production ndash Capstone 30 kW Microturbine System
Prepared By Greenhouse Gas Technology Center
Southern Research Institute PO Box 13825
Research Triangle Park NC 27709 USA Telephone 919806-3456
Under EPA Cooperative Agreement CR 829478
US Environmental Protection Agency Office of Research and Development
National Risk Management Research Laboratory Air Pollution Prevention and Control Division
Research Triangle Park NC 27711 USA
EPA Project Officer David A Kirchgessner Colorado Governorrsquos Office Project Officer Edward Lewis
TABLE OF CONTENTS Page
LIST OF FIGURES iii LIST OF TABLES iii ACKNOWLEDGMENTS iv ACRONYMS AND ABBREVIATIONSv
10 INTRODUCTION 1-111 BACKGROUND 1-112 COMBINED HEAT AND POWER TECHNOLOGY DESCRIPTION 1-213 TEST FACILITY DESCRIPTION 1-514 PERFORMANCE VERIFICATION OVERVIEW1-7
141 Heat and Power Production Performance 1-9142 Power Quality Performance 1-13143 Emissions Performance1-14144 Estimated Annual Emission Reductions 1-15
20 VERIFICATION RESULTS2-121 OVERVIEW 2-122 HEAT AND POWER PRODUCTION PERFORMANCE 2-2
221 Electrical Power Output Heat Recovery Rate and Efficiency During Controlled Tests 2-2
222 Electrical and Thermal Energy Production During the Continuous Monitoring Period 2-5
23 POWER QUALITY PERFORMANCE 2-8231 Electrical Frequency 2-8232 Voltage Output2-9233 Power Factor 2-10234 Current and Voltage Total Harmonic Distortion 2-11
24 EMISSIONS PERFORMANCE 2-12241 Microturbine CHP System Emissions2-12
30 DATA QUALITY ASSESSMENT3-131 DATA QUALITY OBJECTIVES 3-132 RECONCILIATION OF DQOs AND DQIs 3-2
321 Power Output 3-5322 Electrical Efficiency3-6323 PTC-22 Requirements for Electrical Efficiency Determination 3-7324 Ambient Measurements 3-8325 Fuel Flow Rate 3-8326 Fuel Lower Heating Value3-8327 Heat Recovery Rate and Efficiency 3-9328 Total Efficiency3-10329 Exhaust Stack Emission Measurements3-10
3291 NOX CO CO2 SO2 TRS and O2 Concentrations 3-113292 THC Concentrations3-123293 CH4 Concentrations 3-123294 Total Particulate Matter and Exhaust Gas Volumetric Flow Rate 3-123295 NH3 Concentrations3-13
40 REFERENCES 1
i
LIST OF FIGURES Page
Figure 1-1 The Colorado Pork Capstone 330 Microturbine CHP System 1-3 Figure 1-2 Colorado Pork Microturbine CHP System Process Diagram 1-4 Figure 1-3 Colorado Pork Anaerobic Digester 1-6 Figure 1-4 Colorado Pork Waste-to-Energy Process Diagram 1-7 Figure 1-5 Schematic of Measurement System 1-12 Figure 2-1 Electrical and Thermal Efficiency During Controlled Test Periods 2-5 Figure 2-2 Heat and Power Production During the Monitoring Period 2-6 Figure 2-3 Power Output and Ambient Temperature During the Verification Period 2-7 Figure 2-4 Ambient Temperature Effects on Power Production During Verification Period 2-7 Figure 2-5 Microturbine Frequency During Verification Period 2-8 Figure 2-6 Microturbine Voltage During Verification Period 2-9 Figure 2-7 Microturbine Power Factor During Verification Period 2-10 Figure 2-8 Microturbine Current and Voltage THD During Verification Period 2-11
LIST OF TABLES Page
Table 1-1 Capstone Microturbine Model 330 Specifications 1-5 Table 1-2 Controlled and Continuous Test Periods 1-9 Table 1-3 Summary of Emissions Testing Methods 1-14 Table 2-1 Heat and Power Production Performance 2-3 Table 2-2 Fuel Input and Heat Recovery Unit Operating Conditions 2-4 Table 2-3 Electrical Frequency During Monitoring Period 2-8 Table 2-4 Microturbine Voltage During Monitoring Period 2-9 Table 2-5 Power Factors During Monitoring Period 2-10 Table 2-6 Microturbine THD During Extended Period 2-11 Table 2-7 Microturbine CHP Emissions During Controlled Periods 2-13 Table 2-8 Emissions Offsets From On-Site Electricity Production 2-17 Table 2-9 Estimated Annual Emission Reductions using the CHP System 2-18 Table 3-1 Verification Parameter Data Quality Objectives 3-1 Table 3-2 Summary of Data Quality Goals and Results 3-3 Table 3-3 Results of Additional QAQC Checks 3-6 Table 3-4 Variability Observed in Operating Conditions 3-8 Table 3-5 Summary of Emissions Testing Calibrations and QC Checks 3-11
ii
ACKNOWLEDGMENTS
The Greenhouse Gas Technology Center wishes to thank the Colorado Governorrsquos Office of Energy Management and Conservation especially Edward Lewis for providing funding for this project and for reviewing and providing input on the testing strategy and this Verification Report Thanks are also extended to the Colorado Pork Farm (a subsidiary of Custom Swine Corporation) for hosting the verification Finally special thanks to Gerald Licano of Colorado Pork for his assistance with site operation and execution of the verification testing
iii
ACRONYMS AND ABBREVIATIONS
Abs Diff absolute difference AC alternating current acf actual cubic feet ADQ Audit of Data Quality amp amperes ANSI American National Standards Institute APPCD Air Pollution Prevention and Control Division ASHRAE American Society of Heating Refrigerating and Air-Conditioning Engineers Inc ASME American Society of Mechanical Engineers Btu British thermal units Btuhr British thermal units per hour Btulb British thermal units per pound Btumin British thermal units per minute Btuscf British thermal units per standard cubic foot CAR Corrective Action Report C1 quantification of methane CH4 methane CHP combined heat and power CO carbon monoxide CO2 carbon dioxide CT current transformer DAS data acquisition system DG distributed generation DOE US Department of Energy DP differential pressure DQI data quality indicator DQO dscf106Btu
data quality objective dry standard cubic feet per million British thermal units
EA Engineering Assistant EIA Energy Information Administration EPA Environmental Protection Agency ETV Environmental Technology Verification degC degrees Celsius degF degrees Fahrenheit FID flame ionization detector fps ft3
feet per second cubic feet
gal US gallons GC gas chromatograph GHG Center Greenhouse Gas Technology Center gpm gallons per minute GU generating unit HHV higher heating value hr hour Hz hertz IC internal combustion
(continued)
iv
ACRONYMSABBREVIATIONS (continued)
IEEE Institute of Electrical and Electronics Engineers ISO International Standards Organization kVA kilovolt-amperes kVAr kilovolt reactive kW kilowatts kWh kilowatt hours kWhe kilowatt hours electrical kWhth kilowatt hours thermal kWhyr kilowatt hours per year lb pounds lbBtu pounds per British thermal unit lbdscf lbft3
pounds per dry standard cubic foot pounds per cubic feet
lbhr pounds per hour lbkWh pounds per kilowatt-hour lbyr pounds per year LHV 103Btuhr 106Btuhr 106cf
lower heating value thousand British thermal units per hour million British thermal units per hour
million cubic feet mol mole N2 nitrogen NDIR nondispersive infrared NIST National Institute of Standards and Technology NO nitrogen oxide NO2 nitrogen dioxide NOX nitrogen oxides NSPS New Source Performance Standards O2 oxygen O3 ozone ORD Office of Research and Development PEA Performance Evaluation Audit ppmv parts per million volume ppmvw Parts per million volume wet ppmvd parts per million volume dry psia pounds per square inch absolute psig pounds per square inch gauge PT potential transformer QAQC Quality AssuranceQuality Control
(continued)
v
ACRONYMSABBREVIATIONS (continued)
QMP Quality Management Plan Rel Diff relative difference Report Environmental Technology Verification Report RH relative humidity rms root mean square rpm revolutions per minute RTD resistance temperature detector scf standard cubic feet scfh standard cubic feet per hour scfm standard cubic feet per minute Southern Southern Research Institute TampD transmission and distribution Test plan Test and Quality Assurance Plan THCs total hydrocarbons THD total harmonic distortion TSA technical systems audit US United States VAC volts alternating current
vi
10 INTRODUCTION
11 BACKGROUND
The US Environmental Protection Agencyrsquos Office of Research and Development (EPA-ORD) operates the Environmental Technology Verification (ETV) program to facilitate the deployment of innovative technologies through performance verification and information dissemination The goal of ETV is to further environmental protection by accelerating the acceptance and use of improved and innovative environmental technologies Congress funds ETV in response to the belief that there are many viable environmental technologies that are not being used for the lack of credible third-party performance data With performance data developed under this program technology buyers financiers and permitters in the United States and abroad will be better equipped to make informed decisions regarding environmental technology purchase and use
The Greenhouse Gas Technology Center (GHG Center) is one of six verification organizations operating under the ETV program The GHG Center is managed by EPArsquos partner verification organization Southern Research Institute (Southern) which conducts verification testing of promising greenhouse gas mitigation and monitoring technologies The GHG Centerrsquos verification process consists of developing verification protocols conducting field tests collecting and interpreting field and other data obtaining independent peer-reviewed input and reporting findings Performance evaluations are conducted according to externally reviewed verification Test and Quality Assurance Plans (test plan) and established protocols for quality assurance
The GHG Center is guided by volunteer groups of stakeholders These stakeholders guide the GHG Center on which technologies are most appropriate for testing help disseminate results and review Test plans and Technology Verification Reports (report) The GHG Centerrsquos Executive Stakeholder Group consists of national and international experts in the areas of climate science and environmental policy technology and regulation It also includes industry trade organizations environmental technology finance groups governmental organizations and other interested groups The GHG Centerrsquos activities are also guided by industry specific stakeholders who provide guidance on the verification testing strategy related to their area of expertise and peer-review key documents prepared by the GHG Center
A technology of interest to GHG Center stakeholders is the use of microturbines as a distributed generation source Distributed generation (DG) refers to power-generation equipment typically ranging from 5 to 1000 kilowatts (kW) that provide electric power at a site much closer to customers than central station generation A distributed power unit can be connected directly to the customer or to a utilityrsquos transmission and distribution system Examples of technologies available for DG include gas turbine generators internal combustion engine generators (eg gas diesel) photovoltaics wind turbines fuel cells and microturbines DG technologies provide customers one or more of the following main services stand-by generation (ie emergency backup power) peak shaving capability (generation during highshydemand periods) baseload generation (constant generation) or cogeneration combined heat and power (CHP) generation
Recently biogas production from livestock manure management facilities has become a promising alternative for fueling DG technologies EPA estimates US methane emissions from livestock manure management at 170 million tons carbon equivalent which accounts for 10 percent of total 1997 methane emissions The majority of methane emissions come from large swine and dairy farms that manage manure as slurry EPA expects US methane emissions from livestock manure to grow by over 25
1-1
percent from 2000 to 2020 Cost effective technologies are available that can stem this emission growth by recovering methane and using it as an energy source These technologies commonly referred to as anaerobic digesters decompose manure in a controlled environment and recover methane produced from the manure The recovered methane can fuel power generators to produce electricity heat and hot water Digesters also reduce foul odor and can reduce the risk of ground- and surface-water pollution
The GHG Center and the Colorado Governorrsquos Office of Energy Management and Conservation (OEMC) agreed to collaborate and share the cost of verifying two DG technologies that operate on biogas recovered from swine waste These verifications evaluated the performance of a microturbine combined heat and power (CHP) system offered by Capstone Turbine Corporation and an internal combustion (IC) engine CHP system offered by Martin Machinery Inc Both units are currently in operation at an anaerobic digestion facility managed by Colorado Pork LLC near Lamar Colorado This is the only swine farm in Colorado that is producing electrical power from animal waste The electricity is used by Colorado Pork to offset electricity purchases from the local electric cooperative Some of the recovered heat is used to control digester temperature which optimizes and enhances biogas production Both CHP systems are interconnected to the electric utility grid but excess power is not presently exported
The GHG Center evaluated the performance of the two CHP systems by conducting field tests over a fourteen-day verification period (February 2 ndash 15 2004) These tests were planned and executed by the GHG Center to independently verify the electricity generation and use rate thermal energy recovery rate electrical power quality energy efficiency emissions and greenhouse gas emission reductions for the Colorado Pork farm This verification statement and report provides the results of the Capstone 30 microturbine CHP performance evaluation Results of the testing conducted on the IC engine CHP system are reported in a separate report titled Environmental Technology Verification Report ndash Swine Waste Electric Power and Heat Production ndash Martin Machinery Internal Combustion Engine [1]
Details on the verification test design measurement test procedures and Quality AssuranceQuality Control (QAQC) procedures can be found in the test plan titled Test and Quality Assurance Plan ndash Swine Waste Electric Power and Heat Production Systems Capstone Microturbine and Martin Machinery Internal Combustion Engine [2] It can be downloaded from the GHG Centerrsquos web-site (wwwsrishyrtpcom) or the ETV Program web-site (wwwepagovetv) The Test plan describes the rationale for the experimental design the testing and instrument calibration procedures planned for use and specific QAQC goals and procedures The Test plan was reviewed and revised based on comments received from OEMC and the EPA Quality Assurance Team The Test plan meets the requirements of the GHG Centers Quality Management Plan (QMP) and satisfies the ETV QMP requirements Deviations from the Test plan were required in some cases These deviations and the alternative procedures selected for use were initially documented in Corrective Action Reports (CARs) and are discussed in this report
The remainder of Section 10 describes the microturbine CHP system technology and test facility and outlines the performance verification procedures that were followed Section 20 presents test results and Section 30 assesses the quality of the data obtained
12 COMBINED HEAT AND POWER TECHNOLOGY DESCRIPTION
The microturbine system verified at Colorado Pork consists of a Capstone Model 330 Microturbine and a Cain Industries heat-recovery system These primary system components are shown in separate photos in Figure 1-1 The CHP system also includes a CompAir gas compressor which is needed to boost the delivered gas pressure to about 100 psig Figure 1-2 illustrates a simplified process flow diagram of the microturbine CHP system at this site and a discussion of each component is provided below
1-2
Capstone 30 kW Microturbine Cain Industries Heat Recovery SystemCapstone 30 kW Microturbine Cain Industries Heat Recovery System
Figure 1-1 The Colorado Pork Capstone 330 Microturbine CHP System
Electric power is generated from a high-speed single-shaft recuperated air-cooled turbine generator with a nominal rated power output of 30 kW net (59 degF sea level) Table 1-1 provides Capstone 330 microturbine specifications The Capstone 330 is designed to operate on biogas and consists of an air compressor recuperator combustor turbine and a permanent magnet generator The recuperator is a heat exchanger that recovers some of the heat from the exhaust stream and transfers it to the incoming compressed air stream The preheated air is then mixed with the fuel and this compressed fuel and air mixture is burned in the combustor under constant pressure conditions The resulting hot gas is allowed to expand through the turbine section to perform work rotating the turbine blades to turn a generator which produces electricity The need for a gearbox and associated moving parts is eliminated because of the inverter-based electronics that enable the generator to operate at high speeds and frequencies The rotating components are mounted on a single shaft ndash supported by patented air bearings ndash that rotates at over 96000 revolutions per minute (rpm) at full load The exhaust gas exits the turbine and enters the recuperator which pre-heats the air entering the combustor to improve the efficiency of the system The exhaust gas then exits the recuperator and is directed to a heat-recovery unit
1-3
FuelGas Compressor
Capstone 330Microturbine Heat
Exchanger
480 220Volt Transformer
PrimaryDesiccant
Dryer
WaterKnock-
Out CanisterElectricChiller
Microturbine Exhaust
Hot Water Supply
Water Return
To Digester Heating Loop
To Engine Raw Biogas Input
(nominal 17 in wc) Utility Grid
Fuel Gas Compressor
Capstone 330 Microturbine Heat
Exchanger
480 220 Volt Transformer
Microturbine Exhaust
Hot WaterSupply
Water Return
To DigesterHeating Loop
To EngineRaw Biogas Input
(nominal 17 in wc)
Primary Desiccant
Dryer
Utility Grid
Water Knock-
Out Canister Electric Chiller
CHP SystemCHP SystemExhaustExhaust
Heat ExchangerHeat Exchanger
Figure 1-2 Colorado Pork Microturbine CHP System Process Diagram
The permanent magnet generator produces high-frequency alternating current which is rectified inverted and filtered by the line power unit into conditioned 480 volts alternating current (VAC) The unit supplies an electrical frequency of 60 hertz (Hz) and is supplied with a control system which allows for automatic and unattended operation An active filter in the generator is reported by the turbine manufacturer to provide power free of spikes and unwanted harmonics All operations including startup setting of programmable interlocks grid synchronization operational setting dispatch and shutdown can be performed manually or remotely using the internal power-controller system
The gas booster compressor is a CompAir Hydrovane Model 704PKGS with a nominal volume capacity of 48 standard cubic feet per minute (scfm) and the capability of compressing natural gas from inlet pressures ranging from 025 to 15 pounds per square inch gauge (psig) to outlet pressures of 60 to 100 psig The compressor is boosting gas pressure from approximately 1 to 100 psig in this application The compressor imposes a parasitic load of approximately 4 kW on the overall CHP system generating capacity
Figure 1-2 shows that waste heat from the microturbine exhaust at approximately 580 degF is recovered using a heat recovery and control system developed by Cain Industries It is a steel fin-and-tube Heat Recovery Silencer (HRS) radial heat exchanger and silencer (Model 112B28SSS) suitable for up to 700 degF exhaust gas Potable water is used as the heat-transfer media to recover energy from the microturbine exhaust gas stream The water is circulated at a rate of approximately 28 gallons per minute (gpm) A digital controller monitors the water outlet temperature and when the temperature exceeds user set point a damper automatically opens and allows the hot exhaust gas to bypass the heat exchanger and release the heat through the stack The damper allows hot gas to circulate through the heat exchanger when heat recovery is required (ie the water outlet temperature is less than user setpoint) This design allows the system to protect the heat recovery components from the full heat of the turbine exhaust while still maintaining full electrical generation from the microturbine
1-4
Table 1-1 Capstone Microturbine Model 330 Specifications (Source Capstone Microturbine Corporation Colorado Pork)
Dimensions Width Depth Height
281 in 529 in 748 in
Weight Microturbine only 1052 lb
Electrical inputs Power (startup) communications
Utility grid or black start battery Ethernet IP or modem
Electrical outputs Power at ISO conditions (59 oF sea level) 30 kW 400-480 VAC 5060 Hz 3-phase
Noiselevel Typical reported by Capstone 58 dBA at 33 ft Fuel pressure required
wo compressor w compressor
50 to 100 psig 5 to 15 psig
Fuel heat content Higher heating value 350 to 1200 Btuscf
Electrical performance at full load (landfill or digester gas)
Heat input Power output Efficiency - wo compressor Efficiency - w compressor Heat rate
378000 Btuhr LHV basis 30 kW plusmn1 kW 27 plusmn 2 ISO conditions LHV basis 26 plusmn 2 ISO conditions LHV basis 12600 BtukWh LHV basis
Heat recovery potential at full load
Exhaust gas temperature Exhaust energy available for heat recovery
500 oF 290000 Btuhr
Emissions (full load)
Nitrogen oxides (NOX) Carbon monoxide (CO) Total hydrocarbon (THCs)
lt 9 ppmv at 15 O2 lt 40 ppmv at 15 O2 lt 9 ppmv at 15 O2
13 TEST FACILITY DESCRIPTION
The Colorado Pork facility is a sow farrow-to-wean farm in Lamar Colorado that began operation in 1999 and houses up to 5000 sows The facility employs a complete mix anaerobic digester (Figure 1-3) to reduce odor and meet water quality regulations mandated by the Colorado Department of Public Health and Environment The anaerobic digester promotes bacterial decomposition of volatile solids in animal wastes The resulting effluent stream mostly consists of water which is allowed to evaporate from a secondary lagoon
Waste from the 5000 sows is collected in shallow pits below the slatted floors of the hog barns These pits are connected via sewer lines to an in-ground concrete holding tank (50000 gallon capacity) Each morning the pits are drained on a rotating basis to flush about 15000 gallons of waste to the holding tank The holding tank is equipped with a 17 horsepower (Hp) chopper pump that breaks up large pieces of waste Each morning about 15000 gallons of waste is pumped from the holding tank into the digester (requires approximately 20 minutes)
1-5
Figure 1-3 Colorado Pork Anaerobic Digester
The digester is a 70 x 80 x 14 foot deep in-ground concrete tank with a capacity of 500000 gallons The digester is equipped with two propeller type mixers on each end The mixers normally operate for 30 minutes daily to rejuvenate gas production that would otherwise decline between waste charging events Hot water is circulated through the digester using a matrix of 3-inch black steel pipe (total length of about 05 mile) to maintain the digester temperature at 100 degF Small adjustments to the water flow rate are required periodically and are conducted manually by the site operator The retention time in the digester is about 40 days
The effluent exits the digester over a weir and is directed gravimetrically to a lagoon for sludge settling and water evaporation The lagoon is designed to hold up to 20 years of sludge production Tests performed by environmental regulatory personnel have determined the site meets current odor and discharge requirements
The biogas produced from the decomposed waste is collected under a high-density polyethylene (HDPE) cover at a pressure of 15 to 20 inches water column A manifold collects the biogas and routes it to the engineturbine building A pressure relief valve senses pressure buildup when neither the engine nor turbine are operating and diverts the biogas to a flare The digester is currently producing about 20000 cubic feet of biogas per day The primary gas constituents of the raw biogas are CH4 (around 67) and CO2 (approximately 32) Analysis of samples collected at the site show hydrogen sulfide (H2S) concentrations in the gas ranging from 700 to 6800 parts per million (ppm) and averaging about 6000 ppm The gas also contains trace amounts of ammonia (NH3) mercaptans and other noxious gases and is saturated with water vapor The lower heating value (LHV) of the biogas is approximately 625 Btuscf
Figure 1-4 is a schematic of the waste-to-energy production process at Colorado Pork showing integration of the digester microturbine CHP and engine CHP In May 2000 the IC engine CHP system was installed first to offset electricity purchase costs The microturbine CHP system was installed in February 2002 to evaluate the feasibility and economics of the two different power generation technologies Both systems are currently housed in a building adjacent to the digester
1-6
AnaerobicDigester
Microturbine
Heat RecoveryUnit
IC Engine
Heat RecoveryUnit
With the microturbine CHP system the biogas is treated and compressed to produce high-pressure dry biogas for electricity production The site operator sets the heat recovery unit at 110 degF during normal operations Any unused heat is discarded automatically through the exhaust stack With the IC engine CHP system biogas is not pre-treated The IC enginersquos heat recovery system produces hot water at approximately 105 degF In the event this temperature exceeds 185 degF (ie during extremely hot summer days) an automatic valve is activated which discards some of the excess heat through a radiator The radiatorrsquos return water line is used to cool the engine water jacket and prevent overheating the engine
Raw Biogas (nominal 17 in wc
5 H2O)
Desiccant Dryer
Excess Heat
Radiator
Emissions to Atmosphere
Hot Exhaust
Emissions to Atmosphere
Hot Exhaust
Compressor
Knockout And chiller
Treated Biogas (nominal 55 psig dry)
Waste from holding tank 15000 gallons
per day
Effluent to lagoon If water temperature at this
point is gt185oF then valve is opened to reject heat and cool
engine water jacket
If water temperature at this point is gt105oF then valve is
opened to divert hot water from entering digester loop
Cool Water
Hot Water
Biogas
Raw Biogas(nominal 17 in wc
5 H2O)
DesiccantDryer
ExcessHeat
Radiator
Emissions toAtmosphere
Ho
Anaerobic Digester
Microturbine
Heat Recovery Unit
IC Engine
Heat Recovery Unit
t Exhaust
Emissions toAtmosphere
Hot Exhaust
Compressor
KnockoutAnd chiller
Treated Biogas(nominal 55 psig dry)
Waste from holdingtank 15000 gallons
per day
Effluent to lagoonIf water temperature at this
point is gt185oF then valve isopened to reject heat and cool
engine water jacket
If water temperature at thispoint is gt105oF then valve is
opened to divert hot waterfrom entering digester loop
Cool Water
Hot Water
Biogas
Cool WaterCool Water
Hot WaterHot Water
Biogas
Figure 1-4 Colorado Pork Waste-to-Energy Process Diagram
The IC engine hot water line combines with the microturbine hot water line and the mixture is circulated through the waste in the digester to maintain the digester temperature at 100 degF Cool water returning from the digester remains relatively constant throughout the year (approximately 100 degF) A temperature sensor continuously monitors this temperature and in the event this temperature exceeds 105 degF an automated mixing valve reduces the flow of hot water entering the digester This adjustment is performed only a few times per year as digester temperatures remain relatively stable
Typically the engine is run at 45 kW and switched to run on natural gas overnight to avoid reducing biogas pressure and collapsing the digester cover When the microturbine is used it can be run on biogas continuously The system is fully grid parallel When power demand of the farm operations exceed the available capacity of the power generation systems power is drawn from the utility grid Colorado Pork purchases electricity from the Southeast Colorado Power Association a rural electric cooperative
14 PERFORMANCE VERIFICATION OVERVIEW
This verification test was designed to evaluate the performance of the microturbine CHP systemmdashnot the overall system integration or specific management strategy The test plan specified a series of controlled test periods in which the GHG Center intentionally modulated the unit to produce electricity at nominal
1-7
power output commands of 15 20 24 and 30 kW Three replicate test runs were conducted at each of these power commands These tests are identified herein as controlled test periods During these controlled test periods the engine was shut down to make maximize biogas availability
Originally the test plan specified that these tests would be conducted with the heat recovery potential maximized by increasing the hot water supply temperature from the heat recovery unit to approximately 125 oF However changes in CHP system operations at the farm have occurred since development of the test plan Specifically hot water supply temperatures are controlled at about 105 oF to maintain the optimum digester temperature of approximately 100 oF It was not possible during the verification testing to reach the supply temperatures originally proposed without adversely affecting digester operations All of the heat generated by the heat recovery unit was being used to warm the digester These test conditions represent normal site operations with the amount of biogas currently available and the maximum achievable heat recovery rate for this application (that is heat is only recovered and used to maintain the optimum digester temperature)
The test plan also specified that the controlled test periods would be followed by a 1-week period of extended monitoring to evaluate power and heat production and power quality over a range of ambient conditions and farm operations However numerous delays and false starts to this test program caused by problems with microturbine operations (primarily gas compressor functionality) produced serious scheduling conflicts for the GHG Centerrsquos operations In response to this the center was forced to deviate from the test plan on this monitoring After consultation with the GHG QA manager and the GHG Center director it was decided to conduct an abbreviated evaluation of power and heat production and power quality using data collected continuously over a limited time period of 35 hours This 35-hour period includes the controlled test periods
The specific verification parameters associated with the test are listed below Brief discussions of each verification parameter and its method of determination are presented in Sections 141 through 145 Detailed descriptions of testing and analysis methods are not provided here but can be found in the test plan
Heat and Power Production Performance bull Electrical power output and heat recovery rate at selected loads bull Electrical thermal and total system efficiency at selected loads
Power Quality Performance bull Electrical frequency bull Voltage output bull Power factor bull Voltage and current total harmonic distortion
Emissions Performance bull Nitrogen oxides (NOX) carbon monoxide (CO) total hydrocarbons (THC)
ammonia (NH3) total reduced sulfur (TRS) total particulate matter (TPM) carbon dioxide (CO2) and methane (CH4) concentrations at selected loads
bull NOX CO THC NH3 TRS TPM CO2 and CH4 emission rates at selected loads
Each of the verification parameters listed were evaluated during the controlled or continuous monitoring periods as summarized in Table 1-2 This table also specifies the dates and time periods during which the testing was conducted
1-8
Table 1-2 Controlled and Continuous Test Periods
Controlled Test Periods Start Date
Time End Date
Time Test Condition Verification Parameters Evaluated
021404 0926 021404 1645 Power command of 30 kW three 30-minute test runs (120 minutes for TPM and NH3)
NOX CO SO2 THC TRS TPM NH3 CH4 CO2 emissions and electrical thermal and total efficiency
021404 1653 021404 1823 Power command of 24 kW three 30-minute test runs NOX CO SO2 THC TRS CH4 CO2 emissions and electrical thermal and total efficiency
021504 1000 021504 1130 Power command of 20 kW three 30-minute test runs
021504 1200 021504 1330 Power command of 15 kW three 30-minute test runs
Continuous Test Period Start Date Time End Date Time Verification Parameters Evaluated
021404 1130 021504 2226 Power and heat generation rate and power quality
Simultaneous monitoring for power output heat recovery rate heat input ambient meteorological conditions and exhaust emissions were performed during each of the controlled test periods Manual samples of biogas were collected to determine fuel lower heating value and other gas properties Replicate and average electrical power output heat recovery rate energy conversion efficiency (electrical thermal and total) and exhaust stack emission rates are reported for each test period
Results from the continuous monitoring period are used to report the average power and heat production rate during normal facility operations and power quality performance
141 Heat and Power Production Performance
Electrical efficiency determination was based upon guidelines listed in ASME Performance Test Code for Gas Turbines (PTC-22) [3] and was calculated using the average measured net power output fuel flow rate and fuel lower heating value (LHV) during each controlled test period PTC-22 specifies that test runs be over time intervals of not less than 4 minutes and not greater than 30 minutes to compute electrical efficiency
These restrictions minimize electrical efficiency determination uncertainties due to changes in operating conditions (eg turbine or engine speed ambient conditions) Within this time period PTC-22 specifies the maximum permissible limits in power output fuel input atmospheric conditions and other parameters to be less than the values shown in Table 3-4 The CHP system has one primary internal parasitic load at this facility ndash the gas-pressure booster compressor which is rated to draw about 4 kW The water fluid circulation pump also introduces a small internal parasitic load (approximately 500 watts) The chiller used to help in biogas moisture removal also draws about 500 watts but this parasitic load is external to the CHP system This verification did not include separate measurement of these parasitic loads and therefore reports the net system power output and efficiency (based on the usable power delivered by the system) Comparison of the net power output measured by the GHG Center and
1-9
the microturbinersquos indicated power output (gross power generated is displayed on the control panel) however confirms that the parasitic load was approximately 45 kW during all test periods
The electrical power output (in kW) was measured continuously throughout the verification period with a 7500 ION Power Meter (Power Measurements Ltd) and logged on the Centers data acquisition system (DAS) as 1-minute averages Biogas fuel input was determined by recording manual meter readings during each of the controlled test periods The biogas used to fuel the microturbine is metered on a wet basis but fired on a dry basis after moisture removal and compression Measured biogas flow to the microturbine was corrected for moisture content as well as temperature and pressure to determine fuel consumption as dry standard cubic feet per hour (scfh)
Fuel gas sampling and energy content analysis (via gas chromatograph) was conducted according to ASTM procedures to determine the lower heating value of the biogas Ambient temperature relative humidity and barometric pressure were measured near the turbine air inlet to support the determination of electrical conversion efficiency as specified in PTC-22 Electricity conversion efficiency was computed by dividing the average electrical energy output by the average energy input using Equation 1
η =341214 kW (Equation 1)
HI
where
η = efficiency () kW = average net electrical power output measured over the test interval (kW)
(Capstone 330 power output minus power consumed by gas compressor and water circulation pump)
HI = average heat input using LHV over the test interval (Btuhr) determined by multiplying the average mass flow rate of biogas to the system converted to standard cubic feet per hour (scfh) times the gas LHV (Btu per standard cubic foot Btuscf)
341214 = converts kW to Btuhr
Simultaneous with electrical power measurements heat recovery rate was measured using a heat meter (Controlotron Model 1010EP) The meter enabled 1-minute averages of differential heat exchanger temperatures and water flow rates to be monitored Published fluid density and specific heat values for water were used so that heat recovery rates could be calculated at actual conditions per ANSIASHRAE Standard 125 [4]
Heat Recovery Rate (Btumin) = Vρ Cp (T1-T2) (Equation 2)
where
V = total volume of liquid passing through the heat meter flow sensor during a minute (ft3) ρ = density of water solution (lbft3) evaluated at the avg temp (T2 plus T1)2 Cp = specific heat of water solution (Btulb oF) evaluated at the avg temp (T2 plus T1)2 T1 = temperature of heated liquid exiting heat exchanger (oF) (see Figure 1-4) T2 = temperature of cooled liquid entering heat exchanger (oF) (see Figure 1-4)
The average heat recovery rates measured during the controlled tests and the continuous monitoring period represent the heat recovery performance of the CHP system Thermal energy conversion efficiency was computed as the average heat recovered divided by the average energy input
1-10
ηT = 60 Qavg HI (Equation 3)
where
ηT = thermal efficiency () Qavg = average heat recovered (Btumin) HI = average heat input using LHV (Btuhr) determined by multiplying the average mass
flow rate of biogas to the system (converted to scfh) times the gas LHV (Btuscf)
Figure 1-5 illustrates the location of measurement variables contained in Equations 1 through 3 Power output was measured using a 7500 ION Power Meter (Power Measurements Ltd) at a rate of approximately one reading every 8 to 12 milliseconds and logged on the centers data acquisition system (DAS) as 1-minute averages The power meter was located in the main switchbox connecting the electrical output of the CHP system to the host site This location represented net power delivered to the farm after internal parasitic loads The logged one-minute average power output (kW) readings were averaged over the duration of each controlled test period for use in computing electrical efficiency The kW readings were integrated over the duration of the 35-hour verification period to calculate total electrical energy generated in units of kilowatt hours (kWh)
Biogas fuel input was measured with an in-line Dresser-Roots Series B Model 3M175 rotary displacement meter Meter readings were recorded manually at 10-minute intervals during the controlled test periods Gas temperature and pressure sensors were installed to enable flow rate compensation to provide mass flow output at standard conditions (60 oF 14696 psia)
The biogas flow rates metered on a wet basis were corrected to dry basis to represent the volume of gas actually consumed by the microturbine Biogas moisture content was determined for each controlled test run using the average measured biogas temperature and pressure and the published partial pressure of saturated gas [5] It was then assumed that the biogas as fired was dry (after the 3-stage moisture removal system and compression to 100 psig) Dry biogas flow rate was then calculated as
Vd = Vw (1- Bw) (Equation 4)
where
Vd = biogas volume wet basis (dscf) Vw = biogas volume dry basis (wscf) Bw = biogas moisture content ()
The TQAP specified a stain tube method of moisture determination that has an estimated 25 percent uncertainty However the GHG Center has learned on similar verifications conducted since the TQAP was written that the approach used here is more reliable and has less uncertainty than the stain tube procedure
1-11
Gas Dryers and Compressor
Capstone 330Microturbine Heat
Exchanger
480 208Volt Transformer
DC
A
B
EI
J
G
H
F
D
C
A
B I
J
HE
F
G
480 208Volt Transformer
DC
A
B
EI
J
G
H
F
D
C
A
B
D
C
A
B
D
C
A
B I
J
HE
F
G
EE
CHP SystemCHP SystemAir IntakeAir Intake ExhausEx thaust
Raw Biogas Utility GridRaw Biogas Utility GridInputInput
Measurement LocationsMeasurement Locations
D
C
A
B
Power ProductionPower ProductioPoPo nwer Productionwer ProductionE
F
G
I
J
H Water SupplyWWater Supplyater SupplyFuel Gas PressureFuel Gas PressureFFFuel Gas Pressureuel Gas Pressureuel Gas Pressure (T1)(T(T1)1)And Power Quality (kW)A ower Quality (kAAnd P W)nd Power Qualitynd Power Quality (kW) TemperatureTeTemperaturemperature
MeasurementsMeasurementsFuel Gas FlowFuel Gas FlowFuFuFuel Gas Flowel Gas Flowel Gas Flow Water ReturnWater ReturWatWat ner Returner ReturnAmbient TemperatureAAmbient Temperaturembient Temperature (T2)(T2(T(T )2)2)for heat inputfor heat input TemperatureTemperatTeTe uremperaturemperaturePressure and HumidityPPressure and Humidityressure and HumidityGas Samples for LHVGas Samples for LHVGasGasGas Samples for LHVSamples for LHVSamples for LHV (HI(H )I)
Emissions TestingEEmissions Testingmissions TestingWater Circulation (V)WWater Circulation (V)ater Circulation (V)Fuel Gas TemperatureFuel Gas TemperatureFFFuel Gas Temperatureuel Gas Temperatureuel Gas Temperature RateRaRatete
Microturbine Exhaust
Hot Water Supply
Water Return
Digester Heating Loop
Engine Heat Exchanger
System Boundary
Gas Dryers and Compressor
Capstone 330 Microturbine Heat
Exchanger
480 208 Volt Transformer
Microturbine Exhaust
Hot WaterSupply
Water Return
DigesterHeating Loop
EngineHeat Exchanger
DigesterHeating Loop
EngineHeat Exchanger
D C
A
B
JF
System Boundary
E I
G
H
Figure 1-5 Schematic of Measurement System
A total of six biogas samples were collected and analyzed during the controlled test periods to determine gas composition and heating value Samples were collected at a point in the biogas delivery line downstream of the meter but upstream of the gas drying system and compressor due to sampling restrictions (high gas pressure and the absence of sampling ports) The samples were submitted to Empact Analytical Systems Inc of Brighton CO for compositional analysis in accordance with ASTM Specification D1945 for quantification of methane (C1) to hexane plus (C6+) nitrogen oxygen and carbon dioxide [6] The compositional data were then used in conjunction with ASTM Specification D3588 to calculate LHV and the relative density of the gas [7]
In addition to the ASTM D1945 compositional analyses ASTM Method 5504 provided an extended analysis to quantify biogas concentrations of H2S [8] This method is essentially an extension of the ASTM D1945 procedures that uses additional chromatographic columns to separate H2S and heavier hydrocarbons
1-12
A Controlotron Model 1010EP1 energy meter was used to monitor water flow and supply and return temperatures This meter is a digitally integrated system that includes a portable computer ultrasonic fluid flow transmitters and 1000-ohm platinum resistance temperature detectors (RTDs) The meter has an overall rated accuracy of plusmn 2 percent of reading and provides a continuous 4-20 mA output signal over a selectable range The meter was installed in the 1-12-inch carbon steel water supply line
The water flow rate and supply and return temperature data used to determine heat recovery rates were logged as one-minute averages throughout all test periods The heat transfer fluid density and specific heat were determined by using ASHRAE and ASME density and specific heat values for water corrected to the average water temperature measured by the RTDs
142 Power Quality Performance
The GHG Center and its stakeholders developed the following power quality evaluation approach to account for these issues Three documents [9 10 11] formed the basis for selecting the power quality parameters of interest and the measurement methods used The GHG Center measured and recorded the following power quality parameters during the continuous monitoring period
bull Electrical frequency bull Voltage bull Voltage THD bull Current THD bull Power factor
The 7500 ION power meter used for power output determinations was used to perform these measurements as described below and detailed in the test plan The ION power meter continuously measured electrical frequency at the generatorrsquos distribution panel and the DAS was used to record oneshyminute averages throughout the verification The mean maximum and minimum frequencies as well as the standard deviation are reported
The CHP unit generates power at nominal 480 volts (AC) The electric power industry accepts that voltage output can vary within plusmn 10 percent of the standard voltage (480 volts) without causing significant disturbances to the operation of most end-use equipment [11] Deviations from this range are often used to quantify voltage sags and surges The ION power meter continuously measured true root mean square (rms) line-to-line voltage at the generatorrsquos distribution panel for each phase pair True rms voltage readings provide the most accurate representation of AC voltages The DAS recorded one-minute averages for each phase pair throughout the monitoring period as well as the average of the three phases The mean maximum and minimum voltages as well as the standard deviation for the average of the three phases are reported
THD is created by the operation of non-linear loads Harmonic distortion can damage or disrupt many kinds of industrial and commercial equipment Voltage harmonic distortion is any deviation from the pure AC voltage sine waveform THD gives a useful summary view of the generatorrsquos overall voltage quality The specified value for total voltage harmonic is a maximum THD of 50 percent based on ldquorecommended practices for individual customersrdquo in the IEEE 519 Standard The ION meter continuously measured voltage THD up to the 63rd harmonic for each phase The DAS recorded oneshyminute voltage THD averages for each phase throughout the test period and reported the mean minimum maximum and standard deviation for the average THD for the three phases
1-13
Current THD is any distortion of the pure current AC sine waveform The current THD limits recommended in the IEEE 519 standard range from 50 to 200 percent depending on the size of the CHP generator the test facilityrsquos demand and its distribution network design as compared to the capacity of the local utility grid Detailed analysis of the facilityrsquos distribution network and the local grid are beyond the scope of this verification The GHG Center therefore reported current THD data without reference to a particular recommended THD limit The ION power meter as with voltage THD continuously measured current THD for each phase and reported the average minimum and maximum values for the period
The ION power meter also continuously measured average power factor across each generator phase The DAS recorded one-minute averages for each phase during all test periods The GHG Center reported maximum minimum mean and standard deviation power factors averaged over all three phases
143 Emissions Performance
Pollutant concentration and emission rate measurements for NOX CO THCs SO2 TRS CH4 and CO2 were conducted on the turbine exhaust stack during all of the controlled test periods Testing for determination of TPM and NH3 was conducted at full load only Emissions testing coincided with the efficiency determinations described earlier The test procedures used are US EPA reference methods which are well documented in the Code of Federal Regulations (CFR) The reference methods include procedures for selecting measurement system performance specifications and test procedures quality control procedures and emission calculations (40CFR60 Appendix A) [12] Table 1-3 summarizes the standard test methods that were followed A complete discussion of the data quality requirements for example NOX analyzer interference test nitrogen dioxide [NO2] converter efficiency test sampling system bias and drift tests is presented in the test plan
Table 1-3 Summary of Emissions Testing Methods
Pollutant EPA Reference Method Analyzer Type Range
NOX 7E California Analytical Instruments (CAI) 400-CLD (chemiluminescense) 0 ndash 50 ppm
CO 10 TEI Model 48 (NDIR) 0 - 300 ppm
SO2 6C Bovar 721-AT (NDUV) 0 ndash 300 ppm
THC 25A California Analytical Instruments (FID) 0 ndash 300 ppm
CH4 18 Hewlett-Packard 5890 GCFID 0 - 300 ppm
CO2 3A CAI 200 (NDIR) 0 ndash 25
O2 3A CAI 200 (electrochemical) 0 ndash 25
TRS EPA 16A Ametek 921 White Cell (NDUV) 0 - 25 ppm
NH3 BAAQMD ST-1B Ion Specific Electrode Not specified
TPM EPA 5 Gravimetric Not specified
1-14
Emissions testing was conducted by Cubix Corporation of Austin Texas under the on-site supervision of the GHG Center field team leader A detailed description of the sampling system used for each parameter listed is provided in the test plan and is not repeated in this report Sampling was conducted during each test for approximately 30 minutes at a single point near the center of the 10-inch diameter stack Results of the gaseous pollutant testing are reported in units of parts per million volume dry (ppmvd) and ppmvd corrected to 15-percent O2 Concentrations of TPM are reported in units of grains per standard cubic foot (grdscf)
To convert measured pollutant concentrations to mass emissions exhaust gas flow rate determinations were conducted during each test run in accordance with EPA Method 2C Stack gas velocity and temperature traverses were conducted using a calibrated thermocouple a standard pitot tube and an inclined oil manometer The number and location of traverse points sampled was selected in accordance with EPA Method 1 At the conclusion of each test run equations specified in the reference methods were used to calculate exhaust gas velocity actual volumetric flow rate and volumetric flow rate at standard conditions
After converting measured pollutant concentrations to mass units of lbdscf emission rate values were calculated in units of lbhr using the standardized volumetric flow rates The mean of the three test results at each load factor is reported as the average emission rate for that load factor Emission rates for each pollutant are then normalized to system power and reported in terms of lbkWh
144 Estimated Annual Emission Reductions
The electric energy generated by the microturbine offsets electricity otherwise supplied by the utility grid Consequently the reduction in electricity demand from the grid caused by this offset will result in changes in CO2 and NOX emissions associated with producing an equivalent amount of electricity at central power plants If the CHP emissions per kWh are less than the emissions per kWh produced by an electric utility it can be inferred that a net reduction in emissions will occur at the site If the emissions from the on-site generators are greater than the emissions from the grid possibly due to the use of higher efficiency power generation equipment or zero emissions generating technologies (nuclear and hydroelectric) at the power plants a net increase in emissions may occur
The test plan included a detailed approach for estimating the emission reductions that this CHP system can provide Briefly the proposed approach estimated the annual microturbine NOX and CO2 emissions using the emission rates measured during the full load testing and the average generating rate measured during an extended test period The estimated annual CHP emissions could then be calculated in units of tons per year and compared to average emission rates published by the Energy Information Administration (EIA) for the US and Colorado The proposed approach did not include emission reductions associated with heat recovery as this process requires baseline GHG emission assessment from standard waste management practices Due to the significant resources required to do this OEMC elected to verify emission reductions from electricity generation only
Due to the cancellation of the extended test period estimation of annual power production CHP emissions could not be completed For this reason results of the microturbine CHP testing only provide measured emission rates A simple comparison of these emission rates for NOX and CO2 to the US and Colorado regional fossil fuel emission factors is all that the GHG Center can report here with the limited data set collected during this verification
1-15
20 VERIFICATION RESULTS
21 OVERVIEW
The verification testing was conducted on February 14 and 15 2004 This included the controlled tests at the four operating loads and the abbreviated continuous monitoring period to examine heat and power output and power quality The GHG Center acquired several types of data that represent the basis of verification results presented here The following types of data were collected and analyzed during the verification
bull Continuous measurements (biogas pressure biogas temperature power output and quality heat recovery rate and ambient conditions)
bull Manual biogas flow meter readings bull Biogas compositional data bull Emissions testing data bull CHP and facility operating data
The field team leader reviewed verified and validated some data such as DAS file data and reasonableness checks while on site The team leader reviewed collected data for reasonableness and completeness in the field The data from each of the controlled test periods was reviewed on site to verify that PTC-22 variability criteria were met The emissions testing data was validated by reviewing instrument and system calibration data and ensuring that those and other reference method criteria were met Factory calibrations for fuel flow pressure temperature electrical and thermal power output and ambient monitoring instrumentation were reviewed on site to validate instrument functionality Other data such as biogas analysis results were reviewed verified and validated after testing had ended All collected data was classed as either valid suspect or invalid upon review using the QAQC criteria specified in the test plan Review criteria are in the form of factory and on-site calibrations maximum calibration and other errors audit gas analyses results and lab repeatability results Results presented here are based on measurements which met the specified Data Quality Indicators (DQIs) and QC checks and were validated by the GHG Center
With the exception of the reduced load test conditions the microturbine CHP performance data collected during the 35-hour verification period are representative of normal site operations Due to the cancellation of the extended monitoring period the GHG Center was unable to obtain a reasonable set of data to examine daily trends in atmospheric conditions and their impact on electricity and heat production It should be noted that the results presented here may not represent performance over longer operating periods or at significantly different operating conditions
Test results are presented in the following subsections
Section 21 ndash Heat and Power Production Performance (controlled testing and monitoring period)
Section 22 ndash Power Quality Performance (continuous monitoring)
Section 23 ndash Emissions Performance and Reductions (controlled test periods)
2-1
The results show that the quality of power generated by the CHP system is generally high and that the unit is capable of operating in parallel with the utility grid The unit produced between 19 and 24 kW of net electrical power depending on ambient temperature (35 to 60 oF) during the monitoring period The highest heat recovery rate measured during the extended monitoring period was approximately 138 x 103Btuhr Electrical and thermal efficiencies at full power averaged 204 and 333 percent respectively with a corresponding total CHP system efficiency of 537 percent NOX emissions were very low at full load averaging 18 ppmvd at 15 O2 and 82 x 10 ndash 5 lbkWh
In support of the data analyses the GHG Center conducted an audit of data quality (ADQ) following procedures specified in the QMP A full assessment of the quality of data collected throughout the verification period is provided in Section 30 The data quality assessment was used to demonstrate that the data quality objectives (DQOs) introduced in the test plan were met for this verification
22 HEAT AND POWER PRODUCTION PERFORMANCE
The heat and power production performance evaluation included electrical power output heat recovery and CHP efficiency determinations during controlled test periods The performance evaluation also included determination of total electrical energy generated and used and thermal energy recovered over the continuous monitoring period
221 Electrical Power Output Heat Recovery Rate and Efficiency During Controlled Tests
Table 2-1 summarizes the power output heat recovery rate and efficiency performance of the CHP system Ambient temperature ranged from 45 to 58 oF relative humidity ranged from 23 to 41 percent and barometric pressure was between 1269 and 1271 psia during the controlled test periods The results shown in Table 2-1 and the discussion that follows are representative of conditions encountered at this site and are not intended to indicate performance at other operating conditions such as cooler temperatures and different elevations Biogas fuel conditions and heat recovery unit operation data corresponding to the test results are summarized in Table 2-2
Biogas fuel conditions and heat recovery unit operation data corresponding to the test results are summarized in Table 2-2 A total of 12 samples were collected for compositional analysis and determination of LHV There was very little variability in the biogas composition Average biogas CH4 and CO2 concentrations were 681 and 312 percent respectively The average LHV was 625 Btuscf and biogas compressibility averaged 0997 H2S concentrations in the biogas averaged 3730 ppm
The average net electrical power delivered to the farm was 199 kWe at full load The average electrical efficiency corresponding to these measurements was 204 percent Electrical efficiencies at the 24 20 and 15 kW power commands averaged 203 186 and 157 percent respectively Electric power generation heat rate which is an industry-accepted term to characterize the ratio of heat input to electrical power output averaged 16726 BtukWhe at full power
The average heat-recovery rate at full power was 111 x 103 Btuhr or 324 kWthhr and thermal efficiency was 333 percent The average total efficiency (electrical and thermal combined) was 537 percent for the three test runs The net heat rate which includes energy from heat recovery was 6354 BtukWht
2-2
Table 2-1 Microturbine Heat and Power Production Performance
Test ID Test
Condition
Heat Input HI
(103Btuhr)
Electrical Power Generation Performance
Heat Recovery Performance Total CHP
System Efficiency
()
Ambient Conditions c
Power Delivered a
(kWe)
Efficiency ()
Heat Recovery
Rate b
(103Btuhr)
Thermal Efficiency
() Temp (oF) RH ()
Run 1 Run 2 Run 3
Avg
30 kW power command
330 336 330
332
197 201 198
199
204 204 204
204
113 105 113
111
344 314 341
333
548 518 545
537
554 584 568
569
261 241 245
249 Run 4 Run 5 Run 6
Avg
24 kW power command
323 324 322
323
192 193 193
193
203 203 204
203
111 117 119
116
343 361 371
358
546 564 575
562
563 531 497
530
234 259 294
262 Run 7 Run 8 Run 9
Avg
20 kW power command
279 274 274
276
150 150 150
150
183 187 187
186
110 108 106
108
394 396 385
392
577 583 572
577
450 461 476
462
411 398 380
396 Run 10 Run 11 Run 12
Avg
15 kW power command
221 220 219
220
101 101 102
101
156 157 158
157
935 978 996
969
424 444 454
441
580 602 612
598
506 508 506
506
346 349 352
349
a Represents actual power available for consumption at the test site b Divide by 3412 to convert to equivalent kilowatts (kWth) c Barometric pressure was within the range of 1269 to 1271 psia throughout the test period
2-3
Table 2-2 Fuel Input and Heat Recovery Unit Operating Conditions
Test ID Test
Condition
Biogas Fuel Input Heating Loop Fluid Conditions
Gas Flow Rate (scfm)
LHV (Btuscf)
Gas Pressure
(psia)
Gas Temp (oF)
Fluid Flow Rate V (gpm)
Outlet Temp T1
(oF)
Inlet Temp T2
(oF)
Temp Diff (oF)
Run 1 Run 2 Run 3
Avg
30 kW power command
876 891 877
881 6276a
1389 1385 1383
1386
945 966 968
959
283 284 284
284
1013 1008 1008
1010
932 933 928
931
81 75 80
79 Run 4 Run 5 Run 6
Avg
24 kW power command
859 860 855
858
1384 1384 1385
1384
958 947 927
944
284 283 284
284
1011 1012 1008
1010
933 929 923
928
79 83 85
82 Run 7 Run 8 Run 9
Avg
20 kW power command
735 721 723
726 6325b
1396 1395 1395
1395
881 891 900
891
285 284 284
284
969 973 975
976
891 896 900
896
78 77 75
77 Run 10 Run 11 Run 12
Avg
15 kW power command
581 580 578
580
1397 1397 1394
1396
935 947 949
944
284 284 284
284
973 978 979
977
906 908 909
908
66 70 71
69 a Average of three separate samples collected on February 14 2004 b Average of three separate samples collected on February 15 2004
2-4
0
5
10
15
20
25
30
35
40
45
50
Effic
ienc
y (
)
0
5
10
15
20
25
Pow
er O
utpu
t(kW
)
30 kW Power Command 20 kW Power 15 kW Power Command24 kW Power
Power Output
ElectricalEfficiency
ThermalEfficiency
Results of the reduced load tests are also included in the tables Results show that electrical efficiency decreases slightly as the power output is reduced Thermal efficiency however increases as power output (and biogas consumption) decreases These trends are illustrated in Figure 2-1 which displays the electrical and thermal CHP system efficiency at each of the controlled test conditions
CommandCommand
0
5
10
15
20
25
30
35
40
45
50
Effic
ienc
y (
)
0
5
10
15
20
25
Pow
er O
utpu
t (kW
)
30 kW Power Command 20 kW Power Command
15 kW Power Command24 kW Power Command
Power Output
Electrical Efficiency
Thermal Efficiency
Figure 2-1 Electrical and Thermal Efficiency During Controlled Test Periods
As expected the high altitude of the test location (approximately 3700 feet above sea level) derated microturbine power output Table 2-1 and Figure 2-1 show that the power delivered at full load (after parasitic loads) was only 199 kW Power delivered at the 24 kW power command was nearly the same at 193 kW
222 Electrical and Thermal Energy Production During the Continuous Monitoring Period
Figure 2-2 presents a time series plot of power production and heat recovery during the abbreviated 35shyhour monitoring period The system was operated continuously at a power command of 30 kW except for periods when reduced load tests were conducted The CHP system was operated under typical farm conditions with the engine shut down and the heat recovery system configured to maintain digester temperature at around 100 oF A total of 6834 kWhe electricity and 1025 kWhth of thermal energy were generated over the 35-hour operating period The average power generated over the continuous monitoring period (excluding the reduced load testing) was 206 kWe and the average heat recovery rate was 1177 x 103 Btuhr
2-5
0
5
10
15
20
25
30Po
wer
Out
put (
kW)
70
90
110
130
150
170
Heat
Rec
over
y R
ate
(10
3 Btu
hr)
35 Consecutive Hours of Monitorin
Power Output
HeatRecoveryRate
Reduced LoadControlled TestPeriods
g 0
5
10
15
20
25
30Po
wer
Out
put (
kW)
70
90
110
130
150
170
Heat
Rec
over
y R
ate
(10
3 Btu
hr)
35 Consecutive Hours of Monitoringg35 Consecutive Hours of Monitorin
Power Output
Heat Recovery Rate
Reduced Load Controlled Test Periods
21404 21504221404 215041404 215041130 2230111130 223030 2230
Figure 2-2 Heat and Power Production During the Monitoring Period
The power output trace shows periodic trips at intervals of approximately four hours This was caused by the manner in which the facility was operating the biogas compressor To prevent damage to the compressor caused by moisture buildup in the condensate trap the trap was configured to automatically open momentarily to drain every four hours This caused a brief loss of fuel pressure thereby causing the microturbine to trip and restart The entire sequence normally took about 4 minutes to complete and in most cases the turbine was back to full power in 4 minutes The farm reports that the microturbine is no longer operated in this way
As is typical for gas fired turbines power output was also affected by ambient temperature The impact of temperature on this turbine is illustrated in Figures 2-3 and 2-4
2-6
0
5
10
15
20
25
Pow
er O
utpu
t (kW
)
20
40
60
80
Inle
t Air
Tem
pera
ture
(o F)
35 Consecutive Hours of Monitorin
Inlet AirTemperature
Power Output
25
Inlet Air Temperature
Power Output
80
Pow
er O
utpu
t (kW
)
20
60
15
10
40
Inle
t Air
Tem
pera
ture
( o F)
5
0 20 35 Consecutive Hours of Monitorin 35 Consecutive Hours of Monitoringgg
21404 21504221404 215041404 215041130 2230111130 223030 2230
Figure 2-3 Power Output and Ambient Temperature During the Verification Period
15
16
17
18
19
20
21
22
23
24
25
Pow
er O
utpu
t (kW
)
30 35 40 45 50 55 60 65
Ambient Temperature (oF)
Figure 2-4 Ambient Temperature Effects on Power Production During the Verification Period
Figure 2-4 plots power output at full load over the limited test period as a function of ambient temperature and indicates a generally linear relationship The generating rate ranged from about 19 to 235 kW across a temperature range of 349 to 596 oF
2-7
23 POWER QUALITY PERFORMANCE
231 Electrical Frequency
Electrical frequency measurements (voltage and current) were monitored continuously during the verification period The one-minute average data collected by the electrical meter were analyzed to determine maximum frequency minimum frequency average frequency and standard deviation for the verification period These results are illustrated in Figure 2-5 and summarized in Table 2-3 The average electrical frequency measured was 59999 Hz and the standard deviation was 0010 Hz
60060 606
60060 404
60060 202
60060 000
59959 898
59959 696
59959 494
59599922
222111444000444111111333000
35 C35 C35 Consonsonseeecccutututiiivvveee HHHooouuursrsrs ofofof MoMoMonininitttooorrriiingngng 222111555000444222222303030
Figure 2-5 Microturbine Frequency During Verification Period
Table 2-3 Electrical Frequency During Monitoring Period
Parameter Frequency (Hz) Average Frequency 59999 Minimum Frequency 59959 Maximum Frequency 60037 Standard Deviation 0010
Freq
uenc
y (H
z)Fr
eque
ncy
(Hz)
2-8
232 Voltage Output
It is typically accepted that voltage output can vary within plusmn 10 percent of the standard voltage (480 volts) without causing significant disturbances to the operation of most end-use equipment (ANSI 1996) The 7500 ION electric meter was configured to measure 0 to 600 VAC The turbine was grid-connected and operated as a voltage-following current source The voltage levels measured are therefore more indicative of the grid voltage levels that the Capstone tried to respond to
Figure 2-6 plots one-minute average voltage readings and Table 2-4 summarizes the statistical data for the voltages measured on the turbine throughout the verification period The voltage levels were well within the normal accepted range of plusmn 10 percent
460
470
480
490
500
Vol
tage
35 Consecutive Hours of Monitoring
460
470
480
490
500
Vol
tage
35 Consecutive Hours of Monitoring35 Consecutive Hours of Monitoring222111444000444111111333000
222111555000444222222333000
Figure 2-6 Microturbine Voltage During Verification Period
Table 2-4 Microturbine Voltage During Monitoring Period
Parameter Volts Average Voltage 48725 Minimum Voltage 47843 Maximum Voltage 49186 Standard Deviation 245
2-9
233 Power Factor
Figure 2-7 plots one-minute average power factor readings and Table 2-5 summarizes the statistical data for power factors measured on the turbine throughout the verification period The data include only periods when the microturbine was operating Data collected during the periodic trips are not included in the figure or summary table Test results show that the power factor was very stable throughout the period with the turbine at full load The power factor decreased during the low load controlled test periods
Figure 2-7 Microturbine Power Factor During Verification Period
88
90
92
94
96
98
Pow
er F
acto
r (
)
35 Consecutive Hours of Monitoring 88
90
92
94
96
98
Pow
er F
acto
r (
)
35 Consecutive Hours of Monitoring35 Consecutive Hours of Monitoring21404 215042121404 21504404 215041130 2230111130 223030 2230
Table 2-5 Power Factors During Monitoring Period
Parameter Average at full load 9453 Minimum at full load 9177 Maximum at full load 9493 Standard Deviation at full load 0240 Average at 20 kW 9280 Average at 15 kW 8987
2-10
234 Current and Voltage Total Harmonic Distortion
The turbine total harmonic distortion up to the 63rd harmonic was recorded for current and voltage output using the 7500 ION The average current and voltage THD were 321 and 189 percent respectively (Table 2-6) Both were well within the IEEE 519 specification of plusmn 5 percent Figure 2-8 plots the current and voltage THD throughout the verification period Figure 2-8 clearly shows a spike in current THD each time the microturbine was tripped by the biogas pressure loss The highest of the spikes was 32 percent
Table 2-6 Microturbine THD During Monitoring Period
Parameter Current THD () Voltage THD () Average 321 189 Minimum 222 160 Maximum 325 316 Standard Deviation 115 018
Figure 2-8 Microturbine Current and Voltage THD During Verification Period
0
2
4
6
8
10
12
THD
()
35 Consecutive Hours of Monitoring
Voltage THD
Current THD
0
2
4
6
8
10
12
THD
()
35 Consecutive Hours of Monitoring35 Consecutive Hours of Monitoring
Voltage THD
CurrentTHD
21404 21504221404 215041404 215041130 2230111130 223030 2230
2-11
24 EMISSIONS PERFORMANCE
241 Microturbine CHP System Emissions
Testing was conducted on the turbine exhaust stack to determine emission rates for NOX CO THC SO2 TRS CH4 and CO2 at each of the four controlled test conditions Testing for determination of TPM and NH3 was conducted at full load only Stack emission measurements were conducted using the reference methods summarized in Table 1-3 and detailed in the test plan The CHP system was maintained in a stable mode of operation during each test run based on PTC-22 variability criteria
Sampling system QAQC checks were conducted in accordance with test plan specifications to ensure the collection of adequate and accurate emissions data These included analyzer linearity tests and sampling system bias and drift checks Results of the QAQC checks are discussed in Section 325 The results show that DQOs for all gas species met the reference method requirements Table 2-7 summarizes the emission rates measured during each run and the overall average emissions for each set of tests
NOX concentrations averaged 175 ppmvd at 15 O2 at full load and increased to 346 ppmvd at the lowest load tested (setting of 15 kW) The overall average NOX emission rate at full load normalized to power output was 000008 lbkWh The benefits of lower NOX emissions from the CHP system are further enhanced by the fact that some of the exhaust heat is recovered and used Annual published data from Energy Information Administration (EIA) reveal that the measured CHP system NOX emission rate is well below the weighted average US and Colorado regional grid emission factors identified in the test plan which are 00066 and 00077 lbkWh respectively As stated earlier the center could not estimate annual emission reductions due to insufficient power production data but the emissions testing results clearly indicate that reductions will be realized through use of this CHP system The emission reductions are further increased when transmission and distribution system losses are accounted for
Average exhaust gas CO concentrations ranged from a low of 305 ppmvd at 15 O2 at full load to a high of 451 ppmvd at 15 O2 at the 15 kW power command Corresponding average CO emission rates at these power commands were approximately 0009 and 0017 lbkWh respectively
Similarly THC (and CH4) concentrations increased as power output decreased and ranged from 165 ppmvd at 15 O2 at full load to 475 ppmvd at 15 O2 at the 15 kW power command Corresponding average THC emission rates at these power commands were approximately 0003 and 0011 lbkWh respectively The CH4 emissions consistently comprised about 80 percent of the THC emissions
Concentrations of CO2 in the CHP system exhaust gas averaged 23 percent at full load and decreased as power output was reduced to a low of 20 percent These concentrations correspond to average CO2 emission rates of 345 lbkWh and 390 lbkWh respectively The CHP system CO2 emission rate at full load is higher than the weighted average fossil fuel emission factors for both the US and Colorado regional grids (202 and 213 lbkWh respectively) This indicates a likely increase in annual CO2 emissions for power production from this system but this increase would likely be offset by efficiency gains resulting from heat recovery and use and elimination of transmission and distribution system losses
2-12
Table 2-7 Microturbine CHP System Emissions During Controlled Test Periods
Pow
erC
omm
and
(kW
)
Elec
tric
alPo
wer
Out
put
(kW
) Exhaust
O2 ()
NOx Emissions CO Emissions THC Emissions CH4 Emissions CO2 Emissions
(ppm at
15 O2) (lbhr) (lbkWh)
(ppm at
15 O2) (lbhr) (lbkWh)
(ppm at
15 O2) (lbhr) (lbkWh)
(ppm at
15 O2) (lbhr) (lbkWh) () (lbhr) (lbkWh)
Run 1
Run 2
Run 3
AVG
30
197
201
198
199
191
191
192
191
170
180
174
175
161E-03
167E-03
161E-03
163E-03
817E-05
831E-05
814E-05
821E-05
250
310
354
305
0144
0175
0199
0173
0007
0009
0010
0009
141
163
190
165
0046
0052
0061
0053
235E-03
261E-03
310E-03
269E-03
112
141
157
137
0037
0045
0051
0044
187E-03
226E-03
256E-03
223E-03
23
23
23
23
682
668
707
686
346
332
358
345
Run 4
Run 5
Run 6
AVG
24
192
193
193
193
191
192
192
192
190
201
198
196
184E-03
184E-03
180E-03
183E-03
954E-05
952E-05
936E-05
947E-05
319
345
364
343
0188
0191
0202
0194
0010
0010
0010
0010
184
194
200
193
0062
0061
0063
0062
321E-03
319E-03
328E-03
323E-03
141
155
183
160
0047
0049
0058
0051
246E-03
254E-03
300E-03
267E-03
23
23
23
23
696
696
696
696
362
361
361
361
Run 7a
Run 8
Run 9
AVG
20
150
150
150
150
193
193
193
193
505
575
572
399
0004
0042
0042
0029
248E-04
281E-03
279E-03
195E-03
590
192
199
327
0263
0086
0089
0146
0018
0006
0006
0010
365
132
126
208
0093
0034
0032
0053
622E-03
225E-03
214E-03
354E-03
293
97
105
165
0075
0025
0027
0042
499E-03
165E-03
179E-03
281E-03
22
22
22
22
569
569
569
569
380
379
378
379
Run 10
Run 11
Run 12
AVG
15
101
101
102
101
190
191
191
191
332
351
354
346
0022
0022
0022
0022
219E-03
218E-03
220E-03
219E-03
441
459
452
451
0179
0176
0174
0176
0018
0017
0017
0017
483
484
457
475
0112
0106
0100
0106
110E-02
105E-02
987E-03
105E-02
360
413
410
394
0083
0091
0090
0088
824E-03
893E-03
885E-03
867E-03
20
20
20
20
395
395
395
395
391
390
390
390
a The NOX CO and CH4 concentrations during run 7 are questionable when compared to the data collected during runs 8 and 9 A brief 4-minute microturbine shutdown occurred at the conclusion of run 7 but the GHG Center was unable to resolve this anamoly after reviewing all available system operating data
2-13
Table 2-7 Microturbine CHP System Emissions During Controlled Test Periods (Continued)
Pow
erC
omm
and
(kW
)
Elec
tric
alPo
wer
Out
put
(kW
) Exhaust
O2 ()
Particulate Emissions NH3 Emissions SO2 Emissions TRS Emissions
(grdscf) (lbhr) (lbkWh)
(ppm at
15 O2) (lbhr) (lbkWh)
(ppm at
15 O2) (lbhr) (lbkWh)
(ppm at
15 O2) (lbhr) (lbkWh)
Run 1
Run 2
Run 3
AVG
30
197
201
198
199
191
191
192
191
00055
00053
00022
00043
0016
0015
0006
0012
811E-04
746E-04
304E-04
620E-04
005
004
002
004
170E-05
131E-05
600E-06
120E-05
862E-07
654E-07
304E-07
607E-07
488
582
614
561
064
073
081
073
0032
0036
0041
0037
155
144
570
119
0020
0018
0008
0015
101E-03
913E-04
406E-04
778E-04
Run 4
Run 5
Run 6
AVG
24
192
193
193
193
191
192
192
192
ND
ND
ND
NA
ND
ND
ND
NA
ND
ND
ND
NA
ND
ND
ND
NA
ND
ND
ND
NA
ND
ND
ND
NA
560
596
584
580
077
076
075
076
0040
0039
0039
0039
483
327
196
335
00067
00042
00025
00045
348E-04
218E-04
130E-04
232E-04
Run 7
Run 8
Run 9
AVG
20
150
150
150
150
193
193
193
193
ND
ND
ND
NA
ND
ND
ND
NA
ND
ND
ND
NA
ND
ND
ND
NA
ND
ND
ND
NA
ND
ND
ND
NA
594
590
588
591
061
060
061
061
0041
0040
0041
0040
820
678
581
693
00084
00069
00060
00071
561E-04
461E-04
401E-04
474E-04
Run 10
Run 11
Run 12
AVG
15
101
101
102
101
190
191
191
191
ND
ND
ND
NA
ND
ND
ND
NA
ND
ND
ND
NA
ND
ND
ND
NA
ND
ND
ND
NA
ND
ND
ND
NA
477
500
496
491
043
043
043
043
0043
0042
0042
0042
268
229
228
242
00024
00020
00020
00021
237E-04
198E-04
198E-04
211E-04
ND = No data collected These pollutants not tested at reduced loads NA = Not applicable
2-14
Emissions of total particulate matter and NH3 were extremely low during each of the three test replicates conducted at full power SO2 emissions from the CHP were fairly consistent throughout the range of operation At full load SO2 concentrations averaged 561 ppmvd at 15 O2 and corresponding emission rates averaged 0037 lbkWh Emissions of TRS the sulfurous compounds in the fuel that were not oxidized during combustion averaged approximately 780 ppmvd at 15 O2 and 0005 lbkWh during the full load tests
2-15
30 DATA QUALITY ASSESSMENT
31 DATA QUALITY OBJECTIVES
The GHG Center selects methodologies and instruments for all verifications to ensure a stated level of data quality in the final results The GHG Center specifies data quality objectives (DQOs) for each verification parameter before testing commences Each test measurement that contributes to the determination of a verification parameter has stated data quality indicators (DQIs) which if met ensure achievement of that verification parameterrsquos DQO
The establishment of DQOs begins with the determination of the desired level of confidence in the verification parameters Table 3-1 summarizes the DQOs established in the test planning stage for each verification parameter The actual data quality achieved during testing is also shown The next step is to identify all measured values which affect the verification parameter and determine the levels of error which can be tolerated These DQIs most often stated in terms of measurement accuracy precision and completeness are used to determine if the stated DQOs are satisfied The DQIs for this verification shyused to support the DQOs listed in Table 3-1 - are summarized in Table 3-2
Table 3-1 Verification Parameter Data Quality Objectives
Verification Parameter Original DQO Goala
Relative () Absolute (units) Achievedb
Relative () Absolute (units) Power and Heat Production Performance
Electrical power output (kW) plusmn 15 098 kW plusmn 10 020 kW Electrical efficiency () plusmn 15 041c plusmn 13 027c
Heat recovery rate (103Btuhr) plusmn 17 575 x 103Btuhrc plusmn 24 27 x 103Btuhrc
Thermal energy efficiency () plusmn 17 071c plusmn 25 083c
CHP production efficiency () plusmn 12 082c plusmn 16 087c
Power Quality Performance Electrical frequency (Hz) plusmn 001 0006 Hz plusmn 001 0006 Hz Voltage 10 48 Vc 10 49 Vc
Power factor () plusmn 050 TBD plusmn 050 047 Voltage and current total harmonic distortion (THD) () plusmn 100 TBD plusmn 100 003
Emissions Performance NOX CO CO2 O2 TRS and SO2 concentration accuracy plusmn 20 of spand plusmn 20 of spand
CH4 and THC concentration accuracy plusmn 50 of spand plusmn 50 of spand
TPM and NH3 concentration accuracy plusmn 50 plusmn 100 a Original DQO goals as stated in test plan Absolute errors were provided in the test plan where applicable based on anticipated
values b Overall measurement uncertainty achieved during verification The absolute errors listed are based on these uncertainties and the
average values measured during the verification c Calculated composite errors were derived using the procedures described in the corresponding subsections (Sections 322 through
325) d Qualitative data quality indicators based on conformance to reference method requirements
The DQIs specified in Table 3-2 contain accuracy precision and completeness levels that must be achieved to ensure that DQOs can be met Reconciliation of DQIs is conducted by performing independent performance checks in the field with certified reference materials and by following approved reference methods factory calibrating the instruments prior to use and conducting QAQC procedures in
3-1
the field to ensure that instrument installation and operation are verified The following sections address reconciliation of each of the DQI goals
This verification was supported by an Audit of Data Quality (ADQ) conducted by the GHG Center QA manager During the ADQ the QA manager randomly selected data supporting each of the primary verification parameters and followed the data through the analysis and data processing system The ADQ confirmed that no systematic errors were introduced during data handling and processing A performance evaluation audit (PEA) and a technical systems audit (TSA) were planned but not conducted Similar PEAs were recently conducted on two recent CHP verifications [13 14] and it was decided to not repeat the PEA a third time Likewise a full TSA was recently completed on a similar verification [13] where the same measurement systems were used so this QA activity was not repeated here Instead the GHG Center QA manager conducted an abbreviated project review to ensure that the verification approach and analytical procedures specified in the TQAP were followed or in cases where changes to the verification were necessary these changes were justified and documented Corrective action reports (CARs) are completed signed by the GHG Center QA manager and filed at the GHG Center that document significant changes to the verification approach or methodologies that occurred during the verification
32 RECONCILIATION OF DQOs AND DQIs
Table 3-2 summarizes the range of measurements observed in the field and the completeness goals Completeness is the number or percent of valid determinations actually made relative to the number or percent of determinations planned The completeness goals for the controlled tests were to obtain electrical and thermal efficiency as well as emission rate data for three test runs conducted at each of four different load conditions This completeness goal was achieved
Completeness goals for the extended tests were to obtain 90 percent of 7 days of power quality power output heat recovery rate and ambient measurements This goal was not achieved As explained in Section 21 the Center was not able to complete the entire 7-day extended monitoring period A total of 35 hours of data were logged including the controlled test periods
Table 3-2 also includes accuracy goals for measurement instruments Actual measurement accuracy achieved is also reported based on instrument calibrations conducted by manufacturers field calibrations reasonableness checks or independent performance checks with a second instrument Table 3-3 includes the QAQC procedures that were conducted for key measurements in addition to the procedures used to establish DQIs The accuracy results for each measurement and their effects on the DQOs are discussed below
3-2
3-3
Table 3-2 Summary of Data Quality Indicator Goals and Results
Measurement Variable Instrument Type and
Manufacturer
Instrument Range
Range Observed in
Field
Accuracy Completeness
Goal Actual How Verified or Determined Goal Actual
CHP System Power Output and Quality
Power
Electric Meter Power Measurements 7500 ION
0 to 100 kW 0 to 242 kW plusmn 15 reading plusmn 10 reading
Instrument calibration from manufacturer prior to testing
Controlled tests three valid runs per load meeting PTC 22 criteria
Extended test 90 of one minute readings for 7 days
Controlled tests three valid runs at each load
Extended test 35 consecutive hours of one minute readings
Voltage 0 to 600 V 478 to 492 V plusmn 10 reading plusmn 10 reading Frequency 55 to 65 Hz 599 to 600 Hz plusmn 001 reading plusmn 001 reading Current 0 to 200A 5 to 29 A plusmn 10 reading plusmn 10 reading Voltage THD 0 to 100 16 to 32 plusmn 10 full scale plusmn 10 full scale Current THD 0 to 100 22 to 325 plusmn 10 full scale plusmn 10 full scale
Power Factor 0 to 100 918 to 949 plusmn 05 reading plusmn 05 reading
CHP System Heat Recovery Rate
Inlet Temperature
Controlotron Model 1010EP
80 to 150 oF 89 to 94 oF Temps must be plusmn 15 oF of ref Thermocouples
plusmn 07 oF for outlet plusmn 08 oF for inlet
Independent check with calibrated thermocoupleOutlet
Temperature 80 to 150 oF 93 to 102 oF
Water Flow 0 to 150 gpm 281 to 286 gpm plusmn 10 reading plusmn 01 reading Instrument calibration from manufacturer prior to testing
Ambient Conditions
Ambient Temperature
RTD Vaisala Model HMD 60YO
-50 to 150 oF 35 to 60 o F plusmn 02 oF plusmn 02 oF
Instrument calibration from manufacturer prior to testing
Ambient Pressure
Setra Model 280E 0 to 25 psia 1268 to 1272
psia plusmn 01 full scale plusmn 005 full scale
Relative Humidity
Vaisala Model HMD 60YO 0 to 100 RH 21 to 49 RH plusmn 2 plusmn 02
(continued)
3-3
3-4
Table 3-2 Summary of Data Quality Indicator Goals and Results (continued)
Measurement Variable Instrument Type and Manufacturer
Instrument Range
Measurement Range
Observed
Accuracy Completeness
Goal Actual How Verified or Determined Goal Actual
Fuel Input
Gas Flow Rate Dresser-Roots Model 2M175 SSM Series B3 rotary displacement
0 to 30 scfm 5 to 10 scfm 10 of reading plusmn 03 of reading
Factory calibration with volume prover
Controlled tests three valid runs per load meeting PTC 22 criteria Extended test 90 of one- minute readings for 7 days
Controlled tests three valid runs at each load
Extended test 35 hours of one-minute readings
Gas Pressure Omega Model PX205shy030AI transducer 0 to 30 psia 12 to 14 psia plusmn 075 full
scale plusmn 025 full scale Instrument calibration to NIST traceable standards
Gas Temperature
Omega TX-93 Type K thermocouple 0 to 200 oF 75 to 97 oF plusmn 010 reading plusmn 010 reading
LHV Gas Chromatograph HP 589011
0 to 100 CH4
67 to 69 CH4 plusmn 30 accuracy plusmn 02 repeatability
plusmn 05 accuracy plusmn 005 repeatability
analysis of NIST-traceable CH4 standard and duplicate analysis on 3 samples
Controlled tests two valid samples per load
Controlled tests two valid samples per load627 to 633
Btuft3 01 repeatability
plusmn 006 repeatability
Conducted duplicate analyses on 3 samples
Exhaust Stack Emission
NOX Levels Chemiluminescent CAI 400-CLD
0 to 50 ppmvd 0 to 3 ppmvd plusmn 2 full scale le 2 full scale
Calculated following EPA Reference Method calibrations (Before and after each test run)
Controlled tests three valid runs per load
Controlled tests three valid runs per load
CO Levels NDIR TEI Model 48 0 to 300 ppmvd
50 to 160 ppmvd plusmn 2 full scale le 2 full scale
CH4 levels HP 5890 0 to 300 ppmv 30 to 130 ppmv plusmn 5 full scale le 5 reading
THC levels HP 5890 0 to 300 ppmv 40 to 160 ppmv plusmn 5 full scale le 5 full scale
SO2 Levels Bovar 721-AT 0 to 300 ppmvd
145 to 185 ppmvd plusmn 2 full scale le 2 full scale
O2 CO2 Levels CAI 200 0 to 25 10 to 20 O2
20 to 25 CO2 plusmn 2 full scale le 2 full scale
TRS Levels Ametek 921 0 to 25 ppmvd 0 to 5 ppmvd plusmn 2 full scale le 2 full scale
NH3 Levels Ion specific electrode 0 to 5 ugml 0 to 42 ugml plusmn 5 full scale le 5 full scale
TPM concentrations gravimetric Not specified 001 to 004 g plusmn 1 mg plusmn 05 mg
Stack gas velocity
Pitot and thermocouple Not specified 3552 to 3753
fpm plusmn 5 reading le 5 reading
3-4
321 Power Output
Instrumentation used to measure power was introduced in Section 10 and included a Power Measurements Model 7500 ION The data quality objective for power output was plusmn 15 percent of reading which includes compounded error of the instrument and the current transformers (CTs) The test plan specified factory calibration of the ION meter with a NIST-traceable standard to determine if the power output DQO was met The Test plan also required the GHG Center to perform several reasonableness checks in the field to ensure that the meter was installed and operating properly The following summarizes the results
The meter was factory calibrated by Power Measurements in April 2003 Calibrations were conducted in accordance with Power Measurementsrsquo standard operating procedures (in compliance with ISO 90021994) and are traceable to NIST standards The meters were certified by Power Measurements to meet or exceed the accuracy values summarized in Table 3-2 for power output voltage current and frequency NIST-traceable calibration records are archived by the GHG Center Pretest factory calibrations on the meters indicated that accuracy was within plusmn 005 percent of reading and this value combined with the 10-percent error inherent to the current transformers resulted in an overall error of plusmn 101 percent Using the manufacturer-certified calibration results and the average power output measured during the full-load testing the absolute error during all testing is plusmn 020 kW
Additional QC checks were performed on the 7500 ION to verify the operation after installation of the meters at the site and prior to the start of the verification test The results of these QC checks (summarized in Table 3-3) are not used to reconcile the DQI goals but to document proper operation in the field Current and voltage readings were checked for reasonableness using a hand-held Fluke multimeter These checks confirmed that the voltage and current readings between the 7500 ION and the Fluke were within the range specified in the test plan as shown in Table 3-3
These results led to the conclusion that the 7500 ION was installed and operating properly during the verification test The plusmn 10-percent error in power measurements as certified by the manufacturer was used to reconcile the power output DQO (discussed above) and the electrical efficiency DQO (discussed in Section 322)
3-5
Table 3-3 Results of Additional QAQC Checks
Measurement Variable QAQC Check When
PerformedFrequency Expected or Allowable
Result Results Achieved
Power Output
Sensor diagnostics in field Beginning and end of test Voltage and current checks
within plusmn 1 reading plusmn 01 voltage plusmn 09 current
Reasonableness checks Throughout test Readings should be around 22 kW net power output at full load
Readings were 20 to 24 kW at full load
Fuel Heating Value
Calibration with gas standards by laboratory
Prior to analysis of each lot of samples submitted
plusmn 10 for each gas constituent Results satisfactory see
Section 3224 Independent performance checks with blind audit sample
Twice during previous year
plusmn 30 for each major gas constituent (methane CO2)
Heat Recovery Rate
Meter zero check Prior to testing Reported water flow rate lt 01 gpm ndash006 gpm recorded
Independent performance check of temperature readings
Beginning of test period Difference in temperature readings should be lt 15 degF
Temperature readings within 08 degF of reference
322 Electrical Efficiency
The DQO for electrical efficiency was to achieve an uncertainty of plusmn 152 percent at full electrical load or less Recall from Equation 1 (Section 141) that the electrical efficiency determination consists of three direct measurements power output fuel flow rate and fuel LHV The accuracy goals specified to meet the electrical efficiency DQO consisted of plusmn 15 percent for power output plusmn 10 percent for fuel flow rate and plusmn 02 percent for LHV The accuracy goals for each measurement were met The following summarizes actual errors achieved and the methods used to compute them
Power Output As discussed in Section 321 factory calibrations of the 7500 ION with a NISTshytraceable standard and the inherent error in the current and potential transformers resulted in plusmn 10-percent error in power measurements Reasonableness checks in the field verified that the meter was functioning properly The average power output at full load was approximately 20 kW with a measurement error of plusmn 020 kW
Heat Input Heat input is the product of measured fuel flow rate and LHV The DQI goal for fuel flow rate was reconciled through calibration of the gas meter and the gas temperature and pressure sensors used to correct measured gas volumes to standard conditions All three components were calibrated with NIST-traceable standards As shown in Table 3-2 the individual instruments errors were 03 025 and 01 percent for flow pressure and temperature respectively The overall error in biogas flow rate on a wet basis then is 040 percent of reading
Since biogas flow rate was metered on a wet and low pressure basis but combusted by the microturbine on a dry high pressure basis measured flow rates were corrected for moisture content (Section 142) Since the actual moisture content of the as-fired biogas was not directly measured the assumption that the gas was completely dry introduced additional error into the heat input determination The center
3-6
conducted an analysis of this assumption and knowing the temperature and pressure of the gas as fired determined that the worst case error introduced by the assumption that the gas is totally dry is 07 percent Combining that uncertainty with the heat input wet basis error of 040 percent the overall error on determination of biogas flow rate on a dry basis is then 081 percent of reading
The average flow rate at full load was 881 scfm with an associated measurement error of plusmn 007 scfm Complete documentation of data quality results for fuel flow rate is provided in Section 325
Uncertainty in the biogas LHV results was within the 02 percent DQI goal (Section 326) The average LHV during testing was 630 Btuft3 and the measurement error corresponding to this heating value is plusmn 13 Btuft3 The heat input compounded error then is
Error in Heat Input = ( flowmetererror )2 + (LHVerror)2 (Equation 5)
= (00081)2 + (0002)2 = 00083
The measurement error amounts to approximately plusmn 27 x 103Btuhr or 083 percent relative error at the average measured heat input of 332 x 103Btuhr
The errors in the divided values compound similarly for the electrical efficiency determination The electrical power measurement error is plusmn 10 percent relative (Table 3-2) and the heat input error is plusmn 083 percent relative Therefore compounded relative error for the electrical efficiency determination is
Error in Elec Power Efficiency = (powermetererror)2 + (heatinputerror)2 (Equation 6)
= (0010)2 + (00083)2 = 00130
Electrical efficiency for the controlled test periods at full load was 204 plusmn 027 percent or a relative compounded error of 13 percent
323 PTC-22 Requirements for Electrical Efficiency Determination
PTC-22 guidelines state that efficiency determinations were to be performed within 60 minute test periods in which maximum variability in key operational parameters did not exceed specified levels Table 3-4 summarizes the maximum permissible variations observed in power output ambient temperature ambient pressure biogas pressure at the meter and biogas temperature at the meter for each test run The table shows that the requirements for all parameters were met for all test runs and the efficiency determinations were representative of stable operating conditions
3-7
Table 3-4 Variability Observed in Operating Conditions Maximum Observed Variationa in Measured Parameters
Power Output ()
Ambient Temp (oF)
Ambient Pressure ()
Biogas pressure
(psia)
Power Factor ()
Maximum Allowable Variation plusmn 2 plusmn 4 plusmn 05 plusmn 1 plusmn 2
Run 1 06 11 003 02 02 Run 2 17 07 003 01 01 Run 3 18 06 002 01 01 Run 4 03 22 001 02 01 Run 5 03 09 001 02 01 Run 6 04 25 002 02 02 Run 7 03 03 001 03 01 Run 8 04 07 001 01 01 Run 9 02 08 001 02 01
Run 10 04 05 002 01 01 Run 11 04 04 003 02 01 Run 12 03 04 002 03 01
a Maximum (Average of Test Run ndash Observed Value) Average of Test Run 100
324 Ambient Measurements
Ambient temperature relative humidity and barometric pressure at the site were monitored throughout the verification period and the controlled tests The instrumentation used is identified in Table 3-2 along with instrument ranges data quality goals and data quality achieved All three sensors were factoryshycalibrated using reference materials traceable to NIST standards The pressure sensor was calibrated prior to the verification testing confirming the plusmn 01 percent accuracy The temperature and relative humidity sensors were also calibrated within a year prior to testing which verified that the plusmn 02 degF accuracy goal for temperature and plusmn 2 percent accuracy goal for relative humidity were met
325 Fuel Flow Rate
The Dresser-Roots Model 2M175 rotary displacement gas meter was factory-calibrated prior to installation in 1999 Calibration records were obtained and reviewed to ensure that the plusmn 10-percent instrument accuracy goal was satisfied The original calibration for the Roots meter indicating an accuracy of plusmn 032 percent is a permanent calibration This error combines with the errors in the gas temperature pressure and moisture determinations for an overall biogas flow rate measurement error of plusmn 081 percent
326 Fuel Lower Heating Value
Biogas sample collection date time run number and canister ID were logged along with laboratory chain of custody forms and were shipped along with the samples Copies of the chain of custody forms and results of the analyses are stored in the GHG Center project files Collected samples were shipped to Empact Analytical Laboratories of Brighton CO for compositional analysis and determination of LHV
3-8
per ASTM test Methods D1945 [6] and D3588 [7] respectively The DQI goals were to measure methane concentrations within plusmn 30 percent of a NIST-traceable blind audit sample and to achieve less than plusmn 02 percent difference in LHV duplicate analyses results Blind audits were submitted to Empact on two similar verifications within the past year to evaluate analytical accuracy on the methane analyses [13 14] Both audits indicated analytical accuracy within 05 percent and repeatability of within plusmn 02 percent Since the same sampling and analytical procedures were used here by the same analyst the audit was not repeated a third time
Duplicate analyses in addition to the blind audit samples were conducted on three of the samples collected during the controlled test periods Duplicate analysis is defined as the analysis performed by the same operating procedure and using the same instrument for a given sample volume Results of the duplicate analyses showed an average analytical repeatability of 006 percent for methane and 006 percent for LHV The results demonstrate that the plusmn 02 percent LHV accuracy goal was achieved As such both DQIs were met with the methane accuracy at plusmn 05 percent and the LHV repeatability at plusmn 006 percent
327 Heat Recovery Rate and Efficiency
Several measurements were conducted to determine CHP system heat-recovery rate and thermal efficiency These measurements include water flow rate water supply and return temperatures and CHP system heat input The individual errors in each of the measurements is then propagated to determine the overall error in heat-recovery rate and efficiency The Controlotron ultrasonic heat meter was used to continuously monitor water flow rate This meter has a NIST-traceable factory-calibrated accuracy of plusmn 10 percent of reading (this flow through calibration was conducted on October 9 2002) This certification serves as the primary DQI A zero check was also performed on the flow meter The meter reading was -006 gpm with the CHP system shut down and the circulation pump off
Table 3-2 showed that the DQI for supply and return temperatures (delta T) was achieved Each temperature sensor was calibrated against a reference thermocouple with NIST-traceable accuracy The error in the two temperature sensors resulted in an overall delta T uncertainty of 08 oC This absolute error equates to a relative error of 22 percent at the average fluid temperatures measured during the fullshyload testing (about 361 oC) The overall error in heat recovery rate is then the combined error in flow rate and temperature differential This error compounds multiplicatively as follows
Overall Heat Meter Error = (Flow rate error)2 + (compositional error) 2 (Equation 7)
( ) 0240)0220(0100 22 =+=
The heat recovery rate determination therefore has a relative compounded error of plusmn 24 percent The absolute error in the average heat recovery rate at full load (111 x 103Btuhr) then is plusmn 27 x 103Btuhr
This error in heat-recovery rate and the heat input error (083 percent) compound similarly to determine the overall uncertainty in the thermal efficiency determination as follows
Error in Heat Recovery Efficiency = (0024)2 + (00083)2 = 0025 (Equation 8)
Average heat recovery rate (thermal) efficiency at full load then is 333 plusmn 083 percent or a relative compounded error of 25 percent This compounded relative error exceeds the data quality objective
3-9
slightly but the absolute error is within the goal for this verification parameter (measured values were lower than anticipated)
328 Total Efficiency
Total efficiency is the sum of the electrical power and heat-recovery efficiencies Total efficiency is defined as 204 plusmn 027 percent (plusmn 130-percent relative error) plus 333 plusmn 063 percent (plusmn 19-percent relative error) This is based on the determined errors in electrical and thermal efficiency at full load The absolute errors compound as follows
errcabs = err12 + err2
2 (Equation 9)
870830270 22 =+=
Relative error is
errcrel =errcabs (Equation 10)
Value1 +Value2
087 = = 0016
204 + 333 where
errcabs = compounded error absolute err1 = error in first added value absolute value err2 = error in second added value absolute value errcrel = compounded error relative value1 = first added value value2 = second added value
The total CHP efficiency at full load is then 537 plusmn 087 percent or 16 percent relative error Again this compounded relative error exceeds the data quality objective slightly
329 Exhaust Stack Emission Measurements
EPA reference method requirements form the basis for the qualitative DQIs specified in the Test plan and listed in Tables 3-1 and 3-2 Each method specifies sampling and calibration procedures and data quality checks These specifications when properly implemented ensure the collection of high quality and representative emissions data The specific sampling and calibration procedures vary by method and class of pollutants and are summarized in Table 3-5 The table lists the method quality requirements the acceptable criteria and the results for the test conducted here It is generally accepted that conformance to the reference method quality requirements demonstrates that the qualitative DQIs have been met
All of the emissions testing and reference method quality control procedures were conducted by Cubix Corporation either in the field during testing or in their calibration and analytical laboratories in Austin Texas All of the field sampling procedures and calibrations were closely monitored by GHG Center personnel In addition documentation of all sampling and analytical procedures data collection and
3-10
calibrations have been procured reviewed and filed by the GHG Center Table 3-5 is followed by a brief explanation of the QAQC procedures implemented for each class of pollutant quantified during this verification
Table 3-5 Summary of Emissions Testing Calibrations and QC Checks
Measurement Variable
Calibration or QC Check
When Performed and Frequency
Expected or Allowable Result
Result of Calibration(s) or Check(s)
NOX CO CO2 SO2 TRS and O2 concentrations
Analyzer calibration error test
Daily before testing plusmn 2 of analyzer span All within allowable level for each day
System bias checks Before each test run plusmn 5 of analyzer span All within allowable level for each test run Calibration drift test After each test run plusmn 3 of analyzer span
THC concentrations System calibration error test
Daily before testing plusmn 5 of analyzer span All within allowable level for each day
System calibration drift test
After each test run plusmn 3 of analyzer span All within allowable level for each test run
CH4 concentrations Triplicate injections Each test run plusmn 5 difference All within allowable level for each test run
Calibration of GC with gas standards by certified laboratory
Immediately prior to sample analyses andor at least once per day
plusmn 5 for each compound
All within allowable level for each day
TPM emissions Pre and post test sampling system leak checks
Before and after each test run
Sampling system leak rate lt 002 cfm
All checks lt 002 cfm
Minimum sample volume After each test run Corrected Vol gt 600 dscf
Volumes ranged from 694 to 796 dscf
Percent isokinetic sampling rate (I)
After each test run 90 lt I lt 110 91 lt I lt 102
Analytical balance calibration
Once before analysis plusmn 00001 g Within allowable level
Filter and reagent blanks Once during testing after first test run
lt 10 of particulate catch for first test run
Blank weights lt 10 of each sample catch
Dry gas meter calibration Once before and once after testing
plusmn 5 Pre and post test calibrations within 1
Thermocouple calibration Once after testing plusmn 15 of average stack temperature
Within 03 of reference TC
NH3 concentrations Calibration of instrument with NH3 standards
Immediately prior to sample analyses at least once a day
plusmn 5 Pre test calibrations within 1 of working standards
Dry gas meter calibration Once before and once after testing
plusmn 5 Pre and post test calibrations within 1
Exhaust gas volumetric flow rate
Pitot tube dimensional calibration inspection
Once before and once after testing
See 40CFR60 Method 2 Section 100
Calibration criteria met
Thermocouple calibration Once after testing plusmn 15 of average stack temperature
Within 03 of reference TC
3291 NOX CO CO2 SO2 TRS and O2 Concentrations
Test personnel performed sampling system calibration error tests prior to each test run All calibrations employed a suite of three EPA Protocol No 1 calibration gases (four for CO) that spanned the instrument ranges Appropriate calibration ranges were selected for each pollutant based on exhaust gas screening (ranges are summarized in Table 3-2) The daily analyzer calibration error goal for each instrument was plusmn 20 percent of span It was met for each analyzer during each day of testing
3-11
Sampling system bias was evaluated for each parameter at the beginning of each test run using the zero and mid-level calibration gases System response to the zero and mid-level calibration gases also provided a measure of drift and bias at the end of each test run The maximum allowable sampling system bias and drift values were plusmn 5 and plusmn 3 percent of span respectively These specifications were met for each parameter and for each test run Testers also performed a NOX converter efficiency test as described in Section 35 of the test plan The converter efficiency was 9998 percent which meets the 98shypercent goal specified in the method
3292 THC Concentrations
Following Method 25A criteria the analyzer calibration error test is not performed on the THC analyzer Instead a 4-point system bias test is conducted at the beginning of each test day System response must be within plusmn 5 percent of the calibration standard at each point System response to the zero and mid-level calibration gases also provided a measure of drift and bias at the end of each test run The maximum allowable sampling system bias and drift values were plusmn 5 and plusmn 3 percent of span respectively These specifications were met for test run
3293 CH4 Concentrations
The test plan specified EPA Method 18 for determining stack gas methane concentrations This testing was conducted on-site eliminating the need to collect bag samples for transport to a laboratory Test operators injected calibration gas standards into the gas chromatograph (GC) to establish a concentration standard curve prior to sample analysis The operator repeated the injections until the average of all desired compounds from three separate injections agreed to within 50 percent of the certified value The acceptance criterion was met for all runs
The analysts injected the mid-range standard to quantify instrument drift at the completion of each test The analyst would repeat the calibration process used for the average of the two calibration curves to determine concentrations if he observed a variance larger than 50 percent
3294 Total Particulate Matter and Exhaust Gas Volumetric Flow Rate
Reference Methods 1 through 5 used for determination of exhaust gas volumetric flow rate and total particulate emissions include numerous quality control and quality assurance procedures that are required to ensure collection of representative data The most important of these procedures are listed in Table 3-5 along with the results for these tests These methods do not specify overall uncertainties but it is generally accepted that conformance to the control and quality assurance procedures will result in an overall method uncertainty ranging from 5 to 30 percent depending on the mass of the particulate catch the quality of the sampling system and the length of the sampling probe [15] For these tests TPM catches were in the range of 10 to 20 mg the sampling system surfaces contacting the exhaust gases were constructed entirely of glass or Teflon and the probe was less than 3-feet in length In addition testers documented that all of the key method criteria were met It is therefore expected that the overall error for tests conducted here is plusmn 10 percent of reading This exceeds the original goal of plusmn 5 percent but this deviation from the plan is not believed to impact results significantly because TPM emissions were very low
3-12
3295 NH3 Concentrations
Ammonia samples were collected in the back-half of the total particulate sampling train and therefore all of the sampling system criteria are the same as for TPM measurements Sampling error for the NH3 samples should be the same as sampling error for the TPM samples In the laboratory analytical instrumentation was calibrated using nine working standards A calibration curve for the instrument was developed using this nine-point calibration The R2 for the calibration curve was 09997 indicating excellent analytical linearity Based on this the same uncertainty used for the TPM determination (plusmn10 percent) is assigned Again this level of uncertainty exceeds the original goal of plusmn 5 percent but as with the TPM emissions this deviation from the plan is not believed to impact results significantly because NH3 emissions were also very low
3-13
40 REFERENCES
[1] Southern Research Institute Environmental Technology Verification Report Swine Waste Electric and Heat Production ndash Martin Machinery Internal Combustion Engine SRIUSEPA-GHG-QAP-27 wwwsri-rtpcom Greenhouse Gas Technology Center Southern Research Institute Research Triangle Park NC September 2004
[2] Southern Research Institute Test and Quality Assurance Plan - Swine Waste Electric Power and Heat Production Systems Capstone MicroTurbine and Martin Machinery Internal Combustion Engine SRIUSEPA-GHG-QAP-22 wwwsri-rtpcom Greenhouse Gas Technology Center Southern Research Institute Research Triangle Park NC November 2002
[3] American Society of Mechanical Engineers Performance Test Code for Gas Turbines ASME PTC-22 New York NY 1997
[4] American National Standards Institute American Society of Heating Refrigeration and Airshy conditioning Engineers Method of Testing Thermal Energy Meters for Liquid Streams in HVAC
Systems ANSIASHRAE 125-1992 Atlanta GA 1995
[5] CRC Press Handbook of Chemistry and Physics ndash 60th Edition CRC Press Inc Boca Raton Florida 1980
[6] American Society for Testing and Materials Standard Test Method for Analysis of Natural Gas by Gas Chromatography ASTM D1945-98 West Conshohocken PA 2001
[7] American Society for Testing and Materials Standard Practice for Calculating Heat Value Compressibility factor and Relative Density of Gaseous Fuels ASTM D3588-98 West Conshohocken PA 2001
[8] American Society for Testing and Materials Standard Practice for Determination of Sulfur Compounds in Natural Gas by Gas Chromatography and Chemiluminescense ASTM D5504-01 West Conshohocken PA 2001
[9] American National Standards Institute ANSI Institute of Electrical and Electronics Engineers IEEE Master Test Guide for Electrical Measurements in Power Circuits ANSIIEEE Std 120shy1989 New York NY October 1989
[10] American National Standards Institute ANSI Institute of Electrical and Electronics Engineers IEEE Recommended Practices and Requirements for Harmonic Control in Electrical Power Systems IEEE Std 519-1992 New York NY April 1993
[11] American National Standards Institute ANSI Institute of Electrical and Electronics Engineers National Standards for Electric Power Systems and Equipment - Voltage Ratings (Hertz) ANSI C841-1995 American National Standards Institute National Electrical Manufacturers Association Rosslyn VA 1996
[12] US Environmental Protection Agency Code of Federal Regulations Title 40 Part 60 New Source Performance Standards Appendix A US EPA Washington DC 1999
[13] Southern Research Institute Environmental Technology Verification Report Combined Heat and Power at a Commercial Supermarket ndash Capstone 60 kW Microturbine CHP System SRIUSEPA-GHG-QAP-27 wwwsri-rtpcom Greenhouse Gas Technology Center Southern Research Institute Research Triangle Park NC September 2003
[14] Southern Research Institute Environmental Technology Verification Report Residential Electric Power Generation Using the Plug Power SU1 Fuel Cell System SRIUSEPA-GHG-QAP-25 wwwsri-rtpcom Greenhouse Gas Technology Center Southern Research Institute Research Triangle Park NC September 2003
[15] Shigehara RT Measurement Uncertainty of Selected EPA Test Methods Emission Monitoring Inc Presented at Stationary Source Sampling and Analysis for Air Pollutants XXV Conference March 2001
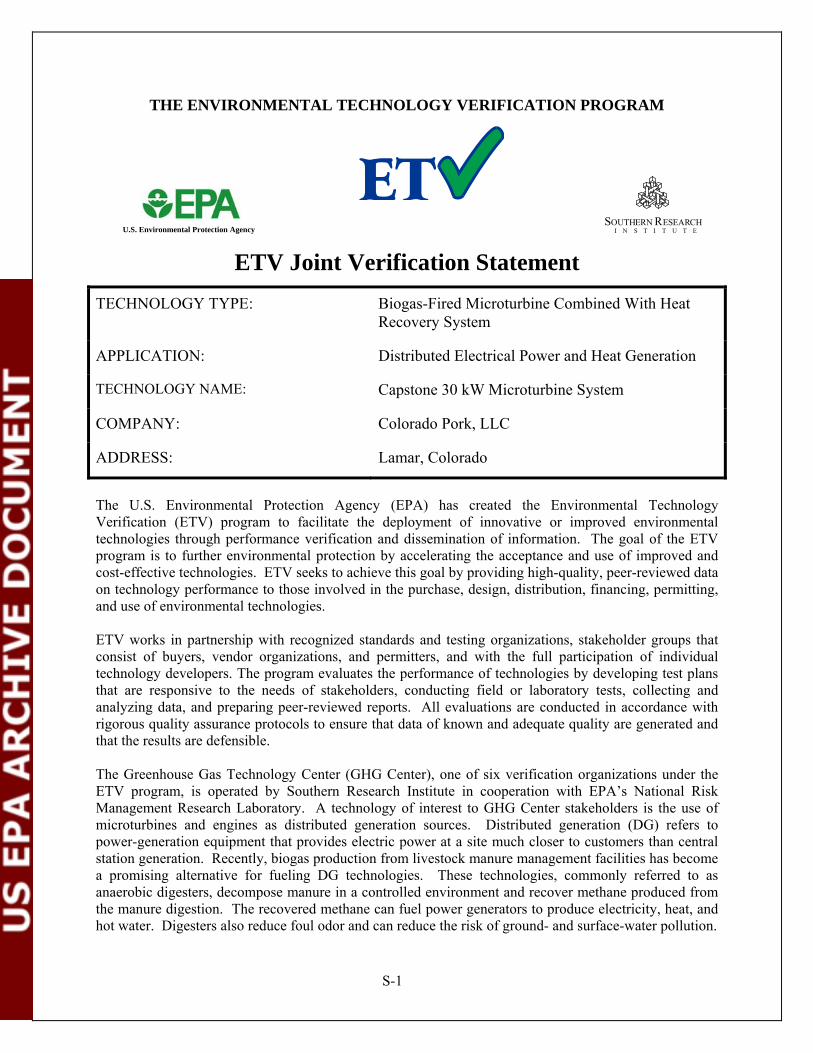
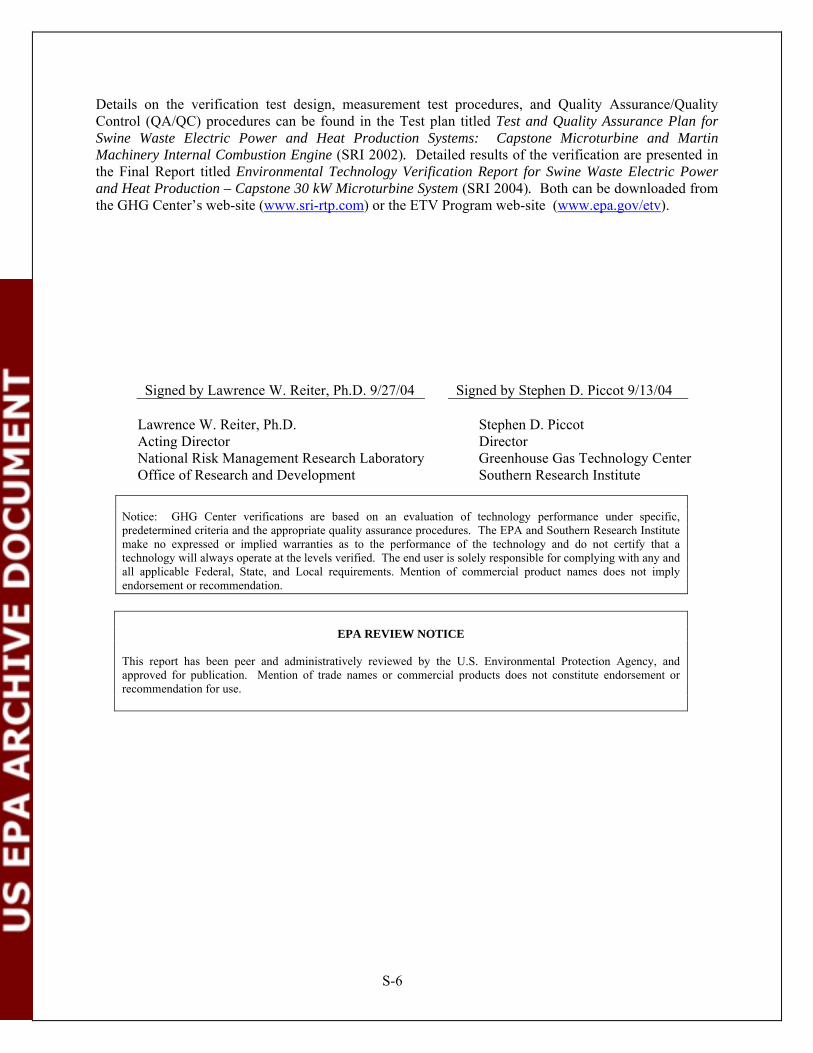

ACRONYMSABBREVIATIONS (continued)
QMP Quality Management Plan Rel Diff relative difference Report Environmental Technology Verification Report RH relative humidity rms root mean square rpm revolutions per minute RTD resistance temperature detector scf standard cubic feet scfh standard cubic feet per hour scfm standard cubic feet per minute Southern Southern Research Institute TampD transmission and distribution Test plan Test and Quality Assurance Plan THCs total hydrocarbons THD total harmonic distortion TSA technical systems audit US United States VAC volts alternating current
vi
10 INTRODUCTION
11 BACKGROUND
The US Environmental Protection Agencyrsquos Office of Research and Development (EPA-ORD) operates the Environmental Technology Verification (ETV) program to facilitate the deployment of innovative technologies through performance verification and information dissemination The goal of ETV is to further environmental protection by accelerating the acceptance and use of improved and innovative environmental technologies Congress funds ETV in response to the belief that there are many viable environmental technologies that are not being used for the lack of credible third-party performance data With performance data developed under this program technology buyers financiers and permitters in the United States and abroad will be better equipped to make informed decisions regarding environmental technology purchase and use
The Greenhouse Gas Technology Center (GHG Center) is one of six verification organizations operating under the ETV program The GHG Center is managed by EPArsquos partner verification organization Southern Research Institute (Southern) which conducts verification testing of promising greenhouse gas mitigation and monitoring technologies The GHG Centerrsquos verification process consists of developing verification protocols conducting field tests collecting and interpreting field and other data obtaining independent peer-reviewed input and reporting findings Performance evaluations are conducted according to externally reviewed verification Test and Quality Assurance Plans (test plan) and established protocols for quality assurance
The GHG Center is guided by volunteer groups of stakeholders These stakeholders guide the GHG Center on which technologies are most appropriate for testing help disseminate results and review Test plans and Technology Verification Reports (report) The GHG Centerrsquos Executive Stakeholder Group consists of national and international experts in the areas of climate science and environmental policy technology and regulation It also includes industry trade organizations environmental technology finance groups governmental organizations and other interested groups The GHG Centerrsquos activities are also guided by industry specific stakeholders who provide guidance on the verification testing strategy related to their area of expertise and peer-review key documents prepared by the GHG Center
A technology of interest to GHG Center stakeholders is the use of microturbines as a distributed generation source Distributed generation (DG) refers to power-generation equipment typically ranging from 5 to 1000 kilowatts (kW) that provide electric power at a site much closer to customers than central station generation A distributed power unit can be connected directly to the customer or to a utilityrsquos transmission and distribution system Examples of technologies available for DG include gas turbine generators internal combustion engine generators (eg gas diesel) photovoltaics wind turbines fuel cells and microturbines DG technologies provide customers one or more of the following main services stand-by generation (ie emergency backup power) peak shaving capability (generation during highshydemand periods) baseload generation (constant generation) or cogeneration combined heat and power (CHP) generation
Recently biogas production from livestock manure management facilities has become a promising alternative for fueling DG technologies EPA estimates US methane emissions from livestock manure management at 170 million tons carbon equivalent which accounts for 10 percent of total 1997 methane emissions The majority of methane emissions come from large swine and dairy farms that manage manure as slurry EPA expects US methane emissions from livestock manure to grow by over 25
1-1
percent from 2000 to 2020 Cost effective technologies are available that can stem this emission growth by recovering methane and using it as an energy source These technologies commonly referred to as anaerobic digesters decompose manure in a controlled environment and recover methane produced from the manure The recovered methane can fuel power generators to produce electricity heat and hot water Digesters also reduce foul odor and can reduce the risk of ground- and surface-water pollution
The GHG Center and the Colorado Governorrsquos Office of Energy Management and Conservation (OEMC) agreed to collaborate and share the cost of verifying two DG technologies that operate on biogas recovered from swine waste These verifications evaluated the performance of a microturbine combined heat and power (CHP) system offered by Capstone Turbine Corporation and an internal combustion (IC) engine CHP system offered by Martin Machinery Inc Both units are currently in operation at an anaerobic digestion facility managed by Colorado Pork LLC near Lamar Colorado This is the only swine farm in Colorado that is producing electrical power from animal waste The electricity is used by Colorado Pork to offset electricity purchases from the local electric cooperative Some of the recovered heat is used to control digester temperature which optimizes and enhances biogas production Both CHP systems are interconnected to the electric utility grid but excess power is not presently exported
The GHG Center evaluated the performance of the two CHP systems by conducting field tests over a fourteen-day verification period (February 2 ndash 15 2004) These tests were planned and executed by the GHG Center to independently verify the electricity generation and use rate thermal energy recovery rate electrical power quality energy efficiency emissions and greenhouse gas emission reductions for the Colorado Pork farm This verification statement and report provides the results of the Capstone 30 microturbine CHP performance evaluation Results of the testing conducted on the IC engine CHP system are reported in a separate report titled Environmental Technology Verification Report ndash Swine Waste Electric Power and Heat Production ndash Martin Machinery Internal Combustion Engine [1]
Details on the verification test design measurement test procedures and Quality AssuranceQuality Control (QAQC) procedures can be found in the test plan titled Test and Quality Assurance Plan ndash Swine Waste Electric Power and Heat Production Systems Capstone Microturbine and Martin Machinery Internal Combustion Engine [2] It can be downloaded from the GHG Centerrsquos web-site (wwwsrishyrtpcom) or the ETV Program web-site (wwwepagovetv) The Test plan describes the rationale for the experimental design the testing and instrument calibration procedures planned for use and specific QAQC goals and procedures The Test plan was reviewed and revised based on comments received from OEMC and the EPA Quality Assurance Team The Test plan meets the requirements of the GHG Centers Quality Management Plan (QMP) and satisfies the ETV QMP requirements Deviations from the Test plan were required in some cases These deviations and the alternative procedures selected for use were initially documented in Corrective Action Reports (CARs) and are discussed in this report
The remainder of Section 10 describes the microturbine CHP system technology and test facility and outlines the performance verification procedures that were followed Section 20 presents test results and Section 30 assesses the quality of the data obtained
12 COMBINED HEAT AND POWER TECHNOLOGY DESCRIPTION
The microturbine system verified at Colorado Pork consists of a Capstone Model 330 Microturbine and a Cain Industries heat-recovery system These primary system components are shown in separate photos in Figure 1-1 The CHP system also includes a CompAir gas compressor which is needed to boost the delivered gas pressure to about 100 psig Figure 1-2 illustrates a simplified process flow diagram of the microturbine CHP system at this site and a discussion of each component is provided below
1-2
Capstone 30 kW Microturbine Cain Industries Heat Recovery SystemCapstone 30 kW Microturbine Cain Industries Heat Recovery System
Figure 1-1 The Colorado Pork Capstone 330 Microturbine CHP System
Electric power is generated from a high-speed single-shaft recuperated air-cooled turbine generator with a nominal rated power output of 30 kW net (59 degF sea level) Table 1-1 provides Capstone 330 microturbine specifications The Capstone 330 is designed to operate on biogas and consists of an air compressor recuperator combustor turbine and a permanent magnet generator The recuperator is a heat exchanger that recovers some of the heat from the exhaust stream and transfers it to the incoming compressed air stream The preheated air is then mixed with the fuel and this compressed fuel and air mixture is burned in the combustor under constant pressure conditions The resulting hot gas is allowed to expand through the turbine section to perform work rotating the turbine blades to turn a generator which produces electricity The need for a gearbox and associated moving parts is eliminated because of the inverter-based electronics that enable the generator to operate at high speeds and frequencies The rotating components are mounted on a single shaft ndash supported by patented air bearings ndash that rotates at over 96000 revolutions per minute (rpm) at full load The exhaust gas exits the turbine and enters the recuperator which pre-heats the air entering the combustor to improve the efficiency of the system The exhaust gas then exits the recuperator and is directed to a heat-recovery unit
1-3
FuelGas Compressor
Capstone 330Microturbine Heat
Exchanger
480 220Volt Transformer
PrimaryDesiccant
Dryer
WaterKnock-
Out CanisterElectricChiller
Microturbine Exhaust
Hot Water Supply
Water Return
To Digester Heating Loop
To Engine Raw Biogas Input
(nominal 17 in wc) Utility Grid
Fuel Gas Compressor
Capstone 330 Microturbine Heat
Exchanger
480 220 Volt Transformer
Microturbine Exhaust
Hot WaterSupply
Water Return
To DigesterHeating Loop
To EngineRaw Biogas Input
(nominal 17 in wc)
Primary Desiccant
Dryer
Utility Grid
Water Knock-
Out Canister Electric Chiller
CHP SystemCHP SystemExhaustExhaust
Heat ExchangerHeat Exchanger
Figure 1-2 Colorado Pork Microturbine CHP System Process Diagram
The permanent magnet generator produces high-frequency alternating current which is rectified inverted and filtered by the line power unit into conditioned 480 volts alternating current (VAC) The unit supplies an electrical frequency of 60 hertz (Hz) and is supplied with a control system which allows for automatic and unattended operation An active filter in the generator is reported by the turbine manufacturer to provide power free of spikes and unwanted harmonics All operations including startup setting of programmable interlocks grid synchronization operational setting dispatch and shutdown can be performed manually or remotely using the internal power-controller system
The gas booster compressor is a CompAir Hydrovane Model 704PKGS with a nominal volume capacity of 48 standard cubic feet per minute (scfm) and the capability of compressing natural gas from inlet pressures ranging from 025 to 15 pounds per square inch gauge (psig) to outlet pressures of 60 to 100 psig The compressor is boosting gas pressure from approximately 1 to 100 psig in this application The compressor imposes a parasitic load of approximately 4 kW on the overall CHP system generating capacity
Figure 1-2 shows that waste heat from the microturbine exhaust at approximately 580 degF is recovered using a heat recovery and control system developed by Cain Industries It is a steel fin-and-tube Heat Recovery Silencer (HRS) radial heat exchanger and silencer (Model 112B28SSS) suitable for up to 700 degF exhaust gas Potable water is used as the heat-transfer media to recover energy from the microturbine exhaust gas stream The water is circulated at a rate of approximately 28 gallons per minute (gpm) A digital controller monitors the water outlet temperature and when the temperature exceeds user set point a damper automatically opens and allows the hot exhaust gas to bypass the heat exchanger and release the heat through the stack The damper allows hot gas to circulate through the heat exchanger when heat recovery is required (ie the water outlet temperature is less than user setpoint) This design allows the system to protect the heat recovery components from the full heat of the turbine exhaust while still maintaining full electrical generation from the microturbine
1-4
Table 1-1 Capstone Microturbine Model 330 Specifications (Source Capstone Microturbine Corporation Colorado Pork)
Dimensions Width Depth Height
281 in 529 in 748 in
Weight Microturbine only 1052 lb
Electrical inputs Power (startup) communications
Utility grid or black start battery Ethernet IP or modem
Electrical outputs Power at ISO conditions (59 oF sea level) 30 kW 400-480 VAC 5060 Hz 3-phase
Noiselevel Typical reported by Capstone 58 dBA at 33 ft Fuel pressure required
wo compressor w compressor
50 to 100 psig 5 to 15 psig
Fuel heat content Higher heating value 350 to 1200 Btuscf
Electrical performance at full load (landfill or digester gas)
Heat input Power output Efficiency - wo compressor Efficiency - w compressor Heat rate
378000 Btuhr LHV basis 30 kW plusmn1 kW 27 plusmn 2 ISO conditions LHV basis 26 plusmn 2 ISO conditions LHV basis 12600 BtukWh LHV basis
Heat recovery potential at full load
Exhaust gas temperature Exhaust energy available for heat recovery
500 oF 290000 Btuhr
Emissions (full load)
Nitrogen oxides (NOX) Carbon monoxide (CO) Total hydrocarbon (THCs)
lt 9 ppmv at 15 O2 lt 40 ppmv at 15 O2 lt 9 ppmv at 15 O2
13 TEST FACILITY DESCRIPTION
The Colorado Pork facility is a sow farrow-to-wean farm in Lamar Colorado that began operation in 1999 and houses up to 5000 sows The facility employs a complete mix anaerobic digester (Figure 1-3) to reduce odor and meet water quality regulations mandated by the Colorado Department of Public Health and Environment The anaerobic digester promotes bacterial decomposition of volatile solids in animal wastes The resulting effluent stream mostly consists of water which is allowed to evaporate from a secondary lagoon
Waste from the 5000 sows is collected in shallow pits below the slatted floors of the hog barns These pits are connected via sewer lines to an in-ground concrete holding tank (50000 gallon capacity) Each morning the pits are drained on a rotating basis to flush about 15000 gallons of waste to the holding tank The holding tank is equipped with a 17 horsepower (Hp) chopper pump that breaks up large pieces of waste Each morning about 15000 gallons of waste is pumped from the holding tank into the digester (requires approximately 20 minutes)
1-5
Figure 1-3 Colorado Pork Anaerobic Digester
The digester is a 70 x 80 x 14 foot deep in-ground concrete tank with a capacity of 500000 gallons The digester is equipped with two propeller type mixers on each end The mixers normally operate for 30 minutes daily to rejuvenate gas production that would otherwise decline between waste charging events Hot water is circulated through the digester using a matrix of 3-inch black steel pipe (total length of about 05 mile) to maintain the digester temperature at 100 degF Small adjustments to the water flow rate are required periodically and are conducted manually by the site operator The retention time in the digester is about 40 days
The effluent exits the digester over a weir and is directed gravimetrically to a lagoon for sludge settling and water evaporation The lagoon is designed to hold up to 20 years of sludge production Tests performed by environmental regulatory personnel have determined the site meets current odor and discharge requirements
The biogas produced from the decomposed waste is collected under a high-density polyethylene (HDPE) cover at a pressure of 15 to 20 inches water column A manifold collects the biogas and routes it to the engineturbine building A pressure relief valve senses pressure buildup when neither the engine nor turbine are operating and diverts the biogas to a flare The digester is currently producing about 20000 cubic feet of biogas per day The primary gas constituents of the raw biogas are CH4 (around 67) and CO2 (approximately 32) Analysis of samples collected at the site show hydrogen sulfide (H2S) concentrations in the gas ranging from 700 to 6800 parts per million (ppm) and averaging about 6000 ppm The gas also contains trace amounts of ammonia (NH3) mercaptans and other noxious gases and is saturated with water vapor The lower heating value (LHV) of the biogas is approximately 625 Btuscf
Figure 1-4 is a schematic of the waste-to-energy production process at Colorado Pork showing integration of the digester microturbine CHP and engine CHP In May 2000 the IC engine CHP system was installed first to offset electricity purchase costs The microturbine CHP system was installed in February 2002 to evaluate the feasibility and economics of the two different power generation technologies Both systems are currently housed in a building adjacent to the digester
1-6
AnaerobicDigester
Microturbine
Heat RecoveryUnit
IC Engine
Heat RecoveryUnit
With the microturbine CHP system the biogas is treated and compressed to produce high-pressure dry biogas for electricity production The site operator sets the heat recovery unit at 110 degF during normal operations Any unused heat is discarded automatically through the exhaust stack With the IC engine CHP system biogas is not pre-treated The IC enginersquos heat recovery system produces hot water at approximately 105 degF In the event this temperature exceeds 185 degF (ie during extremely hot summer days) an automatic valve is activated which discards some of the excess heat through a radiator The radiatorrsquos return water line is used to cool the engine water jacket and prevent overheating the engine
Raw Biogas (nominal 17 in wc
5 H2O)
Desiccant Dryer
Excess Heat
Radiator
Emissions to Atmosphere
Hot Exhaust
Emissions to Atmosphere
Hot Exhaust
Compressor
Knockout And chiller
Treated Biogas (nominal 55 psig dry)
Waste from holding tank 15000 gallons
per day
Effluent to lagoon If water temperature at this
point is gt185oF then valve is opened to reject heat and cool
engine water jacket
If water temperature at this point is gt105oF then valve is
opened to divert hot water from entering digester loop
Cool Water
Hot Water
Biogas
Raw Biogas(nominal 17 in wc
5 H2O)
DesiccantDryer
ExcessHeat
Radiator
Emissions toAtmosphere
Ho
Anaerobic Digester
Microturbine
Heat Recovery Unit
IC Engine
Heat Recovery Unit
t Exhaust
Emissions toAtmosphere
Hot Exhaust
Compressor
KnockoutAnd chiller
Treated Biogas(nominal 55 psig dry)
Waste from holdingtank 15000 gallons
per day
Effluent to lagoonIf water temperature at this
point is gt185oF then valve isopened to reject heat and cool
engine water jacket
If water temperature at thispoint is gt105oF then valve is
opened to divert hot waterfrom entering digester loop
Cool Water
Hot Water
Biogas
Cool WaterCool Water
Hot WaterHot Water
Biogas
Figure 1-4 Colorado Pork Waste-to-Energy Process Diagram
The IC engine hot water line combines with the microturbine hot water line and the mixture is circulated through the waste in the digester to maintain the digester temperature at 100 degF Cool water returning from the digester remains relatively constant throughout the year (approximately 100 degF) A temperature sensor continuously monitors this temperature and in the event this temperature exceeds 105 degF an automated mixing valve reduces the flow of hot water entering the digester This adjustment is performed only a few times per year as digester temperatures remain relatively stable
Typically the engine is run at 45 kW and switched to run on natural gas overnight to avoid reducing biogas pressure and collapsing the digester cover When the microturbine is used it can be run on biogas continuously The system is fully grid parallel When power demand of the farm operations exceed the available capacity of the power generation systems power is drawn from the utility grid Colorado Pork purchases electricity from the Southeast Colorado Power Association a rural electric cooperative
14 PERFORMANCE VERIFICATION OVERVIEW
This verification test was designed to evaluate the performance of the microturbine CHP systemmdashnot the overall system integration or specific management strategy The test plan specified a series of controlled test periods in which the GHG Center intentionally modulated the unit to produce electricity at nominal
1-7
power output commands of 15 20 24 and 30 kW Three replicate test runs were conducted at each of these power commands These tests are identified herein as controlled test periods During these controlled test periods the engine was shut down to make maximize biogas availability
Originally the test plan specified that these tests would be conducted with the heat recovery potential maximized by increasing the hot water supply temperature from the heat recovery unit to approximately 125 oF However changes in CHP system operations at the farm have occurred since development of the test plan Specifically hot water supply temperatures are controlled at about 105 oF to maintain the optimum digester temperature of approximately 100 oF It was not possible during the verification testing to reach the supply temperatures originally proposed without adversely affecting digester operations All of the heat generated by the heat recovery unit was being used to warm the digester These test conditions represent normal site operations with the amount of biogas currently available and the maximum achievable heat recovery rate for this application (that is heat is only recovered and used to maintain the optimum digester temperature)
The test plan also specified that the controlled test periods would be followed by a 1-week period of extended monitoring to evaluate power and heat production and power quality over a range of ambient conditions and farm operations However numerous delays and false starts to this test program caused by problems with microturbine operations (primarily gas compressor functionality) produced serious scheduling conflicts for the GHG Centerrsquos operations In response to this the center was forced to deviate from the test plan on this monitoring After consultation with the GHG QA manager and the GHG Center director it was decided to conduct an abbreviated evaluation of power and heat production and power quality using data collected continuously over a limited time period of 35 hours This 35-hour period includes the controlled test periods
The specific verification parameters associated with the test are listed below Brief discussions of each verification parameter and its method of determination are presented in Sections 141 through 145 Detailed descriptions of testing and analysis methods are not provided here but can be found in the test plan
Heat and Power Production Performance bull Electrical power output and heat recovery rate at selected loads bull Electrical thermal and total system efficiency at selected loads
Power Quality Performance bull Electrical frequency bull Voltage output bull Power factor bull Voltage and current total harmonic distortion
Emissions Performance bull Nitrogen oxides (NOX) carbon monoxide (CO) total hydrocarbons (THC)
ammonia (NH3) total reduced sulfur (TRS) total particulate matter (TPM) carbon dioxide (CO2) and methane (CH4) concentrations at selected loads
bull NOX CO THC NH3 TRS TPM CO2 and CH4 emission rates at selected loads
Each of the verification parameters listed were evaluated during the controlled or continuous monitoring periods as summarized in Table 1-2 This table also specifies the dates and time periods during which the testing was conducted
1-8
Table 1-2 Controlled and Continuous Test Periods
Controlled Test Periods Start Date
Time End Date
Time Test Condition Verification Parameters Evaluated
021404 0926 021404 1645 Power command of 30 kW three 30-minute test runs (120 minutes for TPM and NH3)
NOX CO SO2 THC TRS TPM NH3 CH4 CO2 emissions and electrical thermal and total efficiency
021404 1653 021404 1823 Power command of 24 kW three 30-minute test runs NOX CO SO2 THC TRS CH4 CO2 emissions and electrical thermal and total efficiency
021504 1000 021504 1130 Power command of 20 kW three 30-minute test runs
021504 1200 021504 1330 Power command of 15 kW three 30-minute test runs
Continuous Test Period Start Date Time End Date Time Verification Parameters Evaluated
021404 1130 021504 2226 Power and heat generation rate and power quality
Simultaneous monitoring for power output heat recovery rate heat input ambient meteorological conditions and exhaust emissions were performed during each of the controlled test periods Manual samples of biogas were collected to determine fuel lower heating value and other gas properties Replicate and average electrical power output heat recovery rate energy conversion efficiency (electrical thermal and total) and exhaust stack emission rates are reported for each test period
Results from the continuous monitoring period are used to report the average power and heat production rate during normal facility operations and power quality performance
141 Heat and Power Production Performance
Electrical efficiency determination was based upon guidelines listed in ASME Performance Test Code for Gas Turbines (PTC-22) [3] and was calculated using the average measured net power output fuel flow rate and fuel lower heating value (LHV) during each controlled test period PTC-22 specifies that test runs be over time intervals of not less than 4 minutes and not greater than 30 minutes to compute electrical efficiency
These restrictions minimize electrical efficiency determination uncertainties due to changes in operating conditions (eg turbine or engine speed ambient conditions) Within this time period PTC-22 specifies the maximum permissible limits in power output fuel input atmospheric conditions and other parameters to be less than the values shown in Table 3-4 The CHP system has one primary internal parasitic load at this facility ndash the gas-pressure booster compressor which is rated to draw about 4 kW The water fluid circulation pump also introduces a small internal parasitic load (approximately 500 watts) The chiller used to help in biogas moisture removal also draws about 500 watts but this parasitic load is external to the CHP system This verification did not include separate measurement of these parasitic loads and therefore reports the net system power output and efficiency (based on the usable power delivered by the system) Comparison of the net power output measured by the GHG Center and
1-9
the microturbinersquos indicated power output (gross power generated is displayed on the control panel) however confirms that the parasitic load was approximately 45 kW during all test periods
The electrical power output (in kW) was measured continuously throughout the verification period with a 7500 ION Power Meter (Power Measurements Ltd) and logged on the Centers data acquisition system (DAS) as 1-minute averages Biogas fuel input was determined by recording manual meter readings during each of the controlled test periods The biogas used to fuel the microturbine is metered on a wet basis but fired on a dry basis after moisture removal and compression Measured biogas flow to the microturbine was corrected for moisture content as well as temperature and pressure to determine fuel consumption as dry standard cubic feet per hour (scfh)
Fuel gas sampling and energy content analysis (via gas chromatograph) was conducted according to ASTM procedures to determine the lower heating value of the biogas Ambient temperature relative humidity and barometric pressure were measured near the turbine air inlet to support the determination of electrical conversion efficiency as specified in PTC-22 Electricity conversion efficiency was computed by dividing the average electrical energy output by the average energy input using Equation 1
η =341214 kW (Equation 1)
HI
where
η = efficiency () kW = average net electrical power output measured over the test interval (kW)
(Capstone 330 power output minus power consumed by gas compressor and water circulation pump)
HI = average heat input using LHV over the test interval (Btuhr) determined by multiplying the average mass flow rate of biogas to the system converted to standard cubic feet per hour (scfh) times the gas LHV (Btu per standard cubic foot Btuscf)
341214 = converts kW to Btuhr
Simultaneous with electrical power measurements heat recovery rate was measured using a heat meter (Controlotron Model 1010EP) The meter enabled 1-minute averages of differential heat exchanger temperatures and water flow rates to be monitored Published fluid density and specific heat values for water were used so that heat recovery rates could be calculated at actual conditions per ANSIASHRAE Standard 125 [4]
Heat Recovery Rate (Btumin) = Vρ Cp (T1-T2) (Equation 2)
where
V = total volume of liquid passing through the heat meter flow sensor during a minute (ft3) ρ = density of water solution (lbft3) evaluated at the avg temp (T2 plus T1)2 Cp = specific heat of water solution (Btulb oF) evaluated at the avg temp (T2 plus T1)2 T1 = temperature of heated liquid exiting heat exchanger (oF) (see Figure 1-4) T2 = temperature of cooled liquid entering heat exchanger (oF) (see Figure 1-4)
The average heat recovery rates measured during the controlled tests and the continuous monitoring period represent the heat recovery performance of the CHP system Thermal energy conversion efficiency was computed as the average heat recovered divided by the average energy input
1-10
ηT = 60 Qavg HI (Equation 3)
where
ηT = thermal efficiency () Qavg = average heat recovered (Btumin) HI = average heat input using LHV (Btuhr) determined by multiplying the average mass
flow rate of biogas to the system (converted to scfh) times the gas LHV (Btuscf)
Figure 1-5 illustrates the location of measurement variables contained in Equations 1 through 3 Power output was measured using a 7500 ION Power Meter (Power Measurements Ltd) at a rate of approximately one reading every 8 to 12 milliseconds and logged on the centers data acquisition system (DAS) as 1-minute averages The power meter was located in the main switchbox connecting the electrical output of the CHP system to the host site This location represented net power delivered to the farm after internal parasitic loads The logged one-minute average power output (kW) readings were averaged over the duration of each controlled test period for use in computing electrical efficiency The kW readings were integrated over the duration of the 35-hour verification period to calculate total electrical energy generated in units of kilowatt hours (kWh)
Biogas fuel input was measured with an in-line Dresser-Roots Series B Model 3M175 rotary displacement meter Meter readings were recorded manually at 10-minute intervals during the controlled test periods Gas temperature and pressure sensors were installed to enable flow rate compensation to provide mass flow output at standard conditions (60 oF 14696 psia)
The biogas flow rates metered on a wet basis were corrected to dry basis to represent the volume of gas actually consumed by the microturbine Biogas moisture content was determined for each controlled test run using the average measured biogas temperature and pressure and the published partial pressure of saturated gas [5] It was then assumed that the biogas as fired was dry (after the 3-stage moisture removal system and compression to 100 psig) Dry biogas flow rate was then calculated as
Vd = Vw (1- Bw) (Equation 4)
where
Vd = biogas volume wet basis (dscf) Vw = biogas volume dry basis (wscf) Bw = biogas moisture content ()
The TQAP specified a stain tube method of moisture determination that has an estimated 25 percent uncertainty However the GHG Center has learned on similar verifications conducted since the TQAP was written that the approach used here is more reliable and has less uncertainty than the stain tube procedure
1-11
Gas Dryers and Compressor
Capstone 330Microturbine Heat
Exchanger
480 208Volt Transformer
DC
A
B
EI
J
G
H
F
D
C
A
B I
J
HE
F
G
480 208Volt Transformer
DC
A
B
EI
J
G
H
F
D
C
A
B
D
C
A
B
D
C
A
B I
J
HE
F
G
EE
CHP SystemCHP SystemAir IntakeAir Intake ExhausEx thaust
Raw Biogas Utility GridRaw Biogas Utility GridInputInput
Measurement LocationsMeasurement Locations
D
C
A
B
Power ProductionPower ProductioPoPo nwer Productionwer ProductionE
F
G
I
J
H Water SupplyWWater Supplyater SupplyFuel Gas PressureFuel Gas PressureFFFuel Gas Pressureuel Gas Pressureuel Gas Pressure (T1)(T(T1)1)And Power Quality (kW)A ower Quality (kAAnd P W)nd Power Qualitynd Power Quality (kW) TemperatureTeTemperaturemperature
MeasurementsMeasurementsFuel Gas FlowFuel Gas FlowFuFuFuel Gas Flowel Gas Flowel Gas Flow Water ReturnWater ReturWatWat ner Returner ReturnAmbient TemperatureAAmbient Temperaturembient Temperature (T2)(T2(T(T )2)2)for heat inputfor heat input TemperatureTemperatTeTe uremperaturemperaturePressure and HumidityPPressure and Humidityressure and HumidityGas Samples for LHVGas Samples for LHVGasGasGas Samples for LHVSamples for LHVSamples for LHV (HI(H )I)
Emissions TestingEEmissions Testingmissions TestingWater Circulation (V)WWater Circulation (V)ater Circulation (V)Fuel Gas TemperatureFuel Gas TemperatureFFFuel Gas Temperatureuel Gas Temperatureuel Gas Temperature RateRaRatete
Microturbine Exhaust
Hot Water Supply
Water Return
Digester Heating Loop
Engine Heat Exchanger
System Boundary
Gas Dryers and Compressor
Capstone 330 Microturbine Heat
Exchanger
480 208 Volt Transformer
Microturbine Exhaust
Hot WaterSupply
Water Return
DigesterHeating Loop
EngineHeat Exchanger
DigesterHeating Loop
EngineHeat Exchanger
D C
A
B
JF
System Boundary
E I
G
H
Figure 1-5 Schematic of Measurement System
A total of six biogas samples were collected and analyzed during the controlled test periods to determine gas composition and heating value Samples were collected at a point in the biogas delivery line downstream of the meter but upstream of the gas drying system and compressor due to sampling restrictions (high gas pressure and the absence of sampling ports) The samples were submitted to Empact Analytical Systems Inc of Brighton CO for compositional analysis in accordance with ASTM Specification D1945 for quantification of methane (C1) to hexane plus (C6+) nitrogen oxygen and carbon dioxide [6] The compositional data were then used in conjunction with ASTM Specification D3588 to calculate LHV and the relative density of the gas [7]
In addition to the ASTM D1945 compositional analyses ASTM Method 5504 provided an extended analysis to quantify biogas concentrations of H2S [8] This method is essentially an extension of the ASTM D1945 procedures that uses additional chromatographic columns to separate H2S and heavier hydrocarbons
1-12
A Controlotron Model 1010EP1 energy meter was used to monitor water flow and supply and return temperatures This meter is a digitally integrated system that includes a portable computer ultrasonic fluid flow transmitters and 1000-ohm platinum resistance temperature detectors (RTDs) The meter has an overall rated accuracy of plusmn 2 percent of reading and provides a continuous 4-20 mA output signal over a selectable range The meter was installed in the 1-12-inch carbon steel water supply line
The water flow rate and supply and return temperature data used to determine heat recovery rates were logged as one-minute averages throughout all test periods The heat transfer fluid density and specific heat were determined by using ASHRAE and ASME density and specific heat values for water corrected to the average water temperature measured by the RTDs
142 Power Quality Performance
The GHG Center and its stakeholders developed the following power quality evaluation approach to account for these issues Three documents [9 10 11] formed the basis for selecting the power quality parameters of interest and the measurement methods used The GHG Center measured and recorded the following power quality parameters during the continuous monitoring period
bull Electrical frequency bull Voltage bull Voltage THD bull Current THD bull Power factor
The 7500 ION power meter used for power output determinations was used to perform these measurements as described below and detailed in the test plan The ION power meter continuously measured electrical frequency at the generatorrsquos distribution panel and the DAS was used to record oneshyminute averages throughout the verification The mean maximum and minimum frequencies as well as the standard deviation are reported
The CHP unit generates power at nominal 480 volts (AC) The electric power industry accepts that voltage output can vary within plusmn 10 percent of the standard voltage (480 volts) without causing significant disturbances to the operation of most end-use equipment [11] Deviations from this range are often used to quantify voltage sags and surges The ION power meter continuously measured true root mean square (rms) line-to-line voltage at the generatorrsquos distribution panel for each phase pair True rms voltage readings provide the most accurate representation of AC voltages The DAS recorded one-minute averages for each phase pair throughout the monitoring period as well as the average of the three phases The mean maximum and minimum voltages as well as the standard deviation for the average of the three phases are reported
THD is created by the operation of non-linear loads Harmonic distortion can damage or disrupt many kinds of industrial and commercial equipment Voltage harmonic distortion is any deviation from the pure AC voltage sine waveform THD gives a useful summary view of the generatorrsquos overall voltage quality The specified value for total voltage harmonic is a maximum THD of 50 percent based on ldquorecommended practices for individual customersrdquo in the IEEE 519 Standard The ION meter continuously measured voltage THD up to the 63rd harmonic for each phase The DAS recorded oneshyminute voltage THD averages for each phase throughout the test period and reported the mean minimum maximum and standard deviation for the average THD for the three phases
1-13
Current THD is any distortion of the pure current AC sine waveform The current THD limits recommended in the IEEE 519 standard range from 50 to 200 percent depending on the size of the CHP generator the test facilityrsquos demand and its distribution network design as compared to the capacity of the local utility grid Detailed analysis of the facilityrsquos distribution network and the local grid are beyond the scope of this verification The GHG Center therefore reported current THD data without reference to a particular recommended THD limit The ION power meter as with voltage THD continuously measured current THD for each phase and reported the average minimum and maximum values for the period
The ION power meter also continuously measured average power factor across each generator phase The DAS recorded one-minute averages for each phase during all test periods The GHG Center reported maximum minimum mean and standard deviation power factors averaged over all three phases
143 Emissions Performance
Pollutant concentration and emission rate measurements for NOX CO THCs SO2 TRS CH4 and CO2 were conducted on the turbine exhaust stack during all of the controlled test periods Testing for determination of TPM and NH3 was conducted at full load only Emissions testing coincided with the efficiency determinations described earlier The test procedures used are US EPA reference methods which are well documented in the Code of Federal Regulations (CFR) The reference methods include procedures for selecting measurement system performance specifications and test procedures quality control procedures and emission calculations (40CFR60 Appendix A) [12] Table 1-3 summarizes the standard test methods that were followed A complete discussion of the data quality requirements for example NOX analyzer interference test nitrogen dioxide [NO2] converter efficiency test sampling system bias and drift tests is presented in the test plan
Table 1-3 Summary of Emissions Testing Methods
Pollutant EPA Reference Method Analyzer Type Range
NOX 7E California Analytical Instruments (CAI) 400-CLD (chemiluminescense) 0 ndash 50 ppm
CO 10 TEI Model 48 (NDIR) 0 - 300 ppm
SO2 6C Bovar 721-AT (NDUV) 0 ndash 300 ppm
THC 25A California Analytical Instruments (FID) 0 ndash 300 ppm
CH4 18 Hewlett-Packard 5890 GCFID 0 - 300 ppm
CO2 3A CAI 200 (NDIR) 0 ndash 25
O2 3A CAI 200 (electrochemical) 0 ndash 25
TRS EPA 16A Ametek 921 White Cell (NDUV) 0 - 25 ppm
NH3 BAAQMD ST-1B Ion Specific Electrode Not specified
TPM EPA 5 Gravimetric Not specified
1-14
Emissions testing was conducted by Cubix Corporation of Austin Texas under the on-site supervision of the GHG Center field team leader A detailed description of the sampling system used for each parameter listed is provided in the test plan and is not repeated in this report Sampling was conducted during each test for approximately 30 minutes at a single point near the center of the 10-inch diameter stack Results of the gaseous pollutant testing are reported in units of parts per million volume dry (ppmvd) and ppmvd corrected to 15-percent O2 Concentrations of TPM are reported in units of grains per standard cubic foot (grdscf)
To convert measured pollutant concentrations to mass emissions exhaust gas flow rate determinations were conducted during each test run in accordance with EPA Method 2C Stack gas velocity and temperature traverses were conducted using a calibrated thermocouple a standard pitot tube and an inclined oil manometer The number and location of traverse points sampled was selected in accordance with EPA Method 1 At the conclusion of each test run equations specified in the reference methods were used to calculate exhaust gas velocity actual volumetric flow rate and volumetric flow rate at standard conditions
After converting measured pollutant concentrations to mass units of lbdscf emission rate values were calculated in units of lbhr using the standardized volumetric flow rates The mean of the three test results at each load factor is reported as the average emission rate for that load factor Emission rates for each pollutant are then normalized to system power and reported in terms of lbkWh
144 Estimated Annual Emission Reductions
The electric energy generated by the microturbine offsets electricity otherwise supplied by the utility grid Consequently the reduction in electricity demand from the grid caused by this offset will result in changes in CO2 and NOX emissions associated with producing an equivalent amount of electricity at central power plants If the CHP emissions per kWh are less than the emissions per kWh produced by an electric utility it can be inferred that a net reduction in emissions will occur at the site If the emissions from the on-site generators are greater than the emissions from the grid possibly due to the use of higher efficiency power generation equipment or zero emissions generating technologies (nuclear and hydroelectric) at the power plants a net increase in emissions may occur
The test plan included a detailed approach for estimating the emission reductions that this CHP system can provide Briefly the proposed approach estimated the annual microturbine NOX and CO2 emissions using the emission rates measured during the full load testing and the average generating rate measured during an extended test period The estimated annual CHP emissions could then be calculated in units of tons per year and compared to average emission rates published by the Energy Information Administration (EIA) for the US and Colorado The proposed approach did not include emission reductions associated with heat recovery as this process requires baseline GHG emission assessment from standard waste management practices Due to the significant resources required to do this OEMC elected to verify emission reductions from electricity generation only
Due to the cancellation of the extended test period estimation of annual power production CHP emissions could not be completed For this reason results of the microturbine CHP testing only provide measured emission rates A simple comparison of these emission rates for NOX and CO2 to the US and Colorado regional fossil fuel emission factors is all that the GHG Center can report here with the limited data set collected during this verification
1-15
20 VERIFICATION RESULTS
21 OVERVIEW
The verification testing was conducted on February 14 and 15 2004 This included the controlled tests at the four operating loads and the abbreviated continuous monitoring period to examine heat and power output and power quality The GHG Center acquired several types of data that represent the basis of verification results presented here The following types of data were collected and analyzed during the verification
bull Continuous measurements (biogas pressure biogas temperature power output and quality heat recovery rate and ambient conditions)
bull Manual biogas flow meter readings bull Biogas compositional data bull Emissions testing data bull CHP and facility operating data
The field team leader reviewed verified and validated some data such as DAS file data and reasonableness checks while on site The team leader reviewed collected data for reasonableness and completeness in the field The data from each of the controlled test periods was reviewed on site to verify that PTC-22 variability criteria were met The emissions testing data was validated by reviewing instrument and system calibration data and ensuring that those and other reference method criteria were met Factory calibrations for fuel flow pressure temperature electrical and thermal power output and ambient monitoring instrumentation were reviewed on site to validate instrument functionality Other data such as biogas analysis results were reviewed verified and validated after testing had ended All collected data was classed as either valid suspect or invalid upon review using the QAQC criteria specified in the test plan Review criteria are in the form of factory and on-site calibrations maximum calibration and other errors audit gas analyses results and lab repeatability results Results presented here are based on measurements which met the specified Data Quality Indicators (DQIs) and QC checks and were validated by the GHG Center
With the exception of the reduced load test conditions the microturbine CHP performance data collected during the 35-hour verification period are representative of normal site operations Due to the cancellation of the extended monitoring period the GHG Center was unable to obtain a reasonable set of data to examine daily trends in atmospheric conditions and their impact on electricity and heat production It should be noted that the results presented here may not represent performance over longer operating periods or at significantly different operating conditions
Test results are presented in the following subsections
Section 21 ndash Heat and Power Production Performance (controlled testing and monitoring period)
Section 22 ndash Power Quality Performance (continuous monitoring)
Section 23 ndash Emissions Performance and Reductions (controlled test periods)
2-1
The results show that the quality of power generated by the CHP system is generally high and that the unit is capable of operating in parallel with the utility grid The unit produced between 19 and 24 kW of net electrical power depending on ambient temperature (35 to 60 oF) during the monitoring period The highest heat recovery rate measured during the extended monitoring period was approximately 138 x 103Btuhr Electrical and thermal efficiencies at full power averaged 204 and 333 percent respectively with a corresponding total CHP system efficiency of 537 percent NOX emissions were very low at full load averaging 18 ppmvd at 15 O2 and 82 x 10 ndash 5 lbkWh
In support of the data analyses the GHG Center conducted an audit of data quality (ADQ) following procedures specified in the QMP A full assessment of the quality of data collected throughout the verification period is provided in Section 30 The data quality assessment was used to demonstrate that the data quality objectives (DQOs) introduced in the test plan were met for this verification
22 HEAT AND POWER PRODUCTION PERFORMANCE
The heat and power production performance evaluation included electrical power output heat recovery and CHP efficiency determinations during controlled test periods The performance evaluation also included determination of total electrical energy generated and used and thermal energy recovered over the continuous monitoring period
221 Electrical Power Output Heat Recovery Rate and Efficiency During Controlled Tests
Table 2-1 summarizes the power output heat recovery rate and efficiency performance of the CHP system Ambient temperature ranged from 45 to 58 oF relative humidity ranged from 23 to 41 percent and barometric pressure was between 1269 and 1271 psia during the controlled test periods The results shown in Table 2-1 and the discussion that follows are representative of conditions encountered at this site and are not intended to indicate performance at other operating conditions such as cooler temperatures and different elevations Biogas fuel conditions and heat recovery unit operation data corresponding to the test results are summarized in Table 2-2
Biogas fuel conditions and heat recovery unit operation data corresponding to the test results are summarized in Table 2-2 A total of 12 samples were collected for compositional analysis and determination of LHV There was very little variability in the biogas composition Average biogas CH4 and CO2 concentrations were 681 and 312 percent respectively The average LHV was 625 Btuscf and biogas compressibility averaged 0997 H2S concentrations in the biogas averaged 3730 ppm
The average net electrical power delivered to the farm was 199 kWe at full load The average electrical efficiency corresponding to these measurements was 204 percent Electrical efficiencies at the 24 20 and 15 kW power commands averaged 203 186 and 157 percent respectively Electric power generation heat rate which is an industry-accepted term to characterize the ratio of heat input to electrical power output averaged 16726 BtukWhe at full power
The average heat-recovery rate at full power was 111 x 103 Btuhr or 324 kWthhr and thermal efficiency was 333 percent The average total efficiency (electrical and thermal combined) was 537 percent for the three test runs The net heat rate which includes energy from heat recovery was 6354 BtukWht
2-2
Table 2-1 Microturbine Heat and Power Production Performance
Test ID Test
Condition
Heat Input HI
(103Btuhr)
Electrical Power Generation Performance
Heat Recovery Performance Total CHP
System Efficiency
()
Ambient Conditions c
Power Delivered a
(kWe)
Efficiency ()
Heat Recovery
Rate b
(103Btuhr)
Thermal Efficiency
() Temp (oF) RH ()
Run 1 Run 2 Run 3
Avg
30 kW power command
330 336 330
332
197 201 198
199
204 204 204
204
113 105 113
111
344 314 341
333
548 518 545
537
554 584 568
569
261 241 245
249 Run 4 Run 5 Run 6
Avg
24 kW power command
323 324 322
323
192 193 193
193
203 203 204
203
111 117 119
116
343 361 371
358
546 564 575
562
563 531 497
530
234 259 294
262 Run 7 Run 8 Run 9
Avg
20 kW power command
279 274 274
276
150 150 150
150
183 187 187
186
110 108 106
108
394 396 385
392
577 583 572
577
450 461 476
462
411 398 380
396 Run 10 Run 11 Run 12
Avg
15 kW power command
221 220 219
220
101 101 102
101
156 157 158
157
935 978 996
969
424 444 454
441
580 602 612
598
506 508 506
506
346 349 352
349
a Represents actual power available for consumption at the test site b Divide by 3412 to convert to equivalent kilowatts (kWth) c Barometric pressure was within the range of 1269 to 1271 psia throughout the test period
2-3
Table 2-2 Fuel Input and Heat Recovery Unit Operating Conditions
Test ID Test
Condition
Biogas Fuel Input Heating Loop Fluid Conditions
Gas Flow Rate (scfm)
LHV (Btuscf)
Gas Pressure
(psia)
Gas Temp (oF)
Fluid Flow Rate V (gpm)
Outlet Temp T1
(oF)
Inlet Temp T2
(oF)
Temp Diff (oF)
Run 1 Run 2 Run 3
Avg
30 kW power command
876 891 877
881 6276a
1389 1385 1383
1386
945 966 968
959
283 284 284
284
1013 1008 1008
1010
932 933 928
931
81 75 80
79 Run 4 Run 5 Run 6
Avg
24 kW power command
859 860 855
858
1384 1384 1385
1384
958 947 927
944
284 283 284
284
1011 1012 1008
1010
933 929 923
928
79 83 85
82 Run 7 Run 8 Run 9
Avg
20 kW power command
735 721 723
726 6325b
1396 1395 1395
1395
881 891 900
891
285 284 284
284
969 973 975
976
891 896 900
896
78 77 75
77 Run 10 Run 11 Run 12
Avg
15 kW power command
581 580 578
580
1397 1397 1394
1396
935 947 949
944
284 284 284
284
973 978 979
977
906 908 909
908
66 70 71
69 a Average of three separate samples collected on February 14 2004 b Average of three separate samples collected on February 15 2004
2-4
0
5
10
15
20
25
30
35
40
45
50
Effic
ienc
y (
)
0
5
10
15
20
25
Pow
er O
utpu
t(kW
)
30 kW Power Command 20 kW Power 15 kW Power Command24 kW Power
Power Output
ElectricalEfficiency
ThermalEfficiency
Results of the reduced load tests are also included in the tables Results show that electrical efficiency decreases slightly as the power output is reduced Thermal efficiency however increases as power output (and biogas consumption) decreases These trends are illustrated in Figure 2-1 which displays the electrical and thermal CHP system efficiency at each of the controlled test conditions
CommandCommand
0
5
10
15
20
25
30
35
40
45
50
Effic
ienc
y (
)
0
5
10
15
20
25
Pow
er O
utpu
t (kW
)
30 kW Power Command 20 kW Power Command
15 kW Power Command24 kW Power Command
Power Output
Electrical Efficiency
Thermal Efficiency
Figure 2-1 Electrical and Thermal Efficiency During Controlled Test Periods
As expected the high altitude of the test location (approximately 3700 feet above sea level) derated microturbine power output Table 2-1 and Figure 2-1 show that the power delivered at full load (after parasitic loads) was only 199 kW Power delivered at the 24 kW power command was nearly the same at 193 kW
222 Electrical and Thermal Energy Production During the Continuous Monitoring Period
Figure 2-2 presents a time series plot of power production and heat recovery during the abbreviated 35shyhour monitoring period The system was operated continuously at a power command of 30 kW except for periods when reduced load tests were conducted The CHP system was operated under typical farm conditions with the engine shut down and the heat recovery system configured to maintain digester temperature at around 100 oF A total of 6834 kWhe electricity and 1025 kWhth of thermal energy were generated over the 35-hour operating period The average power generated over the continuous monitoring period (excluding the reduced load testing) was 206 kWe and the average heat recovery rate was 1177 x 103 Btuhr
2-5
0
5
10
15
20
25
30Po
wer
Out
put (
kW)
70
90
110
130
150
170
Heat
Rec
over
y R
ate
(10
3 Btu
hr)
35 Consecutive Hours of Monitorin
Power Output
HeatRecoveryRate
Reduced LoadControlled TestPeriods
g 0
5
10
15
20
25
30Po
wer
Out
put (
kW)
70
90
110
130
150
170
Heat
Rec
over
y R
ate
(10
3 Btu
hr)
35 Consecutive Hours of Monitoringg35 Consecutive Hours of Monitorin
Power Output
Heat Recovery Rate
Reduced Load Controlled Test Periods
21404 21504221404 215041404 215041130 2230111130 223030 2230
Figure 2-2 Heat and Power Production During the Monitoring Period
The power output trace shows periodic trips at intervals of approximately four hours This was caused by the manner in which the facility was operating the biogas compressor To prevent damage to the compressor caused by moisture buildup in the condensate trap the trap was configured to automatically open momentarily to drain every four hours This caused a brief loss of fuel pressure thereby causing the microturbine to trip and restart The entire sequence normally took about 4 minutes to complete and in most cases the turbine was back to full power in 4 minutes The farm reports that the microturbine is no longer operated in this way
As is typical for gas fired turbines power output was also affected by ambient temperature The impact of temperature on this turbine is illustrated in Figures 2-3 and 2-4
2-6
0
5
10
15
20
25
Pow
er O
utpu
t (kW
)
20
40
60
80
Inle
t Air
Tem
pera
ture
(o F)
35 Consecutive Hours of Monitorin
Inlet AirTemperature
Power Output
25
Inlet Air Temperature
Power Output
80
Pow
er O
utpu
t (kW
)
20
60
15
10
40
Inle
t Air
Tem
pera
ture
( o F)
5
0 20 35 Consecutive Hours of Monitorin 35 Consecutive Hours of Monitoringgg
21404 21504221404 215041404 215041130 2230111130 223030 2230
Figure 2-3 Power Output and Ambient Temperature During the Verification Period
15
16
17
18
19
20
21
22
23
24
25
Pow
er O
utpu
t (kW
)
30 35 40 45 50 55 60 65
Ambient Temperature (oF)
Figure 2-4 Ambient Temperature Effects on Power Production During the Verification Period
Figure 2-4 plots power output at full load over the limited test period as a function of ambient temperature and indicates a generally linear relationship The generating rate ranged from about 19 to 235 kW across a temperature range of 349 to 596 oF
2-7
23 POWER QUALITY PERFORMANCE
231 Electrical Frequency
Electrical frequency measurements (voltage and current) were monitored continuously during the verification period The one-minute average data collected by the electrical meter were analyzed to determine maximum frequency minimum frequency average frequency and standard deviation for the verification period These results are illustrated in Figure 2-5 and summarized in Table 2-3 The average electrical frequency measured was 59999 Hz and the standard deviation was 0010 Hz
60060 606
60060 404
60060 202
60060 000
59959 898
59959 696
59959 494
59599922
222111444000444111111333000
35 C35 C35 Consonsonseeecccutututiiivvveee HHHooouuursrsrs ofofof MoMoMonininitttooorrriiingngng 222111555000444222222303030
Figure 2-5 Microturbine Frequency During Verification Period
Table 2-3 Electrical Frequency During Monitoring Period
Parameter Frequency (Hz) Average Frequency 59999 Minimum Frequency 59959 Maximum Frequency 60037 Standard Deviation 0010
Freq
uenc
y (H
z)Fr
eque
ncy
(Hz)
2-8
232 Voltage Output
It is typically accepted that voltage output can vary within plusmn 10 percent of the standard voltage (480 volts) without causing significant disturbances to the operation of most end-use equipment (ANSI 1996) The 7500 ION electric meter was configured to measure 0 to 600 VAC The turbine was grid-connected and operated as a voltage-following current source The voltage levels measured are therefore more indicative of the grid voltage levels that the Capstone tried to respond to
Figure 2-6 plots one-minute average voltage readings and Table 2-4 summarizes the statistical data for the voltages measured on the turbine throughout the verification period The voltage levels were well within the normal accepted range of plusmn 10 percent
460
470
480
490
500
Vol
tage
35 Consecutive Hours of Monitoring
460
470
480
490
500
Vol
tage
35 Consecutive Hours of Monitoring35 Consecutive Hours of Monitoring222111444000444111111333000
222111555000444222222333000
Figure 2-6 Microturbine Voltage During Verification Period
Table 2-4 Microturbine Voltage During Monitoring Period
Parameter Volts Average Voltage 48725 Minimum Voltage 47843 Maximum Voltage 49186 Standard Deviation 245
2-9
233 Power Factor
Figure 2-7 plots one-minute average power factor readings and Table 2-5 summarizes the statistical data for power factors measured on the turbine throughout the verification period The data include only periods when the microturbine was operating Data collected during the periodic trips are not included in the figure or summary table Test results show that the power factor was very stable throughout the period with the turbine at full load The power factor decreased during the low load controlled test periods
Figure 2-7 Microturbine Power Factor During Verification Period
88
90
92
94
96
98
Pow
er F
acto
r (
)
35 Consecutive Hours of Monitoring 88
90
92
94
96
98
Pow
er F
acto
r (
)
35 Consecutive Hours of Monitoring35 Consecutive Hours of Monitoring21404 215042121404 21504404 215041130 2230111130 223030 2230
Table 2-5 Power Factors During Monitoring Period
Parameter Average at full load 9453 Minimum at full load 9177 Maximum at full load 9493 Standard Deviation at full load 0240 Average at 20 kW 9280 Average at 15 kW 8987
2-10
234 Current and Voltage Total Harmonic Distortion
The turbine total harmonic distortion up to the 63rd harmonic was recorded for current and voltage output using the 7500 ION The average current and voltage THD were 321 and 189 percent respectively (Table 2-6) Both were well within the IEEE 519 specification of plusmn 5 percent Figure 2-8 plots the current and voltage THD throughout the verification period Figure 2-8 clearly shows a spike in current THD each time the microturbine was tripped by the biogas pressure loss The highest of the spikes was 32 percent
Table 2-6 Microturbine THD During Monitoring Period
Parameter Current THD () Voltage THD () Average 321 189 Minimum 222 160 Maximum 325 316 Standard Deviation 115 018
Figure 2-8 Microturbine Current and Voltage THD During Verification Period
0
2
4
6
8
10
12
THD
()
35 Consecutive Hours of Monitoring
Voltage THD
Current THD
0
2
4
6
8
10
12
THD
()
35 Consecutive Hours of Monitoring35 Consecutive Hours of Monitoring
Voltage THD
CurrentTHD
21404 21504221404 215041404 215041130 2230111130 223030 2230
2-11
24 EMISSIONS PERFORMANCE
241 Microturbine CHP System Emissions
Testing was conducted on the turbine exhaust stack to determine emission rates for NOX CO THC SO2 TRS CH4 and CO2 at each of the four controlled test conditions Testing for determination of TPM and NH3 was conducted at full load only Stack emission measurements were conducted using the reference methods summarized in Table 1-3 and detailed in the test plan The CHP system was maintained in a stable mode of operation during each test run based on PTC-22 variability criteria
Sampling system QAQC checks were conducted in accordance with test plan specifications to ensure the collection of adequate and accurate emissions data These included analyzer linearity tests and sampling system bias and drift checks Results of the QAQC checks are discussed in Section 325 The results show that DQOs for all gas species met the reference method requirements Table 2-7 summarizes the emission rates measured during each run and the overall average emissions for each set of tests
NOX concentrations averaged 175 ppmvd at 15 O2 at full load and increased to 346 ppmvd at the lowest load tested (setting of 15 kW) The overall average NOX emission rate at full load normalized to power output was 000008 lbkWh The benefits of lower NOX emissions from the CHP system are further enhanced by the fact that some of the exhaust heat is recovered and used Annual published data from Energy Information Administration (EIA) reveal that the measured CHP system NOX emission rate is well below the weighted average US and Colorado regional grid emission factors identified in the test plan which are 00066 and 00077 lbkWh respectively As stated earlier the center could not estimate annual emission reductions due to insufficient power production data but the emissions testing results clearly indicate that reductions will be realized through use of this CHP system The emission reductions are further increased when transmission and distribution system losses are accounted for
Average exhaust gas CO concentrations ranged from a low of 305 ppmvd at 15 O2 at full load to a high of 451 ppmvd at 15 O2 at the 15 kW power command Corresponding average CO emission rates at these power commands were approximately 0009 and 0017 lbkWh respectively
Similarly THC (and CH4) concentrations increased as power output decreased and ranged from 165 ppmvd at 15 O2 at full load to 475 ppmvd at 15 O2 at the 15 kW power command Corresponding average THC emission rates at these power commands were approximately 0003 and 0011 lbkWh respectively The CH4 emissions consistently comprised about 80 percent of the THC emissions
Concentrations of CO2 in the CHP system exhaust gas averaged 23 percent at full load and decreased as power output was reduced to a low of 20 percent These concentrations correspond to average CO2 emission rates of 345 lbkWh and 390 lbkWh respectively The CHP system CO2 emission rate at full load is higher than the weighted average fossil fuel emission factors for both the US and Colorado regional grids (202 and 213 lbkWh respectively) This indicates a likely increase in annual CO2 emissions for power production from this system but this increase would likely be offset by efficiency gains resulting from heat recovery and use and elimination of transmission and distribution system losses
2-12
Table 2-7 Microturbine CHP System Emissions During Controlled Test Periods
Pow
erC
omm
and
(kW
)
Elec
tric
alPo
wer
Out
put
(kW
) Exhaust
O2 ()
NOx Emissions CO Emissions THC Emissions CH4 Emissions CO2 Emissions
(ppm at
15 O2) (lbhr) (lbkWh)
(ppm at
15 O2) (lbhr) (lbkWh)
(ppm at
15 O2) (lbhr) (lbkWh)
(ppm at
15 O2) (lbhr) (lbkWh) () (lbhr) (lbkWh)
Run 1
Run 2
Run 3
AVG
30
197
201
198
199
191
191
192
191
170
180
174
175
161E-03
167E-03
161E-03
163E-03
817E-05
831E-05
814E-05
821E-05
250
310
354
305
0144
0175
0199
0173
0007
0009
0010
0009
141
163
190
165
0046
0052
0061
0053
235E-03
261E-03
310E-03
269E-03
112
141
157
137
0037
0045
0051
0044
187E-03
226E-03
256E-03
223E-03
23
23
23
23
682
668
707
686
346
332
358
345
Run 4
Run 5
Run 6
AVG
24
192
193
193
193
191
192
192
192
190
201
198
196
184E-03
184E-03
180E-03
183E-03
954E-05
952E-05
936E-05
947E-05
319
345
364
343
0188
0191
0202
0194
0010
0010
0010
0010
184
194
200
193
0062
0061
0063
0062
321E-03
319E-03
328E-03
323E-03
141
155
183
160
0047
0049
0058
0051
246E-03
254E-03
300E-03
267E-03
23
23
23
23
696
696
696
696
362
361
361
361
Run 7a
Run 8
Run 9
AVG
20
150
150
150
150
193
193
193
193
505
575
572
399
0004
0042
0042
0029
248E-04
281E-03
279E-03
195E-03
590
192
199
327
0263
0086
0089
0146
0018
0006
0006
0010
365
132
126
208
0093
0034
0032
0053
622E-03
225E-03
214E-03
354E-03
293
97
105
165
0075
0025
0027
0042
499E-03
165E-03
179E-03
281E-03
22
22
22
22
569
569
569
569
380
379
378
379
Run 10
Run 11
Run 12
AVG
15
101
101
102
101
190
191
191
191
332
351
354
346
0022
0022
0022
0022
219E-03
218E-03
220E-03
219E-03
441
459
452
451
0179
0176
0174
0176
0018
0017
0017
0017
483
484
457
475
0112
0106
0100
0106
110E-02
105E-02
987E-03
105E-02
360
413
410
394
0083
0091
0090
0088
824E-03
893E-03
885E-03
867E-03
20
20
20
20
395
395
395
395
391
390
390
390
a The NOX CO and CH4 concentrations during run 7 are questionable when compared to the data collected during runs 8 and 9 A brief 4-minute microturbine shutdown occurred at the conclusion of run 7 but the GHG Center was unable to resolve this anamoly after reviewing all available system operating data
2-13
Table 2-7 Microturbine CHP System Emissions During Controlled Test Periods (Continued)
Pow
erC
omm
and
(kW
)
Elec
tric
alPo
wer
Out
put
(kW
) Exhaust
O2 ()
Particulate Emissions NH3 Emissions SO2 Emissions TRS Emissions
(grdscf) (lbhr) (lbkWh)
(ppm at
15 O2) (lbhr) (lbkWh)
(ppm at
15 O2) (lbhr) (lbkWh)
(ppm at
15 O2) (lbhr) (lbkWh)
Run 1
Run 2
Run 3
AVG
30
197
201
198
199
191
191
192
191
00055
00053
00022
00043
0016
0015
0006
0012
811E-04
746E-04
304E-04
620E-04
005
004
002
004
170E-05
131E-05
600E-06
120E-05
862E-07
654E-07
304E-07
607E-07
488
582
614
561
064
073
081
073
0032
0036
0041
0037
155
144
570
119
0020
0018
0008
0015
101E-03
913E-04
406E-04
778E-04
Run 4
Run 5
Run 6
AVG
24
192
193
193
193
191
192
192
192
ND
ND
ND
NA
ND
ND
ND
NA
ND
ND
ND
NA
ND
ND
ND
NA
ND
ND
ND
NA
ND
ND
ND
NA
560
596
584
580
077
076
075
076
0040
0039
0039
0039
483
327
196
335
00067
00042
00025
00045
348E-04
218E-04
130E-04
232E-04
Run 7
Run 8
Run 9
AVG
20
150
150
150
150
193
193
193
193
ND
ND
ND
NA
ND
ND
ND
NA
ND
ND
ND
NA
ND
ND
ND
NA
ND
ND
ND
NA
ND
ND
ND
NA
594
590
588
591
061
060
061
061
0041
0040
0041
0040
820
678
581
693
00084
00069
00060
00071
561E-04
461E-04
401E-04
474E-04
Run 10
Run 11
Run 12
AVG
15
101
101
102
101
190
191
191
191
ND
ND
ND
NA
ND
ND
ND
NA
ND
ND
ND
NA
ND
ND
ND
NA
ND
ND
ND
NA
ND
ND
ND
NA
477
500
496
491
043
043
043
043
0043
0042
0042
0042
268
229
228
242
00024
00020
00020
00021
237E-04
198E-04
198E-04
211E-04
ND = No data collected These pollutants not tested at reduced loads NA = Not applicable
2-14
Emissions of total particulate matter and NH3 were extremely low during each of the three test replicates conducted at full power SO2 emissions from the CHP were fairly consistent throughout the range of operation At full load SO2 concentrations averaged 561 ppmvd at 15 O2 and corresponding emission rates averaged 0037 lbkWh Emissions of TRS the sulfurous compounds in the fuel that were not oxidized during combustion averaged approximately 780 ppmvd at 15 O2 and 0005 lbkWh during the full load tests
2-15
30 DATA QUALITY ASSESSMENT
31 DATA QUALITY OBJECTIVES
The GHG Center selects methodologies and instruments for all verifications to ensure a stated level of data quality in the final results The GHG Center specifies data quality objectives (DQOs) for each verification parameter before testing commences Each test measurement that contributes to the determination of a verification parameter has stated data quality indicators (DQIs) which if met ensure achievement of that verification parameterrsquos DQO
The establishment of DQOs begins with the determination of the desired level of confidence in the verification parameters Table 3-1 summarizes the DQOs established in the test planning stage for each verification parameter The actual data quality achieved during testing is also shown The next step is to identify all measured values which affect the verification parameter and determine the levels of error which can be tolerated These DQIs most often stated in terms of measurement accuracy precision and completeness are used to determine if the stated DQOs are satisfied The DQIs for this verification shyused to support the DQOs listed in Table 3-1 - are summarized in Table 3-2
Table 3-1 Verification Parameter Data Quality Objectives
Verification Parameter Original DQO Goala
Relative () Absolute (units) Achievedb
Relative () Absolute (units) Power and Heat Production Performance
Electrical power output (kW) plusmn 15 098 kW plusmn 10 020 kW Electrical efficiency () plusmn 15 041c plusmn 13 027c
Heat recovery rate (103Btuhr) plusmn 17 575 x 103Btuhrc plusmn 24 27 x 103Btuhrc
Thermal energy efficiency () plusmn 17 071c plusmn 25 083c
CHP production efficiency () plusmn 12 082c plusmn 16 087c
Power Quality Performance Electrical frequency (Hz) plusmn 001 0006 Hz plusmn 001 0006 Hz Voltage 10 48 Vc 10 49 Vc
Power factor () plusmn 050 TBD plusmn 050 047 Voltage and current total harmonic distortion (THD) () plusmn 100 TBD plusmn 100 003
Emissions Performance NOX CO CO2 O2 TRS and SO2 concentration accuracy plusmn 20 of spand plusmn 20 of spand
CH4 and THC concentration accuracy plusmn 50 of spand plusmn 50 of spand
TPM and NH3 concentration accuracy plusmn 50 plusmn 100 a Original DQO goals as stated in test plan Absolute errors were provided in the test plan where applicable based on anticipated
values b Overall measurement uncertainty achieved during verification The absolute errors listed are based on these uncertainties and the
average values measured during the verification c Calculated composite errors were derived using the procedures described in the corresponding subsections (Sections 322 through
325) d Qualitative data quality indicators based on conformance to reference method requirements
The DQIs specified in Table 3-2 contain accuracy precision and completeness levels that must be achieved to ensure that DQOs can be met Reconciliation of DQIs is conducted by performing independent performance checks in the field with certified reference materials and by following approved reference methods factory calibrating the instruments prior to use and conducting QAQC procedures in
3-1
the field to ensure that instrument installation and operation are verified The following sections address reconciliation of each of the DQI goals
This verification was supported by an Audit of Data Quality (ADQ) conducted by the GHG Center QA manager During the ADQ the QA manager randomly selected data supporting each of the primary verification parameters and followed the data through the analysis and data processing system The ADQ confirmed that no systematic errors were introduced during data handling and processing A performance evaluation audit (PEA) and a technical systems audit (TSA) were planned but not conducted Similar PEAs were recently conducted on two recent CHP verifications [13 14] and it was decided to not repeat the PEA a third time Likewise a full TSA was recently completed on a similar verification [13] where the same measurement systems were used so this QA activity was not repeated here Instead the GHG Center QA manager conducted an abbreviated project review to ensure that the verification approach and analytical procedures specified in the TQAP were followed or in cases where changes to the verification were necessary these changes were justified and documented Corrective action reports (CARs) are completed signed by the GHG Center QA manager and filed at the GHG Center that document significant changes to the verification approach or methodologies that occurred during the verification
32 RECONCILIATION OF DQOs AND DQIs
Table 3-2 summarizes the range of measurements observed in the field and the completeness goals Completeness is the number or percent of valid determinations actually made relative to the number or percent of determinations planned The completeness goals for the controlled tests were to obtain electrical and thermal efficiency as well as emission rate data for three test runs conducted at each of four different load conditions This completeness goal was achieved
Completeness goals for the extended tests were to obtain 90 percent of 7 days of power quality power output heat recovery rate and ambient measurements This goal was not achieved As explained in Section 21 the Center was not able to complete the entire 7-day extended monitoring period A total of 35 hours of data were logged including the controlled test periods
Table 3-2 also includes accuracy goals for measurement instruments Actual measurement accuracy achieved is also reported based on instrument calibrations conducted by manufacturers field calibrations reasonableness checks or independent performance checks with a second instrument Table 3-3 includes the QAQC procedures that were conducted for key measurements in addition to the procedures used to establish DQIs The accuracy results for each measurement and their effects on the DQOs are discussed below
3-2
3-3
Table 3-2 Summary of Data Quality Indicator Goals and Results
Measurement Variable Instrument Type and
Manufacturer
Instrument Range
Range Observed in
Field
Accuracy Completeness
Goal Actual How Verified or Determined Goal Actual
CHP System Power Output and Quality
Power
Electric Meter Power Measurements 7500 ION
0 to 100 kW 0 to 242 kW plusmn 15 reading plusmn 10 reading
Instrument calibration from manufacturer prior to testing
Controlled tests three valid runs per load meeting PTC 22 criteria
Extended test 90 of one minute readings for 7 days
Controlled tests three valid runs at each load
Extended test 35 consecutive hours of one minute readings
Voltage 0 to 600 V 478 to 492 V plusmn 10 reading plusmn 10 reading Frequency 55 to 65 Hz 599 to 600 Hz plusmn 001 reading plusmn 001 reading Current 0 to 200A 5 to 29 A plusmn 10 reading plusmn 10 reading Voltage THD 0 to 100 16 to 32 plusmn 10 full scale plusmn 10 full scale Current THD 0 to 100 22 to 325 plusmn 10 full scale plusmn 10 full scale
Power Factor 0 to 100 918 to 949 plusmn 05 reading plusmn 05 reading
CHP System Heat Recovery Rate
Inlet Temperature
Controlotron Model 1010EP
80 to 150 oF 89 to 94 oF Temps must be plusmn 15 oF of ref Thermocouples
plusmn 07 oF for outlet plusmn 08 oF for inlet
Independent check with calibrated thermocoupleOutlet
Temperature 80 to 150 oF 93 to 102 oF
Water Flow 0 to 150 gpm 281 to 286 gpm plusmn 10 reading plusmn 01 reading Instrument calibration from manufacturer prior to testing
Ambient Conditions
Ambient Temperature
RTD Vaisala Model HMD 60YO
-50 to 150 oF 35 to 60 o F plusmn 02 oF plusmn 02 oF
Instrument calibration from manufacturer prior to testing
Ambient Pressure
Setra Model 280E 0 to 25 psia 1268 to 1272
psia plusmn 01 full scale plusmn 005 full scale
Relative Humidity
Vaisala Model HMD 60YO 0 to 100 RH 21 to 49 RH plusmn 2 plusmn 02
(continued)
3-3
3-4
Table 3-2 Summary of Data Quality Indicator Goals and Results (continued)
Measurement Variable Instrument Type and Manufacturer
Instrument Range
Measurement Range
Observed
Accuracy Completeness
Goal Actual How Verified or Determined Goal Actual
Fuel Input
Gas Flow Rate Dresser-Roots Model 2M175 SSM Series B3 rotary displacement
0 to 30 scfm 5 to 10 scfm 10 of reading plusmn 03 of reading
Factory calibration with volume prover
Controlled tests three valid runs per load meeting PTC 22 criteria Extended test 90 of one- minute readings for 7 days
Controlled tests three valid runs at each load
Extended test 35 hours of one-minute readings
Gas Pressure Omega Model PX205shy030AI transducer 0 to 30 psia 12 to 14 psia plusmn 075 full
scale plusmn 025 full scale Instrument calibration to NIST traceable standards
Gas Temperature
Omega TX-93 Type K thermocouple 0 to 200 oF 75 to 97 oF plusmn 010 reading plusmn 010 reading
LHV Gas Chromatograph HP 589011
0 to 100 CH4
67 to 69 CH4 plusmn 30 accuracy plusmn 02 repeatability
plusmn 05 accuracy plusmn 005 repeatability
analysis of NIST-traceable CH4 standard and duplicate analysis on 3 samples
Controlled tests two valid samples per load
Controlled tests two valid samples per load627 to 633
Btuft3 01 repeatability
plusmn 006 repeatability
Conducted duplicate analyses on 3 samples
Exhaust Stack Emission
NOX Levels Chemiluminescent CAI 400-CLD
0 to 50 ppmvd 0 to 3 ppmvd plusmn 2 full scale le 2 full scale
Calculated following EPA Reference Method calibrations (Before and after each test run)
Controlled tests three valid runs per load
Controlled tests three valid runs per load
CO Levels NDIR TEI Model 48 0 to 300 ppmvd
50 to 160 ppmvd plusmn 2 full scale le 2 full scale
CH4 levels HP 5890 0 to 300 ppmv 30 to 130 ppmv plusmn 5 full scale le 5 reading
THC levels HP 5890 0 to 300 ppmv 40 to 160 ppmv plusmn 5 full scale le 5 full scale
SO2 Levels Bovar 721-AT 0 to 300 ppmvd
145 to 185 ppmvd plusmn 2 full scale le 2 full scale
O2 CO2 Levels CAI 200 0 to 25 10 to 20 O2
20 to 25 CO2 plusmn 2 full scale le 2 full scale
TRS Levels Ametek 921 0 to 25 ppmvd 0 to 5 ppmvd plusmn 2 full scale le 2 full scale
NH3 Levels Ion specific electrode 0 to 5 ugml 0 to 42 ugml plusmn 5 full scale le 5 full scale
TPM concentrations gravimetric Not specified 001 to 004 g plusmn 1 mg plusmn 05 mg
Stack gas velocity
Pitot and thermocouple Not specified 3552 to 3753
fpm plusmn 5 reading le 5 reading
3-4
321 Power Output
Instrumentation used to measure power was introduced in Section 10 and included a Power Measurements Model 7500 ION The data quality objective for power output was plusmn 15 percent of reading which includes compounded error of the instrument and the current transformers (CTs) The test plan specified factory calibration of the ION meter with a NIST-traceable standard to determine if the power output DQO was met The Test plan also required the GHG Center to perform several reasonableness checks in the field to ensure that the meter was installed and operating properly The following summarizes the results
The meter was factory calibrated by Power Measurements in April 2003 Calibrations were conducted in accordance with Power Measurementsrsquo standard operating procedures (in compliance with ISO 90021994) and are traceable to NIST standards The meters were certified by Power Measurements to meet or exceed the accuracy values summarized in Table 3-2 for power output voltage current and frequency NIST-traceable calibration records are archived by the GHG Center Pretest factory calibrations on the meters indicated that accuracy was within plusmn 005 percent of reading and this value combined with the 10-percent error inherent to the current transformers resulted in an overall error of plusmn 101 percent Using the manufacturer-certified calibration results and the average power output measured during the full-load testing the absolute error during all testing is plusmn 020 kW
Additional QC checks were performed on the 7500 ION to verify the operation after installation of the meters at the site and prior to the start of the verification test The results of these QC checks (summarized in Table 3-3) are not used to reconcile the DQI goals but to document proper operation in the field Current and voltage readings were checked for reasonableness using a hand-held Fluke multimeter These checks confirmed that the voltage and current readings between the 7500 ION and the Fluke were within the range specified in the test plan as shown in Table 3-3
These results led to the conclusion that the 7500 ION was installed and operating properly during the verification test The plusmn 10-percent error in power measurements as certified by the manufacturer was used to reconcile the power output DQO (discussed above) and the electrical efficiency DQO (discussed in Section 322)
3-5
Table 3-3 Results of Additional QAQC Checks
Measurement Variable QAQC Check When
PerformedFrequency Expected or Allowable
Result Results Achieved
Power Output
Sensor diagnostics in field Beginning and end of test Voltage and current checks
within plusmn 1 reading plusmn 01 voltage plusmn 09 current
Reasonableness checks Throughout test Readings should be around 22 kW net power output at full load
Readings were 20 to 24 kW at full load
Fuel Heating Value
Calibration with gas standards by laboratory
Prior to analysis of each lot of samples submitted
plusmn 10 for each gas constituent Results satisfactory see
Section 3224 Independent performance checks with blind audit sample
Twice during previous year
plusmn 30 for each major gas constituent (methane CO2)
Heat Recovery Rate
Meter zero check Prior to testing Reported water flow rate lt 01 gpm ndash006 gpm recorded
Independent performance check of temperature readings
Beginning of test period Difference in temperature readings should be lt 15 degF
Temperature readings within 08 degF of reference
322 Electrical Efficiency
The DQO for electrical efficiency was to achieve an uncertainty of plusmn 152 percent at full electrical load or less Recall from Equation 1 (Section 141) that the electrical efficiency determination consists of three direct measurements power output fuel flow rate and fuel LHV The accuracy goals specified to meet the electrical efficiency DQO consisted of plusmn 15 percent for power output plusmn 10 percent for fuel flow rate and plusmn 02 percent for LHV The accuracy goals for each measurement were met The following summarizes actual errors achieved and the methods used to compute them
Power Output As discussed in Section 321 factory calibrations of the 7500 ION with a NISTshytraceable standard and the inherent error in the current and potential transformers resulted in plusmn 10-percent error in power measurements Reasonableness checks in the field verified that the meter was functioning properly The average power output at full load was approximately 20 kW with a measurement error of plusmn 020 kW
Heat Input Heat input is the product of measured fuel flow rate and LHV The DQI goal for fuel flow rate was reconciled through calibration of the gas meter and the gas temperature and pressure sensors used to correct measured gas volumes to standard conditions All three components were calibrated with NIST-traceable standards As shown in Table 3-2 the individual instruments errors were 03 025 and 01 percent for flow pressure and temperature respectively The overall error in biogas flow rate on a wet basis then is 040 percent of reading
Since biogas flow rate was metered on a wet and low pressure basis but combusted by the microturbine on a dry high pressure basis measured flow rates were corrected for moisture content (Section 142) Since the actual moisture content of the as-fired biogas was not directly measured the assumption that the gas was completely dry introduced additional error into the heat input determination The center
3-6
conducted an analysis of this assumption and knowing the temperature and pressure of the gas as fired determined that the worst case error introduced by the assumption that the gas is totally dry is 07 percent Combining that uncertainty with the heat input wet basis error of 040 percent the overall error on determination of biogas flow rate on a dry basis is then 081 percent of reading
The average flow rate at full load was 881 scfm with an associated measurement error of plusmn 007 scfm Complete documentation of data quality results for fuel flow rate is provided in Section 325
Uncertainty in the biogas LHV results was within the 02 percent DQI goal (Section 326) The average LHV during testing was 630 Btuft3 and the measurement error corresponding to this heating value is plusmn 13 Btuft3 The heat input compounded error then is
Error in Heat Input = ( flowmetererror )2 + (LHVerror)2 (Equation 5)
= (00081)2 + (0002)2 = 00083
The measurement error amounts to approximately plusmn 27 x 103Btuhr or 083 percent relative error at the average measured heat input of 332 x 103Btuhr
The errors in the divided values compound similarly for the electrical efficiency determination The electrical power measurement error is plusmn 10 percent relative (Table 3-2) and the heat input error is plusmn 083 percent relative Therefore compounded relative error for the electrical efficiency determination is
Error in Elec Power Efficiency = (powermetererror)2 + (heatinputerror)2 (Equation 6)
= (0010)2 + (00083)2 = 00130
Electrical efficiency for the controlled test periods at full load was 204 plusmn 027 percent or a relative compounded error of 13 percent
323 PTC-22 Requirements for Electrical Efficiency Determination
PTC-22 guidelines state that efficiency determinations were to be performed within 60 minute test periods in which maximum variability in key operational parameters did not exceed specified levels Table 3-4 summarizes the maximum permissible variations observed in power output ambient temperature ambient pressure biogas pressure at the meter and biogas temperature at the meter for each test run The table shows that the requirements for all parameters were met for all test runs and the efficiency determinations were representative of stable operating conditions
3-7
Table 3-4 Variability Observed in Operating Conditions Maximum Observed Variationa in Measured Parameters
Power Output ()
Ambient Temp (oF)
Ambient Pressure ()
Biogas pressure
(psia)
Power Factor ()
Maximum Allowable Variation plusmn 2 plusmn 4 plusmn 05 plusmn 1 plusmn 2
Run 1 06 11 003 02 02 Run 2 17 07 003 01 01 Run 3 18 06 002 01 01 Run 4 03 22 001 02 01 Run 5 03 09 001 02 01 Run 6 04 25 002 02 02 Run 7 03 03 001 03 01 Run 8 04 07 001 01 01 Run 9 02 08 001 02 01
Run 10 04 05 002 01 01 Run 11 04 04 003 02 01 Run 12 03 04 002 03 01
a Maximum (Average of Test Run ndash Observed Value) Average of Test Run 100
324 Ambient Measurements
Ambient temperature relative humidity and barometric pressure at the site were monitored throughout the verification period and the controlled tests The instrumentation used is identified in Table 3-2 along with instrument ranges data quality goals and data quality achieved All three sensors were factoryshycalibrated using reference materials traceable to NIST standards The pressure sensor was calibrated prior to the verification testing confirming the plusmn 01 percent accuracy The temperature and relative humidity sensors were also calibrated within a year prior to testing which verified that the plusmn 02 degF accuracy goal for temperature and plusmn 2 percent accuracy goal for relative humidity were met
325 Fuel Flow Rate
The Dresser-Roots Model 2M175 rotary displacement gas meter was factory-calibrated prior to installation in 1999 Calibration records were obtained and reviewed to ensure that the plusmn 10-percent instrument accuracy goal was satisfied The original calibration for the Roots meter indicating an accuracy of plusmn 032 percent is a permanent calibration This error combines with the errors in the gas temperature pressure and moisture determinations for an overall biogas flow rate measurement error of plusmn 081 percent
326 Fuel Lower Heating Value
Biogas sample collection date time run number and canister ID were logged along with laboratory chain of custody forms and were shipped along with the samples Copies of the chain of custody forms and results of the analyses are stored in the GHG Center project files Collected samples were shipped to Empact Analytical Laboratories of Brighton CO for compositional analysis and determination of LHV
3-8
per ASTM test Methods D1945 [6] and D3588 [7] respectively The DQI goals were to measure methane concentrations within plusmn 30 percent of a NIST-traceable blind audit sample and to achieve less than plusmn 02 percent difference in LHV duplicate analyses results Blind audits were submitted to Empact on two similar verifications within the past year to evaluate analytical accuracy on the methane analyses [13 14] Both audits indicated analytical accuracy within 05 percent and repeatability of within plusmn 02 percent Since the same sampling and analytical procedures were used here by the same analyst the audit was not repeated a third time
Duplicate analyses in addition to the blind audit samples were conducted on three of the samples collected during the controlled test periods Duplicate analysis is defined as the analysis performed by the same operating procedure and using the same instrument for a given sample volume Results of the duplicate analyses showed an average analytical repeatability of 006 percent for methane and 006 percent for LHV The results demonstrate that the plusmn 02 percent LHV accuracy goal was achieved As such both DQIs were met with the methane accuracy at plusmn 05 percent and the LHV repeatability at plusmn 006 percent
327 Heat Recovery Rate and Efficiency
Several measurements were conducted to determine CHP system heat-recovery rate and thermal efficiency These measurements include water flow rate water supply and return temperatures and CHP system heat input The individual errors in each of the measurements is then propagated to determine the overall error in heat-recovery rate and efficiency The Controlotron ultrasonic heat meter was used to continuously monitor water flow rate This meter has a NIST-traceable factory-calibrated accuracy of plusmn 10 percent of reading (this flow through calibration was conducted on October 9 2002) This certification serves as the primary DQI A zero check was also performed on the flow meter The meter reading was -006 gpm with the CHP system shut down and the circulation pump off
Table 3-2 showed that the DQI for supply and return temperatures (delta T) was achieved Each temperature sensor was calibrated against a reference thermocouple with NIST-traceable accuracy The error in the two temperature sensors resulted in an overall delta T uncertainty of 08 oC This absolute error equates to a relative error of 22 percent at the average fluid temperatures measured during the fullshyload testing (about 361 oC) The overall error in heat recovery rate is then the combined error in flow rate and temperature differential This error compounds multiplicatively as follows
Overall Heat Meter Error = (Flow rate error)2 + (compositional error) 2 (Equation 7)
( ) 0240)0220(0100 22 =+=
The heat recovery rate determination therefore has a relative compounded error of plusmn 24 percent The absolute error in the average heat recovery rate at full load (111 x 103Btuhr) then is plusmn 27 x 103Btuhr
This error in heat-recovery rate and the heat input error (083 percent) compound similarly to determine the overall uncertainty in the thermal efficiency determination as follows
Error in Heat Recovery Efficiency = (0024)2 + (00083)2 = 0025 (Equation 8)
Average heat recovery rate (thermal) efficiency at full load then is 333 plusmn 083 percent or a relative compounded error of 25 percent This compounded relative error exceeds the data quality objective
3-9
slightly but the absolute error is within the goal for this verification parameter (measured values were lower than anticipated)
328 Total Efficiency
Total efficiency is the sum of the electrical power and heat-recovery efficiencies Total efficiency is defined as 204 plusmn 027 percent (plusmn 130-percent relative error) plus 333 plusmn 063 percent (plusmn 19-percent relative error) This is based on the determined errors in electrical and thermal efficiency at full load The absolute errors compound as follows
errcabs = err12 + err2
2 (Equation 9)
870830270 22 =+=
Relative error is
errcrel =errcabs (Equation 10)
Value1 +Value2
087 = = 0016
204 + 333 where
errcabs = compounded error absolute err1 = error in first added value absolute value err2 = error in second added value absolute value errcrel = compounded error relative value1 = first added value value2 = second added value
The total CHP efficiency at full load is then 537 plusmn 087 percent or 16 percent relative error Again this compounded relative error exceeds the data quality objective slightly
329 Exhaust Stack Emission Measurements
EPA reference method requirements form the basis for the qualitative DQIs specified in the Test plan and listed in Tables 3-1 and 3-2 Each method specifies sampling and calibration procedures and data quality checks These specifications when properly implemented ensure the collection of high quality and representative emissions data The specific sampling and calibration procedures vary by method and class of pollutants and are summarized in Table 3-5 The table lists the method quality requirements the acceptable criteria and the results for the test conducted here It is generally accepted that conformance to the reference method quality requirements demonstrates that the qualitative DQIs have been met
All of the emissions testing and reference method quality control procedures were conducted by Cubix Corporation either in the field during testing or in their calibration and analytical laboratories in Austin Texas All of the field sampling procedures and calibrations were closely monitored by GHG Center personnel In addition documentation of all sampling and analytical procedures data collection and
3-10
calibrations have been procured reviewed and filed by the GHG Center Table 3-5 is followed by a brief explanation of the QAQC procedures implemented for each class of pollutant quantified during this verification
Table 3-5 Summary of Emissions Testing Calibrations and QC Checks
Measurement Variable
Calibration or QC Check
When Performed and Frequency
Expected or Allowable Result
Result of Calibration(s) or Check(s)
NOX CO CO2 SO2 TRS and O2 concentrations
Analyzer calibration error test
Daily before testing plusmn 2 of analyzer span All within allowable level for each day
System bias checks Before each test run plusmn 5 of analyzer span All within allowable level for each test run Calibration drift test After each test run plusmn 3 of analyzer span
THC concentrations System calibration error test
Daily before testing plusmn 5 of analyzer span All within allowable level for each day
System calibration drift test
After each test run plusmn 3 of analyzer span All within allowable level for each test run
CH4 concentrations Triplicate injections Each test run plusmn 5 difference All within allowable level for each test run
Calibration of GC with gas standards by certified laboratory
Immediately prior to sample analyses andor at least once per day
plusmn 5 for each compound
All within allowable level for each day
TPM emissions Pre and post test sampling system leak checks
Before and after each test run
Sampling system leak rate lt 002 cfm
All checks lt 002 cfm
Minimum sample volume After each test run Corrected Vol gt 600 dscf
Volumes ranged from 694 to 796 dscf
Percent isokinetic sampling rate (I)
After each test run 90 lt I lt 110 91 lt I lt 102
Analytical balance calibration
Once before analysis plusmn 00001 g Within allowable level
Filter and reagent blanks Once during testing after first test run
lt 10 of particulate catch for first test run
Blank weights lt 10 of each sample catch
Dry gas meter calibration Once before and once after testing
plusmn 5 Pre and post test calibrations within 1
Thermocouple calibration Once after testing plusmn 15 of average stack temperature
Within 03 of reference TC
NH3 concentrations Calibration of instrument with NH3 standards
Immediately prior to sample analyses at least once a day
plusmn 5 Pre test calibrations within 1 of working standards
Dry gas meter calibration Once before and once after testing
plusmn 5 Pre and post test calibrations within 1
Exhaust gas volumetric flow rate
Pitot tube dimensional calibration inspection
Once before and once after testing
See 40CFR60 Method 2 Section 100
Calibration criteria met
Thermocouple calibration Once after testing plusmn 15 of average stack temperature
Within 03 of reference TC
3291 NOX CO CO2 SO2 TRS and O2 Concentrations
Test personnel performed sampling system calibration error tests prior to each test run All calibrations employed a suite of three EPA Protocol No 1 calibration gases (four for CO) that spanned the instrument ranges Appropriate calibration ranges were selected for each pollutant based on exhaust gas screening (ranges are summarized in Table 3-2) The daily analyzer calibration error goal for each instrument was plusmn 20 percent of span It was met for each analyzer during each day of testing
3-11
Sampling system bias was evaluated for each parameter at the beginning of each test run using the zero and mid-level calibration gases System response to the zero and mid-level calibration gases also provided a measure of drift and bias at the end of each test run The maximum allowable sampling system bias and drift values were plusmn 5 and plusmn 3 percent of span respectively These specifications were met for each parameter and for each test run Testers also performed a NOX converter efficiency test as described in Section 35 of the test plan The converter efficiency was 9998 percent which meets the 98shypercent goal specified in the method
3292 THC Concentrations
Following Method 25A criteria the analyzer calibration error test is not performed on the THC analyzer Instead a 4-point system bias test is conducted at the beginning of each test day System response must be within plusmn 5 percent of the calibration standard at each point System response to the zero and mid-level calibration gases also provided a measure of drift and bias at the end of each test run The maximum allowable sampling system bias and drift values were plusmn 5 and plusmn 3 percent of span respectively These specifications were met for test run
3293 CH4 Concentrations
The test plan specified EPA Method 18 for determining stack gas methane concentrations This testing was conducted on-site eliminating the need to collect bag samples for transport to a laboratory Test operators injected calibration gas standards into the gas chromatograph (GC) to establish a concentration standard curve prior to sample analysis The operator repeated the injections until the average of all desired compounds from three separate injections agreed to within 50 percent of the certified value The acceptance criterion was met for all runs
The analysts injected the mid-range standard to quantify instrument drift at the completion of each test The analyst would repeat the calibration process used for the average of the two calibration curves to determine concentrations if he observed a variance larger than 50 percent
3294 Total Particulate Matter and Exhaust Gas Volumetric Flow Rate
Reference Methods 1 through 5 used for determination of exhaust gas volumetric flow rate and total particulate emissions include numerous quality control and quality assurance procedures that are required to ensure collection of representative data The most important of these procedures are listed in Table 3-5 along with the results for these tests These methods do not specify overall uncertainties but it is generally accepted that conformance to the control and quality assurance procedures will result in an overall method uncertainty ranging from 5 to 30 percent depending on the mass of the particulate catch the quality of the sampling system and the length of the sampling probe [15] For these tests TPM catches were in the range of 10 to 20 mg the sampling system surfaces contacting the exhaust gases were constructed entirely of glass or Teflon and the probe was less than 3-feet in length In addition testers documented that all of the key method criteria were met It is therefore expected that the overall error for tests conducted here is plusmn 10 percent of reading This exceeds the original goal of plusmn 5 percent but this deviation from the plan is not believed to impact results significantly because TPM emissions were very low
3-12
3295 NH3 Concentrations
Ammonia samples were collected in the back-half of the total particulate sampling train and therefore all of the sampling system criteria are the same as for TPM measurements Sampling error for the NH3 samples should be the same as sampling error for the TPM samples In the laboratory analytical instrumentation was calibrated using nine working standards A calibration curve for the instrument was developed using this nine-point calibration The R2 for the calibration curve was 09997 indicating excellent analytical linearity Based on this the same uncertainty used for the TPM determination (plusmn10 percent) is assigned Again this level of uncertainty exceeds the original goal of plusmn 5 percent but as with the TPM emissions this deviation from the plan is not believed to impact results significantly because NH3 emissions were also very low
3-13
40 REFERENCES
[1] Southern Research Institute Environmental Technology Verification Report Swine Waste Electric and Heat Production ndash Martin Machinery Internal Combustion Engine SRIUSEPA-GHG-QAP-27 wwwsri-rtpcom Greenhouse Gas Technology Center Southern Research Institute Research Triangle Park NC September 2004
[2] Southern Research Institute Test and Quality Assurance Plan - Swine Waste Electric Power and Heat Production Systems Capstone MicroTurbine and Martin Machinery Internal Combustion Engine SRIUSEPA-GHG-QAP-22 wwwsri-rtpcom Greenhouse Gas Technology Center Southern Research Institute Research Triangle Park NC November 2002
[3] American Society of Mechanical Engineers Performance Test Code for Gas Turbines ASME PTC-22 New York NY 1997
[4] American National Standards Institute American Society of Heating Refrigeration and Airshy conditioning Engineers Method of Testing Thermal Energy Meters for Liquid Streams in HVAC
Systems ANSIASHRAE 125-1992 Atlanta GA 1995
[5] CRC Press Handbook of Chemistry and Physics ndash 60th Edition CRC Press Inc Boca Raton Florida 1980
[6] American Society for Testing and Materials Standard Test Method for Analysis of Natural Gas by Gas Chromatography ASTM D1945-98 West Conshohocken PA 2001
[7] American Society for Testing and Materials Standard Practice for Calculating Heat Value Compressibility factor and Relative Density of Gaseous Fuels ASTM D3588-98 West Conshohocken PA 2001
[8] American Society for Testing and Materials Standard Practice for Determination of Sulfur Compounds in Natural Gas by Gas Chromatography and Chemiluminescense ASTM D5504-01 West Conshohocken PA 2001
[9] American National Standards Institute ANSI Institute of Electrical and Electronics Engineers IEEE Master Test Guide for Electrical Measurements in Power Circuits ANSIIEEE Std 120shy1989 New York NY October 1989
[10] American National Standards Institute ANSI Institute of Electrical and Electronics Engineers IEEE Recommended Practices and Requirements for Harmonic Control in Electrical Power Systems IEEE Std 519-1992 New York NY April 1993
[11] American National Standards Institute ANSI Institute of Electrical and Electronics Engineers National Standards for Electric Power Systems and Equipment - Voltage Ratings (Hertz) ANSI C841-1995 American National Standards Institute National Electrical Manufacturers Association Rosslyn VA 1996
[12] US Environmental Protection Agency Code of Federal Regulations Title 40 Part 60 New Source Performance Standards Appendix A US EPA Washington DC 1999
[13] Southern Research Institute Environmental Technology Verification Report Combined Heat and Power at a Commercial Supermarket ndash Capstone 60 kW Microturbine CHP System SRIUSEPA-GHG-QAP-27 wwwsri-rtpcom Greenhouse Gas Technology Center Southern Research Institute Research Triangle Park NC September 2003
[14] Southern Research Institute Environmental Technology Verification Report Residential Electric Power Generation Using the Plug Power SU1 Fuel Cell System SRIUSEPA-GHG-QAP-25 wwwsri-rtpcom Greenhouse Gas Technology Center Southern Research Institute Research Triangle Park NC September 2003
[15] Shigehara RT Measurement Uncertainty of Selected EPA Test Methods Emission Monitoring Inc Presented at Stationary Source Sampling and Analysis for Air Pollutants XXV Conference March 2001

Gas Dryers and Compressor
Capstone 330Microturbine Heat
Exchanger
480 208Volt Transformer
DC
A
B
EI
J
G
H
F
D
C
A
B I
J
HE
F
G
480 208Volt Transformer
DC
A
B
EI
J
G
H
F
D
C
A
B
D
C
A
B
D
C
A
B I
J
HE
F
G
EE
CHP SystemCHP SystemAir IntakeAir Intake ExhausEx thaust
Raw Biogas Utility GridRaw Biogas Utility GridInputInput
Measurement LocationsMeasurement Locations
D
C
A
B
Power ProductionPower ProductioPoPo nwer Productionwer ProductionE
F
G
I
J
H Water SupplyWWater Supplyater SupplyFuel Gas PressureFuel Gas PressureFFFuel Gas Pressureuel Gas Pressureuel Gas Pressure (T1)(T(T1)1)And Power Quality (kW)A ower Quality (kAAnd P W)nd Power Qualitynd Power Quality (kW) TemperatureTeTemperaturemperature
MeasurementsMeasurementsFuel Gas FlowFuel Gas FlowFuFuFuel Gas Flowel Gas Flowel Gas Flow Water ReturnWater ReturWatWat ner Returner ReturnAmbient TemperatureAAmbient Temperaturembient Temperature (T2)(T2(T(T )2)2)for heat inputfor heat input TemperatureTemperatTeTe uremperaturemperaturePressure and HumidityPPressure and Humidityressure and HumidityGas Samples for LHVGas Samples for LHVGasGasGas Samples for LHVSamples for LHVSamples for LHV (HI(H )I)
Emissions TestingEEmissions Testingmissions TestingWater Circulation (V)WWater Circulation (V)ater Circulation (V)Fuel Gas TemperatureFuel Gas TemperatureFFFuel Gas Temperatureuel Gas Temperatureuel Gas Temperature RateRaRatete
Microturbine Exhaust
Hot Water Supply
Water Return
Digester Heating Loop
Engine Heat Exchanger
System Boundary
Gas Dryers and Compressor
Capstone 330 Microturbine Heat
Exchanger
480 208 Volt Transformer
Microturbine Exhaust
Hot WaterSupply
Water Return
DigesterHeating Loop
EngineHeat Exchanger
DigesterHeating Loop
EngineHeat Exchanger
D C
A
B
JF
System Boundary
E I
G
H
Figure 1-5 Schematic of Measurement System
A total of six biogas samples were collected and analyzed during the controlled test periods to determine gas composition and heating value Samples were collected at a point in the biogas delivery line downstream of the meter but upstream of the gas drying system and compressor due to sampling restrictions (high gas pressure and the absence of sampling ports) The samples were submitted to Empact Analytical Systems Inc of Brighton CO for compositional analysis in accordance with ASTM Specification D1945 for quantification of methane (C1) to hexane plus (C6+) nitrogen oxygen and carbon dioxide [6] The compositional data were then used in conjunction with ASTM Specification D3588 to calculate LHV and the relative density of the gas [7]
In addition to the ASTM D1945 compositional analyses ASTM Method 5504 provided an extended analysis to quantify biogas concentrations of H2S [8] This method is essentially an extension of the ASTM D1945 procedures that uses additional chromatographic columns to separate H2S and heavier hydrocarbons
1-12
A Controlotron Model 1010EP1 energy meter was used to monitor water flow and supply and return temperatures This meter is a digitally integrated system that includes a portable computer ultrasonic fluid flow transmitters and 1000-ohm platinum resistance temperature detectors (RTDs) The meter has an overall rated accuracy of plusmn 2 percent of reading and provides a continuous 4-20 mA output signal over a selectable range The meter was installed in the 1-12-inch carbon steel water supply line
The water flow rate and supply and return temperature data used to determine heat recovery rates were logged as one-minute averages throughout all test periods The heat transfer fluid density and specific heat were determined by using ASHRAE and ASME density and specific heat values for water corrected to the average water temperature measured by the RTDs
142 Power Quality Performance
The GHG Center and its stakeholders developed the following power quality evaluation approach to account for these issues Three documents [9 10 11] formed the basis for selecting the power quality parameters of interest and the measurement methods used The GHG Center measured and recorded the following power quality parameters during the continuous monitoring period
bull Electrical frequency bull Voltage bull Voltage THD bull Current THD bull Power factor
The 7500 ION power meter used for power output determinations was used to perform these measurements as described below and detailed in the test plan The ION power meter continuously measured electrical frequency at the generatorrsquos distribution panel and the DAS was used to record oneshyminute averages throughout the verification The mean maximum and minimum frequencies as well as the standard deviation are reported
The CHP unit generates power at nominal 480 volts (AC) The electric power industry accepts that voltage output can vary within plusmn 10 percent of the standard voltage (480 volts) without causing significant disturbances to the operation of most end-use equipment [11] Deviations from this range are often used to quantify voltage sags and surges The ION power meter continuously measured true root mean square (rms) line-to-line voltage at the generatorrsquos distribution panel for each phase pair True rms voltage readings provide the most accurate representation of AC voltages The DAS recorded one-minute averages for each phase pair throughout the monitoring period as well as the average of the three phases The mean maximum and minimum voltages as well as the standard deviation for the average of the three phases are reported
THD is created by the operation of non-linear loads Harmonic distortion can damage or disrupt many kinds of industrial and commercial equipment Voltage harmonic distortion is any deviation from the pure AC voltage sine waveform THD gives a useful summary view of the generatorrsquos overall voltage quality The specified value for total voltage harmonic is a maximum THD of 50 percent based on ldquorecommended practices for individual customersrdquo in the IEEE 519 Standard The ION meter continuously measured voltage THD up to the 63rd harmonic for each phase The DAS recorded oneshyminute voltage THD averages for each phase throughout the test period and reported the mean minimum maximum and standard deviation for the average THD for the three phases
1-13
Current THD is any distortion of the pure current AC sine waveform The current THD limits recommended in the IEEE 519 standard range from 50 to 200 percent depending on the size of the CHP generator the test facilityrsquos demand and its distribution network design as compared to the capacity of the local utility grid Detailed analysis of the facilityrsquos distribution network and the local grid are beyond the scope of this verification The GHG Center therefore reported current THD data without reference to a particular recommended THD limit The ION power meter as with voltage THD continuously measured current THD for each phase and reported the average minimum and maximum values for the period
The ION power meter also continuously measured average power factor across each generator phase The DAS recorded one-minute averages for each phase during all test periods The GHG Center reported maximum minimum mean and standard deviation power factors averaged over all three phases
143 Emissions Performance
Pollutant concentration and emission rate measurements for NOX CO THCs SO2 TRS CH4 and CO2 were conducted on the turbine exhaust stack during all of the controlled test periods Testing for determination of TPM and NH3 was conducted at full load only Emissions testing coincided with the efficiency determinations described earlier The test procedures used are US EPA reference methods which are well documented in the Code of Federal Regulations (CFR) The reference methods include procedures for selecting measurement system performance specifications and test procedures quality control procedures and emission calculations (40CFR60 Appendix A) [12] Table 1-3 summarizes the standard test methods that were followed A complete discussion of the data quality requirements for example NOX analyzer interference test nitrogen dioxide [NO2] converter efficiency test sampling system bias and drift tests is presented in the test plan
Table 1-3 Summary of Emissions Testing Methods
Pollutant EPA Reference Method Analyzer Type Range
NOX 7E California Analytical Instruments (CAI) 400-CLD (chemiluminescense) 0 ndash 50 ppm
CO 10 TEI Model 48 (NDIR) 0 - 300 ppm
SO2 6C Bovar 721-AT (NDUV) 0 ndash 300 ppm
THC 25A California Analytical Instruments (FID) 0 ndash 300 ppm
CH4 18 Hewlett-Packard 5890 GCFID 0 - 300 ppm
CO2 3A CAI 200 (NDIR) 0 ndash 25
O2 3A CAI 200 (electrochemical) 0 ndash 25
TRS EPA 16A Ametek 921 White Cell (NDUV) 0 - 25 ppm
NH3 BAAQMD ST-1B Ion Specific Electrode Not specified
TPM EPA 5 Gravimetric Not specified
1-14
Emissions testing was conducted by Cubix Corporation of Austin Texas under the on-site supervision of the GHG Center field team leader A detailed description of the sampling system used for each parameter listed is provided in the test plan and is not repeated in this report Sampling was conducted during each test for approximately 30 minutes at a single point near the center of the 10-inch diameter stack Results of the gaseous pollutant testing are reported in units of parts per million volume dry (ppmvd) and ppmvd corrected to 15-percent O2 Concentrations of TPM are reported in units of grains per standard cubic foot (grdscf)
To convert measured pollutant concentrations to mass emissions exhaust gas flow rate determinations were conducted during each test run in accordance with EPA Method 2C Stack gas velocity and temperature traverses were conducted using a calibrated thermocouple a standard pitot tube and an inclined oil manometer The number and location of traverse points sampled was selected in accordance with EPA Method 1 At the conclusion of each test run equations specified in the reference methods were used to calculate exhaust gas velocity actual volumetric flow rate and volumetric flow rate at standard conditions
After converting measured pollutant concentrations to mass units of lbdscf emission rate values were calculated in units of lbhr using the standardized volumetric flow rates The mean of the three test results at each load factor is reported as the average emission rate for that load factor Emission rates for each pollutant are then normalized to system power and reported in terms of lbkWh
144 Estimated Annual Emission Reductions
The electric energy generated by the microturbine offsets electricity otherwise supplied by the utility grid Consequently the reduction in electricity demand from the grid caused by this offset will result in changes in CO2 and NOX emissions associated with producing an equivalent amount of electricity at central power plants If the CHP emissions per kWh are less than the emissions per kWh produced by an electric utility it can be inferred that a net reduction in emissions will occur at the site If the emissions from the on-site generators are greater than the emissions from the grid possibly due to the use of higher efficiency power generation equipment or zero emissions generating technologies (nuclear and hydroelectric) at the power plants a net increase in emissions may occur
The test plan included a detailed approach for estimating the emission reductions that this CHP system can provide Briefly the proposed approach estimated the annual microturbine NOX and CO2 emissions using the emission rates measured during the full load testing and the average generating rate measured during an extended test period The estimated annual CHP emissions could then be calculated in units of tons per year and compared to average emission rates published by the Energy Information Administration (EIA) for the US and Colorado The proposed approach did not include emission reductions associated with heat recovery as this process requires baseline GHG emission assessment from standard waste management practices Due to the significant resources required to do this OEMC elected to verify emission reductions from electricity generation only
Due to the cancellation of the extended test period estimation of annual power production CHP emissions could not be completed For this reason results of the microturbine CHP testing only provide measured emission rates A simple comparison of these emission rates for NOX and CO2 to the US and Colorado regional fossil fuel emission factors is all that the GHG Center can report here with the limited data set collected during this verification
1-15
20 VERIFICATION RESULTS
21 OVERVIEW
The verification testing was conducted on February 14 and 15 2004 This included the controlled tests at the four operating loads and the abbreviated continuous monitoring period to examine heat and power output and power quality The GHG Center acquired several types of data that represent the basis of verification results presented here The following types of data were collected and analyzed during the verification
bull Continuous measurements (biogas pressure biogas temperature power output and quality heat recovery rate and ambient conditions)
bull Manual biogas flow meter readings bull Biogas compositional data bull Emissions testing data bull CHP and facility operating data
The field team leader reviewed verified and validated some data such as DAS file data and reasonableness checks while on site The team leader reviewed collected data for reasonableness and completeness in the field The data from each of the controlled test periods was reviewed on site to verify that PTC-22 variability criteria were met The emissions testing data was validated by reviewing instrument and system calibration data and ensuring that those and other reference method criteria were met Factory calibrations for fuel flow pressure temperature electrical and thermal power output and ambient monitoring instrumentation were reviewed on site to validate instrument functionality Other data such as biogas analysis results were reviewed verified and validated after testing had ended All collected data was classed as either valid suspect or invalid upon review using the QAQC criteria specified in the test plan Review criteria are in the form of factory and on-site calibrations maximum calibration and other errors audit gas analyses results and lab repeatability results Results presented here are based on measurements which met the specified Data Quality Indicators (DQIs) and QC checks and were validated by the GHG Center
With the exception of the reduced load test conditions the microturbine CHP performance data collected during the 35-hour verification period are representative of normal site operations Due to the cancellation of the extended monitoring period the GHG Center was unable to obtain a reasonable set of data to examine daily trends in atmospheric conditions and their impact on electricity and heat production It should be noted that the results presented here may not represent performance over longer operating periods or at significantly different operating conditions
Test results are presented in the following subsections
Section 21 ndash Heat and Power Production Performance (controlled testing and monitoring period)
Section 22 ndash Power Quality Performance (continuous monitoring)
Section 23 ndash Emissions Performance and Reductions (controlled test periods)
2-1
The results show that the quality of power generated by the CHP system is generally high and that the unit is capable of operating in parallel with the utility grid The unit produced between 19 and 24 kW of net electrical power depending on ambient temperature (35 to 60 oF) during the monitoring period The highest heat recovery rate measured during the extended monitoring period was approximately 138 x 103Btuhr Electrical and thermal efficiencies at full power averaged 204 and 333 percent respectively with a corresponding total CHP system efficiency of 537 percent NOX emissions were very low at full load averaging 18 ppmvd at 15 O2 and 82 x 10 ndash 5 lbkWh
In support of the data analyses the GHG Center conducted an audit of data quality (ADQ) following procedures specified in the QMP A full assessment of the quality of data collected throughout the verification period is provided in Section 30 The data quality assessment was used to demonstrate that the data quality objectives (DQOs) introduced in the test plan were met for this verification
22 HEAT AND POWER PRODUCTION PERFORMANCE
The heat and power production performance evaluation included electrical power output heat recovery and CHP efficiency determinations during controlled test periods The performance evaluation also included determination of total electrical energy generated and used and thermal energy recovered over the continuous monitoring period
221 Electrical Power Output Heat Recovery Rate and Efficiency During Controlled Tests
Table 2-1 summarizes the power output heat recovery rate and efficiency performance of the CHP system Ambient temperature ranged from 45 to 58 oF relative humidity ranged from 23 to 41 percent and barometric pressure was between 1269 and 1271 psia during the controlled test periods The results shown in Table 2-1 and the discussion that follows are representative of conditions encountered at this site and are not intended to indicate performance at other operating conditions such as cooler temperatures and different elevations Biogas fuel conditions and heat recovery unit operation data corresponding to the test results are summarized in Table 2-2
Biogas fuel conditions and heat recovery unit operation data corresponding to the test results are summarized in Table 2-2 A total of 12 samples were collected for compositional analysis and determination of LHV There was very little variability in the biogas composition Average biogas CH4 and CO2 concentrations were 681 and 312 percent respectively The average LHV was 625 Btuscf and biogas compressibility averaged 0997 H2S concentrations in the biogas averaged 3730 ppm
The average net electrical power delivered to the farm was 199 kWe at full load The average electrical efficiency corresponding to these measurements was 204 percent Electrical efficiencies at the 24 20 and 15 kW power commands averaged 203 186 and 157 percent respectively Electric power generation heat rate which is an industry-accepted term to characterize the ratio of heat input to electrical power output averaged 16726 BtukWhe at full power
The average heat-recovery rate at full power was 111 x 103 Btuhr or 324 kWthhr and thermal efficiency was 333 percent The average total efficiency (electrical and thermal combined) was 537 percent for the three test runs The net heat rate which includes energy from heat recovery was 6354 BtukWht
2-2
Table 2-1 Microturbine Heat and Power Production Performance
Test ID Test
Condition
Heat Input HI
(103Btuhr)
Electrical Power Generation Performance
Heat Recovery Performance Total CHP
System Efficiency
()
Ambient Conditions c
Power Delivered a
(kWe)
Efficiency ()
Heat Recovery
Rate b
(103Btuhr)
Thermal Efficiency
() Temp (oF) RH ()
Run 1 Run 2 Run 3
Avg
30 kW power command
330 336 330
332
197 201 198
199
204 204 204
204
113 105 113
111
344 314 341
333
548 518 545
537
554 584 568
569
261 241 245
249 Run 4 Run 5 Run 6
Avg
24 kW power command
323 324 322
323
192 193 193
193
203 203 204
203
111 117 119
116
343 361 371
358
546 564 575
562
563 531 497
530
234 259 294
262 Run 7 Run 8 Run 9
Avg
20 kW power command
279 274 274
276
150 150 150
150
183 187 187
186
110 108 106
108
394 396 385
392
577 583 572
577
450 461 476
462
411 398 380
396 Run 10 Run 11 Run 12
Avg
15 kW power command
221 220 219
220
101 101 102
101
156 157 158
157
935 978 996
969
424 444 454
441
580 602 612
598
506 508 506
506
346 349 352
349
a Represents actual power available for consumption at the test site b Divide by 3412 to convert to equivalent kilowatts (kWth) c Barometric pressure was within the range of 1269 to 1271 psia throughout the test period
2-3
Table 2-2 Fuel Input and Heat Recovery Unit Operating Conditions
Test ID Test
Condition
Biogas Fuel Input Heating Loop Fluid Conditions
Gas Flow Rate (scfm)
LHV (Btuscf)
Gas Pressure
(psia)
Gas Temp (oF)
Fluid Flow Rate V (gpm)
Outlet Temp T1
(oF)
Inlet Temp T2
(oF)
Temp Diff (oF)
Run 1 Run 2 Run 3
Avg
30 kW power command
876 891 877
881 6276a
1389 1385 1383
1386
945 966 968
959
283 284 284
284
1013 1008 1008
1010
932 933 928
931
81 75 80
79 Run 4 Run 5 Run 6
Avg
24 kW power command
859 860 855
858
1384 1384 1385
1384
958 947 927
944
284 283 284
284
1011 1012 1008
1010
933 929 923
928
79 83 85
82 Run 7 Run 8 Run 9
Avg
20 kW power command
735 721 723
726 6325b
1396 1395 1395
1395
881 891 900
891
285 284 284
284
969 973 975
976
891 896 900
896
78 77 75
77 Run 10 Run 11 Run 12
Avg
15 kW power command
581 580 578
580
1397 1397 1394
1396
935 947 949
944
284 284 284
284
973 978 979
977
906 908 909
908
66 70 71
69 a Average of three separate samples collected on February 14 2004 b Average of three separate samples collected on February 15 2004
2-4
0
5
10
15
20
25
30
35
40
45
50
Effic
ienc
y (
)
0
5
10
15
20
25
Pow
er O
utpu
t(kW
)
30 kW Power Command 20 kW Power 15 kW Power Command24 kW Power
Power Output
ElectricalEfficiency
ThermalEfficiency
Results of the reduced load tests are also included in the tables Results show that electrical efficiency decreases slightly as the power output is reduced Thermal efficiency however increases as power output (and biogas consumption) decreases These trends are illustrated in Figure 2-1 which displays the electrical and thermal CHP system efficiency at each of the controlled test conditions
CommandCommand
0
5
10
15
20
25
30
35
40
45
50
Effic
ienc
y (
)
0
5
10
15
20
25
Pow
er O
utpu
t (kW
)
30 kW Power Command 20 kW Power Command
15 kW Power Command24 kW Power Command
Power Output
Electrical Efficiency
Thermal Efficiency
Figure 2-1 Electrical and Thermal Efficiency During Controlled Test Periods
As expected the high altitude of the test location (approximately 3700 feet above sea level) derated microturbine power output Table 2-1 and Figure 2-1 show that the power delivered at full load (after parasitic loads) was only 199 kW Power delivered at the 24 kW power command was nearly the same at 193 kW
222 Electrical and Thermal Energy Production During the Continuous Monitoring Period
Figure 2-2 presents a time series plot of power production and heat recovery during the abbreviated 35shyhour monitoring period The system was operated continuously at a power command of 30 kW except for periods when reduced load tests were conducted The CHP system was operated under typical farm conditions with the engine shut down and the heat recovery system configured to maintain digester temperature at around 100 oF A total of 6834 kWhe electricity and 1025 kWhth of thermal energy were generated over the 35-hour operating period The average power generated over the continuous monitoring period (excluding the reduced load testing) was 206 kWe and the average heat recovery rate was 1177 x 103 Btuhr
2-5
0
5
10
15
20
25
30Po
wer
Out
put (
kW)
70
90
110
130
150
170
Heat
Rec
over
y R
ate
(10
3 Btu
hr)
35 Consecutive Hours of Monitorin
Power Output
HeatRecoveryRate
Reduced LoadControlled TestPeriods
g 0
5
10
15
20
25
30Po
wer
Out
put (
kW)
70
90
110
130
150
170
Heat
Rec
over
y R
ate
(10
3 Btu
hr)
35 Consecutive Hours of Monitoringg35 Consecutive Hours of Monitorin
Power Output
Heat Recovery Rate
Reduced Load Controlled Test Periods
21404 21504221404 215041404 215041130 2230111130 223030 2230
Figure 2-2 Heat and Power Production During the Monitoring Period
The power output trace shows periodic trips at intervals of approximately four hours This was caused by the manner in which the facility was operating the biogas compressor To prevent damage to the compressor caused by moisture buildup in the condensate trap the trap was configured to automatically open momentarily to drain every four hours This caused a brief loss of fuel pressure thereby causing the microturbine to trip and restart The entire sequence normally took about 4 minutes to complete and in most cases the turbine was back to full power in 4 minutes The farm reports that the microturbine is no longer operated in this way
As is typical for gas fired turbines power output was also affected by ambient temperature The impact of temperature on this turbine is illustrated in Figures 2-3 and 2-4
2-6
0
5
10
15
20
25
Pow
er O
utpu
t (kW
)
20
40
60
80
Inle
t Air
Tem
pera
ture
(o F)
35 Consecutive Hours of Monitorin
Inlet AirTemperature
Power Output
25
Inlet Air Temperature
Power Output
80
Pow
er O
utpu
t (kW
)
20
60
15
10
40
Inle
t Air
Tem
pera
ture
( o F)
5
0 20 35 Consecutive Hours of Monitorin 35 Consecutive Hours of Monitoringgg
21404 21504221404 215041404 215041130 2230111130 223030 2230
Figure 2-3 Power Output and Ambient Temperature During the Verification Period
15
16
17
18
19
20
21
22
23
24
25
Pow
er O
utpu
t (kW
)
30 35 40 45 50 55 60 65
Ambient Temperature (oF)
Figure 2-4 Ambient Temperature Effects on Power Production During the Verification Period
Figure 2-4 plots power output at full load over the limited test period as a function of ambient temperature and indicates a generally linear relationship The generating rate ranged from about 19 to 235 kW across a temperature range of 349 to 596 oF
2-7
23 POWER QUALITY PERFORMANCE
231 Electrical Frequency
Electrical frequency measurements (voltage and current) were monitored continuously during the verification period The one-minute average data collected by the electrical meter were analyzed to determine maximum frequency minimum frequency average frequency and standard deviation for the verification period These results are illustrated in Figure 2-5 and summarized in Table 2-3 The average electrical frequency measured was 59999 Hz and the standard deviation was 0010 Hz
60060 606
60060 404
60060 202
60060 000
59959 898
59959 696
59959 494
59599922
222111444000444111111333000
35 C35 C35 Consonsonseeecccutututiiivvveee HHHooouuursrsrs ofofof MoMoMonininitttooorrriiingngng 222111555000444222222303030
Figure 2-5 Microturbine Frequency During Verification Period
Table 2-3 Electrical Frequency During Monitoring Period
Parameter Frequency (Hz) Average Frequency 59999 Minimum Frequency 59959 Maximum Frequency 60037 Standard Deviation 0010
Freq
uenc
y (H
z)Fr
eque
ncy
(Hz)
2-8
232 Voltage Output
It is typically accepted that voltage output can vary within plusmn 10 percent of the standard voltage (480 volts) without causing significant disturbances to the operation of most end-use equipment (ANSI 1996) The 7500 ION electric meter was configured to measure 0 to 600 VAC The turbine was grid-connected and operated as a voltage-following current source The voltage levels measured are therefore more indicative of the grid voltage levels that the Capstone tried to respond to
Figure 2-6 plots one-minute average voltage readings and Table 2-4 summarizes the statistical data for the voltages measured on the turbine throughout the verification period The voltage levels were well within the normal accepted range of plusmn 10 percent
460
470
480
490
500
Vol
tage
35 Consecutive Hours of Monitoring
460
470
480
490
500
Vol
tage
35 Consecutive Hours of Monitoring35 Consecutive Hours of Monitoring222111444000444111111333000
222111555000444222222333000
Figure 2-6 Microturbine Voltage During Verification Period
Table 2-4 Microturbine Voltage During Monitoring Period
Parameter Volts Average Voltage 48725 Minimum Voltage 47843 Maximum Voltage 49186 Standard Deviation 245
2-9
233 Power Factor
Figure 2-7 plots one-minute average power factor readings and Table 2-5 summarizes the statistical data for power factors measured on the turbine throughout the verification period The data include only periods when the microturbine was operating Data collected during the periodic trips are not included in the figure or summary table Test results show that the power factor was very stable throughout the period with the turbine at full load The power factor decreased during the low load controlled test periods
Figure 2-7 Microturbine Power Factor During Verification Period
88
90
92
94
96
98
Pow
er F
acto
r (
)
35 Consecutive Hours of Monitoring 88
90
92
94
96
98
Pow
er F
acto
r (
)
35 Consecutive Hours of Monitoring35 Consecutive Hours of Monitoring21404 215042121404 21504404 215041130 2230111130 223030 2230
Table 2-5 Power Factors During Monitoring Period
Parameter Average at full load 9453 Minimum at full load 9177 Maximum at full load 9493 Standard Deviation at full load 0240 Average at 20 kW 9280 Average at 15 kW 8987
2-10
234 Current and Voltage Total Harmonic Distortion
The turbine total harmonic distortion up to the 63rd harmonic was recorded for current and voltage output using the 7500 ION The average current and voltage THD were 321 and 189 percent respectively (Table 2-6) Both were well within the IEEE 519 specification of plusmn 5 percent Figure 2-8 plots the current and voltage THD throughout the verification period Figure 2-8 clearly shows a spike in current THD each time the microturbine was tripped by the biogas pressure loss The highest of the spikes was 32 percent
Table 2-6 Microturbine THD During Monitoring Period
Parameter Current THD () Voltage THD () Average 321 189 Minimum 222 160 Maximum 325 316 Standard Deviation 115 018
Figure 2-8 Microturbine Current and Voltage THD During Verification Period
0
2
4
6
8
10
12
THD
()
35 Consecutive Hours of Monitoring
Voltage THD
Current THD
0
2
4
6
8
10
12
THD
()
35 Consecutive Hours of Monitoring35 Consecutive Hours of Monitoring
Voltage THD
CurrentTHD
21404 21504221404 215041404 215041130 2230111130 223030 2230
2-11
24 EMISSIONS PERFORMANCE
241 Microturbine CHP System Emissions
Testing was conducted on the turbine exhaust stack to determine emission rates for NOX CO THC SO2 TRS CH4 and CO2 at each of the four controlled test conditions Testing for determination of TPM and NH3 was conducted at full load only Stack emission measurements were conducted using the reference methods summarized in Table 1-3 and detailed in the test plan The CHP system was maintained in a stable mode of operation during each test run based on PTC-22 variability criteria
Sampling system QAQC checks were conducted in accordance with test plan specifications to ensure the collection of adequate and accurate emissions data These included analyzer linearity tests and sampling system bias and drift checks Results of the QAQC checks are discussed in Section 325 The results show that DQOs for all gas species met the reference method requirements Table 2-7 summarizes the emission rates measured during each run and the overall average emissions for each set of tests
NOX concentrations averaged 175 ppmvd at 15 O2 at full load and increased to 346 ppmvd at the lowest load tested (setting of 15 kW) The overall average NOX emission rate at full load normalized to power output was 000008 lbkWh The benefits of lower NOX emissions from the CHP system are further enhanced by the fact that some of the exhaust heat is recovered and used Annual published data from Energy Information Administration (EIA) reveal that the measured CHP system NOX emission rate is well below the weighted average US and Colorado regional grid emission factors identified in the test plan which are 00066 and 00077 lbkWh respectively As stated earlier the center could not estimate annual emission reductions due to insufficient power production data but the emissions testing results clearly indicate that reductions will be realized through use of this CHP system The emission reductions are further increased when transmission and distribution system losses are accounted for
Average exhaust gas CO concentrations ranged from a low of 305 ppmvd at 15 O2 at full load to a high of 451 ppmvd at 15 O2 at the 15 kW power command Corresponding average CO emission rates at these power commands were approximately 0009 and 0017 lbkWh respectively
Similarly THC (and CH4) concentrations increased as power output decreased and ranged from 165 ppmvd at 15 O2 at full load to 475 ppmvd at 15 O2 at the 15 kW power command Corresponding average THC emission rates at these power commands were approximately 0003 and 0011 lbkWh respectively The CH4 emissions consistently comprised about 80 percent of the THC emissions
Concentrations of CO2 in the CHP system exhaust gas averaged 23 percent at full load and decreased as power output was reduced to a low of 20 percent These concentrations correspond to average CO2 emission rates of 345 lbkWh and 390 lbkWh respectively The CHP system CO2 emission rate at full load is higher than the weighted average fossil fuel emission factors for both the US and Colorado regional grids (202 and 213 lbkWh respectively) This indicates a likely increase in annual CO2 emissions for power production from this system but this increase would likely be offset by efficiency gains resulting from heat recovery and use and elimination of transmission and distribution system losses
2-12
Table 2-7 Microturbine CHP System Emissions During Controlled Test Periods
Pow
erC
omm
and
(kW
)
Elec
tric
alPo
wer
Out
put
(kW
) Exhaust
O2 ()
NOx Emissions CO Emissions THC Emissions CH4 Emissions CO2 Emissions
(ppm at
15 O2) (lbhr) (lbkWh)
(ppm at
15 O2) (lbhr) (lbkWh)
(ppm at
15 O2) (lbhr) (lbkWh)
(ppm at
15 O2) (lbhr) (lbkWh) () (lbhr) (lbkWh)
Run 1
Run 2
Run 3
AVG
30
197
201
198
199
191
191
192
191
170
180
174
175
161E-03
167E-03
161E-03
163E-03
817E-05
831E-05
814E-05
821E-05
250
310
354
305
0144
0175
0199
0173
0007
0009
0010
0009
141
163
190
165
0046
0052
0061
0053
235E-03
261E-03
310E-03
269E-03
112
141
157
137
0037
0045
0051
0044
187E-03
226E-03
256E-03
223E-03
23
23
23
23
682
668
707
686
346
332
358
345
Run 4
Run 5
Run 6
AVG
24
192
193
193
193
191
192
192
192
190
201
198
196
184E-03
184E-03
180E-03
183E-03
954E-05
952E-05
936E-05
947E-05
319
345
364
343
0188
0191
0202
0194
0010
0010
0010
0010
184
194
200
193
0062
0061
0063
0062
321E-03
319E-03
328E-03
323E-03
141
155
183
160
0047
0049
0058
0051
246E-03
254E-03
300E-03
267E-03
23
23
23
23
696
696
696
696
362
361
361
361
Run 7a
Run 8
Run 9
AVG
20
150
150
150
150
193
193
193
193
505
575
572
399
0004
0042
0042
0029
248E-04
281E-03
279E-03
195E-03
590
192
199
327
0263
0086
0089
0146
0018
0006
0006
0010
365
132
126
208
0093
0034
0032
0053
622E-03
225E-03
214E-03
354E-03
293
97
105
165
0075
0025
0027
0042
499E-03
165E-03
179E-03
281E-03
22
22
22
22
569
569
569
569
380
379
378
379
Run 10
Run 11
Run 12
AVG
15
101
101
102
101
190
191
191
191
332
351
354
346
0022
0022
0022
0022
219E-03
218E-03
220E-03
219E-03
441
459
452
451
0179
0176
0174
0176
0018
0017
0017
0017
483
484
457
475
0112
0106
0100
0106
110E-02
105E-02
987E-03
105E-02
360
413
410
394
0083
0091
0090
0088
824E-03
893E-03
885E-03
867E-03
20
20
20
20
395
395
395
395
391
390
390
390
a The NOX CO and CH4 concentrations during run 7 are questionable when compared to the data collected during runs 8 and 9 A brief 4-minute microturbine shutdown occurred at the conclusion of run 7 but the GHG Center was unable to resolve this anamoly after reviewing all available system operating data
2-13
Table 2-7 Microturbine CHP System Emissions During Controlled Test Periods (Continued)
Pow
erC
omm
and
(kW
)
Elec
tric
alPo
wer
Out
put
(kW
) Exhaust
O2 ()
Particulate Emissions NH3 Emissions SO2 Emissions TRS Emissions
(grdscf) (lbhr) (lbkWh)
(ppm at
15 O2) (lbhr) (lbkWh)
(ppm at
15 O2) (lbhr) (lbkWh)
(ppm at
15 O2) (lbhr) (lbkWh)
Run 1
Run 2
Run 3
AVG
30
197
201
198
199
191
191
192
191
00055
00053
00022
00043
0016
0015
0006
0012
811E-04
746E-04
304E-04
620E-04
005
004
002
004
170E-05
131E-05
600E-06
120E-05
862E-07
654E-07
304E-07
607E-07
488
582
614
561
064
073
081
073
0032
0036
0041
0037
155
144
570
119
0020
0018
0008
0015
101E-03
913E-04
406E-04
778E-04
Run 4
Run 5
Run 6
AVG
24
192
193
193
193
191
192
192
192
ND
ND
ND
NA
ND
ND
ND
NA
ND
ND
ND
NA
ND
ND
ND
NA
ND
ND
ND
NA
ND
ND
ND
NA
560
596
584
580
077
076
075
076
0040
0039
0039
0039
483
327
196
335
00067
00042
00025
00045
348E-04
218E-04
130E-04
232E-04
Run 7
Run 8
Run 9
AVG
20
150
150
150
150
193
193
193
193
ND
ND
ND
NA
ND
ND
ND
NA
ND
ND
ND
NA
ND
ND
ND
NA
ND
ND
ND
NA
ND
ND
ND
NA
594
590
588
591
061
060
061
061
0041
0040
0041
0040
820
678
581
693
00084
00069
00060
00071
561E-04
461E-04
401E-04
474E-04
Run 10
Run 11
Run 12
AVG
15
101
101
102
101
190
191
191
191
ND
ND
ND
NA
ND
ND
ND
NA
ND
ND
ND
NA
ND
ND
ND
NA
ND
ND
ND
NA
ND
ND
ND
NA
477
500
496
491
043
043
043
043
0043
0042
0042
0042
268
229
228
242
00024
00020
00020
00021
237E-04
198E-04
198E-04
211E-04
ND = No data collected These pollutants not tested at reduced loads NA = Not applicable
2-14
Emissions of total particulate matter and NH3 were extremely low during each of the three test replicates conducted at full power SO2 emissions from the CHP were fairly consistent throughout the range of operation At full load SO2 concentrations averaged 561 ppmvd at 15 O2 and corresponding emission rates averaged 0037 lbkWh Emissions of TRS the sulfurous compounds in the fuel that were not oxidized during combustion averaged approximately 780 ppmvd at 15 O2 and 0005 lbkWh during the full load tests
2-15
30 DATA QUALITY ASSESSMENT
31 DATA QUALITY OBJECTIVES
The GHG Center selects methodologies and instruments for all verifications to ensure a stated level of data quality in the final results The GHG Center specifies data quality objectives (DQOs) for each verification parameter before testing commences Each test measurement that contributes to the determination of a verification parameter has stated data quality indicators (DQIs) which if met ensure achievement of that verification parameterrsquos DQO
The establishment of DQOs begins with the determination of the desired level of confidence in the verification parameters Table 3-1 summarizes the DQOs established in the test planning stage for each verification parameter The actual data quality achieved during testing is also shown The next step is to identify all measured values which affect the verification parameter and determine the levels of error which can be tolerated These DQIs most often stated in terms of measurement accuracy precision and completeness are used to determine if the stated DQOs are satisfied The DQIs for this verification shyused to support the DQOs listed in Table 3-1 - are summarized in Table 3-2
Table 3-1 Verification Parameter Data Quality Objectives
Verification Parameter Original DQO Goala
Relative () Absolute (units) Achievedb
Relative () Absolute (units) Power and Heat Production Performance
Electrical power output (kW) plusmn 15 098 kW plusmn 10 020 kW Electrical efficiency () plusmn 15 041c plusmn 13 027c
Heat recovery rate (103Btuhr) plusmn 17 575 x 103Btuhrc plusmn 24 27 x 103Btuhrc
Thermal energy efficiency () plusmn 17 071c plusmn 25 083c
CHP production efficiency () plusmn 12 082c plusmn 16 087c
Power Quality Performance Electrical frequency (Hz) plusmn 001 0006 Hz plusmn 001 0006 Hz Voltage 10 48 Vc 10 49 Vc
Power factor () plusmn 050 TBD plusmn 050 047 Voltage and current total harmonic distortion (THD) () plusmn 100 TBD plusmn 100 003
Emissions Performance NOX CO CO2 O2 TRS and SO2 concentration accuracy plusmn 20 of spand plusmn 20 of spand
CH4 and THC concentration accuracy plusmn 50 of spand plusmn 50 of spand
TPM and NH3 concentration accuracy plusmn 50 plusmn 100 a Original DQO goals as stated in test plan Absolute errors were provided in the test plan where applicable based on anticipated
values b Overall measurement uncertainty achieved during verification The absolute errors listed are based on these uncertainties and the
average values measured during the verification c Calculated composite errors were derived using the procedures described in the corresponding subsections (Sections 322 through
325) d Qualitative data quality indicators based on conformance to reference method requirements
The DQIs specified in Table 3-2 contain accuracy precision and completeness levels that must be achieved to ensure that DQOs can be met Reconciliation of DQIs is conducted by performing independent performance checks in the field with certified reference materials and by following approved reference methods factory calibrating the instruments prior to use and conducting QAQC procedures in
3-1
the field to ensure that instrument installation and operation are verified The following sections address reconciliation of each of the DQI goals
This verification was supported by an Audit of Data Quality (ADQ) conducted by the GHG Center QA manager During the ADQ the QA manager randomly selected data supporting each of the primary verification parameters and followed the data through the analysis and data processing system The ADQ confirmed that no systematic errors were introduced during data handling and processing A performance evaluation audit (PEA) and a technical systems audit (TSA) were planned but not conducted Similar PEAs were recently conducted on two recent CHP verifications [13 14] and it was decided to not repeat the PEA a third time Likewise a full TSA was recently completed on a similar verification [13] where the same measurement systems were used so this QA activity was not repeated here Instead the GHG Center QA manager conducted an abbreviated project review to ensure that the verification approach and analytical procedures specified in the TQAP were followed or in cases where changes to the verification were necessary these changes were justified and documented Corrective action reports (CARs) are completed signed by the GHG Center QA manager and filed at the GHG Center that document significant changes to the verification approach or methodologies that occurred during the verification
32 RECONCILIATION OF DQOs AND DQIs
Table 3-2 summarizes the range of measurements observed in the field and the completeness goals Completeness is the number or percent of valid determinations actually made relative to the number or percent of determinations planned The completeness goals for the controlled tests were to obtain electrical and thermal efficiency as well as emission rate data for three test runs conducted at each of four different load conditions This completeness goal was achieved
Completeness goals for the extended tests were to obtain 90 percent of 7 days of power quality power output heat recovery rate and ambient measurements This goal was not achieved As explained in Section 21 the Center was not able to complete the entire 7-day extended monitoring period A total of 35 hours of data were logged including the controlled test periods
Table 3-2 also includes accuracy goals for measurement instruments Actual measurement accuracy achieved is also reported based on instrument calibrations conducted by manufacturers field calibrations reasonableness checks or independent performance checks with a second instrument Table 3-3 includes the QAQC procedures that were conducted for key measurements in addition to the procedures used to establish DQIs The accuracy results for each measurement and their effects on the DQOs are discussed below
3-2
3-3
Table 3-2 Summary of Data Quality Indicator Goals and Results
Measurement Variable Instrument Type and
Manufacturer
Instrument Range
Range Observed in
Field
Accuracy Completeness
Goal Actual How Verified or Determined Goal Actual
CHP System Power Output and Quality
Power
Electric Meter Power Measurements 7500 ION
0 to 100 kW 0 to 242 kW plusmn 15 reading plusmn 10 reading
Instrument calibration from manufacturer prior to testing
Controlled tests three valid runs per load meeting PTC 22 criteria
Extended test 90 of one minute readings for 7 days
Controlled tests three valid runs at each load
Extended test 35 consecutive hours of one minute readings
Voltage 0 to 600 V 478 to 492 V plusmn 10 reading plusmn 10 reading Frequency 55 to 65 Hz 599 to 600 Hz plusmn 001 reading plusmn 001 reading Current 0 to 200A 5 to 29 A plusmn 10 reading plusmn 10 reading Voltage THD 0 to 100 16 to 32 plusmn 10 full scale plusmn 10 full scale Current THD 0 to 100 22 to 325 plusmn 10 full scale plusmn 10 full scale
Power Factor 0 to 100 918 to 949 plusmn 05 reading plusmn 05 reading
CHP System Heat Recovery Rate
Inlet Temperature
Controlotron Model 1010EP
80 to 150 oF 89 to 94 oF Temps must be plusmn 15 oF of ref Thermocouples
plusmn 07 oF for outlet plusmn 08 oF for inlet
Independent check with calibrated thermocoupleOutlet
Temperature 80 to 150 oF 93 to 102 oF
Water Flow 0 to 150 gpm 281 to 286 gpm plusmn 10 reading plusmn 01 reading Instrument calibration from manufacturer prior to testing
Ambient Conditions
Ambient Temperature
RTD Vaisala Model HMD 60YO
-50 to 150 oF 35 to 60 o F plusmn 02 oF plusmn 02 oF
Instrument calibration from manufacturer prior to testing
Ambient Pressure
Setra Model 280E 0 to 25 psia 1268 to 1272
psia plusmn 01 full scale plusmn 005 full scale
Relative Humidity
Vaisala Model HMD 60YO 0 to 100 RH 21 to 49 RH plusmn 2 plusmn 02
(continued)
3-3
3-4
Table 3-2 Summary of Data Quality Indicator Goals and Results (continued)
Measurement Variable Instrument Type and Manufacturer
Instrument Range
Measurement Range
Observed
Accuracy Completeness
Goal Actual How Verified or Determined Goal Actual
Fuel Input
Gas Flow Rate Dresser-Roots Model 2M175 SSM Series B3 rotary displacement
0 to 30 scfm 5 to 10 scfm 10 of reading plusmn 03 of reading
Factory calibration with volume prover
Controlled tests three valid runs per load meeting PTC 22 criteria Extended test 90 of one- minute readings for 7 days
Controlled tests three valid runs at each load
Extended test 35 hours of one-minute readings
Gas Pressure Omega Model PX205shy030AI transducer 0 to 30 psia 12 to 14 psia plusmn 075 full
scale plusmn 025 full scale Instrument calibration to NIST traceable standards
Gas Temperature
Omega TX-93 Type K thermocouple 0 to 200 oF 75 to 97 oF plusmn 010 reading plusmn 010 reading
LHV Gas Chromatograph HP 589011
0 to 100 CH4
67 to 69 CH4 plusmn 30 accuracy plusmn 02 repeatability
plusmn 05 accuracy plusmn 005 repeatability
analysis of NIST-traceable CH4 standard and duplicate analysis on 3 samples
Controlled tests two valid samples per load
Controlled tests two valid samples per load627 to 633
Btuft3 01 repeatability
plusmn 006 repeatability
Conducted duplicate analyses on 3 samples
Exhaust Stack Emission
NOX Levels Chemiluminescent CAI 400-CLD
0 to 50 ppmvd 0 to 3 ppmvd plusmn 2 full scale le 2 full scale
Calculated following EPA Reference Method calibrations (Before and after each test run)
Controlled tests three valid runs per load
Controlled tests three valid runs per load
CO Levels NDIR TEI Model 48 0 to 300 ppmvd
50 to 160 ppmvd plusmn 2 full scale le 2 full scale
CH4 levels HP 5890 0 to 300 ppmv 30 to 130 ppmv plusmn 5 full scale le 5 reading
THC levels HP 5890 0 to 300 ppmv 40 to 160 ppmv plusmn 5 full scale le 5 full scale
SO2 Levels Bovar 721-AT 0 to 300 ppmvd
145 to 185 ppmvd plusmn 2 full scale le 2 full scale
O2 CO2 Levels CAI 200 0 to 25 10 to 20 O2
20 to 25 CO2 plusmn 2 full scale le 2 full scale
TRS Levels Ametek 921 0 to 25 ppmvd 0 to 5 ppmvd plusmn 2 full scale le 2 full scale
NH3 Levels Ion specific electrode 0 to 5 ugml 0 to 42 ugml plusmn 5 full scale le 5 full scale
TPM concentrations gravimetric Not specified 001 to 004 g plusmn 1 mg plusmn 05 mg
Stack gas velocity
Pitot and thermocouple Not specified 3552 to 3753
fpm plusmn 5 reading le 5 reading
3-4
321 Power Output
Instrumentation used to measure power was introduced in Section 10 and included a Power Measurements Model 7500 ION The data quality objective for power output was plusmn 15 percent of reading which includes compounded error of the instrument and the current transformers (CTs) The test plan specified factory calibration of the ION meter with a NIST-traceable standard to determine if the power output DQO was met The Test plan also required the GHG Center to perform several reasonableness checks in the field to ensure that the meter was installed and operating properly The following summarizes the results
The meter was factory calibrated by Power Measurements in April 2003 Calibrations were conducted in accordance with Power Measurementsrsquo standard operating procedures (in compliance with ISO 90021994) and are traceable to NIST standards The meters were certified by Power Measurements to meet or exceed the accuracy values summarized in Table 3-2 for power output voltage current and frequency NIST-traceable calibration records are archived by the GHG Center Pretest factory calibrations on the meters indicated that accuracy was within plusmn 005 percent of reading and this value combined with the 10-percent error inherent to the current transformers resulted in an overall error of plusmn 101 percent Using the manufacturer-certified calibration results and the average power output measured during the full-load testing the absolute error during all testing is plusmn 020 kW
Additional QC checks were performed on the 7500 ION to verify the operation after installation of the meters at the site and prior to the start of the verification test The results of these QC checks (summarized in Table 3-3) are not used to reconcile the DQI goals but to document proper operation in the field Current and voltage readings were checked for reasonableness using a hand-held Fluke multimeter These checks confirmed that the voltage and current readings between the 7500 ION and the Fluke were within the range specified in the test plan as shown in Table 3-3
These results led to the conclusion that the 7500 ION was installed and operating properly during the verification test The plusmn 10-percent error in power measurements as certified by the manufacturer was used to reconcile the power output DQO (discussed above) and the electrical efficiency DQO (discussed in Section 322)
3-5
Table 3-3 Results of Additional QAQC Checks
Measurement Variable QAQC Check When
PerformedFrequency Expected or Allowable
Result Results Achieved
Power Output
Sensor diagnostics in field Beginning and end of test Voltage and current checks
within plusmn 1 reading plusmn 01 voltage plusmn 09 current
Reasonableness checks Throughout test Readings should be around 22 kW net power output at full load
Readings were 20 to 24 kW at full load
Fuel Heating Value
Calibration with gas standards by laboratory
Prior to analysis of each lot of samples submitted
plusmn 10 for each gas constituent Results satisfactory see
Section 3224 Independent performance checks with blind audit sample
Twice during previous year
plusmn 30 for each major gas constituent (methane CO2)
Heat Recovery Rate
Meter zero check Prior to testing Reported water flow rate lt 01 gpm ndash006 gpm recorded
Independent performance check of temperature readings
Beginning of test period Difference in temperature readings should be lt 15 degF
Temperature readings within 08 degF of reference
322 Electrical Efficiency
The DQO for electrical efficiency was to achieve an uncertainty of plusmn 152 percent at full electrical load or less Recall from Equation 1 (Section 141) that the electrical efficiency determination consists of three direct measurements power output fuel flow rate and fuel LHV The accuracy goals specified to meet the electrical efficiency DQO consisted of plusmn 15 percent for power output plusmn 10 percent for fuel flow rate and plusmn 02 percent for LHV The accuracy goals for each measurement were met The following summarizes actual errors achieved and the methods used to compute them
Power Output As discussed in Section 321 factory calibrations of the 7500 ION with a NISTshytraceable standard and the inherent error in the current and potential transformers resulted in plusmn 10-percent error in power measurements Reasonableness checks in the field verified that the meter was functioning properly The average power output at full load was approximately 20 kW with a measurement error of plusmn 020 kW
Heat Input Heat input is the product of measured fuel flow rate and LHV The DQI goal for fuel flow rate was reconciled through calibration of the gas meter and the gas temperature and pressure sensors used to correct measured gas volumes to standard conditions All three components were calibrated with NIST-traceable standards As shown in Table 3-2 the individual instruments errors were 03 025 and 01 percent for flow pressure and temperature respectively The overall error in biogas flow rate on a wet basis then is 040 percent of reading
Since biogas flow rate was metered on a wet and low pressure basis but combusted by the microturbine on a dry high pressure basis measured flow rates were corrected for moisture content (Section 142) Since the actual moisture content of the as-fired biogas was not directly measured the assumption that the gas was completely dry introduced additional error into the heat input determination The center
3-6
conducted an analysis of this assumption and knowing the temperature and pressure of the gas as fired determined that the worst case error introduced by the assumption that the gas is totally dry is 07 percent Combining that uncertainty with the heat input wet basis error of 040 percent the overall error on determination of biogas flow rate on a dry basis is then 081 percent of reading
The average flow rate at full load was 881 scfm with an associated measurement error of plusmn 007 scfm Complete documentation of data quality results for fuel flow rate is provided in Section 325
Uncertainty in the biogas LHV results was within the 02 percent DQI goal (Section 326) The average LHV during testing was 630 Btuft3 and the measurement error corresponding to this heating value is plusmn 13 Btuft3 The heat input compounded error then is
Error in Heat Input = ( flowmetererror )2 + (LHVerror)2 (Equation 5)
= (00081)2 + (0002)2 = 00083
The measurement error amounts to approximately plusmn 27 x 103Btuhr or 083 percent relative error at the average measured heat input of 332 x 103Btuhr
The errors in the divided values compound similarly for the electrical efficiency determination The electrical power measurement error is plusmn 10 percent relative (Table 3-2) and the heat input error is plusmn 083 percent relative Therefore compounded relative error for the electrical efficiency determination is
Error in Elec Power Efficiency = (powermetererror)2 + (heatinputerror)2 (Equation 6)
= (0010)2 + (00083)2 = 00130
Electrical efficiency for the controlled test periods at full load was 204 plusmn 027 percent or a relative compounded error of 13 percent
323 PTC-22 Requirements for Electrical Efficiency Determination
PTC-22 guidelines state that efficiency determinations were to be performed within 60 minute test periods in which maximum variability in key operational parameters did not exceed specified levels Table 3-4 summarizes the maximum permissible variations observed in power output ambient temperature ambient pressure biogas pressure at the meter and biogas temperature at the meter for each test run The table shows that the requirements for all parameters were met for all test runs and the efficiency determinations were representative of stable operating conditions
3-7
Table 3-4 Variability Observed in Operating Conditions Maximum Observed Variationa in Measured Parameters
Power Output ()
Ambient Temp (oF)
Ambient Pressure ()
Biogas pressure
(psia)
Power Factor ()
Maximum Allowable Variation plusmn 2 plusmn 4 plusmn 05 plusmn 1 plusmn 2
Run 1 06 11 003 02 02 Run 2 17 07 003 01 01 Run 3 18 06 002 01 01 Run 4 03 22 001 02 01 Run 5 03 09 001 02 01 Run 6 04 25 002 02 02 Run 7 03 03 001 03 01 Run 8 04 07 001 01 01 Run 9 02 08 001 02 01
Run 10 04 05 002 01 01 Run 11 04 04 003 02 01 Run 12 03 04 002 03 01
a Maximum (Average of Test Run ndash Observed Value) Average of Test Run 100
324 Ambient Measurements
Ambient temperature relative humidity and barometric pressure at the site were monitored throughout the verification period and the controlled tests The instrumentation used is identified in Table 3-2 along with instrument ranges data quality goals and data quality achieved All three sensors were factoryshycalibrated using reference materials traceable to NIST standards The pressure sensor was calibrated prior to the verification testing confirming the plusmn 01 percent accuracy The temperature and relative humidity sensors were also calibrated within a year prior to testing which verified that the plusmn 02 degF accuracy goal for temperature and plusmn 2 percent accuracy goal for relative humidity were met
325 Fuel Flow Rate
The Dresser-Roots Model 2M175 rotary displacement gas meter was factory-calibrated prior to installation in 1999 Calibration records were obtained and reviewed to ensure that the plusmn 10-percent instrument accuracy goal was satisfied The original calibration for the Roots meter indicating an accuracy of plusmn 032 percent is a permanent calibration This error combines with the errors in the gas temperature pressure and moisture determinations for an overall biogas flow rate measurement error of plusmn 081 percent
326 Fuel Lower Heating Value
Biogas sample collection date time run number and canister ID were logged along with laboratory chain of custody forms and were shipped along with the samples Copies of the chain of custody forms and results of the analyses are stored in the GHG Center project files Collected samples were shipped to Empact Analytical Laboratories of Brighton CO for compositional analysis and determination of LHV
3-8
per ASTM test Methods D1945 [6] and D3588 [7] respectively The DQI goals were to measure methane concentrations within plusmn 30 percent of a NIST-traceable blind audit sample and to achieve less than plusmn 02 percent difference in LHV duplicate analyses results Blind audits were submitted to Empact on two similar verifications within the past year to evaluate analytical accuracy on the methane analyses [13 14] Both audits indicated analytical accuracy within 05 percent and repeatability of within plusmn 02 percent Since the same sampling and analytical procedures were used here by the same analyst the audit was not repeated a third time
Duplicate analyses in addition to the blind audit samples were conducted on three of the samples collected during the controlled test periods Duplicate analysis is defined as the analysis performed by the same operating procedure and using the same instrument for a given sample volume Results of the duplicate analyses showed an average analytical repeatability of 006 percent for methane and 006 percent for LHV The results demonstrate that the plusmn 02 percent LHV accuracy goal was achieved As such both DQIs were met with the methane accuracy at plusmn 05 percent and the LHV repeatability at plusmn 006 percent
327 Heat Recovery Rate and Efficiency
Several measurements were conducted to determine CHP system heat-recovery rate and thermal efficiency These measurements include water flow rate water supply and return temperatures and CHP system heat input The individual errors in each of the measurements is then propagated to determine the overall error in heat-recovery rate and efficiency The Controlotron ultrasonic heat meter was used to continuously monitor water flow rate This meter has a NIST-traceable factory-calibrated accuracy of plusmn 10 percent of reading (this flow through calibration was conducted on October 9 2002) This certification serves as the primary DQI A zero check was also performed on the flow meter The meter reading was -006 gpm with the CHP system shut down and the circulation pump off
Table 3-2 showed that the DQI for supply and return temperatures (delta T) was achieved Each temperature sensor was calibrated against a reference thermocouple with NIST-traceable accuracy The error in the two temperature sensors resulted in an overall delta T uncertainty of 08 oC This absolute error equates to a relative error of 22 percent at the average fluid temperatures measured during the fullshyload testing (about 361 oC) The overall error in heat recovery rate is then the combined error in flow rate and temperature differential This error compounds multiplicatively as follows
Overall Heat Meter Error = (Flow rate error)2 + (compositional error) 2 (Equation 7)
( ) 0240)0220(0100 22 =+=
The heat recovery rate determination therefore has a relative compounded error of plusmn 24 percent The absolute error in the average heat recovery rate at full load (111 x 103Btuhr) then is plusmn 27 x 103Btuhr
This error in heat-recovery rate and the heat input error (083 percent) compound similarly to determine the overall uncertainty in the thermal efficiency determination as follows
Error in Heat Recovery Efficiency = (0024)2 + (00083)2 = 0025 (Equation 8)
Average heat recovery rate (thermal) efficiency at full load then is 333 plusmn 083 percent or a relative compounded error of 25 percent This compounded relative error exceeds the data quality objective
3-9
slightly but the absolute error is within the goal for this verification parameter (measured values were lower than anticipated)
328 Total Efficiency
Total efficiency is the sum of the electrical power and heat-recovery efficiencies Total efficiency is defined as 204 plusmn 027 percent (plusmn 130-percent relative error) plus 333 plusmn 063 percent (plusmn 19-percent relative error) This is based on the determined errors in electrical and thermal efficiency at full load The absolute errors compound as follows
errcabs = err12 + err2
2 (Equation 9)
870830270 22 =+=
Relative error is
errcrel =errcabs (Equation 10)
Value1 +Value2
087 = = 0016
204 + 333 where
errcabs = compounded error absolute err1 = error in first added value absolute value err2 = error in second added value absolute value errcrel = compounded error relative value1 = first added value value2 = second added value
The total CHP efficiency at full load is then 537 plusmn 087 percent or 16 percent relative error Again this compounded relative error exceeds the data quality objective slightly
329 Exhaust Stack Emission Measurements
EPA reference method requirements form the basis for the qualitative DQIs specified in the Test plan and listed in Tables 3-1 and 3-2 Each method specifies sampling and calibration procedures and data quality checks These specifications when properly implemented ensure the collection of high quality and representative emissions data The specific sampling and calibration procedures vary by method and class of pollutants and are summarized in Table 3-5 The table lists the method quality requirements the acceptable criteria and the results for the test conducted here It is generally accepted that conformance to the reference method quality requirements demonstrates that the qualitative DQIs have been met
All of the emissions testing and reference method quality control procedures were conducted by Cubix Corporation either in the field during testing or in their calibration and analytical laboratories in Austin Texas All of the field sampling procedures and calibrations were closely monitored by GHG Center personnel In addition documentation of all sampling and analytical procedures data collection and
3-10
calibrations have been procured reviewed and filed by the GHG Center Table 3-5 is followed by a brief explanation of the QAQC procedures implemented for each class of pollutant quantified during this verification
Table 3-5 Summary of Emissions Testing Calibrations and QC Checks
Measurement Variable
Calibration or QC Check
When Performed and Frequency
Expected or Allowable Result
Result of Calibration(s) or Check(s)
NOX CO CO2 SO2 TRS and O2 concentrations
Analyzer calibration error test
Daily before testing plusmn 2 of analyzer span All within allowable level for each day
System bias checks Before each test run plusmn 5 of analyzer span All within allowable level for each test run Calibration drift test After each test run plusmn 3 of analyzer span
THC concentrations System calibration error test
Daily before testing plusmn 5 of analyzer span All within allowable level for each day
System calibration drift test
After each test run plusmn 3 of analyzer span All within allowable level for each test run
CH4 concentrations Triplicate injections Each test run plusmn 5 difference All within allowable level for each test run
Calibration of GC with gas standards by certified laboratory
Immediately prior to sample analyses andor at least once per day
plusmn 5 for each compound
All within allowable level for each day
TPM emissions Pre and post test sampling system leak checks
Before and after each test run
Sampling system leak rate lt 002 cfm
All checks lt 002 cfm
Minimum sample volume After each test run Corrected Vol gt 600 dscf
Volumes ranged from 694 to 796 dscf
Percent isokinetic sampling rate (I)
After each test run 90 lt I lt 110 91 lt I lt 102
Analytical balance calibration
Once before analysis plusmn 00001 g Within allowable level
Filter and reagent blanks Once during testing after first test run
lt 10 of particulate catch for first test run
Blank weights lt 10 of each sample catch
Dry gas meter calibration Once before and once after testing
plusmn 5 Pre and post test calibrations within 1
Thermocouple calibration Once after testing plusmn 15 of average stack temperature
Within 03 of reference TC
NH3 concentrations Calibration of instrument with NH3 standards
Immediately prior to sample analyses at least once a day
plusmn 5 Pre test calibrations within 1 of working standards
Dry gas meter calibration Once before and once after testing
plusmn 5 Pre and post test calibrations within 1
Exhaust gas volumetric flow rate
Pitot tube dimensional calibration inspection
Once before and once after testing
See 40CFR60 Method 2 Section 100
Calibration criteria met
Thermocouple calibration Once after testing plusmn 15 of average stack temperature
Within 03 of reference TC
3291 NOX CO CO2 SO2 TRS and O2 Concentrations
Test personnel performed sampling system calibration error tests prior to each test run All calibrations employed a suite of three EPA Protocol No 1 calibration gases (four for CO) that spanned the instrument ranges Appropriate calibration ranges were selected for each pollutant based on exhaust gas screening (ranges are summarized in Table 3-2) The daily analyzer calibration error goal for each instrument was plusmn 20 percent of span It was met for each analyzer during each day of testing
3-11
Sampling system bias was evaluated for each parameter at the beginning of each test run using the zero and mid-level calibration gases System response to the zero and mid-level calibration gases also provided a measure of drift and bias at the end of each test run The maximum allowable sampling system bias and drift values were plusmn 5 and plusmn 3 percent of span respectively These specifications were met for each parameter and for each test run Testers also performed a NOX converter efficiency test as described in Section 35 of the test plan The converter efficiency was 9998 percent which meets the 98shypercent goal specified in the method
3292 THC Concentrations
Following Method 25A criteria the analyzer calibration error test is not performed on the THC analyzer Instead a 4-point system bias test is conducted at the beginning of each test day System response must be within plusmn 5 percent of the calibration standard at each point System response to the zero and mid-level calibration gases also provided a measure of drift and bias at the end of each test run The maximum allowable sampling system bias and drift values were plusmn 5 and plusmn 3 percent of span respectively These specifications were met for test run
3293 CH4 Concentrations
The test plan specified EPA Method 18 for determining stack gas methane concentrations This testing was conducted on-site eliminating the need to collect bag samples for transport to a laboratory Test operators injected calibration gas standards into the gas chromatograph (GC) to establish a concentration standard curve prior to sample analysis The operator repeated the injections until the average of all desired compounds from three separate injections agreed to within 50 percent of the certified value The acceptance criterion was met for all runs
The analysts injected the mid-range standard to quantify instrument drift at the completion of each test The analyst would repeat the calibration process used for the average of the two calibration curves to determine concentrations if he observed a variance larger than 50 percent
3294 Total Particulate Matter and Exhaust Gas Volumetric Flow Rate
Reference Methods 1 through 5 used for determination of exhaust gas volumetric flow rate and total particulate emissions include numerous quality control and quality assurance procedures that are required to ensure collection of representative data The most important of these procedures are listed in Table 3-5 along with the results for these tests These methods do not specify overall uncertainties but it is generally accepted that conformance to the control and quality assurance procedures will result in an overall method uncertainty ranging from 5 to 30 percent depending on the mass of the particulate catch the quality of the sampling system and the length of the sampling probe [15] For these tests TPM catches were in the range of 10 to 20 mg the sampling system surfaces contacting the exhaust gases were constructed entirely of glass or Teflon and the probe was less than 3-feet in length In addition testers documented that all of the key method criteria were met It is therefore expected that the overall error for tests conducted here is plusmn 10 percent of reading This exceeds the original goal of plusmn 5 percent but this deviation from the plan is not believed to impact results significantly because TPM emissions were very low
3-12
3295 NH3 Concentrations
Ammonia samples were collected in the back-half of the total particulate sampling train and therefore all of the sampling system criteria are the same as for TPM measurements Sampling error for the NH3 samples should be the same as sampling error for the TPM samples In the laboratory analytical instrumentation was calibrated using nine working standards A calibration curve for the instrument was developed using this nine-point calibration The R2 for the calibration curve was 09997 indicating excellent analytical linearity Based on this the same uncertainty used for the TPM determination (plusmn10 percent) is assigned Again this level of uncertainty exceeds the original goal of plusmn 5 percent but as with the TPM emissions this deviation from the plan is not believed to impact results significantly because NH3 emissions were also very low
3-13
40 REFERENCES
[1] Southern Research Institute Environmental Technology Verification Report Swine Waste Electric and Heat Production ndash Martin Machinery Internal Combustion Engine SRIUSEPA-GHG-QAP-27 wwwsri-rtpcom Greenhouse Gas Technology Center Southern Research Institute Research Triangle Park NC September 2004
[2] Southern Research Institute Test and Quality Assurance Plan - Swine Waste Electric Power and Heat Production Systems Capstone MicroTurbine and Martin Machinery Internal Combustion Engine SRIUSEPA-GHG-QAP-22 wwwsri-rtpcom Greenhouse Gas Technology Center Southern Research Institute Research Triangle Park NC November 2002
[3] American Society of Mechanical Engineers Performance Test Code for Gas Turbines ASME PTC-22 New York NY 1997
[4] American National Standards Institute American Society of Heating Refrigeration and Airshy conditioning Engineers Method of Testing Thermal Energy Meters for Liquid Streams in HVAC
Systems ANSIASHRAE 125-1992 Atlanta GA 1995
[5] CRC Press Handbook of Chemistry and Physics ndash 60th Edition CRC Press Inc Boca Raton Florida 1980
[6] American Society for Testing and Materials Standard Test Method for Analysis of Natural Gas by Gas Chromatography ASTM D1945-98 West Conshohocken PA 2001
[7] American Society for Testing and Materials Standard Practice for Calculating Heat Value Compressibility factor and Relative Density of Gaseous Fuels ASTM D3588-98 West Conshohocken PA 2001
[8] American Society for Testing and Materials Standard Practice for Determination of Sulfur Compounds in Natural Gas by Gas Chromatography and Chemiluminescense ASTM D5504-01 West Conshohocken PA 2001
[9] American National Standards Institute ANSI Institute of Electrical and Electronics Engineers IEEE Master Test Guide for Electrical Measurements in Power Circuits ANSIIEEE Std 120shy1989 New York NY October 1989
[10] American National Standards Institute ANSI Institute of Electrical and Electronics Engineers IEEE Recommended Practices and Requirements for Harmonic Control in Electrical Power Systems IEEE Std 519-1992 New York NY April 1993
[11] American National Standards Institute ANSI Institute of Electrical and Electronics Engineers National Standards for Electric Power Systems and Equipment - Voltage Ratings (Hertz) ANSI C841-1995 American National Standards Institute National Electrical Manufacturers Association Rosslyn VA 1996
[12] US Environmental Protection Agency Code of Federal Regulations Title 40 Part 60 New Source Performance Standards Appendix A US EPA Washington DC 1999
[13] Southern Research Institute Environmental Technology Verification Report Combined Heat and Power at a Commercial Supermarket ndash Capstone 60 kW Microturbine CHP System SRIUSEPA-GHG-QAP-27 wwwsri-rtpcom Greenhouse Gas Technology Center Southern Research Institute Research Triangle Park NC September 2003
[14] Southern Research Institute Environmental Technology Verification Report Residential Electric Power Generation Using the Plug Power SU1 Fuel Cell System SRIUSEPA-GHG-QAP-25 wwwsri-rtpcom Greenhouse Gas Technology Center Southern Research Institute Research Triangle Park NC September 2003
[15] Shigehara RT Measurement Uncertainty of Selected EPA Test Methods Emission Monitoring Inc Presented at Stationary Source Sampling and Analysis for Air Pollutants XXV Conference March 2001

0
5
10
15
20
25
30
35
40
45
50
Effic
ienc
y (
)
0
5
10
15
20
25
Pow
er O
utpu
t(kW
)
30 kW Power Command 20 kW Power 15 kW Power Command24 kW Power
Power Output
ElectricalEfficiency
ThermalEfficiency
Results of the reduced load tests are also included in the tables Results show that electrical efficiency decreases slightly as the power output is reduced Thermal efficiency however increases as power output (and biogas consumption) decreases These trends are illustrated in Figure 2-1 which displays the electrical and thermal CHP system efficiency at each of the controlled test conditions
CommandCommand
0
5
10
15
20
25
30
35
40
45
50
Effic
ienc
y (
)
0
5
10
15
20
25
Pow
er O
utpu
t (kW
)
30 kW Power Command 20 kW Power Command
15 kW Power Command24 kW Power Command
Power Output
Electrical Efficiency
Thermal Efficiency
Figure 2-1 Electrical and Thermal Efficiency During Controlled Test Periods
As expected the high altitude of the test location (approximately 3700 feet above sea level) derated microturbine power output Table 2-1 and Figure 2-1 show that the power delivered at full load (after parasitic loads) was only 199 kW Power delivered at the 24 kW power command was nearly the same at 193 kW
222 Electrical and Thermal Energy Production During the Continuous Monitoring Period
Figure 2-2 presents a time series plot of power production and heat recovery during the abbreviated 35shyhour monitoring period The system was operated continuously at a power command of 30 kW except for periods when reduced load tests were conducted The CHP system was operated under typical farm conditions with the engine shut down and the heat recovery system configured to maintain digester temperature at around 100 oF A total of 6834 kWhe electricity and 1025 kWhth of thermal energy were generated over the 35-hour operating period The average power generated over the continuous monitoring period (excluding the reduced load testing) was 206 kWe and the average heat recovery rate was 1177 x 103 Btuhr
2-5
0
5
10
15
20
25
30Po
wer
Out
put (
kW)
70
90
110
130
150
170
Heat
Rec
over
y R
ate
(10
3 Btu
hr)
35 Consecutive Hours of Monitorin
Power Output
HeatRecoveryRate
Reduced LoadControlled TestPeriods
g 0
5
10
15
20
25
30Po
wer
Out
put (
kW)
70
90
110
130
150
170
Heat
Rec
over
y R
ate
(10
3 Btu
hr)
35 Consecutive Hours of Monitoringg35 Consecutive Hours of Monitorin
Power Output
Heat Recovery Rate
Reduced Load Controlled Test Periods
21404 21504221404 215041404 215041130 2230111130 223030 2230
Figure 2-2 Heat and Power Production During the Monitoring Period
The power output trace shows periodic trips at intervals of approximately four hours This was caused by the manner in which the facility was operating the biogas compressor To prevent damage to the compressor caused by moisture buildup in the condensate trap the trap was configured to automatically open momentarily to drain every four hours This caused a brief loss of fuel pressure thereby causing the microturbine to trip and restart The entire sequence normally took about 4 minutes to complete and in most cases the turbine was back to full power in 4 minutes The farm reports that the microturbine is no longer operated in this way
As is typical for gas fired turbines power output was also affected by ambient temperature The impact of temperature on this turbine is illustrated in Figures 2-3 and 2-4
2-6
0
5
10
15
20
25
Pow
er O
utpu
t (kW
)
20
40
60
80
Inle
t Air
Tem
pera
ture
(o F)
35 Consecutive Hours of Monitorin
Inlet AirTemperature
Power Output
25
Inlet Air Temperature
Power Output
80
Pow
er O
utpu
t (kW
)
20
60
15
10
40
Inle
t Air
Tem
pera
ture
( o F)
5
0 20 35 Consecutive Hours of Monitorin 35 Consecutive Hours of Monitoringgg
21404 21504221404 215041404 215041130 2230111130 223030 2230
Figure 2-3 Power Output and Ambient Temperature During the Verification Period
15
16
17
18
19
20
21
22
23
24
25
Pow
er O
utpu
t (kW
)
30 35 40 45 50 55 60 65
Ambient Temperature (oF)
Figure 2-4 Ambient Temperature Effects on Power Production During the Verification Period
Figure 2-4 plots power output at full load over the limited test period as a function of ambient temperature and indicates a generally linear relationship The generating rate ranged from about 19 to 235 kW across a temperature range of 349 to 596 oF
2-7
23 POWER QUALITY PERFORMANCE
231 Electrical Frequency
Electrical frequency measurements (voltage and current) were monitored continuously during the verification period The one-minute average data collected by the electrical meter were analyzed to determine maximum frequency minimum frequency average frequency and standard deviation for the verification period These results are illustrated in Figure 2-5 and summarized in Table 2-3 The average electrical frequency measured was 59999 Hz and the standard deviation was 0010 Hz
60060 606
60060 404
60060 202
60060 000
59959 898
59959 696
59959 494
59599922
222111444000444111111333000
35 C35 C35 Consonsonseeecccutututiiivvveee HHHooouuursrsrs ofofof MoMoMonininitttooorrriiingngng 222111555000444222222303030
Figure 2-5 Microturbine Frequency During Verification Period
Table 2-3 Electrical Frequency During Monitoring Period
Parameter Frequency (Hz) Average Frequency 59999 Minimum Frequency 59959 Maximum Frequency 60037 Standard Deviation 0010
Freq
uenc
y (H
z)Fr
eque
ncy
(Hz)
2-8
232 Voltage Output
It is typically accepted that voltage output can vary within plusmn 10 percent of the standard voltage (480 volts) without causing significant disturbances to the operation of most end-use equipment (ANSI 1996) The 7500 ION electric meter was configured to measure 0 to 600 VAC The turbine was grid-connected and operated as a voltage-following current source The voltage levels measured are therefore more indicative of the grid voltage levels that the Capstone tried to respond to
Figure 2-6 plots one-minute average voltage readings and Table 2-4 summarizes the statistical data for the voltages measured on the turbine throughout the verification period The voltage levels were well within the normal accepted range of plusmn 10 percent
460
470
480
490
500
Vol
tage
35 Consecutive Hours of Monitoring
460
470
480
490
500
Vol
tage
35 Consecutive Hours of Monitoring35 Consecutive Hours of Monitoring222111444000444111111333000
222111555000444222222333000
Figure 2-6 Microturbine Voltage During Verification Period
Table 2-4 Microturbine Voltage During Monitoring Period
Parameter Volts Average Voltage 48725 Minimum Voltage 47843 Maximum Voltage 49186 Standard Deviation 245
2-9
233 Power Factor
Figure 2-7 plots one-minute average power factor readings and Table 2-5 summarizes the statistical data for power factors measured on the turbine throughout the verification period The data include only periods when the microturbine was operating Data collected during the periodic trips are not included in the figure or summary table Test results show that the power factor was very stable throughout the period with the turbine at full load The power factor decreased during the low load controlled test periods
Figure 2-7 Microturbine Power Factor During Verification Period
88
90
92
94
96
98
Pow
er F
acto
r (
)
35 Consecutive Hours of Monitoring 88
90
92
94
96
98
Pow
er F
acto
r (
)
35 Consecutive Hours of Monitoring35 Consecutive Hours of Monitoring21404 215042121404 21504404 215041130 2230111130 223030 2230
Table 2-5 Power Factors During Monitoring Period
Parameter Average at full load 9453 Minimum at full load 9177 Maximum at full load 9493 Standard Deviation at full load 0240 Average at 20 kW 9280 Average at 15 kW 8987
2-10
234 Current and Voltage Total Harmonic Distortion
The turbine total harmonic distortion up to the 63rd harmonic was recorded for current and voltage output using the 7500 ION The average current and voltage THD were 321 and 189 percent respectively (Table 2-6) Both were well within the IEEE 519 specification of plusmn 5 percent Figure 2-8 plots the current and voltage THD throughout the verification period Figure 2-8 clearly shows a spike in current THD each time the microturbine was tripped by the biogas pressure loss The highest of the spikes was 32 percent
Table 2-6 Microturbine THD During Monitoring Period
Parameter Current THD () Voltage THD () Average 321 189 Minimum 222 160 Maximum 325 316 Standard Deviation 115 018
Figure 2-8 Microturbine Current and Voltage THD During Verification Period
0
2
4
6
8
10
12
THD
()
35 Consecutive Hours of Monitoring
Voltage THD
Current THD
0
2
4
6
8
10
12
THD
()
35 Consecutive Hours of Monitoring35 Consecutive Hours of Monitoring
Voltage THD
CurrentTHD
21404 21504221404 215041404 215041130 2230111130 223030 2230
2-11
24 EMISSIONS PERFORMANCE
241 Microturbine CHP System Emissions
Testing was conducted on the turbine exhaust stack to determine emission rates for NOX CO THC SO2 TRS CH4 and CO2 at each of the four controlled test conditions Testing for determination of TPM and NH3 was conducted at full load only Stack emission measurements were conducted using the reference methods summarized in Table 1-3 and detailed in the test plan The CHP system was maintained in a stable mode of operation during each test run based on PTC-22 variability criteria
Sampling system QAQC checks were conducted in accordance with test plan specifications to ensure the collection of adequate and accurate emissions data These included analyzer linearity tests and sampling system bias and drift checks Results of the QAQC checks are discussed in Section 325 The results show that DQOs for all gas species met the reference method requirements Table 2-7 summarizes the emission rates measured during each run and the overall average emissions for each set of tests
NOX concentrations averaged 175 ppmvd at 15 O2 at full load and increased to 346 ppmvd at the lowest load tested (setting of 15 kW) The overall average NOX emission rate at full load normalized to power output was 000008 lbkWh The benefits of lower NOX emissions from the CHP system are further enhanced by the fact that some of the exhaust heat is recovered and used Annual published data from Energy Information Administration (EIA) reveal that the measured CHP system NOX emission rate is well below the weighted average US and Colorado regional grid emission factors identified in the test plan which are 00066 and 00077 lbkWh respectively As stated earlier the center could not estimate annual emission reductions due to insufficient power production data but the emissions testing results clearly indicate that reductions will be realized through use of this CHP system The emission reductions are further increased when transmission and distribution system losses are accounted for
Average exhaust gas CO concentrations ranged from a low of 305 ppmvd at 15 O2 at full load to a high of 451 ppmvd at 15 O2 at the 15 kW power command Corresponding average CO emission rates at these power commands were approximately 0009 and 0017 lbkWh respectively
Similarly THC (and CH4) concentrations increased as power output decreased and ranged from 165 ppmvd at 15 O2 at full load to 475 ppmvd at 15 O2 at the 15 kW power command Corresponding average THC emission rates at these power commands were approximately 0003 and 0011 lbkWh respectively The CH4 emissions consistently comprised about 80 percent of the THC emissions
Concentrations of CO2 in the CHP system exhaust gas averaged 23 percent at full load and decreased as power output was reduced to a low of 20 percent These concentrations correspond to average CO2 emission rates of 345 lbkWh and 390 lbkWh respectively The CHP system CO2 emission rate at full load is higher than the weighted average fossil fuel emission factors for both the US and Colorado regional grids (202 and 213 lbkWh respectively) This indicates a likely increase in annual CO2 emissions for power production from this system but this increase would likely be offset by efficiency gains resulting from heat recovery and use and elimination of transmission and distribution system losses
2-12
Table 2-7 Microturbine CHP System Emissions During Controlled Test Periods
Pow
erC
omm
and
(kW
)
Elec
tric
alPo
wer
Out
put
(kW
) Exhaust
O2 ()
NOx Emissions CO Emissions THC Emissions CH4 Emissions CO2 Emissions
(ppm at
15 O2) (lbhr) (lbkWh)
(ppm at
15 O2) (lbhr) (lbkWh)
(ppm at
15 O2) (lbhr) (lbkWh)
(ppm at
15 O2) (lbhr) (lbkWh) () (lbhr) (lbkWh)
Run 1
Run 2
Run 3
AVG
30
197
201
198
199
191
191
192
191
170
180
174
175
161E-03
167E-03
161E-03
163E-03
817E-05
831E-05
814E-05
821E-05
250
310
354
305
0144
0175
0199
0173
0007
0009
0010
0009
141
163
190
165
0046
0052
0061
0053
235E-03
261E-03
310E-03
269E-03
112
141
157
137
0037
0045
0051
0044
187E-03
226E-03
256E-03
223E-03
23
23
23
23
682
668
707
686
346
332
358
345
Run 4
Run 5
Run 6
AVG
24
192
193
193
193
191
192
192
192
190
201
198
196
184E-03
184E-03
180E-03
183E-03
954E-05
952E-05
936E-05
947E-05
319
345
364
343
0188
0191
0202
0194
0010
0010
0010
0010
184
194
200
193
0062
0061
0063
0062
321E-03
319E-03
328E-03
323E-03
141
155
183
160
0047
0049
0058
0051
246E-03
254E-03
300E-03
267E-03
23
23
23
23
696
696
696
696
362
361
361
361
Run 7a
Run 8
Run 9
AVG
20
150
150
150
150
193
193
193
193
505
575
572
399
0004
0042
0042
0029
248E-04
281E-03
279E-03
195E-03
590
192
199
327
0263
0086
0089
0146
0018
0006
0006
0010
365
132
126
208
0093
0034
0032
0053
622E-03
225E-03
214E-03
354E-03
293
97
105
165
0075
0025
0027
0042
499E-03
165E-03
179E-03
281E-03
22
22
22
22
569
569
569
569
380
379
378
379
Run 10
Run 11
Run 12
AVG
15
101
101
102
101
190
191
191
191
332
351
354
346
0022
0022
0022
0022
219E-03
218E-03
220E-03
219E-03
441
459
452
451
0179
0176
0174
0176
0018
0017
0017
0017
483
484
457
475
0112
0106
0100
0106
110E-02
105E-02
987E-03
105E-02
360
413
410
394
0083
0091
0090
0088
824E-03
893E-03
885E-03
867E-03
20
20
20
20
395
395
395
395
391
390
390
390
a The NOX CO and CH4 concentrations during run 7 are questionable when compared to the data collected during runs 8 and 9 A brief 4-minute microturbine shutdown occurred at the conclusion of run 7 but the GHG Center was unable to resolve this anamoly after reviewing all available system operating data
2-13
Table 2-7 Microturbine CHP System Emissions During Controlled Test Periods (Continued)
Pow
erC
omm
and
(kW
)
Elec
tric
alPo
wer
Out
put
(kW
) Exhaust
O2 ()
Particulate Emissions NH3 Emissions SO2 Emissions TRS Emissions
(grdscf) (lbhr) (lbkWh)
(ppm at
15 O2) (lbhr) (lbkWh)
(ppm at
15 O2) (lbhr) (lbkWh)
(ppm at
15 O2) (lbhr) (lbkWh)
Run 1
Run 2
Run 3
AVG
30
197
201
198
199
191
191
192
191
00055
00053
00022
00043
0016
0015
0006
0012
811E-04
746E-04
304E-04
620E-04
005
004
002
004
170E-05
131E-05
600E-06
120E-05
862E-07
654E-07
304E-07
607E-07
488
582
614
561
064
073
081
073
0032
0036
0041
0037
155
144
570
119
0020
0018
0008
0015
101E-03
913E-04
406E-04
778E-04
Run 4
Run 5
Run 6
AVG
24
192
193
193
193
191
192
192
192
ND
ND
ND
NA
ND
ND
ND
NA
ND
ND
ND
NA
ND
ND
ND
NA
ND
ND
ND
NA
ND
ND
ND
NA
560
596
584
580
077
076
075
076
0040
0039
0039
0039
483
327
196
335
00067
00042
00025
00045
348E-04
218E-04
130E-04
232E-04
Run 7
Run 8
Run 9
AVG
20
150
150
150
150
193
193
193
193
ND
ND
ND
NA
ND
ND
ND
NA
ND
ND
ND
NA
ND
ND
ND
NA
ND
ND
ND
NA
ND
ND
ND
NA
594
590
588
591
061
060
061
061
0041
0040
0041
0040
820
678
581
693
00084
00069
00060
00071
561E-04
461E-04
401E-04
474E-04
Run 10
Run 11
Run 12
AVG
15
101
101
102
101
190
191
191
191
ND
ND
ND
NA
ND
ND
ND
NA
ND
ND
ND
NA
ND
ND
ND
NA
ND
ND
ND
NA
ND
ND
ND
NA
477
500
496
491
043
043
043
043
0043
0042
0042
0042
268
229
228
242
00024
00020
00020
00021
237E-04
198E-04
198E-04
211E-04
ND = No data collected These pollutants not tested at reduced loads NA = Not applicable
2-14
Emissions of total particulate matter and NH3 were extremely low during each of the three test replicates conducted at full power SO2 emissions from the CHP were fairly consistent throughout the range of operation At full load SO2 concentrations averaged 561 ppmvd at 15 O2 and corresponding emission rates averaged 0037 lbkWh Emissions of TRS the sulfurous compounds in the fuel that were not oxidized during combustion averaged approximately 780 ppmvd at 15 O2 and 0005 lbkWh during the full load tests
2-15
30 DATA QUALITY ASSESSMENT
31 DATA QUALITY OBJECTIVES
The GHG Center selects methodologies and instruments for all verifications to ensure a stated level of data quality in the final results The GHG Center specifies data quality objectives (DQOs) for each verification parameter before testing commences Each test measurement that contributes to the determination of a verification parameter has stated data quality indicators (DQIs) which if met ensure achievement of that verification parameterrsquos DQO
The establishment of DQOs begins with the determination of the desired level of confidence in the verification parameters Table 3-1 summarizes the DQOs established in the test planning stage for each verification parameter The actual data quality achieved during testing is also shown The next step is to identify all measured values which affect the verification parameter and determine the levels of error which can be tolerated These DQIs most often stated in terms of measurement accuracy precision and completeness are used to determine if the stated DQOs are satisfied The DQIs for this verification shyused to support the DQOs listed in Table 3-1 - are summarized in Table 3-2
Table 3-1 Verification Parameter Data Quality Objectives
Verification Parameter Original DQO Goala
Relative () Absolute (units) Achievedb
Relative () Absolute (units) Power and Heat Production Performance
Electrical power output (kW) plusmn 15 098 kW plusmn 10 020 kW Electrical efficiency () plusmn 15 041c plusmn 13 027c
Heat recovery rate (103Btuhr) plusmn 17 575 x 103Btuhrc plusmn 24 27 x 103Btuhrc
Thermal energy efficiency () plusmn 17 071c plusmn 25 083c
CHP production efficiency () plusmn 12 082c plusmn 16 087c
Power Quality Performance Electrical frequency (Hz) plusmn 001 0006 Hz plusmn 001 0006 Hz Voltage 10 48 Vc 10 49 Vc
Power factor () plusmn 050 TBD plusmn 050 047 Voltage and current total harmonic distortion (THD) () plusmn 100 TBD plusmn 100 003
Emissions Performance NOX CO CO2 O2 TRS and SO2 concentration accuracy plusmn 20 of spand plusmn 20 of spand
CH4 and THC concentration accuracy plusmn 50 of spand plusmn 50 of spand
TPM and NH3 concentration accuracy plusmn 50 plusmn 100 a Original DQO goals as stated in test plan Absolute errors were provided in the test plan where applicable based on anticipated
values b Overall measurement uncertainty achieved during verification The absolute errors listed are based on these uncertainties and the
average values measured during the verification c Calculated composite errors were derived using the procedures described in the corresponding subsections (Sections 322 through
325) d Qualitative data quality indicators based on conformance to reference method requirements
The DQIs specified in Table 3-2 contain accuracy precision and completeness levels that must be achieved to ensure that DQOs can be met Reconciliation of DQIs is conducted by performing independent performance checks in the field with certified reference materials and by following approved reference methods factory calibrating the instruments prior to use and conducting QAQC procedures in
3-1
the field to ensure that instrument installation and operation are verified The following sections address reconciliation of each of the DQI goals
This verification was supported by an Audit of Data Quality (ADQ) conducted by the GHG Center QA manager During the ADQ the QA manager randomly selected data supporting each of the primary verification parameters and followed the data through the analysis and data processing system The ADQ confirmed that no systematic errors were introduced during data handling and processing A performance evaluation audit (PEA) and a technical systems audit (TSA) were planned but not conducted Similar PEAs were recently conducted on two recent CHP verifications [13 14] and it was decided to not repeat the PEA a third time Likewise a full TSA was recently completed on a similar verification [13] where the same measurement systems were used so this QA activity was not repeated here Instead the GHG Center QA manager conducted an abbreviated project review to ensure that the verification approach and analytical procedures specified in the TQAP were followed or in cases where changes to the verification were necessary these changes were justified and documented Corrective action reports (CARs) are completed signed by the GHG Center QA manager and filed at the GHG Center that document significant changes to the verification approach or methodologies that occurred during the verification
32 RECONCILIATION OF DQOs AND DQIs
Table 3-2 summarizes the range of measurements observed in the field and the completeness goals Completeness is the number or percent of valid determinations actually made relative to the number or percent of determinations planned The completeness goals for the controlled tests were to obtain electrical and thermal efficiency as well as emission rate data for three test runs conducted at each of four different load conditions This completeness goal was achieved
Completeness goals for the extended tests were to obtain 90 percent of 7 days of power quality power output heat recovery rate and ambient measurements This goal was not achieved As explained in Section 21 the Center was not able to complete the entire 7-day extended monitoring period A total of 35 hours of data were logged including the controlled test periods
Table 3-2 also includes accuracy goals for measurement instruments Actual measurement accuracy achieved is also reported based on instrument calibrations conducted by manufacturers field calibrations reasonableness checks or independent performance checks with a second instrument Table 3-3 includes the QAQC procedures that were conducted for key measurements in addition to the procedures used to establish DQIs The accuracy results for each measurement and their effects on the DQOs are discussed below
3-2
3-3
Table 3-2 Summary of Data Quality Indicator Goals and Results
Measurement Variable Instrument Type and
Manufacturer
Instrument Range
Range Observed in
Field
Accuracy Completeness
Goal Actual How Verified or Determined Goal Actual
CHP System Power Output and Quality
Power
Electric Meter Power Measurements 7500 ION
0 to 100 kW 0 to 242 kW plusmn 15 reading plusmn 10 reading
Instrument calibration from manufacturer prior to testing
Controlled tests three valid runs per load meeting PTC 22 criteria
Extended test 90 of one minute readings for 7 days
Controlled tests three valid runs at each load
Extended test 35 consecutive hours of one minute readings
Voltage 0 to 600 V 478 to 492 V plusmn 10 reading plusmn 10 reading Frequency 55 to 65 Hz 599 to 600 Hz plusmn 001 reading plusmn 001 reading Current 0 to 200A 5 to 29 A plusmn 10 reading plusmn 10 reading Voltage THD 0 to 100 16 to 32 plusmn 10 full scale plusmn 10 full scale Current THD 0 to 100 22 to 325 plusmn 10 full scale plusmn 10 full scale
Power Factor 0 to 100 918 to 949 plusmn 05 reading plusmn 05 reading
CHP System Heat Recovery Rate
Inlet Temperature
Controlotron Model 1010EP
80 to 150 oF 89 to 94 oF Temps must be plusmn 15 oF of ref Thermocouples
plusmn 07 oF for outlet plusmn 08 oF for inlet
Independent check with calibrated thermocoupleOutlet
Temperature 80 to 150 oF 93 to 102 oF
Water Flow 0 to 150 gpm 281 to 286 gpm plusmn 10 reading plusmn 01 reading Instrument calibration from manufacturer prior to testing
Ambient Conditions
Ambient Temperature
RTD Vaisala Model HMD 60YO
-50 to 150 oF 35 to 60 o F plusmn 02 oF plusmn 02 oF
Instrument calibration from manufacturer prior to testing
Ambient Pressure
Setra Model 280E 0 to 25 psia 1268 to 1272
psia plusmn 01 full scale plusmn 005 full scale
Relative Humidity
Vaisala Model HMD 60YO 0 to 100 RH 21 to 49 RH plusmn 2 plusmn 02
(continued)
3-3
3-4
Table 3-2 Summary of Data Quality Indicator Goals and Results (continued)
Measurement Variable Instrument Type and Manufacturer
Instrument Range
Measurement Range
Observed
Accuracy Completeness
Goal Actual How Verified or Determined Goal Actual
Fuel Input
Gas Flow Rate Dresser-Roots Model 2M175 SSM Series B3 rotary displacement
0 to 30 scfm 5 to 10 scfm 10 of reading plusmn 03 of reading
Factory calibration with volume prover
Controlled tests three valid runs per load meeting PTC 22 criteria Extended test 90 of one- minute readings for 7 days
Controlled tests three valid runs at each load
Extended test 35 hours of one-minute readings
Gas Pressure Omega Model PX205shy030AI transducer 0 to 30 psia 12 to 14 psia plusmn 075 full
scale plusmn 025 full scale Instrument calibration to NIST traceable standards
Gas Temperature
Omega TX-93 Type K thermocouple 0 to 200 oF 75 to 97 oF plusmn 010 reading plusmn 010 reading
LHV Gas Chromatograph HP 589011
0 to 100 CH4
67 to 69 CH4 plusmn 30 accuracy plusmn 02 repeatability
plusmn 05 accuracy plusmn 005 repeatability
analysis of NIST-traceable CH4 standard and duplicate analysis on 3 samples
Controlled tests two valid samples per load
Controlled tests two valid samples per load627 to 633
Btuft3 01 repeatability
plusmn 006 repeatability
Conducted duplicate analyses on 3 samples
Exhaust Stack Emission
NOX Levels Chemiluminescent CAI 400-CLD
0 to 50 ppmvd 0 to 3 ppmvd plusmn 2 full scale le 2 full scale
Calculated following EPA Reference Method calibrations (Before and after each test run)
Controlled tests three valid runs per load
Controlled tests three valid runs per load
CO Levels NDIR TEI Model 48 0 to 300 ppmvd
50 to 160 ppmvd plusmn 2 full scale le 2 full scale
CH4 levels HP 5890 0 to 300 ppmv 30 to 130 ppmv plusmn 5 full scale le 5 reading
THC levels HP 5890 0 to 300 ppmv 40 to 160 ppmv plusmn 5 full scale le 5 full scale
SO2 Levels Bovar 721-AT 0 to 300 ppmvd
145 to 185 ppmvd plusmn 2 full scale le 2 full scale
O2 CO2 Levels CAI 200 0 to 25 10 to 20 O2
20 to 25 CO2 plusmn 2 full scale le 2 full scale
TRS Levels Ametek 921 0 to 25 ppmvd 0 to 5 ppmvd plusmn 2 full scale le 2 full scale
NH3 Levels Ion specific electrode 0 to 5 ugml 0 to 42 ugml plusmn 5 full scale le 5 full scale
TPM concentrations gravimetric Not specified 001 to 004 g plusmn 1 mg plusmn 05 mg
Stack gas velocity
Pitot and thermocouple Not specified 3552 to 3753
fpm plusmn 5 reading le 5 reading
3-4
321 Power Output
Instrumentation used to measure power was introduced in Section 10 and included a Power Measurements Model 7500 ION The data quality objective for power output was plusmn 15 percent of reading which includes compounded error of the instrument and the current transformers (CTs) The test plan specified factory calibration of the ION meter with a NIST-traceable standard to determine if the power output DQO was met The Test plan also required the GHG Center to perform several reasonableness checks in the field to ensure that the meter was installed and operating properly The following summarizes the results
The meter was factory calibrated by Power Measurements in April 2003 Calibrations were conducted in accordance with Power Measurementsrsquo standard operating procedures (in compliance with ISO 90021994) and are traceable to NIST standards The meters were certified by Power Measurements to meet or exceed the accuracy values summarized in Table 3-2 for power output voltage current and frequency NIST-traceable calibration records are archived by the GHG Center Pretest factory calibrations on the meters indicated that accuracy was within plusmn 005 percent of reading and this value combined with the 10-percent error inherent to the current transformers resulted in an overall error of plusmn 101 percent Using the manufacturer-certified calibration results and the average power output measured during the full-load testing the absolute error during all testing is plusmn 020 kW
Additional QC checks were performed on the 7500 ION to verify the operation after installation of the meters at the site and prior to the start of the verification test The results of these QC checks (summarized in Table 3-3) are not used to reconcile the DQI goals but to document proper operation in the field Current and voltage readings were checked for reasonableness using a hand-held Fluke multimeter These checks confirmed that the voltage and current readings between the 7500 ION and the Fluke were within the range specified in the test plan as shown in Table 3-3
These results led to the conclusion that the 7500 ION was installed and operating properly during the verification test The plusmn 10-percent error in power measurements as certified by the manufacturer was used to reconcile the power output DQO (discussed above) and the electrical efficiency DQO (discussed in Section 322)
3-5
Table 3-3 Results of Additional QAQC Checks
Measurement Variable QAQC Check When
PerformedFrequency Expected or Allowable
Result Results Achieved
Power Output
Sensor diagnostics in field Beginning and end of test Voltage and current checks
within plusmn 1 reading plusmn 01 voltage plusmn 09 current
Reasonableness checks Throughout test Readings should be around 22 kW net power output at full load
Readings were 20 to 24 kW at full load
Fuel Heating Value
Calibration with gas standards by laboratory
Prior to analysis of each lot of samples submitted
plusmn 10 for each gas constituent Results satisfactory see
Section 3224 Independent performance checks with blind audit sample
Twice during previous year
plusmn 30 for each major gas constituent (methane CO2)
Heat Recovery Rate
Meter zero check Prior to testing Reported water flow rate lt 01 gpm ndash006 gpm recorded
Independent performance check of temperature readings
Beginning of test period Difference in temperature readings should be lt 15 degF
Temperature readings within 08 degF of reference
322 Electrical Efficiency
The DQO for electrical efficiency was to achieve an uncertainty of plusmn 152 percent at full electrical load or less Recall from Equation 1 (Section 141) that the electrical efficiency determination consists of three direct measurements power output fuel flow rate and fuel LHV The accuracy goals specified to meet the electrical efficiency DQO consisted of plusmn 15 percent for power output plusmn 10 percent for fuel flow rate and plusmn 02 percent for LHV The accuracy goals for each measurement were met The following summarizes actual errors achieved and the methods used to compute them
Power Output As discussed in Section 321 factory calibrations of the 7500 ION with a NISTshytraceable standard and the inherent error in the current and potential transformers resulted in plusmn 10-percent error in power measurements Reasonableness checks in the field verified that the meter was functioning properly The average power output at full load was approximately 20 kW with a measurement error of plusmn 020 kW
Heat Input Heat input is the product of measured fuel flow rate and LHV The DQI goal for fuel flow rate was reconciled through calibration of the gas meter and the gas temperature and pressure sensors used to correct measured gas volumes to standard conditions All three components were calibrated with NIST-traceable standards As shown in Table 3-2 the individual instruments errors were 03 025 and 01 percent for flow pressure and temperature respectively The overall error in biogas flow rate on a wet basis then is 040 percent of reading
Since biogas flow rate was metered on a wet and low pressure basis but combusted by the microturbine on a dry high pressure basis measured flow rates were corrected for moisture content (Section 142) Since the actual moisture content of the as-fired biogas was not directly measured the assumption that the gas was completely dry introduced additional error into the heat input determination The center
3-6
conducted an analysis of this assumption and knowing the temperature and pressure of the gas as fired determined that the worst case error introduced by the assumption that the gas is totally dry is 07 percent Combining that uncertainty with the heat input wet basis error of 040 percent the overall error on determination of biogas flow rate on a dry basis is then 081 percent of reading
The average flow rate at full load was 881 scfm with an associated measurement error of plusmn 007 scfm Complete documentation of data quality results for fuel flow rate is provided in Section 325
Uncertainty in the biogas LHV results was within the 02 percent DQI goal (Section 326) The average LHV during testing was 630 Btuft3 and the measurement error corresponding to this heating value is plusmn 13 Btuft3 The heat input compounded error then is
Error in Heat Input = ( flowmetererror )2 + (LHVerror)2 (Equation 5)
= (00081)2 + (0002)2 = 00083
The measurement error amounts to approximately plusmn 27 x 103Btuhr or 083 percent relative error at the average measured heat input of 332 x 103Btuhr
The errors in the divided values compound similarly for the electrical efficiency determination The electrical power measurement error is plusmn 10 percent relative (Table 3-2) and the heat input error is plusmn 083 percent relative Therefore compounded relative error for the electrical efficiency determination is
Error in Elec Power Efficiency = (powermetererror)2 + (heatinputerror)2 (Equation 6)
= (0010)2 + (00083)2 = 00130
Electrical efficiency for the controlled test periods at full load was 204 plusmn 027 percent or a relative compounded error of 13 percent
323 PTC-22 Requirements for Electrical Efficiency Determination
PTC-22 guidelines state that efficiency determinations were to be performed within 60 minute test periods in which maximum variability in key operational parameters did not exceed specified levels Table 3-4 summarizes the maximum permissible variations observed in power output ambient temperature ambient pressure biogas pressure at the meter and biogas temperature at the meter for each test run The table shows that the requirements for all parameters were met for all test runs and the efficiency determinations were representative of stable operating conditions
3-7
Table 3-4 Variability Observed in Operating Conditions Maximum Observed Variationa in Measured Parameters
Power Output ()
Ambient Temp (oF)
Ambient Pressure ()
Biogas pressure
(psia)
Power Factor ()
Maximum Allowable Variation plusmn 2 plusmn 4 plusmn 05 plusmn 1 plusmn 2
Run 1 06 11 003 02 02 Run 2 17 07 003 01 01 Run 3 18 06 002 01 01 Run 4 03 22 001 02 01 Run 5 03 09 001 02 01 Run 6 04 25 002 02 02 Run 7 03 03 001 03 01 Run 8 04 07 001 01 01 Run 9 02 08 001 02 01
Run 10 04 05 002 01 01 Run 11 04 04 003 02 01 Run 12 03 04 002 03 01
a Maximum (Average of Test Run ndash Observed Value) Average of Test Run 100
324 Ambient Measurements
Ambient temperature relative humidity and barometric pressure at the site were monitored throughout the verification period and the controlled tests The instrumentation used is identified in Table 3-2 along with instrument ranges data quality goals and data quality achieved All three sensors were factoryshycalibrated using reference materials traceable to NIST standards The pressure sensor was calibrated prior to the verification testing confirming the plusmn 01 percent accuracy The temperature and relative humidity sensors were also calibrated within a year prior to testing which verified that the plusmn 02 degF accuracy goal for temperature and plusmn 2 percent accuracy goal for relative humidity were met
325 Fuel Flow Rate
The Dresser-Roots Model 2M175 rotary displacement gas meter was factory-calibrated prior to installation in 1999 Calibration records were obtained and reviewed to ensure that the plusmn 10-percent instrument accuracy goal was satisfied The original calibration for the Roots meter indicating an accuracy of plusmn 032 percent is a permanent calibration This error combines with the errors in the gas temperature pressure and moisture determinations for an overall biogas flow rate measurement error of plusmn 081 percent
326 Fuel Lower Heating Value
Biogas sample collection date time run number and canister ID were logged along with laboratory chain of custody forms and were shipped along with the samples Copies of the chain of custody forms and results of the analyses are stored in the GHG Center project files Collected samples were shipped to Empact Analytical Laboratories of Brighton CO for compositional analysis and determination of LHV
3-8
per ASTM test Methods D1945 [6] and D3588 [7] respectively The DQI goals were to measure methane concentrations within plusmn 30 percent of a NIST-traceable blind audit sample and to achieve less than plusmn 02 percent difference in LHV duplicate analyses results Blind audits were submitted to Empact on two similar verifications within the past year to evaluate analytical accuracy on the methane analyses [13 14] Both audits indicated analytical accuracy within 05 percent and repeatability of within plusmn 02 percent Since the same sampling and analytical procedures were used here by the same analyst the audit was not repeated a third time
Duplicate analyses in addition to the blind audit samples were conducted on three of the samples collected during the controlled test periods Duplicate analysis is defined as the analysis performed by the same operating procedure and using the same instrument for a given sample volume Results of the duplicate analyses showed an average analytical repeatability of 006 percent for methane and 006 percent for LHV The results demonstrate that the plusmn 02 percent LHV accuracy goal was achieved As such both DQIs were met with the methane accuracy at plusmn 05 percent and the LHV repeatability at plusmn 006 percent
327 Heat Recovery Rate and Efficiency
Several measurements were conducted to determine CHP system heat-recovery rate and thermal efficiency These measurements include water flow rate water supply and return temperatures and CHP system heat input The individual errors in each of the measurements is then propagated to determine the overall error in heat-recovery rate and efficiency The Controlotron ultrasonic heat meter was used to continuously monitor water flow rate This meter has a NIST-traceable factory-calibrated accuracy of plusmn 10 percent of reading (this flow through calibration was conducted on October 9 2002) This certification serves as the primary DQI A zero check was also performed on the flow meter The meter reading was -006 gpm with the CHP system shut down and the circulation pump off
Table 3-2 showed that the DQI for supply and return temperatures (delta T) was achieved Each temperature sensor was calibrated against a reference thermocouple with NIST-traceable accuracy The error in the two temperature sensors resulted in an overall delta T uncertainty of 08 oC This absolute error equates to a relative error of 22 percent at the average fluid temperatures measured during the fullshyload testing (about 361 oC) The overall error in heat recovery rate is then the combined error in flow rate and temperature differential This error compounds multiplicatively as follows
Overall Heat Meter Error = (Flow rate error)2 + (compositional error) 2 (Equation 7)
( ) 0240)0220(0100 22 =+=
The heat recovery rate determination therefore has a relative compounded error of plusmn 24 percent The absolute error in the average heat recovery rate at full load (111 x 103Btuhr) then is plusmn 27 x 103Btuhr
This error in heat-recovery rate and the heat input error (083 percent) compound similarly to determine the overall uncertainty in the thermal efficiency determination as follows
Error in Heat Recovery Efficiency = (0024)2 + (00083)2 = 0025 (Equation 8)
Average heat recovery rate (thermal) efficiency at full load then is 333 plusmn 083 percent or a relative compounded error of 25 percent This compounded relative error exceeds the data quality objective
3-9
slightly but the absolute error is within the goal for this verification parameter (measured values were lower than anticipated)
328 Total Efficiency
Total efficiency is the sum of the electrical power and heat-recovery efficiencies Total efficiency is defined as 204 plusmn 027 percent (plusmn 130-percent relative error) plus 333 plusmn 063 percent (plusmn 19-percent relative error) This is based on the determined errors in electrical and thermal efficiency at full load The absolute errors compound as follows
errcabs = err12 + err2
2 (Equation 9)
870830270 22 =+=
Relative error is
errcrel =errcabs (Equation 10)
Value1 +Value2
087 = = 0016
204 + 333 where
errcabs = compounded error absolute err1 = error in first added value absolute value err2 = error in second added value absolute value errcrel = compounded error relative value1 = first added value value2 = second added value
The total CHP efficiency at full load is then 537 plusmn 087 percent or 16 percent relative error Again this compounded relative error exceeds the data quality objective slightly
329 Exhaust Stack Emission Measurements
EPA reference method requirements form the basis for the qualitative DQIs specified in the Test plan and listed in Tables 3-1 and 3-2 Each method specifies sampling and calibration procedures and data quality checks These specifications when properly implemented ensure the collection of high quality and representative emissions data The specific sampling and calibration procedures vary by method and class of pollutants and are summarized in Table 3-5 The table lists the method quality requirements the acceptable criteria and the results for the test conducted here It is generally accepted that conformance to the reference method quality requirements demonstrates that the qualitative DQIs have been met
All of the emissions testing and reference method quality control procedures were conducted by Cubix Corporation either in the field during testing or in their calibration and analytical laboratories in Austin Texas All of the field sampling procedures and calibrations were closely monitored by GHG Center personnel In addition documentation of all sampling and analytical procedures data collection and
3-10
calibrations have been procured reviewed and filed by the GHG Center Table 3-5 is followed by a brief explanation of the QAQC procedures implemented for each class of pollutant quantified during this verification
Table 3-5 Summary of Emissions Testing Calibrations and QC Checks
Measurement Variable
Calibration or QC Check
When Performed and Frequency
Expected or Allowable Result
Result of Calibration(s) or Check(s)
NOX CO CO2 SO2 TRS and O2 concentrations
Analyzer calibration error test
Daily before testing plusmn 2 of analyzer span All within allowable level for each day
System bias checks Before each test run plusmn 5 of analyzer span All within allowable level for each test run Calibration drift test After each test run plusmn 3 of analyzer span
THC concentrations System calibration error test
Daily before testing plusmn 5 of analyzer span All within allowable level for each day
System calibration drift test
After each test run plusmn 3 of analyzer span All within allowable level for each test run
CH4 concentrations Triplicate injections Each test run plusmn 5 difference All within allowable level for each test run
Calibration of GC with gas standards by certified laboratory
Immediately prior to sample analyses andor at least once per day
plusmn 5 for each compound
All within allowable level for each day
TPM emissions Pre and post test sampling system leak checks
Before and after each test run
Sampling system leak rate lt 002 cfm
All checks lt 002 cfm
Minimum sample volume After each test run Corrected Vol gt 600 dscf
Volumes ranged from 694 to 796 dscf
Percent isokinetic sampling rate (I)
After each test run 90 lt I lt 110 91 lt I lt 102
Analytical balance calibration
Once before analysis plusmn 00001 g Within allowable level
Filter and reagent blanks Once during testing after first test run
lt 10 of particulate catch for first test run
Blank weights lt 10 of each sample catch
Dry gas meter calibration Once before and once after testing
plusmn 5 Pre and post test calibrations within 1
Thermocouple calibration Once after testing plusmn 15 of average stack temperature
Within 03 of reference TC
NH3 concentrations Calibration of instrument with NH3 standards
Immediately prior to sample analyses at least once a day
plusmn 5 Pre test calibrations within 1 of working standards
Dry gas meter calibration Once before and once after testing
plusmn 5 Pre and post test calibrations within 1
Exhaust gas volumetric flow rate
Pitot tube dimensional calibration inspection
Once before and once after testing
See 40CFR60 Method 2 Section 100
Calibration criteria met
Thermocouple calibration Once after testing plusmn 15 of average stack temperature
Within 03 of reference TC
3291 NOX CO CO2 SO2 TRS and O2 Concentrations
Test personnel performed sampling system calibration error tests prior to each test run All calibrations employed a suite of three EPA Protocol No 1 calibration gases (four for CO) that spanned the instrument ranges Appropriate calibration ranges were selected for each pollutant based on exhaust gas screening (ranges are summarized in Table 3-2) The daily analyzer calibration error goal for each instrument was plusmn 20 percent of span It was met for each analyzer during each day of testing
3-11
Sampling system bias was evaluated for each parameter at the beginning of each test run using the zero and mid-level calibration gases System response to the zero and mid-level calibration gases also provided a measure of drift and bias at the end of each test run The maximum allowable sampling system bias and drift values were plusmn 5 and plusmn 3 percent of span respectively These specifications were met for each parameter and for each test run Testers also performed a NOX converter efficiency test as described in Section 35 of the test plan The converter efficiency was 9998 percent which meets the 98shypercent goal specified in the method
3292 THC Concentrations
Following Method 25A criteria the analyzer calibration error test is not performed on the THC analyzer Instead a 4-point system bias test is conducted at the beginning of each test day System response must be within plusmn 5 percent of the calibration standard at each point System response to the zero and mid-level calibration gases also provided a measure of drift and bias at the end of each test run The maximum allowable sampling system bias and drift values were plusmn 5 and plusmn 3 percent of span respectively These specifications were met for test run
3293 CH4 Concentrations
The test plan specified EPA Method 18 for determining stack gas methane concentrations This testing was conducted on-site eliminating the need to collect bag samples for transport to a laboratory Test operators injected calibration gas standards into the gas chromatograph (GC) to establish a concentration standard curve prior to sample analysis The operator repeated the injections until the average of all desired compounds from three separate injections agreed to within 50 percent of the certified value The acceptance criterion was met for all runs
The analysts injected the mid-range standard to quantify instrument drift at the completion of each test The analyst would repeat the calibration process used for the average of the two calibration curves to determine concentrations if he observed a variance larger than 50 percent
3294 Total Particulate Matter and Exhaust Gas Volumetric Flow Rate
Reference Methods 1 through 5 used for determination of exhaust gas volumetric flow rate and total particulate emissions include numerous quality control and quality assurance procedures that are required to ensure collection of representative data The most important of these procedures are listed in Table 3-5 along with the results for these tests These methods do not specify overall uncertainties but it is generally accepted that conformance to the control and quality assurance procedures will result in an overall method uncertainty ranging from 5 to 30 percent depending on the mass of the particulate catch the quality of the sampling system and the length of the sampling probe [15] For these tests TPM catches were in the range of 10 to 20 mg the sampling system surfaces contacting the exhaust gases were constructed entirely of glass or Teflon and the probe was less than 3-feet in length In addition testers documented that all of the key method criteria were met It is therefore expected that the overall error for tests conducted here is plusmn 10 percent of reading This exceeds the original goal of plusmn 5 percent but this deviation from the plan is not believed to impact results significantly because TPM emissions were very low
3-12
3295 NH3 Concentrations
Ammonia samples were collected in the back-half of the total particulate sampling train and therefore all of the sampling system criteria are the same as for TPM measurements Sampling error for the NH3 samples should be the same as sampling error for the TPM samples In the laboratory analytical instrumentation was calibrated using nine working standards A calibration curve for the instrument was developed using this nine-point calibration The R2 for the calibration curve was 09997 indicating excellent analytical linearity Based on this the same uncertainty used for the TPM determination (plusmn10 percent) is assigned Again this level of uncertainty exceeds the original goal of plusmn 5 percent but as with the TPM emissions this deviation from the plan is not believed to impact results significantly because NH3 emissions were also very low
3-13
40 REFERENCES
[1] Southern Research Institute Environmental Technology Verification Report Swine Waste Electric and Heat Production ndash Martin Machinery Internal Combustion Engine SRIUSEPA-GHG-QAP-27 wwwsri-rtpcom Greenhouse Gas Technology Center Southern Research Institute Research Triangle Park NC September 2004
[2] Southern Research Institute Test and Quality Assurance Plan - Swine Waste Electric Power and Heat Production Systems Capstone MicroTurbine and Martin Machinery Internal Combustion Engine SRIUSEPA-GHG-QAP-22 wwwsri-rtpcom Greenhouse Gas Technology Center Southern Research Institute Research Triangle Park NC November 2002
[3] American Society of Mechanical Engineers Performance Test Code for Gas Turbines ASME PTC-22 New York NY 1997
[4] American National Standards Institute American Society of Heating Refrigeration and Airshy conditioning Engineers Method of Testing Thermal Energy Meters for Liquid Streams in HVAC
Systems ANSIASHRAE 125-1992 Atlanta GA 1995
[5] CRC Press Handbook of Chemistry and Physics ndash 60th Edition CRC Press Inc Boca Raton Florida 1980
[6] American Society for Testing and Materials Standard Test Method for Analysis of Natural Gas by Gas Chromatography ASTM D1945-98 West Conshohocken PA 2001
[7] American Society for Testing and Materials Standard Practice for Calculating Heat Value Compressibility factor and Relative Density of Gaseous Fuels ASTM D3588-98 West Conshohocken PA 2001
[8] American Society for Testing and Materials Standard Practice for Determination of Sulfur Compounds in Natural Gas by Gas Chromatography and Chemiluminescense ASTM D5504-01 West Conshohocken PA 2001
[9] American National Standards Institute ANSI Institute of Electrical and Electronics Engineers IEEE Master Test Guide for Electrical Measurements in Power Circuits ANSIIEEE Std 120shy1989 New York NY October 1989
[10] American National Standards Institute ANSI Institute of Electrical and Electronics Engineers IEEE Recommended Practices and Requirements for Harmonic Control in Electrical Power Systems IEEE Std 519-1992 New York NY April 1993
[11] American National Standards Institute ANSI Institute of Electrical and Electronics Engineers National Standards for Electric Power Systems and Equipment - Voltage Ratings (Hertz) ANSI C841-1995 American National Standards Institute National Electrical Manufacturers Association Rosslyn VA 1996
[12] US Environmental Protection Agency Code of Federal Regulations Title 40 Part 60 New Source Performance Standards Appendix A US EPA Washington DC 1999
[13] Southern Research Institute Environmental Technology Verification Report Combined Heat and Power at a Commercial Supermarket ndash Capstone 60 kW Microturbine CHP System SRIUSEPA-GHG-QAP-27 wwwsri-rtpcom Greenhouse Gas Technology Center Southern Research Institute Research Triangle Park NC September 2003
[14] Southern Research Institute Environmental Technology Verification Report Residential Electric Power Generation Using the Plug Power SU1 Fuel Cell System SRIUSEPA-GHG-QAP-25 wwwsri-rtpcom Greenhouse Gas Technology Center Southern Research Institute Research Triangle Park NC September 2003
[15] Shigehara RT Measurement Uncertainty of Selected EPA Test Methods Emission Monitoring Inc Presented at Stationary Source Sampling and Analysis for Air Pollutants XXV Conference March 2001

0
5
10
15
20
25
30Po
wer
Out
put (
kW)
70
90
110
130
150
170
Heat
Rec
over
y R
ate
(10
3 Btu
hr)
35 Consecutive Hours of Monitorin
Power Output
HeatRecoveryRate
Reduced LoadControlled TestPeriods
g 0
5
10
15
20
25
30Po
wer
Out
put (
kW)
70
90
110
130
150
170
Heat
Rec
over
y R
ate
(10
3 Btu
hr)
35 Consecutive Hours of Monitoringg35 Consecutive Hours of Monitorin
Power Output
Heat Recovery Rate
Reduced Load Controlled Test Periods
21404 21504221404 215041404 215041130 2230111130 223030 2230
Figure 2-2 Heat and Power Production During the Monitoring Period
The power output trace shows periodic trips at intervals of approximately four hours This was caused by the manner in which the facility was operating the biogas compressor To prevent damage to the compressor caused by moisture buildup in the condensate trap the trap was configured to automatically open momentarily to drain every four hours This caused a brief loss of fuel pressure thereby causing the microturbine to trip and restart The entire sequence normally took about 4 minutes to complete and in most cases the turbine was back to full power in 4 minutes The farm reports that the microturbine is no longer operated in this way
As is typical for gas fired turbines power output was also affected by ambient temperature The impact of temperature on this turbine is illustrated in Figures 2-3 and 2-4
2-6
0
5
10
15
20
25
Pow
er O
utpu
t (kW
)
20
40
60
80
Inle
t Air
Tem
pera
ture
(o F)
35 Consecutive Hours of Monitorin
Inlet AirTemperature
Power Output
25
Inlet Air Temperature
Power Output
80
Pow
er O
utpu
t (kW
)
20
60
15
10
40
Inle
t Air
Tem
pera
ture
( o F)
5
0 20 35 Consecutive Hours of Monitorin 35 Consecutive Hours of Monitoringgg
21404 21504221404 215041404 215041130 2230111130 223030 2230
Figure 2-3 Power Output and Ambient Temperature During the Verification Period
15
16
17
18
19
20
21
22
23
24
25
Pow
er O
utpu
t (kW
)
30 35 40 45 50 55 60 65
Ambient Temperature (oF)
Figure 2-4 Ambient Temperature Effects on Power Production During the Verification Period
Figure 2-4 plots power output at full load over the limited test period as a function of ambient temperature and indicates a generally linear relationship The generating rate ranged from about 19 to 235 kW across a temperature range of 349 to 596 oF
2-7
23 POWER QUALITY PERFORMANCE
231 Electrical Frequency
Electrical frequency measurements (voltage and current) were monitored continuously during the verification period The one-minute average data collected by the electrical meter were analyzed to determine maximum frequency minimum frequency average frequency and standard deviation for the verification period These results are illustrated in Figure 2-5 and summarized in Table 2-3 The average electrical frequency measured was 59999 Hz and the standard deviation was 0010 Hz
60060 606
60060 404
60060 202
60060 000
59959 898
59959 696
59959 494
59599922
222111444000444111111333000
35 C35 C35 Consonsonseeecccutututiiivvveee HHHooouuursrsrs ofofof MoMoMonininitttooorrriiingngng 222111555000444222222303030
Figure 2-5 Microturbine Frequency During Verification Period
Table 2-3 Electrical Frequency During Monitoring Period
Parameter Frequency (Hz) Average Frequency 59999 Minimum Frequency 59959 Maximum Frequency 60037 Standard Deviation 0010
Freq
uenc
y (H
z)Fr
eque
ncy
(Hz)
2-8
232 Voltage Output
It is typically accepted that voltage output can vary within plusmn 10 percent of the standard voltage (480 volts) without causing significant disturbances to the operation of most end-use equipment (ANSI 1996) The 7500 ION electric meter was configured to measure 0 to 600 VAC The turbine was grid-connected and operated as a voltage-following current source The voltage levels measured are therefore more indicative of the grid voltage levels that the Capstone tried to respond to
Figure 2-6 plots one-minute average voltage readings and Table 2-4 summarizes the statistical data for the voltages measured on the turbine throughout the verification period The voltage levels were well within the normal accepted range of plusmn 10 percent
460
470
480
490
500
Vol
tage
35 Consecutive Hours of Monitoring
460
470
480
490
500
Vol
tage
35 Consecutive Hours of Monitoring35 Consecutive Hours of Monitoring222111444000444111111333000
222111555000444222222333000
Figure 2-6 Microturbine Voltage During Verification Period
Table 2-4 Microturbine Voltage During Monitoring Period
Parameter Volts Average Voltage 48725 Minimum Voltage 47843 Maximum Voltage 49186 Standard Deviation 245
2-9
233 Power Factor
Figure 2-7 plots one-minute average power factor readings and Table 2-5 summarizes the statistical data for power factors measured on the turbine throughout the verification period The data include only periods when the microturbine was operating Data collected during the periodic trips are not included in the figure or summary table Test results show that the power factor was very stable throughout the period with the turbine at full load The power factor decreased during the low load controlled test periods
Figure 2-7 Microturbine Power Factor During Verification Period
88
90
92
94
96
98
Pow
er F
acto
r (
)
35 Consecutive Hours of Monitoring 88
90
92
94
96
98
Pow
er F
acto
r (
)
35 Consecutive Hours of Monitoring35 Consecutive Hours of Monitoring21404 215042121404 21504404 215041130 2230111130 223030 2230
Table 2-5 Power Factors During Monitoring Period
Parameter Average at full load 9453 Minimum at full load 9177 Maximum at full load 9493 Standard Deviation at full load 0240 Average at 20 kW 9280 Average at 15 kW 8987
2-10
234 Current and Voltage Total Harmonic Distortion
The turbine total harmonic distortion up to the 63rd harmonic was recorded for current and voltage output using the 7500 ION The average current and voltage THD were 321 and 189 percent respectively (Table 2-6) Both were well within the IEEE 519 specification of plusmn 5 percent Figure 2-8 plots the current and voltage THD throughout the verification period Figure 2-8 clearly shows a spike in current THD each time the microturbine was tripped by the biogas pressure loss The highest of the spikes was 32 percent
Table 2-6 Microturbine THD During Monitoring Period
Parameter Current THD () Voltage THD () Average 321 189 Minimum 222 160 Maximum 325 316 Standard Deviation 115 018
Figure 2-8 Microturbine Current and Voltage THD During Verification Period
0
2
4
6
8
10
12
THD
()
35 Consecutive Hours of Monitoring
Voltage THD
Current THD
0
2
4
6
8
10
12
THD
()
35 Consecutive Hours of Monitoring35 Consecutive Hours of Monitoring
Voltage THD
CurrentTHD
21404 21504221404 215041404 215041130 2230111130 223030 2230
2-11
24 EMISSIONS PERFORMANCE
241 Microturbine CHP System Emissions
Testing was conducted on the turbine exhaust stack to determine emission rates for NOX CO THC SO2 TRS CH4 and CO2 at each of the four controlled test conditions Testing for determination of TPM and NH3 was conducted at full load only Stack emission measurements were conducted using the reference methods summarized in Table 1-3 and detailed in the test plan The CHP system was maintained in a stable mode of operation during each test run based on PTC-22 variability criteria
Sampling system QAQC checks were conducted in accordance with test plan specifications to ensure the collection of adequate and accurate emissions data These included analyzer linearity tests and sampling system bias and drift checks Results of the QAQC checks are discussed in Section 325 The results show that DQOs for all gas species met the reference method requirements Table 2-7 summarizes the emission rates measured during each run and the overall average emissions for each set of tests
NOX concentrations averaged 175 ppmvd at 15 O2 at full load and increased to 346 ppmvd at the lowest load tested (setting of 15 kW) The overall average NOX emission rate at full load normalized to power output was 000008 lbkWh The benefits of lower NOX emissions from the CHP system are further enhanced by the fact that some of the exhaust heat is recovered and used Annual published data from Energy Information Administration (EIA) reveal that the measured CHP system NOX emission rate is well below the weighted average US and Colorado regional grid emission factors identified in the test plan which are 00066 and 00077 lbkWh respectively As stated earlier the center could not estimate annual emission reductions due to insufficient power production data but the emissions testing results clearly indicate that reductions will be realized through use of this CHP system The emission reductions are further increased when transmission and distribution system losses are accounted for
Average exhaust gas CO concentrations ranged from a low of 305 ppmvd at 15 O2 at full load to a high of 451 ppmvd at 15 O2 at the 15 kW power command Corresponding average CO emission rates at these power commands were approximately 0009 and 0017 lbkWh respectively
Similarly THC (and CH4) concentrations increased as power output decreased and ranged from 165 ppmvd at 15 O2 at full load to 475 ppmvd at 15 O2 at the 15 kW power command Corresponding average THC emission rates at these power commands were approximately 0003 and 0011 lbkWh respectively The CH4 emissions consistently comprised about 80 percent of the THC emissions
Concentrations of CO2 in the CHP system exhaust gas averaged 23 percent at full load and decreased as power output was reduced to a low of 20 percent These concentrations correspond to average CO2 emission rates of 345 lbkWh and 390 lbkWh respectively The CHP system CO2 emission rate at full load is higher than the weighted average fossil fuel emission factors for both the US and Colorado regional grids (202 and 213 lbkWh respectively) This indicates a likely increase in annual CO2 emissions for power production from this system but this increase would likely be offset by efficiency gains resulting from heat recovery and use and elimination of transmission and distribution system losses
2-12
Table 2-7 Microturbine CHP System Emissions During Controlled Test Periods
Pow
erC
omm
and
(kW
)
Elec
tric
alPo
wer
Out
put
(kW
) Exhaust
O2 ()
NOx Emissions CO Emissions THC Emissions CH4 Emissions CO2 Emissions
(ppm at
15 O2) (lbhr) (lbkWh)
(ppm at
15 O2) (lbhr) (lbkWh)
(ppm at
15 O2) (lbhr) (lbkWh)
(ppm at
15 O2) (lbhr) (lbkWh) () (lbhr) (lbkWh)
Run 1
Run 2
Run 3
AVG
30
197
201
198
199
191
191
192
191
170
180
174
175
161E-03
167E-03
161E-03
163E-03
817E-05
831E-05
814E-05
821E-05
250
310
354
305
0144
0175
0199
0173
0007
0009
0010
0009
141
163
190
165
0046
0052
0061
0053
235E-03
261E-03
310E-03
269E-03
112
141
157
137
0037
0045
0051
0044
187E-03
226E-03
256E-03
223E-03
23
23
23
23
682
668
707
686
346
332
358
345
Run 4
Run 5
Run 6
AVG
24
192
193
193
193
191
192
192
192
190
201
198
196
184E-03
184E-03
180E-03
183E-03
954E-05
952E-05
936E-05
947E-05
319
345
364
343
0188
0191
0202
0194
0010
0010
0010
0010
184
194
200
193
0062
0061
0063
0062
321E-03
319E-03
328E-03
323E-03
141
155
183
160
0047
0049
0058
0051
246E-03
254E-03
300E-03
267E-03
23
23
23
23
696
696
696
696
362
361
361
361
Run 7a
Run 8
Run 9
AVG
20
150
150
150
150
193
193
193
193
505
575
572
399
0004
0042
0042
0029
248E-04
281E-03
279E-03
195E-03
590
192
199
327
0263
0086
0089
0146
0018
0006
0006
0010
365
132
126
208
0093
0034
0032
0053
622E-03
225E-03
214E-03
354E-03
293
97
105
165
0075
0025
0027
0042
499E-03
165E-03
179E-03
281E-03
22
22
22
22
569
569
569
569
380
379
378
379
Run 10
Run 11
Run 12
AVG
15
101
101
102
101
190
191
191
191
332
351
354
346
0022
0022
0022
0022
219E-03
218E-03
220E-03
219E-03
441
459
452
451
0179
0176
0174
0176
0018
0017
0017
0017
483
484
457
475
0112
0106
0100
0106
110E-02
105E-02
987E-03
105E-02
360
413
410
394
0083
0091
0090
0088
824E-03
893E-03
885E-03
867E-03
20
20
20
20
395
395
395
395
391
390
390
390
a The NOX CO and CH4 concentrations during run 7 are questionable when compared to the data collected during runs 8 and 9 A brief 4-minute microturbine shutdown occurred at the conclusion of run 7 but the GHG Center was unable to resolve this anamoly after reviewing all available system operating data
2-13
Table 2-7 Microturbine CHP System Emissions During Controlled Test Periods (Continued)
Pow
erC
omm
and
(kW
)
Elec
tric
alPo
wer
Out
put
(kW
) Exhaust
O2 ()
Particulate Emissions NH3 Emissions SO2 Emissions TRS Emissions
(grdscf) (lbhr) (lbkWh)
(ppm at
15 O2) (lbhr) (lbkWh)
(ppm at
15 O2) (lbhr) (lbkWh)
(ppm at
15 O2) (lbhr) (lbkWh)
Run 1
Run 2
Run 3
AVG
30
197
201
198
199
191
191
192
191
00055
00053
00022
00043
0016
0015
0006
0012
811E-04
746E-04
304E-04
620E-04
005
004
002
004
170E-05
131E-05
600E-06
120E-05
862E-07
654E-07
304E-07
607E-07
488
582
614
561
064
073
081
073
0032
0036
0041
0037
155
144
570
119
0020
0018
0008
0015
101E-03
913E-04
406E-04
778E-04
Run 4
Run 5
Run 6
AVG
24
192
193
193
193
191
192
192
192
ND
ND
ND
NA
ND
ND
ND
NA
ND
ND
ND
NA
ND
ND
ND
NA
ND
ND
ND
NA
ND
ND
ND
NA
560
596
584
580
077
076
075
076
0040
0039
0039
0039
483
327
196
335
00067
00042
00025
00045
348E-04
218E-04
130E-04
232E-04
Run 7
Run 8
Run 9
AVG
20
150
150
150
150
193
193
193
193
ND
ND
ND
NA
ND
ND
ND
NA
ND
ND
ND
NA
ND
ND
ND
NA
ND
ND
ND
NA
ND
ND
ND
NA
594
590
588
591
061
060
061
061
0041
0040
0041
0040
820
678
581
693
00084
00069
00060
00071
561E-04
461E-04
401E-04
474E-04
Run 10
Run 11
Run 12
AVG
15
101
101
102
101
190
191
191
191
ND
ND
ND
NA
ND
ND
ND
NA
ND
ND
ND
NA
ND
ND
ND
NA
ND
ND
ND
NA
ND
ND
ND
NA
477
500
496
491
043
043
043
043
0043
0042
0042
0042
268
229
228
242
00024
00020
00020
00021
237E-04
198E-04
198E-04
211E-04
ND = No data collected These pollutants not tested at reduced loads NA = Not applicable
2-14
Emissions of total particulate matter and NH3 were extremely low during each of the three test replicates conducted at full power SO2 emissions from the CHP were fairly consistent throughout the range of operation At full load SO2 concentrations averaged 561 ppmvd at 15 O2 and corresponding emission rates averaged 0037 lbkWh Emissions of TRS the sulfurous compounds in the fuel that were not oxidized during combustion averaged approximately 780 ppmvd at 15 O2 and 0005 lbkWh during the full load tests
2-15
30 DATA QUALITY ASSESSMENT
31 DATA QUALITY OBJECTIVES
The GHG Center selects methodologies and instruments for all verifications to ensure a stated level of data quality in the final results The GHG Center specifies data quality objectives (DQOs) for each verification parameter before testing commences Each test measurement that contributes to the determination of a verification parameter has stated data quality indicators (DQIs) which if met ensure achievement of that verification parameterrsquos DQO
The establishment of DQOs begins with the determination of the desired level of confidence in the verification parameters Table 3-1 summarizes the DQOs established in the test planning stage for each verification parameter The actual data quality achieved during testing is also shown The next step is to identify all measured values which affect the verification parameter and determine the levels of error which can be tolerated These DQIs most often stated in terms of measurement accuracy precision and completeness are used to determine if the stated DQOs are satisfied The DQIs for this verification shyused to support the DQOs listed in Table 3-1 - are summarized in Table 3-2
Table 3-1 Verification Parameter Data Quality Objectives
Verification Parameter Original DQO Goala
Relative () Absolute (units) Achievedb
Relative () Absolute (units) Power and Heat Production Performance
Electrical power output (kW) plusmn 15 098 kW plusmn 10 020 kW Electrical efficiency () plusmn 15 041c plusmn 13 027c
Heat recovery rate (103Btuhr) plusmn 17 575 x 103Btuhrc plusmn 24 27 x 103Btuhrc
Thermal energy efficiency () plusmn 17 071c plusmn 25 083c
CHP production efficiency () plusmn 12 082c plusmn 16 087c
Power Quality Performance Electrical frequency (Hz) plusmn 001 0006 Hz plusmn 001 0006 Hz Voltage 10 48 Vc 10 49 Vc
Power factor () plusmn 050 TBD plusmn 050 047 Voltage and current total harmonic distortion (THD) () plusmn 100 TBD plusmn 100 003
Emissions Performance NOX CO CO2 O2 TRS and SO2 concentration accuracy plusmn 20 of spand plusmn 20 of spand
CH4 and THC concentration accuracy plusmn 50 of spand plusmn 50 of spand
TPM and NH3 concentration accuracy plusmn 50 plusmn 100 a Original DQO goals as stated in test plan Absolute errors were provided in the test plan where applicable based on anticipated
values b Overall measurement uncertainty achieved during verification The absolute errors listed are based on these uncertainties and the
average values measured during the verification c Calculated composite errors were derived using the procedures described in the corresponding subsections (Sections 322 through
325) d Qualitative data quality indicators based on conformance to reference method requirements
The DQIs specified in Table 3-2 contain accuracy precision and completeness levels that must be achieved to ensure that DQOs can be met Reconciliation of DQIs is conducted by performing independent performance checks in the field with certified reference materials and by following approved reference methods factory calibrating the instruments prior to use and conducting QAQC procedures in
3-1
the field to ensure that instrument installation and operation are verified The following sections address reconciliation of each of the DQI goals
This verification was supported by an Audit of Data Quality (ADQ) conducted by the GHG Center QA manager During the ADQ the QA manager randomly selected data supporting each of the primary verification parameters and followed the data through the analysis and data processing system The ADQ confirmed that no systematic errors were introduced during data handling and processing A performance evaluation audit (PEA) and a technical systems audit (TSA) were planned but not conducted Similar PEAs were recently conducted on two recent CHP verifications [13 14] and it was decided to not repeat the PEA a third time Likewise a full TSA was recently completed on a similar verification [13] where the same measurement systems were used so this QA activity was not repeated here Instead the GHG Center QA manager conducted an abbreviated project review to ensure that the verification approach and analytical procedures specified in the TQAP were followed or in cases where changes to the verification were necessary these changes were justified and documented Corrective action reports (CARs) are completed signed by the GHG Center QA manager and filed at the GHG Center that document significant changes to the verification approach or methodologies that occurred during the verification
32 RECONCILIATION OF DQOs AND DQIs
Table 3-2 summarizes the range of measurements observed in the field and the completeness goals Completeness is the number or percent of valid determinations actually made relative to the number or percent of determinations planned The completeness goals for the controlled tests were to obtain electrical and thermal efficiency as well as emission rate data for three test runs conducted at each of four different load conditions This completeness goal was achieved
Completeness goals for the extended tests were to obtain 90 percent of 7 days of power quality power output heat recovery rate and ambient measurements This goal was not achieved As explained in Section 21 the Center was not able to complete the entire 7-day extended monitoring period A total of 35 hours of data were logged including the controlled test periods
Table 3-2 also includes accuracy goals for measurement instruments Actual measurement accuracy achieved is also reported based on instrument calibrations conducted by manufacturers field calibrations reasonableness checks or independent performance checks with a second instrument Table 3-3 includes the QAQC procedures that were conducted for key measurements in addition to the procedures used to establish DQIs The accuracy results for each measurement and their effects on the DQOs are discussed below
3-2
3-3
Table 3-2 Summary of Data Quality Indicator Goals and Results
Measurement Variable Instrument Type and
Manufacturer
Instrument Range
Range Observed in
Field
Accuracy Completeness
Goal Actual How Verified or Determined Goal Actual
CHP System Power Output and Quality
Power
Electric Meter Power Measurements 7500 ION
0 to 100 kW 0 to 242 kW plusmn 15 reading plusmn 10 reading
Instrument calibration from manufacturer prior to testing
Controlled tests three valid runs per load meeting PTC 22 criteria
Extended test 90 of one minute readings for 7 days
Controlled tests three valid runs at each load
Extended test 35 consecutive hours of one minute readings
Voltage 0 to 600 V 478 to 492 V plusmn 10 reading plusmn 10 reading Frequency 55 to 65 Hz 599 to 600 Hz plusmn 001 reading plusmn 001 reading Current 0 to 200A 5 to 29 A plusmn 10 reading plusmn 10 reading Voltage THD 0 to 100 16 to 32 plusmn 10 full scale plusmn 10 full scale Current THD 0 to 100 22 to 325 plusmn 10 full scale plusmn 10 full scale
Power Factor 0 to 100 918 to 949 plusmn 05 reading plusmn 05 reading
CHP System Heat Recovery Rate
Inlet Temperature
Controlotron Model 1010EP
80 to 150 oF 89 to 94 oF Temps must be plusmn 15 oF of ref Thermocouples
plusmn 07 oF for outlet plusmn 08 oF for inlet
Independent check with calibrated thermocoupleOutlet
Temperature 80 to 150 oF 93 to 102 oF
Water Flow 0 to 150 gpm 281 to 286 gpm plusmn 10 reading plusmn 01 reading Instrument calibration from manufacturer prior to testing
Ambient Conditions
Ambient Temperature
RTD Vaisala Model HMD 60YO
-50 to 150 oF 35 to 60 o F plusmn 02 oF plusmn 02 oF
Instrument calibration from manufacturer prior to testing
Ambient Pressure
Setra Model 280E 0 to 25 psia 1268 to 1272
psia plusmn 01 full scale plusmn 005 full scale
Relative Humidity
Vaisala Model HMD 60YO 0 to 100 RH 21 to 49 RH plusmn 2 plusmn 02
(continued)
3-3
3-4
Table 3-2 Summary of Data Quality Indicator Goals and Results (continued)
Measurement Variable Instrument Type and Manufacturer
Instrument Range
Measurement Range
Observed
Accuracy Completeness
Goal Actual How Verified or Determined Goal Actual
Fuel Input
Gas Flow Rate Dresser-Roots Model 2M175 SSM Series B3 rotary displacement
0 to 30 scfm 5 to 10 scfm 10 of reading plusmn 03 of reading
Factory calibration with volume prover
Controlled tests three valid runs per load meeting PTC 22 criteria Extended test 90 of one- minute readings for 7 days
Controlled tests three valid runs at each load
Extended test 35 hours of one-minute readings
Gas Pressure Omega Model PX205shy030AI transducer 0 to 30 psia 12 to 14 psia plusmn 075 full
scale plusmn 025 full scale Instrument calibration to NIST traceable standards
Gas Temperature
Omega TX-93 Type K thermocouple 0 to 200 oF 75 to 97 oF plusmn 010 reading plusmn 010 reading
LHV Gas Chromatograph HP 589011
0 to 100 CH4
67 to 69 CH4 plusmn 30 accuracy plusmn 02 repeatability
plusmn 05 accuracy plusmn 005 repeatability
analysis of NIST-traceable CH4 standard and duplicate analysis on 3 samples
Controlled tests two valid samples per load
Controlled tests two valid samples per load627 to 633
Btuft3 01 repeatability
plusmn 006 repeatability
Conducted duplicate analyses on 3 samples
Exhaust Stack Emission
NOX Levels Chemiluminescent CAI 400-CLD
0 to 50 ppmvd 0 to 3 ppmvd plusmn 2 full scale le 2 full scale
Calculated following EPA Reference Method calibrations (Before and after each test run)
Controlled tests three valid runs per load
Controlled tests three valid runs per load
CO Levels NDIR TEI Model 48 0 to 300 ppmvd
50 to 160 ppmvd plusmn 2 full scale le 2 full scale
CH4 levels HP 5890 0 to 300 ppmv 30 to 130 ppmv plusmn 5 full scale le 5 reading
THC levels HP 5890 0 to 300 ppmv 40 to 160 ppmv plusmn 5 full scale le 5 full scale
SO2 Levels Bovar 721-AT 0 to 300 ppmvd
145 to 185 ppmvd plusmn 2 full scale le 2 full scale
O2 CO2 Levels CAI 200 0 to 25 10 to 20 O2
20 to 25 CO2 plusmn 2 full scale le 2 full scale
TRS Levels Ametek 921 0 to 25 ppmvd 0 to 5 ppmvd plusmn 2 full scale le 2 full scale
NH3 Levels Ion specific electrode 0 to 5 ugml 0 to 42 ugml plusmn 5 full scale le 5 full scale
TPM concentrations gravimetric Not specified 001 to 004 g plusmn 1 mg plusmn 05 mg
Stack gas velocity
Pitot and thermocouple Not specified 3552 to 3753
fpm plusmn 5 reading le 5 reading
3-4
321 Power Output
Instrumentation used to measure power was introduced in Section 10 and included a Power Measurements Model 7500 ION The data quality objective for power output was plusmn 15 percent of reading which includes compounded error of the instrument and the current transformers (CTs) The test plan specified factory calibration of the ION meter with a NIST-traceable standard to determine if the power output DQO was met The Test plan also required the GHG Center to perform several reasonableness checks in the field to ensure that the meter was installed and operating properly The following summarizes the results
The meter was factory calibrated by Power Measurements in April 2003 Calibrations were conducted in accordance with Power Measurementsrsquo standard operating procedures (in compliance with ISO 90021994) and are traceable to NIST standards The meters were certified by Power Measurements to meet or exceed the accuracy values summarized in Table 3-2 for power output voltage current and frequency NIST-traceable calibration records are archived by the GHG Center Pretest factory calibrations on the meters indicated that accuracy was within plusmn 005 percent of reading and this value combined with the 10-percent error inherent to the current transformers resulted in an overall error of plusmn 101 percent Using the manufacturer-certified calibration results and the average power output measured during the full-load testing the absolute error during all testing is plusmn 020 kW
Additional QC checks were performed on the 7500 ION to verify the operation after installation of the meters at the site and prior to the start of the verification test The results of these QC checks (summarized in Table 3-3) are not used to reconcile the DQI goals but to document proper operation in the field Current and voltage readings were checked for reasonableness using a hand-held Fluke multimeter These checks confirmed that the voltage and current readings between the 7500 ION and the Fluke were within the range specified in the test plan as shown in Table 3-3
These results led to the conclusion that the 7500 ION was installed and operating properly during the verification test The plusmn 10-percent error in power measurements as certified by the manufacturer was used to reconcile the power output DQO (discussed above) and the electrical efficiency DQO (discussed in Section 322)
3-5
Table 3-3 Results of Additional QAQC Checks
Measurement Variable QAQC Check When
PerformedFrequency Expected or Allowable
Result Results Achieved
Power Output
Sensor diagnostics in field Beginning and end of test Voltage and current checks
within plusmn 1 reading plusmn 01 voltage plusmn 09 current
Reasonableness checks Throughout test Readings should be around 22 kW net power output at full load
Readings were 20 to 24 kW at full load
Fuel Heating Value
Calibration with gas standards by laboratory
Prior to analysis of each lot of samples submitted
plusmn 10 for each gas constituent Results satisfactory see
Section 3224 Independent performance checks with blind audit sample
Twice during previous year
plusmn 30 for each major gas constituent (methane CO2)
Heat Recovery Rate
Meter zero check Prior to testing Reported water flow rate lt 01 gpm ndash006 gpm recorded
Independent performance check of temperature readings
Beginning of test period Difference in temperature readings should be lt 15 degF
Temperature readings within 08 degF of reference
322 Electrical Efficiency
The DQO for electrical efficiency was to achieve an uncertainty of plusmn 152 percent at full electrical load or less Recall from Equation 1 (Section 141) that the electrical efficiency determination consists of three direct measurements power output fuel flow rate and fuel LHV The accuracy goals specified to meet the electrical efficiency DQO consisted of plusmn 15 percent for power output plusmn 10 percent for fuel flow rate and plusmn 02 percent for LHV The accuracy goals for each measurement were met The following summarizes actual errors achieved and the methods used to compute them
Power Output As discussed in Section 321 factory calibrations of the 7500 ION with a NISTshytraceable standard and the inherent error in the current and potential transformers resulted in plusmn 10-percent error in power measurements Reasonableness checks in the field verified that the meter was functioning properly The average power output at full load was approximately 20 kW with a measurement error of plusmn 020 kW
Heat Input Heat input is the product of measured fuel flow rate and LHV The DQI goal for fuel flow rate was reconciled through calibration of the gas meter and the gas temperature and pressure sensors used to correct measured gas volumes to standard conditions All three components were calibrated with NIST-traceable standards As shown in Table 3-2 the individual instruments errors were 03 025 and 01 percent for flow pressure and temperature respectively The overall error in biogas flow rate on a wet basis then is 040 percent of reading
Since biogas flow rate was metered on a wet and low pressure basis but combusted by the microturbine on a dry high pressure basis measured flow rates were corrected for moisture content (Section 142) Since the actual moisture content of the as-fired biogas was not directly measured the assumption that the gas was completely dry introduced additional error into the heat input determination The center
3-6
conducted an analysis of this assumption and knowing the temperature and pressure of the gas as fired determined that the worst case error introduced by the assumption that the gas is totally dry is 07 percent Combining that uncertainty with the heat input wet basis error of 040 percent the overall error on determination of biogas flow rate on a dry basis is then 081 percent of reading
The average flow rate at full load was 881 scfm with an associated measurement error of plusmn 007 scfm Complete documentation of data quality results for fuel flow rate is provided in Section 325
Uncertainty in the biogas LHV results was within the 02 percent DQI goal (Section 326) The average LHV during testing was 630 Btuft3 and the measurement error corresponding to this heating value is plusmn 13 Btuft3 The heat input compounded error then is
Error in Heat Input = ( flowmetererror )2 + (LHVerror)2 (Equation 5)
= (00081)2 + (0002)2 = 00083
The measurement error amounts to approximately plusmn 27 x 103Btuhr or 083 percent relative error at the average measured heat input of 332 x 103Btuhr
The errors in the divided values compound similarly for the electrical efficiency determination The electrical power measurement error is plusmn 10 percent relative (Table 3-2) and the heat input error is plusmn 083 percent relative Therefore compounded relative error for the electrical efficiency determination is
Error in Elec Power Efficiency = (powermetererror)2 + (heatinputerror)2 (Equation 6)
= (0010)2 + (00083)2 = 00130
Electrical efficiency for the controlled test periods at full load was 204 plusmn 027 percent or a relative compounded error of 13 percent
323 PTC-22 Requirements for Electrical Efficiency Determination
PTC-22 guidelines state that efficiency determinations were to be performed within 60 minute test periods in which maximum variability in key operational parameters did not exceed specified levels Table 3-4 summarizes the maximum permissible variations observed in power output ambient temperature ambient pressure biogas pressure at the meter and biogas temperature at the meter for each test run The table shows that the requirements for all parameters were met for all test runs and the efficiency determinations were representative of stable operating conditions
3-7
Table 3-4 Variability Observed in Operating Conditions Maximum Observed Variationa in Measured Parameters
Power Output ()
Ambient Temp (oF)
Ambient Pressure ()
Biogas pressure
(psia)
Power Factor ()
Maximum Allowable Variation plusmn 2 plusmn 4 plusmn 05 plusmn 1 plusmn 2
Run 1 06 11 003 02 02 Run 2 17 07 003 01 01 Run 3 18 06 002 01 01 Run 4 03 22 001 02 01 Run 5 03 09 001 02 01 Run 6 04 25 002 02 02 Run 7 03 03 001 03 01 Run 8 04 07 001 01 01 Run 9 02 08 001 02 01
Run 10 04 05 002 01 01 Run 11 04 04 003 02 01 Run 12 03 04 002 03 01
a Maximum (Average of Test Run ndash Observed Value) Average of Test Run 100
324 Ambient Measurements
Ambient temperature relative humidity and barometric pressure at the site were monitored throughout the verification period and the controlled tests The instrumentation used is identified in Table 3-2 along with instrument ranges data quality goals and data quality achieved All three sensors were factoryshycalibrated using reference materials traceable to NIST standards The pressure sensor was calibrated prior to the verification testing confirming the plusmn 01 percent accuracy The temperature and relative humidity sensors were also calibrated within a year prior to testing which verified that the plusmn 02 degF accuracy goal for temperature and plusmn 2 percent accuracy goal for relative humidity were met
325 Fuel Flow Rate
The Dresser-Roots Model 2M175 rotary displacement gas meter was factory-calibrated prior to installation in 1999 Calibration records were obtained and reviewed to ensure that the plusmn 10-percent instrument accuracy goal was satisfied The original calibration for the Roots meter indicating an accuracy of plusmn 032 percent is a permanent calibration This error combines with the errors in the gas temperature pressure and moisture determinations for an overall biogas flow rate measurement error of plusmn 081 percent
326 Fuel Lower Heating Value
Biogas sample collection date time run number and canister ID were logged along with laboratory chain of custody forms and were shipped along with the samples Copies of the chain of custody forms and results of the analyses are stored in the GHG Center project files Collected samples were shipped to Empact Analytical Laboratories of Brighton CO for compositional analysis and determination of LHV
3-8
per ASTM test Methods D1945 [6] and D3588 [7] respectively The DQI goals were to measure methane concentrations within plusmn 30 percent of a NIST-traceable blind audit sample and to achieve less than plusmn 02 percent difference in LHV duplicate analyses results Blind audits were submitted to Empact on two similar verifications within the past year to evaluate analytical accuracy on the methane analyses [13 14] Both audits indicated analytical accuracy within 05 percent and repeatability of within plusmn 02 percent Since the same sampling and analytical procedures were used here by the same analyst the audit was not repeated a third time
Duplicate analyses in addition to the blind audit samples were conducted on three of the samples collected during the controlled test periods Duplicate analysis is defined as the analysis performed by the same operating procedure and using the same instrument for a given sample volume Results of the duplicate analyses showed an average analytical repeatability of 006 percent for methane and 006 percent for LHV The results demonstrate that the plusmn 02 percent LHV accuracy goal was achieved As such both DQIs were met with the methane accuracy at plusmn 05 percent and the LHV repeatability at plusmn 006 percent
327 Heat Recovery Rate and Efficiency
Several measurements were conducted to determine CHP system heat-recovery rate and thermal efficiency These measurements include water flow rate water supply and return temperatures and CHP system heat input The individual errors in each of the measurements is then propagated to determine the overall error in heat-recovery rate and efficiency The Controlotron ultrasonic heat meter was used to continuously monitor water flow rate This meter has a NIST-traceable factory-calibrated accuracy of plusmn 10 percent of reading (this flow through calibration was conducted on October 9 2002) This certification serves as the primary DQI A zero check was also performed on the flow meter The meter reading was -006 gpm with the CHP system shut down and the circulation pump off
Table 3-2 showed that the DQI for supply and return temperatures (delta T) was achieved Each temperature sensor was calibrated against a reference thermocouple with NIST-traceable accuracy The error in the two temperature sensors resulted in an overall delta T uncertainty of 08 oC This absolute error equates to a relative error of 22 percent at the average fluid temperatures measured during the fullshyload testing (about 361 oC) The overall error in heat recovery rate is then the combined error in flow rate and temperature differential This error compounds multiplicatively as follows
Overall Heat Meter Error = (Flow rate error)2 + (compositional error) 2 (Equation 7)
( ) 0240)0220(0100 22 =+=
The heat recovery rate determination therefore has a relative compounded error of plusmn 24 percent The absolute error in the average heat recovery rate at full load (111 x 103Btuhr) then is plusmn 27 x 103Btuhr
This error in heat-recovery rate and the heat input error (083 percent) compound similarly to determine the overall uncertainty in the thermal efficiency determination as follows
Error in Heat Recovery Efficiency = (0024)2 + (00083)2 = 0025 (Equation 8)
Average heat recovery rate (thermal) efficiency at full load then is 333 plusmn 083 percent or a relative compounded error of 25 percent This compounded relative error exceeds the data quality objective
3-9
slightly but the absolute error is within the goal for this verification parameter (measured values were lower than anticipated)
328 Total Efficiency
Total efficiency is the sum of the electrical power and heat-recovery efficiencies Total efficiency is defined as 204 plusmn 027 percent (plusmn 130-percent relative error) plus 333 plusmn 063 percent (plusmn 19-percent relative error) This is based on the determined errors in electrical and thermal efficiency at full load The absolute errors compound as follows
errcabs = err12 + err2
2 (Equation 9)
870830270 22 =+=
Relative error is
errcrel =errcabs (Equation 10)
Value1 +Value2
087 = = 0016
204 + 333 where
errcabs = compounded error absolute err1 = error in first added value absolute value err2 = error in second added value absolute value errcrel = compounded error relative value1 = first added value value2 = second added value
The total CHP efficiency at full load is then 537 plusmn 087 percent or 16 percent relative error Again this compounded relative error exceeds the data quality objective slightly
329 Exhaust Stack Emission Measurements
EPA reference method requirements form the basis for the qualitative DQIs specified in the Test plan and listed in Tables 3-1 and 3-2 Each method specifies sampling and calibration procedures and data quality checks These specifications when properly implemented ensure the collection of high quality and representative emissions data The specific sampling and calibration procedures vary by method and class of pollutants and are summarized in Table 3-5 The table lists the method quality requirements the acceptable criteria and the results for the test conducted here It is generally accepted that conformance to the reference method quality requirements demonstrates that the qualitative DQIs have been met
All of the emissions testing and reference method quality control procedures were conducted by Cubix Corporation either in the field during testing or in their calibration and analytical laboratories in Austin Texas All of the field sampling procedures and calibrations were closely monitored by GHG Center personnel In addition documentation of all sampling and analytical procedures data collection and
3-10
calibrations have been procured reviewed and filed by the GHG Center Table 3-5 is followed by a brief explanation of the QAQC procedures implemented for each class of pollutant quantified during this verification
Table 3-5 Summary of Emissions Testing Calibrations and QC Checks
Measurement Variable
Calibration or QC Check
When Performed and Frequency
Expected or Allowable Result
Result of Calibration(s) or Check(s)
NOX CO CO2 SO2 TRS and O2 concentrations
Analyzer calibration error test
Daily before testing plusmn 2 of analyzer span All within allowable level for each day
System bias checks Before each test run plusmn 5 of analyzer span All within allowable level for each test run Calibration drift test After each test run plusmn 3 of analyzer span
THC concentrations System calibration error test
Daily before testing plusmn 5 of analyzer span All within allowable level for each day
System calibration drift test
After each test run plusmn 3 of analyzer span All within allowable level for each test run
CH4 concentrations Triplicate injections Each test run plusmn 5 difference All within allowable level for each test run
Calibration of GC with gas standards by certified laboratory
Immediately prior to sample analyses andor at least once per day
plusmn 5 for each compound
All within allowable level for each day
TPM emissions Pre and post test sampling system leak checks
Before and after each test run
Sampling system leak rate lt 002 cfm
All checks lt 002 cfm
Minimum sample volume After each test run Corrected Vol gt 600 dscf
Volumes ranged from 694 to 796 dscf
Percent isokinetic sampling rate (I)
After each test run 90 lt I lt 110 91 lt I lt 102
Analytical balance calibration
Once before analysis plusmn 00001 g Within allowable level
Filter and reagent blanks Once during testing after first test run
lt 10 of particulate catch for first test run
Blank weights lt 10 of each sample catch
Dry gas meter calibration Once before and once after testing
plusmn 5 Pre and post test calibrations within 1
Thermocouple calibration Once after testing plusmn 15 of average stack temperature
Within 03 of reference TC
NH3 concentrations Calibration of instrument with NH3 standards
Immediately prior to sample analyses at least once a day
plusmn 5 Pre test calibrations within 1 of working standards
Dry gas meter calibration Once before and once after testing
plusmn 5 Pre and post test calibrations within 1
Exhaust gas volumetric flow rate
Pitot tube dimensional calibration inspection
Once before and once after testing
See 40CFR60 Method 2 Section 100
Calibration criteria met
Thermocouple calibration Once after testing plusmn 15 of average stack temperature
Within 03 of reference TC
3291 NOX CO CO2 SO2 TRS and O2 Concentrations
Test personnel performed sampling system calibration error tests prior to each test run All calibrations employed a suite of three EPA Protocol No 1 calibration gases (four for CO) that spanned the instrument ranges Appropriate calibration ranges were selected for each pollutant based on exhaust gas screening (ranges are summarized in Table 3-2) The daily analyzer calibration error goal for each instrument was plusmn 20 percent of span It was met for each analyzer during each day of testing
3-11
Sampling system bias was evaluated for each parameter at the beginning of each test run using the zero and mid-level calibration gases System response to the zero and mid-level calibration gases also provided a measure of drift and bias at the end of each test run The maximum allowable sampling system bias and drift values were plusmn 5 and plusmn 3 percent of span respectively These specifications were met for each parameter and for each test run Testers also performed a NOX converter efficiency test as described in Section 35 of the test plan The converter efficiency was 9998 percent which meets the 98shypercent goal specified in the method
3292 THC Concentrations
Following Method 25A criteria the analyzer calibration error test is not performed on the THC analyzer Instead a 4-point system bias test is conducted at the beginning of each test day System response must be within plusmn 5 percent of the calibration standard at each point System response to the zero and mid-level calibration gases also provided a measure of drift and bias at the end of each test run The maximum allowable sampling system bias and drift values were plusmn 5 and plusmn 3 percent of span respectively These specifications were met for test run
3293 CH4 Concentrations
The test plan specified EPA Method 18 for determining stack gas methane concentrations This testing was conducted on-site eliminating the need to collect bag samples for transport to a laboratory Test operators injected calibration gas standards into the gas chromatograph (GC) to establish a concentration standard curve prior to sample analysis The operator repeated the injections until the average of all desired compounds from three separate injections agreed to within 50 percent of the certified value The acceptance criterion was met for all runs
The analysts injected the mid-range standard to quantify instrument drift at the completion of each test The analyst would repeat the calibration process used for the average of the two calibration curves to determine concentrations if he observed a variance larger than 50 percent
3294 Total Particulate Matter and Exhaust Gas Volumetric Flow Rate
Reference Methods 1 through 5 used for determination of exhaust gas volumetric flow rate and total particulate emissions include numerous quality control and quality assurance procedures that are required to ensure collection of representative data The most important of these procedures are listed in Table 3-5 along with the results for these tests These methods do not specify overall uncertainties but it is generally accepted that conformance to the control and quality assurance procedures will result in an overall method uncertainty ranging from 5 to 30 percent depending on the mass of the particulate catch the quality of the sampling system and the length of the sampling probe [15] For these tests TPM catches were in the range of 10 to 20 mg the sampling system surfaces contacting the exhaust gases were constructed entirely of glass or Teflon and the probe was less than 3-feet in length In addition testers documented that all of the key method criteria were met It is therefore expected that the overall error for tests conducted here is plusmn 10 percent of reading This exceeds the original goal of plusmn 5 percent but this deviation from the plan is not believed to impact results significantly because TPM emissions were very low
3-12
3295 NH3 Concentrations
Ammonia samples were collected in the back-half of the total particulate sampling train and therefore all of the sampling system criteria are the same as for TPM measurements Sampling error for the NH3 samples should be the same as sampling error for the TPM samples In the laboratory analytical instrumentation was calibrated using nine working standards A calibration curve for the instrument was developed using this nine-point calibration The R2 for the calibration curve was 09997 indicating excellent analytical linearity Based on this the same uncertainty used for the TPM determination (plusmn10 percent) is assigned Again this level of uncertainty exceeds the original goal of plusmn 5 percent but as with the TPM emissions this deviation from the plan is not believed to impact results significantly because NH3 emissions were also very low
3-13
40 REFERENCES
[1] Southern Research Institute Environmental Technology Verification Report Swine Waste Electric and Heat Production ndash Martin Machinery Internal Combustion Engine SRIUSEPA-GHG-QAP-27 wwwsri-rtpcom Greenhouse Gas Technology Center Southern Research Institute Research Triangle Park NC September 2004
[2] Southern Research Institute Test and Quality Assurance Plan - Swine Waste Electric Power and Heat Production Systems Capstone MicroTurbine and Martin Machinery Internal Combustion Engine SRIUSEPA-GHG-QAP-22 wwwsri-rtpcom Greenhouse Gas Technology Center Southern Research Institute Research Triangle Park NC November 2002
[3] American Society of Mechanical Engineers Performance Test Code for Gas Turbines ASME PTC-22 New York NY 1997
[4] American National Standards Institute American Society of Heating Refrigeration and Airshy conditioning Engineers Method of Testing Thermal Energy Meters for Liquid Streams in HVAC
Systems ANSIASHRAE 125-1992 Atlanta GA 1995
[5] CRC Press Handbook of Chemistry and Physics ndash 60th Edition CRC Press Inc Boca Raton Florida 1980
[6] American Society for Testing and Materials Standard Test Method for Analysis of Natural Gas by Gas Chromatography ASTM D1945-98 West Conshohocken PA 2001
[7] American Society for Testing and Materials Standard Practice for Calculating Heat Value Compressibility factor and Relative Density of Gaseous Fuels ASTM D3588-98 West Conshohocken PA 2001
[8] American Society for Testing and Materials Standard Practice for Determination of Sulfur Compounds in Natural Gas by Gas Chromatography and Chemiluminescense ASTM D5504-01 West Conshohocken PA 2001
[9] American National Standards Institute ANSI Institute of Electrical and Electronics Engineers IEEE Master Test Guide for Electrical Measurements in Power Circuits ANSIIEEE Std 120shy1989 New York NY October 1989
[10] American National Standards Institute ANSI Institute of Electrical and Electronics Engineers IEEE Recommended Practices and Requirements for Harmonic Control in Electrical Power Systems IEEE Std 519-1992 New York NY April 1993
[11] American National Standards Institute ANSI Institute of Electrical and Electronics Engineers National Standards for Electric Power Systems and Equipment - Voltage Ratings (Hertz) ANSI C841-1995 American National Standards Institute National Electrical Manufacturers Association Rosslyn VA 1996
[12] US Environmental Protection Agency Code of Federal Regulations Title 40 Part 60 New Source Performance Standards Appendix A US EPA Washington DC 1999
[13] Southern Research Institute Environmental Technology Verification Report Combined Heat and Power at a Commercial Supermarket ndash Capstone 60 kW Microturbine CHP System SRIUSEPA-GHG-QAP-27 wwwsri-rtpcom Greenhouse Gas Technology Center Southern Research Institute Research Triangle Park NC September 2003
[14] Southern Research Institute Environmental Technology Verification Report Residential Electric Power Generation Using the Plug Power SU1 Fuel Cell System SRIUSEPA-GHG-QAP-25 wwwsri-rtpcom Greenhouse Gas Technology Center Southern Research Institute Research Triangle Park NC September 2003
[15] Shigehara RT Measurement Uncertainty of Selected EPA Test Methods Emission Monitoring Inc Presented at Stationary Source Sampling and Analysis for Air Pollutants XXV Conference March 2001

0
5
10
15
20
25
Pow
er O
utpu
t (kW
)
20
40
60
80
Inle
t Air
Tem
pera
ture
(o F)
35 Consecutive Hours of Monitorin
Inlet AirTemperature
Power Output
25
Inlet Air Temperature
Power Output
80
Pow
er O
utpu
t (kW
)
20
60
15
10
40
Inle
t Air
Tem
pera
ture
( o F)
5
0 20 35 Consecutive Hours of Monitorin 35 Consecutive Hours of Monitoringgg
21404 21504221404 215041404 215041130 2230111130 223030 2230
Figure 2-3 Power Output and Ambient Temperature During the Verification Period
15
16
17
18
19
20
21
22
23
24
25
Pow
er O
utpu
t (kW
)
30 35 40 45 50 55 60 65
Ambient Temperature (oF)
Figure 2-4 Ambient Temperature Effects on Power Production During the Verification Period
Figure 2-4 plots power output at full load over the limited test period as a function of ambient temperature and indicates a generally linear relationship The generating rate ranged from about 19 to 235 kW across a temperature range of 349 to 596 oF
2-7
23 POWER QUALITY PERFORMANCE
231 Electrical Frequency
Electrical frequency measurements (voltage and current) were monitored continuously during the verification period The one-minute average data collected by the electrical meter were analyzed to determine maximum frequency minimum frequency average frequency and standard deviation for the verification period These results are illustrated in Figure 2-5 and summarized in Table 2-3 The average electrical frequency measured was 59999 Hz and the standard deviation was 0010 Hz
60060 606
60060 404
60060 202
60060 000
59959 898
59959 696
59959 494
59599922
222111444000444111111333000
35 C35 C35 Consonsonseeecccutututiiivvveee HHHooouuursrsrs ofofof MoMoMonininitttooorrriiingngng 222111555000444222222303030
Figure 2-5 Microturbine Frequency During Verification Period
Table 2-3 Electrical Frequency During Monitoring Period
Parameter Frequency (Hz) Average Frequency 59999 Minimum Frequency 59959 Maximum Frequency 60037 Standard Deviation 0010
Freq
uenc
y (H
z)Fr
eque
ncy
(Hz)
2-8
232 Voltage Output
It is typically accepted that voltage output can vary within plusmn 10 percent of the standard voltage (480 volts) without causing significant disturbances to the operation of most end-use equipment (ANSI 1996) The 7500 ION electric meter was configured to measure 0 to 600 VAC The turbine was grid-connected and operated as a voltage-following current source The voltage levels measured are therefore more indicative of the grid voltage levels that the Capstone tried to respond to
Figure 2-6 plots one-minute average voltage readings and Table 2-4 summarizes the statistical data for the voltages measured on the turbine throughout the verification period The voltage levels were well within the normal accepted range of plusmn 10 percent
460
470
480
490
500
Vol
tage
35 Consecutive Hours of Monitoring
460
470
480
490
500
Vol
tage
35 Consecutive Hours of Monitoring35 Consecutive Hours of Monitoring222111444000444111111333000
222111555000444222222333000
Figure 2-6 Microturbine Voltage During Verification Period
Table 2-4 Microturbine Voltage During Monitoring Period
Parameter Volts Average Voltage 48725 Minimum Voltage 47843 Maximum Voltage 49186 Standard Deviation 245
2-9
233 Power Factor
Figure 2-7 plots one-minute average power factor readings and Table 2-5 summarizes the statistical data for power factors measured on the turbine throughout the verification period The data include only periods when the microturbine was operating Data collected during the periodic trips are not included in the figure or summary table Test results show that the power factor was very stable throughout the period with the turbine at full load The power factor decreased during the low load controlled test periods
Figure 2-7 Microturbine Power Factor During Verification Period
88
90
92
94
96
98
Pow
er F
acto
r (
)
35 Consecutive Hours of Monitoring 88
90
92
94
96
98
Pow
er F
acto
r (
)
35 Consecutive Hours of Monitoring35 Consecutive Hours of Monitoring21404 215042121404 21504404 215041130 2230111130 223030 2230
Table 2-5 Power Factors During Monitoring Period
Parameter Average at full load 9453 Minimum at full load 9177 Maximum at full load 9493 Standard Deviation at full load 0240 Average at 20 kW 9280 Average at 15 kW 8987
2-10
234 Current and Voltage Total Harmonic Distortion
The turbine total harmonic distortion up to the 63rd harmonic was recorded for current and voltage output using the 7500 ION The average current and voltage THD were 321 and 189 percent respectively (Table 2-6) Both were well within the IEEE 519 specification of plusmn 5 percent Figure 2-8 plots the current and voltage THD throughout the verification period Figure 2-8 clearly shows a spike in current THD each time the microturbine was tripped by the biogas pressure loss The highest of the spikes was 32 percent
Table 2-6 Microturbine THD During Monitoring Period
Parameter Current THD () Voltage THD () Average 321 189 Minimum 222 160 Maximum 325 316 Standard Deviation 115 018
Figure 2-8 Microturbine Current and Voltage THD During Verification Period
0
2
4
6
8
10
12
THD
()
35 Consecutive Hours of Monitoring
Voltage THD
Current THD
0
2
4
6
8
10
12
THD
()
35 Consecutive Hours of Monitoring35 Consecutive Hours of Monitoring
Voltage THD
CurrentTHD
21404 21504221404 215041404 215041130 2230111130 223030 2230
2-11
24 EMISSIONS PERFORMANCE
241 Microturbine CHP System Emissions
Testing was conducted on the turbine exhaust stack to determine emission rates for NOX CO THC SO2 TRS CH4 and CO2 at each of the four controlled test conditions Testing for determination of TPM and NH3 was conducted at full load only Stack emission measurements were conducted using the reference methods summarized in Table 1-3 and detailed in the test plan The CHP system was maintained in a stable mode of operation during each test run based on PTC-22 variability criteria
Sampling system QAQC checks were conducted in accordance with test plan specifications to ensure the collection of adequate and accurate emissions data These included analyzer linearity tests and sampling system bias and drift checks Results of the QAQC checks are discussed in Section 325 The results show that DQOs for all gas species met the reference method requirements Table 2-7 summarizes the emission rates measured during each run and the overall average emissions for each set of tests
NOX concentrations averaged 175 ppmvd at 15 O2 at full load and increased to 346 ppmvd at the lowest load tested (setting of 15 kW) The overall average NOX emission rate at full load normalized to power output was 000008 lbkWh The benefits of lower NOX emissions from the CHP system are further enhanced by the fact that some of the exhaust heat is recovered and used Annual published data from Energy Information Administration (EIA) reveal that the measured CHP system NOX emission rate is well below the weighted average US and Colorado regional grid emission factors identified in the test plan which are 00066 and 00077 lbkWh respectively As stated earlier the center could not estimate annual emission reductions due to insufficient power production data but the emissions testing results clearly indicate that reductions will be realized through use of this CHP system The emission reductions are further increased when transmission and distribution system losses are accounted for
Average exhaust gas CO concentrations ranged from a low of 305 ppmvd at 15 O2 at full load to a high of 451 ppmvd at 15 O2 at the 15 kW power command Corresponding average CO emission rates at these power commands were approximately 0009 and 0017 lbkWh respectively
Similarly THC (and CH4) concentrations increased as power output decreased and ranged from 165 ppmvd at 15 O2 at full load to 475 ppmvd at 15 O2 at the 15 kW power command Corresponding average THC emission rates at these power commands were approximately 0003 and 0011 lbkWh respectively The CH4 emissions consistently comprised about 80 percent of the THC emissions
Concentrations of CO2 in the CHP system exhaust gas averaged 23 percent at full load and decreased as power output was reduced to a low of 20 percent These concentrations correspond to average CO2 emission rates of 345 lbkWh and 390 lbkWh respectively The CHP system CO2 emission rate at full load is higher than the weighted average fossil fuel emission factors for both the US and Colorado regional grids (202 and 213 lbkWh respectively) This indicates a likely increase in annual CO2 emissions for power production from this system but this increase would likely be offset by efficiency gains resulting from heat recovery and use and elimination of transmission and distribution system losses
2-12
Table 2-7 Microturbine CHP System Emissions During Controlled Test Periods
Pow
erC
omm
and
(kW
)
Elec
tric
alPo
wer
Out
put
(kW
) Exhaust
O2 ()
NOx Emissions CO Emissions THC Emissions CH4 Emissions CO2 Emissions
(ppm at
15 O2) (lbhr) (lbkWh)
(ppm at
15 O2) (lbhr) (lbkWh)
(ppm at
15 O2) (lbhr) (lbkWh)
(ppm at
15 O2) (lbhr) (lbkWh) () (lbhr) (lbkWh)
Run 1
Run 2
Run 3
AVG
30
197
201
198
199
191
191
192
191
170
180
174
175
161E-03
167E-03
161E-03
163E-03
817E-05
831E-05
814E-05
821E-05
250
310
354
305
0144
0175
0199
0173
0007
0009
0010
0009
141
163
190
165
0046
0052
0061
0053
235E-03
261E-03
310E-03
269E-03
112
141
157
137
0037
0045
0051
0044
187E-03
226E-03
256E-03
223E-03
23
23
23
23
682
668
707
686
346
332
358
345
Run 4
Run 5
Run 6
AVG
24
192
193
193
193
191
192
192
192
190
201
198
196
184E-03
184E-03
180E-03
183E-03
954E-05
952E-05
936E-05
947E-05
319
345
364
343
0188
0191
0202
0194
0010
0010
0010
0010
184
194
200
193
0062
0061
0063
0062
321E-03
319E-03
328E-03
323E-03
141
155
183
160
0047
0049
0058
0051
246E-03
254E-03
300E-03
267E-03
23
23
23
23
696
696
696
696
362
361
361
361
Run 7a
Run 8
Run 9
AVG
20
150
150
150
150
193
193
193
193
505
575
572
399
0004
0042
0042
0029
248E-04
281E-03
279E-03
195E-03
590
192
199
327
0263
0086
0089
0146
0018
0006
0006
0010
365
132
126
208
0093
0034
0032
0053
622E-03
225E-03
214E-03
354E-03
293
97
105
165
0075
0025
0027
0042
499E-03
165E-03
179E-03
281E-03
22
22
22
22
569
569
569
569
380
379
378
379
Run 10
Run 11
Run 12
AVG
15
101
101
102
101
190
191
191
191
332
351
354
346
0022
0022
0022
0022
219E-03
218E-03
220E-03
219E-03
441
459
452
451
0179
0176
0174
0176
0018
0017
0017
0017
483
484
457
475
0112
0106
0100
0106
110E-02
105E-02
987E-03
105E-02
360
413
410
394
0083
0091
0090
0088
824E-03
893E-03
885E-03
867E-03
20
20
20
20
395
395
395
395
391
390
390
390
a The NOX CO and CH4 concentrations during run 7 are questionable when compared to the data collected during runs 8 and 9 A brief 4-minute microturbine shutdown occurred at the conclusion of run 7 but the GHG Center was unable to resolve this anamoly after reviewing all available system operating data
2-13
Table 2-7 Microturbine CHP System Emissions During Controlled Test Periods (Continued)
Pow
erC
omm
and
(kW
)
Elec
tric
alPo
wer
Out
put
(kW
) Exhaust
O2 ()
Particulate Emissions NH3 Emissions SO2 Emissions TRS Emissions
(grdscf) (lbhr) (lbkWh)
(ppm at
15 O2) (lbhr) (lbkWh)
(ppm at
15 O2) (lbhr) (lbkWh)
(ppm at
15 O2) (lbhr) (lbkWh)
Run 1
Run 2
Run 3
AVG
30
197
201
198
199
191
191
192
191
00055
00053
00022
00043
0016
0015
0006
0012
811E-04
746E-04
304E-04
620E-04
005
004
002
004
170E-05
131E-05
600E-06
120E-05
862E-07
654E-07
304E-07
607E-07
488
582
614
561
064
073
081
073
0032
0036
0041
0037
155
144
570
119
0020
0018
0008
0015
101E-03
913E-04
406E-04
778E-04
Run 4
Run 5
Run 6
AVG
24
192
193
193
193
191
192
192
192
ND
ND
ND
NA
ND
ND
ND
NA
ND
ND
ND
NA
ND
ND
ND
NA
ND
ND
ND
NA
ND
ND
ND
NA
560
596
584
580
077
076
075
076
0040
0039
0039
0039
483
327
196
335
00067
00042
00025
00045
348E-04
218E-04
130E-04
232E-04
Run 7
Run 8
Run 9
AVG
20
150
150
150
150
193
193
193
193
ND
ND
ND
NA
ND
ND
ND
NA
ND
ND
ND
NA
ND
ND
ND
NA
ND
ND
ND
NA
ND
ND
ND
NA
594
590
588
591
061
060
061
061
0041
0040
0041
0040
820
678
581
693
00084
00069
00060
00071
561E-04
461E-04
401E-04
474E-04
Run 10
Run 11
Run 12
AVG
15
101
101
102
101
190
191
191
191
ND
ND
ND
NA
ND
ND
ND
NA
ND
ND
ND
NA
ND
ND
ND
NA
ND
ND
ND
NA
ND
ND
ND
NA
477
500
496
491
043
043
043
043
0043
0042
0042
0042
268
229
228
242
00024
00020
00020
00021
237E-04
198E-04
198E-04
211E-04
ND = No data collected These pollutants not tested at reduced loads NA = Not applicable
2-14
Emissions of total particulate matter and NH3 were extremely low during each of the three test replicates conducted at full power SO2 emissions from the CHP were fairly consistent throughout the range of operation At full load SO2 concentrations averaged 561 ppmvd at 15 O2 and corresponding emission rates averaged 0037 lbkWh Emissions of TRS the sulfurous compounds in the fuel that were not oxidized during combustion averaged approximately 780 ppmvd at 15 O2 and 0005 lbkWh during the full load tests
2-15
30 DATA QUALITY ASSESSMENT
31 DATA QUALITY OBJECTIVES
The GHG Center selects methodologies and instruments for all verifications to ensure a stated level of data quality in the final results The GHG Center specifies data quality objectives (DQOs) for each verification parameter before testing commences Each test measurement that contributes to the determination of a verification parameter has stated data quality indicators (DQIs) which if met ensure achievement of that verification parameterrsquos DQO
The establishment of DQOs begins with the determination of the desired level of confidence in the verification parameters Table 3-1 summarizes the DQOs established in the test planning stage for each verification parameter The actual data quality achieved during testing is also shown The next step is to identify all measured values which affect the verification parameter and determine the levels of error which can be tolerated These DQIs most often stated in terms of measurement accuracy precision and completeness are used to determine if the stated DQOs are satisfied The DQIs for this verification shyused to support the DQOs listed in Table 3-1 - are summarized in Table 3-2
Table 3-1 Verification Parameter Data Quality Objectives
Verification Parameter Original DQO Goala
Relative () Absolute (units) Achievedb
Relative () Absolute (units) Power and Heat Production Performance
Electrical power output (kW) plusmn 15 098 kW plusmn 10 020 kW Electrical efficiency () plusmn 15 041c plusmn 13 027c
Heat recovery rate (103Btuhr) plusmn 17 575 x 103Btuhrc plusmn 24 27 x 103Btuhrc
Thermal energy efficiency () plusmn 17 071c plusmn 25 083c
CHP production efficiency () plusmn 12 082c plusmn 16 087c
Power Quality Performance Electrical frequency (Hz) plusmn 001 0006 Hz plusmn 001 0006 Hz Voltage 10 48 Vc 10 49 Vc
Power factor () plusmn 050 TBD plusmn 050 047 Voltage and current total harmonic distortion (THD) () plusmn 100 TBD plusmn 100 003
Emissions Performance NOX CO CO2 O2 TRS and SO2 concentration accuracy plusmn 20 of spand plusmn 20 of spand
CH4 and THC concentration accuracy plusmn 50 of spand plusmn 50 of spand
TPM and NH3 concentration accuracy plusmn 50 plusmn 100 a Original DQO goals as stated in test plan Absolute errors were provided in the test plan where applicable based on anticipated
values b Overall measurement uncertainty achieved during verification The absolute errors listed are based on these uncertainties and the
average values measured during the verification c Calculated composite errors were derived using the procedures described in the corresponding subsections (Sections 322 through
325) d Qualitative data quality indicators based on conformance to reference method requirements
The DQIs specified in Table 3-2 contain accuracy precision and completeness levels that must be achieved to ensure that DQOs can be met Reconciliation of DQIs is conducted by performing independent performance checks in the field with certified reference materials and by following approved reference methods factory calibrating the instruments prior to use and conducting QAQC procedures in
3-1
the field to ensure that instrument installation and operation are verified The following sections address reconciliation of each of the DQI goals
This verification was supported by an Audit of Data Quality (ADQ) conducted by the GHG Center QA manager During the ADQ the QA manager randomly selected data supporting each of the primary verification parameters and followed the data through the analysis and data processing system The ADQ confirmed that no systematic errors were introduced during data handling and processing A performance evaluation audit (PEA) and a technical systems audit (TSA) were planned but not conducted Similar PEAs were recently conducted on two recent CHP verifications [13 14] and it was decided to not repeat the PEA a third time Likewise a full TSA was recently completed on a similar verification [13] where the same measurement systems were used so this QA activity was not repeated here Instead the GHG Center QA manager conducted an abbreviated project review to ensure that the verification approach and analytical procedures specified in the TQAP were followed or in cases where changes to the verification were necessary these changes were justified and documented Corrective action reports (CARs) are completed signed by the GHG Center QA manager and filed at the GHG Center that document significant changes to the verification approach or methodologies that occurred during the verification
32 RECONCILIATION OF DQOs AND DQIs
Table 3-2 summarizes the range of measurements observed in the field and the completeness goals Completeness is the number or percent of valid determinations actually made relative to the number or percent of determinations planned The completeness goals for the controlled tests were to obtain electrical and thermal efficiency as well as emission rate data for three test runs conducted at each of four different load conditions This completeness goal was achieved
Completeness goals for the extended tests were to obtain 90 percent of 7 days of power quality power output heat recovery rate and ambient measurements This goal was not achieved As explained in Section 21 the Center was not able to complete the entire 7-day extended monitoring period A total of 35 hours of data were logged including the controlled test periods
Table 3-2 also includes accuracy goals for measurement instruments Actual measurement accuracy achieved is also reported based on instrument calibrations conducted by manufacturers field calibrations reasonableness checks or independent performance checks with a second instrument Table 3-3 includes the QAQC procedures that were conducted for key measurements in addition to the procedures used to establish DQIs The accuracy results for each measurement and their effects on the DQOs are discussed below
3-2
3-3
Table 3-2 Summary of Data Quality Indicator Goals and Results
Measurement Variable Instrument Type and
Manufacturer
Instrument Range
Range Observed in
Field
Accuracy Completeness
Goal Actual How Verified or Determined Goal Actual
CHP System Power Output and Quality
Power
Electric Meter Power Measurements 7500 ION
0 to 100 kW 0 to 242 kW plusmn 15 reading plusmn 10 reading
Instrument calibration from manufacturer prior to testing
Controlled tests three valid runs per load meeting PTC 22 criteria
Extended test 90 of one minute readings for 7 days
Controlled tests three valid runs at each load
Extended test 35 consecutive hours of one minute readings
Voltage 0 to 600 V 478 to 492 V plusmn 10 reading plusmn 10 reading Frequency 55 to 65 Hz 599 to 600 Hz plusmn 001 reading plusmn 001 reading Current 0 to 200A 5 to 29 A plusmn 10 reading plusmn 10 reading Voltage THD 0 to 100 16 to 32 plusmn 10 full scale plusmn 10 full scale Current THD 0 to 100 22 to 325 plusmn 10 full scale plusmn 10 full scale
Power Factor 0 to 100 918 to 949 plusmn 05 reading plusmn 05 reading
CHP System Heat Recovery Rate
Inlet Temperature
Controlotron Model 1010EP
80 to 150 oF 89 to 94 oF Temps must be plusmn 15 oF of ref Thermocouples
plusmn 07 oF for outlet plusmn 08 oF for inlet
Independent check with calibrated thermocoupleOutlet
Temperature 80 to 150 oF 93 to 102 oF
Water Flow 0 to 150 gpm 281 to 286 gpm plusmn 10 reading plusmn 01 reading Instrument calibration from manufacturer prior to testing
Ambient Conditions
Ambient Temperature
RTD Vaisala Model HMD 60YO
-50 to 150 oF 35 to 60 o F plusmn 02 oF plusmn 02 oF
Instrument calibration from manufacturer prior to testing
Ambient Pressure
Setra Model 280E 0 to 25 psia 1268 to 1272
psia plusmn 01 full scale plusmn 005 full scale
Relative Humidity
Vaisala Model HMD 60YO 0 to 100 RH 21 to 49 RH plusmn 2 plusmn 02
(continued)
3-3
3-4
Table 3-2 Summary of Data Quality Indicator Goals and Results (continued)
Measurement Variable Instrument Type and Manufacturer
Instrument Range
Measurement Range
Observed
Accuracy Completeness
Goal Actual How Verified or Determined Goal Actual
Fuel Input
Gas Flow Rate Dresser-Roots Model 2M175 SSM Series B3 rotary displacement
0 to 30 scfm 5 to 10 scfm 10 of reading plusmn 03 of reading
Factory calibration with volume prover
Controlled tests three valid runs per load meeting PTC 22 criteria Extended test 90 of one- minute readings for 7 days
Controlled tests three valid runs at each load
Extended test 35 hours of one-minute readings
Gas Pressure Omega Model PX205shy030AI transducer 0 to 30 psia 12 to 14 psia plusmn 075 full
scale plusmn 025 full scale Instrument calibration to NIST traceable standards
Gas Temperature
Omega TX-93 Type K thermocouple 0 to 200 oF 75 to 97 oF plusmn 010 reading plusmn 010 reading
LHV Gas Chromatograph HP 589011
0 to 100 CH4
67 to 69 CH4 plusmn 30 accuracy plusmn 02 repeatability
plusmn 05 accuracy plusmn 005 repeatability
analysis of NIST-traceable CH4 standard and duplicate analysis on 3 samples
Controlled tests two valid samples per load
Controlled tests two valid samples per load627 to 633
Btuft3 01 repeatability
plusmn 006 repeatability
Conducted duplicate analyses on 3 samples
Exhaust Stack Emission
NOX Levels Chemiluminescent CAI 400-CLD
0 to 50 ppmvd 0 to 3 ppmvd plusmn 2 full scale le 2 full scale
Calculated following EPA Reference Method calibrations (Before and after each test run)
Controlled tests three valid runs per load
Controlled tests three valid runs per load
CO Levels NDIR TEI Model 48 0 to 300 ppmvd
50 to 160 ppmvd plusmn 2 full scale le 2 full scale
CH4 levels HP 5890 0 to 300 ppmv 30 to 130 ppmv plusmn 5 full scale le 5 reading
THC levels HP 5890 0 to 300 ppmv 40 to 160 ppmv plusmn 5 full scale le 5 full scale
SO2 Levels Bovar 721-AT 0 to 300 ppmvd
145 to 185 ppmvd plusmn 2 full scale le 2 full scale
O2 CO2 Levels CAI 200 0 to 25 10 to 20 O2
20 to 25 CO2 plusmn 2 full scale le 2 full scale
TRS Levels Ametek 921 0 to 25 ppmvd 0 to 5 ppmvd plusmn 2 full scale le 2 full scale
NH3 Levels Ion specific electrode 0 to 5 ugml 0 to 42 ugml plusmn 5 full scale le 5 full scale
TPM concentrations gravimetric Not specified 001 to 004 g plusmn 1 mg plusmn 05 mg
Stack gas velocity
Pitot and thermocouple Not specified 3552 to 3753
fpm plusmn 5 reading le 5 reading
3-4
321 Power Output
Instrumentation used to measure power was introduced in Section 10 and included a Power Measurements Model 7500 ION The data quality objective for power output was plusmn 15 percent of reading which includes compounded error of the instrument and the current transformers (CTs) The test plan specified factory calibration of the ION meter with a NIST-traceable standard to determine if the power output DQO was met The Test plan also required the GHG Center to perform several reasonableness checks in the field to ensure that the meter was installed and operating properly The following summarizes the results
The meter was factory calibrated by Power Measurements in April 2003 Calibrations were conducted in accordance with Power Measurementsrsquo standard operating procedures (in compliance with ISO 90021994) and are traceable to NIST standards The meters were certified by Power Measurements to meet or exceed the accuracy values summarized in Table 3-2 for power output voltage current and frequency NIST-traceable calibration records are archived by the GHG Center Pretest factory calibrations on the meters indicated that accuracy was within plusmn 005 percent of reading and this value combined with the 10-percent error inherent to the current transformers resulted in an overall error of plusmn 101 percent Using the manufacturer-certified calibration results and the average power output measured during the full-load testing the absolute error during all testing is plusmn 020 kW
Additional QC checks were performed on the 7500 ION to verify the operation after installation of the meters at the site and prior to the start of the verification test The results of these QC checks (summarized in Table 3-3) are not used to reconcile the DQI goals but to document proper operation in the field Current and voltage readings were checked for reasonableness using a hand-held Fluke multimeter These checks confirmed that the voltage and current readings between the 7500 ION and the Fluke were within the range specified in the test plan as shown in Table 3-3
These results led to the conclusion that the 7500 ION was installed and operating properly during the verification test The plusmn 10-percent error in power measurements as certified by the manufacturer was used to reconcile the power output DQO (discussed above) and the electrical efficiency DQO (discussed in Section 322)
3-5
Table 3-3 Results of Additional QAQC Checks
Measurement Variable QAQC Check When
PerformedFrequency Expected or Allowable
Result Results Achieved
Power Output
Sensor diagnostics in field Beginning and end of test Voltage and current checks
within plusmn 1 reading plusmn 01 voltage plusmn 09 current
Reasonableness checks Throughout test Readings should be around 22 kW net power output at full load
Readings were 20 to 24 kW at full load
Fuel Heating Value
Calibration with gas standards by laboratory
Prior to analysis of each lot of samples submitted
plusmn 10 for each gas constituent Results satisfactory see
Section 3224 Independent performance checks with blind audit sample
Twice during previous year
plusmn 30 for each major gas constituent (methane CO2)
Heat Recovery Rate
Meter zero check Prior to testing Reported water flow rate lt 01 gpm ndash006 gpm recorded
Independent performance check of temperature readings
Beginning of test period Difference in temperature readings should be lt 15 degF
Temperature readings within 08 degF of reference
322 Electrical Efficiency
The DQO for electrical efficiency was to achieve an uncertainty of plusmn 152 percent at full electrical load or less Recall from Equation 1 (Section 141) that the electrical efficiency determination consists of three direct measurements power output fuel flow rate and fuel LHV The accuracy goals specified to meet the electrical efficiency DQO consisted of plusmn 15 percent for power output plusmn 10 percent for fuel flow rate and plusmn 02 percent for LHV The accuracy goals for each measurement were met The following summarizes actual errors achieved and the methods used to compute them
Power Output As discussed in Section 321 factory calibrations of the 7500 ION with a NISTshytraceable standard and the inherent error in the current and potential transformers resulted in plusmn 10-percent error in power measurements Reasonableness checks in the field verified that the meter was functioning properly The average power output at full load was approximately 20 kW with a measurement error of plusmn 020 kW
Heat Input Heat input is the product of measured fuel flow rate and LHV The DQI goal for fuel flow rate was reconciled through calibration of the gas meter and the gas temperature and pressure sensors used to correct measured gas volumes to standard conditions All three components were calibrated with NIST-traceable standards As shown in Table 3-2 the individual instruments errors were 03 025 and 01 percent for flow pressure and temperature respectively The overall error in biogas flow rate on a wet basis then is 040 percent of reading
Since biogas flow rate was metered on a wet and low pressure basis but combusted by the microturbine on a dry high pressure basis measured flow rates were corrected for moisture content (Section 142) Since the actual moisture content of the as-fired biogas was not directly measured the assumption that the gas was completely dry introduced additional error into the heat input determination The center
3-6
conducted an analysis of this assumption and knowing the temperature and pressure of the gas as fired determined that the worst case error introduced by the assumption that the gas is totally dry is 07 percent Combining that uncertainty with the heat input wet basis error of 040 percent the overall error on determination of biogas flow rate on a dry basis is then 081 percent of reading
The average flow rate at full load was 881 scfm with an associated measurement error of plusmn 007 scfm Complete documentation of data quality results for fuel flow rate is provided in Section 325
Uncertainty in the biogas LHV results was within the 02 percent DQI goal (Section 326) The average LHV during testing was 630 Btuft3 and the measurement error corresponding to this heating value is plusmn 13 Btuft3 The heat input compounded error then is
Error in Heat Input = ( flowmetererror )2 + (LHVerror)2 (Equation 5)
= (00081)2 + (0002)2 = 00083
The measurement error amounts to approximately plusmn 27 x 103Btuhr or 083 percent relative error at the average measured heat input of 332 x 103Btuhr
The errors in the divided values compound similarly for the electrical efficiency determination The electrical power measurement error is plusmn 10 percent relative (Table 3-2) and the heat input error is plusmn 083 percent relative Therefore compounded relative error for the electrical efficiency determination is
Error in Elec Power Efficiency = (powermetererror)2 + (heatinputerror)2 (Equation 6)
= (0010)2 + (00083)2 = 00130
Electrical efficiency for the controlled test periods at full load was 204 plusmn 027 percent or a relative compounded error of 13 percent
323 PTC-22 Requirements for Electrical Efficiency Determination
PTC-22 guidelines state that efficiency determinations were to be performed within 60 minute test periods in which maximum variability in key operational parameters did not exceed specified levels Table 3-4 summarizes the maximum permissible variations observed in power output ambient temperature ambient pressure biogas pressure at the meter and biogas temperature at the meter for each test run The table shows that the requirements for all parameters were met for all test runs and the efficiency determinations were representative of stable operating conditions
3-7
Table 3-4 Variability Observed in Operating Conditions Maximum Observed Variationa in Measured Parameters
Power Output ()
Ambient Temp (oF)
Ambient Pressure ()
Biogas pressure
(psia)
Power Factor ()
Maximum Allowable Variation plusmn 2 plusmn 4 plusmn 05 plusmn 1 plusmn 2
Run 1 06 11 003 02 02 Run 2 17 07 003 01 01 Run 3 18 06 002 01 01 Run 4 03 22 001 02 01 Run 5 03 09 001 02 01 Run 6 04 25 002 02 02 Run 7 03 03 001 03 01 Run 8 04 07 001 01 01 Run 9 02 08 001 02 01
Run 10 04 05 002 01 01 Run 11 04 04 003 02 01 Run 12 03 04 002 03 01
a Maximum (Average of Test Run ndash Observed Value) Average of Test Run 100
324 Ambient Measurements
Ambient temperature relative humidity and barometric pressure at the site were monitored throughout the verification period and the controlled tests The instrumentation used is identified in Table 3-2 along with instrument ranges data quality goals and data quality achieved All three sensors were factoryshycalibrated using reference materials traceable to NIST standards The pressure sensor was calibrated prior to the verification testing confirming the plusmn 01 percent accuracy The temperature and relative humidity sensors were also calibrated within a year prior to testing which verified that the plusmn 02 degF accuracy goal for temperature and plusmn 2 percent accuracy goal for relative humidity were met
325 Fuel Flow Rate
The Dresser-Roots Model 2M175 rotary displacement gas meter was factory-calibrated prior to installation in 1999 Calibration records were obtained and reviewed to ensure that the plusmn 10-percent instrument accuracy goal was satisfied The original calibration for the Roots meter indicating an accuracy of plusmn 032 percent is a permanent calibration This error combines with the errors in the gas temperature pressure and moisture determinations for an overall biogas flow rate measurement error of plusmn 081 percent
326 Fuel Lower Heating Value
Biogas sample collection date time run number and canister ID were logged along with laboratory chain of custody forms and were shipped along with the samples Copies of the chain of custody forms and results of the analyses are stored in the GHG Center project files Collected samples were shipped to Empact Analytical Laboratories of Brighton CO for compositional analysis and determination of LHV
3-8
per ASTM test Methods D1945 [6] and D3588 [7] respectively The DQI goals were to measure methane concentrations within plusmn 30 percent of a NIST-traceable blind audit sample and to achieve less than plusmn 02 percent difference in LHV duplicate analyses results Blind audits were submitted to Empact on two similar verifications within the past year to evaluate analytical accuracy on the methane analyses [13 14] Both audits indicated analytical accuracy within 05 percent and repeatability of within plusmn 02 percent Since the same sampling and analytical procedures were used here by the same analyst the audit was not repeated a third time
Duplicate analyses in addition to the blind audit samples were conducted on three of the samples collected during the controlled test periods Duplicate analysis is defined as the analysis performed by the same operating procedure and using the same instrument for a given sample volume Results of the duplicate analyses showed an average analytical repeatability of 006 percent for methane and 006 percent for LHV The results demonstrate that the plusmn 02 percent LHV accuracy goal was achieved As such both DQIs were met with the methane accuracy at plusmn 05 percent and the LHV repeatability at plusmn 006 percent
327 Heat Recovery Rate and Efficiency
Several measurements were conducted to determine CHP system heat-recovery rate and thermal efficiency These measurements include water flow rate water supply and return temperatures and CHP system heat input The individual errors in each of the measurements is then propagated to determine the overall error in heat-recovery rate and efficiency The Controlotron ultrasonic heat meter was used to continuously monitor water flow rate This meter has a NIST-traceable factory-calibrated accuracy of plusmn 10 percent of reading (this flow through calibration was conducted on October 9 2002) This certification serves as the primary DQI A zero check was also performed on the flow meter The meter reading was -006 gpm with the CHP system shut down and the circulation pump off
Table 3-2 showed that the DQI for supply and return temperatures (delta T) was achieved Each temperature sensor was calibrated against a reference thermocouple with NIST-traceable accuracy The error in the two temperature sensors resulted in an overall delta T uncertainty of 08 oC This absolute error equates to a relative error of 22 percent at the average fluid temperatures measured during the fullshyload testing (about 361 oC) The overall error in heat recovery rate is then the combined error in flow rate and temperature differential This error compounds multiplicatively as follows
Overall Heat Meter Error = (Flow rate error)2 + (compositional error) 2 (Equation 7)
( ) 0240)0220(0100 22 =+=
The heat recovery rate determination therefore has a relative compounded error of plusmn 24 percent The absolute error in the average heat recovery rate at full load (111 x 103Btuhr) then is plusmn 27 x 103Btuhr
This error in heat-recovery rate and the heat input error (083 percent) compound similarly to determine the overall uncertainty in the thermal efficiency determination as follows
Error in Heat Recovery Efficiency = (0024)2 + (00083)2 = 0025 (Equation 8)
Average heat recovery rate (thermal) efficiency at full load then is 333 plusmn 083 percent or a relative compounded error of 25 percent This compounded relative error exceeds the data quality objective
3-9
slightly but the absolute error is within the goal for this verification parameter (measured values were lower than anticipated)
328 Total Efficiency
Total efficiency is the sum of the electrical power and heat-recovery efficiencies Total efficiency is defined as 204 plusmn 027 percent (plusmn 130-percent relative error) plus 333 plusmn 063 percent (plusmn 19-percent relative error) This is based on the determined errors in electrical and thermal efficiency at full load The absolute errors compound as follows
errcabs = err12 + err2
2 (Equation 9)
870830270 22 =+=
Relative error is
errcrel =errcabs (Equation 10)
Value1 +Value2
087 = = 0016
204 + 333 where
errcabs = compounded error absolute err1 = error in first added value absolute value err2 = error in second added value absolute value errcrel = compounded error relative value1 = first added value value2 = second added value
The total CHP efficiency at full load is then 537 plusmn 087 percent or 16 percent relative error Again this compounded relative error exceeds the data quality objective slightly
329 Exhaust Stack Emission Measurements
EPA reference method requirements form the basis for the qualitative DQIs specified in the Test plan and listed in Tables 3-1 and 3-2 Each method specifies sampling and calibration procedures and data quality checks These specifications when properly implemented ensure the collection of high quality and representative emissions data The specific sampling and calibration procedures vary by method and class of pollutants and are summarized in Table 3-5 The table lists the method quality requirements the acceptable criteria and the results for the test conducted here It is generally accepted that conformance to the reference method quality requirements demonstrates that the qualitative DQIs have been met
All of the emissions testing and reference method quality control procedures were conducted by Cubix Corporation either in the field during testing or in their calibration and analytical laboratories in Austin Texas All of the field sampling procedures and calibrations were closely monitored by GHG Center personnel In addition documentation of all sampling and analytical procedures data collection and
3-10
calibrations have been procured reviewed and filed by the GHG Center Table 3-5 is followed by a brief explanation of the QAQC procedures implemented for each class of pollutant quantified during this verification
Table 3-5 Summary of Emissions Testing Calibrations and QC Checks
Measurement Variable
Calibration or QC Check
When Performed and Frequency
Expected or Allowable Result
Result of Calibration(s) or Check(s)
NOX CO CO2 SO2 TRS and O2 concentrations
Analyzer calibration error test
Daily before testing plusmn 2 of analyzer span All within allowable level for each day
System bias checks Before each test run plusmn 5 of analyzer span All within allowable level for each test run Calibration drift test After each test run plusmn 3 of analyzer span
THC concentrations System calibration error test
Daily before testing plusmn 5 of analyzer span All within allowable level for each day
System calibration drift test
After each test run plusmn 3 of analyzer span All within allowable level for each test run
CH4 concentrations Triplicate injections Each test run plusmn 5 difference All within allowable level for each test run
Calibration of GC with gas standards by certified laboratory
Immediately prior to sample analyses andor at least once per day
plusmn 5 for each compound
All within allowable level for each day
TPM emissions Pre and post test sampling system leak checks
Before and after each test run
Sampling system leak rate lt 002 cfm
All checks lt 002 cfm
Minimum sample volume After each test run Corrected Vol gt 600 dscf
Volumes ranged from 694 to 796 dscf
Percent isokinetic sampling rate (I)
After each test run 90 lt I lt 110 91 lt I lt 102
Analytical balance calibration
Once before analysis plusmn 00001 g Within allowable level
Filter and reagent blanks Once during testing after first test run
lt 10 of particulate catch for first test run
Blank weights lt 10 of each sample catch
Dry gas meter calibration Once before and once after testing
plusmn 5 Pre and post test calibrations within 1
Thermocouple calibration Once after testing plusmn 15 of average stack temperature
Within 03 of reference TC
NH3 concentrations Calibration of instrument with NH3 standards
Immediately prior to sample analyses at least once a day
plusmn 5 Pre test calibrations within 1 of working standards
Dry gas meter calibration Once before and once after testing
plusmn 5 Pre and post test calibrations within 1
Exhaust gas volumetric flow rate
Pitot tube dimensional calibration inspection
Once before and once after testing
See 40CFR60 Method 2 Section 100
Calibration criteria met
Thermocouple calibration Once after testing plusmn 15 of average stack temperature
Within 03 of reference TC
3291 NOX CO CO2 SO2 TRS and O2 Concentrations
Test personnel performed sampling system calibration error tests prior to each test run All calibrations employed a suite of three EPA Protocol No 1 calibration gases (four for CO) that spanned the instrument ranges Appropriate calibration ranges were selected for each pollutant based on exhaust gas screening (ranges are summarized in Table 3-2) The daily analyzer calibration error goal for each instrument was plusmn 20 percent of span It was met for each analyzer during each day of testing
3-11
Sampling system bias was evaluated for each parameter at the beginning of each test run using the zero and mid-level calibration gases System response to the zero and mid-level calibration gases also provided a measure of drift and bias at the end of each test run The maximum allowable sampling system bias and drift values were plusmn 5 and plusmn 3 percent of span respectively These specifications were met for each parameter and for each test run Testers also performed a NOX converter efficiency test as described in Section 35 of the test plan The converter efficiency was 9998 percent which meets the 98shypercent goal specified in the method
3292 THC Concentrations
Following Method 25A criteria the analyzer calibration error test is not performed on the THC analyzer Instead a 4-point system bias test is conducted at the beginning of each test day System response must be within plusmn 5 percent of the calibration standard at each point System response to the zero and mid-level calibration gases also provided a measure of drift and bias at the end of each test run The maximum allowable sampling system bias and drift values were plusmn 5 and plusmn 3 percent of span respectively These specifications were met for test run
3293 CH4 Concentrations
The test plan specified EPA Method 18 for determining stack gas methane concentrations This testing was conducted on-site eliminating the need to collect bag samples for transport to a laboratory Test operators injected calibration gas standards into the gas chromatograph (GC) to establish a concentration standard curve prior to sample analysis The operator repeated the injections until the average of all desired compounds from three separate injections agreed to within 50 percent of the certified value The acceptance criterion was met for all runs
The analysts injected the mid-range standard to quantify instrument drift at the completion of each test The analyst would repeat the calibration process used for the average of the two calibration curves to determine concentrations if he observed a variance larger than 50 percent
3294 Total Particulate Matter and Exhaust Gas Volumetric Flow Rate
Reference Methods 1 through 5 used for determination of exhaust gas volumetric flow rate and total particulate emissions include numerous quality control and quality assurance procedures that are required to ensure collection of representative data The most important of these procedures are listed in Table 3-5 along with the results for these tests These methods do not specify overall uncertainties but it is generally accepted that conformance to the control and quality assurance procedures will result in an overall method uncertainty ranging from 5 to 30 percent depending on the mass of the particulate catch the quality of the sampling system and the length of the sampling probe [15] For these tests TPM catches were in the range of 10 to 20 mg the sampling system surfaces contacting the exhaust gases were constructed entirely of glass or Teflon and the probe was less than 3-feet in length In addition testers documented that all of the key method criteria were met It is therefore expected that the overall error for tests conducted here is plusmn 10 percent of reading This exceeds the original goal of plusmn 5 percent but this deviation from the plan is not believed to impact results significantly because TPM emissions were very low
3-12
3295 NH3 Concentrations
Ammonia samples were collected in the back-half of the total particulate sampling train and therefore all of the sampling system criteria are the same as for TPM measurements Sampling error for the NH3 samples should be the same as sampling error for the TPM samples In the laboratory analytical instrumentation was calibrated using nine working standards A calibration curve for the instrument was developed using this nine-point calibration The R2 for the calibration curve was 09997 indicating excellent analytical linearity Based on this the same uncertainty used for the TPM determination (plusmn10 percent) is assigned Again this level of uncertainty exceeds the original goal of plusmn 5 percent but as with the TPM emissions this deviation from the plan is not believed to impact results significantly because NH3 emissions were also very low
3-13
40 REFERENCES
[1] Southern Research Institute Environmental Technology Verification Report Swine Waste Electric and Heat Production ndash Martin Machinery Internal Combustion Engine SRIUSEPA-GHG-QAP-27 wwwsri-rtpcom Greenhouse Gas Technology Center Southern Research Institute Research Triangle Park NC September 2004
[2] Southern Research Institute Test and Quality Assurance Plan - Swine Waste Electric Power and Heat Production Systems Capstone MicroTurbine and Martin Machinery Internal Combustion Engine SRIUSEPA-GHG-QAP-22 wwwsri-rtpcom Greenhouse Gas Technology Center Southern Research Institute Research Triangle Park NC November 2002
[3] American Society of Mechanical Engineers Performance Test Code for Gas Turbines ASME PTC-22 New York NY 1997
[4] American National Standards Institute American Society of Heating Refrigeration and Airshy conditioning Engineers Method of Testing Thermal Energy Meters for Liquid Streams in HVAC
Systems ANSIASHRAE 125-1992 Atlanta GA 1995
[5] CRC Press Handbook of Chemistry and Physics ndash 60th Edition CRC Press Inc Boca Raton Florida 1980
[6] American Society for Testing and Materials Standard Test Method for Analysis of Natural Gas by Gas Chromatography ASTM D1945-98 West Conshohocken PA 2001
[7] American Society for Testing and Materials Standard Practice for Calculating Heat Value Compressibility factor and Relative Density of Gaseous Fuels ASTM D3588-98 West Conshohocken PA 2001
[8] American Society for Testing and Materials Standard Practice for Determination of Sulfur Compounds in Natural Gas by Gas Chromatography and Chemiluminescense ASTM D5504-01 West Conshohocken PA 2001
[9] American National Standards Institute ANSI Institute of Electrical and Electronics Engineers IEEE Master Test Guide for Electrical Measurements in Power Circuits ANSIIEEE Std 120shy1989 New York NY October 1989
[10] American National Standards Institute ANSI Institute of Electrical and Electronics Engineers IEEE Recommended Practices and Requirements for Harmonic Control in Electrical Power Systems IEEE Std 519-1992 New York NY April 1993
[11] American National Standards Institute ANSI Institute of Electrical and Electronics Engineers National Standards for Electric Power Systems and Equipment - Voltage Ratings (Hertz) ANSI C841-1995 American National Standards Institute National Electrical Manufacturers Association Rosslyn VA 1996
[12] US Environmental Protection Agency Code of Federal Regulations Title 40 Part 60 New Source Performance Standards Appendix A US EPA Washington DC 1999
[13] Southern Research Institute Environmental Technology Verification Report Combined Heat and Power at a Commercial Supermarket ndash Capstone 60 kW Microturbine CHP System SRIUSEPA-GHG-QAP-27 wwwsri-rtpcom Greenhouse Gas Technology Center Southern Research Institute Research Triangle Park NC September 2003
[14] Southern Research Institute Environmental Technology Verification Report Residential Electric Power Generation Using the Plug Power SU1 Fuel Cell System SRIUSEPA-GHG-QAP-25 wwwsri-rtpcom Greenhouse Gas Technology Center Southern Research Institute Research Triangle Park NC September 2003
[15] Shigehara RT Measurement Uncertainty of Selected EPA Test Methods Emission Monitoring Inc Presented at Stationary Source Sampling and Analysis for Air Pollutants XXV Conference March 2001

3-3
Table 3-2 Summary of Data Quality Indicator Goals and Results
Measurement Variable Instrument Type and
Manufacturer
Instrument Range
Range Observed in
Field
Accuracy Completeness
Goal Actual How Verified or Determined Goal Actual
CHP System Power Output and Quality
Power
Electric Meter Power Measurements 7500 ION
0 to 100 kW 0 to 242 kW plusmn 15 reading plusmn 10 reading
Instrument calibration from manufacturer prior to testing
Controlled tests three valid runs per load meeting PTC 22 criteria
Extended test 90 of one minute readings for 7 days
Controlled tests three valid runs at each load
Extended test 35 consecutive hours of one minute readings
Voltage 0 to 600 V 478 to 492 V plusmn 10 reading plusmn 10 reading Frequency 55 to 65 Hz 599 to 600 Hz plusmn 001 reading plusmn 001 reading Current 0 to 200A 5 to 29 A plusmn 10 reading plusmn 10 reading Voltage THD 0 to 100 16 to 32 plusmn 10 full scale plusmn 10 full scale Current THD 0 to 100 22 to 325 plusmn 10 full scale plusmn 10 full scale
Power Factor 0 to 100 918 to 949 plusmn 05 reading plusmn 05 reading
CHP System Heat Recovery Rate
Inlet Temperature
Controlotron Model 1010EP
80 to 150 oF 89 to 94 oF Temps must be plusmn 15 oF of ref Thermocouples
plusmn 07 oF for outlet plusmn 08 oF for inlet
Independent check with calibrated thermocoupleOutlet
Temperature 80 to 150 oF 93 to 102 oF
Water Flow 0 to 150 gpm 281 to 286 gpm plusmn 10 reading plusmn 01 reading Instrument calibration from manufacturer prior to testing
Ambient Conditions
Ambient Temperature
RTD Vaisala Model HMD 60YO
-50 to 150 oF 35 to 60 o F plusmn 02 oF plusmn 02 oF
Instrument calibration from manufacturer prior to testing
Ambient Pressure
Setra Model 280E 0 to 25 psia 1268 to 1272
psia plusmn 01 full scale plusmn 005 full scale
Relative Humidity
Vaisala Model HMD 60YO 0 to 100 RH 21 to 49 RH plusmn 2 plusmn 02
(continued)
3-3
3-4
Table 3-2 Summary of Data Quality Indicator Goals and Results (continued)
Measurement Variable Instrument Type and Manufacturer
Instrument Range
Measurement Range
Observed
Accuracy Completeness
Goal Actual How Verified or Determined Goal Actual
Fuel Input
Gas Flow Rate Dresser-Roots Model 2M175 SSM Series B3 rotary displacement
0 to 30 scfm 5 to 10 scfm 10 of reading plusmn 03 of reading
Factory calibration with volume prover
Controlled tests three valid runs per load meeting PTC 22 criteria Extended test 90 of one- minute readings for 7 days
Controlled tests three valid runs at each load
Extended test 35 hours of one-minute readings
Gas Pressure Omega Model PX205shy030AI transducer 0 to 30 psia 12 to 14 psia plusmn 075 full
scale plusmn 025 full scale Instrument calibration to NIST traceable standards
Gas Temperature
Omega TX-93 Type K thermocouple 0 to 200 oF 75 to 97 oF plusmn 010 reading plusmn 010 reading
LHV Gas Chromatograph HP 589011
0 to 100 CH4
67 to 69 CH4 plusmn 30 accuracy plusmn 02 repeatability
plusmn 05 accuracy plusmn 005 repeatability
analysis of NIST-traceable CH4 standard and duplicate analysis on 3 samples
Controlled tests two valid samples per load
Controlled tests two valid samples per load627 to 633
Btuft3 01 repeatability
plusmn 006 repeatability
Conducted duplicate analyses on 3 samples
Exhaust Stack Emission
NOX Levels Chemiluminescent CAI 400-CLD
0 to 50 ppmvd 0 to 3 ppmvd plusmn 2 full scale le 2 full scale
Calculated following EPA Reference Method calibrations (Before and after each test run)
Controlled tests three valid runs per load
Controlled tests three valid runs per load
CO Levels NDIR TEI Model 48 0 to 300 ppmvd
50 to 160 ppmvd plusmn 2 full scale le 2 full scale
CH4 levels HP 5890 0 to 300 ppmv 30 to 130 ppmv plusmn 5 full scale le 5 reading
THC levels HP 5890 0 to 300 ppmv 40 to 160 ppmv plusmn 5 full scale le 5 full scale
SO2 Levels Bovar 721-AT 0 to 300 ppmvd
145 to 185 ppmvd plusmn 2 full scale le 2 full scale
O2 CO2 Levels CAI 200 0 to 25 10 to 20 O2
20 to 25 CO2 plusmn 2 full scale le 2 full scale
TRS Levels Ametek 921 0 to 25 ppmvd 0 to 5 ppmvd plusmn 2 full scale le 2 full scale
NH3 Levels Ion specific electrode 0 to 5 ugml 0 to 42 ugml plusmn 5 full scale le 5 full scale
TPM concentrations gravimetric Not specified 001 to 004 g plusmn 1 mg plusmn 05 mg
Stack gas velocity
Pitot and thermocouple Not specified 3552 to 3753
fpm plusmn 5 reading le 5 reading
3-4
321 Power Output
Instrumentation used to measure power was introduced in Section 10 and included a Power Measurements Model 7500 ION The data quality objective for power output was plusmn 15 percent of reading which includes compounded error of the instrument and the current transformers (CTs) The test plan specified factory calibration of the ION meter with a NIST-traceable standard to determine if the power output DQO was met The Test plan also required the GHG Center to perform several reasonableness checks in the field to ensure that the meter was installed and operating properly The following summarizes the results
The meter was factory calibrated by Power Measurements in April 2003 Calibrations were conducted in accordance with Power Measurementsrsquo standard operating procedures (in compliance with ISO 90021994) and are traceable to NIST standards The meters were certified by Power Measurements to meet or exceed the accuracy values summarized in Table 3-2 for power output voltage current and frequency NIST-traceable calibration records are archived by the GHG Center Pretest factory calibrations on the meters indicated that accuracy was within plusmn 005 percent of reading and this value combined with the 10-percent error inherent to the current transformers resulted in an overall error of plusmn 101 percent Using the manufacturer-certified calibration results and the average power output measured during the full-load testing the absolute error during all testing is plusmn 020 kW
Additional QC checks were performed on the 7500 ION to verify the operation after installation of the meters at the site and prior to the start of the verification test The results of these QC checks (summarized in Table 3-3) are not used to reconcile the DQI goals but to document proper operation in the field Current and voltage readings were checked for reasonableness using a hand-held Fluke multimeter These checks confirmed that the voltage and current readings between the 7500 ION and the Fluke were within the range specified in the test plan as shown in Table 3-3
These results led to the conclusion that the 7500 ION was installed and operating properly during the verification test The plusmn 10-percent error in power measurements as certified by the manufacturer was used to reconcile the power output DQO (discussed above) and the electrical efficiency DQO (discussed in Section 322)
3-5
Table 3-3 Results of Additional QAQC Checks
Measurement Variable QAQC Check When
PerformedFrequency Expected or Allowable
Result Results Achieved
Power Output
Sensor diagnostics in field Beginning and end of test Voltage and current checks
within plusmn 1 reading plusmn 01 voltage plusmn 09 current
Reasonableness checks Throughout test Readings should be around 22 kW net power output at full load
Readings were 20 to 24 kW at full load
Fuel Heating Value
Calibration with gas standards by laboratory
Prior to analysis of each lot of samples submitted
plusmn 10 for each gas constituent Results satisfactory see
Section 3224 Independent performance checks with blind audit sample
Twice during previous year
plusmn 30 for each major gas constituent (methane CO2)
Heat Recovery Rate
Meter zero check Prior to testing Reported water flow rate lt 01 gpm ndash006 gpm recorded
Independent performance check of temperature readings
Beginning of test period Difference in temperature readings should be lt 15 degF
Temperature readings within 08 degF of reference
322 Electrical Efficiency
The DQO for electrical efficiency was to achieve an uncertainty of plusmn 152 percent at full electrical load or less Recall from Equation 1 (Section 141) that the electrical efficiency determination consists of three direct measurements power output fuel flow rate and fuel LHV The accuracy goals specified to meet the electrical efficiency DQO consisted of plusmn 15 percent for power output plusmn 10 percent for fuel flow rate and plusmn 02 percent for LHV The accuracy goals for each measurement were met The following summarizes actual errors achieved and the methods used to compute them
Power Output As discussed in Section 321 factory calibrations of the 7500 ION with a NISTshytraceable standard and the inherent error in the current and potential transformers resulted in plusmn 10-percent error in power measurements Reasonableness checks in the field verified that the meter was functioning properly The average power output at full load was approximately 20 kW with a measurement error of plusmn 020 kW
Heat Input Heat input is the product of measured fuel flow rate and LHV The DQI goal for fuel flow rate was reconciled through calibration of the gas meter and the gas temperature and pressure sensors used to correct measured gas volumes to standard conditions All three components were calibrated with NIST-traceable standards As shown in Table 3-2 the individual instruments errors were 03 025 and 01 percent for flow pressure and temperature respectively The overall error in biogas flow rate on a wet basis then is 040 percent of reading
Since biogas flow rate was metered on a wet and low pressure basis but combusted by the microturbine on a dry high pressure basis measured flow rates were corrected for moisture content (Section 142) Since the actual moisture content of the as-fired biogas was not directly measured the assumption that the gas was completely dry introduced additional error into the heat input determination The center
3-6
conducted an analysis of this assumption and knowing the temperature and pressure of the gas as fired determined that the worst case error introduced by the assumption that the gas is totally dry is 07 percent Combining that uncertainty with the heat input wet basis error of 040 percent the overall error on determination of biogas flow rate on a dry basis is then 081 percent of reading
The average flow rate at full load was 881 scfm with an associated measurement error of plusmn 007 scfm Complete documentation of data quality results for fuel flow rate is provided in Section 325
Uncertainty in the biogas LHV results was within the 02 percent DQI goal (Section 326) The average LHV during testing was 630 Btuft3 and the measurement error corresponding to this heating value is plusmn 13 Btuft3 The heat input compounded error then is
Error in Heat Input = ( flowmetererror )2 + (LHVerror)2 (Equation 5)
= (00081)2 + (0002)2 = 00083
The measurement error amounts to approximately plusmn 27 x 103Btuhr or 083 percent relative error at the average measured heat input of 332 x 103Btuhr
The errors in the divided values compound similarly for the electrical efficiency determination The electrical power measurement error is plusmn 10 percent relative (Table 3-2) and the heat input error is plusmn 083 percent relative Therefore compounded relative error for the electrical efficiency determination is
Error in Elec Power Efficiency = (powermetererror)2 + (heatinputerror)2 (Equation 6)
= (0010)2 + (00083)2 = 00130
Electrical efficiency for the controlled test periods at full load was 204 plusmn 027 percent or a relative compounded error of 13 percent
323 PTC-22 Requirements for Electrical Efficiency Determination
PTC-22 guidelines state that efficiency determinations were to be performed within 60 minute test periods in which maximum variability in key operational parameters did not exceed specified levels Table 3-4 summarizes the maximum permissible variations observed in power output ambient temperature ambient pressure biogas pressure at the meter and biogas temperature at the meter for each test run The table shows that the requirements for all parameters were met for all test runs and the efficiency determinations were representative of stable operating conditions
3-7
Table 3-4 Variability Observed in Operating Conditions Maximum Observed Variationa in Measured Parameters
Power Output ()
Ambient Temp (oF)
Ambient Pressure ()
Biogas pressure
(psia)
Power Factor ()
Maximum Allowable Variation plusmn 2 plusmn 4 plusmn 05 plusmn 1 plusmn 2
Run 1 06 11 003 02 02 Run 2 17 07 003 01 01 Run 3 18 06 002 01 01 Run 4 03 22 001 02 01 Run 5 03 09 001 02 01 Run 6 04 25 002 02 02 Run 7 03 03 001 03 01 Run 8 04 07 001 01 01 Run 9 02 08 001 02 01
Run 10 04 05 002 01 01 Run 11 04 04 003 02 01 Run 12 03 04 002 03 01
a Maximum (Average of Test Run ndash Observed Value) Average of Test Run 100
324 Ambient Measurements
Ambient temperature relative humidity and barometric pressure at the site were monitored throughout the verification period and the controlled tests The instrumentation used is identified in Table 3-2 along with instrument ranges data quality goals and data quality achieved All three sensors were factoryshycalibrated using reference materials traceable to NIST standards The pressure sensor was calibrated prior to the verification testing confirming the plusmn 01 percent accuracy The temperature and relative humidity sensors were also calibrated within a year prior to testing which verified that the plusmn 02 degF accuracy goal for temperature and plusmn 2 percent accuracy goal for relative humidity were met
325 Fuel Flow Rate
The Dresser-Roots Model 2M175 rotary displacement gas meter was factory-calibrated prior to installation in 1999 Calibration records were obtained and reviewed to ensure that the plusmn 10-percent instrument accuracy goal was satisfied The original calibration for the Roots meter indicating an accuracy of plusmn 032 percent is a permanent calibration This error combines with the errors in the gas temperature pressure and moisture determinations for an overall biogas flow rate measurement error of plusmn 081 percent
326 Fuel Lower Heating Value
Biogas sample collection date time run number and canister ID were logged along with laboratory chain of custody forms and were shipped along with the samples Copies of the chain of custody forms and results of the analyses are stored in the GHG Center project files Collected samples were shipped to Empact Analytical Laboratories of Brighton CO for compositional analysis and determination of LHV
3-8
per ASTM test Methods D1945 [6] and D3588 [7] respectively The DQI goals were to measure methane concentrations within plusmn 30 percent of a NIST-traceable blind audit sample and to achieve less than plusmn 02 percent difference in LHV duplicate analyses results Blind audits were submitted to Empact on two similar verifications within the past year to evaluate analytical accuracy on the methane analyses [13 14] Both audits indicated analytical accuracy within 05 percent and repeatability of within plusmn 02 percent Since the same sampling and analytical procedures were used here by the same analyst the audit was not repeated a third time
Duplicate analyses in addition to the blind audit samples were conducted on three of the samples collected during the controlled test periods Duplicate analysis is defined as the analysis performed by the same operating procedure and using the same instrument for a given sample volume Results of the duplicate analyses showed an average analytical repeatability of 006 percent for methane and 006 percent for LHV The results demonstrate that the plusmn 02 percent LHV accuracy goal was achieved As such both DQIs were met with the methane accuracy at plusmn 05 percent and the LHV repeatability at plusmn 006 percent
327 Heat Recovery Rate and Efficiency
Several measurements were conducted to determine CHP system heat-recovery rate and thermal efficiency These measurements include water flow rate water supply and return temperatures and CHP system heat input The individual errors in each of the measurements is then propagated to determine the overall error in heat-recovery rate and efficiency The Controlotron ultrasonic heat meter was used to continuously monitor water flow rate This meter has a NIST-traceable factory-calibrated accuracy of plusmn 10 percent of reading (this flow through calibration was conducted on October 9 2002) This certification serves as the primary DQI A zero check was also performed on the flow meter The meter reading was -006 gpm with the CHP system shut down and the circulation pump off
Table 3-2 showed that the DQI for supply and return temperatures (delta T) was achieved Each temperature sensor was calibrated against a reference thermocouple with NIST-traceable accuracy The error in the two temperature sensors resulted in an overall delta T uncertainty of 08 oC This absolute error equates to a relative error of 22 percent at the average fluid temperatures measured during the fullshyload testing (about 361 oC) The overall error in heat recovery rate is then the combined error in flow rate and temperature differential This error compounds multiplicatively as follows
Overall Heat Meter Error = (Flow rate error)2 + (compositional error) 2 (Equation 7)
( ) 0240)0220(0100 22 =+=
The heat recovery rate determination therefore has a relative compounded error of plusmn 24 percent The absolute error in the average heat recovery rate at full load (111 x 103Btuhr) then is plusmn 27 x 103Btuhr
This error in heat-recovery rate and the heat input error (083 percent) compound similarly to determine the overall uncertainty in the thermal efficiency determination as follows
Error in Heat Recovery Efficiency = (0024)2 + (00083)2 = 0025 (Equation 8)
Average heat recovery rate (thermal) efficiency at full load then is 333 plusmn 083 percent or a relative compounded error of 25 percent This compounded relative error exceeds the data quality objective
3-9
slightly but the absolute error is within the goal for this verification parameter (measured values were lower than anticipated)
328 Total Efficiency
Total efficiency is the sum of the electrical power and heat-recovery efficiencies Total efficiency is defined as 204 plusmn 027 percent (plusmn 130-percent relative error) plus 333 plusmn 063 percent (plusmn 19-percent relative error) This is based on the determined errors in electrical and thermal efficiency at full load The absolute errors compound as follows
errcabs = err12 + err2
2 (Equation 9)
870830270 22 =+=
Relative error is
errcrel =errcabs (Equation 10)
Value1 +Value2
087 = = 0016
204 + 333 where
errcabs = compounded error absolute err1 = error in first added value absolute value err2 = error in second added value absolute value errcrel = compounded error relative value1 = first added value value2 = second added value
The total CHP efficiency at full load is then 537 plusmn 087 percent or 16 percent relative error Again this compounded relative error exceeds the data quality objective slightly
329 Exhaust Stack Emission Measurements
EPA reference method requirements form the basis for the qualitative DQIs specified in the Test plan and listed in Tables 3-1 and 3-2 Each method specifies sampling and calibration procedures and data quality checks These specifications when properly implemented ensure the collection of high quality and representative emissions data The specific sampling and calibration procedures vary by method and class of pollutants and are summarized in Table 3-5 The table lists the method quality requirements the acceptable criteria and the results for the test conducted here It is generally accepted that conformance to the reference method quality requirements demonstrates that the qualitative DQIs have been met
All of the emissions testing and reference method quality control procedures were conducted by Cubix Corporation either in the field during testing or in their calibration and analytical laboratories in Austin Texas All of the field sampling procedures and calibrations were closely monitored by GHG Center personnel In addition documentation of all sampling and analytical procedures data collection and
3-10
calibrations have been procured reviewed and filed by the GHG Center Table 3-5 is followed by a brief explanation of the QAQC procedures implemented for each class of pollutant quantified during this verification
Table 3-5 Summary of Emissions Testing Calibrations and QC Checks
Measurement Variable
Calibration or QC Check
When Performed and Frequency
Expected or Allowable Result
Result of Calibration(s) or Check(s)
NOX CO CO2 SO2 TRS and O2 concentrations
Analyzer calibration error test
Daily before testing plusmn 2 of analyzer span All within allowable level for each day
System bias checks Before each test run plusmn 5 of analyzer span All within allowable level for each test run Calibration drift test After each test run plusmn 3 of analyzer span
THC concentrations System calibration error test
Daily before testing plusmn 5 of analyzer span All within allowable level for each day
System calibration drift test
After each test run plusmn 3 of analyzer span All within allowable level for each test run
CH4 concentrations Triplicate injections Each test run plusmn 5 difference All within allowable level for each test run
Calibration of GC with gas standards by certified laboratory
Immediately prior to sample analyses andor at least once per day
plusmn 5 for each compound
All within allowable level for each day
TPM emissions Pre and post test sampling system leak checks
Before and after each test run
Sampling system leak rate lt 002 cfm
All checks lt 002 cfm
Minimum sample volume After each test run Corrected Vol gt 600 dscf
Volumes ranged from 694 to 796 dscf
Percent isokinetic sampling rate (I)
After each test run 90 lt I lt 110 91 lt I lt 102
Analytical balance calibration
Once before analysis plusmn 00001 g Within allowable level
Filter and reagent blanks Once during testing after first test run
lt 10 of particulate catch for first test run
Blank weights lt 10 of each sample catch
Dry gas meter calibration Once before and once after testing
plusmn 5 Pre and post test calibrations within 1
Thermocouple calibration Once after testing plusmn 15 of average stack temperature
Within 03 of reference TC
NH3 concentrations Calibration of instrument with NH3 standards
Immediately prior to sample analyses at least once a day
plusmn 5 Pre test calibrations within 1 of working standards
Dry gas meter calibration Once before and once after testing
plusmn 5 Pre and post test calibrations within 1
Exhaust gas volumetric flow rate
Pitot tube dimensional calibration inspection
Once before and once after testing
See 40CFR60 Method 2 Section 100
Calibration criteria met
Thermocouple calibration Once after testing plusmn 15 of average stack temperature
Within 03 of reference TC
3291 NOX CO CO2 SO2 TRS and O2 Concentrations
Test personnel performed sampling system calibration error tests prior to each test run All calibrations employed a suite of three EPA Protocol No 1 calibration gases (four for CO) that spanned the instrument ranges Appropriate calibration ranges were selected for each pollutant based on exhaust gas screening (ranges are summarized in Table 3-2) The daily analyzer calibration error goal for each instrument was plusmn 20 percent of span It was met for each analyzer during each day of testing
3-11
Sampling system bias was evaluated for each parameter at the beginning of each test run using the zero and mid-level calibration gases System response to the zero and mid-level calibration gases also provided a measure of drift and bias at the end of each test run The maximum allowable sampling system bias and drift values were plusmn 5 and plusmn 3 percent of span respectively These specifications were met for each parameter and for each test run Testers also performed a NOX converter efficiency test as described in Section 35 of the test plan The converter efficiency was 9998 percent which meets the 98shypercent goal specified in the method
3292 THC Concentrations
Following Method 25A criteria the analyzer calibration error test is not performed on the THC analyzer Instead a 4-point system bias test is conducted at the beginning of each test day System response must be within plusmn 5 percent of the calibration standard at each point System response to the zero and mid-level calibration gases also provided a measure of drift and bias at the end of each test run The maximum allowable sampling system bias and drift values were plusmn 5 and plusmn 3 percent of span respectively These specifications were met for test run
3293 CH4 Concentrations
The test plan specified EPA Method 18 for determining stack gas methane concentrations This testing was conducted on-site eliminating the need to collect bag samples for transport to a laboratory Test operators injected calibration gas standards into the gas chromatograph (GC) to establish a concentration standard curve prior to sample analysis The operator repeated the injections until the average of all desired compounds from three separate injections agreed to within 50 percent of the certified value The acceptance criterion was met for all runs
The analysts injected the mid-range standard to quantify instrument drift at the completion of each test The analyst would repeat the calibration process used for the average of the two calibration curves to determine concentrations if he observed a variance larger than 50 percent
3294 Total Particulate Matter and Exhaust Gas Volumetric Flow Rate
Reference Methods 1 through 5 used for determination of exhaust gas volumetric flow rate and total particulate emissions include numerous quality control and quality assurance procedures that are required to ensure collection of representative data The most important of these procedures are listed in Table 3-5 along with the results for these tests These methods do not specify overall uncertainties but it is generally accepted that conformance to the control and quality assurance procedures will result in an overall method uncertainty ranging from 5 to 30 percent depending on the mass of the particulate catch the quality of the sampling system and the length of the sampling probe [15] For these tests TPM catches were in the range of 10 to 20 mg the sampling system surfaces contacting the exhaust gases were constructed entirely of glass or Teflon and the probe was less than 3-feet in length In addition testers documented that all of the key method criteria were met It is therefore expected that the overall error for tests conducted here is plusmn 10 percent of reading This exceeds the original goal of plusmn 5 percent but this deviation from the plan is not believed to impact results significantly because TPM emissions were very low
3-12
3295 NH3 Concentrations
Ammonia samples were collected in the back-half of the total particulate sampling train and therefore all of the sampling system criteria are the same as for TPM measurements Sampling error for the NH3 samples should be the same as sampling error for the TPM samples In the laboratory analytical instrumentation was calibrated using nine working standards A calibration curve for the instrument was developed using this nine-point calibration The R2 for the calibration curve was 09997 indicating excellent analytical linearity Based on this the same uncertainty used for the TPM determination (plusmn10 percent) is assigned Again this level of uncertainty exceeds the original goal of plusmn 5 percent but as with the TPM emissions this deviation from the plan is not believed to impact results significantly because NH3 emissions were also very low
3-13
40 REFERENCES
[1] Southern Research Institute Environmental Technology Verification Report Swine Waste Electric and Heat Production ndash Martin Machinery Internal Combustion Engine SRIUSEPA-GHG-QAP-27 wwwsri-rtpcom Greenhouse Gas Technology Center Southern Research Institute Research Triangle Park NC September 2004
[2] Southern Research Institute Test and Quality Assurance Plan - Swine Waste Electric Power and Heat Production Systems Capstone MicroTurbine and Martin Machinery Internal Combustion Engine SRIUSEPA-GHG-QAP-22 wwwsri-rtpcom Greenhouse Gas Technology Center Southern Research Institute Research Triangle Park NC November 2002
[3] American Society of Mechanical Engineers Performance Test Code for Gas Turbines ASME PTC-22 New York NY 1997
[4] American National Standards Institute American Society of Heating Refrigeration and Airshy conditioning Engineers Method of Testing Thermal Energy Meters for Liquid Streams in HVAC
Systems ANSIASHRAE 125-1992 Atlanta GA 1995
[5] CRC Press Handbook of Chemistry and Physics ndash 60th Edition CRC Press Inc Boca Raton Florida 1980
[6] American Society for Testing and Materials Standard Test Method for Analysis of Natural Gas by Gas Chromatography ASTM D1945-98 West Conshohocken PA 2001
[7] American Society for Testing and Materials Standard Practice for Calculating Heat Value Compressibility factor and Relative Density of Gaseous Fuels ASTM D3588-98 West Conshohocken PA 2001
[8] American Society for Testing and Materials Standard Practice for Determination of Sulfur Compounds in Natural Gas by Gas Chromatography and Chemiluminescense ASTM D5504-01 West Conshohocken PA 2001
[9] American National Standards Institute ANSI Institute of Electrical and Electronics Engineers IEEE Master Test Guide for Electrical Measurements in Power Circuits ANSIIEEE Std 120shy1989 New York NY October 1989
[10] American National Standards Institute ANSI Institute of Electrical and Electronics Engineers IEEE Recommended Practices and Requirements for Harmonic Control in Electrical Power Systems IEEE Std 519-1992 New York NY April 1993
[11] American National Standards Institute ANSI Institute of Electrical and Electronics Engineers National Standards for Electric Power Systems and Equipment - Voltage Ratings (Hertz) ANSI C841-1995 American National Standards Institute National Electrical Manufacturers Association Rosslyn VA 1996
[12] US Environmental Protection Agency Code of Federal Regulations Title 40 Part 60 New Source Performance Standards Appendix A US EPA Washington DC 1999
[13] Southern Research Institute Environmental Technology Verification Report Combined Heat and Power at a Commercial Supermarket ndash Capstone 60 kW Microturbine CHP System SRIUSEPA-GHG-QAP-27 wwwsri-rtpcom Greenhouse Gas Technology Center Southern Research Institute Research Triangle Park NC September 2003
[14] Southern Research Institute Environmental Technology Verification Report Residential Electric Power Generation Using the Plug Power SU1 Fuel Cell System SRIUSEPA-GHG-QAP-25 wwwsri-rtpcom Greenhouse Gas Technology Center Southern Research Institute Research Triangle Park NC September 2003
[15] Shigehara RT Measurement Uncertainty of Selected EPA Test Methods Emission Monitoring Inc Presented at Stationary Source Sampling and Analysis for Air Pollutants XXV Conference March 2001

3-4
Table 3-2 Summary of Data Quality Indicator Goals and Results (continued)
Measurement Variable Instrument Type and Manufacturer
Instrument Range
Measurement Range
Observed
Accuracy Completeness
Goal Actual How Verified or Determined Goal Actual
Fuel Input
Gas Flow Rate Dresser-Roots Model 2M175 SSM Series B3 rotary displacement
0 to 30 scfm 5 to 10 scfm 10 of reading plusmn 03 of reading
Factory calibration with volume prover
Controlled tests three valid runs per load meeting PTC 22 criteria Extended test 90 of one- minute readings for 7 days
Controlled tests three valid runs at each load
Extended test 35 hours of one-minute readings
Gas Pressure Omega Model PX205shy030AI transducer 0 to 30 psia 12 to 14 psia plusmn 075 full
scale plusmn 025 full scale Instrument calibration to NIST traceable standards
Gas Temperature
Omega TX-93 Type K thermocouple 0 to 200 oF 75 to 97 oF plusmn 010 reading plusmn 010 reading
LHV Gas Chromatograph HP 589011
0 to 100 CH4
67 to 69 CH4 plusmn 30 accuracy plusmn 02 repeatability
plusmn 05 accuracy plusmn 005 repeatability
analysis of NIST-traceable CH4 standard and duplicate analysis on 3 samples
Controlled tests two valid samples per load
Controlled tests two valid samples per load627 to 633
Btuft3 01 repeatability
plusmn 006 repeatability
Conducted duplicate analyses on 3 samples
Exhaust Stack Emission
NOX Levels Chemiluminescent CAI 400-CLD
0 to 50 ppmvd 0 to 3 ppmvd plusmn 2 full scale le 2 full scale
Calculated following EPA Reference Method calibrations (Before and after each test run)
Controlled tests three valid runs per load
Controlled tests three valid runs per load
CO Levels NDIR TEI Model 48 0 to 300 ppmvd
50 to 160 ppmvd plusmn 2 full scale le 2 full scale
CH4 levels HP 5890 0 to 300 ppmv 30 to 130 ppmv plusmn 5 full scale le 5 reading
THC levels HP 5890 0 to 300 ppmv 40 to 160 ppmv plusmn 5 full scale le 5 full scale
SO2 Levels Bovar 721-AT 0 to 300 ppmvd
145 to 185 ppmvd plusmn 2 full scale le 2 full scale
O2 CO2 Levels CAI 200 0 to 25 10 to 20 O2
20 to 25 CO2 plusmn 2 full scale le 2 full scale
TRS Levels Ametek 921 0 to 25 ppmvd 0 to 5 ppmvd plusmn 2 full scale le 2 full scale
NH3 Levels Ion specific electrode 0 to 5 ugml 0 to 42 ugml plusmn 5 full scale le 5 full scale
TPM concentrations gravimetric Not specified 001 to 004 g plusmn 1 mg plusmn 05 mg
Stack gas velocity
Pitot and thermocouple Not specified 3552 to 3753
fpm plusmn 5 reading le 5 reading
3-4
321 Power Output
Instrumentation used to measure power was introduced in Section 10 and included a Power Measurements Model 7500 ION The data quality objective for power output was plusmn 15 percent of reading which includes compounded error of the instrument and the current transformers (CTs) The test plan specified factory calibration of the ION meter with a NIST-traceable standard to determine if the power output DQO was met The Test plan also required the GHG Center to perform several reasonableness checks in the field to ensure that the meter was installed and operating properly The following summarizes the results
The meter was factory calibrated by Power Measurements in April 2003 Calibrations were conducted in accordance with Power Measurementsrsquo standard operating procedures (in compliance with ISO 90021994) and are traceable to NIST standards The meters were certified by Power Measurements to meet or exceed the accuracy values summarized in Table 3-2 for power output voltage current and frequency NIST-traceable calibration records are archived by the GHG Center Pretest factory calibrations on the meters indicated that accuracy was within plusmn 005 percent of reading and this value combined with the 10-percent error inherent to the current transformers resulted in an overall error of plusmn 101 percent Using the manufacturer-certified calibration results and the average power output measured during the full-load testing the absolute error during all testing is plusmn 020 kW
Additional QC checks were performed on the 7500 ION to verify the operation after installation of the meters at the site and prior to the start of the verification test The results of these QC checks (summarized in Table 3-3) are not used to reconcile the DQI goals but to document proper operation in the field Current and voltage readings were checked for reasonableness using a hand-held Fluke multimeter These checks confirmed that the voltage and current readings between the 7500 ION and the Fluke were within the range specified in the test plan as shown in Table 3-3
These results led to the conclusion that the 7500 ION was installed and operating properly during the verification test The plusmn 10-percent error in power measurements as certified by the manufacturer was used to reconcile the power output DQO (discussed above) and the electrical efficiency DQO (discussed in Section 322)
3-5
Table 3-3 Results of Additional QAQC Checks
Measurement Variable QAQC Check When
PerformedFrequency Expected or Allowable
Result Results Achieved
Power Output
Sensor diagnostics in field Beginning and end of test Voltage and current checks
within plusmn 1 reading plusmn 01 voltage plusmn 09 current
Reasonableness checks Throughout test Readings should be around 22 kW net power output at full load
Readings were 20 to 24 kW at full load
Fuel Heating Value
Calibration with gas standards by laboratory
Prior to analysis of each lot of samples submitted
plusmn 10 for each gas constituent Results satisfactory see
Section 3224 Independent performance checks with blind audit sample
Twice during previous year
plusmn 30 for each major gas constituent (methane CO2)
Heat Recovery Rate
Meter zero check Prior to testing Reported water flow rate lt 01 gpm ndash006 gpm recorded
Independent performance check of temperature readings
Beginning of test period Difference in temperature readings should be lt 15 degF
Temperature readings within 08 degF of reference
322 Electrical Efficiency
The DQO for electrical efficiency was to achieve an uncertainty of plusmn 152 percent at full electrical load or less Recall from Equation 1 (Section 141) that the electrical efficiency determination consists of three direct measurements power output fuel flow rate and fuel LHV The accuracy goals specified to meet the electrical efficiency DQO consisted of plusmn 15 percent for power output plusmn 10 percent for fuel flow rate and plusmn 02 percent for LHV The accuracy goals for each measurement were met The following summarizes actual errors achieved and the methods used to compute them
Power Output As discussed in Section 321 factory calibrations of the 7500 ION with a NISTshytraceable standard and the inherent error in the current and potential transformers resulted in plusmn 10-percent error in power measurements Reasonableness checks in the field verified that the meter was functioning properly The average power output at full load was approximately 20 kW with a measurement error of plusmn 020 kW
Heat Input Heat input is the product of measured fuel flow rate and LHV The DQI goal for fuel flow rate was reconciled through calibration of the gas meter and the gas temperature and pressure sensors used to correct measured gas volumes to standard conditions All three components were calibrated with NIST-traceable standards As shown in Table 3-2 the individual instruments errors were 03 025 and 01 percent for flow pressure and temperature respectively The overall error in biogas flow rate on a wet basis then is 040 percent of reading
Since biogas flow rate was metered on a wet and low pressure basis but combusted by the microturbine on a dry high pressure basis measured flow rates were corrected for moisture content (Section 142) Since the actual moisture content of the as-fired biogas was not directly measured the assumption that the gas was completely dry introduced additional error into the heat input determination The center
3-6
conducted an analysis of this assumption and knowing the temperature and pressure of the gas as fired determined that the worst case error introduced by the assumption that the gas is totally dry is 07 percent Combining that uncertainty with the heat input wet basis error of 040 percent the overall error on determination of biogas flow rate on a dry basis is then 081 percent of reading
The average flow rate at full load was 881 scfm with an associated measurement error of plusmn 007 scfm Complete documentation of data quality results for fuel flow rate is provided in Section 325
Uncertainty in the biogas LHV results was within the 02 percent DQI goal (Section 326) The average LHV during testing was 630 Btuft3 and the measurement error corresponding to this heating value is plusmn 13 Btuft3 The heat input compounded error then is
Error in Heat Input = ( flowmetererror )2 + (LHVerror)2 (Equation 5)
= (00081)2 + (0002)2 = 00083
The measurement error amounts to approximately plusmn 27 x 103Btuhr or 083 percent relative error at the average measured heat input of 332 x 103Btuhr
The errors in the divided values compound similarly for the electrical efficiency determination The electrical power measurement error is plusmn 10 percent relative (Table 3-2) and the heat input error is plusmn 083 percent relative Therefore compounded relative error for the electrical efficiency determination is
Error in Elec Power Efficiency = (powermetererror)2 + (heatinputerror)2 (Equation 6)
= (0010)2 + (00083)2 = 00130
Electrical efficiency for the controlled test periods at full load was 204 plusmn 027 percent or a relative compounded error of 13 percent
323 PTC-22 Requirements for Electrical Efficiency Determination
PTC-22 guidelines state that efficiency determinations were to be performed within 60 minute test periods in which maximum variability in key operational parameters did not exceed specified levels Table 3-4 summarizes the maximum permissible variations observed in power output ambient temperature ambient pressure biogas pressure at the meter and biogas temperature at the meter for each test run The table shows that the requirements for all parameters were met for all test runs and the efficiency determinations were representative of stable operating conditions
3-7
Table 3-4 Variability Observed in Operating Conditions Maximum Observed Variationa in Measured Parameters
Power Output ()
Ambient Temp (oF)
Ambient Pressure ()
Biogas pressure
(psia)
Power Factor ()
Maximum Allowable Variation plusmn 2 plusmn 4 plusmn 05 plusmn 1 plusmn 2
Run 1 06 11 003 02 02 Run 2 17 07 003 01 01 Run 3 18 06 002 01 01 Run 4 03 22 001 02 01 Run 5 03 09 001 02 01 Run 6 04 25 002 02 02 Run 7 03 03 001 03 01 Run 8 04 07 001 01 01 Run 9 02 08 001 02 01
Run 10 04 05 002 01 01 Run 11 04 04 003 02 01 Run 12 03 04 002 03 01
a Maximum (Average of Test Run ndash Observed Value) Average of Test Run 100
324 Ambient Measurements
Ambient temperature relative humidity and barometric pressure at the site were monitored throughout the verification period and the controlled tests The instrumentation used is identified in Table 3-2 along with instrument ranges data quality goals and data quality achieved All three sensors were factoryshycalibrated using reference materials traceable to NIST standards The pressure sensor was calibrated prior to the verification testing confirming the plusmn 01 percent accuracy The temperature and relative humidity sensors were also calibrated within a year prior to testing which verified that the plusmn 02 degF accuracy goal for temperature and plusmn 2 percent accuracy goal for relative humidity were met
325 Fuel Flow Rate
The Dresser-Roots Model 2M175 rotary displacement gas meter was factory-calibrated prior to installation in 1999 Calibration records were obtained and reviewed to ensure that the plusmn 10-percent instrument accuracy goal was satisfied The original calibration for the Roots meter indicating an accuracy of plusmn 032 percent is a permanent calibration This error combines with the errors in the gas temperature pressure and moisture determinations for an overall biogas flow rate measurement error of plusmn 081 percent
326 Fuel Lower Heating Value
Biogas sample collection date time run number and canister ID were logged along with laboratory chain of custody forms and were shipped along with the samples Copies of the chain of custody forms and results of the analyses are stored in the GHG Center project files Collected samples were shipped to Empact Analytical Laboratories of Brighton CO for compositional analysis and determination of LHV
3-8
per ASTM test Methods D1945 [6] and D3588 [7] respectively The DQI goals were to measure methane concentrations within plusmn 30 percent of a NIST-traceable blind audit sample and to achieve less than plusmn 02 percent difference in LHV duplicate analyses results Blind audits were submitted to Empact on two similar verifications within the past year to evaluate analytical accuracy on the methane analyses [13 14] Both audits indicated analytical accuracy within 05 percent and repeatability of within plusmn 02 percent Since the same sampling and analytical procedures were used here by the same analyst the audit was not repeated a third time
Duplicate analyses in addition to the blind audit samples were conducted on three of the samples collected during the controlled test periods Duplicate analysis is defined as the analysis performed by the same operating procedure and using the same instrument for a given sample volume Results of the duplicate analyses showed an average analytical repeatability of 006 percent for methane and 006 percent for LHV The results demonstrate that the plusmn 02 percent LHV accuracy goal was achieved As such both DQIs were met with the methane accuracy at plusmn 05 percent and the LHV repeatability at plusmn 006 percent
327 Heat Recovery Rate and Efficiency
Several measurements were conducted to determine CHP system heat-recovery rate and thermal efficiency These measurements include water flow rate water supply and return temperatures and CHP system heat input The individual errors in each of the measurements is then propagated to determine the overall error in heat-recovery rate and efficiency The Controlotron ultrasonic heat meter was used to continuously monitor water flow rate This meter has a NIST-traceable factory-calibrated accuracy of plusmn 10 percent of reading (this flow through calibration was conducted on October 9 2002) This certification serves as the primary DQI A zero check was also performed on the flow meter The meter reading was -006 gpm with the CHP system shut down and the circulation pump off
Table 3-2 showed that the DQI for supply and return temperatures (delta T) was achieved Each temperature sensor was calibrated against a reference thermocouple with NIST-traceable accuracy The error in the two temperature sensors resulted in an overall delta T uncertainty of 08 oC This absolute error equates to a relative error of 22 percent at the average fluid temperatures measured during the fullshyload testing (about 361 oC) The overall error in heat recovery rate is then the combined error in flow rate and temperature differential This error compounds multiplicatively as follows
Overall Heat Meter Error = (Flow rate error)2 + (compositional error) 2 (Equation 7)
( ) 0240)0220(0100 22 =+=
The heat recovery rate determination therefore has a relative compounded error of plusmn 24 percent The absolute error in the average heat recovery rate at full load (111 x 103Btuhr) then is plusmn 27 x 103Btuhr
This error in heat-recovery rate and the heat input error (083 percent) compound similarly to determine the overall uncertainty in the thermal efficiency determination as follows
Error in Heat Recovery Efficiency = (0024)2 + (00083)2 = 0025 (Equation 8)
Average heat recovery rate (thermal) efficiency at full load then is 333 plusmn 083 percent or a relative compounded error of 25 percent This compounded relative error exceeds the data quality objective
3-9
slightly but the absolute error is within the goal for this verification parameter (measured values were lower than anticipated)
328 Total Efficiency
Total efficiency is the sum of the electrical power and heat-recovery efficiencies Total efficiency is defined as 204 plusmn 027 percent (plusmn 130-percent relative error) plus 333 plusmn 063 percent (plusmn 19-percent relative error) This is based on the determined errors in electrical and thermal efficiency at full load The absolute errors compound as follows
errcabs = err12 + err2
2 (Equation 9)
870830270 22 =+=
Relative error is
errcrel =errcabs (Equation 10)
Value1 +Value2
087 = = 0016
204 + 333 where
errcabs = compounded error absolute err1 = error in first added value absolute value err2 = error in second added value absolute value errcrel = compounded error relative value1 = first added value value2 = second added value
The total CHP efficiency at full load is then 537 plusmn 087 percent or 16 percent relative error Again this compounded relative error exceeds the data quality objective slightly
329 Exhaust Stack Emission Measurements
EPA reference method requirements form the basis for the qualitative DQIs specified in the Test plan and listed in Tables 3-1 and 3-2 Each method specifies sampling and calibration procedures and data quality checks These specifications when properly implemented ensure the collection of high quality and representative emissions data The specific sampling and calibration procedures vary by method and class of pollutants and are summarized in Table 3-5 The table lists the method quality requirements the acceptable criteria and the results for the test conducted here It is generally accepted that conformance to the reference method quality requirements demonstrates that the qualitative DQIs have been met
All of the emissions testing and reference method quality control procedures were conducted by Cubix Corporation either in the field during testing or in their calibration and analytical laboratories in Austin Texas All of the field sampling procedures and calibrations were closely monitored by GHG Center personnel In addition documentation of all sampling and analytical procedures data collection and
3-10
calibrations have been procured reviewed and filed by the GHG Center Table 3-5 is followed by a brief explanation of the QAQC procedures implemented for each class of pollutant quantified during this verification
Table 3-5 Summary of Emissions Testing Calibrations and QC Checks
Measurement Variable
Calibration or QC Check
When Performed and Frequency
Expected or Allowable Result
Result of Calibration(s) or Check(s)
NOX CO CO2 SO2 TRS and O2 concentrations
Analyzer calibration error test
Daily before testing plusmn 2 of analyzer span All within allowable level for each day
System bias checks Before each test run plusmn 5 of analyzer span All within allowable level for each test run Calibration drift test After each test run plusmn 3 of analyzer span
THC concentrations System calibration error test
Daily before testing plusmn 5 of analyzer span All within allowable level for each day
System calibration drift test
After each test run plusmn 3 of analyzer span All within allowable level for each test run
CH4 concentrations Triplicate injections Each test run plusmn 5 difference All within allowable level for each test run
Calibration of GC with gas standards by certified laboratory
Immediately prior to sample analyses andor at least once per day
plusmn 5 for each compound
All within allowable level for each day
TPM emissions Pre and post test sampling system leak checks
Before and after each test run
Sampling system leak rate lt 002 cfm
All checks lt 002 cfm
Minimum sample volume After each test run Corrected Vol gt 600 dscf
Volumes ranged from 694 to 796 dscf
Percent isokinetic sampling rate (I)
After each test run 90 lt I lt 110 91 lt I lt 102
Analytical balance calibration
Once before analysis plusmn 00001 g Within allowable level
Filter and reagent blanks Once during testing after first test run
lt 10 of particulate catch for first test run
Blank weights lt 10 of each sample catch
Dry gas meter calibration Once before and once after testing
plusmn 5 Pre and post test calibrations within 1
Thermocouple calibration Once after testing plusmn 15 of average stack temperature
Within 03 of reference TC
NH3 concentrations Calibration of instrument with NH3 standards
Immediately prior to sample analyses at least once a day
plusmn 5 Pre test calibrations within 1 of working standards
Dry gas meter calibration Once before and once after testing
plusmn 5 Pre and post test calibrations within 1
Exhaust gas volumetric flow rate
Pitot tube dimensional calibration inspection
Once before and once after testing
See 40CFR60 Method 2 Section 100
Calibration criteria met
Thermocouple calibration Once after testing plusmn 15 of average stack temperature
Within 03 of reference TC
3291 NOX CO CO2 SO2 TRS and O2 Concentrations
Test personnel performed sampling system calibration error tests prior to each test run All calibrations employed a suite of three EPA Protocol No 1 calibration gases (four for CO) that spanned the instrument ranges Appropriate calibration ranges were selected for each pollutant based on exhaust gas screening (ranges are summarized in Table 3-2) The daily analyzer calibration error goal for each instrument was plusmn 20 percent of span It was met for each analyzer during each day of testing
3-11
Sampling system bias was evaluated for each parameter at the beginning of each test run using the zero and mid-level calibration gases System response to the zero and mid-level calibration gases also provided a measure of drift and bias at the end of each test run The maximum allowable sampling system bias and drift values were plusmn 5 and plusmn 3 percent of span respectively These specifications were met for each parameter and for each test run Testers also performed a NOX converter efficiency test as described in Section 35 of the test plan The converter efficiency was 9998 percent which meets the 98shypercent goal specified in the method
3292 THC Concentrations
Following Method 25A criteria the analyzer calibration error test is not performed on the THC analyzer Instead a 4-point system bias test is conducted at the beginning of each test day System response must be within plusmn 5 percent of the calibration standard at each point System response to the zero and mid-level calibration gases also provided a measure of drift and bias at the end of each test run The maximum allowable sampling system bias and drift values were plusmn 5 and plusmn 3 percent of span respectively These specifications were met for test run
3293 CH4 Concentrations
The test plan specified EPA Method 18 for determining stack gas methane concentrations This testing was conducted on-site eliminating the need to collect bag samples for transport to a laboratory Test operators injected calibration gas standards into the gas chromatograph (GC) to establish a concentration standard curve prior to sample analysis The operator repeated the injections until the average of all desired compounds from three separate injections agreed to within 50 percent of the certified value The acceptance criterion was met for all runs
The analysts injected the mid-range standard to quantify instrument drift at the completion of each test The analyst would repeat the calibration process used for the average of the two calibration curves to determine concentrations if he observed a variance larger than 50 percent
3294 Total Particulate Matter and Exhaust Gas Volumetric Flow Rate
Reference Methods 1 through 5 used for determination of exhaust gas volumetric flow rate and total particulate emissions include numerous quality control and quality assurance procedures that are required to ensure collection of representative data The most important of these procedures are listed in Table 3-5 along with the results for these tests These methods do not specify overall uncertainties but it is generally accepted that conformance to the control and quality assurance procedures will result in an overall method uncertainty ranging from 5 to 30 percent depending on the mass of the particulate catch the quality of the sampling system and the length of the sampling probe [15] For these tests TPM catches were in the range of 10 to 20 mg the sampling system surfaces contacting the exhaust gases were constructed entirely of glass or Teflon and the probe was less than 3-feet in length In addition testers documented that all of the key method criteria were met It is therefore expected that the overall error for tests conducted here is plusmn 10 percent of reading This exceeds the original goal of plusmn 5 percent but this deviation from the plan is not believed to impact results significantly because TPM emissions were very low
3-12
3295 NH3 Concentrations
Ammonia samples were collected in the back-half of the total particulate sampling train and therefore all of the sampling system criteria are the same as for TPM measurements Sampling error for the NH3 samples should be the same as sampling error for the TPM samples In the laboratory analytical instrumentation was calibrated using nine working standards A calibration curve for the instrument was developed using this nine-point calibration The R2 for the calibration curve was 09997 indicating excellent analytical linearity Based on this the same uncertainty used for the TPM determination (plusmn10 percent) is assigned Again this level of uncertainty exceeds the original goal of plusmn 5 percent but as with the TPM emissions this deviation from the plan is not believed to impact results significantly because NH3 emissions were also very low
3-13
40 REFERENCES
[1] Southern Research Institute Environmental Technology Verification Report Swine Waste Electric and Heat Production ndash Martin Machinery Internal Combustion Engine SRIUSEPA-GHG-QAP-27 wwwsri-rtpcom Greenhouse Gas Technology Center Southern Research Institute Research Triangle Park NC September 2004
[2] Southern Research Institute Test and Quality Assurance Plan - Swine Waste Electric Power and Heat Production Systems Capstone MicroTurbine and Martin Machinery Internal Combustion Engine SRIUSEPA-GHG-QAP-22 wwwsri-rtpcom Greenhouse Gas Technology Center Southern Research Institute Research Triangle Park NC November 2002
[3] American Society of Mechanical Engineers Performance Test Code for Gas Turbines ASME PTC-22 New York NY 1997
[4] American National Standards Institute American Society of Heating Refrigeration and Airshy conditioning Engineers Method of Testing Thermal Energy Meters for Liquid Streams in HVAC
Systems ANSIASHRAE 125-1992 Atlanta GA 1995
[5] CRC Press Handbook of Chemistry and Physics ndash 60th Edition CRC Press Inc Boca Raton Florida 1980
[6] American Society for Testing and Materials Standard Test Method for Analysis of Natural Gas by Gas Chromatography ASTM D1945-98 West Conshohocken PA 2001
[7] American Society for Testing and Materials Standard Practice for Calculating Heat Value Compressibility factor and Relative Density of Gaseous Fuels ASTM D3588-98 West Conshohocken PA 2001
[8] American Society for Testing and Materials Standard Practice for Determination of Sulfur Compounds in Natural Gas by Gas Chromatography and Chemiluminescense ASTM D5504-01 West Conshohocken PA 2001
[9] American National Standards Institute ANSI Institute of Electrical and Electronics Engineers IEEE Master Test Guide for Electrical Measurements in Power Circuits ANSIIEEE Std 120shy1989 New York NY October 1989
[10] American National Standards Institute ANSI Institute of Electrical and Electronics Engineers IEEE Recommended Practices and Requirements for Harmonic Control in Electrical Power Systems IEEE Std 519-1992 New York NY April 1993
[11] American National Standards Institute ANSI Institute of Electrical and Electronics Engineers National Standards for Electric Power Systems and Equipment - Voltage Ratings (Hertz) ANSI C841-1995 American National Standards Institute National Electrical Manufacturers Association Rosslyn VA 1996
[12] US Environmental Protection Agency Code of Federal Regulations Title 40 Part 60 New Source Performance Standards Appendix A US EPA Washington DC 1999
[13] Southern Research Institute Environmental Technology Verification Report Combined Heat and Power at a Commercial Supermarket ndash Capstone 60 kW Microturbine CHP System SRIUSEPA-GHG-QAP-27 wwwsri-rtpcom Greenhouse Gas Technology Center Southern Research Institute Research Triangle Park NC September 2003
[14] Southern Research Institute Environmental Technology Verification Report Residential Electric Power Generation Using the Plug Power SU1 Fuel Cell System SRIUSEPA-GHG-QAP-25 wwwsri-rtpcom Greenhouse Gas Technology Center Southern Research Institute Research Triangle Park NC September 2003
[15] Shigehara RT Measurement Uncertainty of Selected EPA Test Methods Emission Monitoring Inc Presented at Stationary Source Sampling and Analysis for Air Pollutants XXV Conference March 2001