Co. Name Co. Name Co. Name Co. Name - Nirmal Bang Results on 140215.pdf · Co. Name Co. Name Co....
57
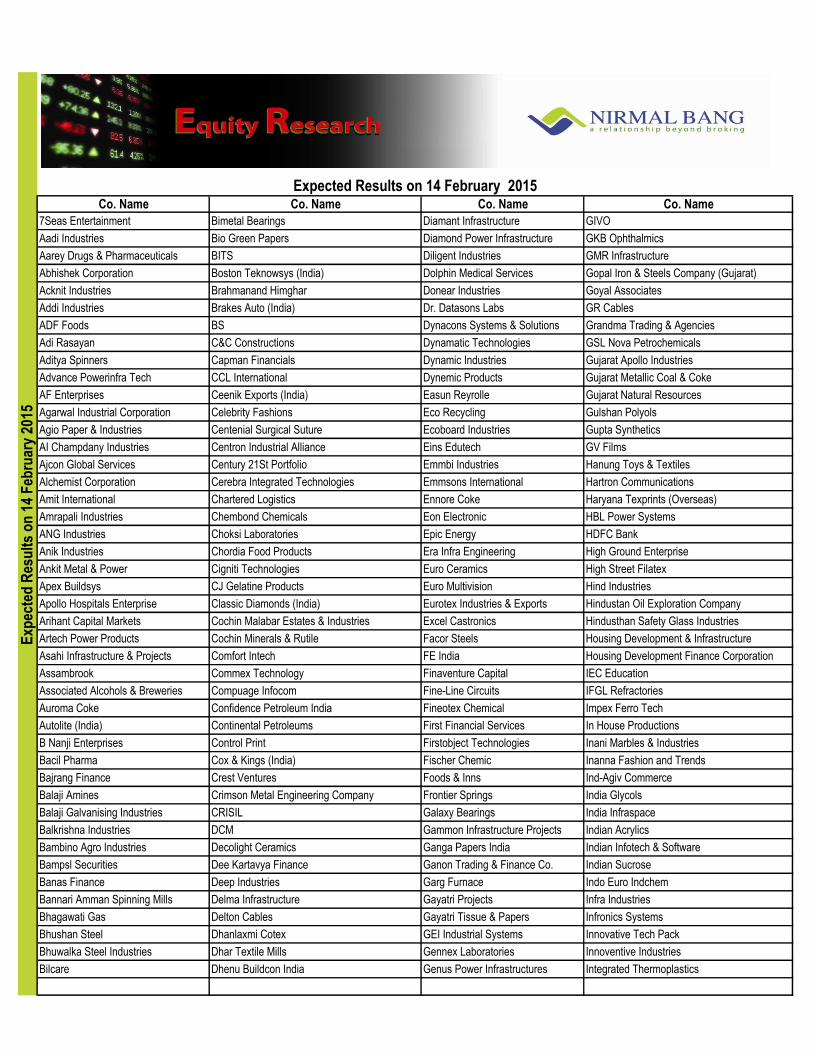
Co. Name Co. Name Co. Name Co. Name 7Seas Entertainment Bimetal Bearings Diamant Infrastructure GIVO Aadi Industries Bio Green Papers Diamond Power Infrastructure GKB Ophthalmics Aarey Drugs & Pharmaceuticals BITS Diligent Industries GMR Infrastructure Abhishek Corporation Boston Teknowsys (India) Dolphin Medical Services Gopal Iron & Steels Company (Gujarat) Acknit Industries Brahmanand Himghar Donear Industries Goyal Associates Addi Industries Brakes Auto (India) Dr. Datasons Labs GR Cables ADF Foods BS Dynacons Systems & Solutions Grandma Trading & Agencies Adi Rasayan C&C Constructions Dynamatic Technologies GSL Nova Petrochemicals Aditya Spinners Capman Financials Dynamic Industries Gujarat Apollo Industries Advance Powerinfra Tech CCL International Dynemic Products Gujarat Metallic Coal & Coke AF Enterprises Ceenik Exports (India) Easun Reyrolle Gujarat Natural Resources Agarwal Industrial Corporation Celebrity Fashions Eco Recycling Gulshan Polyols Agio Paper & Industries Centenial Surgical Suture Ecoboard Industries Gupta Synthetics AI Champdany Industries Centron Industrial Alliance Eins Edutech GV Films Ajcon Global Services Century 21St Portfolio Emmbi Industries Hanung Toys & Textiles Alchemist Corporation Cerebra Integrated Technologies Emmsons International Hartron Communications Amit International Chartered Logistics Ennore Coke Haryana Texprints (Overseas) Amrapali Industries Chembond Chemicals Eon Electronic HBL Power Systems ANG Industries Choksi Laboratories Epic Energy HDFC Bank Anik Industries Chordia Food Products Era Infra Engineering High Ground Enterprise Ankit Metal & Power Cigniti Technologies Euro Ceramics High Street Filatex Apex Buildsys CJ Gelatine Products Euro Multivision Hind Industries Apollo Hospitals Enterprise Classic Diamonds (India) Eurotex Industries & Exports Hindustan Oil Exploration Company Arihant Capital Markets Cochin Malabar Estates & Industries Excel Castronics Hindusthan Safety Glass Industries Artech Power Products Cochin Minerals & Rutile Facor Steels Housing Development & Infrastructure Asahi Infrastructure & Projects Comfort Intech FE India Housing Development Finance Corporation Assambrook Commex Technology Finaventure Capital IEC Education Associated Alcohols & Breweries Compuage Infocom Fine-Line Circuits IFGL Refractories Auroma Coke Confidence Petroleum India Fineotex Chemical Impex Ferro Tech Autolite (India) Continental Petroleums First Financial Services In House Productions B Nanji Enterprises Control Print Firstobject Technologies Inani Marbles & Industries Bacil Pharma Cox & Kings (India) Fischer Chemic Inanna Fashion and Trends Bajrang Finance Crest Ventures Foods & Inns Ind-Agiv Commerce Balaji Amines Crimson Metal Engineering Company Frontier Springs India Glycols Balaji Galvanising Industries CRISIL Galaxy Bearings India Infraspace Balkrishna Industries DCM Gammon Infrastructure Projects Indian Acrylics Bambino Agro Industries Decolight Ceramics Ganga Papers India Indian Infotech & Software Bampsl Securities Dee Kartavya Finance Ganon Trading & Finance Co. Indian Sucrose Banas Finance Deep Industries Garg Furnace Indo Euro Indchem Bannari Amman Spinning Mills Delma Infrastructure Gayatri Projects Infra Industries Bhagawati Gas Delton Cables Gayatri Tissue & Papers Infronics Systems Bhushan Steel Dhanlaxmi Cotex GEI Industrial Systems Innovative Tech Pack Bhuwalka Steel Industries Dhar Textile Mills Gennex Laboratories Innoventive Industries Bilcare Dhenu Buildcon India Genus Power Infrastructures Integrated Thermoplastics Expected Results on 14 February 2015 Expected Results on 14 February 2015
-
Upload
truongthuan -
Category
Documents
-
view
238 -
download
5
Transcript of Co. Name Co. Name Co. Name Co. Name - Nirmal Bang Results on 140215.pdf · Co. Name Co. Name Co....
Co. Name Co. Name Co. Name Co. Name
7Seas Entertainment Bimetal Bearings Diamant Infrastructure GIVO
Aadi Industries Bio Green Papers Diamond Power Infrastructure GKB Ophthalmics
Aarey Drugs & Pharmaceuticals BITS Diligent Industries GMR Infrastructure
Abhishek Corporation Boston Teknowsys (India) Dolphin Medical Services Gopal Iron & Steels Company (Gujarat)
Acknit Industries Brahmanand Himghar Donear Industries Goyal Associates
Addi Industries Brakes Auto (India) Dr. Datasons Labs GR Cables
ADF Foods BS Dynacons Systems & Solutions Grandma Trading & Agencies
Adi Rasayan C&C Constructions Dynamatic Technologies GSL Nova Petrochemicals
Aditya Spinners Capman Financials Dynamic Industries Gujarat Apollo Industries
Advance Powerinfra Tech CCL International Dynemic Products Gujarat Metallic Coal & Coke
AF Enterprises Ceenik Exports (India) Easun Reyrolle Gujarat Natural Resources
Agarwal Industrial Corporation Celebrity Fashions Eco Recycling Gulshan Polyols
Agio Paper & Industries Centenial Surgical Suture Ecoboard Industries Gupta Synthetics
AI Champdany Industries Centron Industrial Alliance Eins Edutech GV Films
Ajcon Global Services Century 21St Portfolio Emmbi Industries Hanung Toys & Textiles
Alchemist Corporation Cerebra Integrated Technologies Emmsons International Hartron Communications
Amit International Chartered Logistics Ennore Coke Haryana Texprints (Overseas)
Amrapali Industries Chembond Chemicals Eon Electronic HBL Power Systems
ANG Industries Choksi Laboratories Epic Energy HDFC Bank
Anik Industries Chordia Food Products Era Infra Engineering High Ground Enterprise
Ankit Metal & Power Cigniti Technologies Euro Ceramics High Street Filatex
Apex Buildsys CJ Gelatine Products Euro Multivision Hind Industries
Apollo Hospitals Enterprise Classic Diamonds (India) Eurotex Industries & Exports Hindustan Oil Exploration Company
Arihant Capital Markets Cochin Malabar Estates & Industries Excel Castronics Hindusthan Safety Glass Industries
Artech Power Products Cochin Minerals & Rutile Facor Steels Housing Development & Infrastructure
Asahi Infrastructure & Projects Comfort Intech FE India Housing Development Finance Corporation
Assambrook Commex Technology Finaventure Capital IEC Education
Associated Alcohols & Breweries Compuage Infocom Fine-Line Circuits IFGL Refractories
Auroma Coke Confidence Petroleum India Fineotex Chemical Impex Ferro Tech
Autolite (India) Continental Petroleums First Financial Services In House Productions
B Nanji Enterprises Control Print Firstobject Technologies Inani Marbles & Industries
Bacil Pharma Cox & Kings (India) Fischer Chemic Inanna Fashion and Trends
Bajrang Finance Crest Ventures Foods & Inns Ind-Agiv Commerce
Balaji Amines Crimson Metal Engineering Company Frontier Springs India Glycols
Balaji Galvanising Industries CRISIL Galaxy Bearings India Infraspace
Balkrishna Industries DCM Gammon Infrastructure Projects Indian Acrylics
Bambino Agro Industries Decolight Ceramics Ganga Papers India Indian Infotech & Software
Bampsl Securities Dee Kartavya Finance Ganon Trading & Finance Co. Indian Sucrose
Banas Finance Deep Industries Garg Furnace Indo Euro Indchem
Bannari Amman Spinning Mills Delma Infrastructure Gayatri Projects Infra Industries
Bhagawati Gas Delton Cables Gayatri Tissue & Papers Infronics Systems
Bhushan Steel Dhanlaxmi Cotex GEI Industrial Systems Innovative Tech Pack
Bhuwalka Steel Industries Dhar Textile Mills Gennex Laboratories Innoventive Industries
Bilcare Dhenu Buildcon India Genus Power Infrastructures Integrated Thermoplastics
Exp
ecte
d R
esu
lts
on
14
Feb
ruar
y 20
15
Expected Results on 14 February 2015
Exp
ecte
d R
esu
lts
on
14
Feb
ruar
y 20
15
Expected Results on 14 February 2015Co. Name Co. Name Co. Name Co. Name
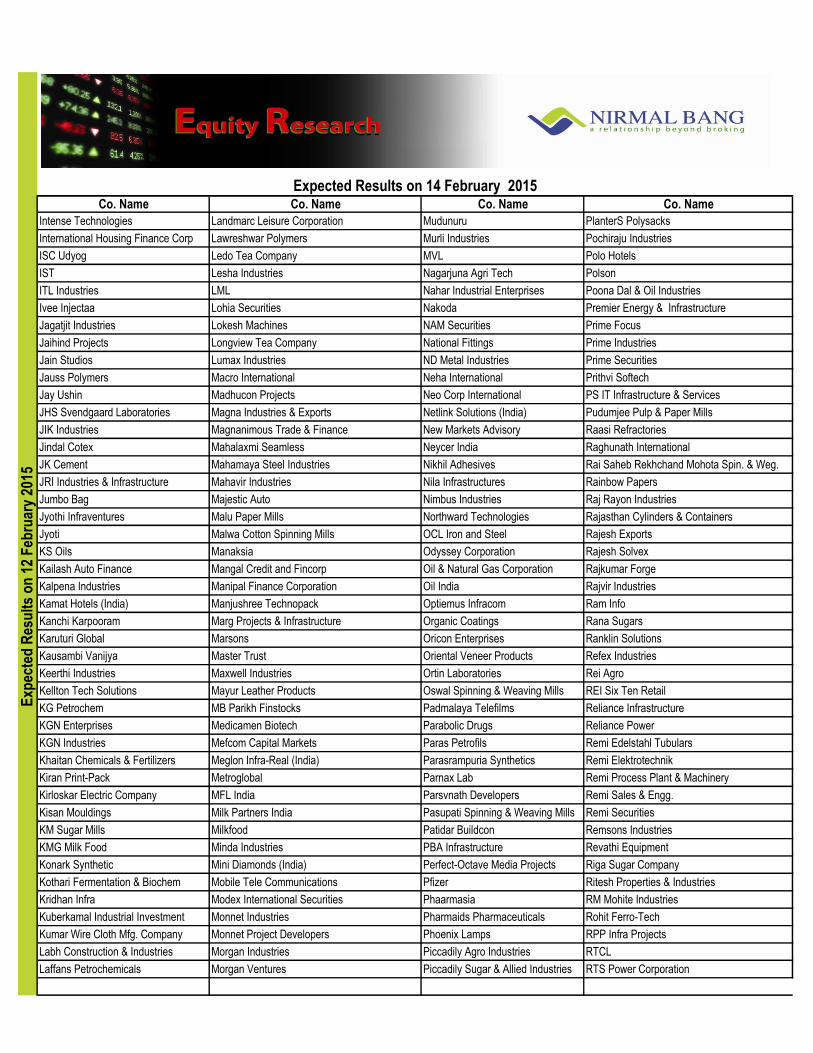
Intense Technologies Landmarc Leisure Corporation Mudunuru PlanterS Polysacks
International Housing Finance Corp Lawreshwar Polymers Murli Industries Pochiraju Industries
ISC Udyog Ledo Tea Company MVL Polo Hotels
IST Lesha Industries Nagarjuna Agri Tech Polson
ITL Industries LML Nahar Industrial Enterprises Poona Dal & Oil Industries
Ivee Injectaa Lohia Securities Nakoda Premier Energy & Infrastructure
Jagatjit Industries Lokesh Machines NAM Securities Prime Focus
Jaihind Projects Longview Tea Company National Fittings Prime Industries
Jain Studios Lumax Industries ND Metal Industries Prime Securities
Jauss Polymers Macro International Neha International Prithvi Softech
Jay Ushin Madhucon Projects Neo Corp International PS IT Infrastructure & Services
JHS Svendgaard Laboratories Magna Industries & Exports Netlink Solutions (India) Pudumjee Pulp & Paper Mills
JIK Industries Magnanimous Trade & Finance New Markets Advisory Raasi Refractories
Jindal Cotex Mahalaxmi Seamless Neycer India Raghunath International
JK Cement Mahamaya Steel Industries Nikhil Adhesives Rai Saheb Rekhchand Mohota Spin. & Weg.
JRI Industries & Infrastructure Mahavir Industries Nila Infrastructures Rainbow Papers
Jumbo Bag Majestic Auto Nimbus Industries Raj Rayon Industries
Jyothi Infraventures Malu Paper Mills Northward Technologies Rajasthan Cylinders & Containers
Jyoti Malwa Cotton Spinning Mills OCL Iron and Steel Rajesh Exports
KS Oils Manaksia Odyssey Corporation Rajesh Solvex
Kailash Auto Finance Mangal Credit and Fincorp Oil & Natural Gas Corporation Rajkumar Forge
Kalpena Industries Manipal Finance Corporation Oil India Rajvir Industries
Kamat Hotels (India) Manjushree Technopack Optiemus Infracom Ram Info
Kanchi Karpooram Marg Projects & Infrastructure Organic Coatings Rana Sugars
Karuturi Global Marsons Oricon Enterprises Ranklin Solutions
Kausambi Vanijya Master Trust Oriental Veneer Products Refex Industries
Keerthi Industries Maxwell Industries Ortin Laboratories Rei Agro
Kellton Tech Solutions Mayur Leather Products Oswal Spinning & Weaving Mills REI Six Ten Retail
KG Petrochem MB Parikh Finstocks Padmalaya Telefilms Reliance Infrastructure
KGN Enterprises Medicamen Biotech Parabolic Drugs Reliance Power
KGN Industries Mefcom Capital Markets Paras Petrofils Remi Edelstahl Tubulars
Khaitan Chemicals & Fertilizers Meglon Infra-Real (India) Parasrampuria Synthetics Remi Elektrotechnik
Kiran Print-Pack Metroglobal Parnax Lab Remi Process Plant & Machinery
Kirloskar Electric Company MFL India Parsvnath Developers Remi Sales & Engg.
Kisan Mouldings Milk Partners India Pasupati Spinning & Weaving Mills Remi Securities
KM Sugar Mills Milkfood Patidar Buildcon Remsons Industries
KMG Milk Food Minda Industries PBA Infrastructure Revathi Equipment
Konark Synthetic Mini Diamonds (India) Perfect-Octave Media Projects Riga Sugar Company
Kothari Fermentation & Biochem Mobile Tele Communications Pfizer Ritesh Properties & Industries
Kridhan Infra Modex International Securities Phaarmasia RM Mohite Industries
Kuberkamal Industrial Investment Monnet Industries Pharmaids Pharmaceuticals Rohit Ferro-Tech
Kumar Wire Cloth Mfg. Company Monnet Project Developers Phoenix Lamps RPP Infra Projects
Labh Construction & Industries Morgan Industries Piccadily Agro Industries RTCL
Laffans Petrochemicals Morgan Ventures Piccadily Sugar & Allied Industries RTS Power Corporation
Exp
ecte
d R
esu
lts
on
12
Feb
ruar
y 20
15
Exp
ecte
d R
esu
lts
on
14
Feb
ruar
y 20
15
Expected Results on 14 February 2015
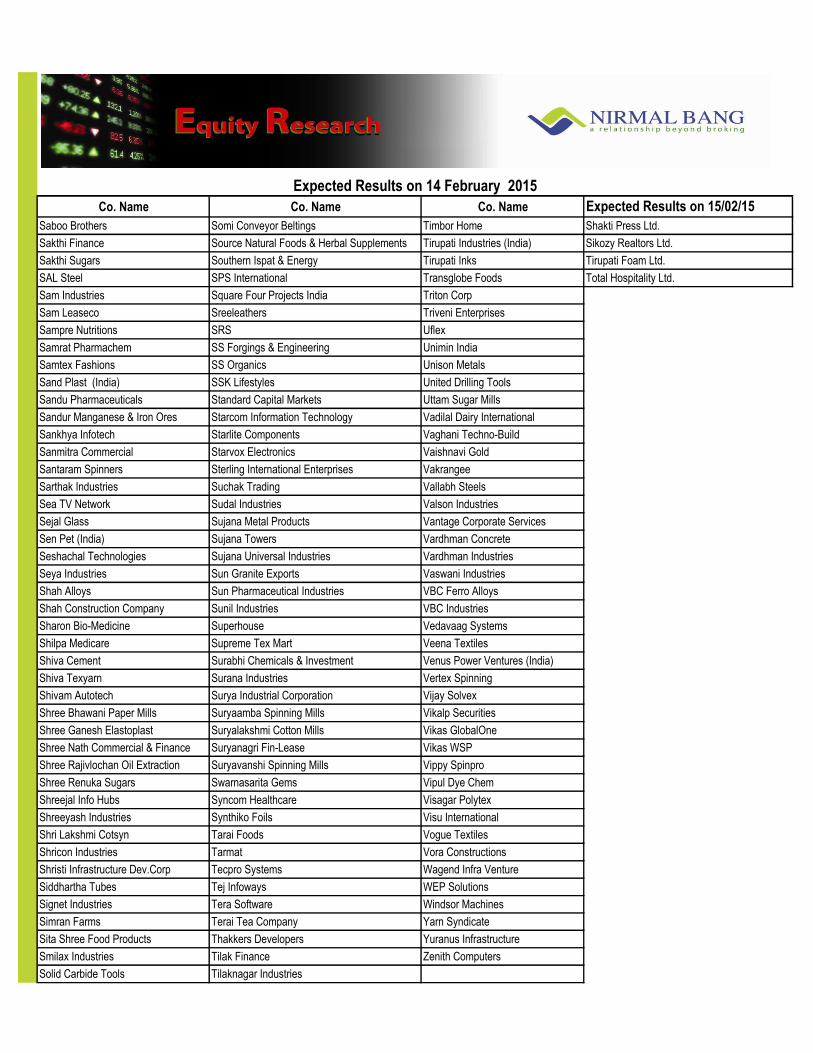
Co. Name Co. Name Co. Name Expected Results on 15/02/15
Saboo Brothers Somi Conveyor Beltings Timbor Home Shakti Press Ltd.
Sakthi Finance Source Natural Foods & Herbal Supplements Tirupati Industries (India) Sikozy Realtors Ltd.
Sakthi Sugars Southern Ispat & Energy Tirupati Inks Tirupati Foam Ltd.
SAL Steel SPS International Transglobe Foods Total Hospitality Ltd.
Sam Industries Square Four Projects India Triton Corp
Sam Leaseco Sreeleathers Triveni Enterprises
Sampre Nutritions SRS Uflex
Samrat Pharmachem SS Forgings & Engineering Unimin India
Samtex Fashions SS Organics Unison Metals
Sand Plast (India) SSK Lifestyles United Drilling Tools
Sandu Pharmaceuticals Standard Capital Markets Uttam Sugar Mills
Sandur Manganese & Iron Ores Starcom Information Technology Vadilal Dairy International
Sankhya Infotech Starlite Components Vaghani Techno-Build
Sanmitra Commercial Starvox Electronics Vaishnavi Gold
Santaram Spinners Sterling International Enterprises Vakrangee
Sarthak Industries Suchak Trading Vallabh Steels
Sea TV Network Sudal Industries Valson Industries
Sejal Glass Sujana Metal Products Vantage Corporate Services
Sen Pet (India) Sujana Towers Vardhman Concrete
Seshachal Technologies Sujana Universal Industries Vardhman Industries
Seya Industries Sun Granite Exports Vaswani Industries
Shah Alloys Sun Pharmaceutical Industries VBC Ferro Alloys
Shah Construction Company Sunil Industries VBC Industries
Sharon Bio-Medicine Superhouse Vedavaag Systems
Shilpa Medicare Supreme Tex Mart Veena Textiles
Shiva Cement Surabhi Chemicals & Investment Venus Power Ventures (India)
Shiva Texyarn Surana Industries Vertex Spinning
Shivam Autotech Surya Industrial Corporation Vijay Solvex
Shree Bhawani Paper Mills Suryaamba Spinning Mills Vikalp Securities
Shree Ganesh Elastoplast Suryalakshmi Cotton Mills Vikas GlobalOne
Shree Nath Commercial & Finance Suryanagri Fin-Lease Vikas WSP
Shree Rajivlochan Oil Extraction Suryavanshi Spinning Mills Vippy Spinpro
Shree Renuka Sugars Swarnasarita Gems Vipul Dye Chem
Shreejal Info Hubs Syncom Healthcare Visagar Polytex
Shreeyash Industries Synthiko Foils Visu International
Shri Lakshmi Cotsyn Tarai Foods Vogue Textiles
Shricon Industries Tarmat Vora Constructions
Shristi Infrastructure Dev.Corp Tecpro Systems Wagend Infra Venture
Siddhartha Tubes Tej Infoways WEP Solutions
Signet Industries Tera Software Windsor Machines
Simran Farms Terai Tea Company Yarn Syndicate
Sita Shree Food Products Thakkers Developers Yuranus Infrastructure
Smilax Industries Tilak Finance Zenith Computers
Solid Carbide Tools Tilaknagar Industries
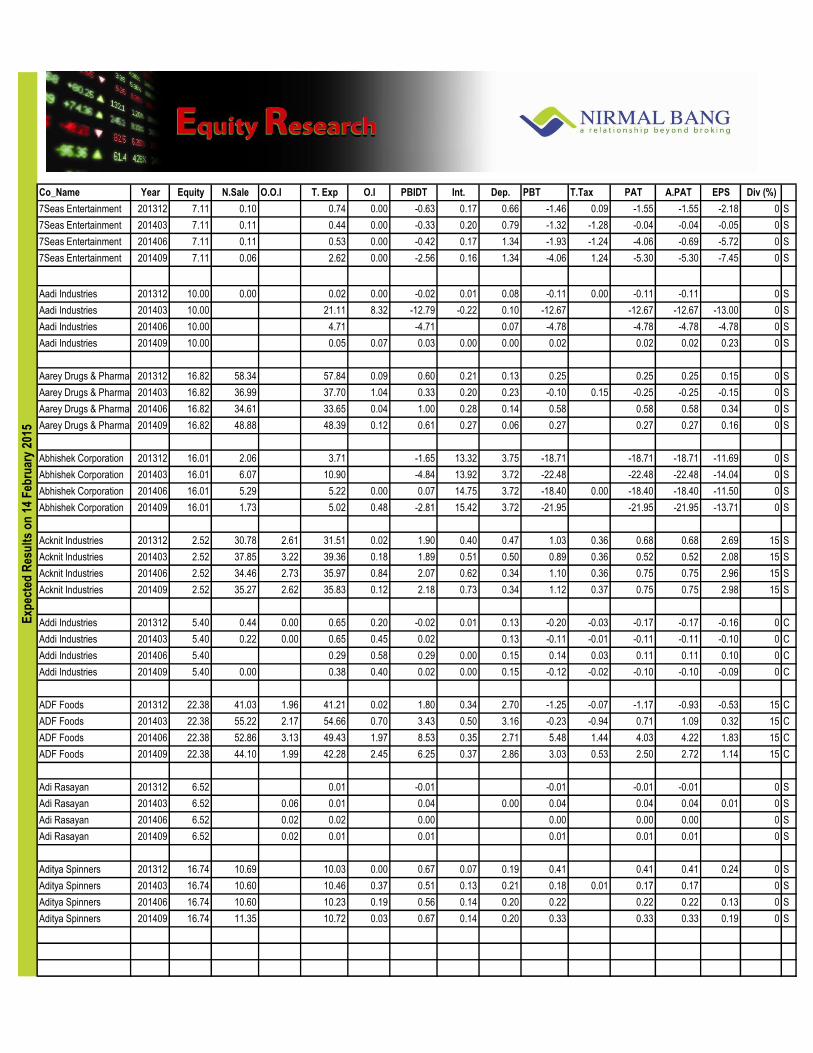
Co_Name Year Equity N.Sale O.O.I T. Exp O.I PBIDT Int. Dep. PBT T.Tax PAT A.PAT EPS Div (%)
7Seas Entertainment 201312 7.11 0.10 0.74 0.00 -0.63 0.17 0.66 -1.46 0.09 -1.55 -1.55 -2.18 0 S
7Seas Entertainment 201403 7.11 0.11 0.44 0.00 -0.33 0.20 0.79 -1.32 -1.28 -0.04 -0.04 -0.05 0 S
7Seas Entertainment 201406 7.11 0.11 0.53 0.00 -0.42 0.17 1.34 -1.93 -1.24 -4.06 -0.69 -5.72 0 S
7Seas Entertainment 201409 7.11 0.06 2.62 0.00 -2.56 0.16 1.34 -4.06 1.24 -5.30 -5.30 -7.45 0 S
Aadi Industries 201312 10.00 0.00 0.02 0.00 -0.02 0.01 0.08 -0.11 0.00 -0.11 -0.11 0 S
Aadi Industries 201403 10.00 21.11 8.32 -12.79 -0.22 0.10 -12.67 -12.67 -12.67 -13.00 0 S
Aadi Industries 201406 10.00 4.71 -4.71 0.07 -4.78 -4.78 -4.78 -4.78 0 S
Aadi Industries 201409 10.00 0.05 0.07 0.03 0.00 0.00 0.02 0.02 0.02 0.23 0 S
Aarey Drugs & Pharmaceuticals 201312 16.82 58.34 57.84 0.09 0.60 0.21 0.13 0.25 0.25 0.25 0.15 0 S
Aarey Drugs & Pharmaceuticals 201403 16.82 36.99 37.70 1.04 0.33 0.20 0.23 -0.10 0.15 -0.25 -0.25 -0.15 0 S
Aarey Drugs & Pharmaceuticals 201406 16.82 34.61 33.65 0.04 1.00 0.28 0.14 0.58 0.58 0.58 0.34 0 S
Aarey Drugs & Pharmaceuticals 201409 16.82 48.88 48.39 0.12 0.61 0.27 0.06 0.27 0.27 0.27 0.16 0 S
Abhishek Corporation 201312 16.01 2.06 3.71 -1.65 13.32 3.75 -18.71 -18.71 -18.71 -11.69 0 S
Abhishek Corporation 201403 16.01 6.07 10.90 -4.84 13.92 3.72 -22.48 -22.48 -22.48 -14.04 0 S
Abhishek Corporation 201406 16.01 5.29 5.22 0.00 0.07 14.75 3.72 -18.40 0.00 -18.40 -18.40 -11.50 0 S
Abhishek Corporation 201409 16.01 1.73 5.02 0.48 -2.81 15.42 3.72 -21.95 -21.95 -21.95 -13.71 0 S
Acknit Industries 201312 2.52 30.78 2.61 31.51 0.02 1.90 0.40 0.47 1.03 0.36 0.68 0.68 2.69 15 S
Acknit Industries 201403 2.52 37.85 3.22 39.36 0.18 1.89 0.51 0.50 0.89 0.36 0.52 0.52 2.08 15 S
Acknit Industries 201406 2.52 34.46 2.73 35.97 0.84 2.07 0.62 0.34 1.10 0.36 0.75 0.75 2.96 15 S
Acknit Industries 201409 2.52 35.27 2.62 35.83 0.12 2.18 0.73 0.34 1.12 0.37 0.75 0.75 2.98 15 S
Addi Industries 201312 5.40 0.44 0.00 0.65 0.20 -0.02 0.01 0.13 -0.20 -0.03 -0.17 -0.17 -0.16 0 C
Addi Industries 201403 5.40 0.22 0.00 0.65 0.45 0.02 0.13 -0.11 -0.01 -0.11 -0.11 -0.10 0 C
Addi Industries 201406 5.40 0.29 0.58 0.29 0.00 0.15 0.14 0.03 0.11 0.11 0.10 0 C
Addi Industries 201409 5.40 0.00 0.38 0.40 0.02 0.00 0.15 -0.12 -0.02 -0.10 -0.10 -0.09 0 C
ADF Foods 201312 22.38 41.03 1.96 41.21 0.02 1.80 0.34 2.70 -1.25 -0.07 -1.17 -0.93 -0.53 15 C
ADF Foods 201403 22.38 55.22 2.17 54.66 0.70 3.43 0.50 3.16 -0.23 -0.94 0.71 1.09 0.32 15 C
ADF Foods 201406 22.38 52.86 3.13 49.43 1.97 8.53 0.35 2.71 5.48 1.44 4.03 4.22 1.83 15 C
ADF Foods 201409 22.38 44.10 1.99 42.28 2.45 6.25 0.37 2.86 3.03 0.53 2.50 2.72 1.14 15 C
Adi Rasayan 201312 6.52 0.01 -0.01 -0.01 -0.01 -0.01 0 S
Adi Rasayan 201403 6.52 0.06 0.01 0.04 0.00 0.04 0.04 0.04 0.01 0 S
Adi Rasayan 201406 6.52 0.02 0.02 0.00 0.00 0.00 0.00 0 S
Adi Rasayan 201409 6.52 0.02 0.01 0.01 0.01 0.01 0.01 0 S
Aditya Spinners 201312 16.74 10.69 10.03 0.00 0.67 0.07 0.19 0.41 0.41 0.41 0.24 0 S
Aditya Spinners 201403 16.74 10.60 10.46 0.37 0.51 0.13 0.21 0.18 0.01 0.17 0.17 0 S
Aditya Spinners 201406 16.74 10.60 10.23 0.19 0.56 0.14 0.20 0.22 0.22 0.22 0.13 0 S
Aditya Spinners 201409 16.74 11.35 10.72 0.03 0.67 0.14 0.20 0.33 0.33 0.33 0.19 0 S
Exp
ecte
d R
esu
lts
on
14
Feb
ruar
y 20
15

Co_Name Year Equity N.Sale O.O.I T. Exp O.I PBIDT Int. Dep. PBT T.Tax PAT A.PAT EPS Div (%)
Exp
ecte
d R
esu
lts
on
14
Feb
ruar
y 20
15
Advance Powerinfra Tech 201312 11.64 1.87 1.88 0.05 0.04 0.00 0.01 0.03 0.00 0.03 0.03 0.02 0 S
Advance Powerinfra Tech 201403 11.64 7.68 0.04 7.67 0.05 0.01 0.03 0.01 0.00 0.01 0.01 0 S
Advance Powerinfra Tech 201406 11.64 0.53 0.55 0.06 0.05 0.02 0.03 0.01 0.02 0.02 0.02 0 S
Advance Powerinfra Tech 201409 11.64 0.12 0.19 0.10 0.02 0.00 0.02 0.01 0.00 0.00 0.00 0.01 0 S
AF Enterprises 201312 4.00 0.98 0.97 0.00 0.01 0.00 0.01 0.01 0.00 0.00 0.01 0 S
AF Enterprises 201403 4.00 4.08 0.10 4.19 -0.01 -0.01 -0.01 -0.01 -0.03 0 S
AF Enterprises 201406 4.00 0.95 0.07 1.01 0.01 0.01 0.00 0.01 0.01 0.02 0 S
AF Enterprises 201409 4.00 1.05 0.07 1.11 0.01 0.00 0.01 0.00 0.01 0.01 0.02 0 S
Agarwal Industrial Corporation 201312 5.51 31.96 8.68 37.97 0.08 2.75 0.97 1.26 0.53 0.32 0.21 0.21 0.38 14 C
Agarwal Industrial Corporation 201403 5.51 70.63 9.00 75.64 0.35 4.33 0.99 0.70 2.64 0.38 2.26 2.26 14 C
Agarwal Industrial Corporation 201406 5.51 52.33 8.64 55.97 0.02 5.02 0.89 1.02 3.11 0.76 2.35 2.35 4.26 14 C
Agarwal Industrial Corporation 201409 5.51 10.66 9.48 17.27 0.02 2.90 0.79 1.02 1.09 0.35 0.74 0.74 1.33 14 C
Agio Paper & Industries 201312 16.13 0.04 0.28 0.01 -0.22 1.27 0.07 -1.56 -1.56 -1.56 -0.97 0 S
Agio Paper & Industries 201403 16.13 0.33 0.40 0.16 0.08 1.29 0.08 -1.28 -1.28 -1.28 -0.80 0 S
Agio Paper & Industries 201406 16.13 0.21 0.02 -0.19 1.35 0.08 -1.61 -1.61 -1.61 -1.00 0 S
Agio Paper & Industries 201409 16.13 0.03 0.32 0.03 -0.27 1.41 0.07 -1.75 -1.75 -1.75 -1.08 0 S
AI Champdany Industries 201312 13.71 77.79 2.64 76.57 0.01 3.87 2.17 1.65 0.05 -0.01 0.07 0.07 0.02 0 C
AI Champdany Industries 201403 13.71 87.95 0.90 84.92 0.37 4.29 3.08 1.50 -0.29 -0.17 -0.12 -0.12 -0.04 0 C
AI Champdany Industries 201406 13.71 61.92 1.13 61.39 0.01 1.68 2.85 1.39 -2.57 -0.95 -1.61 -1.61 -0.59 0 C
AI Champdany Industries 201409 13.71 74.07 0.99 70.25 0.00 4.80 2.93 1.39 0.49 -0.08 0.57 0.57 0.21 0 C
Ajcon Global Services 201312 6.12 1.94 0.96 0.02 1.00 0.74 0.12 0.14 0.05 0.09 0.09 0.15 0 C
Ajcon Global Services 201403 6.12 2.25 0.00 0.96 0.02 1.30 1.00 0.12 0.18 0.08 0.10 0.10 0 C
Ajcon Global Services 201406 6.12 1.81 0.88 0.02 0.95 0.70 0.12 0.12 0.04 0.08 0.08 0.30 0 C
Ajcon Global Services 201409 6.12 2.01 0.98 0.02 1.05 0.76 0.12 0.16 0.05 0.11 0.11 0.18 0 C
Alchemist Corporation 201312 4.91 0.04 -0.04 0.00 -0.04 -0.04 -0.04 -0.09 0 C
Alchemist Corporation 201403 4.91 0.01 0.04 -0.04 0.00 -0.11 -0.11 -0.11 -0.22 0 C
Alchemist Corporation 201406 4.91 0.00 0.04 -0.04 0.00 -0.04 -0.04 -0.04 -0.08 0 C
Alchemist Corporation 201409 4.91 0.00 0.03 -0.03 0.00 -0.03 -0.03 -0.03 -0.07 0 C
Amit International 201312 18.95 0.03 -0.03 0.01 -0.04 -0.04 -0.04 -0.02 0 S
Amit International 201403 18.95 0.02 0.05 0.03 0.01 0.02 0.02 0.02 0.01 0 S
Amit International 201406 18.95 0.04 -0.04 0.01 -0.05 -0.05 -0.05 -0.10 0 S
Amit International 201409 18.95 0.02 0.00 -0.02 0.01 -0.03 -0.03 -0.03 -0.02 0 S
Amrapali Industries 201312 25.71 1215.88 -0.14 1218.28 2.24 -0.31 0.25 -0.43 -0.13 -0.13 -0.13 0 S
Amrapali Industries 201403 25.71 968.81 -4.56 971.24 3.12 -3.86 1.39 0.13 -5.39 -5.39 -5.39 0 S
Amrapali Industries 201406 25.71 1261.19 1260.62 1.32 1.89 0.34 0.11 1.44 1.44 1.44 0 S
Amrapali Industries 201409 25.71 1214.55 0.48 1215.41 2.24 1.85 0.36 0.51 0.98 0.98 0.98 0 S

Co_Name Year Equity N.Sale O.O.I T. Exp O.I PBIDT Int. Dep. PBT T.Tax PAT A.PAT EPS Div (%)
Exp
ecte
d R
esu
lts
on
14
Feb
ruar
y 20
15
ANG Industries 201312 15.59 36.53 32.97 3.55 4.72 1.72 -2.89 -2.89 -2.89 0 C
ANG Industries 201403 15.59 47.07 0.00 39.64 0.00 7.43 5.65 1.74 0.04 0.00 0.04 0.04 0 C
ANG Industries 201406 15.59 38.49 34.66 3.83 4.54 1.73 -6.34 -6.34 -6.34 -16.28 0 C
ANG Industries 201409 15.59 39.47 35.29 4.18 4.44 1.72 -1.97 -1.97 -1.97 -2.53 0 C
Anik Industries 201312 27.75 335.42 0.71 333.91 13.55 15.76 12.64 1.35 1.77 0.09 1.68 1.68 0.61 0 S
Anik Industries 201403 27.75 425.88 1.03 428.53 26.43 24.81 16.16 1.32 7.33 1.99 5.34 5.34 1.93 0 S
Anik Industries 201406 27.75 369.63 0.25 353.46 3.09 19.51 13.99 1.51 4.02 0.45 3.57 3.57 1.29 0 S
Anik Industries 201409 27.75 333.33 1.40 325.73 12.84 21.83 18.84 1.63 1.36 0.30 1.06 1.06 0.38 0 S
Ankit Metal & Power 201312 122.08 375.74 1.16 376.64 0.58 0.84 27.05 15.09 -41.30 -16.30 -25.01 -25.01 -2.45 0 S
Ankit Metal & Power 201403 122.08 422.06 0.68 454.54 1.11 -30.70 36.56 17.82 -85.08 -18.07 -67.00 -67.00 -4.72 0 S
Ankit Metal & Power 201406 122.08 358.00 0.80 372.06 1.75 -11.52 31.77 18.55 -61.83 -61.83 -61.83 -4.36 0 S
Ankit Metal & Power 201409 122.08 279.05 0.79 283.80 0.79 -3.16 25.50 18.71 -47.37 -47.37 -47.37 -3.34 0 S
Apex Buildsys 201312 13.72 53.39 46.44 0.18 7.13 11.14 2.91 -6.92 -2.11 -4.82 -4.82 -0.70 0 C
Apex Buildsys 201403 13.72 47.35 33.42 0.66 14.59 9.93 2.85 1.80 0.51 1.29 1.29 0.19 0 C
Apex Buildsys 201406 13.72 51.02 40.27 0.13 10.88 12.52 3.49 -5.14 -1.86 -3.28 -3.28 -0.48 0 C
Apex Buildsys 201409 13.72 44.30 43.25 0.16 1.22 12.13 3.52 -14.44 -2.12 -12.31 -12.31 -1.80 0 C
Apollo Hospitals Enterprise 201312 69.56 993.34 835.58 3.81 161.57 23.11 33.51 104.95 21.51 83.44 83.44 6.00 115 C
Apollo Hospitals Enterprise 201403 69.56 998.18 848.13 7.03 157.08 20.94 33.12 103.02 21.68 81.34 81.34 5.85 115 C
Apollo Hospitals Enterprise 201406 69.56 1053.72 897.43 6.45 162.74 18.92 39.92 103.90 21.16 82.74 82.74 5.95 115 C
Apollo Hospitals Enterprise 201409 69.56 1152.85 980.26 8.20 180.79 20.14 38.85 121.80 30.30 91.50 91.50 6.58 115 C
Arihant Capital Markets 201312 10.41 8.11 1.95 8.34 1.64 3.35 0.21 0.31 1.65 0.38 1.27 1.31 0.63 15 C
Arihant Capital Markets 201403 10.41 8.18 1.52 8.29 1.42 2.84 0.27 0.26 -0.07 -0.11 0.04 0.03 0.01 15 C
Arihant Capital Markets 201406 10.41 12.99 2.50 11.12 1.31 5.69 0.36 0.34 4.99 1.56 3.43 3.46 1.66 15 C
Arihant Capital Markets 201409 10.41 12.32 2.91 11.08 1.26 5.40 0.61 0.35 4.45 1.32 3.13 3.17 1.52 15 C
Artech Power Products 201312 3.77 0.01 -0.01 -0.01 -0.01 -0.01 -0.03 0 S
Artech Power Products 201403 3.77 0.00 0.00 0.00 0.00 0.00 0 S
Artech Power Products 201406 3.77 0.02 -0.02 -0.02 -0.02 -0.02 -0.06 0 S
Artech Power Products 201409 3.77 0.01 -0.01 -0.01 -0.01 -0.01 0 S
Asahi Infrastructure & Projects 201312 35.08 86.50 85.28 1.22 0.04 0.23 0.95 0.95 0.95 0.03 0 S
Asahi Infrastructure & Projects 201403 35.08 3.11 2.89 0.08 0.30 0.02 0.12 0.16 0.00 0.16 0.16 0 S
Asahi Infrastructure & Projects 201406 35.08 2.06 1.82 0.24 0.01 0.05 0.18 0.18 0.18 0.01 0 S
Asahi Infrastructure & Projects 201409 35.08 1.98 1.71 0.27 0.02 0.04 0.21 0.21 0.21 0.01 0 S
Assambrook 201312 6.46 15.91 0.40 16.58 0.01 -0.26 0.00 0.37 -0.24 -0.24 -0.24 -0.36 0 S
Assambrook 201403 6.46 13.59 0.09 19.76 0.61 -5.47 0.00 0.29 -6.89 -6.89 -6.89 -10.66 0 S
Assambrook 201406 6.46 2.58 0.18 2.71 0.04 0.00 0.39 -0.31 -0.31 -0.31 -0.47 0 S
Assambrook 201409 6.46 10.46 0.04 9.29 1.21 0.00 0.38 0.82 0.82 0.82 1.27 0 S

Co_Name Year Equity N.Sale O.O.I T. Exp O.I PBIDT Int. Dep. PBT T.Tax PAT A.PAT EPS Div (%)
Exp
ecte
d R
esu
lts
on
14
Feb
ruar
y 20
15
Associated Alcohols & Breweries 201312 9.04 63.18 0.00 58.92 4.26 2.26 1.88 0.12 -0.27 0.39 0.39 0.43 0 C
Associated Alcohols & Breweries 201403 9.04 47.78 40.39 7.38 0.48 1.39 5.52 2.09 3.43 3.43 3.79 0 C
Associated Alcohols & Breweries 201406 9.04 79.50 0.91 71.48 8.93 2.00 1.87 5.06 1.08 3.99 3.99 4.41 0 C
Associated Alcohols & Breweries 201409 9.04 67.01 0.38 57.12 10.27 1.66 2.32 6.29 3.80 2.48 2.48 2.75 0 C
Auroma Coke 201312 6.32 5.68 0.05 4.90 0.84 0.45 0.16 0.24 0.08 0.16 0.16 0.25 0 S
Auroma Coke 201403 6.32 7.18 0.03 6.29 0.01 0.94 0.49 0.16 0.30 0.08 0.22 0.22 0.34 0 S
Auroma Coke 201406 6.32 6.50 0.01 5.94 0.00 0.57 0.49 0.21 -0.12 0.00 -0.12 -0.12 -0.19 0 S
Auroma Coke 201409 6.32 3.43 0.02 3.40 0.03 0.07 0.45 0.15 -0.53 -0.11 -0.42 -0.42 -0.66 0 S
Autolite (India) 201312 9.46 26.84 1.40 26.47 0.04 1.81 0.69 0.84 0.28 0.28 0.28 0.30 0 S
Autolite (India) 201403 9.86 31.16 1.49 31.31 0.69 2.03 0.85 0.90 0.28 0.17 0.11 0.11 0.12 0 S
Autolite (India) 201406 9.86 21.41 0.85 22.41 0.16 0.01 0.95 0.81 -1.75 -1.75 -1.75 -1.78 0 S
Autolite (India) 201409 9.86 29.55 1.57 29.38 0.44 2.18 1.26 0.84 0.08 0.08 0.08 0.08 0 S
B Nanji Enterprises 201312 5.50 3.37 1.15 2.22 1.41 0.07 0.74 0.74 0.74 1.35 0 S
B Nanji Enterprises 201403 5.50 13.56 0.71 11.49 0.00 2.78 1.37 0.07 1.34 0.65 0.68 0.68 1.24 0 S
B Nanji Enterprises 201406 5.50 4.41 2.33 0.01 2.09 1.30 0.06 0.73 0.00 0.73 0.73 1.33 0 S
B Nanji Enterprises 201409 5.50 2.90 2.18 0.02 0.73 0.82 0.06 -0.15 -0.15 -0.15 -0.03 0 S
Bacil Pharma 201312 5.89 0.02 0.01 -0.01 -0.01 -0.01 -0.01 0 S
Bacil Pharma 201403 5.89 0.10 0.02 -0.08 0.00 -0.08 -0.08 -0.08 0 S
Bacil Pharma 201406 5.89 0.03 0.01 -0.02 -0.02 -0.02 -0.02 -0.03 0 S
Bacil Pharma 201409 5.89 0.03 0.02 0.00 0.00 -0.01 -0.01 -0.01 -0.01 0 S
Bajrang Finance 201312 1.40 0.13 0.02 0.11 0.11 0.06 0.05 0.05 0.34 0 S
Bajrang Finance 201403 1.40 0.12 0.04 0.00 0.09 0.09 0.03 0.06 0.06 0.43 0 S
Bajrang Finance 201406 1.40 0.13 0.02 0.11 0.11 0.04 0.08 0.08 0.55 0 S
Bajrang Finance 201409 1.40 0.16 0.03 0.14 1.40 0.04 1.36 1.36 9.68 0 S
Balaji Amines 201312 6.48 137.51 118.08 0.54 19.97 8.70 4.50 6.78 2.58 4.20 4.20 1.30 50 C
Balaji Amines 201403 6.48 171.50 150.37 0.54 21.67 8.33 4.41 8.93 -0.16 9.09 9.09 2.81 50 C
Balaji Amines 201406 6.48 164.47 139.51 0.78 25.74 8.36 4.90 12.48 3.17 9.31 9.31 2.87 50 C
Balaji Amines 201409 6.48 150.45 122.28 0.85 29.02 7.94 4.93 16.15 5.81 10.34 10.34 2.81 50 C
Balaji Galvanising Industries 201312 4.96 2.24 2.43 0.00 -0.19 0.05 -0.24 -0.24 -0.24 0 S
Balaji Galvanising Industries 201403 4.96 2.10 2.16 0.01 -0.05 0.08 0.04 -0.17 -0.17 -0.17 0 S
Balaji Galvanising Industries 201406 4.96 1.84 1.97 0.00 -0.13 0.03 0.05 -0.21 -0.21 -0.21 0 S
Balaji Galvanising Industries 201409 4.96 1.98 0.20 2.33 0.00 -0.14 0.03 0.05 -0.22 -0.22 -0.22 -1.62 0 S
Balkrishna Industries 201312 19.33 867.32 17.10 655.52 5.71 234.61 6.36 42.54 185.71 61.86 123.85 123.85 12.81 100 C
Balkrishna Industries 201403 19.33 1030.63 6.21 768.96 5.16 273.04 9.92 47.87 215.25 61.10 154.15 154.15 15.95 100 C
Balkrishna Industries 201406 19.33 948.07 12.91 728.44 7.25 239.79 11.77 56.70 171.32 55.91 115.41 115.41 11.94 100 C
Balkrishna Industries 201409 19.33 875.47 5.84 726.20 51.73 206.84 13.13 59.51 134.20 44.04 90.16 90.16 9.33 100 C

Co_Name Year Equity N.Sale O.O.I T. Exp O.I PBIDT Int. Dep. PBT T.Tax PAT A.PAT EPS Div (%)
Exp
ecte
d R
esu
lts
on
14
Feb
ruar
y 20
15
Bambino Agro Industries 201312 8.01 63.17 57.72 5.45 2.32 1.02 2.11 0.30 1.82 1.82 2.27 15 S
Bambino Agro Industries 201403 8.01 54.88 49.93 4.95 3.49 1.16 0.30 0.12 0.18 0.18 0.23 15 S
Bambino Agro Industries 201406 8.01 62.31 56.08 6.24 2.65 1.09 2.50 0.99 1.51 1.51 1.89 15 S
Bambino Agro Industries 201409 8.01 80.33 74.13 6.20 3.02 0.23 2.95 -0.64 3.59 3.59 4.48 15 S
Bampsl Securities 201312 29.60 0.22 0.05 0.17 0.01 0.17 0.06 0.09 0.11 0.00 0 S
Bampsl Securities 201403 29.60 1.15 0.26 0.90 0.01 0.89 0.27 0.42 0.62 0.01 0 S
Bampsl Securities 201406 29.60 0.20 0.05 0.15 0.01 0.15 0.05 0.08 0.10 0 S
Bampsl Securities 201409 29.60 0.73 0.10 0.64 0.01 0.64 0.21 0.34 0.43 0.01 0 S
Banas Finance 201312 11.38 1.96 0.01 2.62 -0.65 0.01 -0.67 -0.67 -0.67 -0.06 0 S
Banas Finance 201403 11.38 2.02 2.02 -0.01 0.00 -0.01 0.00 0.03 -0.02 -0.02 0 S
Banas Finance 201406 11.38 3.27 2.21 1.06 1.06 0.15 0.91 0.91 0.08 0 S
Banas Finance 201409 11.38 2.15 1.15 1.00 0.00 1.00 0.45 0.55 0.55 0.05 0 S
Bannari Amman Spinning Mills 201312 15.75 171.35 3.55 147.87 0.07 27.09 8.94 9.13 9.02 2.88 6.14 6.14 3.90 20 C
Bannari Amman Spinning Mills 201403 15.75 187.94 3.88 170.93 0.94 21.83 10.36 7.82 3.66 0.90 2.76 2.76 1.75 20 C
Bannari Amman Spinning Mills 201406 15.75 168.38 4.18 146.11 26.45 10.26 7.49 8.70 2.70 6.00 6.00 3.81 20 C
Bannari Amman Spinning Mills 201409 15.75 159.85 4.48 142.51 21.82 10.14 7.57 4.12 1.53 2.58 2.58 1.64 20 C
Bhagawati Gas 201312 16.74 0.28 0.01 -0.27 0.05 0.15 -0.48 -0.48 -0.48 -0.28 0 S
Bhagawati Gas 201403 16.74 0.15 0.01 -0.14 0.05 0.15 -0.33 -0.33 -0.33 -0.20 0 S
Bhagawati Gas 201406 16.74 0.17 -0.17 0.03 0.14 -0.34 -0.34 -0.34 -0.20 0 S
Bhagawati Gas 201409 16.74 0.20 0.03 -0.17 0.06 0.15 -0.39 -0.39 -0.39 -0.23 0 S
Bhushan Steel 201312 45.30 2318.29 88.87 1805.52 3.40 605.04 432.08 242.28 -69.32 -14.53 -54.79 -54.79 -2.55 25 C
Bhushan Steel 201403 45.30 2407.52 102.80 1854.68 13.29 668.93 439.37 252.56 -23.00 -3.43 -19.57 -19.57 -0.99 25 C
Bhushan Steel 201406 45.30 2671.28 130.40 2086.34 2.04 717.38 552.49 306.52 -141.63 -141.63 -141.63 -6.37 25 C
Bhushan Steel 201409 45.30 2757.58 206.41 2379.61 2.56 586.94 565.41 318.72 -297.19 0.00 -297.19 -297.19 -13.24 25 C
Bhuwalka Steel Industries 201312 10.37 75.89 0.21 74.01 0.13 2.23 4.37 1.43 -3.57 -3.57 -3.57 -3.45 0 C
Bhuwalka Steel Industries 201403 10.37 91.97 0.11 105.08 0.08 -12.92 7.14 1.61 -21.68 -5.96 -15.72 -15.72 -15.15 0 C
Bhuwalka Steel Industries 201406 10.38 137.60 0.00 134.81 0.05 2.84 4.91 1.32 -3.39 0.00 -3.39 -3.39 -3.27 0 C
Bhuwalka Steel Industries 201409 10.37 117.68 0.00 115.08 0.14 2.74 7.99 1.33 -6.57 6.55 -6.57 -6.34 0 C
Bilcare 201312 23.55 774.29 3.24 735.49 42.04 62.23 37.88 -58.07 8.76 -66.85 -66.48 -28.23 0 C
Bilcare 201403 23.55 725.36 12.60 644.69 93.27 56.91 39.24 -15.71 3.85 -19.45 -19.33 -8.21 0 C
Bilcare 201406 23.55 690.65 5.10 641.05 54.70 50.04 38.00 -12.03 -2.31 -9.72 -9.89 -4.20 0 C
Bilcare 201409 23.55 711.44 6.33 666.73 51.04 74.71 39.05 -62.72 7.24 -69.96 -70.09 -29.76 0 C
Bimetal Bearings 201312 3.83 32.01 1.16 32.89 1.04 1.32 0.05 1.14 0.12 -0.09 0.21 0.21 0.54 70 S
Bimetal Bearings 201403 3.83 37.53 1.63 37.56 1.44 3.04 0.11 1.09 1.84 0.27 1.57 1.57 4.11 70 S
Bimetal Bearings 201406 3.83 34.17 1.42 34.76 1.18 2.00 0.07 1.37 0.56 0.18 0.39 0.39 1.01 70 S
Bimetal Bearings 201409 3.83 43.02 1.74 40.68 1.98 6.06 0.06 1.61 4.40 1.37 3.02 3.02 7.91 70 S

Co_Name Year Equity N.Sale O.O.I T. Exp O.I PBIDT Int. Dep. PBT T.Tax PAT A.PAT EPS Div (%)
Exp
ecte
d R
esu
lts
on
14
Feb
ruar
y 20
15
Bio Green Papers 201312 8.00 0.23 1.61 1.68 0.31 0.07 0.22 0.01 0.00 0.01 0.01 0.01 0 S
Bio Green Papers 201403 8.00 1.53 1.80 0.28 0.06 0.22 -0.01 -0.01 -0.01 -0.01 0 S
Bio Green Papers 201406 8.00 0.60 0.93 0.33 0.10 0.22 0.01 0.00 0.00 0.00 0 S
Bio Green Papers 201409 8.00 0.20 0.53 0.33 0.10 0.22 0.00 0.00 0.00 0 S
BITS 201312 22.38 0.00 0.13 0.12 -0.01 0.00 0.02 -0.02 0.00 -0.02 -0.02 0 S
BITS 201403 22.38 0.13 0.33 0.13 -0.06 0.02 -0.08 0.01 -0.09 -0.09 -0.01 0 S
BITS 201406 22.38 0.03 0.15 0.19 0.06 0.02 0.05 0.05 0.05 0.00 0 S
BITS 201409 22.38 0.26 0.21 -0.05 0.02 -0.07 -0.07 -0.07 -0.01 0 S
Boston Teknowsys (India) 201312 5.24 0.86 0.84 0.02 0.01 0.01 0.00 0.01 0.01 0.01 0 S
Boston Teknowsys (India) 201403 5.24 4.20 4.13 0.08 0.02 0.05 0.02 0.04 0.04 0.07 0 S
Boston Teknowsys (India) 201406 5.24 0.72 0.71 0.00 0.01 0.00 0.01 0.01 0.00 0.00 0.00 0 S
Boston Teknowsys (India) 201409 5.24 0.93 0.92 0.01 0.01 0.00 0.00 0.00 0.00 0 S
Brahmanand Himghar 201312 7.00 0.90 0.02 0.20 0.72 0.23 0.05 0.45 0.45 0.45 0.32 0 C
Brahmanand Himghar 201403 7.00 0.16 0.37 0.55 -0.02 0.19 0.06 -0.26 -0.26 -0.26 0 C
Brahmanand Himghar 201406 7.00 0.67 0.05 0.52 0.20 0.17 0.05 -0.01 -0.01 -0.01 0 C
Brahmanand Himghar 201409 7.00 0.84 0.03 0.40 0.00 0.47 0.02 0.04 0.41 0.00 0.41 0.41 0.29 0 C
Brakes Auto (India) 201312 20.97 0.07 0.04 0.03 0.03 0.00 0.00 0.00 0 S
Brakes Auto (India) 201403 20.97 0.35 0.38 -0.03 0.03 -0.06 -0.06 -0.06 -0.03 0 S
Brakes Auto (India) 201406 20.97 0.07 0.05 0.02 0.03 -0.01 -0.01 -0.01 0 S
Brakes Auto (India) 201409 20.97 0.01 0.01 0 S
BS 201312 43.90 541.25 494.20 1.20 48.25 27.83 7.18 12.76 4.00 8.77 8.77 2.00 10 C
BS 201403 43.90 653.05 0.00 570.62 2.56 84.98 28.94 7.68 47.89 17.03 30.86 30.86 10 C
BS 201406 43.90 501.76 433.23 0.45 68.98 30.72 9.18 28.61 9.54 19.07 19.07 0.43 10 C
BS 201409 43.94 713.43 649.66 2.44 66.20 33.36 9.26 23.11 7.45 15.66 15.66 0.36 10 C
C&C Constructions 201312 25.45 274.73 3.56 267.14 2.50 13.66 65.94 16.10 -68.38 1.19 -69.58 -69.58 -27.34 0 C
C&C Constructions 201403 25.45 351.43 3.19 329.12 8.69 34.19 50.72 14.59 -31.12 4.14 -35.26 -35.26 -13.86 0 C
C&C Constructions 201406 25.45 427.68 3.82 320.81 4.10 114.79 41.04 17.16 56.59 4.94 51.65 51.65 20.30 0 C
C&C Constructions 201409 25.45 255.33 3.35 250.18 2.29 10.78 48.38 9.33 -46.93 -0.94 -45.98 -45.98 -18.07 0 C
Capman Financials 201312 3.52 0.20 0.03 0.17 0.17 0.05 0.12 0.12 0.34 0 S
Capman Financials 201403 3.52 0.22 0.09 0.13 0.13 0.04 0.09 0.09 0.24 0 S
Capman Financials 201406 3.52 0.22 0.04 0.19 0.19 0.06 0.13 0.13 0.36 0 S
Capman Financials 201409 3.52 0.22 0.05 0.17 0.17 0.17 0.17 0.33 0 S
CCL International 201312 19.19 17.61 0.07 16.93 0.75 0.16 0.31 0.29 0.08 0.21 0.21 0.02 3 S
CCL International 201403 19.19 37.78 0.25 36.66 1.37 0.29 0.41 0.67 0.22 0.46 0.46 0.05 3 S
CCL International 201406 19.19 19.85 0.15 19.12 0.88 0.24 0.43 0.21 0.06 0.15 0.15 0.02 3 S
CCL International 201409 19.19 18.36 0.17 17.19 1.34 0.36 0.98 0.00 0.01 -0.01 -0.01 3 S

Co_Name Year Equity N.Sale O.O.I T. Exp O.I PBIDT Int. Dep. PBT T.Tax PAT A.PAT EPS Div (%)
Exp
ecte
d R
esu
lts
on
14
Feb
ruar
y 20
15
Ceenik Exports (India) 201312 3.35 2.54 0.01 2.73 -0.18 0.56 0.01 -0.75 -0.75 -0.75 -2.24 0 S
Ceenik Exports (India) 201403 3.35 2.35 1.96 0.39 0.80 0.15 -0.56 -0.29 -0.28 -0.28 -0.82 0 S
Ceenik Exports (India) 201406 3.35 2.26 2.27 -0.01 0.45 0.07 -0.53 -0.53 -0.53 -1.58 0 S
Ceenik Exports (India) 201409 3.35 3.80 2.35 1.45 0.60 0.14 0.71 0.71 0.71 2.12 0 S
Celebrity Fashions 201312 30.50 70.71 0.73 68.21 0.47 3.70 1.25 1.21 1.24 1.24 1.24 0.41 0 S
Celebrity Fashions 201403 36.35 66.83 5.52 62.82 0.26 9.79 0.95 1.42 7.42 17.39 7.42 5.64 0 S
Celebrity Fashions 201406 36.35 51.85 1.36 53.01 0.24 0.44 2.09 1.50 -3.15 -3.15 -3.15 -0.87 0 S
Celebrity Fashions 201409 39.00 39.65 8.92 48.78 0.31 0.10 2.56 1.89 -4.35 -4.35 -4.35 -1.14 0 S
Centenial Surgical Suture 201312 3.65 12.74 11.55 1.19 0.25 0.15 0.79 0.27 0.52 0.52 1.43 0 S
Centenial Surgical Suture 201403 3.65 11.56 10.71 0.85 0.48 0.14 0.23 0.07 0.16 0.16 0.43 0 S
Centenial Surgical Suture 201406 3.65 13.58 12.30 0.03 1.31 0.40 0.14 0.77 0.26 0.51 0.51 1.39 0 S
Centenial Surgical Suture 201409 3.65 13.13 11.75 1.38 0.30 0.22 0.86 0.29 0.57 0.57 1.55 0 S
Centron Industrial Alliance 201312 9.96 3.21 0.70 3.76 0.14 0.03 0.11 0.11 0.11 0.11 0 S
Centron Industrial Alliance 201403 9.96 13.32 0.07 13.30 0.09 -0.03 -0.05 0.16 0.09 0.07 0.07 0.01 0 S
Centron Industrial Alliance 201406 9.96 3.56 0.32 3.76 0.13 0.00 0.13 0.13 0.13 0.01 0 S
Centron Industrial Alliance 201409 9.96 5.58 0.35 5.74 0.19 0.00 0.19 0.19 0.19 0.02 0 S
Century 21St Portfolio 201312 2.07 0.01 0.01 0.00 0.00 0.00 0.00 0.00 0 S
Century 21St Portfolio 201403 2.07 0.05 0.05 0.00 0.00 -0.01 -0.01 -0.01 -0.04 0 S
Century 21St Portfolio 201406 2.07 0.00 0.00 0.00 -0.01 -0.01 -0.01 -0.03 0 S
Century 21St Portfolio 201409 2.07 0.01 -0.01 0.00 -0.01 -0.01 -0.01 -0.04 0 S
Cerebra Integrated Technologies 201312 48.09 62.16 0.58 61.94 0.72 1.52 0.25 0.24 1.03 0.04 0.99 0.97 0.07 0 C
Cerebra Integrated Technologies 201403 48.09 68.31 -0.12 65.63 -0.37 2.19 0.92 0.23 1.03 0.21 0.82 0.46 0 C
Cerebra Integrated Technologies 201406 48.09 55.87 55.10 0.07 0.85 0.32 0.17 0.36 0.14 0.22 0.10 0 C
Cerebra Integrated Technologies 201409 48.09 60.07 57.85 0.45 2.67 0.50 0.20 1.97 0.36 1.61 1.37 0 C
Chartered Logistics 201312 9.93 41.29 35.88 0.05 5.46 2.50 2.51 0.45 0.45 0.45 0.05 0 S
Chartered Logistics 201403 9.93 34.49 41.06 2.82 -3.75 4.15 3.42 -11.31 -11.31 -11.31 -1.14 0 S
Chartered Logistics 201406 9.93 34.52 29.23 0.76 6.06 2.20 2.65 1.21 1.21 1.21 0.12 0 S
Chartered Logistics 201409 9.93 35.54 29.62 1.31 7.24 2.65 2.51 2.08 2.08 2.08 0.21 0 S
Chembond Chemicals 201312 6.66 67.59 1.09 62.99 5.69 1.05 0.73 3.91 1.79 2.12 1.36 2.04 30 C
Chembond Chemicals 201403 6.66 71.05 2.75 66.64 7.16 1.32 0.81 5.03 1.35 3.68 3.62 5.43 30 C
Chembond Chemicals 201406 6.66 71.54 0.77 67.31 5.00 0.90 0.91 3.19 1.08 2.11 1.69 2.54 30 C
Chembond Chemicals 201409 6.66 77.07 0.58 70.47 7.18 0.93 0.97 5.29 1.83 3.46 2.75 4.12 30 C
Choksi Laboratories 201312 6.67 5.09 0.00 3.89 0.02 1.22 0.38 0.42 0.42 0.17 0.25 0.25 0.37 0 S
Choksi Laboratories 201403 6.97 4.68 0.05 3.91 0.05 0.88 0.17 0.35 0.36 -0.04 0.40 0.40 0.57 0 S
Choksi Laboratories 201406 6.97 4.93 0.00 3.93 0.10 1.11 0.35 0.69 0.07 -0.03 0.11 0.11 0.15 0 S
Choksi Laboratories 201409 6.97 5.46 0.01 4.11 1.36 0.45 0.69 0.22 0.17 0.06 0.06 0.08 0 S
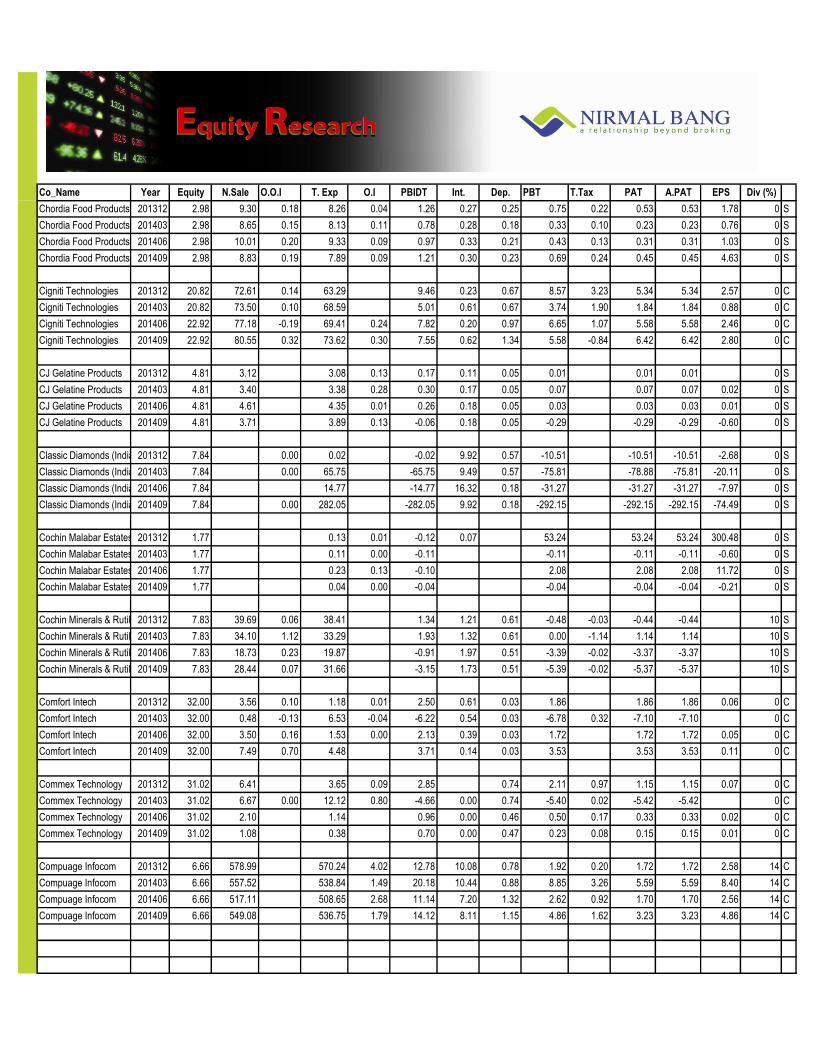
Co_Name Year Equity N.Sale O.O.I T. Exp O.I PBIDT Int. Dep. PBT T.Tax PAT A.PAT EPS Div (%)
Exp
ecte
d R
esu
lts
on
14
Feb
ruar
y 20
15
Chordia Food Products 201312 2.98 9.30 0.18 8.26 0.04 1.26 0.27 0.25 0.75 0.22 0.53 0.53 1.78 0 S
Chordia Food Products 201403 2.98 8.65 0.15 8.13 0.11 0.78 0.28 0.18 0.33 0.10 0.23 0.23 0.76 0 S
Chordia Food Products 201406 2.98 10.01 0.20 9.33 0.09 0.97 0.33 0.21 0.43 0.13 0.31 0.31 1.03 0 S
Chordia Food Products 201409 2.98 8.83 0.19 7.89 0.09 1.21 0.30 0.23 0.69 0.24 0.45 0.45 4.63 0 S
Cigniti Technologies 201312 20.82 72.61 0.14 63.29 9.46 0.23 0.67 8.57 3.23 5.34 5.34 2.57 0 C
Cigniti Technologies 201403 20.82 73.50 0.10 68.59 5.01 0.61 0.67 3.74 1.90 1.84 1.84 0.88 0 C
Cigniti Technologies 201406 22.92 77.18 -0.19 69.41 0.24 7.82 0.20 0.97 6.65 1.07 5.58 5.58 2.46 0 C
Cigniti Technologies 201409 22.92 80.55 0.32 73.62 0.30 7.55 0.62 1.34 5.58 -0.84 6.42 6.42 2.80 0 C
CJ Gelatine Products 201312 4.81 3.12 3.08 0.13 0.17 0.11 0.05 0.01 0.01 0.01 0 S
CJ Gelatine Products 201403 4.81 3.40 3.38 0.28 0.30 0.17 0.05 0.07 0.07 0.07 0.02 0 S
CJ Gelatine Products 201406 4.81 4.61 4.35 0.01 0.26 0.18 0.05 0.03 0.03 0.03 0.01 0 S
CJ Gelatine Products 201409 4.81 3.71 3.89 0.13 -0.06 0.18 0.05 -0.29 -0.29 -0.29 -0.60 0 S
Classic Diamonds (India) 201312 7.84 0.00 0.02 -0.02 9.92 0.57 -10.51 -10.51 -10.51 -2.68 0 S
Classic Diamonds (India) 201403 7.84 0.00 65.75 -65.75 9.49 0.57 -75.81 -78.88 -75.81 -20.11 0 S
Classic Diamonds (India) 201406 7.84 14.77 -14.77 16.32 0.18 -31.27 -31.27 -31.27 -7.97 0 S
Classic Diamonds (India) 201409 7.84 0.00 282.05 -282.05 9.92 0.18 -292.15 -292.15 -292.15 -74.49 0 S
Cochin Malabar Estates & Industries 201312 1.77 0.13 0.01 -0.12 0.07 53.24 53.24 53.24 300.48 0 S
Cochin Malabar Estates & Industries 201403 1.77 0.11 0.00 -0.11 -0.11 -0.11 -0.11 -0.60 0 S
Cochin Malabar Estates & Industries 201406 1.77 0.23 0.13 -0.10 2.08 2.08 2.08 11.72 0 S
Cochin Malabar Estates & Industries 201409 1.77 0.04 0.00 -0.04 -0.04 -0.04 -0.04 -0.21 0 S
Cochin Minerals & Rutile 201312 7.83 39.69 0.06 38.41 1.34 1.21 0.61 -0.48 -0.03 -0.44 -0.44 10 S
Cochin Minerals & Rutile 201403 7.83 34.10 1.12 33.29 1.93 1.32 0.61 0.00 -1.14 1.14 1.14 10 S
Cochin Minerals & Rutile 201406 7.83 18.73 0.23 19.87 -0.91 1.97 0.51 -3.39 -0.02 -3.37 -3.37 10 S
Cochin Minerals & Rutile 201409 7.83 28.44 0.07 31.66 -3.15 1.73 0.51 -5.39 -0.02 -5.37 -5.37 10 S
Comfort Intech 201312 32.00 3.56 0.10 1.18 0.01 2.50 0.61 0.03 1.86 1.86 1.86 0.06 0 C
Comfort Intech 201403 32.00 0.48 -0.13 6.53 -0.04 -6.22 0.54 0.03 -6.78 0.32 -7.10 -7.10 0 C
Comfort Intech 201406 32.00 3.50 0.16 1.53 0.00 2.13 0.39 0.03 1.72 1.72 1.72 0.05 0 C
Comfort Intech 201409 32.00 7.49 0.70 4.48 3.71 0.14 0.03 3.53 3.53 3.53 0.11 0 C
Commex Technology 201312 31.02 6.41 3.65 0.09 2.85 0.74 2.11 0.97 1.15 1.15 0.07 0 C
Commex Technology 201403 31.02 6.67 0.00 12.12 0.80 -4.66 0.00 0.74 -5.40 0.02 -5.42 -5.42 0 C
Commex Technology 201406 31.02 2.10 1.14 0.96 0.00 0.46 0.50 0.17 0.33 0.33 0.02 0 C
Commex Technology 201409 31.02 1.08 0.38 0.70 0.00 0.47 0.23 0.08 0.15 0.15 0.01 0 C
Compuage Infocom 201312 6.66 578.99 570.24 4.02 12.78 10.08 0.78 1.92 0.20 1.72 1.72 2.58 14 C
Compuage Infocom 201403 6.66 557.52 538.84 1.49 20.18 10.44 0.88 8.85 3.26 5.59 5.59 8.40 14 C
Compuage Infocom 201406 6.66 517.11 508.65 2.68 11.14 7.20 1.32 2.62 0.92 1.70 1.70 2.56 14 C
Compuage Infocom 201409 6.66 549.08 536.75 1.79 14.12 8.11 1.15 4.86 1.62 3.23 3.23 4.86 14 C
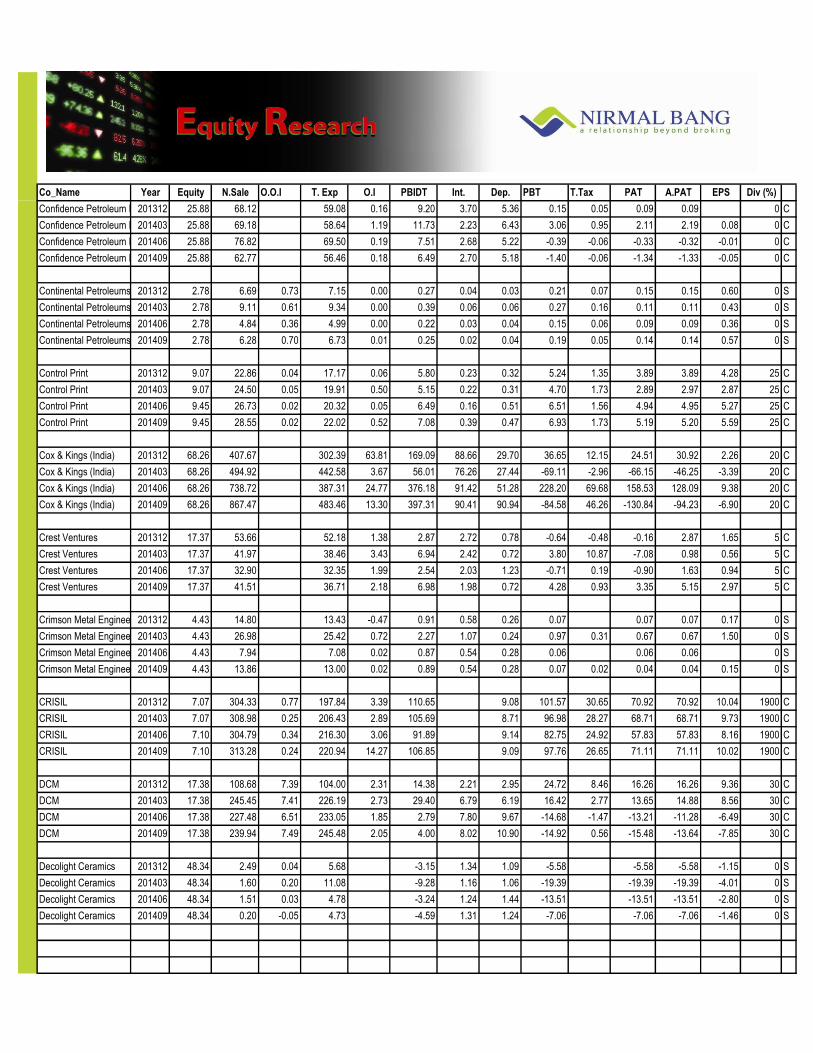
Co_Name Year Equity N.Sale O.O.I T. Exp O.I PBIDT Int. Dep. PBT T.Tax PAT A.PAT EPS Div (%)
Exp
ecte
d R
esu
lts
on
14
Feb
ruar
y 20
15
Confidence Petroleum India 201312 25.88 68.12 59.08 0.16 9.20 3.70 5.36 0.15 0.05 0.09 0.09 0 C
Confidence Petroleum India 201403 25.88 69.18 58.64 1.19 11.73 2.23 6.43 3.06 0.95 2.11 2.19 0.08 0 C
Confidence Petroleum India 201406 25.88 76.82 69.50 0.19 7.51 2.68 5.22 -0.39 -0.06 -0.33 -0.32 -0.01 0 C
Confidence Petroleum India 201409 25.88 62.77 56.46 0.18 6.49 2.70 5.18 -1.40 -0.06 -1.34 -1.33 -0.05 0 C
Continental Petroleums 201312 2.78 6.69 0.73 7.15 0.00 0.27 0.04 0.03 0.21 0.07 0.15 0.15 0.60 0 S
Continental Petroleums 201403 2.78 9.11 0.61 9.34 0.00 0.39 0.06 0.06 0.27 0.16 0.11 0.11 0.43 0 S
Continental Petroleums 201406 2.78 4.84 0.36 4.99 0.00 0.22 0.03 0.04 0.15 0.06 0.09 0.09 0.36 0 S
Continental Petroleums 201409 2.78 6.28 0.70 6.73 0.01 0.25 0.02 0.04 0.19 0.05 0.14 0.14 0.57 0 S
Control Print 201312 9.07 22.86 0.04 17.17 0.06 5.80 0.23 0.32 5.24 1.35 3.89 3.89 4.28 25 C
Control Print 201403 9.07 24.50 0.05 19.91 0.50 5.15 0.22 0.31 4.70 1.73 2.89 2.97 2.87 25 C
Control Print 201406 9.45 26.73 0.02 20.32 0.05 6.49 0.16 0.51 6.51 1.56 4.94 4.95 5.27 25 C
Control Print 201409 9.45 28.55 0.02 22.02 0.52 7.08 0.39 0.47 6.93 1.73 5.19 5.20 5.59 25 C
Cox & Kings (India) 201312 68.26 407.67 302.39 63.81 169.09 88.66 29.70 36.65 12.15 24.51 30.92 2.26 20 C
Cox & Kings (India) 201403 68.26 494.92 442.58 3.67 56.01 76.26 27.44 -69.11 -2.96 -66.15 -46.25 -3.39 20 C
Cox & Kings (India) 201406 68.26 738.72 387.31 24.77 376.18 91.42 51.28 228.20 69.68 158.53 128.09 9.38 20 C
Cox & Kings (India) 201409 68.26 867.47 483.46 13.30 397.31 90.41 90.94 -84.58 46.26 -130.84 -94.23 -6.90 20 C
Crest Ventures 201312 17.37 53.66 52.18 1.38 2.87 2.72 0.78 -0.64 -0.48 -0.16 2.87 1.65 5 C
Crest Ventures 201403 17.37 41.97 38.46 3.43 6.94 2.42 0.72 3.80 10.87 -7.08 0.98 0.56 5 C
Crest Ventures 201406 17.37 32.90 32.35 1.99 2.54 2.03 1.23 -0.71 0.19 -0.90 1.63 0.94 5 C
Crest Ventures 201409 17.37 41.51 36.71 2.18 6.98 1.98 0.72 4.28 0.93 3.35 5.15 2.97 5 C
Crimson Metal Engineering Company 201312 4.43 14.80 13.43 -0.47 0.91 0.58 0.26 0.07 0.07 0.07 0.17 0 S
Crimson Metal Engineering Company 201403 4.43 26.98 25.42 0.72 2.27 1.07 0.24 0.97 0.31 0.67 0.67 1.50 0 S
Crimson Metal Engineering Company 201406 4.43 7.94 7.08 0.02 0.87 0.54 0.28 0.06 0.06 0.06 0 S
Crimson Metal Engineering Company 201409 4.43 13.86 13.00 0.02 0.89 0.54 0.28 0.07 0.02 0.04 0.04 0.15 0 S
CRISIL 201312 7.07 304.33 0.77 197.84 3.39 110.65 9.08 101.57 30.65 70.92 70.92 10.04 1900 C
CRISIL 201403 7.07 308.98 0.25 206.43 2.89 105.69 8.71 96.98 28.27 68.71 68.71 9.73 1900 C
CRISIL 201406 7.10 304.79 0.34 216.30 3.06 91.89 9.14 82.75 24.92 57.83 57.83 8.16 1900 C
CRISIL 201409 7.10 313.28 0.24 220.94 14.27 106.85 9.09 97.76 26.65 71.11 71.11 10.02 1900 C
DCM 201312 17.38 108.68 7.39 104.00 2.31 14.38 2.21 2.95 24.72 8.46 16.26 16.26 9.36 30 C
DCM 201403 17.38 245.45 7.41 226.19 2.73 29.40 6.79 6.19 16.42 2.77 13.65 14.88 8.56 30 C
DCM 201406 17.38 227.48 6.51 233.05 1.85 2.79 7.80 9.67 -14.68 -1.47 -13.21 -11.28 -6.49 30 C
DCM 201409 17.38 239.94 7.49 245.48 2.05 4.00 8.02 10.90 -14.92 0.56 -15.48 -13.64 -7.85 30 C
Decolight Ceramics 201312 48.34 2.49 0.04 5.68 -3.15 1.34 1.09 -5.58 -5.58 -5.58 -1.15 0 S
Decolight Ceramics 201403 48.34 1.60 0.20 11.08 -9.28 1.16 1.06 -19.39 -19.39 -19.39 -4.01 0 S
Decolight Ceramics 201406 48.34 1.51 0.03 4.78 -3.24 1.24 1.44 -13.51 -13.51 -13.51 -2.80 0 S
Decolight Ceramics 201409 48.34 0.20 -0.05 4.73 -4.59 1.31 1.24 -7.06 -7.06 -7.06 -1.46 0 S

Co_Name Year Equity N.Sale O.O.I T. Exp O.I PBIDT Int. Dep. PBT T.Tax PAT A.PAT EPS Div (%)
Exp
ecte
d R
esu
lts
on
14
Feb
ruar
y 20
15
Dee Kartavya Finance 201312 12.66 0.04 -0.04 -0.04 -0.07 -0.04 -0.03 0 S
Dee Kartavya Finance 201403 12.66 0.05 0.00 0.05 0.00 -0.06 0.00 -0.04 -0.06 -0.03 0 S
Dee Kartavya Finance 201406 12.66 0.07 -0.07 -0.07 -0.07 -0.07 -0.05 0 S
Dee Kartavya Finance 201409 12.66 0.06 0.06 0.20 0.20 0.20 0.04 0.16 0.16 0.13 0 S
Deep Industries 201312 26.25 24.83 11.93 -0.16 12.74 2.43 3.01 7.31 1.80 5.51 5.51 2.10 10 C
Deep Industries 201403 26.25 21.16 5.61 0.64 16.19 2.70 3.49 10.01 5.95 4.06 4.06 1.55 10 C
Deep Industries 201406 29.20 27.00 12.38 0.24 14.85 2.46 4.17 8.21 2.38 5.84 5.84 2.00 10 C
Deep Industries 201409 29.20 25.43 11.60 0.34 14.16 2.98 2.78 8.41 3.09 5.32 5.32 1.82 10 C
Delma Infrastructure 201312 0.25 0.06 -0.06 -0.06 -0.06 -0.06 -2.59 0 S
Delma Infrastructure 201403 0.25 0.14 -0.14 -0.14 0.08 -0.22 -0.22 -8.67 0 S
Delma Infrastructure 201406 0.25 0.10 -0.10 -0.38 -0.38 -0.38 -15.38 0 S
Delma Infrastructure 201409 0.25 0.12 -0.12 -0.12 -0.12 -0.12 -4.92 0 S
Delton Cables 201312 2.88 28.77 0.02 27.40 0.17 1.56 1.59 0.34 -0.29 -0.09 -0.20 -0.20 -0.71 0 S
Delton Cables 201403 2.88 39.32 37.37 0.50 2.45 2.03 0.22 0.12 0.11 0.01 0.01 0.04 0 S
Delton Cables 201406 2.88 34.60 33.29 0.21 1.52 2.42 0.24 -1.14 -0.55 -0.60 -0.60 -2.07 0 S
Delton Cables 201409 2.88 31.50 30.13 0.29 1.66 2.27 0.24 -0.85 -0.25 -0.60 -0.60 -2.07 0 S
Dhanlaxmi Cotex 201312 4.87 0.41 1.21 1.57 0.05 0.05 0.05 0.05 0.09 0 S
Dhanlaxmi Cotex 201403 4.87 4.62 0.75 4.79 0.58 0.58 0.58 0.58 1.20 0 S
Dhanlaxmi Cotex 201406 4.87 12.31 0.58 12.48 0.42 0.42 0.42 0.42 0.86 0 S
Dhanlaxmi Cotex 201409 4.87 5.52 1.22 5.80 0.94 0.94 0.94 0.94 1.92 0 S
Dhar Textile Mills 201312 6.31 8.14 7.64 0.01 0.51 -12.15 -1.14 13.80 13.80 13.80 21.87 0 S
Dhar Textile Mills 201403 6.31 9.23 5.54 3.69 1.80 0.02 1.88 1.88 1.88 2.98 0 S
Dhar Textile Mills 201406 6.31 8.95 8.56 0.01 0.40 1.25 0.02 -0.87 -0.87 -0.87 -1.38 0 S
Dhar Textile Mills 201409 6.31 7.86 7.46 0.40 1.24 0.02 -0.86 -0.86 -0.86 -1.36 0 S
Dhenu Buildcon India 201312 1.83 4.42 4.39 -0.11 -0.08 0.00 -0.08 0.02 -0.10 -0.10 -0.05 0 S
Dhenu Buildcon India 201403 1.83 3.50 3.61 0.17 0.06 0.06 0.06 0.06 0.03 0 S
Dhenu Buildcon India 201406 1.83 3.79 3.77 0.02 0.02 0.02 0.02 0.01 0 S
Dhenu Buildcon India 201409 1.83 4.22 4.22 0.02 0.02 0.00 0.02 0.02 0.01 0 S
Diamant Infrastructure 201312 7.04 20.27 18.37 0.00 1.90 0.86 0.87 0.16 0.08 0.08 0.08 0.02 0 S
Diamant Infrastructure 201403 7.04 12.18 12.35 0.25 0.07 0.79 0.71 -1.42 -0.46 -0.96 -0.96 -0.27 0 S
Diamant Infrastructure 201406 7.04 16.48 15.06 0.04 1.46 0.70 0.56 0.20 0.07 0.14 0.14 0.04 0 S
Diamant Infrastructure 201409 7.04 6.56 5.48 0.10 1.18 0.61 0.52 0.05 0.02 0.04 0.04 0.01 0 S
Diamond Power Infrastructure 201312 49.61 755.87 688.45 1.65 69.08 33.34 7.49 28.25 6.62 21.64 21.64 4.36 0 C
Diamond Power Infrastructure 201403 54.68 1179.40 1103.62 4.13 79.91 40.77 15.88 23.26 -0.90 24.17 24.17 4.42 0 C
Diamond Power Infrastructure 201406 54.00 805.04 714.78 1.90 92.17 29.81 14.72 47.64 11.17 36.47 36.47 6.75 0 C
Diamond Power Infrastructure 201409 54.00 895.58 801.28 1.60 95.90 29.26 15.70 50.94 10.62 40.32 40.32 7.50 0 C

Co_Name Year Equity N.Sale O.O.I T. Exp O.I PBIDT Int. Dep. PBT T.Tax PAT A.PAT EPS Div (%)
Exp
ecte
d R
esu
lts
on
14
Feb
ruar
y 20
15
Diligent Industries 201312 11.44 1.88 0.44 2.01 0.31 0.49 0.14 -0.33 -0.33 -0.33 -0.29 0 S
Diligent Industries 201403 11.44 19.73 0.15 18.08 0.01 1.81 0.51 0.40 0.89 -0.32 1.21 1.21 1.06 0 S
Diligent Industries 201406 11.44 17.79 16.78 0.07 1.08 0.65 0.12 0.31 0.10 0.21 0.21 0.19 0 S
Diligent Industries 201409 11.44 1.32 1.58 0.04 -0.22 0.57 0.12 -0.91 -0.91 -0.91 -0.80 0 S
Dolphin Medical Services 201312 15.10 0.18 0.20 -0.01 0.01 0.18 -0.20 -0.20 -0.20 -0.13 0 C
Dolphin Medical Services 201403 15.10 0.22 0.26 -0.04 0.01 0.18 -0.23 0.00 -0.24 -0.24 -0.16 0 C
Dolphin Medical Services 201406 15.10 0.12 0.15 0.00 -0.03 0.01 0.17 -0.21 -0.21 -0.21 -0.14 0 C
Dolphin Medical Services 201409 15.10 0.09 0.11 -0.01 0.01 0.17 -0.20 -0.20 -0.20 -0.13 0 C
Donear Industries 201312 10.40 120.56 1.32 109.97 1.93 13.83 8.45 5.66 -0.28 -0.02 -0.27 -0.27 -0.05 10 S
Donear Industries 201403 10.40 126.23 1.59 114.57 1.65 14.89 6.33 5.76 2.79 0.34 2.45 2.45 0.47 10 S
Donear Industries 201406 10.40 127.15 1.54 114.87 1.30 15.12 7.64 5.83 3.32 -0.64 3.96 3.96 0.76 10 S
Donear Industries 201409 10.40 121.71 1.16 109.85 2.11 15.14 7.79 5.93 1.42 0.35 1.07 1.07 0.21 10 S
Dr. Datasons Labs 201312 13.89 150.57 129.99 -0.01 20.57 12.67 5.15 2.75 0.89 1.86 1.86 1.34 0 C
Dr. Datasons Labs 201403 31.66 20.80 22.12 7.83 6.51 10.29 5.04 -8.82 -2.67 -6.16 -6.16 -1.70 0 C
Dr. Datasons Labs 201406 53.37 201.44 191.41 10.03 8.69 1.25 0.09 0.03 0.06 0.06 0.02 0 C
Dr. Datasons Labs 201409 53.37 114.03 108.43 4.37 9.97 8.68 1.26 0.03 0.01 0.02 0.02 0 C
Dynacons Systems & Solutions 201312 5.92 17.75 0.12 16.91 0.96 0.46 0.30 0.20 0.03 0.17 0.17 0.16 0 S
Dynacons Systems & Solutions 201403 5.92 18.34 0.10 17.31 1.13 0.53 0.34 0.27 0.16 0.11 0.11 0.19 0 S
Dynacons Systems & Solutions 201406 5.92 22.55 0.05 21.68 0.92 0.44 0.28 0.21 0.05 0.16 0.16 0.28 0 S
Dynacons Systems & Solutions 201409 5.92 29.40 0.09 28.41 1.08 0.48 0.30 0.31 0.06 0.25 0.25 0.42 0 S
Dynamatic Technologies 201312 5.42 396.00 3.90 356.61 1.31 44.60 26.17 12.70 5.73 1.80 3.92 3.92 7.24 0 C
Dynamatic Technologies 201403 5.54 426.56 3.88 387.85 12.23 54.82 25.94 12.79 16.09 2.88 13.21 13.21 24.39 0 C
Dynamatic Technologies 201406 5.76 421.70 3.26 378.66 1.13 47.43 21.36 12.20 -8.68 2.33 -11.01 -11.01 -19.64 0 C
Dynamatic Technologies 201409 6.04 427.02 4.88 394.49 1.05 38.46 21.29 12.74 46.08 12.03 34.05 34.05 56.75 0 C
Dynamic Industries 201312 3.03 28.14 0.06 25.90 0.01 2.31 0.34 0.18 1.79 0.63 1.16 1.16 3.84 10 C
Dynamic Industries 201403 3.03 35.12 0.05 32.21 0.08 3.04 0.41 0.17 2.46 0.63 1.83 1.83 6.05 10 C
Dynamic Industries 201406 3.03 38.41 0.05 35.75 0.68 3.40 0.56 0.23 2.61 0.85 1.76 1.76 5.80 10 C
Dynamic Industries 201409 3.03 13.98 0.03 12.84 0.22 1.39 0.45 0.23 0.71 0.28 0.43 0.43 1.43 10 C
Dynemic Products 201312 11.33 30.43 0.41 24.59 0.03 6.28 0.32 0.45 5.51 1.73 3.78 3.78 3.34 15 C
Dynemic Products 201403 11.33 30.95 1.76 28.11 0.36 4.96 0.37 0.46 4.13 1.66 2.47 2.47 2.18 15 C
Dynemic Products 201406 11.33 30.06 0.40 26.01 0.02 4.47 0.47 0.64 3.35 1.16 2.19 2.19 1.94 15 C
Dynemic Products 201409 11.33 33.27 1.09 28.96 0.10 5.49 0.47 0.68 4.34 1.39 2.94 2.94 2.60 15 C
Easun Reyrolle 201312 4.16 53.20 0.53 49.40 0.01 4.34 6.29 2.03 -5.09 -5.09 -5.09 -2.45 0 C
Easun Reyrolle 201403 4.16 36.36 0.47 39.88 0.03 -3.02 10.01 1.99 -16.08 -16.08 -16.08 -7.73 0 C
Easun Reyrolle 201406 6.16 23.10 5.68 26.30 2.48 4.75 1.91 -5.09 -5.09 -5.09 -2.44 0 C
Easun Reyrolle 201409 6.16 17.52 0.78 16.54 1.76 7.39 1.89 -9.10 -9.10 -9.10 -2.96 0 C

Co_Name Year Equity N.Sale O.O.I T. Exp O.I PBIDT Int. Dep. PBT T.Tax PAT A.PAT EPS Div (%)
Exp
ecte
d R
esu
lts
on
14
Feb
ruar
y 20
15
Eco Recycling 201312 17.54 6.17 0.23 6.87 0.91 0.44 0.21 0.07 0.16 0.16 0.16 0.09 0 S
Eco Recycling 201403 17.54 11.87 0.13 12.29 0.70 0.40 0.25 0.07 0.09 0.09 0.09 0.05 0 S
Eco Recycling 201406 17.54 6.96 0.22 6.97 0.17 0.38 0.22 0.07 0.09 0.09 0.09 0.05 0 S
Eco Recycling 201409 17.54 5.66 0.18 5.39 0.27 0.73 0.22 0.07 0.43 0.43 0.43 0.25 0 S
Ecoboard Industries 201312 17.83 7.90 8.08 0.15 -0.03 0.98 1.04 -2.06 -2.06 -2.06 -1.15 0 S
Ecoboard Industries 201403 17.83 6.81 6.67 0.32 0.45 1.50 1.06 -2.11 -2.11 -2.11 -1.18 0 S
Ecoboard Industries 201406 17.83 4.00 3.89 0.24 0.36 1.03 1.05 -1.72 -1.72 -1.72 -0.96 0 S
Ecoboard Industries 201409 17.83 3.20 4.15 0.57 -0.37 1.07 1.05 -2.49 -2.49 -2.49 -1.40 0 S
Eins Edutech 201312 14.38 0.03 0.03 0.00 0.00 0.00 0.00 0.00 0.00 0 S
Eins Edutech 201403 14.38 0.03 0.05 0.00 -0.02 -0.04 -0.04 -0.04 -0.03 0 S
Eins Edutech 201406 14.38 0.09 0.04 0.05 0.05 0.02 0.04 0.04 0.02 0 S
Eins Edutech 201409 14.38 0.02 0.01 0.00 0.01 0.00 0.01 0.00 0.00 0.00 0 S
Emmbi Industries 201312 17.69 40.34 0.30 36.67 0.02 3.99 1.76 0.73 1.49 0.38 1.11 1.11 0.63 3 S
Emmbi Industries 201403 17.69 46.83 0.04 42.02 0.02 4.87 2.00 0.76 2.12 0.70 1.42 1.42 0.80 3 S
Emmbi Industries 201406 17.69 38.52 0.36 35.30 0.01 3.59 1.54 0.91 1.15 0.36 0.79 0.79 0.45 3 S
Emmbi Industries 201409 17.69 43.61 0.07 40.00 0.02 3.70 2.09 0.56 1.05 0.31 0.74 0.74 0.42 3 S
Emmsons International 201312 12.00 302.77 8.39 291.76 2.30 21.71 18.45 0.18 3.07 0.52 2.55 2.55 2.12 0 C
Emmsons International 201403 12.00 360.23 15.43 363.73 3.22 15.16 24.42 0.25 -9.21 -2.59 -6.62 -6.62 -5.52 0 C
Emmsons International 201406 12.00 390.89 6.12 381.62 3.16 18.55 16.77 0.28 1.50 0.29 1.21 1.21 1.01 0 C
Emmsons International 201409 12.00 113.29 1.65 113.92 3.21 4.23 20.06 0.28 -16.11 -0.38 -15.73 -15.73 -13.11 0 C
Ennore Coke 201312 15.50 128.65 137.15 4.32 -4.17 4.18 3.77 -12.13 -12.13 -12.13 -7.82 0 S
Ennore Coke 201403 15.50 183.56 206.35 26.35 3.56 4.94 3.65 -5.03 0.86 -5.89 -5.89 -3.80 0 S
Ennore Coke 201406 15.50 79.75 91.89 4.44 -7.70 3.84 3.16 -14.73 -14.73 -14.73 -9.50 0 S
Ennore Coke 201409 15.50 58.03 76.15 4.69 -13.43 3.53 3.26 -20.21 -20.21 -20.21 -13.04 0 S
Eon Electronic 201312 8.03 31.23 35.59 1.21 -3.15 1.44 0.78 -5.37 -0.57 -4.80 -4.80 -2.99 0 S
Eon Electronic 201403 8.03 33.33 38.33 0.92 -4.08 1.79 0.79 -6.66 -0.03 -6.62 -6.62 -4.13 0 S
Eon Electronic 201406 8.03 30.48 33.30 1.45 -1.38 1.85 0.52 -0.15 -0.08 -0.07 -0.07 -0.04 0 S
Eon Electronic 201409 8.03 31.52 35.36 1.70 -2.14 1.95 0.53 -4.62 -0.07 -4.55 -4.55 -2.84 0 S
Epic Energy 201312 6.71 10.82 10.14 0.68 0.01 0.40 0.26 0.08 0.18 0.18 0.27 0 C
Epic Energy 201403 6.71 11.04 11.05 -0.01 0.01 0.36 -0.38 -0.15 -0.23 -0.23 -0.34 0 C
Epic Energy 201406 6.71 4.11 3.67 0.44 0.01 0.42 0.02 0.00 0.01 0.01 0.02 0 C
Epic Energy 201409 6.71 4.49 4.14 0.35 0.00 0.32 0.02 0.00 0.02 0.02 0.02 0 C
Era Infra Engineering 201312 36.37 578.38 545.01 3.01 36.38 217.37 32.73 -213.72 -78.53 -123.93 -135.18 -6.82 0 C
Era Infra Engineering 201403 36.37 341.64 327.23 4.23 18.64 140.96 37.63 -390.24 -143.05 -247.19 -247.19 -13.59 0 C
Era Infra Engineering 201406 36.37 370.26 334.93 3.07 38.40 155.22 49.62 -167.10 -167.10 -167.10 -9.19 0 C
Era Infra Engineering 201409 36.37 360.48 356.45 1.55 5.57 155.24 50.14 -208.94 -208.94 -208.94 -11.49 0 C

Co_Name Year Equity N.Sale O.O.I T. Exp O.I PBIDT Int. Dep. PBT T.Tax PAT A.PAT EPS Div (%)
Exp
ecte
d R
esu
lts
on
14
Feb
ruar
y 20
15
Euro Ceramics 201312 28.58 21.02 26.60 0.12 -5.46 0.22 7.43 -13.12 -13.12 -13.12 -4.59 0 C
Euro Ceramics 201403 33.74 12.57 12.30 0.11 0.38 0.06 7.20 -6.88 -6.88 -6.88 -2.56 0 C
Euro Ceramics 201406 33.74 10.82 10.85 0.07 0.04 0.19 9.81 -9.96 -9.96 -9.96 -2.95 0 C
Euro Ceramics 201409 33.74 10.27 10.13 0.01 0.16 0.27 9.91 -44.12 -44.12 -44.12 -13.08 0 C
Euro Multivision 201312 23.80 2.84 0.01 3.29 0.19 -0.25 0.04 4.82 -5.11 -5.11 -5.11 -2.14 0 S
Euro Multivision 201403 23.80 3.94 0.44 4.38 0.16 0.17 0.01 4.51 -4.35 -4.35 -4.35 -1.83 0 S
Euro Multivision 201406 23.80 2.76 0.18 1.58 0.12 1.47 0.00 4.85 -3.37 -3.37 -3.37 -1.42 0 S
Euro Multivision 201409 23.80 4.29 0.07 4.60 0.12 -0.12 4.27 -4.39 -4.39 -4.39 -1.84 0 S
Eurotex Industries & Exports 201312 8.74 84.15 4.97 82.95 0.00 6.17 2.29 2.43 1.46 1.99 -0.53 -0.53 -0.60 5 S
Eurotex Industries & Exports 201403 8.74 97.32 4.86 95.20 0.13 7.12 2.38 2.36 2.38 1.02 1.36 1.36 1.55 5 S
Eurotex Industries & Exports 201406 8.74 68.16 3.49 66.95 0.02 4.72 2.60 1.16 0.96 0.35 0.61 0.61 0.70 5 S
Eurotex Industries & Exports 201409 8.74 61.64 2.17 63.85 0.51 0.46 2.14 1.15 -2.84 -0.21 -2.63 -2.63 -3.00 5 S
Excel Castronics 201312 8.14 1.32 0.15 1.35 0.12 0.12 0.12 0.12 0.15 0 S
Excel Castronics 201403 8.14 2.04 0.00 2.05 0.08 0.06 0.01 0.05 -0.41 0.45 0.45 0.55 0 S
Excel Castronics 201406 8.14 6.97 0.03 7.08 -0.08 -0.08 -0.08 -0.08 0 S
Excel Castronics 201409 8.14 9.75 0.01 9.47 0.29 0.29 0.29 0.29 0.36 0 S
Facor Steels 201312 20.65 25.53 0.32 28.45 0.06 -2.54 2.17 1.34 -6.05 -6.05 -6.05 -0.29 0 S
Facor Steels 201403 20.65 32.36 0.49 36.46 0.13 -3.48 2.64 1.34 -7.46 -7.46 -7.46 -0.36 0 S
Facor Steels 201406 20.65 20.66 0.29 28.26 0.28 -7.03 2.22 1.02 -10.26 -10.26 -10.26 -0.50 0 S
Facor Steels 201409 20.65 8.78 0.01 12.35 0.04 -3.52 2.22 1.04 -6.78 -6.78 -6.78 -0.33 0 S
FE India 201312 8.20 269.17 0.02 264.24 0.19 5.15 3.78 0.15 1.22 0.43 0.79 0.79 0.96 0 C
FE India 201403 8.20 251.61 0.16 246.15 1.04 6.66 4.07 0.14 2.44 0.79 1.65 1.65 2.01 0 C
FE India 201406 8.20 224.76 0.46 219.02 0.24 6.44 4.48 0.15 2.21 0.72 1.49 1.49 1.82 0 C
FE India 201409 8.20 189.65 0.26 184.64 0.00 5.27 3.69 0.15 1.43 0.47 0.97 0.97 1.18 0 C
Finaventure Capital 201312 10.57 0.05 -0.05 0.65 -0.70 -0.70 -0.70 -0.66 0 S
Finaventure Capital 201403 10.57 -5.93 0.04 3.83 -2.14 -2.14 -2.14 -2.14 0 S
Finaventure Capital 201406 10.57 -1.07 0.08 -1.15 0.00 -1.15 -1.15 -1.15 -0.11 0 S
Finaventure Capital 201409 10.57 -19.53 0.06 -19.59 0.00 -19.60 -19.60 -19.60 0 S
Fine-Line Circuits 201312 4.83 5.91 5.68 0.02 0.24 0.05 0.13 0.07 0.01 0.06 0.06 0.12 0 S
Fine-Line Circuits 201403 4.83 6.12 5.94 0.07 0.25 0.05 0.11 0.08 0.01 0.08 0.08 0.16 0 S
Fine-Line Circuits 201406 4.83 6.12 5.75 0.01 0.37 0.06 0.12 0.19 0.00 0.19 0.19 0.39 0 S
Fine-Line Circuits 201409 4.83 5.57 5.40 0.01 0.18 0.04 0.11 0.03 -0.05 0.07 0.07 0.15 0 S
Fineotex Chemical 201312 11.23 13.99 0.07 12.97 0.59 1.68 0.09 0.05 1.53 0.36 1.18 1.18 1.05 5 C
Fineotex Chemical 201403 11.23 15.32 0.04 13.69 1.21 2.88 0.08 0.05 2.75 0.83 1.92 1.92 1.71 5 C
Fineotex Chemical 201406 11.23 15.83 0.04 13.81 0.55 2.60 0.06 0.12 2.43 0.76 1.67 1.67 1.49 5 C
Fineotex Chemical 201409 11.23 16.79 0.05 14.76 1.58 3.66 0.06 0.11 3.49 0.73 2.76 2.76 2.45 5 C

Co_Name Year Equity N.Sale O.O.I T. Exp O.I PBIDT Int. Dep. PBT T.Tax PAT A.PAT EPS Div (%)
Exp
ecte
d R
esu
lts
on
14
Feb
ruar
y 20
15
First Financial Services 201312 8.08 0.03 0.13 0.23 -0.07 0.00 -0.08 -0.08 -0.08 0 S
First Financial Services 201403 8.08 0.56 0.37 0.75 0.18 0.01 0.17 0.02 0.15 0.15 0.02 0 S
First Financial Services 201406 8.08 0.12 0.04 0.08 0.00 0.08 0.08 0.08 0.01 0 S
First Financial Services 201409 8.08 3.00 0.08 3.02 0.00 0.05 0.00 0.05 0.00 0.05 0.05 0.01 0 S
Firstobject Technologies 201312 10.40 11.54 12.72 -1.19 1.11 -2.29 -2.29 -2.29 -2.20 0 S
Firstobject Technologies 201403 10.40 7.25 7.64 0.62 0.23 0.98 -0.75 -0.75 -0.75 -0.72 0 S
Firstobject Technologies 201406 10.40 8.79 6.67 2.11 1.15 0.07 0.01 0.05 0.05 0.05 0 S
Firstobject Technologies 201409 10.40 9.22 7.52 1.70 1.25 0.07 0.01 0.06 0.06 0.05 0 S
Fischer Chemic 201312 3.44 0.07 0.03 0.04 0.04 0.04 0.04 0.01 0 S
Fischer Chemic 201403 3.44 0.03 -0.03 -0.03 -0.03 -0.03 -0.09 0 S
Fischer Chemic 201406 3.44 0.02 0.02 0.00 0.00 0.00 0.00 0 S
Fischer Chemic 201409 3.44 0.02 0.02 0.00 0.00 0.00 0.00 0 S
Foods & Inns 201312 1.45 66.31 2.60 59.81 4.58 13.67 5.68 1.12 6.87 -0.23 7.10 7.10 48.94 18 C
Foods & Inns 201403 1.45 84.41 3.92 76.79 3.89 15.43 5.47 1.12 8.85 0.79 8.06 8.06 55.53 18 C
Foods & Inns 201406 1.45 89.00 2.73 80.50 1.79 13.02 5.72 2.92 4.38 1.20 3.18 3.18 21.90 18 C
Foods & Inns 201409 1.45 103.27 3.47 93.82 2.29 15.21 4.80 1.39 9.02 3.14 5.88 5.88 40.52 18 C
Frontier Springs 201312 3.96 8.82 8.08 0.03 0.77 0.22 0.25 0.30 0.11 0.20 0.20 0.50 0 S
Frontier Springs 201403 3.96 11.50 9.72 0.03 1.80 0.22 0.30 1.28 0.23 1.06 1.06 2.69 0 S
Frontier Springs 201406 3.96 6.92 6.68 0.03 0.27 0.20 0.41 -0.34 0.15 -0.49 -0.49 -1.25 0 S
Frontier Springs 201409 3.96 8.13 7.92 0.12 0.33 0.22 0.32 -0.21 -0.03 -0.18 -0.18 -0.46 0 S
Galaxy Bearings 201312 3.18 9.47 0.63 8.66 1.43 0.36 0.12 0.95 0.31 0.64 0.64 2.02 0 S
Galaxy Bearings 201403 3.18 14.98 0.63 13.90 1.70 0.43 0.11 1.17 0.15 1.01 1.01 3.19 0 S
Galaxy Bearings 201406 3.18 9.51 0.13 8.51 1.13 0.47 0.16 0.50 0.24 0.26 0.26 0.83 0 S
Galaxy Bearings 201409 3.18 11.06 0.11 9.79 1.39 0.47 0.17 0.75 0.28 0.47 0.47 1.48 0 S
Gammon Infrastructure Projects 201312 147.62 134.71 4.05 50.45 1.53 89.85 72.00 37.77 -19.91 0.01 -19.92 -20.43 -0.28 0 C
Gammon Infrastructure Projects 201403 147.62 205.70 5.51 62.66 1.53 150.07 66.90 82.25 -37.06 1.75 -38.80 -39.25 -0.53 0 C
Gammon Infrastructure Projects 201406 147.62 145.10 5.54 63.58 5.87 92.93 70.95 42.82 -20.84 -0.05 -20.79 -20.60 -0.28 0 C
Gammon Infrastructure Projects 201409 188.45 173.48 6.69 73.74 2.21 108.64 66.78 43.18 -1.32 -22.96 21.64 20.91 0.28 0 C
Ganga Papers India 201312 10.79 16.56 0.03 15.34 0.07 1.31 0.81 0.13 0.38 0.38 0.38 0.38 0 S
Ganga Papers India 201403 10.79 17.33 0.03 16.52 -0.04 0.80 0.55 0.13 0.12 0.02 0.10 0.10 0.10 0 S
Ganga Papers India 201406 10.79 17.19 0.02 16.55 0.07 0.74 0.44 0.14 0.16 0.16 0.16 0.15 0 S
Ganga Papers India 201409 10.79 19.17 0.04 18.67 0.07 0.61 0.41 0.14 0.06 0.06 0.06 0.05 0 S
Ganon Trading & Finance Company 201312 9.33 0.01 0.02 0.01 0.01 0.00 0.00 0.00 0 S
Ganon Trading & Finance Company 201403 9.33 47.34 47.29 0.05 0.05 0.03 0.02 0.02 0.02 0 S
Ganon Trading & Finance Company 201406 9.33 0.02 -0.02 -0.02 -0.02 -0.02 0 S
Ganon Trading & Finance Company 201409 9.33 13.10 13.21 -0.12 -0.12 -0.12 -0.12 -0.12 0 S

Co_Name Year Equity N.Sale O.O.I T. Exp O.I PBIDT Int. Dep. PBT T.Tax PAT A.PAT EPS Div (%)
Exp
ecte
d R
esu
lts
on
14
Feb
ruar
y 20
15
Garg Furnace 201312 4.01 31.68 29.29 2.39 1.71 0.46 0.22 0.12 0.10 0.10 0.25 0 S
Garg Furnace 201403 4.01 50.06 47.87 0.85 3.03 2.59 0.18 0.26 -0.11 0.37 0.37 0.91 0 S
Garg Furnace 201406 4.01 35.44 33.02 0.01 2.43 1.96 0.31 0.16 0.05 0.12 0.12 0.29 0 S
Garg Furnace 201409 4.01 30.13 27.61 0.00 2.52 1.80 0.30 0.43 0.35 0.08 0.08 0.20 0 S
Gayatri Projects 201312 30.23 420.43 1.18 369.71 0.93 52.83 41.87 7.64 3.32 1.70 1.62 1.62 0.54 20 C
Gayatri Projects 201403 30.23 496.03 2.48 417.72 0.84 81.63 42.11 7.17 32.36 16.33 16.03 16.03 5.30 20 C
Gayatri Projects 201406 30.23 340.98 1.21 291.86 0.23 50.56 38.94 7.74 3.89 1.65 2.24 2.24 0.74 20 C
Gayatri Projects 201409 30.23 303.55 2.77 261.19 0.45 45.58 37.32 7.24 1.02 -0.11 1.14 1.14 0.38 20 C
Gayatri Tissue & Papers 201312 1.50 1.94 1.73 0.21 0.21 0.07 0.15 0.15 0.97 0 S
Gayatri Tissue & Papers 201403 1.50 0.68 0.66 0.03 0.03 0.01 0.02 0.02 0.12 0 S
Gayatri Tissue & Papers 201406 1.50 1.15 1.06 0.09 0.09 0.03 0.06 0.06 0.43 0 S
Gayatri Tissue & Papers 201409 1.50 0.91 0.84 0.07 0.07 0.02 0.05 0.05 0.33 0 S
GEI Industrial Systems 201312 19.68 14.40 0.25 20.39 1.73 -4.00 13.63 1.98 -19.62 -19.62 -19.62 0 C
GEI Industrial Systems 201403 19.68 22.19 0.95 28.20 0.85 -4.21 3.88 1.24 -9.33 -9.33 -9.33 0 C
GEI Industrial Systems 201406 19.68 9.55 12.21 0.01 -2.65 7.84 1.80 -12.29 -12.29 -12.29 0 C
GEI Industrial Systems 201409 19.68 7.89 10.62 0.13 -2.61 8.58 1.80 -12.99 -12.99 -12.99 0 C
Gennex Laboratories 201312 12.65 10.20 0.01 9.35 0.10 0.96 0.10 0.21 0.66 0.66 0.66 0.05 0 S
Gennex Laboratories 201403 12.65 9.91 0.01 9.71 0.03 0.23 0.09 0.21 -0.06 -0.06 -0.06 -0.01 0 S
Gennex Laboratories 201406 12.65 7.69 0.01 7.17 0.02 0.56 0.07 0.15 0.35 0.35 0.35 0.03 0 S
Gennex Laboratories 201409 12.65 8.30 0.01 7.64 0.01 0.68 0.10 0.28 0.30 0.05 0.25 0.25 0.02 0 S
Genus Power Infrastructures 201312 25.66 175.62 -1.12 144.84 29.65 13.10 2.70 13.84 2.66 11.18 11.18 0.77 10 S
Genus Power Infrastructures 201403 25.66 212.25 3.87 197.58 0.53 19.06 0.55 2.67 15.85 -5.89 21.74 21.74 1.16 10 S
Genus Power Infrastructures 201406 25.67 169.42 1.59 148.12 1.21 24.10 5.87 2.64 15.59 3.28 12.32 12.32 0.48 10 S
Genus Power Infrastructures 201409 25.67 237.56 4.88 209.47 2.43 35.40 8.20 4.09 5.67 3.93 1.74 1.74 0.07 10 S
GIVO 201312 24.15 6.10 0.14 5.82 0.42 0.14 0.14 0.14 0.14 0.14 0.02 0 S
GIVO 201403 24.15 6.16 0.20 6.08 0.00 0.29 0.07 0.14 0.08 0.19 -0.11 -0.11 -0.01 0 S
GIVO 201406 24.15 4.50 0.18 4.26 0.42 0.12 0.15 0.15 0.15 0.15 0.02 0 S
GIVO 201409 24.15 6.58 0.17 6.43 0.32 0.15 0.15 0.02 0.02 0.02 0 S
GKB Ophthalmics 201312 4.15 8.99 8.36 0.05 0.68 0.62 0.29 -0.10 0.10 -0.20 -0.20 -0.47 0 C
GKB Ophthalmics 201403 4.15 8.94 6.45 0.52 3.02 0.90 0.31 1.39 1.68 -0.28 -0.28 -0.68 0 C
GKB Ophthalmics 201406 4.15 5.36 4.84 0.10 0.62 0.70 0.45 -0.53 -0.09 -0.44 -0.44 -1.06 0 C
GKB Ophthalmics 201409 4.15 5.80 0.02 6.59 0.31 -0.47 0.71 0.44 -1.61 -0.14 -1.48 -1.48 -3.55 0 C
GMR Infrastructure 201312 389.24 2625.04 13.31 2006.17 145.19 777.37 759.93 373.27 -355.83 58.05 -413.88 -441.09 -1.13 10 C
GMR Infrastructure 201403 389.24 2930.00 30.75 2269.45 106.06 797.36 918.51 437.69 1169.31 -15.05 1184.36 1170.18 3.01 10 C
GMR Infrastructure 201406 389.24 2699.38 32.01 2118.48 64.98 677.89 831.65 453.27 -625.15 26.50 -651.65 -593.20 -1.52 10 C
GMR Infrastructure 201409 436.13 2636.03 46.05 2096.54 101.14 686.68 845.04 474.67 -650.85 38.86 -689.71 -609.86 -1.41 10 C

Co_Name Year Equity N.Sale O.O.I T. Exp O.I PBIDT Int. Dep. PBT T.Tax PAT A.PAT EPS Div (%)
Exp
ecte
d R
esu
lts
on
14
Feb
ruar
y 20
15
Gopal Iron & Steels Company (Gujarat) 201312 4.92 6.56 0.30 5.33 0.01 1.54 0.94 0.28 0.32 0.03 0.29 0.29 0.58 0 S
Gopal Iron & Steels Company (Gujarat) 201403 4.92 17.94 0.19 16.90 0.00 1.24 0.92 0.28 0.03 0.05 -0.02 -0.02 -0.04 0 S
Gopal Iron & Steels Company (Gujarat) 201406 4.92 6.60 0.20 6.11 0.02 0.71 0.90 0.31 -0.50 0.01 -0.51 -0.51 -1.03 0 S
Gopal Iron & Steels Company (Gujarat) 201409 4.92 2.68 0.19 2.56 0.30 0.60 0.73 0.31 -0.43 0.01 -0.43 -0.43 -0.88 0 S
Goyal Associates 201312 5.08 0.10 0.03 0.17 -0.03 0.01 -0.04 -0.04 -0.04 -0.01 0 S
Goyal Associates 201403 5.08 0.03 0.02 0.02 0.01 0.01 0.01 -0.01 -0.01 0.00 0 S
Goyal Associates 201406 5.08 0.14 0.04 0.12 0.06 0.01 0.05 0.05 0.05 0.01 0 S
Goyal Associates 201409 5.08 0.06 0.03 0.03 0.01 0.02 0.02 0.02 0 S
GR Cables 201312 28.90 0.09 -0.09 0.36 -0.45 -0.45 -0.45 -0.16 0 S
GR Cables 201403 28.90 0.07 0.08 0.03 -0.02 -0.02 -0.02 -0.01 0 S
GR Cables 201406 28.90 0.06 -0.06 0.03 -0.08 -0.08 -0.08 -0.03 0 S
GR Cables 201409 28.90 0.06 -0.06 0.03 -0.08 -0.08 -0.08 -0.03 0 S
Grandma Trading & Agencies 201312 13.06 0.09 0.24 0.15 0.15 0.15 0.15 0.11 0 S
Grandma Trading & Agencies 201403 13.06 0.17 0.59 0.07 -0.36 -0.36 0.07 -0.42 -0.42 -0.32 0 S
Grandma Trading & Agencies 201406 13.06 0.09 0.18 0.10 0.10 0.00 0.10 0.10 0.07 0 S
Grandma Trading & Agencies 201409 13.06 0.07 0.23 0.19 0.03 0.03 0.03 0.03 0.02 0 S
GSL Nova Petrochemicals 201312 13.50 0.00 0.18 0.12 -0.05 2.44 0.94 -3.43 -3.43 -3.43 -1.27 0 S
GSL Nova Petrochemicals 201403 13.50 6.32 4.24 0.43 2.52 2.50 1.00 -0.97 -0.97 -0.97 -4.19 0 S
GSL Nova Petrochemicals 201406 13.50 0.44 -0.44 2.24 0.89 -3.57 -3.57 -3.57 -1.32 0 S
GSL Nova Petrochemicals 201409 13.50 1.38 1.54 0.49 0.33 2.55 0.89 -3.11 -3.11 -3.11 -1.15 0 S
Gujarat Apollo Industries 201312 16.58 10.59 0.14 13.35 2.67 0.04 1.55 0.32 -1.83 -1.83 -1.83 -1.10 25 C
Gujarat Apollo Industries 201403 15.94 17.50 0.01 24.77 3.35 -3.91 1.39 0.25 -5.54 -2.51 5.62 -3.03 3.53 25 C
Gujarat Apollo Industries 201406 15.15 11.85 0.20 13.85 3.69 1.89 2.06 0.33 -0.49 -0.49 -0.49 -0.32 25 C
Gujarat Apollo Industries 201409 15.16 16.83 0.71 18.13 5.41 4.82 2.49 0.48 1.86 1.86 1.86 1.23 25 C
Gujarat Metallic Coal & Coke 201312 19.81 37.97 37.33 0.03 0.68 0.85 0.00 -0.17 -0.17 -0.17 -0.85 0 C
Gujarat Metallic Coal & Coke 201403 19.81 13.70 11.90 0.02 1.82 1.10 0.00 0.71 0.01 0.71 0.71 3.56 0 C
Gujarat Metallic Coal & Coke 201406 19.81 15.15 14.61 0.00 0.54 0.46 0.00 0.08 0.08 0.08 0.38 0 C
Gujarat Metallic Coal & Coke 201409 19.81 160.95 161.04 0.12 0.03 0.34 -0.30 -0.30 -0.30 -1.54 0 C
Gujarat Natural Resources 201312 38.75 3.14 0.08 2.31 0.07 0.99 0.15 0.33 0.51 0.13 0.38 0.38 0.10 3 C
Gujarat Natural Resources 201403 38.75 3.13 0.46 0.71 3.36 6.24 0.79 1.73 3.72 -0.66 4.38 4.38 1.13 3 C
Gujarat Natural Resources 201406 38.75 4.46 0.56 2.05 0.92 3.89 1.54 0.71 1.64 0.34 1.30 1.30 0.34 3 C
Gujarat Natural Resources 201409 38.75 3.11 0.27 1.21 0.85 3.02 2.17 0.70 0.34 0.05 0.29 0.29 0.08 3 C
Gulshan Polyols 201312 4.22 82.41 0.20 69.77 0.27 13.10 1.12 3.55 8.45 3.09 5.36 5.36 6.35 50 S
Gulshan Polyols 201403 4.22 81.30 0.18 69.03 0.47 12.92 0.10 3.53 9.30 -0.61 9.90 9.90 10.59 50 S
Gulshan Polyols 201406 4.22 84.78 0.43 72.30 0.64 13.54 0.88 5.18 7.48 1.69 5.80 5.80 6.86 50 S
Gulshan Polyols 201409 4.22 103.10 1.15 92.90 0.70 12.05 0.80 5.25 6.00 1.05 4.94 4.94 5.85 50 S

Co_Name Year Equity N.Sale O.O.I T. Exp O.I PBIDT Int. Dep. PBT T.Tax PAT A.PAT EPS Div (%)
Exp
ecte
d R
esu
lts
on
14
Feb
ruar
y 20
15
Gupta Synthetics 201312 7.35 23.08 25.50 0.03 -2.40 4.68 1.66 -8.74 -8.74 -8.74 -11.88 0 S
Gupta Synthetics 201403 7.35 18.66 22.69 0.03 -4.00 4.73 1.67 -10.39 -10.39 -10.39 -14.13 0 S
Gupta Synthetics 201406 7.35 15.30 19.37 0.02 -4.06 4.60 1.66 -10.32 -10.32 -10.32 -14.03 0 S
Gupta Synthetics 201409 7.35 18.86 24.02 0.09 -5.06 4.64 1.66 -11.36 -11.36 -11.36 -15.81 0 S
GV Films 201312 368.63 1.32 2.29 0.03 -0.95 0.10 0.37 -1.42 -1.42 -1.42 0 C
GV Films 201403 368.63 1.30 2.45 0.15 -0.99 0.10 0.37 -1.46 -1.46 -1.46 0 C
GV Films 201406 368.63 1.26 2.44 0.05 -1.14 0.02 -1.16 -1.16 -1.16 0 C
GV Films 201409 368.63 1.36 1.37 0.04 0.03 0.30 0.02 -0.30 -0.30 -0.30 0 C
Hanung Toys & Textiles 201312 26.58 42.62 231.51 7.02 -181.87 57.28 2.94 -242.10 9.71 -251.81 -251.81 -94.74 0 C
Hanung Toys & Textiles 201403 26.58 39.43 116.43 7.85 -69.14 66.85 11.25 -147.24 -164.68 17.44 17.44 6.56 0 C
Hanung Toys & Textiles 201406 26.58 29.24 165.91 7.39 -129.28 43.92 11.20 -184.40 -52.85 -131.56 -131.56 -49.50 0 C
Hanung Toys & Textiles 201409 30.82 34.62 193.85 0.11 -159.12 61.46 11.21 -272.54 52.85 -325.38 -325.38 -105.57 0 C
Hartron Communications 201312 8.90 5.54 2.69 0.12 2.97 0.58 0.40 1.99 0.38 1.62 1.62 1.82 0 S
Hartron Communications 201403 8.90 5.97 4.77 0.16 1.36 0.66 0.37 0.33 -0.07 0.41 0.41 0.46 0 S
Hartron Communications 201406 8.90 5.93 6.10 0.11 -0.06 0.73 0.40 -1.18 -0.09 -1.09 -1.09 -1.23 0 S
Haryana Texprints (Overseas) 201312 5.00 15.68 0.15 14.74 0.09 1.17 0.52 0.26 0.40 0.05 0.36 0.36 0.07 0 S
Haryana Texprints (Overseas) 201403 5.00 18.87 0.59 18.15 0.09 1.40 0.50 0.27 0.63 0.17 0.46 0.46 0.09 0 S
Haryana Texprints (Overseas) 201406 5.00 12.35 0.11 11.87 0.02 0.62 0.53 0.23 -0.14 -0.14 -0.14 -0.03 0 S
Haryana Texprints (Overseas) 201409 5.00 10.59 0.03 10.02 0.02 0.62 0.49 0.21 -0.08 -0.08 -0.08 -0.02 0 S
HBL Power Systems 201312 25.30 345.29 315.00 2.49 32.78 18.87 9.92 4.58 1.58 3.00 3.00 0.12 20 S
HBL Power Systems 201403 25.30 320.16 316.84 9.31 12.63 18.50 8.47 -20.94 -3.52 -17.42 -17.42 -0.69 20 S
HBL Power Systems 201406 25.30 285.57 271.76 3.37 17.18 17.76 12.81 -17.94 -0.60 -17.34 -17.34 -0.69 20 S
HBL Power Systems 201409 25.30 377.64 338.54 -0.55 38.55 17.05 13.26 8.12 -0.59 8.71 8.71 0.34 20 S
HDFC Bank 201312 478.92 10590.68 2895.07 2148.27 3887.97 5955.91 3499.13 1173.43 2325.70 2325.70 9.80 343 C
HDFC Bank 201403 479.81 10788.56 3174.72 2001.42 3779.34 5835.92 3493.21 1166.69 2326.52 2326.52 9.70 343 C
HDFC Bank 201406 481.54 11220.08 3178.41 1850.57 3843.77 6048.47 3360.99 1127.95 2233.04 2233.04 9.30 343 C
HDFC Bank 201409 482.86 11847.63 3497.90 2047.10 4060.19 6336.64 3604.30 1222.84 2381.46 2381.46 9.90 343 C
High Ground Enterprise 201312 5.50 27.47 26.08 0.00 1.39 0.26 0.00 1.12 0.36 0.76 0.76 1.38 7 S
High Ground Enterprise 201403 5.50 23.58 20.50 0.02 3.10 0.33 0.01 2.76 0.89 1.88 1.88 3.41 7 S
High Ground Enterprise 201406 8.60 24.11 21.84 0.01 2.28 0.35 0.15 1.78 0.58 1.21 1.21 1.98 7 S
High Ground Enterprise 201409 8.60 52.96 48.71 0.26 4.50 0.48 0.35 3.68 1.20 2.48 2.48 2.88 7 S
High Street Filatex 201312 0.65 0.02 0.02 0.02 -0.02 -0.02 -0.02 -0.29 0 S
High Street Filatex 201403 0.65 0.09 0.01 0.00 0.08 0.02 0.06 0.06 0.06 0.95 0 S
High Street Filatex 201406 0.65 0.36 0.34 0.01 0.02 0.02 0.00 0.00 0.00 0.03 0 S
High Street Filatex 201409 0.65 0.51 0.46 0.04 0.02 0.03 0.03 0.03 0.38 0 S

Co_Name Year Equity N.Sale O.O.I T. Exp O.I PBIDT Int. Dep. PBT T.Tax PAT A.PAT EPS Div (%)
Exp
ecte
d R
esu
lts
on
14
Feb
ruar
y 20
15
Hind Industries 201312 8.64 17.03 13.67 0.27 3.62 2.29 0.72 0.62 0.12 0.50 0.50 0.57 0 C
Hind Industries 201403 8.64 38.01 35.03 0.95 3.93 2.78 0.57 0.58 0.36 0.22 0.22 0.25 0 C
Hind Industries 201406 8.64 21.33 18.28 0.38 3.43 2.30 0.68 0.45 0.13 0.32 0.32 0.37 0 C
Hind Industries 201409 8.64 18.83 15.34 0.08 3.57 2.47 0.68 0.42 0.12 0.30 0.30 0.34 0 C
Hindustan Oil Exploration Company 201312 130.51 17.00 7.32 2.13 11.81 2.61 24.22 -15.03 -15.03 -15.03 -1.15 0 C
Hindustan Oil Exploration Company 201403 130.51 13.23 50.52 3.68 -33.60 5.50 33.28 -72.39 43.64 -116.03 -116.03 -8.89 0 C
Hindustan Oil Exploration Company 201406 130.51 12.05 6.47 1.53 7.11 4.93 13.61 -11.43 -11.43 -11.43 -0.88 0 C
Hindustan Oil Exploration Company 201409 130.51 11.97 16.27 2.69 -1.61 5.91 16.72 -1085.55 -1085.55 -1085.55 -83.18 0 C
Hindusthan Safety Glass Industries 201312 3.06 0.01 0.01 0.00 0.00 -0.10 0.00 -0.01 0 S
Hindusthan Safety Glass Industries 201403 3.06 0.05 0.02 0.03 0.03 0.01 0.02 0.02 0.08 0 S
Hindusthan Safety Glass Industries 201406 3.06 0.01 0.03 0.02 -0.01 -0.01 -0.01 -0.04 0 S
Hindusthan Safety Glass Industries 201409 3.06 0.00 0.03 -0.02 -0.02 -0.02 -0.02 -0.08 0 S
Housing Development & Infrastructure 201312 419.00 76.47 2.74 -119.62 10.42 209.25 185.21 18.49 5.55 0.46 5.09 5.10 0.09 0 C
Housing Development & Infrastructure 201403 419.04 205.30 3.62 -9.40 50.35 268.67 169.36 19.92 79.39 -34.30 113.69 113.52 2.71 0 C
Housing Development & Infrastructure 201406 419.00 245.22 4.65 10.89 6.26 245.24 164.30 5.03 75.91 19.21 56.70 56.69 1.35 0 C
Housing Development & Infrastructure 201409 419.00 259.55 5.78 76.09 39.51 228.75 137.00 7.42 84.33 26.48 57.85 57.87 1.38 0 C
Housing Development Finance Corporation 201312 311.85 6344.07 3696.79 3782.14 12.12 6270.84 4228.19 12.32 2030.33 557.14 1473.19 1934.85 12.41 700 C
Housing Development Finance Corporation 201403 312.10 7119.25 5147.22 5141.60 29.55 7154.42 4308.68 12.65 2833.09 764.90 2068.19 2414.70 15.44 700 C
Housing Development Finance Corporation 201406 313.39 9553.34 486.06 3422.57 16.67 6633.50 4496.56 -4.46 2141.40 657.32 1484.08 1872.90 11.99 700 C
Housing Development Finance Corporation 201409 313.77 10931.91 676.52 4628.90 35.65 7015.18 4657.41 16.22 2341.55 721.77 1619.78 2064.36 13.16 700 C
IEC Education 201312 15.26 2.02 0.00 1.82 0.00 0.21 0.01 0.15 0.05 0.05 0.00 0.00 0 C
IEC Education 201403 15.26 0.86 0.01 0.68 -0.12 0.06 0.01 0.15 -0.10 -0.04 -0.03 -0.03 -0.02 0 C
IEC Education 201406 15.26 1.63 0.00 1.46 0.01 0.18 0.00 0.15 0.03 0.02 0.01 0.01 0 C
IEC Education 201409 15.26 0.45 0.00 0.30 0.01 0.16 0.00 0.15 0.01 0.02 -0.01 -0.01 0 C
IFGL Refractories 201312 34.61 194.74 169.03 2.13 27.84 1.91 4.61 21.32 6.79 14.53 14.26 4.06 18 C
IFGL Refractories 201403 34.61 200.33 172.11 1.17 29.39 1.56 4.28 23.55 6.96 16.59 15.75 4.49 18 C
IFGL Refractories 201406 34.61 203.90 174.14 1.25 31.01 1.44 3.68 25.89 6.73 19.16 18.44 5.27 18 C
IFGL Refractories 201409 34.61 198.38 174.73 1.42 25.07 1.59 3.64 19.84 6.03 13.81 13.89 3.88 18 C
Impex Ferro Tech 201312 81.60 167.97 2.43 173.42 1.25 -1.77 8.81 2.97 -13.55 -3.81 -9.74 -9.74 -1.16 0 S
Impex Ferro Tech 201403 81.60 199.42 2.06 221.04 0.56 -19.00 9.80 2.90 -31.70 0.04 -31.74 -31.74 -3.89 0 S
Impex Ferro Tech 201406 81.60 123.58 1.79 131.48 0.50 -5.61 9.25 2.27 -17.13 5.80 -22.93 -22.93 -3.12 0 S
Impex Ferro Tech 201409 81.60 165.03 2.99 180.41 1.62 -10.77 8.45 2.18 -21.40 -5.80 -15.60 -15.60 -2.12 0 S
In House Productions 201312 4.75 0.00 0.23 0.00 -0.22 0.01 -0.23 -0.23 -0.23 -0.49 0 S
In House Productions 201403 4.75 0.00 13.10 0.01 -13.09 0.00 0.01 -13.10 -13.10 -13.10 -27.56 0 S
In House Productions 201406 4.75 0.11 0.16 0.00 -0.05 0.00 0.01 -0.06 0.00 -0.06 -0.06 -0.12 0 S
In House Productions 201409 4.75 0.00 0.15 0.00 -0.15 0.00 0.01 -0.16 -0.16 -0.16 -0.34 0 S
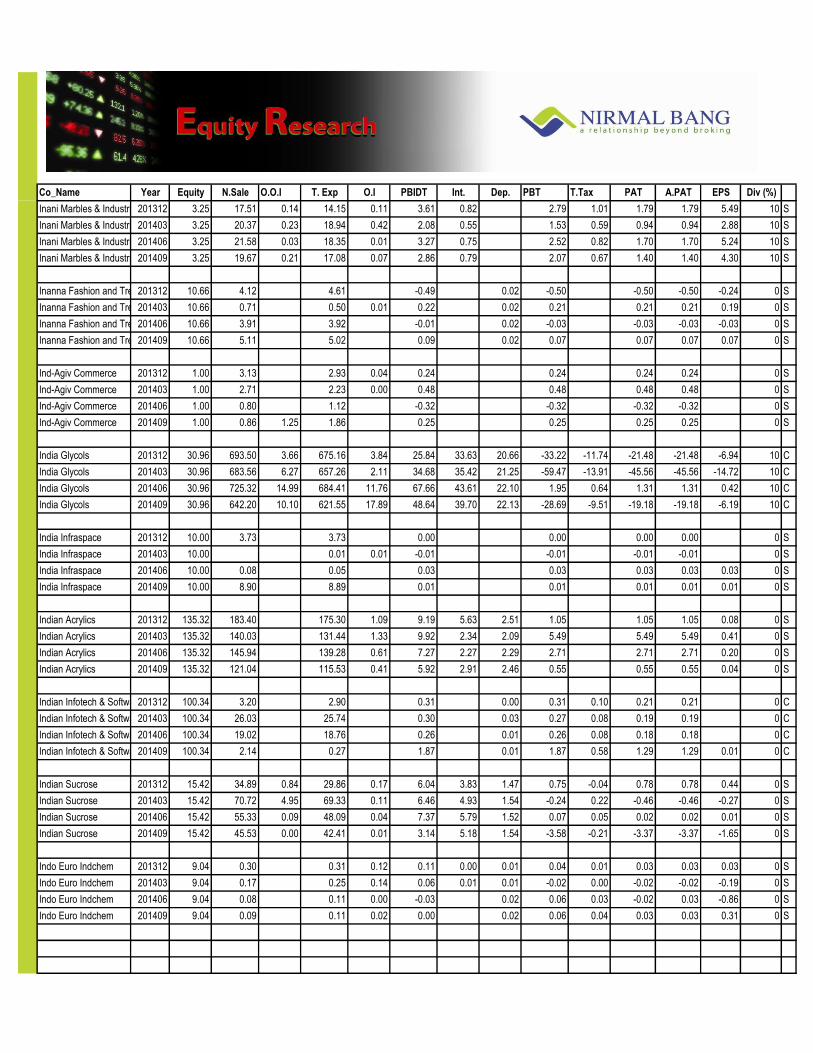
Co_Name Year Equity N.Sale O.O.I T. Exp O.I PBIDT Int. Dep. PBT T.Tax PAT A.PAT EPS Div (%)
Exp
ecte
d R
esu
lts
on
14
Feb
ruar
y 20
15
Inani Marbles & Industries 201312 3.25 17.51 0.14 14.15 0.11 3.61 0.82 2.79 1.01 1.79 1.79 5.49 10 S
Inani Marbles & Industries 201403 3.25 20.37 0.23 18.94 0.42 2.08 0.55 1.53 0.59 0.94 0.94 2.88 10 S
Inani Marbles & Industries 201406 3.25 21.58 0.03 18.35 0.01 3.27 0.75 2.52 0.82 1.70 1.70 5.24 10 S
Inani Marbles & Industries 201409 3.25 19.67 0.21 17.08 0.07 2.86 0.79 2.07 0.67 1.40 1.40 4.30 10 S
Inanna Fashion and Trends 201312 10.66 4.12 4.61 -0.49 0.02 -0.50 -0.50 -0.50 -0.24 0 S
Inanna Fashion and Trends 201403 10.66 0.71 0.50 0.01 0.22 0.02 0.21 0.21 0.21 0.19 0 S
Inanna Fashion and Trends 201406 10.66 3.91 3.92 -0.01 0.02 -0.03 -0.03 -0.03 -0.03 0 S
Inanna Fashion and Trends 201409 10.66 5.11 5.02 0.09 0.02 0.07 0.07 0.07 0.07 0 S
Ind-Agiv Commerce 201312 1.00 3.13 2.93 0.04 0.24 0.24 0.24 0.24 0 S
Ind-Agiv Commerce 201403 1.00 2.71 2.23 0.00 0.48 0.48 0.48 0.48 0 S
Ind-Agiv Commerce 201406 1.00 0.80 1.12 -0.32 -0.32 -0.32 -0.32 0 S
Ind-Agiv Commerce 201409 1.00 0.86 1.25 1.86 0.25 0.25 0.25 0.25 0 S
India Glycols 201312 30.96 693.50 3.66 675.16 3.84 25.84 33.63 20.66 -33.22 -11.74 -21.48 -21.48 -6.94 10 C
India Glycols 201403 30.96 683.56 6.27 657.26 2.11 34.68 35.42 21.25 -59.47 -13.91 -45.56 -45.56 -14.72 10 C
India Glycols 201406 30.96 725.32 14.99 684.41 11.76 67.66 43.61 22.10 1.95 0.64 1.31 1.31 0.42 10 C
India Glycols 201409 30.96 642.20 10.10 621.55 17.89 48.64 39.70 22.13 -28.69 -9.51 -19.18 -19.18 -6.19 10 C
India Infraspace 201312 10.00 3.73 3.73 0.00 0.00 0.00 0.00 0 S
India Infraspace 201403 10.00 0.01 0.01 -0.01 -0.01 -0.01 -0.01 0 S
India Infraspace 201406 10.00 0.08 0.05 0.03 0.03 0.03 0.03 0.03 0 S
India Infraspace 201409 10.00 8.90 8.89 0.01 0.01 0.01 0.01 0.01 0 S
Indian Acrylics 201312 135.32 183.40 175.30 1.09 9.19 5.63 2.51 1.05 1.05 1.05 0.08 0 S
Indian Acrylics 201403 135.32 140.03 131.44 1.33 9.92 2.34 2.09 5.49 5.49 5.49 0.41 0 S
Indian Acrylics 201406 135.32 145.94 139.28 0.61 7.27 2.27 2.29 2.71 2.71 2.71 0.20 0 S
Indian Acrylics 201409 135.32 121.04 115.53 0.41 5.92 2.91 2.46 0.55 0.55 0.55 0.04 0 S
Indian Infotech & Software 201312 100.34 3.20 2.90 0.31 0.00 0.31 0.10 0.21 0.21 0 C
Indian Infotech & Software 201403 100.34 26.03 25.74 0.30 0.03 0.27 0.08 0.19 0.19 0 C
Indian Infotech & Software 201406 100.34 19.02 18.76 0.26 0.01 0.26 0.08 0.18 0.18 0 C
Indian Infotech & Software 201409 100.34 2.14 0.27 1.87 0.01 1.87 0.58 1.29 1.29 0.01 0 C
Indian Sucrose 201312 15.42 34.89 0.84 29.86 0.17 6.04 3.83 1.47 0.75 -0.04 0.78 0.78 0.44 0 S
Indian Sucrose 201403 15.42 70.72 4.95 69.33 0.11 6.46 4.93 1.54 -0.24 0.22 -0.46 -0.46 -0.27 0 S
Indian Sucrose 201406 15.42 55.33 0.09 48.09 0.04 7.37 5.79 1.52 0.07 0.05 0.02 0.02 0.01 0 S
Indian Sucrose 201409 15.42 45.53 0.00 42.41 0.01 3.14 5.18 1.54 -3.58 -0.21 -3.37 -3.37 -1.65 0 S
Indo Euro Indchem 201312 9.04 0.30 0.31 0.12 0.11 0.00 0.01 0.04 0.01 0.03 0.03 0.03 0 S
Indo Euro Indchem 201403 9.04 0.17 0.25 0.14 0.06 0.01 0.01 -0.02 0.00 -0.02 -0.02 -0.19 0 S
Indo Euro Indchem 201406 9.04 0.08 0.11 0.00 -0.03 0.02 0.06 0.03 -0.02 0.03 -0.86 0 S
Indo Euro Indchem 201409 9.04 0.09 0.11 0.02 0.00 0.02 0.06 0.04 0.03 0.03 0.31 0 S

Co_Name Year Equity N.Sale O.O.I T. Exp O.I PBIDT Int. Dep. PBT T.Tax PAT A.PAT EPS Div (%)
Exp
ecte
d R
esu
lts
on
14
Feb
ruar
y 20
15
Infra Industries 201312 5.98 3.61 3.46 0.05 0.21 0.15 0.11 -0.05 -0.05 -0.05 -0.09 0 S
Infra Industries 201403 5.98 2.53 2.62 0.43 0.33 0.21 0.10 0.03 0.03 0.03 0.04 0 S
Infra Industries 201406 5.98 1.12 1.79 0.09 -0.58 0.14 0.11 -0.83 -0.83 -0.83 -1.38 0 S
Infra Industries 201409 5.98 1.04 1.26 0.01 -0.21 0.24 0.09 -0.54 -0.54 -0.54 -0.91 0 S
Infronics Systems 201312 7.93 1.09 0.02 0.33 0.77 0.37 0.88 -0.47 -0.15 -0.33 -0.33 -0.21 0 C
Infronics Systems 201403 7.93 3.78 0.16 3.25 0.69 0.36 0.89 -0.56 -0.03 -0.53 -0.53 -0.33 0 C
Infronics Systems 201406 7.93 1.38 0.02 0.46 0.94 0.45 0.74 -0.25 -0.02 -0.23 -0.23 -0.15 0 C
Infronics Systems 201409 7.93 0.78 0.02 5.42 -4.63 0.59 0.75 -5.97 0.02 -5.99 -5.99 -3.78 0 C
Innovative Tech Pack 201312 2.19 20.14 0.03 17.07 3.10 0.86 1.18 1.06 1.06 1.06 0.48 0 S
Innovative Tech Pack 201403 2.19 22.01 0.67 19.26 3.42 0.63 0.71 0.02 0.02 0.02 0.01 0 S
Innovative Tech Pack 201406 2.19 16.41 14.69 0.04 1.77 0.65 0.96 0.16 0.16 0.16 0.07 0 S
Innovative Tech Pack 201409 2.19 16.93 0.48 15.27 2.13 0.75 1.21 0.17 0.17 0.17 0.08 0 S
Innoventive Industries 201312 59.64 77.31 -0.83 108.52 2.05 -30.00 33.42 9.78 -73.20 -73.20 -73.20 -12.27 10 C
Innoventive Industries 201403 59.64 70.15 5.55 326.89 2.19 -249.01 22.85 6.08 -277.93 -5.80 -272.13 -272.13 -45.63 10 C
Innoventive Industries 201406 59.64 76.39 0.37 86.78 13.27 3.24 23.40 21.63 -41.79 -41.79 -41.79 -7.01 10 C
Innoventive Industries 201409 59.64 93.08 0.10 151.79 0.17 -58.45 71.52 15.09 -145.06 -145.06 -145.06 -24.32 10 C
Integrated Thermoplastics 201312 6.29 15.19 12.96 2.23 0.96 0.12 1.15 1.15 1.15 1.83 0 S
Integrated Thermoplastics 201403 6.29 5.13 6.29 0.15 -1.02 0.89 0.12 -2.02 -2.02 -2.02 -3.22 0 S
Integrated Thermoplastics 201406 6.29 6.05 6.51 0.03 -0.43 0.88 0.12 -1.42 -1.42 -1.42 -2.26 0 S
Integrated Thermoplastics 201409 6.29 3.04 3.87 0.03 -0.80 0.99 0.11 -1.90 -1.90 -1.90 -3.02 0 S
Intense Technologies 201312 3.83 12.04 8.16 0.58 4.47 0.37 4.10 4.10 4.10 2.14 0 S
Intense Technologies 201403 3.86 11.87 9.09 0.81 3.59 0.37 3.22 1.19 2.03 2.03 1.05 0 S
Intense Technologies 201406 3.86 8.74 8.29 0.56 1.01 0.28 0.73 0.73 0.73 0.38 0 S
Intense Technologies 201409 3.86 11.91 9.27 0.46 3.10 0.31 2.78 0.50 2.28 2.28 1.18 0 S
International Housing Finance Corporation 201312 16.33 0.01 -0.01 -0.01 -0.01 -0.01 0 S
International Housing Finance Corporation 201403 16.33 0.36 -0.36 -0.36 -0.36 -0.36 0 S
International Housing Finance Corporation 201406 16.33 0.02 -0.02 -0.02 -0.02 -0.02 -0.01 0 S
International Housing Finance Corporation 201409 16.33 0.02 -0.02 -0.02 -0.02 -0.02 0 S
ISC Udyog 201312 5.25 0.01 0.03 0.01 0.00 0.00 0.00 0.00 -0.01 0 S
ISC Udyog 201403 5.25 0.01 0.06 0.01 -0.04 0.06 -0.10 -0.01 -0.11 -0.11 -0.20 0 S
ISC Udyog 201406 5.25 0.06 0.05 0.01 0.02 0.02 0.02 0.02 0.04 0 S
ISC Udyog 201409 5.25 0.01 0.03 0.01 -0.01 -0.01 -0.01 -0.01 0.06 0 S
IST 201312 5.85 5.24 4.90 0.97 1.32 0.01 0.41 0.90 0.08 0.82 0.82 1.40 0 C
IST 201403 5.85 6.08 5.33 1.34 2.09 0.01 0.42 1.67 0.32 1.34 1.34 2.30 0 C
IST 201406 5.85 5.14 4.94 1.22 1.42 0.01 0.51 0.90 0.24 0.66 0.66 1.12 0 C
IST 201409 5.85 5.08 5.29 1.77 1.56 0.00 0.54 1.02 -0.13 1.15 1.15 1.98 0 C

Co_Name Year Equity N.Sale O.O.I T. Exp O.I PBIDT Int. Dep. PBT T.Tax PAT A.PAT EPS Div (%)
Exp
ecte
d R
esu
lts
on
14
Feb
ruar
y 20
15
ITL Industries 201312 3.25 8.72 7.51 0.00 1.21 0.67 0.16 0.38 0.15 0.23 0.23 0.71 5 C
ITL Industries 201403 3.25 15.35 14.03 0.21 1.53 0.40 0.32 0.82 0.28 0.54 0.54 1.65 5 C
ITL Industries 201406 3.25 9.49 8.07 0.01 1.44 0.73 0.22 0.49 0.15 0.34 0.34 1.05 5 C
ITL Industries 201409 3.25 13.71 12.56 0.00 1.16 0.65 0.24 0.28 0.09 0.19 0.19 0.57 5 C
Ivee Injectaa 201312 3.76 0.00 0.00 0.00 0.00 0.00 -0.01 0 S
Ivee Injectaa 201403 3.76 0.03 -0.03 -0.03 -0.03 -0.03 -0.08 0 S
Ivee Injectaa 201406 3.76 0.01 -0.01 -0.01 -0.01 -0.01 -0.04 0 S
Ivee Injectaa 201409 3.76 0.00 0.02 0.00 -0.02 0.00 -0.02 0.00 -0.02 -0.02 -0.05 0 S
Jagatjit Industries 201312 46.15 236.06 8.12 246.43 0.30 -1.95 7.15 4.55 -13.65 -13.65 -13.65 -3.13 0 C
Jagatjit Industries 201403 46.15 215.53 5.44 226.74 0.47 -5.30 7.55 4.55 -17.40 2.57 -19.97 -19.97 -4.58 0 C
Jagatjit Industries 201406 46.15 234.27 7.44 229.00 0.34 13.05 7.58 4.52 0.95 0.95 0.95 0.22 0 C
Jagatjit Industries 201409 46.15 189.63 6.75 194.75 4.53 6.16 7.38 2.54 -3.76 -3.76 -3.76 -0.86 0 C
Jaihind Projects 201312 9.76 68.66 0.19 52.29 0.54 17.11 16.20 2.80 -1.90 -0.54 -1.36 -1.36 -1.39 0 C
Jaihind Projects 201403 9.76 103.33 104.42 0.79 -0.31 10.53 2.77 -13.61 -2.53 -11.08 -11.08 -11.35 0 C
Jaihind Projects 201406 9.76 36.16 32.73 0.67 4.11 13.32 4.25 -13.46 -4.60 -8.86 -8.86 -9.08 0 C
Jaihind Projects 201409 9.76 19.17 8.34 22.90 0.68 5.30 12.07 4.18 -10.95 -2.37 -8.58 -8.58 -8.79 0 C
Jain Studios 201312 25.44 5.88 5.34 0.05 0.58 0.02 0.24 0.32 0.32 0.32 0.11 0 S
Jain Studios 201403 28.60 7.12 7.37 0.72 0.47 0.00 0.24 0.23 0.56 -0.33 -0.33 -0.12 0 S
Jain Studios 201406 28.60 8.30 7.82 0.02 0.51 0.00 0.30 0.20 0.20 0.20 0.07 0 S
Jain Studios 201409 28.60 8.80 8.17 0.01 0.65 0.15 0.29 0.21 0.21 0.21 0.07 0 S
Jauss Polymers 201312 4.63 3.62 3.18 0.43 0.03 0.22 0.93 0.93 0.93 2.01 0 S
Jauss Polymers 201403 4.63 5.79 0.00 4.55 0.00 1.24 0.19 0.26 0.79 0.40 0.40 0.40 0.86 0 S
Jauss Polymers 201406 4.63 3.75 3.11 0.64 0.07 0.25 1.57 0.33 1.24 1.24 2.69 0 S
Jauss Polymers 201409 4.63 4.92 4.28 0.03 0.68 0.13 0.26 0.30 0.21 0.09 0.09 0.19 0 S
Jay Ushin 201312 3.87 147.09 143.62 3.04 6.52 2.47 3.01 1.04 -0.49 1.53 1.53 3.96 25 S
Jay Ushin 201403 3.87 150.33 146.70 2.04 5.67 1.60 2.84 1.23 1.27 -0.04 -0.04 -0.11 25 S
Jay Ushin 201406 3.87 151.05 145.72 2.39 7.72 2.41 3.06 2.26 0.96 1.31 1.31 3.38 25 S
Jay Ushin 201409 3.87 167.74 163.78 3.79 7.75 2.18 2.97 2.61 1.06 1.55 1.55 4.00 25 S
JHS Svendgaard Laboratories 201312 24.10 7.61 0.01 8.34 0.21 -0.51 3.29 3.71 -7.78 0.22 -8.00 -8.00 -3.32 0 C
JHS Svendgaard Laboratories 201403 24.10 7.79 0.02 8.01 3.42 3.23 3.96 3.62 -10.81 -6.16 -4.65 -4.65 -1.93 0 C
JIK Industries 201312 72.64 0.40 0.44 -0.05 0.12 -0.17 -0.17 -0.17 -0.02 0 C
JIK Industries 201403 72.64 0.26 0.36 -0.10 0.12 -3.13 -3.13 -3.13 -0.43 0 C
JIK Industries 201406 72.64 0.23 0.27 0.00 -0.04 0.01 -0.05 0.00 -0.05 -0.05 -0.01 0 C
JIK Industries 201409 72.64 0.23 0.21 0.02 0.03 -0.01 -0.01 -0.01 0 C
Jindal Cotex 201312 45.00 85.71 0.04 85.99 -0.24 13.27 4.29 -17.80 -17.80 -10.50 -2.33 0 C
Jindal Cotex 201403 45.00 91.41 0.95 87.16 5.19 14.89 -0.73 -8.97 -0.03 -8.94 -7.97 -1.77 0 C
Jindal Cotex 201406 45.00 65.19 0.28 64.54 0.93 11.16 3.17 -13.40 -13.40 -11.36 -2.98 0 C
Jindal Cotex 201409 45.00 61.82 0.00 101.83 -40.00 16.53 4.05 -60.59 -60.59 -60.59 -13.46 0 C

Co_Name Year Equity N.Sale O.O.I T. Exp O.I PBIDT Int. Dep. PBT T.Tax PAT A.PAT EPS Div (%)
Exp
ecte
d R
esu
lts
on
14
Feb
ruar
y 20
15
JK Cement 201312 69.93 674.37 2.79 601.27 12.93 88.82 39.37 33.11 16.33 5.12 11.22 11.22 1.60 30 C
JK Cement 201403 69.93 827.41 5.30 669.33 14.43 177.81 37.42 34.68 105.71 29.33 76.38 76.38 10.92 30 C
JK Cement 201406 69.93 801.36 1.87 702.86 13.79 114.16 40.35 28.48 45.33 7.30 38.03 38.03 5.44 30 C
JK Cement 201409 69.93 827.92 2.76 740.27 13.20 103.61 46.17 29.64 27.80 -4.52 32.32 32.32 4.62 30 C
JRI Industries & Infrastructure 201312 5.31 1.01 1.01 0.01 0.00 0.01 0.00 0.00 0.00 0 S
JRI Industries & Infrastructure 201403 5.31 1.05 0.73 0.32 0.00 0.32 0.10 0.22 0.22 0.08 0 S
JRI Industries & Infrastructure 201406 5.31 1.02 1.02 0.01 0.00 0.01 0.00 0.00 0.00 0 S
JRI Industries & Infrastructure 201409 5.31 1.82 1.78 0.04 0.00 0.04 0.01 0.03 0.03 0.01 0 S
Jumbo Bag 201312 8.37 18.78 0.63 28.83 8.42 -1.00 0.95 0.51 -2.45 -2.45 -2.45 -0.29 0 S
Jumbo Bag 201403 8.37 24.56 0.48 23.85 0.22 1.41 1.09 0.40 -0.07 -0.07 -0.07 -0.01 0 S
Jumbo Bag 201406 8.37 20.61 1.07 20.25 0.35 1.78 1.32 0.40 0.05 0.02 0.03 0.03 0 S
Jumbo Bag 201409 8.37 24.08 0.69 22.91 0.30 2.16 1.69 0.40 0.07 0.03 0.05 0.05 0.01 0 S
Jyothi Infraventures 201312 5.16 0.04 -0.04 0.00 -0.05 -0.05 -0.05 -0.09 0 S
Jyothi Infraventures 201403 5.16 0.04 -0.04 0.00 -0.04 -0.04 -0.04 -0.08 0 S
Jyothi Infraventures 201406 1.55 0.05 -0.05 0.00 -0.05 -0.05 -0.05 -0.31 0 S
Jyothi Infraventures 201409 1.55 0.04 -0.04 0.00 -0.04 -0.04 -0.04 -0.28 0 S
Jyoti 201312 17.13 59.73 0.51 66.83 -0.08 -6.67 19.36 2.61 -28.64 0.43 -29.07 -29.07 -16.97 0 S
Jyoti 201403 17.13 86.69 0.07 120.14 6.66 -26.72 16.49 2.69 -45.90 3.53 -49.43 -49.43 -28.87 0 S
Jyoti 201406 17.13 61.96 0.90 66.11 0.26 -2.97 17.40 3.08 -23.45 0.00 -23.45 -23.45 -13.69 0 S
Jyoti 201409 17.13 52.69 0.13 55.44 0.82 -1.80 18.17 3.19 -23.16 -23.16 -23.16 -13.52 0 S
Kailash Auto Finance 201312 58.71 12.41 0.20 12.29 0.31 0.31 0.31 0.31 0.01 0 S
Kailash Auto Finance 201403 58.71 7.64 -0.19 6.50 0.00 0.95 0.05 0.90 0.00 0.90 0.90 0.02 0 S
Kailash Auto Finance 201406 58.71 17.62 15.88 0.01 1.75 0.03 1.72 1.72 1.72 0.03 0 S
Kailash Auto Finance 201409 58.71 17.97 16.33 1.65 0.06 1.59 1.59 1.59 0.03 0 S
Kalpena Industries 201312 18.82 311.15 0.61 288.81 22.96 11.34 4.11 7.51 1.50 6.01 6.01 3.19 12 S
Kalpena Industries 201403 18.82 371.36 5.58 361.14 15.80 5.10 3.29 7.41 4.47 2.94 2.94 1.56 12 S
Kalpena Industries 201406 18.82 412.82 2.67 389.18 26.32 11.44 4.87 10.01 2.50 7.51 7.51 3.99 12 S
Kalpena Industries 201409 18.82 445.53 5.19 427.38 23.34 8.11 5.60 9.64 1.92 7.72 7.72 4.10 12 S
Kamat Hotels (India) 201312 22.54 35.13 2.44 24.04 6.93 20.45 14.43 3.62 -238.47 -11.83 -226.64 -226.64 -103.23 0 C
Kamat Hotels (India) 201403 24.17 34.60 2.16 22.86 1.75 15.65 14.03 3.51 1.11 0.46 0.66 0.66 0.29 0 C
Kamat Hotels (India) 201406 24.17 28.57 1.95 23.83 3.16 9.85 24.29 5.09 -19.54 -6.61 -12.92 -12.92 -5.48 0 C
Kamat Hotels (India) 201409 24.17 26.50 1.53 22.79 1.02 6.27 40.47 4.46 -38.66 -13.30 -25.36 -25.36 -10.75 0 C
Kanchi Karpooram 201409 4.14 15.87 0.02 17.23 0.03 -1.32 0.32 0.32 -1.96 -0.31 -1.65 -1.65 -3.97 15 S
Karuturi Global 201312 80.97 147.31 104.71 11.76 54.35 20.35 7.96 26.04 -6.78 8.05 7.85 0.10 0 C
Karuturi Global 201403 80.97 156.33 115.40 32.06 72.99 12.87 15.42 44.70 6.06 25.98 26.18 0.32 0 C
Karuturi Global 201406 80.97 54.27 39.21 5.03 20.09 9.95 6.68 3.47 -1.06 4.56 4.56 0.06 0 C
Karuturi Global 201409 80.97 62.14 56.84 3.49 8.79 16.67 7.82 -0.28 0.57 -0.86 -0.86 -0.01 0 C

Co_Name Year Equity N.Sale O.O.I T. Exp O.I PBIDT Int. Dep. PBT T.Tax PAT A.PAT EPS Div (%)
Exp
ecte
d R
esu
lts
on
14
Feb
ruar
y 20
15
Kausambi Vanijya 201312 4.74 12.13 12.15 0.04 0.03 0.01 0.02 0.02 0.02 0.05 0 C
Kausambi Vanijya 201403 4.74 0.21 0.32 0.11 -0.01 0.01 -0.01 0.00 -0.02 -0.02 -0.03 0 C
Kausambi Vanijya 201406 4.74 0.77 0.93 0.06 -0.11 -0.11 -0.11 -0.11 0 C
Kausambi Vanijya 201409 4.74 2.35 2.31 0.09 0.14 0.14 0.14 0.14 0.10 0 C
Keerthi Industries 201312 8.02 25.36 24.42 0.15 1.09 2.28 3.41 -4.70 -4.70 -4.70 -6.11 0 S
Keerthi Industries 201403 8.02 30.61 31.25 0.64 0.00 2.46 3.33 -7.86 -2.59 -5.27 -5.27 -6.75 0 S
Keerthi Industries 201406 8.02 21.42 22.85 0.28 -1.15 2.31 2.16 -5.62 -5.62 -5.62 -7.26 0 S
Keerthi Industries 201409 8.02 30.17 23.21 0.16 7.12 2.29 2.16 2.67 2.67 2.67 3.08 0 S
Kellton Tech Solutions 201312 17.75 26.42 23.97 0.09 2.55 0.70 0.54 1.30 0.08 1.22 1.22 0.34 0 C
Kellton Tech Solutions 201403 17.75 40.13 0.10 37.07 0.06 3.21 0.61 0.67 1.93 0.45 1.49 1.49 0.42 0 C
Kellton Tech Solutions 201406 20.69 41.78 0.03 36.58 -0.10 5.12 1.39 0.67 3.06 0.53 2.52 2.52 0.71 0 C
Kellton Tech Solutions 201409 20.69 42.41 37.12 0.01 5.30 1.08 0.85 3.37 0.24 3.13 3.13 0.85 0 C
KG Petrochem 201312 5.82 33.77 2.94 30.95 0.52 6.28 1.44 1.81 3.03 0.97 2.06 2.06 3.95 0 S
KG Petrochem 201403 5.82 38.66 3.81 39.56 0.74 3.65 1.66 1.83 0.16 0.04 0.12 0.12 0.22 0 S
KG Petrochem 201406 5.82 32.55 3.02 32.30 0.52 3.79 1.80 1.96 0.03 -0.06 0.09 0.09 0.18 0 S
KG Petrochem 201409 5.82 47.49 4.63 45.05 2.05 9.12 2.41 2.55 4.17 1.87 2.29 2.29 4.39 0 S
KGN Enterprises 201312 20.47 5.90 0.08 5.88 0.09 0.09 0.02 0.08 0.08 0.04 0 C
KGN Enterprises 201403 20.47 0.36 0.04 0.81 0.00 -0.41 0.00 -0.41 -0.08 -0.33 -0.33 -0.16 0 C
KGN Enterprises 201406 20.47 0.55 0.17 0.70 0.00 0.02 0.02 0.01 0.02 0.02 0.01 0 C
KGN Enterprises 201409 20.47 0.36 0.07 0.42 0.01 0.02 0.02 0.00 0.01 0.01 0.01 0 C
KGN Industries 201312 22.25 4.44 4.34 0.10 0.00 0.10 0.03 0.07 0.07 0 C
KGN Industries 201403 22.25 0.60 0.90 -0.30 0.07 -0.37 -0.08 -0.29 -0.29 -0.01 0 C
KGN Industries 201406 22.25 0.34 0.02 0.32 0.04 0.02 0.02 0.01 0.02 0.02 0.00 0 C
KGN Industries 201409 22.25 0.15 0.11 0.03 0.01 0.02 0.01 0.02 0.02 0 C
Khaitan Chemicals & Fertilizers 201312 9.70 96.51 89.39 0.41 7.53 6.47 1.96 -0.91 -0.36 -0.55 -0.55 -0.01 5 S
Khaitan Chemicals & Fertilizers 201403 9.70 96.66 86.54 7.59 17.72 5.79 1.89 10.03 0.67 9.36 9.36 0.96 5 S
Khaitan Chemicals & Fertilizers 201406 9.70 65.21 59.93 0.33 5.61 7.51 2.19 -4.09 -1.24 -2.85 -2.85 -0.29 5 S
Khaitan Chemicals & Fertilizers 201409 9.70 85.94 79.10 0.36 7.19 7.80 2.22 -2.83 -5.14 2.31 2.31 0.24 5 S
Kiran Print-Pack 201312 5.00 0.03 0.08 0.01 -0.04 0.03 -0.08 -0.08 -0.08 -0.15 0 S
Kiran Print-Pack 201403 5.00 0.07 0.10 0.01 -0.02 0.03 -0.05 -0.66 0.61 0.61 1.22 0 S
Kiran Print-Pack 201406 5.00 0.07 0.08 0.01 0.00 0.01 -0.01 -0.01 -0.01 -0.02 0 S
Kiran Print-Pack 201409 5.00 0.10 0.09 0.02 0.03 0.01 0.02 0.02 0.02 0.05 0 S
Kirloskar Electric Company 201312 50.52 154.48 159.64 -0.31 -5.47 10.73 3.34 -19.54 -19.54 -19.54 -3.87 0 C
Kirloskar Electric Company 201403 50.52 147.68 164.26 14.77 -1.81 11.47 1.16 -14.44 -14.44 -14.44 -2.86 0 C
Kirloskar Electric Company 201406 50.52 142.03 151.96 0.83 -9.10 10.80 2.80 -22.70 -22.70 -22.70 -4.49 0 C
Kirloskar Electric Company 201409 50.52 109.26 123.81 1.71 -12.84 11.58 2.78 -27.20 -27.20 -27.20 -5.38 0 C
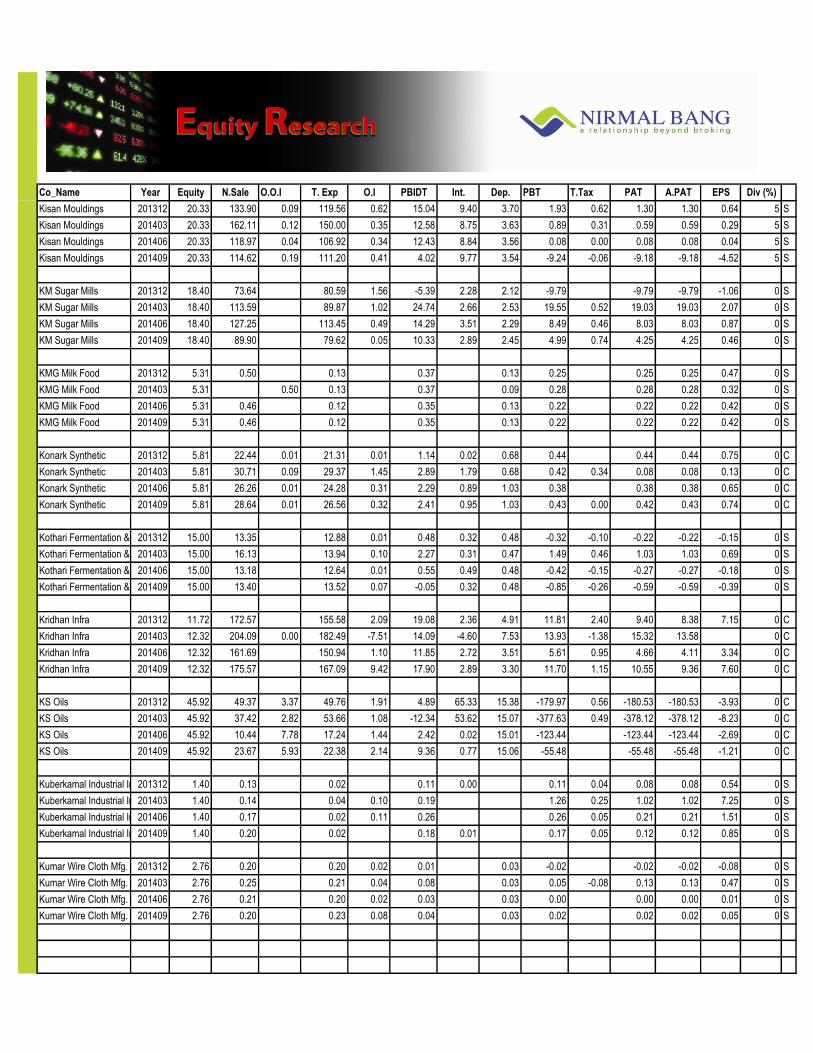
Co_Name Year Equity N.Sale O.O.I T. Exp O.I PBIDT Int. Dep. PBT T.Tax PAT A.PAT EPS Div (%)
Exp
ecte
d R
esu
lts
on
14
Feb
ruar
y 20
15
Kisan Mouldings 201312 20.33 133.90 0.09 119.56 0.62 15.04 9.40 3.70 1.93 0.62 1.30 1.30 0.64 5 S
Kisan Mouldings 201403 20.33 162.11 0.12 150.00 0.35 12.58 8.75 3.63 0.89 0.31 0.59 0.59 0.29 5 S
Kisan Mouldings 201406 20.33 118.97 0.04 106.92 0.34 12.43 8.84 3.56 0.08 0.00 0.08 0.08 0.04 5 S
Kisan Mouldings 201409 20.33 114.62 0.19 111.20 0.41 4.02 9.77 3.54 -9.24 -0.06 -9.18 -9.18 -4.52 5 S
KM Sugar Mills 201312 18.40 73.64 80.59 1.56 -5.39 2.28 2.12 -9.79 -9.79 -9.79 -1.06 0 S
KM Sugar Mills 201403 18.40 113.59 89.87 1.02 24.74 2.66 2.53 19.55 0.52 19.03 19.03 2.07 0 S
KM Sugar Mills 201406 18.40 127.25 113.45 0.49 14.29 3.51 2.29 8.49 0.46 8.03 8.03 0.87 0 S
KM Sugar Mills 201409 18.40 89.90 79.62 0.05 10.33 2.89 2.45 4.99 0.74 4.25 4.25 0.46 0 S
KMG Milk Food 201312 5.31 0.50 0.13 0.37 0.13 0.25 0.25 0.25 0.47 0 S
KMG Milk Food 201403 5.31 0.50 0.13 0.37 0.09 0.28 0.28 0.28 0.32 0 S
KMG Milk Food 201406 5.31 0.46 0.12 0.35 0.13 0.22 0.22 0.22 0.42 0 S
KMG Milk Food 201409 5.31 0.46 0.12 0.35 0.13 0.22 0.22 0.22 0.42 0 S
Konark Synthetic 201312 5.81 22.44 0.01 21.31 0.01 1.14 0.02 0.68 0.44 0.44 0.44 0.75 0 C
Konark Synthetic 201403 5.81 30.71 0.09 29.37 1.45 2.89 1.79 0.68 0.42 0.34 0.08 0.08 0.13 0 C
Konark Synthetic 201406 5.81 26.26 0.01 24.28 0.31 2.29 0.89 1.03 0.38 0.38 0.38 0.65 0 C
Konark Synthetic 201409 5.81 28.64 0.01 26.56 0.32 2.41 0.95 1.03 0.43 0.00 0.42 0.43 0.74 0 C
Kothari Fermentation & Biochem 201312 15.00 13.35 12.88 0.01 0.48 0.32 0.48 -0.32 -0.10 -0.22 -0.22 -0.15 0 S
Kothari Fermentation & Biochem 201403 15.00 16.13 13.94 0.10 2.27 0.31 0.47 1.49 0.46 1.03 1.03 0.69 0 S
Kothari Fermentation & Biochem 201406 15.00 13.18 12.64 0.01 0.55 0.49 0.48 -0.42 -0.15 -0.27 -0.27 -0.18 0 S
Kothari Fermentation & Biochem 201409 15.00 13.40 13.52 0.07 -0.05 0.32 0.48 -0.85 -0.26 -0.59 -0.59 -0.39 0 S
Kridhan Infra 201312 11.72 172.57 155.58 2.09 19.08 2.36 4.91 11.81 2.40 9.40 8.38 7.15 0 C
Kridhan Infra 201403 12.32 204.09 0.00 182.49 -7.51 14.09 -4.60 7.53 13.93 -1.38 15.32 13.58 0 C
Kridhan Infra 201406 12.32 161.69 150.94 1.10 11.85 2.72 3.51 5.61 0.95 4.66 4.11 3.34 0 C
Kridhan Infra 201409 12.32 175.57 167.09 9.42 17.90 2.89 3.30 11.70 1.15 10.55 9.36 7.60 0 C
KS Oils 201312 45.92 49.37 3.37 49.76 1.91 4.89 65.33 15.38 -179.97 0.56 -180.53 -180.53 -3.93 0 C
KS Oils 201403 45.92 37.42 2.82 53.66 1.08 -12.34 53.62 15.07 -377.63 0.49 -378.12 -378.12 -8.23 0 C
KS Oils 201406 45.92 10.44 7.78 17.24 1.44 2.42 0.02 15.01 -123.44 -123.44 -123.44 -2.69 0 C
KS Oils 201409 45.92 23.67 5.93 22.38 2.14 9.36 0.77 15.06 -55.48 -55.48 -55.48 -1.21 0 C
Kuberkamal Industrial Investment 201312 1.40 0.13 0.02 0.11 0.00 0.11 0.04 0.08 0.08 0.54 0 S
Kuberkamal Industrial Investment 201403 1.40 0.14 0.04 0.10 0.19 1.26 0.25 1.02 1.02 7.25 0 S
Kuberkamal Industrial Investment 201406 1.40 0.17 0.02 0.11 0.26 0.26 0.05 0.21 0.21 1.51 0 S
Kuberkamal Industrial Investment 201409 1.40 0.20 0.02 0.18 0.01 0.17 0.05 0.12 0.12 0.85 0 S
Kumar Wire Cloth Mfg. Company 201312 2.76 0.20 0.20 0.02 0.01 0.03 -0.02 -0.02 -0.02 -0.08 0 S
Kumar Wire Cloth Mfg. Company 201403 2.76 0.25 0.21 0.04 0.08 0.03 0.05 -0.08 0.13 0.13 0.47 0 S
Kumar Wire Cloth Mfg. Company 201406 2.76 0.21 0.20 0.02 0.03 0.03 0.00 0.00 0.00 0.01 0 S
Kumar Wire Cloth Mfg. Company 201409 2.76 0.20 0.23 0.08 0.04 0.03 0.02 0.02 0.02 0.05 0 S
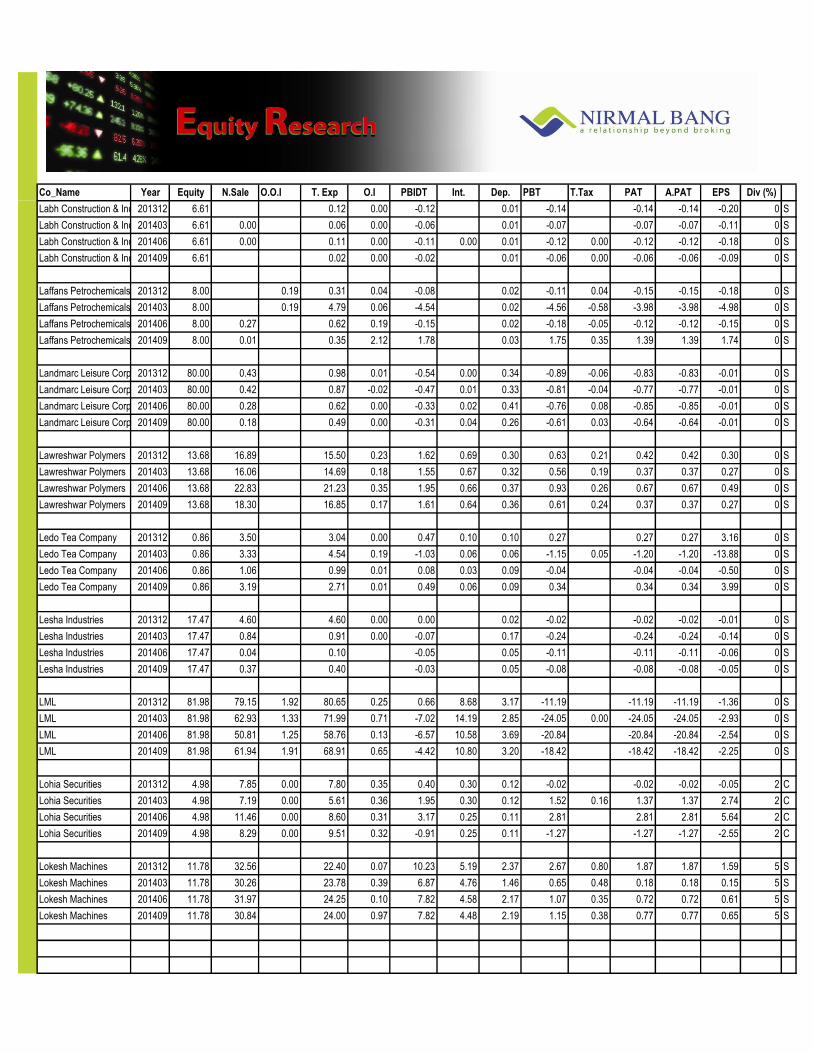
Co_Name Year Equity N.Sale O.O.I T. Exp O.I PBIDT Int. Dep. PBT T.Tax PAT A.PAT EPS Div (%)
Exp
ecte
d R
esu
lts
on
14
Feb
ruar
y 20
15
Labh Construction & Industries 201312 6.61 0.12 0.00 -0.12 0.01 -0.14 -0.14 -0.14 -0.20 0 S
Labh Construction & Industries 201403 6.61 0.00 0.06 0.00 -0.06 0.01 -0.07 -0.07 -0.07 -0.11 0 S
Labh Construction & Industries 201406 6.61 0.00 0.11 0.00 -0.11 0.00 0.01 -0.12 0.00 -0.12 -0.12 -0.18 0 S
Labh Construction & Industries 201409 6.61 0.02 0.00 -0.02 0.01 -0.06 0.00 -0.06 -0.06 -0.09 0 S
Laffans Petrochemicals 201312 8.00 0.19 0.31 0.04 -0.08 0.02 -0.11 0.04 -0.15 -0.15 -0.18 0 S
Laffans Petrochemicals 201403 8.00 0.19 4.79 0.06 -4.54 0.02 -4.56 -0.58 -3.98 -3.98 -4.98 0 S
Laffans Petrochemicals 201406 8.00 0.27 0.62 0.19 -0.15 0.02 -0.18 -0.05 -0.12 -0.12 -0.15 0 S
Laffans Petrochemicals 201409 8.00 0.01 0.35 2.12 1.78 0.03 1.75 0.35 1.39 1.39 1.74 0 S
Landmarc Leisure Corporation 201312 80.00 0.43 0.98 0.01 -0.54 0.00 0.34 -0.89 -0.06 -0.83 -0.83 -0.01 0 S
Landmarc Leisure Corporation 201403 80.00 0.42 0.87 -0.02 -0.47 0.01 0.33 -0.81 -0.04 -0.77 -0.77 -0.01 0 S
Landmarc Leisure Corporation 201406 80.00 0.28 0.62 0.00 -0.33 0.02 0.41 -0.76 0.08 -0.85 -0.85 -0.01 0 S
Landmarc Leisure Corporation 201409 80.00 0.18 0.49 0.00 -0.31 0.04 0.26 -0.61 0.03 -0.64 -0.64 -0.01 0 S
Lawreshwar Polymers 201312 13.68 16.89 15.50 0.23 1.62 0.69 0.30 0.63 0.21 0.42 0.42 0.30 0 S
Lawreshwar Polymers 201403 13.68 16.06 14.69 0.18 1.55 0.67 0.32 0.56 0.19 0.37 0.37 0.27 0 S
Lawreshwar Polymers 201406 13.68 22.83 21.23 0.35 1.95 0.66 0.37 0.93 0.26 0.67 0.67 0.49 0 S
Lawreshwar Polymers 201409 13.68 18.30 16.85 0.17 1.61 0.64 0.36 0.61 0.24 0.37 0.37 0.27 0 S
Ledo Tea Company 201312 0.86 3.50 3.04 0.00 0.47 0.10 0.10 0.27 0.27 0.27 3.16 0 S
Ledo Tea Company 201403 0.86 3.33 4.54 0.19 -1.03 0.06 0.06 -1.15 0.05 -1.20 -1.20 -13.88 0 S
Ledo Tea Company 201406 0.86 1.06 0.99 0.01 0.08 0.03 0.09 -0.04 -0.04 -0.04 -0.50 0 S
Ledo Tea Company 201409 0.86 3.19 2.71 0.01 0.49 0.06 0.09 0.34 0.34 0.34 3.99 0 S
Lesha Industries 201312 17.47 4.60 4.60 0.00 0.00 0.02 -0.02 -0.02 -0.02 -0.01 0 S
Lesha Industries 201403 17.47 0.84 0.91 0.00 -0.07 0.17 -0.24 -0.24 -0.24 -0.14 0 S
Lesha Industries 201406 17.47 0.04 0.10 -0.05 0.05 -0.11 -0.11 -0.11 -0.06 0 S
Lesha Industries 201409 17.47 0.37 0.40 -0.03 0.05 -0.08 -0.08 -0.08 -0.05 0 S
LML 201312 81.98 79.15 1.92 80.65 0.25 0.66 8.68 3.17 -11.19 -11.19 -11.19 -1.36 0 S
LML 201403 81.98 62.93 1.33 71.99 0.71 -7.02 14.19 2.85 -24.05 0.00 -24.05 -24.05 -2.93 0 S
LML 201406 81.98 50.81 1.25 58.76 0.13 -6.57 10.58 3.69 -20.84 -20.84 -20.84 -2.54 0 S
LML 201409 81.98 61.94 1.91 68.91 0.65 -4.42 10.80 3.20 -18.42 -18.42 -18.42 -2.25 0 S
Lohia Securities 201312 4.98 7.85 0.00 7.80 0.35 0.40 0.30 0.12 -0.02 -0.02 -0.02 -0.05 2 C
Lohia Securities 201403 4.98 7.19 0.00 5.61 0.36 1.95 0.30 0.12 1.52 0.16 1.37 1.37 2.74 2 C
Lohia Securities 201406 4.98 11.46 0.00 8.60 0.31 3.17 0.25 0.11 2.81 2.81 2.81 5.64 2 C
Lohia Securities 201409 4.98 8.29 0.00 9.51 0.32 -0.91 0.25 0.11 -1.27 -1.27 -1.27 -2.55 2 C
Lokesh Machines 201312 11.78 32.56 22.40 0.07 10.23 5.19 2.37 2.67 0.80 1.87 1.87 1.59 5 S
Lokesh Machines 201403 11.78 30.26 23.78 0.39 6.87 4.76 1.46 0.65 0.48 0.18 0.18 0.15 5 S
Lokesh Machines 201406 11.78 31.97 24.25 0.10 7.82 4.58 2.17 1.07 0.35 0.72 0.72 0.61 5 S
Lokesh Machines 201409 11.78 30.84 24.00 0.97 7.82 4.48 2.19 1.15 0.38 0.77 0.77 0.65 5 S

Co_Name Year Equity N.Sale O.O.I T. Exp O.I PBIDT Int. Dep. PBT T.Tax PAT A.PAT EPS Div (%)
Exp
ecte
d R
esu
lts
on
14
Feb
ruar
y 20
15
Longview Tea Company 201312 3.00 0.19 0.24 0.17 0.12 0.02 0.11 0.02 0.09 0.09 0.30 0 S
Longview Tea Company 201403 3.00 0.24 0.33 0.20 0.11 0.02 0.09 0.03 0.07 0.07 0.22 0 S
Longview Tea Company 201406 3.00 0.08 0.16 0.08 0.02 0.07 0.01 0.05 0.05 0.18 0 S
Longview Tea Company 201409 3.00 0.18 0.17 -0.01 0.02 -0.03 -0.03 -0.03 -0.07 0 S
Lumax Industries 201312 9.35 285.38 3.39 276.40 1.45 13.81 4.35 9.25 0.21 -1.55 1.77 1.77 1.89 35 S
Lumax Industries 201403 9.35 296.68 1.06 282.41 2.52 17.85 3.94 8.93 4.97 0.06 4.91 4.91 5.26 35 S
Lumax Industries 201406 9.35 272.56 2.48 258.32 0.91 17.62 3.54 9.49 4.59 -0.39 4.98 4.98 5.32 35 S
Lumax Industries 201409 9.35 284.74 1.84 270.30 1.34 17.62 3.13 9.68 4.81 -0.59 5.40 5.40 5.78 35 S
Macro International 201312 3.99 0.04 0.08 0.03 0.00 0.03 0.01 0.02 0.02 0.05 0 S
Macro International 201403 3.99 0.07 0.07 0.00 0.00 -0.01 0.00 -0.01 -0.01 -0.01 0 S
Macro International 201406 3.97 0.05 0.08 0.02 0.00 0.02 0.01 0.01 0.01 0.30 0 S
Macro International 201409 3.97 0.05 0.10 0.05 0.00 0.05 0.02 0.03 0.03 0.09 0 S
Madhucon Projects 201312 7.38 168.22 9.52 132.35 7.26 52.65 34.36 13.04 5.24 3.50 1.74 1.74 0.24 10 C
Madhucon Projects 201403 7.38 340.77 8.12 288.97 8.29 68.21 31.05 8.14 29.01 10.31 18.71 18.71 2.54 10 C
Madhucon Projects 201406 7.38 146.12 4.39 117.95 17.78 50.33 29.75 11.18 9.40 2.91 6.49 6.49 0.88 10 C
Madhucon Projects 201409 7.38 247.14 7.78 212.69 2.46 44.68 25.16 8.63 10.90 1.34 9.56 9.56 1.29 10 C
Magna Industries & Exports 201312 11.36 2.31 2.18 0.05 0.18 0.01 0.01 0.17 0.05 0.12 0.12 0.11 0 S
Magna Industries & Exports 201403 11.36 9.52 11.79 2.69 0.42 0.00 0.01 0.41 0.12 0.29 0.29 0.25 0 S
Magna Industries & Exports 201406 11.36 7.36 7.22 0.14 0.00 0.01 0.13 0.04 0.09 0.09 0.08 0 S
Magna Industries & Exports 201409 11.36 5.17 5.04 0.01 0.14 0.00 0.01 0.14 0.04 0.09 0.09 0.08 0 S
Magnanimous Trade & Finance 201312 0.95 0.09 0.06 -0.03 0.00 -0.03 -0.01 -0.02 -0.02 -0.23 0 S
Magnanimous Trade & Finance 201403 0.95 0.04 0.07 0.03 0.00 0.03 -0.02 0.04 0.04 0.45 0 S
Magnanimous Trade & Finance 201406 0.95 0.02 0.07 0.07 0.01 0.00 0.01 0.00 0.01 0.01 0.05 0 S
Magnanimous Trade & Finance 201409 0.95 0.06 0.07 0.02 0.00 0.01 0.01 0.01 0.01 0.08 0 S
Mahalaxmi Seamless 201312 5.29 4.16 4.43 0.04 -0.23 0.20 0.29 -0.72 -0.72 -0.72 -1.36 0 S
Mahalaxmi Seamless 201403 5.29 4.33 4.99 0.02 -0.64 0.27 -0.21 -0.70 -0.70 -0.70 -1.32 0 S
Mahalaxmi Seamless 201406 5.29 4.74 4.22 0.01 0.52 0.13 0.16 0.23 0.23 0.23 0.43 0 S
Mahalaxmi Seamless 201409 5.29 3.43 3.05 0.01 0.39 0.17 0.17 0.06 0.06 0.06 0.11 0 S
Mahamaya Steel Industries 201312 13.57 70.49 67.70 0.19 2.98 1.69 1.35 0.23 0.52 -0.29 -0.29 -0.21 0 S
Mahamaya Steel Industries 201403 13.57 90.20 87.72 0.24 2.72 0.69 1.33 1.88 0.57 1.32 1.32 0.97 0 S
Mahamaya Steel Industries 201406 13.57 85.77 82.01 0.20 3.97 1.53 1.35 1.08 0.37 0.71 0.71 0.53 0 S
Mahamaya Steel Industries 201409 13.57 65.79 62.13 0.19 3.86 1.78 1.35 0.73 0.28 0.46 0.46 0.34 0 S
Mahavir Industries 201312 6.31 1.20 1.23 -0.04 -0.04 -0.04 -0.04 -0.06 0 S
Mahavir Industries 201403 10.00 0.03 0.05 -0.02 -0.02 -0.02 -0.02 -0.02 0 S
Mahavir Industries 201406 10.00 0.04 0.04 0.01 0.01 0.00 0.01 0.01 0 S
Mahavir Industries 201409 10.00 0.04 0.03 -0.01 -0.01 -0.01 -0.01 -0.01 0 S
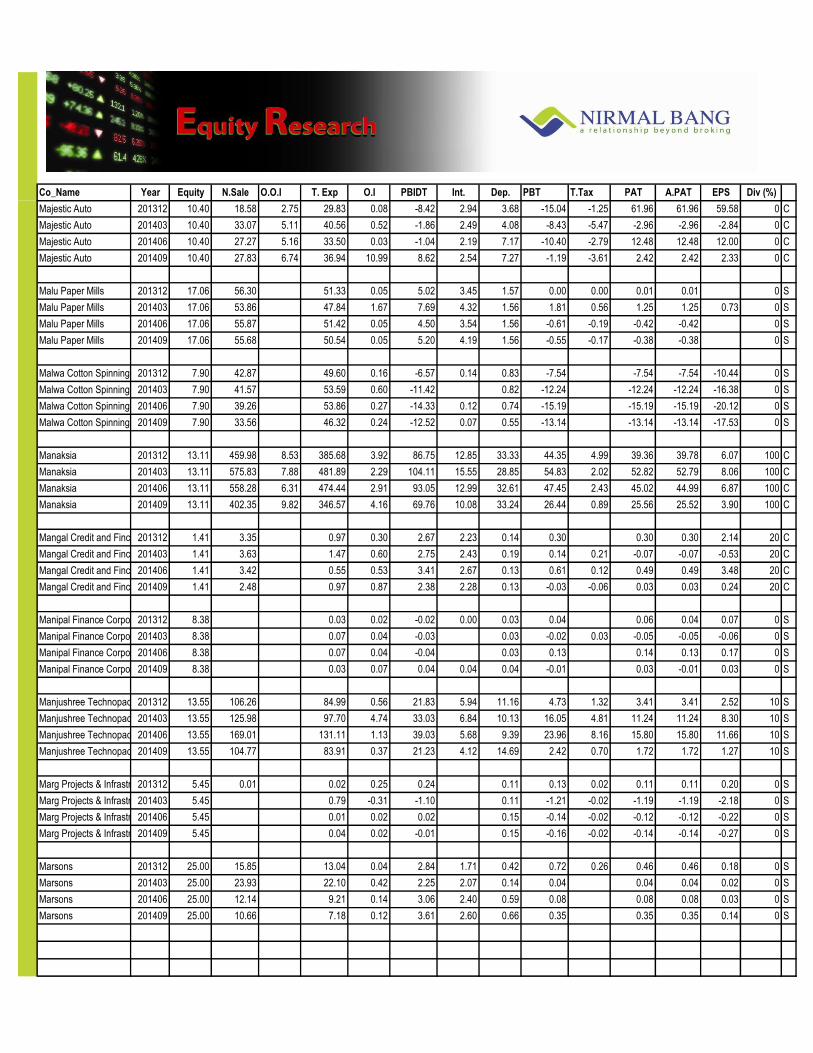
Co_Name Year Equity N.Sale O.O.I T. Exp O.I PBIDT Int. Dep. PBT T.Tax PAT A.PAT EPS Div (%)
Exp
ecte
d R
esu
lts
on
14
Feb
ruar
y 20
15
Majestic Auto 201312 10.40 18.58 2.75 29.83 0.08 -8.42 2.94 3.68 -15.04 -1.25 61.96 61.96 59.58 0 C
Majestic Auto 201403 10.40 33.07 5.11 40.56 0.52 -1.86 2.49 4.08 -8.43 -5.47 -2.96 -2.96 -2.84 0 C
Majestic Auto 201406 10.40 27.27 5.16 33.50 0.03 -1.04 2.19 7.17 -10.40 -2.79 12.48 12.48 12.00 0 C
Majestic Auto 201409 10.40 27.83 6.74 36.94 10.99 8.62 2.54 7.27 -1.19 -3.61 2.42 2.42 2.33 0 C
Malu Paper Mills 201312 17.06 56.30 51.33 0.05 5.02 3.45 1.57 0.00 0.00 0.01 0.01 0 S
Malu Paper Mills 201403 17.06 53.86 47.84 1.67 7.69 4.32 1.56 1.81 0.56 1.25 1.25 0.73 0 S
Malu Paper Mills 201406 17.06 55.87 51.42 0.05 4.50 3.54 1.56 -0.61 -0.19 -0.42 -0.42 0 S
Malu Paper Mills 201409 17.06 55.68 50.54 0.05 5.20 4.19 1.56 -0.55 -0.17 -0.38 -0.38 0 S
Malwa Cotton Spinning Mills 201312 7.90 42.87 49.60 0.16 -6.57 0.14 0.83 -7.54 -7.54 -7.54 -10.44 0 S
Malwa Cotton Spinning Mills 201403 7.90 41.57 53.59 0.60 -11.42 0.82 -12.24 -12.24 -12.24 -16.38 0 S
Malwa Cotton Spinning Mills 201406 7.90 39.26 53.86 0.27 -14.33 0.12 0.74 -15.19 -15.19 -15.19 -20.12 0 S
Malwa Cotton Spinning Mills 201409 7.90 33.56 46.32 0.24 -12.52 0.07 0.55 -13.14 -13.14 -13.14 -17.53 0 S
Manaksia 201312 13.11 459.98 8.53 385.68 3.92 86.75 12.85 33.33 44.35 4.99 39.36 39.78 6.07 100 C
Manaksia 201403 13.11 575.83 7.88 481.89 2.29 104.11 15.55 28.85 54.83 2.02 52.82 52.79 8.06 100 C
Manaksia 201406 13.11 558.28 6.31 474.44 2.91 93.05 12.99 32.61 47.45 2.43 45.02 44.99 6.87 100 C
Manaksia 201409 13.11 402.35 9.82 346.57 4.16 69.76 10.08 33.24 26.44 0.89 25.56 25.52 3.90 100 C
Mangal Credit and Fincorp 201312 1.41 3.35 0.97 0.30 2.67 2.23 0.14 0.30 0.30 0.30 2.14 20 C
Mangal Credit and Fincorp 201403 1.41 3.63 1.47 0.60 2.75 2.43 0.19 0.14 0.21 -0.07 -0.07 -0.53 20 C
Mangal Credit and Fincorp 201406 1.41 3.42 0.55 0.53 3.41 2.67 0.13 0.61 0.12 0.49 0.49 3.48 20 C
Mangal Credit and Fincorp 201409 1.41 2.48 0.97 0.87 2.38 2.28 0.13 -0.03 -0.06 0.03 0.03 0.24 20 C
Manipal Finance Corporation 201312 8.38 0.03 0.02 -0.02 0.00 0.03 0.04 0.06 0.04 0.07 0 S
Manipal Finance Corporation 201403 8.38 0.07 0.04 -0.03 0.03 -0.02 0.03 -0.05 -0.05 -0.06 0 S
Manipal Finance Corporation 201406 8.38 0.07 0.04 -0.04 0.03 0.13 0.14 0.13 0.17 0 S
Manipal Finance Corporation 201409 8.38 0.03 0.07 0.04 0.04 0.04 -0.01 0.03 -0.01 0.03 0 S
Manjushree Technopack 201312 13.55 106.26 84.99 0.56 21.83 5.94 11.16 4.73 1.32 3.41 3.41 2.52 10 S
Manjushree Technopack 201403 13.55 125.98 97.70 4.74 33.03 6.84 10.13 16.05 4.81 11.24 11.24 8.30 10 S
Manjushree Technopack 201406 13.55 169.01 131.11 1.13 39.03 5.68 9.39 23.96 8.16 15.80 15.80 11.66 10 S
Manjushree Technopack 201409 13.55 104.77 83.91 0.37 21.23 4.12 14.69 2.42 0.70 1.72 1.72 1.27 10 S
Marg Projects & Infrastructure 201312 5.45 0.01 0.02 0.25 0.24 0.11 0.13 0.02 0.11 0.11 0.20 0 S
Marg Projects & Infrastructure 201403 5.45 0.79 -0.31 -1.10 0.11 -1.21 -0.02 -1.19 -1.19 -2.18 0 S
Marg Projects & Infrastructure 201406 5.45 0.01 0.02 0.02 0.15 -0.14 -0.02 -0.12 -0.12 -0.22 0 S
Marg Projects & Infrastructure 201409 5.45 0.04 0.02 -0.01 0.15 -0.16 -0.02 -0.14 -0.14 -0.27 0 S
Marsons 201312 25.00 15.85 13.04 0.04 2.84 1.71 0.42 0.72 0.26 0.46 0.46 0.18 0 S
Marsons 201403 25.00 23.93 22.10 0.42 2.25 2.07 0.14 0.04 0.04 0.04 0.02 0 S
Marsons 201406 25.00 12.14 9.21 0.14 3.06 2.40 0.59 0.08 0.08 0.08 0.03 0 S
Marsons 201409 25.00 10.66 7.18 0.12 3.61 2.60 0.66 0.35 0.35 0.35 0.14 0 S

Co_Name Year Equity N.Sale O.O.I T. Exp O.I PBIDT Int. Dep. PBT T.Tax PAT A.PAT EPS Div (%)
Exp
ecte
d R
esu
lts
on
14
Feb
ruar
y 20
15
Master Trust 201312 10.92 23.73 17.63 6.10 3.20 0.23 2.67 0.22 2.45 2.45 2.20 10 C
Master Trust 201403 10.92 18.91 15.40 3.51 1.78 0.39 1.34 0.59 0.75 0.75 0.69 10 C
Master Trust 201406 10.92 27.91 19.35 0.08 8.64 4.18 0.36 4.10 0.53 3.57 3.57 3.30 10 C
Master Trust 201409 10.92 29.63 19.83 0.03 9.83 6.03 0.21 3.59 0.19 3.40 3.40 3.10 10 C
Maxwell Industries 201312 12.62 60.06 0.35 54.83 0.17 5.75 3.27 0.89 1.59 0.58 1.01 1.01 0.16 10 S
Maxwell Industries 201403 12.62 59.84 0.39 55.99 0.51 4.74 3.15 0.89 0.70 0.24 0.46 0.46 0.07 10 S
Maxwell Industries 201406 12.62 66.05 0.49 59.55 0.08 7.07 3.07 0.87 3.13 1.01 2.12 2.12 10 S
Maxwell Industries 201409 12.62 66.94 0.45 61.59 0.18 5.98 3.12 1.24 1.62 0.49 1.13 1.13 10 S
Mayur Leather Products 201312 4.84 5.68 0.07 5.98 0.89 0.68 0.09 0.09 0.50 0.15 0.35 0.35 0.72 10 S
Mayur Leather Products 201403 4.84 7.20 1.09 7.40 -0.24 0.64 0.09 0.10 0.45 0.23 0.23 0.23 0.47 10 S
Mayur Leather Products 201406 4.84 7.01 0.62 6.90 0.23 0.96 0.15 0.09 0.72 0.15 0.57 0.57 1.17 10 S
Mayur Leather Products 201409 4.84 5.64 0.68 6.13 0.24 0.42 0.11 0.09 0.22 0.07 0.15 0.15 0.30 10 S
MB Parikh Finstocks 201312 3.00 0.07 0.08 -0.01 0.00 0.01 -0.02 -0.02 -0.02 0 S
MB Parikh Finstocks 201403 3.00 0.04 0.03 0.07 0.00 0.01 0.01 -0.02 -0.02 -0.02 0 S
MB Parikh Finstocks 201406 3.00 0.12 0.10 0.02 0.04 0.00 0.02 0.02 0.02 0.02 0 S
MB Parikh Finstocks 201409 3.00 0.12 0.08 0.00 0.05 0.00 0.03 0.02 0.02 0.02 0.01 0 S
Medicamen Biotech 201312 8.49 12.02 11.49 0.08 0.61 0.72 0.40 -0.52 -0.09 -0.43 -0.43 -0.50 0 S
Medicamen Biotech 201403 8.91 22.39 22.10 0.39 0.68 0.78 0.40 -0.50 -0.05 -0.44 -0.44 -0.52 0 S
Medicamen Biotech 201406 8.91 19.02 18.16 0.45 1.31 0.63 0.52 0.16 -0.14 0.30 0.30 0.34 0 S
Medicamen Biotech 201409 8.91 27.31 25.62 0.16 1.85 0.71 0.53 0.61 0.11 0.50 0.50 0.56 0 S
Mefcom Capital Markets 201312 9.14 0.26 0.38 0.06 -0.06 0.00 0.02 -0.08 -0.08 -0.08 -0.10 0 C
Mefcom Capital Markets 201403 9.14 0.22 0.32 0.21 0.11 0.00 0.02 0.09 0.09 0.09 0.10 0 C
Mefcom Capital Markets 201406 9.14 0.38 0.48 0.06 -0.04 0.00 0.01 -0.06 -0.06 -0.06 -0.06 0 C
Mefcom Capital Markets 201409 9.14 0.34 0.35 0.24 0.23 0.00 0.01 0.22 0.22 0.22 0.23 0 C
Meglon Infra-Real (India) 201312 5.00 0.02 0.03 -0.01 -0.01 -0.01 -0.01 0 S
Meglon Infra-Real (India) 201403 5.00 0.02 0.04 -0.03 -0.03 -0.03 -0.03 0 S
Meglon Infra-Real (India) 201406 5.00 0.02 0.03 0.00 -0.01 0.00 -0.01 0.00 -0.01 -0.01 0 S
Meglon Infra-Real (India) 201409 5.00 0.03 0.05 -0.02 -0.02 -0.02 -0.02 0 S
Metroglobal 201312 16.33 76.25 69.23 0.19 7.20 0.37 0.09 6.75 6.75 6.75 4.13 0 C
Metroglobal 201403 16.33 101.54 99.66 1.46 3.34 0.82 0.11 2.35 2.35 2.35 1.44 0 C
Metroglobal 201406 16.33 65.21 59.92 1.25 6.55 0.33 0.07 6.15 6.15 6.15 3.77 0 C
Metroglobal 201409 16.33 81.28 74.97 2.51 8.83 0.36 0.07 8.40 8.40 8.40 5.14 0 C
MFL India 201312 36.03 30.62 28.89 0.00 1.73 0.62 0.78 0.33 0.11 0.22 0.22 0.06 0 S
MFL India 201403 36.03 28.01 26.25 0.02 1.78 0.60 0.76 0.42 0.35 0.07 0.07 0.02 0 S
MFL India 201406 36.03 29.43 27.81 0.01 1.62 0.63 0.72 0.28 0.09 0.19 0.19 0.05 0 S
MFL India 201409 36.03 33.00 31.26 0.01 1.74 0.64 0.70 0.40 0.19 0.21 0.21 0.06 0 S

Co_Name Year Equity N.Sale O.O.I T. Exp O.I PBIDT Int. Dep. PBT T.Tax PAT A.PAT EPS Div (%)
Exp
ecte
d R
esu
lts
on
14
Feb
ruar
y 20
15
Milk Partners India 201312 11.86 14.29 14.16 0.13 0.10 0.04 0.04 0.04 0.03 0 S
Milk Partners India 201403 7.75 15.26 15.08 0.19 0.10 0.08 0.00 0.08 0.08 0.10 0 S
Milk Partners India 201406 7.75 12.35 12.25 0.10 0.10 0.01 0.00 0.00 0.00 0.01 0 S
Milk Partners India 201409 7.75 38.84 38.72 0.11 0.10 0.02 0.01 0.01 0.01 0.01 0 S
Milkfood 201312 4.89 108.94 1.51 101.46 0.02 9.01 2.70 1.50 4.81 5.02 4.81 10.26 0 C
Milkfood 201403 4.89 158.83 0.75 153.73 2.59 8.44 3.26 1.94 4.88 1.57 0.94 3.31 1.93 0 C
Milkfood 201406 4.89 101.19 1.08 99.72 2.55 2.49 1.46 -1.40 -1.40 -1.40 -2.86 0 C
Milkfood 201409 4.89 58.54 0.03 56.67 0.03 1.93 2.34 1.75 -2.16 -2.16 -2.16 -4.41 0 C
Minda Industries 201312 15.87 280.15 3.08 265.58 1.00 18.64 3.73 10.33 4.58 0.53 4.05 4.05 2.54 30 C
Minda Industries 201403 15.87 299.11 3.93 273.49 0.92 30.47 3.09 11.45 17.44 3.25 14.19 14.19 8.92 30 C
Minda Industries 201406 15.87 300.46 4.12 277.43 2.29 29.43 3.15 12.11 14.18 1.55 12.63 12.63 7.94 30 C
Minda Industries 201409 15.87 342.27 4.76 319.56 6.04 33.51 3.66 12.28 33.34 7.76 25.58 25.58 16.10 30 C
Mini Diamonds (India) 201312 3.45 12.95 13.06 0.24 0.13 0.08 0.01 0.04 0.04 0.04 0.01 0 S
Mini Diamonds (India) 201403 3.45 21.04 20.84 0.25 0.45 0.14 0.04 0.28 0.17 0.11 0.11 0.05 0 S
Mini Diamonds (India) 201406 3.45 28.12 28.34 0.40 0.18 0.10 0.02 0.06 0.06 0.06 0.02 0 S
Mini Diamonds (India) 201409 3.45 35.12 35.93 1.00 0.19 0.13 0.03 0.04 0.04 0.04 0.01 0 S
Mobile Tele Communications 201312 11.90 21.81 0.03 21.39 0.44 0.18 0.18 0.08 0.08 0.08 0.01 0 S
Mobile Tele Communications 201403 11.90 34.55 2.30 37.06 0.05 -0.16 0.18 0.18 -0.52 -0.07 -0.45 -0.45 -0.04 0 S
Mobile Tele Communications 201406 11.90 25.12 0.00 24.50 0.01 0.64 0.22 0.18 0.25 0.25 0.25 0.02 0 S
Mobile Tele Communications 201409 11.90 40.53 0.14 39.73 0.03 0.97 0.23 0.18 0.56 0.56 0.56 0.05 0 S
Modex International Securities 201312 3.00 3.74 3.10 0.27 0.90 0.47 0.20 0.23 0.00 0.23 0.23 0 S
Modex International Securities 201403 3.00 2.32 1.86 0.13 0.60 0.27 0.10 0.23 0.08 0.15 0.15 0.49 0 S
Modex International Securities 201406 3.00 1.60 1.59 0.18 0.19 0.11 0.07 0.01 0.01 0.01 0.02 0 S
Modex International Securities 201409 3.00 1.29 1.38 0.29 0.21 0.12 0.08 0.01 0.01 0.01 0.03 0 S
Monnet Industries 201312 3.68 0.15 0.13 2.96 2.98 5.76 0.04 -2.82 -2.82 -2.82 -7.66 0 S
Monnet Industries 201403 3.68 0.15 0.16 2.97 2.95 5.95 0.04 -3.04 -3.04 -3.04 -8.25 0 S
Monnet Industries 201406 3.68 0.10 0.14 2.97 2.93 6.01 0.03 -3.11 -3.11 -3.11 -8.45 0 S
Monnet Industries 201409 3.68 4.17 5.17 3.03 2.03 6.07 0.04 -4.08 0.00 -4.08 -4.08 -11.08 0 S
Monnet Project Developers 201312 7.41 0.06 0.09 0.03 0.00 0.02 0.01 0.02 0.02 0.02 0 S
Monnet Project Developers 201403 7.41 0.10 0.09 -0.02 0.00 -0.02 -0.02 -0.02 -0.03 0 S
Monnet Project Developers 201406 7.41 0.05 0.09 0.04 0.00 0.04 0.01 0.03 0.03 0.03 0 S
Monnet Project Developers 201409 7.41 0.06 0.08 0.03 0.00 0.02 0.01 0.01 0.01 0.02 0 S
Morgan Industries 201312 15.00 8.73 7.80 0.00 0.93 0.58 0.22 0.13 0.00 0.13 0.13 0 S
Morgan Industries 201403 15.00 15.35 16.78 2.07 0.64 0.66 0.22 -0.23 0.00 -0.23 -0.23 0 S
Morgan Industries 201406 15.00 11.17 10.30 0.00 0.87 0.66 0.18 0.03 0.00 0.03 0.03 0 S
Morgan Industries 201409 15.00 13.98 13.29 0.20 0.89 0.59 0.22 0.08 0.08 0.08 0 S

Co_Name Year Equity N.Sale O.O.I T. Exp O.I PBIDT Int. Dep. PBT T.Tax PAT A.PAT EPS Div (%)
Exp
ecte
d R
esu
lts
on
14
Feb
ruar
y 20
15
Morgan Ventures 201312 9.90 0.19 0.24 -0.05 0.26 -0.31 -0.31 -0.31 -0.31 0 C
Morgan Ventures 201403 9.90 0.18 0.44 -0.27 0.25 -0.52 -0.52 -0.52 -0.52 0 C
Morgan Ventures 201406 9.90 3.25 0.37 2.89 0.29 2.59 2.59 2.59 2.62 0 C
Morgan Ventures 201409 9.90 0.54 0.49 0.05 0.18 -1.25 -1.25 -1.25 -1.25 0 C
Mudunuru 201312 4.79 0.69 0.56 0.13 0.11 0.02 0.01 0.01 0.01 0.03 0 S
Mudunuru 201403 4.79 3.23 3.04 0.18 0.13 0.05 -0.16 0.21 0.21 0.44 0 S
Mudunuru 201406 4.79 1.34 1.11 0.22 0.15 0.08 0.00 0.07 0.07 0.15 0 S
Mudunuru 201409 4.79 0.75 0.52 0.00 0.23 0.00 0.15 0.08 0.13 -0.05 -0.05 -0.11 0 S
Murli Industries 201312 14.42 110.39 116.73 0.05 -6.29 32.13 15.11 -53.53 -53.53 -53.53 -7.42 0 S
Murli Industries 201403 14.42 84.41 158.46 0.41 -73.65 35.35 14.96 -123.96 0.53 -124.49 -124.49 -17.26 0 S
Murli Industries 201406 14.42 53.37 51.52 0.13 1.98 31.63 14.58 -44.24 -50.63 -44.24 -7.02 0 S
Murli Industries 201409 14.42 27.94 45.18 -17.23 31.74 14.70 -63.67 -64.40 -63.67 -8.93 0 S
MVL 201312 60.12 9.60 0.53 7.76 2.36 1.75 0.10 0.51 0.15 0.36 0.36 0.01 0 C
MVL 201403 60.12 36.38 0.20 27.59 8.99 9.32 0.23 5.08 -0.03 5.11 5.11 0.09 0 C
MVL 201406 60.12 16.10 0.62 12.92 3.80 3.31 0.16 0.74 0.17 0.58 0.58 0.01 0 C
MVL 201409 60.12 8.52 0.48 10.94 -1.94 4.02 0.15 -6.11 0.08 -6.18 -6.18 -0.10 0 C
Nagarjuna Agri Tech 201312 9.37 0.01 0.03 -0.02 0.13 -0.14 -0.14 -0.14 -0.15 0 S
Nagarjuna Agri Tech 201403 9.37 0.09 0.05 0.10 0.04 0.08 -0.04 -0.04 -0.04 -0.04 0 S
Nagarjuna Agri Tech 201406 9.37 0.02 0.01 -0.01 0.03 -0.04 -0.04 -0.04 0 S
Nagarjuna Agri Tech 201409 9.37 0.01 0.02 -0.01 0.03 -0.04 -0.04 -0.04 -0.04 0 S
Nahar Industrial Enterprises 201312 39.84 463.16 3.21 383.70 1.41 84.08 22.47 30.95 30.66 9.70 20.96 20.96 5.26 10 S
Nahar Industrial Enterprises 201403 39.84 472.11 13.64 422.20 2.17 65.71 25.48 33.29 6.94 4.83 2.12 2.12 0.53 10 S
Nahar Industrial Enterprises 201406 39.84 485.57 4.58 435.17 2.27 57.25 27.86 35.81 -6.41 -1.01 -5.40 -5.40 -1.36 10 S
Nahar Industrial Enterprises 201409 39.84 430.04 3.86 392.83 1.11 42.17 23.91 36.61 -18.34 -5.49 -12.85 -12.85 -3.23 10 S
Nakoda 201312 150.00 812.58 1.31 765.86 6.22 54.26 20.49 9.23 24.55 4.91 19.63 19.63 0.65 6 C
Nakoda 201403 150.00 792.72 0.72 804.54 1.55 -9.55 36.86 8.84 -55.24 -55.24 -55.24 -1.84 6 C
Nakoda 201406 150.00 414.36 7.96 437.40 5.50 -9.59 47.75 9.10 -66.43 -66.43 -66.43 -2.21 6 C
Nakoda 201409 150.00 241.70 242.49 0.02 -0.77 38.36 8.97 -48.09 -48.09 -48.09 -1.60 6 C
NAM Securities 201312 3.05 0.16 0.13 0.04 0.02 0.02 0.00 0.02 0.02 0.22 0 S
NAM Securities 201403 3.05 0.09 0.07 0.02 0.02 0.00 -0.01 0.01 0.01 0.20 0 S
NAM Securities 201406 3.05 0.17 0.10 0.07 0.02 0.04 0.04 0.04 0.60 0 S
NAM Securities 201409 3.05 0.12 0.07 0.05 0.00 0.03 0.02 0.02 0.02 0.21 0 S
National Fittings 201312 8.32 9.10 7.65 0.04 1.50 0.19 0.18 1.13 0.53 0.61 0.61 0.73 10 S
National Fittings 201403 8.32 12.13 9.61 0.10 2.62 0.13 0.18 2.31 0.79 1.52 1.52 1.82 10 S
National Fittings 201406 8.32 9.49 7.66 0.20 2.03 0.19 0.29 1.54 0.56 0.99 0.99 1.19 10 S
National Fittings 201409 8.32 13.37 10.44 0.26 3.19 0.28 0.29 2.63 0.85 1.77 1.77 2.13 10 S

Co_Name Year Equity N.Sale O.O.I T. Exp O.I PBIDT Int. Dep. PBT T.Tax PAT A.PAT EPS Div (%)
Exp
ecte
d R
esu
lts
on
14
Feb
ruar
y 20
15
ND Metal Industries 201312 2.48 0.13 0.54 0.01 -0.41 0.08 -0.49 -0.49 -0.49 -1.98 0 S
ND Metal Industries 201403 2.48 0.00 0.18 0.05 -0.13 0.06 -0.19 -0.19 -0.19 -0.76 0 S
ND Metal Industries 201406 2.48 0.07 0.10 0.00 -0.03 0.08 -0.11 -0.11 -0.11 -0.43 0 S
ND Metal Industries 201409 2.48 0.09 0.13 0.02 -0.03 0.07 -0.10 -0.10 -0.10 -0.40 0 S
Neha International 201312 28.38 20.42 0.12 18.67 1.87 1.05 0.50 0.32 0.05 0.27 0.38 0.13 0 C
Neha International 201403 28.38 52.76 0.15 50.78 2.12 1.22 0.41 0.49 0.28 0.21 0.33 0.12 0 C
Neha International 201406 28.38 79.57 0.15 78.90 0.83 1.01 0.68 -0.87 0.08 -0.94 -0.80 -0.28 0 C
Neha International 201409 28.38 28.54 0.18 27.34 1.38 1.12 0.68 -0.43 -0.43 -0.29 -0.10 0 C
Neo Corp International 201312 38.02 138.56 0.26 120.99 17.82 8.20 2.96 6.66 1.64 5.02 5.02 1.32 0 C
Neo Corp International 201403 38.02 194.70 -2.88 175.45 16.37 9.05 1.22 6.10 7.07 -0.97 -0.97 -0.25 0 C
Neo Corp International 201406 38.02 261.35 0.69 235.49 26.55 8.94 2.59 15.02 4.45 10.57 10.57 2.78 0 C
Neo Corp International 201409 38.02 188.64 2.67 169.78 21.53 6.52 2.01 13.00 4.20 8.80 8.80 2.31 0 C
Netlink Solutions (India) 201312 2.97 0.12 0.14 0.07 0.06 0.01 0.05 0.00 0.04 0.04 0.01 0 S
Netlink Solutions (India) 201403 2.97 0.06 0.13 0.44 0.37 0.01 0.36 0.36 0.36 0.12 0 S
Netlink Solutions (India) 201406 2.97 0.05 0.26 2.13 1.92 0.02 1.90 0.36 1.54 1.54 0.52 0 S
Netlink Solutions (India) 201409 2.97 0.18 0.13 0.11 0.16 0.02 0.14 0.04 0.11 0.11 0.04 0 S
New Markets Advisory 201312 1.24 0.02 0.02 0.00 0.00 0.00 0.00 0 S
New Markets Advisory 201403 1.24 0.04 0.02 -0.02 0.00 -0.02 -0.02 -0.02 0 S
New Markets Advisory 201406 1.24 0.02 0.05 0.03 0.03 0.01 0.02 0.02 0.18 0 S
New Markets Advisory 201409 1.24 0.01 0.01 0.00 0.00 0.00 0.00 -0.02 0 S
Neycer India 201312 10.15 5.98 4.98 0.00 0.99 0.62 0.36 0.01 0.00 0.01 0.01 0.01 0 S
Neycer India 201403 10.15 6.44 6.53 0.11 0.01 0.42 0.40 -0.82 -0.31 -0.51 -0.51 -0.63 0 S
Neycer India 201406 10.15 6.18 5.51 0.01 0.67 0.50 0.39 -0.23 -0.23 -0.23 -0.23 0 S
Nikhil Adhesives 201312 3.91 62.50 0.26 58.68 0.02 4.10 1.56 0.61 0.66 0.66 0.66 1.67 0 C
Nikhil Adhesives 201403 3.91 64.46 0.24 61.92 0.16 2.94 1.42 0.62 0.96 0.11 0.85 0.85 2.18 0 C
Nikhil Adhesives 201406 3.91 64.47 0.21 62.53 0.25 2.40 1.54 0.51 0.36 0.04 0.32 0.32 0.81 0 C
Nikhil Adhesives 201409 3.91 60.02 0.27 58.07 -0.19 2.04 1.27 0.46 0.30 0.04 0.26 0.26 0.68 0 C
Nila Infrastructures 201312 29.52 21.18 16.20 0.90 5.88 2.58 0.24 3.06 1.13 1.93 1.93 0.07 10 S
Nila Infrastructures 201403 29.52 32.99 0.00 24.28 0.65 9.36 1.21 0.23 7.92 2.92 5.00 5.00 0.17 10 S
Nila Infrastructures 201406 29.52 27.59 22.68 0.99 5.91 2.39 0.35 3.17 1.13 2.05 2.05 0.07 10 S
Nila Infrastructures 201409 29.52 28.36 23.75 1.22 5.83 2.33 0.33 3.17 1.12 2.05 2.05 0.07 10 S
Nimbus Industries 201312 3.81 12.02 12.01 0.01 0.02 0.02 0.02 0.02 0.03 0 S
Nimbus Industries 201403 3.81 16.10 0.11 16.04 0.17 0.17 0.05 0.12 0.12 0.16 0 S
Nimbus Industries 201406 3.81 17.38 17.25 0.13 0.13 0.04 0.09 0.09 0.11 0 S
Nimbus Industries 201409 3.81 18.01 17.88 0.02 0.15 0.15 0.05 0.10 0.10 0.13 0 S

Co_Name Year Equity N.Sale O.O.I T. Exp O.I PBIDT Int. Dep. PBT T.Tax PAT A.PAT EPS Div (%)
Exp
ecte
d R
esu
lts
on
14
Feb
ruar
y 20
15
Northward Technologies 201312 3.55 0.08 0.10 -0.02 0.01 -0.03 -0.03 -0.03 -0.08 0 S
Northward Technologies 201403 3.55 0.06 0.22 -0.17 0.01 -0.17 -0.17 -0.17 -0.49 0 S
Northward Technologies 201406 3.55 0.00 0.10 0.00 -0.10 0.00 0.01 -0.11 0.00 -0.11 -0.11 -0.30 0 S
Northward Technologies 201409 3.55 0.14 -0.14 0.00 -0.14 -0.14 -0.14 -0.39 0 S
OCL Iron and Steel 201312 13.41 134.38 128.75 5.97 11.59 2.94 3.49 5.16 1.70 3.46 3.46 0.26 0 C
OCL Iron and Steel 201403 13.41 269.87 238.22 0.93 32.58 25.37 10.00 -2.79 -0.97 -1.82 -1.82 -0.23 0 C
OCL Iron and Steel 201406 13.41 346.42 306.72 2.05 41.76 28.24 13.43 0.09 0.06 0.04 0.04 0 C
OCL Iron and Steel 201409 13.41 268.83 2.22 236.58 34.46 31.35 13.80 -10.69 -3.40 -7.29 -7.29 -0.54 0 C
Odyssey Corporation 201312 19.70 0.14 0.84 0.25 -0.45 0.00 0.02 -0.47 -0.47 -0.47 -0.12 0 C
Odyssey Corporation 201403 19.70 0.12 2.21 0.97 -1.12 0.00 0.02 -1.14 -0.94 -0.20 -0.20 -0.05 0 C
Odyssey Corporation 201406 19.70 0.05 0.12 0.60 0.53 0.00 0.02 0.51 0.51 0.51 0.13 0 C
Odyssey Corporation 201409 19.70 2.75 3.13 0.98 0.59 0.02 0.58 0.58 0.58 0.15 0 C
Oil & Natural Gas Corporation 201312 4277.76 20744.66 107.58 10344.44 2662.33 13170.13 0.02 2588.36 10581.75 3455.78 7125.97 7125.97 8.33 190 C
Oil & Natural Gas Corporation 201403 4277.76 20880.93 432.16 12127.22 1371.83 10557.70 0.04 3580.35 6977.31 2088.31 4889.00 4889.00 5.71 190 C
Oil & Natural Gas Corporation 201406 4277.76 21747.00 104.27 12987.00 895.18 9759.45 0.13 2562.31 7197.01 2415.22 4781.79 4781.79 5.59 190 C
Oil & Natural Gas Corporation 201409 4277.76 20361.14 86.61 11419.12 1360.89 10389.52 0.14 2453.75 7935.63 2490.74 5444.89 5444.89 6.36 190 C
Oil India 201312 601.14 2606.98 123.40 1439.16 321.99 1613.21 33.04 220.78 1359.39 456.43 902.96 902.96 15.02 215 C
Oil India 201403 601.14 1825.22 122.93 1470.80 601.43 1078.78 34.53 224.39 819.86 254.24 565.62 565.62 9.41 215 C
Oil India 201406 601.14 2514.77 140.56 1400.17 281.68 1536.84 85.74 164.74 1286.36 434.49 851.87 851.87 14.17 215 C
Oil India 201409 601.14 2080.96 111.52 1383.29 429.78 1238.97 78.07 194.04 966.86 358.53 608.33 608.33 10.12 215 C
Optiemus Infracom 201312 85.81 1048.67 4.02 1026.18 9.66 36.17 11.54 4.94 19.69 6.74 12.95 12.95 1.51 0 C
Optiemus Infracom 201403 85.81 916.35 2.65 903.12 14.81 30.69 13.57 4.45 16.00 4.73 11.27 11.27 1.31 0 C
Optiemus Infracom 201406 85.81 578.69 4.97 557.99 0.46 26.13 9.28 7.88 8.97 3.12 5.85 5.85 0.65 0 C
Optiemus Infracom 201409 85.81 534.07 3.39 507.28 0.53 30.71 10.78 7.95 11.98 3.95 8.03 8.03 0.94 0 C
Organic Coatings 201312 7.68 9.92 9.54 0.00 0.37 0.51 0.35 -0.48 -0.48 -0.48 -0.62 0 S
Organic Coatings 201403 7.68 9.97 12.35 -0.55 -2.93 0.64 0.39 -4.34 0.00 -4.34 -4.34 -5.66 0 S
Organic Coatings 201406 7.68 12.12 11.50 0.29 0.91 0.48 0.41 0.03 0.03 0.03 0.04 0 S
Organic Coatings 201409 7.68 10.59 10.06 0.38 0.91 0.52 0.41 -0.01 -0.01 -0.01 -0.01 0 S
Oricon Enterprises 201312 20.51 225.01 0.30 208.77 6.67 23.20 3.67 10.23 9.30 3.97 5.33 2.22 0.18 22 C
Oricon Enterprises 201403 20.51 216.35 0.29 187.78 7.89 36.75 4.63 10.29 20.70 8.00 12.71 6.92 0.64 22 C
Oricon Enterprises 201406 20.51 243.04 0.35 220.52 7.02 29.88 3.62 8.95 17.31 6.34 10.97 6.06 0.56 22 C
Oricon Enterprises 201409 20.51 301.02 0.37 276.10 7.92 33.21 3.48 7.77 21.95 7.31 14.64 7.26 0.68 22 C
Oriental Veneer Products 201312 5.39 20.64 20.80 0.70 0.54 0.05 0.21 0.28 0.08 0.19 0.19 0.36 0 S
Oriental Veneer Products 201403 5.39 17.57 16.20 1.11 2.49 2.16 0.18 0.15 0.10 0.05 0.05 0.10 0 S
Oriental Veneer Products 201406 5.39 17.68 17.40 0.37 0.65 0.12 0.20 0.34 0.12 0.22 0.22 0.40 0 S
Oriental Veneer Products 201409 5.39 22.22 21.87 0.39 0.74 0.09 0.22 0.44 0.12 0.32 0.32 0.58 0 S
Ortin Laboratories 201312 16.94 9.41 3.46 11.56 0.04 1.36 0.87 0.38 0.11 0.05 0.07 0.07 0.04 0 S
Ortin Laboratories 201403 16.94 14.00 2.85 16.02 0.31 1.15 0.94 0.38 0.04 -0.06 0.10 0.10 0.06 0 S

Co_Name Year Equity N.Sale O.O.I T. Exp O.I PBIDT Int. Dep. PBT T.Tax PAT A.PAT EPS Div (%)
Exp
ecte
d R
esu
lts
on
14
Feb
ruar
y 20
15
Ortin Laboratories 201406 16.94 6.49 4.32 9.17 0.15 1.79 0.92 0.38 0.50 0.17 0.34 0.34 0.20 0 S
Ortin Laboratories 201409 16.94 10.92 5.94 14.74 0.03 2.15 0.91 0.14 1.10 0.36 0.75 0.75 0.44 0 S
Oswal Spinning & Weaving Mills 201312 9.09 37.97 0.61 36.62 0.00 1.95 1.57 0.18 0.21 0.00 0.21 0.21 0.02 0 S
Oswal Spinning & Weaving Mills 201403 9.09 27.34 6.11 34.78 0.21 -1.13 -1.24 -3.04 0.00 -3.04 -3.04 -0.33 0 S
Oswal Spinning & Weaving Mills 201406 9.09 21.21 0.24 23.83 -2.38 1.30 0.24 -3.92 -3.92 -3.92 -0.42 0 S
Oswal Spinning & Weaving Mills 201409 9.09 19.76 0.18 20.45 -0.51 1.20 0.24 -1.94 -1.94 -1.94 -0.21 0 S
Padmalaya Telefilms 201312 17.00 0.62 0.54 0.08 0.50 -0.42 -0.42 -0.42 -0.25 0 S
Padmalaya Telefilms 201403 17.00 0.65 0.01 0.49 0.17 0.50 -0.33 -0.53 0.20 0.20 0.12 0 S
Padmalaya Telefilms 201406 17.00 0.54 0.01 0.43 0.12 0.50 -0.39 -0.39 -0.39 -0.23 0 S
Padmalaya Telefilms 201409 17.00 0.55 0.01 0.47 0.09 0.50 -0.41 -0.41 -0.41 -0.24 0 S
Parabolic Drugs 201312 61.89 108.07 6.35 112.86 1.56 19.93 17.03 -35.40 -10.94 -24.46 -24.46 -3.95 0 C
Parabolic Drugs 201403 61.89 112.05 7.51 196.65 -77.09 23.55 17.02 -117.66 -29.67 -61.01 -87.99 -9.86 0 C
Parabolic Drugs 201406 61.89 109.64 0.84 109.15 1.33 18.14 17.23 -34.04 -10.52 -23.52 -23.52 -3.80 0 C
Parabolic Drugs 201409 61.89 49.64 0.77 55.02 -4.61 18.69 17.26 -40.57 -12.53 -28.04 -28.04 -4.53 0 C
Paras Petrofils 201312 33.42 3.16 2.92 0.17 0.41 0.04 0.02 0.35 0.14 0.21 0.21 0.01 0 S
Paras Petrofils 201403 33.42 1.39 1.74 0.13 -0.22 0.01 -0.35 3.57 2.58 -3.92 0.08 0 S
Paras Petrofils 201406 33.42 4.00 3.74 0.75 1.01 0.01 1.00 0.31 0.69 0.69 0.02 0 S
Paras Petrofils 201409 33.42 1.12 1.10 0.01 0.02 0.01 0.01 -0.24 0.18 0.25 0.01 0 S
Parasrampuria Synthetics 201312 66.28 12.76 13.14 0.07 -0.32 0.42 -0.74 -0.74 -0.74 -13.02 0 S
Parasrampuria Synthetics 201403 66.28 12.20 12.08 1.82 1.93 0.35 1.58 -0.05 1.61 1.63 -14.31 0 S
Parasrampuria Synthetics 201406 66.28 12.75 13.10 0.06 -0.29 0.36 -0.64 -0.64 -0.64 -14.80 0 S
Parasrampuria Synthetics 201409 66.28 13.02 12.75 0.05 0.32 0.00 0.35 -4.17 0.00 -4.17 -4.17 -15.45 0 S
Parnax Lab 201312 8.51 18.37 0.12 16.32 2.16 0.88 0.54 0.74 0.74 0.74 0.87 0 C
Parnax Lab 201403 8.51 21.67 0.28 20.16 1.79 1.09 0.54 -0.07 -0.07 -0.08 -0.09 0 C
Parnax Lab 201406 8.51 21.19 0.11 18.74 2.56 1.08 0.58 0.90 0.90 0.89 1.05 0 C
Parnax Lab 201409 8.51 26.92 0.11 23.62 3.41 1.03 0.60 1.78 1.78 1.78 2.09 0 C
Parsvnath Developers 201312 217.59 118.64 0.67 54.35 1.42 66.39 40.77 3.10 22.51 10.98 11.53 11.00 0.25 0 C
Parsvnath Developers 201403 217.59 89.38 0.79 90.31 7.77 7.63 47.54 2.93 -42.84 -16.12 -26.73 -22.84 -0.52 0 C
Parsvnath Developers 201406 217.59 95.56 0.78 42.57 4.59 58.36 44.41 2.36 11.59 5.47 6.12 6.15 0.14 0 C
Parsvnath Developers 201409 217.59 251.87 0.52 195.20 3.61 60.81 43.52 -4.27 21.56 9.73 11.83 12.65 0.29 0 C
Pasupati Spinning & Weaving Mills 201312 9.34 58.68 2.19 56.96 3.91 1.57 0.88 1.46 1.46 1.46 1.56 0 S
Pasupati Spinning & Weaving Mills 201403 9.34 54.46 0.19 52.37 2.28 2.22 0.88 -0.82 0.05 -1.86 -0.87 -1.98 0 S
Pasupati Spinning & Weaving Mills 201406 9.34 49.86 1.07 47.50 3.43 1.65 1.01 0.77 0.29 0.48 0.48 0.51 0 S
Pasupati Spinning & Weaving Mills 201409 9.34 52.03 0.48 49.82 2.69 1.65 1.00 0.04 0.02 0.02 0.02 0.03 0 S
Patidar Buildcon 201312 5.52 0.54 0.45 0.03 0.11 0.00 0.11 0.11 0.11 0.21 0 S
Patidar Buildcon 201403 5.52 0.72 0.03 0.77 -0.02 0.01 -0.03 0.07 -0.10 -0.10 -0.19 0 S
Patidar Buildcon 201406 5.52 0.42 0.02 0.45 0.03 0.03 0.00 0.03 0.03 0.03 0.05 0 S
Patidar Buildcon 201409 5.52 0.14 0.06 0.20 0.00 0.00 0.00 0.00 0.00 0.01 0 S

Co_Name Year Equity N.Sale O.O.I T. Exp O.I PBIDT Int. Dep. PBT T.Tax PAT A.PAT EPS Div (%)
Exp
ecte
d R
esu
lts
on
14
Feb
ruar
y 20
15
PBA Infrastructure 201312 13.50 65.71 1.03 57.91 8.83 7.44 2.19 -0.81 -0.81 -0.81 -0.06 0 S
PBA Infrastructure 201403 13.50 95.39 0.58 83.29 12.68 11.43 2.04 -0.80 -0.80 -0.80 -0.06 0 S
PBA Infrastructure 201406 13.50 70.34 0.35 63.20 7.49 6.17 2.15 -0.84 -0.84 -0.84 -0.06 0 S
PBA Infrastructure 201409 13.50 30.03 1.19 24.85 6.37 7.08 2.15 -2.85 -2.85 -2.85 -0.21 0 S
Perfect-Octave Media Projects 201312 34.01 3.07 3.04 0.03 0.03 0.03 0.03 0.01 0 S
Perfect-Octave Media Projects 201403 34.01 4.13 5.15 -1.02 2.72 -3.73 -0.88 -2.86 -2.86 -0.08 0 S
Perfect-Octave Media Projects 201406 34.01 3.05 3.06 0.00 0.66 -0.67 -0.67 -0.67 0 S
Perfect-Octave Media Projects 201409 34.01 0.35 0.04 0.78 -0.39 0.71 -1.09 -1.09 -1.09 -0.03 0 S
Pfizer 201312 29.84 247.70 24.49 225.79 28.13 74.53 0.08 1.74 72.71 25.11 47.60 47.60 15.95 3600 S
Pfizer 201403 29.84 251.69 22.79 201.57 16.31 89.22 0.19 2.03 87.00 30.97 56.03 56.03 18.78 3600 S
Pfizer 201406 29.84 239.85 26.31 203.91 10.08 72.33 0.12 2.26 69.95 23.80 46.15 46.15 15.47 3600 S
Pfizer 201409 29.84 269.45 27.03 246.36 9.98 60.10 0.05 1.90 -17.88 -6.05 -11.83 -11.83 -3.97 3600 S
Phaarmasia 201312 6.83 2.36 2.26 0.10 0.20 -0.11 -0.11 -0.11 0 S
Phaarmasia 201403 6.83 2.97 0.00 2.83 0.14 0.02 0.10 0.03 0.02 0.01 0.01 0.01 0 S
Phaarmasia 201406 6.83 2.94 2.76 0.18 0.00 0.08 0.10 0.03 0.07 0.07 0.09 0 S
Phaarmasia 201409 6.83 2.82 2.63 0.19 0.01 0.10 0.09 0.03 0.06 0.06 0.09 0 S
Pharmaids Pharmaceuticals 201312 3.36 0.45 0.53 0.01 -0.07 0.00 0.02 -0.10 -0.10 -0.10 -0.28 0 S
Pharmaids Pharmaceuticals 201403 3.36 0.40 0.77 0.07 -0.29 0.00 0.02 -0.32 -0.32 -0.32 -0.93 0 S
Pharmaids Pharmaceuticals 201406 3.36 0.45 0.49 0.08 0.04 0.02 0.02 0.02 0.02 0.05 0 S
Pharmaids Pharmaceuticals 201409 3.36 0.45 0.46 0.05 0.04 0.02 0.02 0.02 0.02 0.07 0 S
Phoenix Lamps 201312 28.02 74.99 59.54 1.47 16.92 1.75 1.22 13.95 -1.57 15.52 15.52 5.54 160 C
Phoenix Lamps 201403 28.02 66.73 49.64 -0.37 16.72 0.88 3.40 12.32 -0.57 12.89 12.89 4.60 160 C
Phoenix Lamps 201406 28.02 56.11 46.22 0.33 10.22 0.71 1.43 8.08 1.55 6.52 6.52 2.33 160 C
Phoenix Lamps 201409 28.02 63.63 49.67 0.02 13.98 1.16 1.99 10.83 2.86 7.97 7.97 2.85 160 C
Piccadily Agro Industries 201312 23.59 70.36 -0.23 61.18 0.83 9.77 1.46 2.47 5.85 1.90 3.95 3.95 1.67 0 C
Piccadily Agro Industries 201403 23.59 98.12 -1.72 81.11 0.87 16.15 2.16 2.48 11.51 5.07 6.44 6.44 2.73 0 C
Piccadily Agro Industries 201406 23.59 103.16 2.09 89.41 1.06 16.90 3.04 2.59 11.27 3.97 7.30 7.30 3.10 0 C
Piccadily Agro Industries 201409 23.59 84.65 0.91 75.21 1.07 11.42 2.05 2.83 6.55 1.57 4.97 4.97 2.11 0 C
Piccadily Sugar & Allied Industries 201312 23.22 3.61 0.16 2.82 0.00 0.95 0.07 0.41 0.46 0.14 0.32 0.32 0.14 0 S
Piccadily Sugar & Allied Industries 201403 23.22 3.64 0.62 3.78 0.00 0.48 0.07 0.40 0.05 -0.07 0.11 0.11 0.05 0 S
Piccadily Sugar & Allied Industries 201406 23.22 2.61 0.15 2.58 0.00 0.18 0.07 0.41 -0.30 -0.12 -0.18 -0.18 -0.08 0 S
Piccadily Sugar & Allied Industries 201409 23.22 2.89 0.01 2.52 0.00 0.38 0.08 0.85 -0.55 -0.04 -0.51 -0.51 -0.22 0 S
PlanterS Polysacks 201312 1.40 0.04 0.05 0.01 0.01 0.00 0.01 0.01 0.04 0 S
PlanterS Polysacks 201403 1.40 0.00 0.00 0 S
PlanterS Polysacks 201406 1.40 0.02 -0.02 -0.02 -0.02 -0.02 -0.12 0 S
PlanterS Polysacks 201409 1.40 0.00 0.00 0.00 0.00 0.00 -0.01 0 S

Co_Name Year Equity N.Sale O.O.I T. Exp O.I PBIDT Int. Dep. PBT T.Tax PAT A.PAT EPS Div (%)
Exp
ecte
d R
esu
lts
on
14
Feb
ruar
y 20
15
Pochiraju Industries 201312 18.91 25.80 22.12 3.68 1.51 1.33 0.83 0.05 0.78 0.78 0.41 0 S
Pochiraju Industries 201403 18.91 47.38 39.64 7.74 1.48 1.72 4.54 0.43 4.10 4.10 2.17 0 S
Pochiraju Industries 201406 18.91 36.16 28.40 7.75 1.56 1.72 4.48 0.10 4.38 4.38 2.32 0 S
Pochiraju Industries 201409 18.91 39.36 31.54 7.81 1.48 1.72 4.61 0.20 4.41 4.41 2.33 0 S
Polo Hotels 201312 8.84 0.02 0.21 0.18 0.07 0.05 0.06 0.06 0.06 0 S
Polo Hotels 201403 8.84 0.03 0.21 0.18 0.10 0.03 0.05 0.05 0.05 0 S
Polo Hotels 201406 8.84 0.03 0.21 0.18 0.10 0.03 0.05 0.05 0.05 0 S
Polo Hotels 201409 8.84 0.02 0.27 0.25 0.10 0.07 0.09 0.09 0.09 0 S
Polson 201312 0.60 22.11 0.99 19.55 3.56 1.95 0.75 0.86 0.28 0.58 0.58 47.92 0 S
Polson 201403 0.60 22.19 0.54 18.76 3.97 1.96 0.53 1.48 0.87 0.61 0.61 50.73 0 S
Polson 201406 0.60 23.64 0.51 20.55 0.50 4.11 1.57 0.63 1.91 0.63 1.28 1.28 106.25 0 S
Polson 201409 0.60 27.93 0.55 24.45 0.61 4.65 1.70 0.63 2.32 0.70 1.62 1.62 134.63 0 S
Poona Dal & Oil Industries 201312 5.71 76.63 75.68 0.06 1.01 0.08 0.27 0.65 0.20 0.45 0.45 0.80 0 S
Poona Dal & Oil Industries 201403 5.71 59.42 58.54 0.25 1.13 0.48 0.28 0.37 0.22 0.14 0.15 0.27 0 S
Poona Dal & Oil Industries 201406 5.71 51.73 50.94 0.14 0.92 0.12 0.24 0.57 0.18 0.39 0.39 0.68 0 S
Poona Dal & Oil Industries 201409 5.71 55.45 54.67 0.10 0.88 0.04 0.28 0.56 0.17 0.39 0.39 0.68 0 S
Premier Energy & Infrastructure 201312 41.35 9.29 0.07 8.36 1.00 -0.03 0.01 1.02 0.16 0.86 0.86 0.21 0 C
Premier Energy & Infrastructure 201403 41.35 8.79 7.88 0.03 0.94 0.06 0.01 0.87 0.26 0.61 0.61 0.15 0 C
Premier Energy & Infrastructure 201406 41.35 15.26 10.69 0.16 4.73 0.52 0.00 4.21 1.39 2.82 2.82 0.68 0 C
Prime Focus 201312 18.54 213.68 168.88 5.72 50.51 16.28 25.17 8.94 0.93 8.01 10.33 0.56 0 C
Prime Focus 201403 18.54 235.51 1.09 194.24 -2.17 40.19 10.76 27.68 0.92 9.30 -8.38 -7.16 -0.39 0 C
Prime Focus 201406 18.54 199.01 0.29 185.09 10.31 24.52 17.50 29.44 -31.24 -16.15 -15.09 -8.78 -0.47 0 C
Prime Focus 201409 18.54 22.81 2.52 15.25 0.64 10.72 4.13 5.44 1.15 -0.05 1.20 1.20 0.06 0 C
Prime Industries 201312 7.86 0.05 0.03 0.00 0.03 0.00 0.00 0.02 0.00 0.02 0.02 0.03 0 S
Prime Industries 201403 7.86 -0.01 0.02 -0.03 0.01 0.02 -0.06 -0.01 -0.05 -0.05 -0.06 0 S
Prime Industries 201406 7.86 0.02 0.04 -0.02 -0.02 -0.02 -0.02 0 S
Prime Industries 201409 7.86 0.05 0.03 0.03 0.00 0.03 0.03 0.03 0 S
Prime Securities 201312 13.28 -0.38 0.22 0.05 -0.55 0.06 -0.61 -0.61 -0.61 -0.23 0 C
Prime Securities 201403 13.28 -0.79 0.40 0.05 -1.14 0.87 0.06 -2.18 -2.18 -2.18 -0.82 0 C
Prime Securities 201406 13.28 -7.15 0.33 -7.48 0.06 -2.91 -2.91 -2.91 -1.10 0 C
Prime Securities 201409 13.28 0.13 1.06 0.07 -0.86 0.06 -0.92 -0.92 -0.92 -0.35 0 C
Prithvi Softech 201312 5.50 1.72 1.06 0.05 0.72 0.03 0.70 0.23 0.47 0.47 0.85 5 S
Prithvi Softech 201403 5.50 2.02 1.32 0.12 0.82 0.04 0.03 0.76 0.40 0.36 0.36 0.65 5 S
Prithvi Softech 201406 5.50 2.51 1.13 0.09 1.46 0.01 0.03 1.42 0.46 0.96 0.96 1.75 5 S
Prithvi Softech 201409 5.50 2.14 1.15 0.07 1.06 0.00 0.03 1.03 0.34 0.70 0.70 1.26 5 S

Co_Name Year Equity N.Sale O.O.I T. Exp O.I PBIDT Int. Dep. PBT T.Tax PAT A.PAT EPS Div (%)
Exp
ecte
d R
esu
lts
on
14
Feb
ruar
y 20
15
PS IT Infrastructure & Services 201312 53.76 9.80 9.79 -0.25 -0.24 -0.24 -0.24 -0.24 -0.05 0 S
PS IT Infrastructure & Services 201403 53.76 17.76 17.66 -0.51 -0.40 -0.40 0.33 -0.73 -0.73 -0.14 0 S
PS IT Infrastructure & Services 201406 53.76 16.39 16.41 0.27 0.25 0.25 0.25 0.25 0.05 0 S
PS IT Infrastructure & Services 201409 53.76 109.02 108.62 0.40 0.40 0.40 0.40 0.01 0 S
Pudumjee Pulp & Paper Mills 201312 8.20 53.75 2.01 52.23 2.41 5.94 1.97 2.02 1.95 0.13 1.82 1.82 0.44 15 C
Pudumjee Pulp & Paper Mills 201403 8.20 53.56 10.13 49.42 1.83 16.10 2.49 2.04 11.57 0.49 11.08 11.08 2.70 15 C
Pudumjee Pulp & Paper Mills 201406 8.20 68.04 0.40 65.58 2.35 5.21 2.12 1.30 1.79 0.59 1.20 1.20 0.29 15 C
Pudumjee Pulp & Paper Mills 201409 8.20 70.49 0.57 67.99 2.75 5.82 1.77 1.32 2.73 0.93 1.80 1.80 0.44 15 C
Raasi Refractories 201312 4.71 4.16 0.03 4.67 -0.48 0.01 0.26 -0.75 -0.75 -0.75 -1.60 0 S
Raasi Refractories 201403 4.71 3.57 3.97 -0.41 0.06 0.26 -0.72 -0.72 -0.72 -1.53 0 S
Raasi Refractories 201406 4.71 4.23 4.74 -0.51 0.01 0.26 -0.78 -0.78 -0.78 -1.66 0 S
Raasi Refractories 201409 4.71 4.23 4.83 -0.60 0.01 0.16 -0.77 -0.77 -0.77 -1.63 0 S
Raghunath International 201312 5.00 0.70 0.55 0.10 0.25 0.02 0.02 0.21 0.06 0.16 0.16 0.31 0 S
Raghunath International 201403 5.00 0.24 0.11 -0.14 0.03 0.01 -0.18 -0.06 -0.12 -0.12 -0.23 0 S
Raghunath International 201406 5.00 0.12 0.10 -0.02 0.02 0.01 -0.05 -0.02 -0.04 -0.04 0.07 0 S
Raghunath International 201409 5.00 2.29 1.99 0.10 0.39 0.01 0.38 0.10 0.28 0.28 0.01 0 S
Rai Saheb Rekhchand Mohota Spinning & Weaving Mills 201312 4.17 65.15 60.79 -0.06 4.30 2.64 1.13 0.53 0.53 0.53 1.27 1 S
Rai Saheb Rekhchand Mohota Spinning & Weaving Mills 201403 12.51 68.46 64.44 0.24 4.26 3.07 0.83 0.36 0.18 0.18 0.18 0.14 1 S
Rai Saheb Rekhchand Mohota Spinning & Weaving Mills 201406 12.51 47.76 44.16 3.60 2.37 1.05 0.18 0.18 0.18 0.14 1 S
Rai Saheb Rekhchand Mohota Spinning & Weaving Mills 201409 12.51 66.82 63.02 0.29 4.09 2.69 1.06 0.34 0.34 0.34 0.27 1 S
Rainbow Papers 201312 19.79 288.90 2.56 241.70 0.06 49.82 17.59 12.60 19.63 19.63 19.63 1.98 20 C
Rainbow Papers 201403 19.79 322.51 2.26 273.60 1.12 52.29 17.90 13.09 21.30 9.70 11.60 11.60 1.17 20 C
Rainbow Papers 201406 21.24 287.38 1.14 240.85 2.27 49.94 19.47 9.71 20.92 20.92 20.92 2.10 20 C
Rainbow Papers 201409 21.24 304.00 1.74 264.81 2.69 43.62 19.27 9.81 14.54 14.54 14.54 1.37 20 C
Raj Rayon Industries 201312 26.65 87.57 0.83 103.00 0.53 -14.07 14.63 11.19 -39.89 -13.04 -26.86 -26.86 -1.01 0 S
Raj Rayon Industries 201403 26.65 40.06 0.49 47.72 0.87 -6.31 11.54 3.00 -20.85 -5.02 -15.83 -15.83 -0.59 0 S
Raj Rayon Industries 201406 26.65 10.67 0.01 14.06 6.12 2.74 15.84 9.30 -22.40 -7.09 -15.32 -15.32 -0.57 0 S
Raj Rayon Industries 201409 26.65 9.33 0.01 7.20 0.31 2.45 16.22 9.31 -23.08 -7.12 -15.95 -15.95 -0.60 0 S
Rajasthan Cylinders & Containers 201403 3.36 17.07 16.96 0.10 0.21 0.21 0.05 -0.05 0.06 -0.11 -0.11 -0.32 0 S
Rajasthan Cylinders & Containers 201406 3.36 15.22 15.43 0.00 -0.22 0.15 0.14 -0.51 0.00 -0.51 -0.51 -1.51 0 S
Rajasthan Cylinders & Containers 201409 3.36 12.72 13.07 -0.35 0.15 0.13 -0.63 -0.63 -0.63 -1.87 0 S
Rajesh Exports 201312 29.53 5022.99 4850.13 0.05 172.92 80.71 0.54 91.67 91.67 91.67 3.10 100 C
Rajesh Exports 201403 29.53 12230.47 12008.34 0.51 222.64 103.57 14.78 104.29 44.40 59.90 59.34 2.00 100 C
Rajesh Exports 201406 29.53 7905.05 7655.13 2.14 252.06 119.24 14.47 118.35 118.35 118.35 4.00 100 C
Rajesh Exports 201409 29.53 10959.43 10697.07 1.97 264.33 90.04 14.52 159.77 159.77 159.77 5.41 100 C

Co_Name Year Equity N.Sale O.O.I T. Exp O.I PBIDT Int. Dep. PBT T.Tax PAT A.PAT EPS Div (%)
Exp
ecte
d R
esu
lts
on
14
Feb
ruar
y 20
15
Rajesh Solvex 201312 5.50 0.08 1.57 1.40 0.25 0.17 0.04 0.05 0.05 0.05 0.16 0 S
Rajesh Solvex 201403 5.50 1.30 1.65 2.38 0.00 0.57 0.10 0.05 0.42 0.00 0.42 0.42 0.76 0 S
Rajesh Solvex 201406 5.50 0.03 1.96 1.52 0.01 0.48 0.19 0.04 0.25 0.25 0.25 0.44 0 S
Rajesh Solvex 201409 5.50 1.66 1.33 0.33 0.20 0.04 0.09 0.09 0.09 0.17 0 S
Rajkumar Forge 201312 10.94 4.97 0.12 6.14 -0.15 -1.21 0.49 -1.69 -0.40 -1.29 -1.29 -1.18 0 S
Rajkumar Forge 201403 10.94 7.06 -0.03 6.36 -0.54 0.13 0.26 -0.13 0.09 -0.22 -0.22 -0.20 0 S
Rajkumar Forge 201406 10.94 9.80 0.17 9.18 0.40 1.19 0.27 0.39 0.53 1.17 -0.64 -0.64 -0.58 0 S
Rajkumar Forge 201409 10.94 4.56 0.06 4.76 0.86 0.72 0.09 0.27 0.36 0.11 0.25 0.25 0.22 0 S
Rajvir Industries 201312 3.04 45.43 0.31 44.20 0.27 1.80 5.74 3.00 -6.94 -1.62 -5.33 -5.33 -17.56 0 S
Rajvir Industries 201403 3.04 17.03 0.38 43.39 12.55 -13.43 6.54 3.00 -22.97 -7.98 -14.99 -14.99 -49.40 0 S
Rajvir Industries 201406 3.04 27.27 0.43 22.77 0.30 5.22 5.68 2.64 -3.10 -1.03 -2.07 -2.07 -6.82 0 S
Rajvir Industries 201409 3.04 25.66 0.50 22.50 0.18 3.84 4.61 2.45 -3.22 -1.16 -2.06 -2.06 -6.80 0 S
Ram Info 201312 6.28 2.62 2.48 0.04 0.18 0.01 0.08 0.08 0.08 0.08 0.13 0 S
Ram Info 201403 6.28 2.24 1.66 0.02 0.60 0.02 0.09 0.49 0.49 0.49 0.79 0 S
Ram Info 201406 6.28 2.42 2.07 0.01 0.36 0.01 0.09 0.25 0.25 0.25 0.40 0 S
Ram Info 201409 6.28 3.13 2.55 0.04 0.61 0.01 0.20 0.41 0.41 0.41 0.65 0 S
Rana Sugars 201312 153.54 117.37 0.43 83.64 34.16 26.23 16.36 -8.43 -8.45 -8.43 -0.55 0 S
Rana Sugars 201403 153.54 320.41 8.04 268.91 59.54 20.95 15.60 22.99 -5.56 28.46 28.54 1.85 0 S
Rana Sugars 201406 153.54 77.24 0.35 68.78 8.81 18.87 0.62 -10.68 -10.68 -10.68 -0.70 0 S
Rana Sugars 201409 153.54 71.13 0.02 80.70 0.00 -9.56 19.05 0.62 -29.22 0.00 -29.27 -29.22 -1.90 0 S
Ranklin Solutions 201312 12.04 0.03 0.01 0.02 0.55 -0.54 0.15 -0.69 -0.69 -0.57 5 S
Ranklin Solutions 201403 12.04 0.03 0.01 0.00 0.02 0.00 1.04 -1.02 0.00 -1.02 -1.02 -0.85 5 S
Ranklin Solutions 201406 12.04 0.03 0.01 0.00 0.02 0.00 0.55 -0.53 0.00 -0.53 -0.53 -0.44 5 S
Ranklin Solutions 201409 12.04 0.03 0.01 0.03 0.55 -0.53 -0.53 -0.53 -0.44 5 S
Refex Industries 201312 15.48 6.67 5.64 0.02 1.05 0.19 0.62 0.23 0.23 0.23 0.15 0 S
Refex Industries 201403 15.48 6.15 7.16 3.38 2.38 1.44 0.47 0.46 0.46 0.46 0.30 0 S
Refex Industries 201406 15.48 4.38 3.54 0.00 0.84 0.00 0.50 0.34 0.34 0.34 0.22 0 S
Refex Industries 201409 15.48 3.06 2.35 0.01 0.71 0.00 0.51 0.20 0.20 0.20 0.13 0 S
Rei Agro 201312 95.80 2968.02 2647.81 10.91 331.13 182.92 18.41 129.80 0.19 129.61 129.67 1.35 0 C
Rei Agro 201403 95.80 1061.36 0.00 861.50 0.78 200.65 182.99 18.02 -50.88 -3.32 -47.56 -46.89 0 C
Rei Agro 201406 95.80 532.63 692.16 3.94 -155.60 165.45 27.99 -623.03 -623.03 -623.03 -6.50 0 C
Rei Agro 201409 95.80 519.19 1528.07 3.74 -1005.13 -0.63 -5.76 -999.15 -999.15 -999.15 -6.51 0 C
REI Six Ten Retail 201312 29.42 0.45 1.02 0.20 -0.38 0.01 0.83 -1.21 -1.21 -1.21 -0.08 0 S
REI Six Ten Retail 201403 29.42 76.98 75.58 0.00 1.40 0.03 -0.37 -10.10 -10.10 -10.10 -0.69 0 S
REI Six Ten Retail 201406 29.42 0.37 0.71 0.00 -0.34 0.00 0.10 -30.81 -30.81 -30.81 -2.09 0 S
REI Six Ten Retail 201409 29.42 0.03 0.21 0.00 -0.18 0.04 -0.22 -0.22 -0.22 -0.01 0 S

Co_Name Year Equity N.Sale O.O.I T. Exp O.I PBIDT Int. Dep. PBT T.Tax PAT A.PAT EPS Div (%)
Exp
ecte
d R
esu
lts
on
14
Feb
ruar
y 20
15
Reliance Infrastructure 201312 263.03 3815.41 80.85 3227.17 322.15 991.24 376.31 129.56 485.37 125.68 359.69 450.45 17.13 75 C
Reliance Infrastructure 201403 262.58 4661.22 46.47 4033.31 328.31 1002.69 451.23 126.35 425.11 -85.20 510.31 621.42 23.63 75 C
Reliance Infrastructure 201406 262.58 4135.10 15.79 3465.48 397.60 1083.01 480.75 142.03 460.23 106.14 354.09 457.62 17.40 75 C
Reliance Infrastructure 201409 262.58 4035.56 22.39 3333.13 429.13 1153.95 564.64 227.36 361.95 52.81 309.14 431.19 16.40 75 C
Reliance Power 201312 2805.13 1372.61 872.37 110.92 611.16 179.89 103.65 327.62 60.40 267.22 267.22 0.95 0 C
Reliance Power 201403 2796.63 1296.10 62.56 822.95 40.89 576.60 181.41 73.63 321.56 52.68 268.88 268.88 0.96 0 C
Reliance Power 201406 2796.63 1753.07 1118.41 57.43 692.09 257.68 133.17 301.24 56.89 244.35 244.35 0.87 0 C
Reliance Power 201409 2796.63 1783.24 1186.04 100.94 698.14 261.08 132.80 304.26 51.19 253.07 253.07 0.90 0 C
Remi Edelstahl Tubulars 201312 9.58 28.99 0.81 27.02 0.01 2.79 1.35 0.77 0.67 0.24 0.43 0.43 0.45 0 S
Remi Edelstahl Tubulars 201403 9.58 39.82 0.59 36.65 3.77 2.14 0.80 0.83 0.23 0.60 0.60 0.63 0 S
Remi Edelstahl Tubulars 201406 9.58 34.03 0.20 31.47 0.08 2.85 2.62 1.13 -0.90 -0.30 -0.61 -0.61 -0.64 0 S
Remi Edelstahl Tubulars 201409 9.58 51.22 0.17 47.23 0.11 4.26 2.34 1.16 0.75 0.24 0.51 0.51 0.53 0 S
Remi Elektrotechnik 201312 4.87 19.06 0.09 16.99 0.07 2.23 0.92 0.37 0.93 0.30 0.63 0.63 1.30 0 S
Remi Elektrotechnik 201403 4.87 29.35 0.15 26.04 0.11 3.57 0.12 0.40 3.05 1.04 2.01 2.01 4.14 0 S
Remi Elektrotechnik 201406 4.87 27.03 0.08 23.45 0.03 3.69 1.02 0.39 2.28 0.74 1.54 1.54 3.16 0 S
Remi Elektrotechnik 201409 4.87 26.85 0.10 22.50 0.08 4.53 1.13 0.40 3.00 1.06 1.94 1.94 3.98 0 S
Remi Process Plant & Machinery 201312 1.76 3.12 0.03 3.11 0.18 0.22 -0.11 0.13 0.20 0.08 0.12 0.12 0.70 6 S
Remi Process Plant & Machinery 201403 1.76 2.64 0.07 2.77 0.29 0.22 -0.30 0.13 0.39 0.04 0.35 0.35 1.97 6 S
Remi Process Plant & Machinery 201406 1.76 3.72 0.25 3.79 0.37 0.55 0.14 0.42 0.12 0.30 0.30 1.68 6 S
Remi Process Plant & Machinery 201409 1.76 5.65 0.34 5.86 0.29 0.41 0.16 0.26 0.08 0.17 0.17 0.98 6 S
Remi Sales & Engg. 201312 0.57 24.27 23.91 0.01 0.37 0.00 0.10 0.26 0.07 0.19 0.19 3.39 0 S
Remi Sales & Engg. 201403 0.57 32.84 31.90 0.13 1.07 0.02 0.08 0.98 0.33 0.64 0.64 11.30 0 S
Remi Sales & Engg. 201406 0.57 44.64 43.06 0.19 1.77 0.14 0.10 1.53 0.50 1.03 1.03 18.13 0 S
Remi Sales & Engg. 201409 0.57 30.85 30.03 0.13 0.95 0.07 0.10 0.78 0.26 0.53 0.53 9.24 0 S
Remi Securities 201312 1.75 0.16 0.04 0.00 0.12 0.26 -0.14 -0.04 -0.10 -0.10 -0.55 0 S
Remi Securities 201403 1.75 0.17 0.01 0.05 0.22 0.24 -0.02 -0.02 0.00 0.00 0.01 0 S
Remi Securities 201406 1.75 0.14 0.02 0.12 0.25 -0.13 -0.04 -0.09 -0.09 -0.52 0 S
Remi Securities 201409 1.75 0.13 0.02 0.01 0.13 0.22 1.83 -0.03 1.87 1.87 10.66 0 S
Remsons Industries 201312 5.71 30.75 0.26 29.04 0.29 2.25 0.60 0.59 1.06 0.36 0.70 0.70 1.22 0 S
Remsons Industries 201403 5.71 27.53 0.46 26.80 0.15 1.34 0.63 0.58 0.13 0.10 0.04 0.04 0.06 0 S
Remsons Industries 201406 5.71 25.45 0.21 25.46 0.05 0.25 0.50 0.54 -0.80 -0.26 -0.54 -0.54 -0.95 0 S
Remsons Industries 201409 5.71 30.02 0.23 29.29 0.17 1.12 0.55 0.56 0.02 0.05 -0.04 -0.04 -0.06 0 S
Revathi Equipment 201312 3.07 37.45 0.74 38.71 1.17 0.65 3.00 0.93 -3.29 0.58 -3.87 -4.60 -14.99 0 C
Revathi Equipment 201403 3.07 50.35 -0.88 45.38 1.96 6.06 3.04 0.95 -5.82 0.28 -6.09 -7.29 0 C
Revathi Equipment 201406 3.07 28.07 0.28 25.23 0.44 3.57 2.54 0.61 0.42 0.17 0.25 -0.35 -1.10 0 C
Revathi Equipment 201409 3.07 32.13 -0.01 27.86 1.71 5.98 2.42 0.66 2.90 1.13 1.77 0.30 1.00 0 C

Co_Name Year Equity N.Sale O.O.I T. Exp O.I PBIDT Int. Dep. PBT T.Tax PAT A.PAT EPS Div (%)
Exp
ecte
d R
esu
lts
on
14
Feb
ruar
y 20
15
Riga Sugar Company 201312 9.12 37.15 0.01 40.20 0.08 -2.96 2.83 1.54 -7.33 -7.33 -7.33 -7.39 0 S
Riga Sugar Company 201403 10.64 22.63 1.37 0.37 0.18 23.81 3.10 1.37 19.34 0.24 19.10 19.10 17.95 0 S
Riga Sugar Company 201406 10.64 36.30 0.40 34.03 0.03 2.70 3.92 0.90 -2.12 0.00 -2.12 -2.12 -1.99 0 S
Riga Sugar Company 201409 10.64 40.18 0.10 47.90 0.04 -7.59 3.94 0.84 -12.37 -12.37 -12.37 -11.62 0 S
Ritesh Properties & Industries 201312 11.59 1.65 1.44 0.07 0.28 -0.08 0.07 0.29 0.05 0.24 0.24 0.20 0 C
Ritesh Properties & Industries 201403 11.59 2.85 0.03 3.53 0.80 0.14 0.02 0.04 0.08 0.03 -0.52 0.05 -0.44 0 C
Ritesh Properties & Industries 201406 11.59 1.67 1.26 0.04 0.45 0.01 0.07 0.37 0.07 0.30 0.30 0.26 0 C
Ritesh Properties & Industries 201409 11.59 1.98 1.60 0.10 0.47 0.01 0.04 0.45 0.09 0.36 0.36 0.31 0 C
RM Mohite Industries 201312 20.10 41.26 35.76 0.00 5.49 2.49 2.28 0.72 0.72 0.72 0.36 0 S
RM Mohite Industries 201403 20.10 58.23 50.55 0.35 8.03 4.04 2.41 1.59 0.31 1.28 1.28 0.64 0 S
RM Mohite Industries 201406 20.10 54.49 49.56 0.99 5.92 1.59 2.20 2.12 2.12 2.12 1.06 0 S
RM Mohite Industries 201409 20.10 54.56 47.95 0.02 6.62 1.41 2.34 2.87 2.87 2.87 1.43 0 S
Rohit Ferro-Tech 201312 113.78 505.39 7.32 548.18 2.42 -33.05 45.72 7.58 -86.35 -29.52 -56.83 -56.83 -5.00 0 C
Rohit Ferro-Tech 201403 113.78 656.66 10.78 723.54 0.82 -55.29 37.83 7.42 -100.54 17.00 -117.54 -117.54 -10.33 0 C
Rohit Ferro-Tech 201406 113.78 428.56 5.39 479.63 4.37 -41.31 48.71 6.54 -96.56 -96.56 -96.56 -8.49 0 C
Rohit Ferro-Tech 201409 113.78 518.47 5.59 591.11 0.94 -66.11 47.45 6.50 -120.06 -120.06 -120.06 -10.55 0 C
RPP Infra Projects 201312 22.60 65.67 57.60 2.79 10.86 4.12 1.97 4.77 0.64 4.13 4.13 1.83 5 C
RPP Infra Projects 201403 22.60 52.76 44.87 1.23 9.13 4.02 1.93 3.18 1.60 1.57 1.57 0.70 5 C
RPP Infra Projects 201406 22.60 47.10 39.29 1.96 9.77 3.87 2.04 3.85 0.87 2.99 2.99 1.32 5 C
RPP Infra Projects 201409 22.60 60.26 51.44 1.50 10.32 4.33 0.10 5.89 1.77 4.12 4.12 1.82 5 C
RTCL 201312 12.00 0.36 0.17 0.05 0.24 0.16 0.05 0.02 0.01 0.02 0.02 0.01 0 S
RTCL 201403 12.00 1.45 1.70 0.68 0.43 0.20 0.04 0.19 0.06 0.11 0.13 0.09 0 S
RTCL 201406 12.00 0.11 0.06 -0.05 0.17 0.04 -0.26 -0.08 -0.18 -0.19 -0.15 0 S
RTCL 201409 12.00 0.12 0.06 -0.06 0.18 0.04 -0.28 -0.09 -0.20 -0.20 -0.17 0 S
RTS Power Corporation 201312 8.17 32.79 0.56 30.54 0.17 2.97 2.37 0.37 0.22 0.22 0.22 0.27 0 C
RTS Power Corporation 201403 8.17 48.15 1.19 43.13 0.40 6.60 2.58 0.37 3.65 0.03 3.62 3.62 4.43 0 C
RTS Power Corporation 201406 8.17 35.71 0.83 34.10 0.17 2.61 2.81 0.34 -0.53 -0.53 -0.53 -0.06 0 C
RTS Power Corporation 201409 8.17 35.01 0.76 32.59 0.20 3.38 3.02 0.35 0.01 0.01 0.01 0.01 0 C
Saboo Brothers 201312 6.10 0.00 0.05 0.06 0.01 0.01 0.01 0.01 0.01 0.01 0 S
Saboo Brothers 201403 6.10 0.03 0.63 0.11 -0.49 0.00 -0.49 -0.49 -0.49 -0.81 0 S
Saboo Brothers 201406 6.10 0.03 0.05 0.02 0.00 0.02 0.02 0.02 0.02 0 S
Saboo Brothers 201409 6.10 0.03 0.05 0.02 0.00 0.02 0.02 0.02 0.02 0 S
Sakthi Finance 201312 50.00 32.30 8.05 0.53 24.78 19.65 0.64 4.49 1.47 3.02 3.02 0.60 10 S
Sakthi Finance 201403 50.00 34.68 10.03 2.82 27.47 20.92 0.62 5.93 1.71 4.23 4.23 0.85 10 S
Sakthi Finance 201406 50.00 34.66 8.51 1.13 27.28 21.34 0.69 5.25 1.88 3.37 3.37 0.67 10 S
Sakthi Finance 201409 50.00 35.06 8.46 1.33 27.94 21.89 0.71 5.34 1.40 3.94 3.94 0.79 10 S

Co_Name Year Equity N.Sale O.O.I T. Exp O.I PBIDT Int. Dep. PBT T.Tax PAT A.PAT EPS Div (%)
Exp
ecte
d R
esu
lts
on
14
Feb
ruar
y 20
15
Sakthi Sugars 201312 36.81 109.32 0.58 124.10 0.75 -13.45 45.95 16.69 -76.09 -19.54 -56.56 -56.56 -15.37 0 C
Sakthi Sugars 201403 96.21 222.18 1.53 186.51 0.93 38.14 57.85 16.43 -36.14 -22.03 -14.12 -14.12 -3.72 0 C
Sakthi Sugars 201406 96.21 226.30 1.26 213.00 0.96 15.52 46.04 14.65 -45.17 -8.63 -36.54 -36.54 -3.80 0 C
Sakthi Sugars 201409 96.21 155.82 0.70 151.45 0.59 5.65 45.67 14.68 -54.70 -18.17 -36.53 -36.53 -3.80 0 C
SAL Steel 201312 84.97 87.04 0.49 82.93 4.59 8.17 4.81 -8.39 -2.80 -5.59 -5.59 -0.66 0 S
SAL Steel 201403 84.97 89.67 0.29 87.65 2.31 8.22 3.23 -9.43 0.38 -9.81 -9.81 -4.17 0 S
SAL Steel 201406 84.97 95.92 0.04 92.06 3.90 7.62 2.95 -6.68 -1.28 -5.40 -5.40 -0.64 0 S
SAL Steel 201409 84.97 83.30 0.27 78.21 5.35 7.99 2.77 -5.41 -0.85 -4.56 -4.56 -0.54 0 S
Sam Industries 201312 11.09 1.92 1.51 0.24 0.65 0.00 0.39 0.26 0.07 0.19 0.19 0.17 0 S
Sam Industries 201403 11.09 2.68 1.99 0.39 1.08 0.03 0.29 0.66 -0.32 0.98 0.98 0.88 0 S
Sam Industries 201406 11.09 1.54 1.42 0.20 0.32 0.00 0.16 0.16 0.06 0.10 0.10 0.09 0 S
Sam Industries 201409 11.09 1.82 1.73 0.44 0.53 0.19 0.34 0.19 0.15 0.15 0.13 0 S
Sam Leaseco 201312 10.20 0.02 0.27 0.24 0.24 0.05 0.20 0.20 0.19 0 S
Sam Leaseco 201403 10.20 0.45 0.25 -0.19 -0.19 0.06 -0.25 -0.25 -0.25 0 S
Sam Leaseco 201406 10.20 0.02 0.28 0.26 0.00 0.26 0.08 0.18 0.18 0.02 0 S
Sam Leaseco 201409 10.20 0.14 0.26 0.12 0.12 0.07 0.05 0.05 0 S
Sampre Nutritions 201312 4.82 4.16 3.36 0.01 0.81 0.01 0.41 0.39 0.39 0.39 0.81 0 S
Sampre Nutritions 201403 4.82 3.01 2.48 0.06 0.59 0.04 0.17 0.39 0.23 0.16 0.16 0.42 0 S
Sampre Nutritions 201406 4.82 1.93 1.89 0.01 0.05 0.32 -0.27 -0.27 -0.27 -0.55 0 S
Sampre Nutritions 201409 4.82 2.34 1.71 0.02 0.64 0.08 0.32 0.24 0.24 0.24 0.49 0 S
Samrat Pharmachem 201312 3.09 17.25 0.02 16.85 0.05 0.47 0.15 0.08 0.23 0.07 0.16 0.16 0.53 0 S
Samrat Pharmachem 201403 3.09 12.16 0.05 11.70 0.07 0.58 0.09 0.08 0.40 0.05 0.35 0.35 1.13 0 S
Samrat Pharmachem 201406 3.09 14.14 0.04 13.59 0.03 0.61 0.12 0.09 0.40 0.17 0.24 0.24 0.77 0 S
Samrat Pharmachem 201409 3.09 15.09 0.11 14.71 0.06 0.54 0.25 0.09 0.21 0.06 0.14 0.14 0.46 0 S
Samtex Fashions 201312 14.90 442.80 0.04 418.81 0.02 24.04 10.67 2.69 10.68 2.19 8.49 8.49 0 C
Samtex Fashions 201403 14.90 641.81 1.22 602.49 0.93 41.46 33.88 3.43 4.06 3.88 0.19 0.19 0 C
Samtex Fashions 201406 14.90 504.13 13.54 486.65 31.02 18.32 3.10 9.64 1.99 7.66 7.66 0 C
Samtex Fashions 201409 14.90 48.83 0.82 46.02 3.63 2.01 0.87 0.75 0.23 0.52 0.52 0 C
Sand Plast (India) 201312 23.20 1.26 1.55 -0.29 0.35 -0.64 -0.64 -0.64 -0.27 0 S
Sand Plast (India) 201403 23.20 1.23 1.64 0.18 -0.24 0.36 -0.59 -0.59 -0.59 -0.26 0 S
Sand Plast (India) 201406 23.20 0.61 0.97 -0.36 0.38 -0.73 -0.73 -0.73 -0.32 0 S
Sand Plast (India) 201409 25.00 0.89 1.11 -0.23 0.38 -0.60 -0.60 -0.60 -0.24 0 S
Sandu Pharmaceuticals 201312 7.08 9.17 8.69 0.09 0.58 0.30 0.13 0.14 0.03 0.11 0.11 0.16 0 S
Sandu Pharmaceuticals 201403 7.08 9.90 9.24 0.15 0.80 0.26 0.15 0.38 0.21 0.17 0.17 0.24 0 S
Sandu Pharmaceuticals 201406 7.08 8.27 7.70 0.03 0.59 0.34 0.15 0.10 -0.01 0.11 0.11 0.16 0 S
Sandu Pharmaceuticals 201409 7.08 9.76 9.03 0.02 0.75 0.37 0.16 0.22 0.07 0.15 0.15 0.21 0 S

Co_Name Year Equity N.Sale O.O.I T. Exp O.I PBIDT Int. Dep. PBT T.Tax PAT A.PAT EPS Div (%)
Exp
ecte
d R
esu
lts
on
14
Feb
ruar
y 20
15
Sandur Manganese & Iron Ores 201312 8.75 93.51 1.40 62.45 1.09 33.55 2.89 30.66 10.25 20.41 20.41 23.33 30 C
Sandur Manganese & Iron Ores 201403 8.75 66.55 0.80 80.14 13.08 0.29 0.01 0.60 -0.32 -0.05 -0.27 -0.27 -0.31 30 C
Sandur Manganese & Iron Ores 201406 8.75 85.80 0.81 55.42 2.10 33.29 0.78 32.51 11.05 21.46 21.46 24.53 30 C
Sandur Manganese & Iron Ores 201409 8.75 80.64 0.93 62.04 1.00 20.53 1.26 19.27 6.55 12.72 12.72 14.54 30 C
Sankhya Infotech 201312 11.25 39.59 38.02 0.01 1.58 1.14 1.20 -0.76 -0.76 -0.76 -0.67 0 C
Sankhya Infotech 201403 11.25 35.44 31.56 -1.29 2.58 1.09 1.20 0.29 0.74 -0.45 -0.45 -0.40 0 C
Sankhya Infotech 201406 11.25 39.71 36.05 0.21 3.87 1.09 1.24 1.55 0.32 1.22 1.22 1.09 0 C
Sankhya Infotech 201409 11.25 46.08 40.45 -0.18 5.45 1.20 1.24 3.01 1.81 1.20 1.20 1.06 0 C
Sanmitra Commercial 201312 1.10 0.01 0.01 0.00 0.00 0.00 0.00 0 S
Sanmitra Commercial 201403 1.10 0.01 0.02 0.01 0.01 0.01 0.01 0 S
Sanmitra Commercial 201406 1.10 0.02 0.01 -0.02 -0.02 -0.02 -0.02 -0.16 0 S
Sanmitra Commercial 201409 1.10 0.01 0.00 -0.01 -0.01 -0.01 -0.01 -0.07 0 S
Santaram Spinners 201312 6.15 18.00 0.21 17.35 0.86 0.53 0.24 0.10 0.10 0.10 0.15 0 S
Santaram Spinners 201403 6.15 33.74 1.01 34.64 0.01 0.12 0.35 0.17 -0.40 0.27 -0.67 -0.67 -0.11 0 S
Santaram Spinners 201406 6.15 53.94 0.35 53.26 0.00 1.04 0.54 0.04 0.46 0.10 0.36 0.36 0.58 0 S
Santaram Spinners 201409 6.15 13.34 0.18 12.81 0.02 0.72 0.61 0.04 0.07 0.07 0.07 0.12 0 S
Sarthak Industries 201312 6.97 50.27 0.17 54.20 0.12 -3.64 0.48 0.13 -4.25 1.17 -5.42 -5.42 -7.78 0 S
Sarthak Industries 201403 6.97 35.14 0.12 42.44 0.17 -7.01 0.35 0.13 -7.50 0.08 -7.58 -7.58 -10.87 0 S
Sarthak Industries 201406 6.97 13.49 0.78 13.75 0.08 0.61 0.25 0.09 0.27 -0.07 0.34 0.34 0.48 0 S
Sarthak Industries 201409 6.97 40.13 0.05 39.88 0.08 0.37 0.15 0.09 0.13 0.06 0.07 0.07 0.10 0 S
Sea TV Network 201312 12.02 3.98 0.19 3.32 0.86 1.27 1.20 -1.62 0.16 -1.78 -1.78 -1.48 0 C
Sea TV Network 201403 12.02 4.77 -0.06 3.50 1.20 1.44 1.19 -1.43 0.27 -1.70 -1.70 -1.41 0 C
Sea TV Network 201406 12.02 4.52 0.01 2.77 1.76 1.49 1.65 -1.38 0.03 -1.41 -1.41 -1.18 0 C
Sea TV Network 201409 12.02 4.93 0.01 3.05 1.89 1.33 0.94 -0.38 0.27 -0.66 -0.66 -0.55 0 C
Sejal Glass 201312 33.55 52.43 0.68 52.15 2.23 3.20 1.73 0.59 -2.20 -2.20 -2.20 -0.65 0 C
Sejal Glass 201403 33.55 26.94 0.76 33.87 1.89 -4.28 3.35 0.64 -16.57 -16.57 -16.57 -4.94 0 C
Sejal Glass 201406 33.55 4.46 0.15 4.78 1.52 1.35 1.95 0.61 -1.21 -1.21 -1.21 -0.36 0 C
Sejal Glass 201409 33.55 3.78 0.13 5.51 1.23 -0.37 2.35 1.85 -4.57 -4.57 -4.57 -1.36 0 C
Sen Pet (India) 201312 42.79 0.01 0.51 -0.51 0.85 -1.36 -1.36 -1.36 -0.32 0 S
Sen Pet (India) 201403 42.79 0.44 -0.44 0.85 -1.28 -1.28 -1.28 -0.30 0 S
Sen Pet (India) 201406 42.79 0.08 0.55 -0.47 0.87 -1.34 -1.34 -1.34 -0.31 0 S
Sen Pet (India) 201409 42.79 0.02 0.35 -0.34 0.85 -1.19 -1.19 -1.19 -0.28 0 S
Seshachal Technologies 201312 6.94 8.36 -8.36 0.01 -8.37 -8.37 -8.37 -12.05 0 S
Seshachal Technologies 201403 6.94 0.03 -0.03 0.01 -0.03 -0.03 -0.03 -0.04 0 S
Seshachal Technologies 201406 6.94 0.01 -0.01 0.01 -0.01 -0.01 -0.01 -0.02 0 S
Seshachal Technologies 201409 6.94 0.02 -0.02 0.01 -0.03 -0.03 -0.03 -0.04 0 S
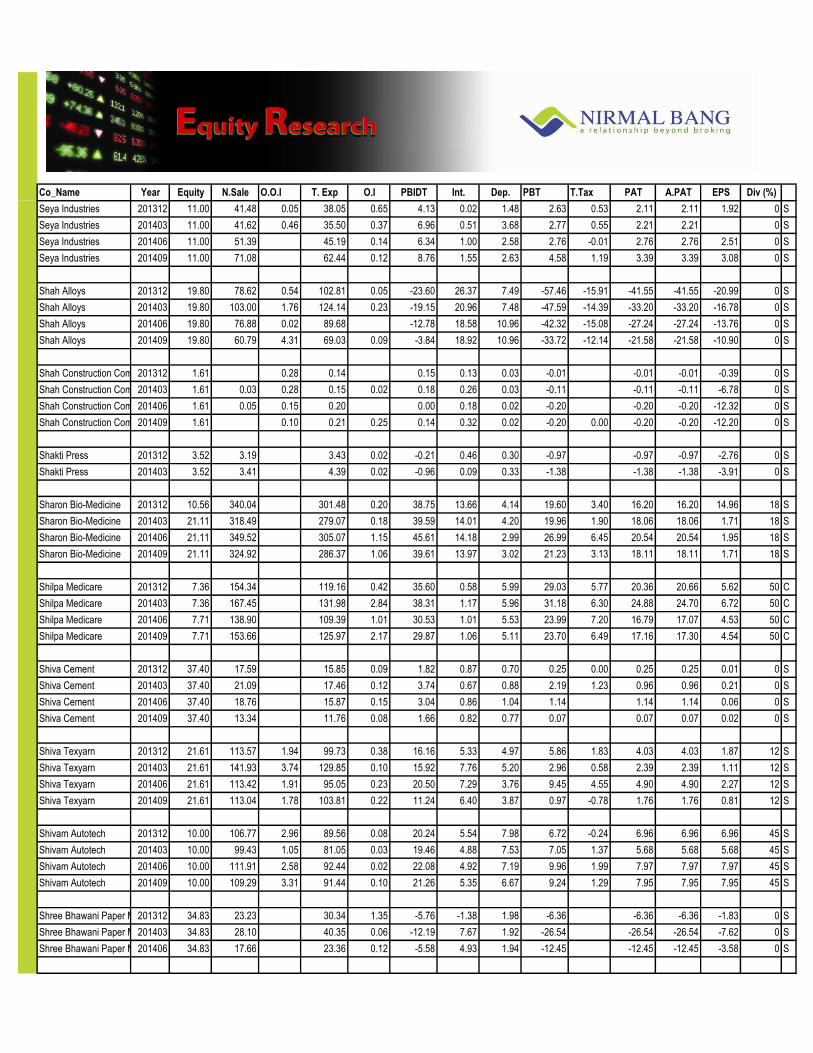
Co_Name Year Equity N.Sale O.O.I T. Exp O.I PBIDT Int. Dep. PBT T.Tax PAT A.PAT EPS Div (%)
Exp
ecte
d R
esu
lts
on
14
Feb
ruar
y 20
15
Seya Industries 201312 11.00 41.48 0.05 38.05 0.65 4.13 0.02 1.48 2.63 0.53 2.11 2.11 1.92 0 S
Seya Industries 201403 11.00 41.62 0.46 35.50 0.37 6.96 0.51 3.68 2.77 0.55 2.21 2.21 0 S
Seya Industries 201406 11.00 51.39 45.19 0.14 6.34 1.00 2.58 2.76 -0.01 2.76 2.76 2.51 0 S
Seya Industries 201409 11.00 71.08 62.44 0.12 8.76 1.55 2.63 4.58 1.19 3.39 3.39 3.08 0 S
Shah Alloys 201312 19.80 78.62 0.54 102.81 0.05 -23.60 26.37 7.49 -57.46 -15.91 -41.55 -41.55 -20.99 0 S
Shah Alloys 201403 19.80 103.00 1.76 124.14 0.23 -19.15 20.96 7.48 -47.59 -14.39 -33.20 -33.20 -16.78 0 S
Shah Alloys 201406 19.80 76.88 0.02 89.68 -12.78 18.58 10.96 -42.32 -15.08 -27.24 -27.24 -13.76 0 S
Shah Alloys 201409 19.80 60.79 4.31 69.03 0.09 -3.84 18.92 10.96 -33.72 -12.14 -21.58 -21.58 -10.90 0 S
Shah Construction Company 201312 1.61 0.28 0.14 0.15 0.13 0.03 -0.01 -0.01 -0.01 -0.39 0 S
Shah Construction Company 201403 1.61 0.03 0.28 0.15 0.02 0.18 0.26 0.03 -0.11 -0.11 -0.11 -6.78 0 S
Shah Construction Company 201406 1.61 0.05 0.15 0.20 0.00 0.18 0.02 -0.20 -0.20 -0.20 -12.32 0 S
Shah Construction Company 201409 1.61 0.10 0.21 0.25 0.14 0.32 0.02 -0.20 0.00 -0.20 -0.20 -12.20 0 S
Shakti Press 201312 3.52 3.19 3.43 0.02 -0.21 0.46 0.30 -0.97 -0.97 -0.97 -2.76 0 S
Shakti Press 201403 3.52 3.41 4.39 0.02 -0.96 0.09 0.33 -1.38 -1.38 -1.38 -3.91 0 S
Sharon Bio-Medicine 201312 10.56 340.04 301.48 0.20 38.75 13.66 4.14 19.60 3.40 16.20 16.20 14.96 18 S
Sharon Bio-Medicine 201403 21.11 318.49 279.07 0.18 39.59 14.01 4.20 19.96 1.90 18.06 18.06 1.71 18 S
Sharon Bio-Medicine 201406 21.11 349.52 305.07 1.15 45.61 14.18 2.99 26.99 6.45 20.54 20.54 1.95 18 S
Sharon Bio-Medicine 201409 21.11 324.92 286.37 1.06 39.61 13.97 3.02 21.23 3.13 18.11 18.11 1.71 18 S
Shilpa Medicare 201312 7.36 154.34 119.16 0.42 35.60 0.58 5.99 29.03 5.77 20.36 20.66 5.62 50 C
Shilpa Medicare 201403 7.36 167.45 131.98 2.84 38.31 1.17 5.96 31.18 6.30 24.88 24.70 6.72 50 C
Shilpa Medicare 201406 7.71 138.90 109.39 1.01 30.53 1.01 5.53 23.99 7.20 16.79 17.07 4.53 50 C
Shilpa Medicare 201409 7.71 153.66 125.97 2.17 29.87 1.06 5.11 23.70 6.49 17.16 17.30 4.54 50 C
Shiva Cement 201312 37.40 17.59 15.85 0.09 1.82 0.87 0.70 0.25 0.00 0.25 0.25 0.01 0 S
Shiva Cement 201403 37.40 21.09 17.46 0.12 3.74 0.67 0.88 2.19 1.23 0.96 0.96 0.21 0 S
Shiva Cement 201406 37.40 18.76 15.87 0.15 3.04 0.86 1.04 1.14 1.14 1.14 0.06 0 S
Shiva Cement 201409 37.40 13.34 11.76 0.08 1.66 0.82 0.77 0.07 0.07 0.07 0.02 0 S
Shiva Texyarn 201312 21.61 113.57 1.94 99.73 0.38 16.16 5.33 4.97 5.86 1.83 4.03 4.03 1.87 12 S
Shiva Texyarn 201403 21.61 141.93 3.74 129.85 0.10 15.92 7.76 5.20 2.96 0.58 2.39 2.39 1.11 12 S
Shiva Texyarn 201406 21.61 113.42 1.91 95.05 0.23 20.50 7.29 3.76 9.45 4.55 4.90 4.90 2.27 12 S
Shiva Texyarn 201409 21.61 113.04 1.78 103.81 0.22 11.24 6.40 3.87 0.97 -0.78 1.76 1.76 0.81 12 S
Shivam Autotech 201312 10.00 106.77 2.96 89.56 0.08 20.24 5.54 7.98 6.72 -0.24 6.96 6.96 6.96 45 S
Shivam Autotech 201403 10.00 99.43 1.05 81.05 0.03 19.46 4.88 7.53 7.05 1.37 5.68 5.68 5.68 45 S
Shivam Autotech 201406 10.00 111.91 2.58 92.44 0.02 22.08 4.92 7.19 9.96 1.99 7.97 7.97 7.97 45 S
Shivam Autotech 201409 10.00 109.29 3.31 91.44 0.10 21.26 5.35 6.67 9.24 1.29 7.95 7.95 7.95 45 S
Shree Bhawani Paper Mills 201312 34.83 23.23 30.34 1.35 -5.76 -1.38 1.98 -6.36 -6.36 -6.36 -1.83 0 S
Shree Bhawani Paper Mills 201403 34.83 28.10 40.35 0.06 -12.19 7.67 1.92 -26.54 -26.54 -26.54 -7.62 0 S
Shree Bhawani Paper Mills 201406 34.83 17.66 23.36 0.12 -5.58 4.93 1.94 -12.45 -12.45 -12.45 -3.58 0 S

Co_Name Year Equity N.Sale O.O.I T. Exp O.I PBIDT Int. Dep. PBT T.Tax PAT A.PAT EPS Div (%)
Exp
ecte
d R
esu
lts
on
14
Feb
ruar
y 20
15
Shree Ganesh Elastoplast 201312 5.50 1.35 -0.20 1.03 0.11 0.00 0.00 0.11 0.02 0.09 0.09 0.17 0 S
Shree Ganesh Elastoplast 201403 5.50 1.55 0.22 1.80 -0.04 0.06 0.00 -0.10 -0.02 -0.09 -0.09 -0.16 0 S
Shree Ganesh Elastoplast 201406 5.50 0.79 0.00 0.93 -0.13 0.08 0.00 -0.21 -0.21 -0.21 -0.38 0 S
Shree Ganesh Elastoplast 201409 5.50 4.03 0.01 3.90 0.13 0.02 0.00 0.11 0.02 0.09 0.09 0.16 0 S
Shree Nath Commercial & Finance 201312 12.65 0.24 0.04 0.20 0.04 0.16 0.16 0.16 0.13 0 S
Shree Nath Commercial & Finance 201403 12.65 5.77 0.18 6.63 -0.69 0.00 -0.69 -0.14 -0.62 -0.55 -0.49 0 S
Shree Nath Commercial & Finance 201406 12.65 0.96 0.24 0.20 0.00 1.00 1.00 1.00 1.00 0.79 0 S
Shree Nath Commercial & Finance 201409 12.65 0.55 0.24 0.75 -1.95 -1.92 -1.92 0.01 -1.93 -1.93 -0.15 0 S
Shree Rajivlochan Oil Extraction 201312 3.02 0.01 0.01 0.00 0.00 0.00 0.00 0.00 0 S
Shree Rajivlochan Oil Extraction 201403 3.02 0.08 0.16 1.42 1.35 0.03 1.32 0.01 1.31 1.31 4.34 0 S
Shree Rajivlochan Oil Extraction 201406 3.02 0.01 -0.01 0.01 -0.01 -0.01 -0.01 5.52 0 S
Shree Rajivlochan Oil Extraction 201409 3.02 0.10 0.10 0.01 0.02 0.00 0.01 0.00 0.01 0.01 0 S
Shree Renuka Sugars 201312 67.10 1191.10 1209.00 4.80 -13.10 93.20 42.10 -270.90 -77.00 -193.90 -193.90 -2.89 0 C
Shree Renuka Sugars 201403 67.10 1859.00 1756.10 7.60 110.50 106.60 41.10 -83.10 5.20 -88.30 -88.30 -1.32 0 C
Shree Renuka Sugars 201406 92.90 1157.80 1140.80 2.30 19.30 84.40 38.40 -122.10 -41.50 -80.60 -80.60 -1.05 0 C
Shree Renuka Sugars 201409 92.90 1628.90 1653.70 1.20 -23.60 87.70 37.90 -195.60 -66.50 -129.10 -129.10 -1.42 0 C
Shreejal Info Hubs 201312 7.50 0.10 0.07 0.03 0.03 0.00 0.00 0.00 0 S
Shreejal Info Hubs 201403 7.50 0.03 0.01 0.01 0.00 0.02 0.00 0.00 0.00 0.00 0 S
Shreejal Info Hubs 201406 7.50 0.05 0.03 0.02 0.01 0.00 0.00 0.00 0 S
Shreejal Info Hubs 201409 7.50 0.03 0.01 0.02 0.01 0.00 0.00 0.00 0 S
Shreeyash Industries 201312 5.44 0.17 0.20 -0.03 -0.03 -0.03 -0.03 -0.06 0 S
Shreeyash Industries 201403 5.44 0.18 0.20 -0.02 -0.02 -0.02 -0.02 -0.04 0 S
Shreeyash Industries 201406 5.44 0.01 0.13 -0.12 -0.12 -0.09 -0.12 -0.23 0 S
Shreeyash Industries 201409 5.44 0.00 0.17 -0.17 -0.17 -0.17 -0.14 -0.02 0 S
Shri Lakshmi Cotsyn 201312 28.47 219.58 299.56 13.08 -66.90 65.02 27.31 -159.23 0.00 -159.23 -159.23 0 C
Shri Lakshmi Cotsyn 201403 28.47 188.62 321.80 6.09 -127.09 47.37 26.16 -200.62 -372.30 -200.62 0 C
Shri Lakshmi Cotsyn 201406 28.47 178.34 232.91 6.91 -47.66 75.77 26.25 -149.68 -234.31 -149.68 0 C
Shri Lakshmi Cotsyn 201409 28.47 149.71 211.83 9.07 -53.05 44.99 26.50 -124.54 -266.11 -124.54 0 C
Shricon Industries 201312 1.24 0.00 0.00 0.02 -0.02 -0.02 -0.02 -0.15 0 S
Shricon Industries 201403 1.24 0.02 -0.02 0.02 -0.04 -0.04 -0.04 -0.30 0 S
Shricon Industries 201406 1.24 0.01 -0.01 0.02 -0.03 0.00 -0.02 -0.02 -0.19 0 S
Shricon Industries 201409 1.24 0.06 0.19 0.13 0.02 0.11 0.02 0.10 0.10 0.77 0 S
Shristi Infrastructure Development Corporation 201312 22.20 23.16 11.08 1.16 13.25 11.32 0.17 1.75 0.54 1.21 1.24 0.56 3 C
Shristi Infrastructure Development Corporation 201403 22.20 55.90 45.54 1.74 12.10 10.46 0.18 1.46 -0.65 2.10 2.14 0.96 3 C
Shristi Infrastructure Development Corporation 201406 22.20 35.27 24.14 0.40 11.52 10.63 0.16 0.73 0.33 0.40 0.40 0.18 3 C
Shristi Infrastructure Development Corporation 201409 22.20 37.95 26.27 0.91 12.59 11.34 0.17 1.08 0.34 0.74 0.74 0.33 3 C

Co_Name Year Equity N.Sale O.O.I T. Exp O.I PBIDT Int. Dep. PBT T.Tax PAT A.PAT EPS Div (%)
Exp
ecte
d R
esu
lts
on
14
Feb
ruar
y 20
15
Siddhartha Tubes 201312 6.00 36.02 0.00 37.30 0.02 -1.25 0.22 2.50 -3.97 0.00 -3.97 -3.97 0 S
Siddhartha Tubes 201403 6.00 34.19 0.00 36.10 1.24 -0.67 0.66 1.90 12.39 12.39 12.39 0 S
Siddhartha Tubes 201406 6.00 29.96 0.01 32.46 0.05 -2.44 0.06 2.35 -4.86 -4.86 -4.86 0 S
Siddhartha Tubes 201409 6.00 17.69 20.45 0.01 -2.75 0.08 0.50 -3.33 -3.33 -3.33 0 S
Signet Industries 201312 29.19 157.52 0.38 139.58 0.02 18.33 12.69 1.61 4.03 1.35 2.68 2.68 0.92 12 S
Signet Industries 201403 29.19 172.61 0.46 158.29 5.19 19.98 11.93 1.64 6.40 1.26 5.15 5.15 1.76 12 S
Signet Industries 201406 29.19 160.39 0.70 145.12 1.00 16.97 8.83 1.51 6.62 1.85 4.77 4.77 1.63 12 S
Signet Industries 201409 29.19 154.28 0.48 139.23 0.88 16.40 10.13 1.76 4.51 1.30 3.21 3.21 1.10 12 S
Sikozy Realtors 201312 4.46 0.03 -0.03 0.00 -0.03 -0.03 -0.03 -0.01 0 S
Sikozy Realtors 201403 4.46 0.03 -0.03 0.00 -0.03 0.03 -0.06 -0.06 -0.13 0 S
Sikozy Realtors 201406 4.46 0.07 -0.07 0.00 -0.07 -0.07 -0.07 -0.02 0 S
Sikozy Realtors 201409 4.46 0.03 -0.03 0.00 -0.04 -0.04 -0.04 -0.01 0 S
Simran Farms 201312 3.79 93.63 0.00 103.45 -9.82 0.26 0.34 -10.43 -0.22 -10.21 -10.21 -26.92 0 C
Simran Farms 201403 3.79 101.96 0.00 91.09 10.88 0.38 0.32 10.18 0.22 9.95 9.95 26.25 0 C
Simran Farms 201406 3.79 98.29 0.00 97.02 1.27 0.70 0.45 0.12 0.02 0.10 0.10 0.25 0 C
Simran Farms 201409 3.79 102.31 0.01 106.35 -4.03 0.77 0.29 -5.08 -0.02 -5.06 -5.06 -13.35 0 C
Sita Shree Food Products 201312 22.04 151.36 4.96 151.46 4.86 3.94 0.77 0.15 0.15 0.15 0.32 0 C
Sita Shree Food Products 201403 27.83 153.11 -5.79 139.97 0.00 7.35 4.51 0.75 2.07 1.91 0.16 0.16 0 C
Sita Shree Food Products 201406 27.83 123.90 0.28 117.85 6.32 4.30 0.87 1.15 0.24 0.92 0.92 0.33 0 C
Sita Shree Food Products 201409 27.83 114.38 0.39 109.08 5.70 3.59 1.01 1.09 0.20 0.89 0.89 0.32 0 C
Smilax Industries 201312 12.30 0.01 -0.01 -0.01 -0.01 -0.01 -0.01 0 S
Smilax Industries 201403 12.30 0.01 -0.01 -0.01 -0.01 -0.01 -0.01 0 S
Smilax Industries 201406 12.30 0.04 -0.04 -0.04 -0.04 -0.04 -0.04 0 S
Smilax Industries 201409 12.30 0.05 -0.05 -0.05 -0.05 -0.05 -0.04 0 S
Solid Carbide Tools 201312 8.86 0.01 -0.01 0.04 -0.05 -0.05 -0.05 -0.06 0 S
Solid Carbide Tools 201403 0.89 0.05 -0.05 0.04 -0.09 -0.09 -0.09 -0.10 0 S
Solid Carbide Tools 201406 0.89 0.24 -0.24 0.04 -0.28 -0.28 -0.28 -0.31 0 S
Solid Carbide Tools 201409 0.89 0.24 -0.24 0.07 -0.31 -0.31 -0.31 0 S
Somi Conveyor Beltings 201312 11.78 16.46 0.04 13.75 0.14 2.90 0.35 0.97 1.57 0.51 1.06 1.06 0.90 0 S
Somi Conveyor Beltings 201403 11.78 14.83 0.02 12.12 0.03 2.76 0.32 1.11 1.33 0.46 0.87 0.87 0.74 0 S
Somi Conveyor Beltings 201406 11.78 15.48 0.03 12.62 0.13 3.01 0.43 1.25 1.34 0.46 0.88 0.88 0.75 0 S
Somi Conveyor Beltings 201409 11.78 21.02 0.01 17.96 0.18 3.25 0.51 1.27 1.47 0.50 0.97 0.97 0.82 0 S
Source Natural Foods and Herbal Supplements 201312 4.50 1.32 0.01 1.19 0.15 0.07 0.08 0.08 0.08 0.17 0 S
Source Natural Foods and Herbal Supplements 201403 5.20 1.46 0.00 1.30 0.01 0.17 0.06 0.11 0.11 0.11 0.21 0 S
Source Natural Foods and Herbal Supplements 201406 5.20 1.26 0.00 1.18 0.00 0.08 0.06 0.03 0.03 0.03 0.06 0 S
Source Natural Foods and Herbal Supplements 201409 6.10 1.99 0.00 1.63 0.36 0.00 0.07 0.29 0.29 0.29 0.48 0 S

Co_Name Year Equity N.Sale O.O.I T. Exp O.I PBIDT Int. Dep. PBT T.Tax PAT A.PAT EPS Div (%)
Exp
ecte
d R
esu
lts
on
14
Feb
ruar
y 20
15
Southern Ispat & Energy 201312 132.15 129.29 121.95 0.01 7.35 0.12 0.31 6.91 0.02 6.89 6.89 0.52 0 C
Southern Ispat & Energy 201403 132.15 194.24 182.53 11.71 0.13 0.31 11.28 0.01 11.27 11.27 0.85 0 C
Southern Ispat & Energy 201406 132.15 123.39 118.54 0.02 4.87 0.13 0.26 4.47 0.02 4.45 4.45 0.34 0 C
Southern Ispat & Energy 201409 132.15 286.42 273.97 12.46 0.12 0.26 12.07 0.02 12.05 12.05 0.91 0 C
SPS International 201312 3.23 4.88 4.28 0.09 0.69 0.03 0.16 0.50 0.15 0.35 0.35 1.09 0 S
SPS International 201403 3.23 4.33 4.53 0.04 -0.17 0.04 0.31 -0.52 -0.19 -0.33 -0.33 -1.02 0 S
SPS International 201406 3.23 4.23 3.72 0.50 0.04 0.12 0.35 0.11 0.24 0.24 0.74 0 S
SPS International 201409 3.23 4.03 3.72 0.01 0.32 0.02 0.12 0.18 0.06 0.12 0.12 0.38 0 S
Square Four Projects India 201312 9.81 0.02 -0.02 -0.02 -0.02 -0.02 -0.02 0 S
Square Four Projects India 201403 9.81 0.05 0.18 0.14 0.14 0.14 0.14 0.14 0 S
Square Four Projects India 201406 9.81 0.02 0.00 -0.02 -0.02 -0.02 -0.02 -0.02 0 S
Square Four Projects India 201409 9.81 0.02 -0.02 -0.02 -0.02 -0.02 0 S
Sreeleathers 201312 25.16 13.55 10.94 0.43 3.03 0.36 0.23 2.45 0.70 1.74 1.74 0.69 3 S
Sreeleathers 201403 25.16 12.66 10.66 0.33 2.33 0.32 0.23 1.78 0.73 1.05 1.05 0.42 3 S
Sreeleathers 201406 25.16 15.59 12.44 0.13 3.28 0.35 0.29 2.65 0.97 1.68 1.68 0.67 3 S
Sreeleathers 201409 25.16 21.64 17.80 0.24 4.08 0.36 0.29 3.43 1.25 2.18 2.18 0.87 3 S
SRS 201312 139.29 824.50 0.23 807.98 1.59 18.34 11.67 3.64 3.04 -1.43 4.46 4.46 0.32 0 S
SRS 201403 139.29 1027.17 0.23 987.82 2.57 42.15 16.15 3.67 22.33 0.17 22.16 22.16 1.59 0 S
SRS 201406 139.29 1020.54 0.18 981.07 2.97 42.61 18.75 5.34 18.52 1.97 16.56 16.56 1.19 0 S
SRS 201409 139.29 932.32 0.18 897.45 4.32 39.36 18.43 5.51 15.43 -0.11 15.54 15.54 1.12 0 S
SS Forgings & Engineering 201312 7.80 0.03 0.01 0.02 -0.01 0.00 0.00 0.00 0 S
SS Forgings & Engineering 201403 7.80 0.40 0.42 -0.02 0.02 -0.03 -0.03 -0.03 -0.04 0 S
SS Forgings & Engineering 201406 7.80 0.06 0.04 0.02 0.02 0.00 0.00 0.00 0 S
SS Forgings & Engineering 201409 7.80 0.03 0.01 0.01 0.02 -0.01 -0.01 -0.01 -0.01 0 S
SS Organics 201312 10.20 0.87 1.78 -0.91 0.29 -1.20 -1.20 -1.20 -1.18 0 S
SS Organics 201403 10.20 1.51 2.18 0.10 -0.57 0.01 0.29 -0.87 -0.87 -0.87 -0.85 0 S
SS Organics 201406 10.20 1.36 2.08 -0.72 0.04 0.30 -1.06 -1.06 -1.06 -1.04 0 S
SS Organics 201409 10.20 0.31 1.38 2.42 -0.73 0.04 1.17 -1.94 -1.94 -1.94 -1.90 0 S
SSK Lifestyles 201312 3.02 0.09 0.18 -0.09 0.09 -0.18 -0.18 -0.18 -0.58 0 S
SSK Lifestyles 201403 3.02 0.13 0.01 0.12 0.02 0.05 -0.02 -0.02 -0.02 -1.07 0 S
SSK Lifestyles 201406 3.02 0.16 0.17 -0.01 0.04 -0.05 -0.05 -0.05 -0.15 0 S
SSK Lifestyles 201409 3.02 0.10 0.03 0.17 -0.03 0.04 -0.07 -0.07 -0.07 -0.23 0 S
Standard Capital Markets 201312 4.00 0.07 0.03 0.04 0.00 0.04 0.01 0.03 0.03 0.07 0 S
Standard Capital Markets 201403 4.00 -0.05 0.03 -0.08 -0.08 0.01 -0.08 -0.08 -0.21 0 S
Standard Capital Markets 201406 4.00 0.08 0.06 0.02 0.00 0.02 0.01 0.01 0.01 0.03 0 S
Standard Capital Markets 201409 4.00 0.07 0.05 0.00 0.02 0.00 0.02 0.01 0.02 0.02 0.04 0 S

Co_Name Year Equity N.Sale O.O.I T. Exp O.I PBIDT Int. Dep. PBT T.Tax PAT A.PAT EPS Div (%)
Exp
ecte
d R
esu
lts
on
14
Feb
ruar
y 20
15
Starcom Information Technology 201312 5.00 4.68 3.45 0.42 1.65 0.24 0.26 1.15 0.06 1.08 1.08 2.17 0 S
Starcom Information Technology 201403 5.00 5.33 5.83 0.40 -0.10 1.30 0.02 -1.42 -0.15 -1.27 -1.27 -2.54 0 S
Starcom Information Technology 201406 5.00 3.30 3.59 0.41 0.13 1.42 0.15 -1.44 -1.44 -1.44 -2.71 0 S
Starcom Information Technology 201409 5.00 4.99 4.83 0.48 0.64 1.17 0.15 -0.69 -0.04 -0.64 -0.64 -1.29 0 S
Starlite Components 201312 3.37 3.29 0.09 3.34 0.27 0.31 0.04 0.28 0.28 0.28 0.82 0 S
Starlite Components 201403 5.00 4.00 0.01 4.17 0.61 0.45 0.05 0.40 -0.85 1.26 1.26 0.99 0 S
Starlite Components 201406 5.00 3.22 3.34 0.00 -0.12 0.21 0.06 -0.39 -0.39 -0.39 -0.78 0 S
Starlite Components 201409 5.00 8.10 7.70 0.00 0.40 0.24 0.06 0.10 0.10 0.10 0.20 0 S
Starvox Electronics 201312 0.91 0.04 0.01 0.08 0.00 -0.02 0.00 -0.03 -0.03 -0.03 0 S
Starvox Electronics 201403 0.91 0.06 0.02 0.08 0.00 0.00 0.00 0.00 -0.01 -0.01 -0.01 0 S
Starvox Electronics 201406 0.91 0.06 0.00 0.07 0.00 -0.01 0.00 -0.01 -0.01 -0.01 0 S
Starvox Electronics 201409 0.95 0.04 0.03 0.18 -0.11 0.00 -0.11 -0.11 -0.11 0 S
Sterling International Enterprises 201312 27.14 109.32 69.04 0.75 41.03 4.11 35.50 1.42 0.01 1.41 1.41 0.05 0 C
Sterling International Enterprises 201403 27.14 107.87 69.72 0.38 38.53 3.86 32.92 1.76 0.03 1.73 1.73 0.06 0 C
Sterling International Enterprises 201406 27.14 115.01 76.48 0.79 39.32 35.67 3.65 0.05 3.60 3.60 0.13 0 C
Sterling International Enterprises 201409 27.14 126.21 77.43 48.78 3.41 42.40 2.97 0.01 2.96 2.96 0.11 0 C
Suchak Trading 201312 11.73 0.06 0.04 0.01 0.03 0.01 0.02 0.02 0.02 0 S
Suchak Trading 201403 11.73 0.06 0.04 0.01 0.03 0.01 0.02 0.02 0.00 0.00 0 S
Suchak Trading 201406 11.73 0.04 0.04 0.03 0.03 0.01 0.02 0.02 0.02 0 S
Suchak Trading 201409 11.73 0.06 0.05 0.03 0.05 0.01 0.04 0.04 0.04 0 S
Sudal Industries 201312 6.51 17.73 16.01 1.72 1.23 0.44 0.05 0.00 0.06 0.06 0.09 0 S
Sudal Industries 201403 6.51 22.16 19.64 0.02 2.54 1.59 0.42 0.53 0.51 0.02 0.02 0.03 0 S
Sudal Industries 201406 6.51 22.65 20.67 1.99 1.80 0.40 -0.22 -0.22 -0.22 -0.33 0 S
Sudal Industries 201409 7.37 18.40 16.90 0.01 1.51 2.71 0.41 -1.61 -1.61 -1.61 -2.19 0 S
Sujana Metal Products 201312 98.18 763.91 1.00 716.92 0.05 48.03 47.28 9.96 -9.21 -1.84 -7.37 -7.37 -0.38 0 C
Sujana Metal Products 201403 98.18 736.82 0.80 688.36 -1.78 47.49 41.68 9.99 -4.19 4.15 -8.32 -8.32 -0.43 0 C
Sujana Metal Products 201406 98.18 848.87 1.99 784.62 1.35 67.59 49.58 10.68 7.33 0.71 6.62 6.62 0.23 0 C
Sujana Metal Products 201409 98.18 815.02 1.84 760.12 4.53 61.27 46.39 9.33 3.51 0.27 3.24 3.24 0.16 0 C
Sujana Towers 201312 51.92 328.52 1.31 261.96 0.42 68.28 58.79 5.61 3.87 0.72 3.15 3.31 0.06 0 C
Sujana Towers 201403 51.92 755.65 0.11 705.98 0.62 50.40 52.61 6.02 -8.23 0.33 -8.56 -4.23 0 C
Sujana Towers 201406 51.92 503.45 1.12 446.56 0.27 58.29 50.31 6.80 1.18 0.30 0.88 1.06 0.20 0 C
Sujana Towers 201409 51.92 789.48 1.13 735.25 0.27 55.63 46.21 6.88 2.54 0.71 1.83 2.01 0.39 0 C
Sujana Universal Industries 201312 168.84 884.67 842.07 0.70 43.30 33.94 7.52 1.84 0.63 1.21 1.21 0.07 0 C
Sujana Universal Industries 201403 168.84 789.38 803.18 41.81 28.01 52.90 -5.14 -19.75 -6.62 -13.12 -13.12 -0.78 0 C
Sujana Universal Industries 201406 168.84 812.99 781.46 0.96 32.50 27.31 4.35 0.83 0.28 0.55 0.55 0.03 0 C
Sujana Universal Industries 201409 168.84 793.56 771.90 1.82 23.48 19.10 3.44 0.95 0.32 0.63 0.63 0.04 0 C

Co_Name Year Equity N.Sale O.O.I T. Exp O.I PBIDT Int. Dep. PBT T.Tax PAT A.PAT EPS Div (%)
Exp
ecte
d R
esu
lts
on
14
Feb
ruar
y 20
15
Sun Granite Exports 201312 10.68 0.00 0.04 0.00 -0.04 0.02 0.06 -0.11 0.00 -0.11 -0.11 0 S
Sun Granite Exports 201403 10.68 0.00 0.06 0.00 -0.06 0.02 0.05 -0.13 0.00 -0.13 -0.13 0 S
Sun Granite Exports 201406 10.68 0.03 -0.03 0.02 0.05 -0.10 -0.10 -0.10 0 S
Sun Granite Exports 201409 10.68 0.06 0.09 -0.03 0.02 0.05 -0.10 -0.10 -0.10 0 S
Sun Pharmaceutical Industries 201312 207.12 4286.59 25.85 2311.53 134.38 2135.29 6.72 104.97 2023.60 243.78 1779.82 1531.09 7.40 150 C
Sun Pharmaceutical Industries 201403 207.12 4043.57 15.04 2258.01 193.83 1994.43 3.91 106.10 1884.42 119.93 1764.49 1587.12 7.70 150 C
Sun Pharmaceutical Industries 201406 207.12 3926.85 8.73 2202.98 92.38 1824.98 6.58 128.01 1690.39 211.88 1478.51 1390.51 6.70 150 C
Sun Pharmaceutical Industries 201409 207.12 4750.53 18.96 2589.39 52.66 2232.76 24.40 167.17 2041.19 194.21 1846.98 1572.46 7.60 150 C
Sunil Industries 201312 4.20 26.76 26.02 0.21 0.95 0.34 0.15 0.46 0.15 0.30 0.30 0.72 0 S
Sunil Industries 201403 4.20 30.08 28.70 0.28 1.66 0.84 0.32 0.50 0.19 0.31 0.31 0.74 0 S
Sunil Industries 201406 4.20 30.21 28.95 0.14 1.39 0.70 0.20 0.49 0.15 0.34 0.34 0.80 0 S
Sunil Industries 201409 4.20 40.21 38.06 0.07 2.22 0.76 0.34 1.11 0.35 0.76 0.76 1.80 0 S
Superhouse 201312 11.42 161.97 0.54 142.57 0.41 20.37 4.63 3.31 12.31 4.35 7.97 7.97 7.23 15 C
Superhouse 201403 11.42 182.94 1.32 162.87 0.33 21.72 4.98 3.34 14.11 4.87 9.24 9.24 8.38 15 C
Superhouse 201406 11.42 174.53 0.93 154.25 0.24 21.45 5.28 2.87 13.23 4.61 8.63 8.63 7.82 15 C
Superhouse 201409 11.42 196.47 1.04 173.34 0.26 24.42 4.55 4.52 15.10 5.28 9.82 9.82 8.90 15 C
Supreme Tex Mart 201312 34.12 217.76 0.01 192.23 25.54 12.47 8.44 4.63 1.78 2.85 2.85 0.42 0 S
Supreme Tex Mart 201403 34.12 167.50 0.17 162.80 4.86 13.73 8.27 -17.13 -5.33 -11.80 -11.80 -1.77 0 S
Supreme Tex Mart 201406 34.12 107.25 0.00 91.43 15.82 11.93 11.14 -7.24 -1.91 -5.33 -5.33 -0.78 0 S
Supreme Tex Mart 201409 34.12 150.26 0.00 173.71 -23.45 12.82 11.32 -100.68 -9.05 -91.64 -91.64 -14.02 0 S
Surabhi Chemicals & Investment 201312 21.36 0.42 0.14 0.28 0.28 0.28 0.28 0.01 0 S
Surabhi Chemicals & Investment 201403 21.63 0.49 0.14 0.35 0.00 0.00 0.35 0.35 0.35 0.02 0 S
Surabhi Chemicals & Investment 201406 21.63 0.33 0.12 0.21 0.00 0.21 0.21 0.21 0.01 0 S
Surabhi Chemicals & Investment 201409 21.63 0.65 0.12 0.54 0.00 0.00 0.54 0.18 0.36 0.36 0.02 0 S
Surana Industries 201312 44.52 105.69 111.34 0.64 -5.01 42.36 10.12 -57.49 -21.26 -36.22 -36.22 -8.14 0 C
Surana Industries 201403 44.52 124.51 167.92 0.90 -42.51 53.31 2.62 -98.43 -34.03 -64.41 -64.41 -14.47 0 C
Surana Industries 201406 44.52 90.75 96.81 5.85 -0.21 17.05 0.87 -18.14 -7.33 -10.81 -10.81 -2.43 0 C
Surana Industries 201409 44.52 94.29 99.78 -0.01 -5.50 39.59 37.95 -83.04 41.19 -124.22 -124.22 -27.90 0 C
Surya Industrial Corporation 201312 4.47 0.01 -0.01 -0.01 -0.01 -0.01 -0.01 0 S
Surya Industrial Corporation 201403 4.47 0.01 0.00 0.00 0.00 0.00 -0.01 -0.01 -0.01 -0.01 0 S
Surya Industrial Corporation 201406 4.47 0.01 -0.01 -0.01 -0.01 -0.01 -0.03 0 S
Surya Industrial Corporation 201409 4.47 0.02 0.02 0.01 0.01 0.01 0.01 0.01 0 S
Suryaamba Spinning Mills 201312 2.35 43.58 41.56 0.32 2.33 1.13 0.71 0.49 0.49 0.49 2.10 10 S
Suryaamba Spinning Mills 201403 2.48 37.79 35.59 0.81 3.02 1.53 0.63 0.86 1.20 -0.34 -0.34 -1.35 10 S
Suryaamba Spinning Mills 201406 2.48 38.90 36.96 0.80 2.74 1.09 0.73 0.92 0.92 0.92 2.54 10 S
Suryaamba Spinning Mills 201409 2.93 37.91 35.56 0.58 2.92 1.12 0.67 1.13 1.13 1.13 3.23 10 S
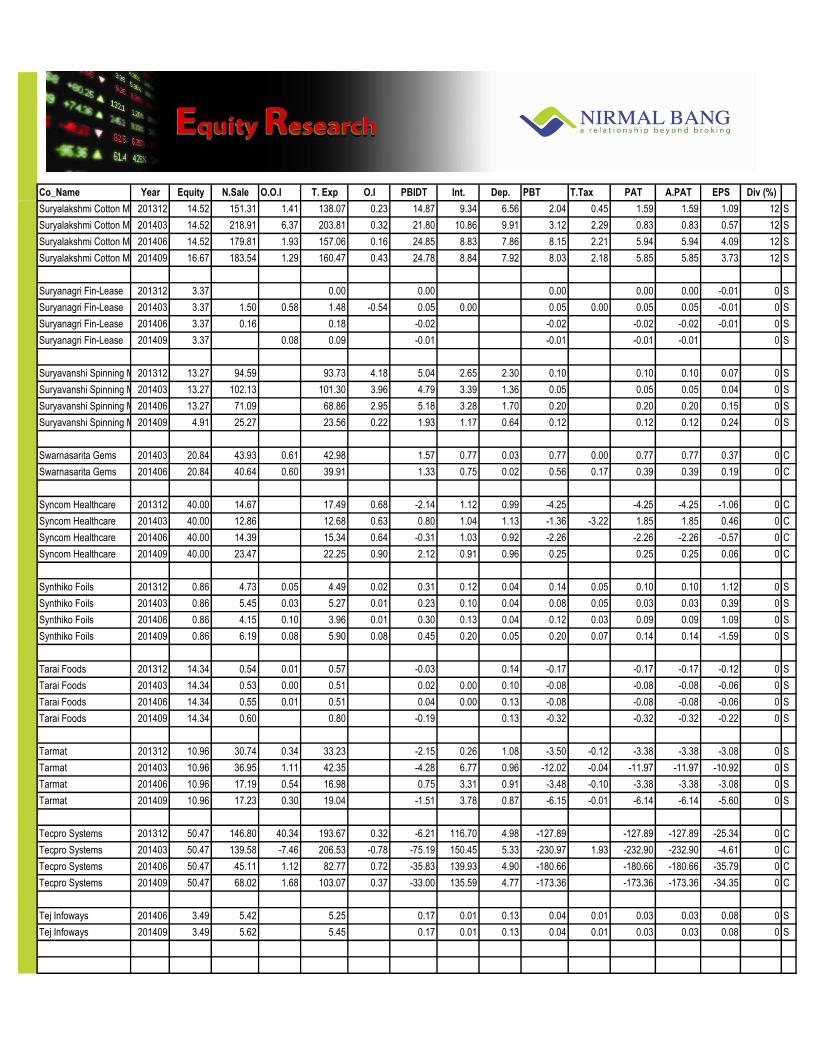
Co_Name Year Equity N.Sale O.O.I T. Exp O.I PBIDT Int. Dep. PBT T.Tax PAT A.PAT EPS Div (%)
Exp
ecte
d R
esu
lts
on
14
Feb
ruar
y 20
15
Suryalakshmi Cotton Mills 201312 14.52 151.31 1.41 138.07 0.23 14.87 9.34 6.56 2.04 0.45 1.59 1.59 1.09 12 S
Suryalakshmi Cotton Mills 201403 14.52 218.91 6.37 203.81 0.32 21.80 10.86 9.91 3.12 2.29 0.83 0.83 0.57 12 S
Suryalakshmi Cotton Mills 201406 14.52 179.81 1.93 157.06 0.16 24.85 8.83 7.86 8.15 2.21 5.94 5.94 4.09 12 S
Suryalakshmi Cotton Mills 201409 16.67 183.54 1.29 160.47 0.43 24.78 8.84 7.92 8.03 2.18 5.85 5.85 3.73 12 S
Suryanagri Fin-Lease 201312 3.37 0.00 0.00 0.00 0.00 0.00 -0.01 0 S
Suryanagri Fin-Lease 201403 3.37 1.50 0.58 1.48 -0.54 0.05 0.00 0.05 0.00 0.05 0.05 -0.01 0 S
Suryanagri Fin-Lease 201406 3.37 0.16 0.18 -0.02 -0.02 -0.02 -0.02 -0.01 0 S
Suryanagri Fin-Lease 201409 3.37 0.08 0.09 -0.01 -0.01 -0.01 -0.01 0 S
Suryavanshi Spinning Mills 201312 13.27 94.59 93.73 4.18 5.04 2.65 2.30 0.10 0.10 0.10 0.07 0 S
Suryavanshi Spinning Mills 201403 13.27 102.13 101.30 3.96 4.79 3.39 1.36 0.05 0.05 0.05 0.04 0 S
Suryavanshi Spinning Mills 201406 13.27 71.09 68.86 2.95 5.18 3.28 1.70 0.20 0.20 0.20 0.15 0 S
Suryavanshi Spinning Mills 201409 4.91 25.27 23.56 0.22 1.93 1.17 0.64 0.12 0.12 0.12 0.24 0 S
Swarnasarita Gems 201403 20.84 43.93 0.61 42.98 1.57 0.77 0.03 0.77 0.00 0.77 0.77 0.37 0 C
Swarnasarita Gems 201406 20.84 40.64 0.60 39.91 1.33 0.75 0.02 0.56 0.17 0.39 0.39 0.19 0 C
Syncom Healthcare 201312 40.00 14.67 17.49 0.68 -2.14 1.12 0.99 -4.25 -4.25 -4.25 -1.06 0 C
Syncom Healthcare 201403 40.00 12.86 12.68 0.63 0.80 1.04 1.13 -1.36 -3.22 1.85 1.85 0.46 0 C
Syncom Healthcare 201406 40.00 14.39 15.34 0.64 -0.31 1.03 0.92 -2.26 -2.26 -2.26 -0.57 0 C
Syncom Healthcare 201409 40.00 23.47 22.25 0.90 2.12 0.91 0.96 0.25 0.25 0.25 0.06 0 C
Synthiko Foils 201312 0.86 4.73 0.05 4.49 0.02 0.31 0.12 0.04 0.14 0.05 0.10 0.10 1.12 0 S
Synthiko Foils 201403 0.86 5.45 0.03 5.27 0.01 0.23 0.10 0.04 0.08 0.05 0.03 0.03 0.39 0 S
Synthiko Foils 201406 0.86 4.15 0.10 3.96 0.01 0.30 0.13 0.04 0.12 0.03 0.09 0.09 1.09 0 S
Synthiko Foils 201409 0.86 6.19 0.08 5.90 0.08 0.45 0.20 0.05 0.20 0.07 0.14 0.14 -1.59 0 S
Tarai Foods 201312 14.34 0.54 0.01 0.57 -0.03 0.14 -0.17 -0.17 -0.17 -0.12 0 S
Tarai Foods 201403 14.34 0.53 0.00 0.51 0.02 0.00 0.10 -0.08 -0.08 -0.08 -0.06 0 S
Tarai Foods 201406 14.34 0.55 0.01 0.51 0.04 0.00 0.13 -0.08 -0.08 -0.08 -0.06 0 S
Tarai Foods 201409 14.34 0.60 0.80 -0.19 0.13 -0.32 -0.32 -0.32 -0.22 0 S
Tarmat 201312 10.96 30.74 0.34 33.23 -2.15 0.26 1.08 -3.50 -0.12 -3.38 -3.38 -3.08 0 S
Tarmat 201403 10.96 36.95 1.11 42.35 -4.28 6.77 0.96 -12.02 -0.04 -11.97 -11.97 -10.92 0 S
Tarmat 201406 10.96 17.19 0.54 16.98 0.75 3.31 0.91 -3.48 -0.10 -3.38 -3.38 -3.08 0 S
Tarmat 201409 10.96 17.23 0.30 19.04 -1.51 3.78 0.87 -6.15 -0.01 -6.14 -6.14 -5.60 0 S
Tecpro Systems 201312 50.47 146.80 40.34 193.67 0.32 -6.21 116.70 4.98 -127.89 -127.89 -127.89 -25.34 0 C
Tecpro Systems 201403 50.47 139.58 -7.46 206.53 -0.78 -75.19 150.45 5.33 -230.97 1.93 -232.90 -232.90 -4.61 0 C
Tecpro Systems 201406 50.47 45.11 1.12 82.77 0.72 -35.83 139.93 4.90 -180.66 -180.66 -180.66 -35.79 0 C
Tecpro Systems 201409 50.47 68.02 1.68 103.07 0.37 -33.00 135.59 4.77 -173.36 -173.36 -173.36 -34.35 0 C
Tej Infoways 201406 3.49 5.42 5.25 0.17 0.01 0.13 0.04 0.01 0.03 0.03 0.08 0 S
Tej Infoways 201409 3.49 5.62 5.45 0.17 0.01 0.13 0.04 0.01 0.03 0.03 0.08 0 S
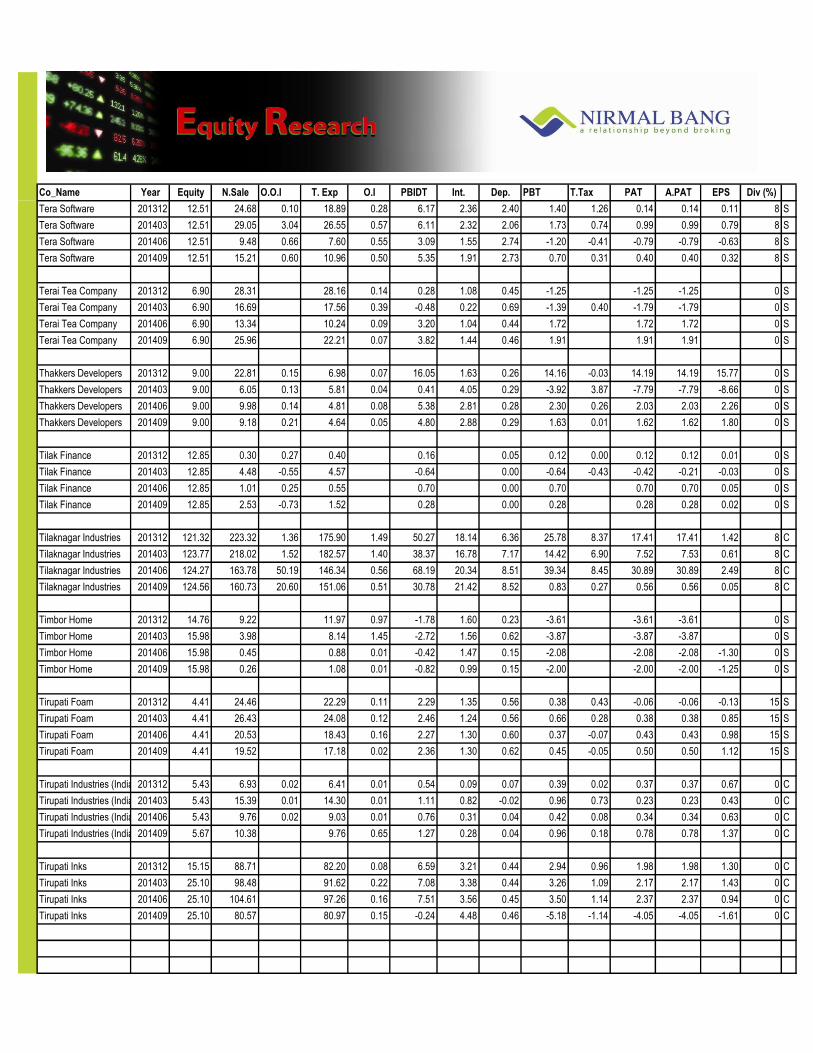
Co_Name Year Equity N.Sale O.O.I T. Exp O.I PBIDT Int. Dep. PBT T.Tax PAT A.PAT EPS Div (%)
Exp
ecte
d R
esu
lts
on
14
Feb
ruar
y 20
15
Tera Software 201312 12.51 24.68 0.10 18.89 0.28 6.17 2.36 2.40 1.40 1.26 0.14 0.14 0.11 8 S
Tera Software 201403 12.51 29.05 3.04 26.55 0.57 6.11 2.32 2.06 1.73 0.74 0.99 0.99 0.79 8 S
Tera Software 201406 12.51 9.48 0.66 7.60 0.55 3.09 1.55 2.74 -1.20 -0.41 -0.79 -0.79 -0.63 8 S
Tera Software 201409 12.51 15.21 0.60 10.96 0.50 5.35 1.91 2.73 0.70 0.31 0.40 0.40 0.32 8 S
Terai Tea Company 201312 6.90 28.31 28.16 0.14 0.28 1.08 0.45 -1.25 -1.25 -1.25 0 S
Terai Tea Company 201403 6.90 16.69 17.56 0.39 -0.48 0.22 0.69 -1.39 0.40 -1.79 -1.79 0 S
Terai Tea Company 201406 6.90 13.34 10.24 0.09 3.20 1.04 0.44 1.72 1.72 1.72 0 S
Terai Tea Company 201409 6.90 25.96 22.21 0.07 3.82 1.44 0.46 1.91 1.91 1.91 0 S
Thakkers Developers 201312 9.00 22.81 0.15 6.98 0.07 16.05 1.63 0.26 14.16 -0.03 14.19 14.19 15.77 0 S
Thakkers Developers 201403 9.00 6.05 0.13 5.81 0.04 0.41 4.05 0.29 -3.92 3.87 -7.79 -7.79 -8.66 0 S
Thakkers Developers 201406 9.00 9.98 0.14 4.81 0.08 5.38 2.81 0.28 2.30 0.26 2.03 2.03 2.26 0 S
Thakkers Developers 201409 9.00 9.18 0.21 4.64 0.05 4.80 2.88 0.29 1.63 0.01 1.62 1.62 1.80 0 S
Tilak Finance 201312 12.85 0.30 0.27 0.40 0.16 0.05 0.12 0.00 0.12 0.12 0.01 0 S
Tilak Finance 201403 12.85 4.48 -0.55 4.57 -0.64 0.00 -0.64 -0.43 -0.42 -0.21 -0.03 0 S
Tilak Finance 201406 12.85 1.01 0.25 0.55 0.70 0.00 0.70 0.70 0.70 0.05 0 S
Tilak Finance 201409 12.85 2.53 -0.73 1.52 0.28 0.00 0.28 0.28 0.28 0.02 0 S
Tilaknagar Industries 201312 121.32 223.32 1.36 175.90 1.49 50.27 18.14 6.36 25.78 8.37 17.41 17.41 1.42 8 C
Tilaknagar Industries 201403 123.77 218.02 1.52 182.57 1.40 38.37 16.78 7.17 14.42 6.90 7.52 7.53 0.61 8 C
Tilaknagar Industries 201406 124.27 163.78 50.19 146.34 0.56 68.19 20.34 8.51 39.34 8.45 30.89 30.89 2.49 8 C
Tilaknagar Industries 201409 124.56 160.73 20.60 151.06 0.51 30.78 21.42 8.52 0.83 0.27 0.56 0.56 0.05 8 C
Timbor Home 201312 14.76 9.22 11.97 0.97 -1.78 1.60 0.23 -3.61 -3.61 -3.61 0 S
Timbor Home 201403 15.98 3.98 8.14 1.45 -2.72 1.56 0.62 -3.87 -3.87 -3.87 0 S
Timbor Home 201406 15.98 0.45 0.88 0.01 -0.42 1.47 0.15 -2.08 -2.08 -2.08 -1.30 0 S
Timbor Home 201409 15.98 0.26 1.08 0.01 -0.82 0.99 0.15 -2.00 -2.00 -2.00 -1.25 0 S
Tirupati Foam 201312 4.41 24.46 22.29 0.11 2.29 1.35 0.56 0.38 0.43 -0.06 -0.06 -0.13 15 S
Tirupati Foam 201403 4.41 26.43 24.08 0.12 2.46 1.24 0.56 0.66 0.28 0.38 0.38 0.85 15 S
Tirupati Foam 201406 4.41 20.53 18.43 0.16 2.27 1.30 0.60 0.37 -0.07 0.43 0.43 0.98 15 S
Tirupati Foam 201409 4.41 19.52 17.18 0.02 2.36 1.30 0.62 0.45 -0.05 0.50 0.50 1.12 15 S
Tirupati Industries (India) 201312 5.43 6.93 0.02 6.41 0.01 0.54 0.09 0.07 0.39 0.02 0.37 0.37 0.67 0 C
Tirupati Industries (India) 201403 5.43 15.39 0.01 14.30 0.01 1.11 0.82 -0.02 0.96 0.73 0.23 0.23 0.43 0 C
Tirupati Industries (India) 201406 5.43 9.76 0.02 9.03 0.01 0.76 0.31 0.04 0.42 0.08 0.34 0.34 0.63 0 C
Tirupati Industries (India) 201409 5.67 10.38 9.76 0.65 1.27 0.28 0.04 0.96 0.18 0.78 0.78 1.37 0 C
Tirupati Inks 201312 15.15 88.71 82.20 0.08 6.59 3.21 0.44 2.94 0.96 1.98 1.98 1.30 0 C
Tirupati Inks 201403 25.10 98.48 91.62 0.22 7.08 3.38 0.44 3.26 1.09 2.17 2.17 1.43 0 C
Tirupati Inks 201406 25.10 104.61 97.26 0.16 7.51 3.56 0.45 3.50 1.14 2.37 2.37 0.94 0 C
Tirupati Inks 201409 25.10 80.57 80.97 0.15 -0.24 4.48 0.46 -5.18 -1.14 -4.05 -4.05 -1.61 0 C
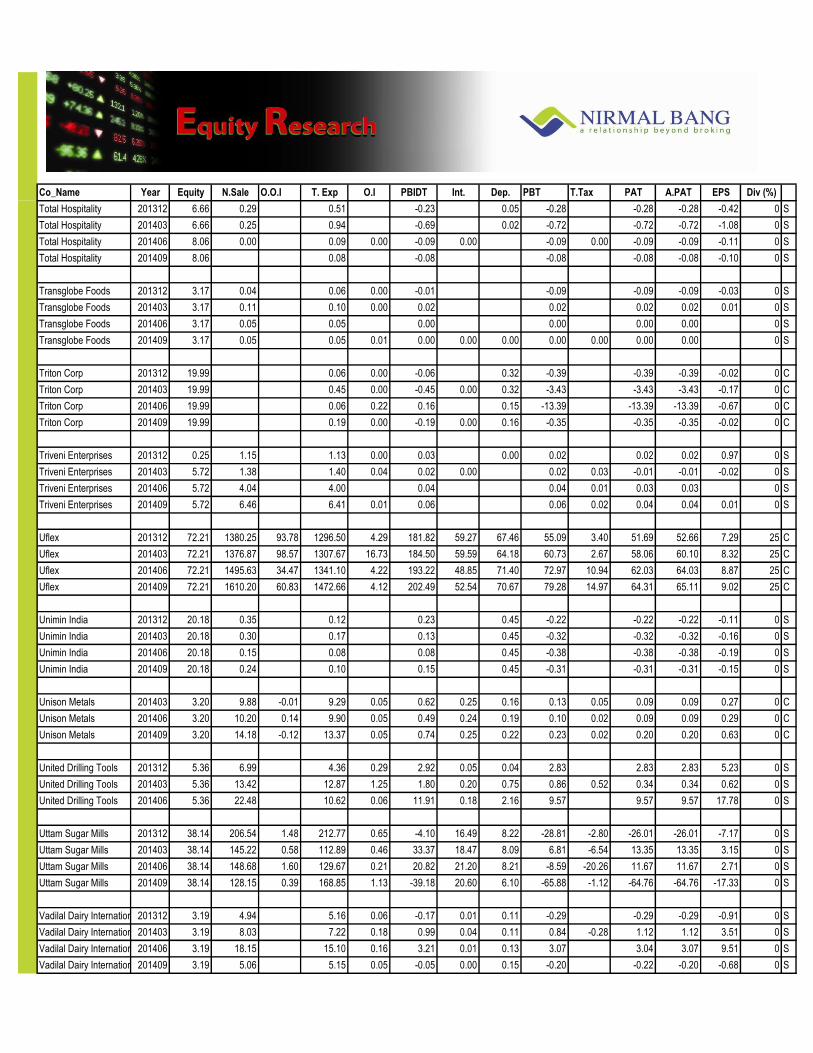
Co_Name Year Equity N.Sale O.O.I T. Exp O.I PBIDT Int. Dep. PBT T.Tax PAT A.PAT EPS Div (%)
Exp
ecte
d R
esu
lts
on
14
Feb
ruar
y 20
15
Total Hospitality 201312 6.66 0.29 0.51 -0.23 0.05 -0.28 -0.28 -0.28 -0.42 0 S
Total Hospitality 201403 6.66 0.25 0.94 -0.69 0.02 -0.72 -0.72 -0.72 -1.08 0 S
Total Hospitality 201406 8.06 0.00 0.09 0.00 -0.09 0.00 -0.09 0.00 -0.09 -0.09 -0.11 0 S
Total Hospitality 201409 8.06 0.08 -0.08 -0.08 -0.08 -0.08 -0.10 0 S
Transglobe Foods 201312 3.17 0.04 0.06 0.00 -0.01 -0.09 -0.09 -0.09 -0.03 0 S
Transglobe Foods 201403 3.17 0.11 0.10 0.00 0.02 0.02 0.02 0.02 0.01 0 S
Transglobe Foods 201406 3.17 0.05 0.05 0.00 0.00 0.00 0.00 0 S
Transglobe Foods 201409 3.17 0.05 0.05 0.01 0.00 0.00 0.00 0.00 0.00 0.00 0.00 0 S
Triton Corp 201312 19.99 0.06 0.00 -0.06 0.32 -0.39 -0.39 -0.39 -0.02 0 C
Triton Corp 201403 19.99 0.45 0.00 -0.45 0.00 0.32 -3.43 -3.43 -3.43 -0.17 0 C
Triton Corp 201406 19.99 0.06 0.22 0.16 0.15 -13.39 -13.39 -13.39 -0.67 0 C
Triton Corp 201409 19.99 0.19 0.00 -0.19 0.00 0.16 -0.35 -0.35 -0.35 -0.02 0 C
Triveni Enterprises 201312 0.25 1.15 1.13 0.00 0.03 0.00 0.02 0.02 0.02 0.97 0 S
Triveni Enterprises 201403 5.72 1.38 1.40 0.04 0.02 0.00 0.02 0.03 -0.01 -0.01 -0.02 0 S
Triveni Enterprises 201406 5.72 4.04 4.00 0.04 0.04 0.01 0.03 0.03 0 S
Triveni Enterprises 201409 5.72 6.46 6.41 0.01 0.06 0.06 0.02 0.04 0.04 0.01 0 S
Uflex 201312 72.21 1380.25 93.78 1296.50 4.29 181.82 59.27 67.46 55.09 3.40 51.69 52.66 7.29 25 C
Uflex 201403 72.21 1376.87 98.57 1307.67 16.73 184.50 59.59 64.18 60.73 2.67 58.06 60.10 8.32 25 C
Uflex 201406 72.21 1495.63 34.47 1341.10 4.22 193.22 48.85 71.40 72.97 10.94 62.03 64.03 8.87 25 C
Uflex 201409 72.21 1610.20 60.83 1472.66 4.12 202.49 52.54 70.67 79.28 14.97 64.31 65.11 9.02 25 C
Unimin India 201312 20.18 0.35 0.12 0.23 0.45 -0.22 -0.22 -0.22 -0.11 0 S
Unimin India 201403 20.18 0.30 0.17 0.13 0.45 -0.32 -0.32 -0.32 -0.16 0 S
Unimin India 201406 20.18 0.15 0.08 0.08 0.45 -0.38 -0.38 -0.38 -0.19 0 S
Unimin India 201409 20.18 0.24 0.10 0.15 0.45 -0.31 -0.31 -0.31 -0.15 0 S
Unison Metals 201403 3.20 9.88 -0.01 9.29 0.05 0.62 0.25 0.16 0.13 0.05 0.09 0.09 0.27 0 C
Unison Metals 201406 3.20 10.20 0.14 9.90 0.05 0.49 0.24 0.19 0.10 0.02 0.09 0.09 0.29 0 C
Unison Metals 201409 3.20 14.18 -0.12 13.37 0.05 0.74 0.25 0.22 0.23 0.02 0.20 0.20 0.63 0 C
United Drilling Tools 201312 5.36 6.99 4.36 0.29 2.92 0.05 0.04 2.83 2.83 2.83 5.23 0 S
United Drilling Tools 201403 5.36 13.42 12.87 1.25 1.80 0.20 0.75 0.86 0.52 0.34 0.34 0.62 0 S
United Drilling Tools 201406 5.36 22.48 10.62 0.06 11.91 0.18 2.16 9.57 9.57 9.57 17.78 0 S
Uttam Sugar Mills 201312 38.14 206.54 1.48 212.77 0.65 -4.10 16.49 8.22 -28.81 -2.80 -26.01 -26.01 -7.17 0 S
Uttam Sugar Mills 201403 38.14 145.22 0.58 112.89 0.46 33.37 18.47 8.09 6.81 -6.54 13.35 13.35 3.15 0 S
Uttam Sugar Mills 201406 38.14 148.68 1.60 129.67 0.21 20.82 21.20 8.21 -8.59 -20.26 11.67 11.67 2.71 0 S
Uttam Sugar Mills 201409 38.14 128.15 0.39 168.85 1.13 -39.18 20.60 6.10 -65.88 -1.12 -64.76 -64.76 -17.33 0 S
Vadilal Dairy International 201312 3.19 4.94 5.16 0.06 -0.17 0.01 0.11 -0.29 -0.29 -0.29 -0.91 0 S
Vadilal Dairy International 201403 3.19 8.03 7.22 0.18 0.99 0.04 0.11 0.84 -0.28 1.12 1.12 3.51 0 S
Vadilal Dairy International 201406 3.19 18.15 15.10 0.16 3.21 0.01 0.13 3.07 3.04 3.07 9.51 0 S
Vadilal Dairy International 201409 3.19 5.06 5.15 0.05 -0.05 0.00 0.15 -0.20 -0.22 -0.20 -0.68 0 S

Co_Name Year Equity N.Sale O.O.I T. Exp O.I PBIDT Int. Dep. PBT T.Tax PAT A.PAT EPS Div (%)
Exp
ecte
d R
esu
lts
on
14
Feb
ruar
y 20
15
Vaghani Techno-Build 201312 5.22 0.03 0.09 0.06 0.00 0.06 0.06 0.06 0.11 0 S
Vaghani Techno-Build 201403 5.22 0.03 0.03 0.00 0.00 -0.01 -0.01 -0.01 0 S
Vaghani Techno-Build 201406 5.22 0.00 0.05 0.01 -0.03 0.04 -0.07 0.00 -0.07 -0.07 -0.14 0 S
Vaghani Techno-Build 201409 5.22 0.04 0.02 -0.02 0.05 -0.06 -0.06 -0.06 -0.12 0 S
Vaishnavi Gold 201312 19.73 33.69 33.59 0.00 0.10 0.00 0.10 0.01 0.09 0.09 0.05 5 S
Vaishnavi Gold 201403 19.73 42.86 0.01 42.84 0.00 0.03 0.00 0.00 0.03 0.01 0.02 0.02 0.01 5 S
Vaishnavi Gold 201406 19.73 27.11 0.01 27.12 0.00 0.00 0.00 0.00 0.00 0.00 0.00 0.00 5 S
Vaishnavi Gold 201409 19.73 0.04 0.04 0.01 0.00 0.01 0.01 0.01 5 S
Vakrangee 201312 50.35 489.21 348.83 0.33 140.71 19.52 43.02 78.17 27.07 51.10 51.10 1.02 25 C
Vakrangee 201403 50.35 647.85 0.00 459.92 -1.93 186.01 16.69 52.50 116.82 45.76 71.05 71.05 1.41 25 C
Vakrangee 201406 50.35 681.23 0.01 524.98 0.67 156.92 20.48 40.72 95.72 19.54 76.19 76.19 1.51 25 C
Vakrangee 201409 50.35 698.28 0.00 517.44 2.37 183.21 20.41 41.13 121.67 41.60 80.07 80.07 1.59 25 C
Vallabh Steels 201312 4.95 36.86 34.91 1.96 1.49 0.32 0.15 0.03 0.12 0.12 0.23 0 S
Vallabh Steels 201403 4.95 47.28 47.79 2.31 1.80 0.14 1.66 -0.47 2.12 2.12 4.29 0 S
Vallabh Steels 201406 4.95 27.59 25.47 2.12 1.67 0.23 0.22 0.03 0.18 0.18 0.37 0 S
Vallabh Steels 201409 4.95 30.66 28.37 2.29 1.79 0.23 0.26 0.06 0.21 0.21 0.41 0 S
Valson Industries 201312 7.66 25.44 0.23 24.29 1.39 0.47 0.58 0.33 0.12 0.22 0.22 0.29 8 S
Valson Industries 201403 7.66 25.72 0.36 24.32 1.76 0.39 0.69 0.69 0.07 0.62 0.62 0.81 8 S
Valson Industries 201406 7.66 27.16 0.23 25.74 1.66 0.35 0.77 0.54 0.15 0.39 0.39 0.51 8 S
Valson Industries 201409 7.66 30.24 0.22 28.61 0.00 1.85 0.32 0.77 0.76 0.37 0.40 0.40 0.52 8 S
Vantage Corporate Services 201312 5.51 1.88 1.16 0.72 0.01 0.72 0.72 0.72 0.13 0 S
Vantage Corporate Services 201403 5.51 0.47 0.27 0.19 0.00 0.19 0.19 0.19 0.03 0 S
Vantage Corporate Services 201406 5.51 0.11 0.09 0.02 0.00 0.01 0.01 0.01 0.02 0 S
Vantage Corporate Services 201409 5.51 0.14 0.48 -0.34 0.00 -0.34 -0.34 -0.34 -0.61 0 S
Vardhman Concrete 201312 7.16 0.05 -0.05 0.03 0.06 -0.15 -0.02 -0.13 -0.13 -0.18 0 S
Vardhman Concrete 201403 7.16 4.18 1.42 0.02 2.79 0.24 0.01 1.81 -0.33 2.14 2.14 2.99 0 S
Vardhman Concrete 201406 7.16 0.04 0.07 -0.03 0.05 0.01 -0.10 0.00 -0.09 -0.09 -0.13 0 S
Vardhman Concrete 201409 7.16 0.08 0.08 0.01 0.01 0.05 0.01 -0.05 0.00 -0.05 -0.05 -0.07 0 S
Vardhman Industries 201312 7.90 88.99 0.02 83.27 0.00 5.75 2.41 1.84 1.49 0.30 1.20 1.20 1.51 10 S
Vardhman Industries 201403 7.90 109.16 -0.07 104.24 4.85 1.46 1.18 2.85 0.79 2.06 2.06 2.61 10 S
Vardhman Industries 201406 7.90 69.27 63.66 5.61 2.42 1.55 1.64 0.30 1.34 1.34 1.70 10 S
Vardhman Industries 201409 7.90 78.62 73.82 4.80 1.23 1.44 2.14 0.42 1.72 1.72 2.18 10 S
Vaswani Industries 201312 28.66 54.65 50.29 0.04 4.39 2.86 1.40 0.13 0.13 0.00 0.00 0 S
Vaswani Industries 201403 28.66 71.88 68.51 1.78 5.15 2.74 1.37 1.04 0.34 0.70 0.70 -0.11 0 S
Vaswani Industries 201406 28.66 63.46 58.63 0.02 4.85 2.72 1.39 0.75 0.23 0.51 0.51 0.66 0 S
Vaswani Industries 201409 28.66 62.13 57.69 0.05 4.49 2.82 1.41 0.26 0.04 0.22 0.22 0.08 0 S
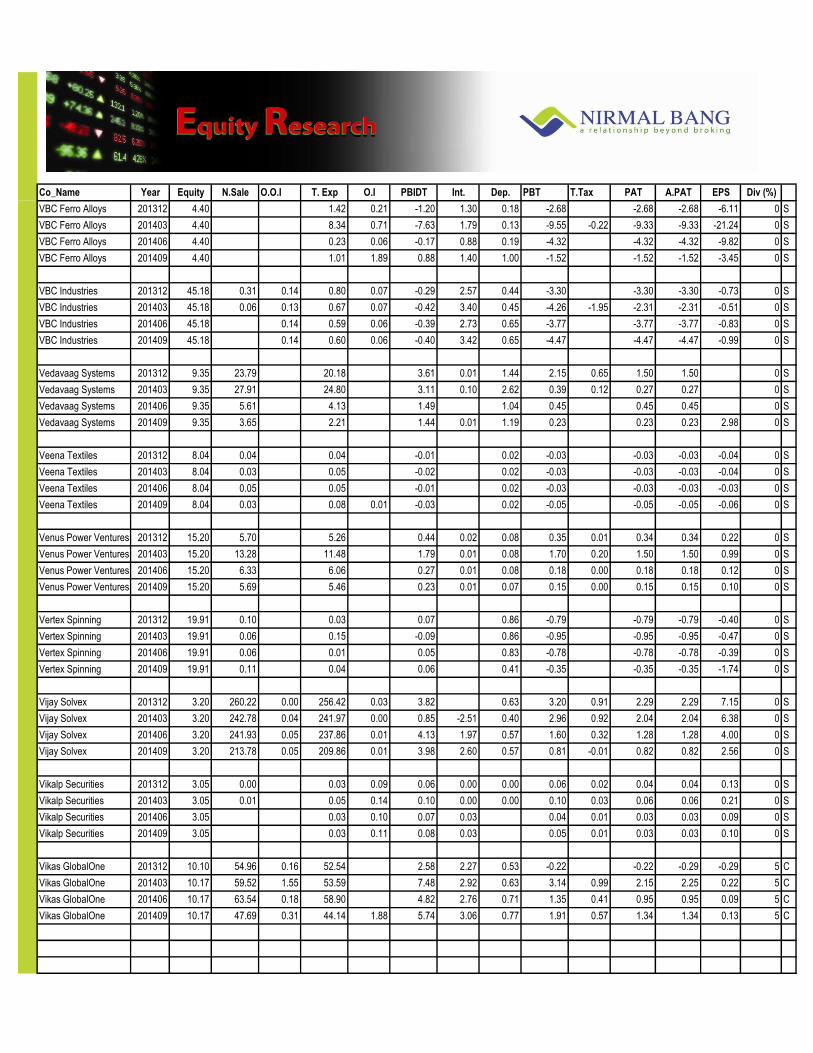
Co_Name Year Equity N.Sale O.O.I T. Exp O.I PBIDT Int. Dep. PBT T.Tax PAT A.PAT EPS Div (%)
Exp
ecte
d R
esu
lts
on
14
Feb
ruar
y 20
15
VBC Ferro Alloys 201312 4.40 1.42 0.21 -1.20 1.30 0.18 -2.68 -2.68 -2.68 -6.11 0 S
VBC Ferro Alloys 201403 4.40 8.34 0.71 -7.63 1.79 0.13 -9.55 -0.22 -9.33 -9.33 -21.24 0 S
VBC Ferro Alloys 201406 4.40 0.23 0.06 -0.17 0.88 0.19 -4.32 -4.32 -4.32 -9.82 0 S
VBC Ferro Alloys 201409 4.40 1.01 1.89 0.88 1.40 1.00 -1.52 -1.52 -1.52 -3.45 0 S
VBC Industries 201312 45.18 0.31 0.14 0.80 0.07 -0.29 2.57 0.44 -3.30 -3.30 -3.30 -0.73 0 S
VBC Industries 201403 45.18 0.06 0.13 0.67 0.07 -0.42 3.40 0.45 -4.26 -1.95 -2.31 -2.31 -0.51 0 S
VBC Industries 201406 45.18 0.14 0.59 0.06 -0.39 2.73 0.65 -3.77 -3.77 -3.77 -0.83 0 S
VBC Industries 201409 45.18 0.14 0.60 0.06 -0.40 3.42 0.65 -4.47 -4.47 -4.47 -0.99 0 S
Vedavaag Systems 201312 9.35 23.79 20.18 3.61 0.01 1.44 2.15 0.65 1.50 1.50 0 S
Vedavaag Systems 201403 9.35 27.91 24.80 3.11 0.10 2.62 0.39 0.12 0.27 0.27 0 S
Vedavaag Systems 201406 9.35 5.61 4.13 1.49 1.04 0.45 0.45 0.45 0 S
Vedavaag Systems 201409 9.35 3.65 2.21 1.44 0.01 1.19 0.23 0.23 0.23 2.98 0 S
Veena Textiles 201312 8.04 0.04 0.04 -0.01 0.02 -0.03 -0.03 -0.03 -0.04 0 S
Veena Textiles 201403 8.04 0.03 0.05 -0.02 0.02 -0.03 -0.03 -0.03 -0.04 0 S
Veena Textiles 201406 8.04 0.05 0.05 -0.01 0.02 -0.03 -0.03 -0.03 -0.03 0 S
Veena Textiles 201409 8.04 0.03 0.08 0.01 -0.03 0.02 -0.05 -0.05 -0.05 -0.06 0 S
Venus Power Ventures (India) 201312 15.20 5.70 5.26 0.44 0.02 0.08 0.35 0.01 0.34 0.34 0.22 0 S
Venus Power Ventures (India) 201403 15.20 13.28 11.48 1.79 0.01 0.08 1.70 0.20 1.50 1.50 0.99 0 S
Venus Power Ventures (India) 201406 15.20 6.33 6.06 0.27 0.01 0.08 0.18 0.00 0.18 0.18 0.12 0 S
Venus Power Ventures (India) 201409 15.20 5.69 5.46 0.23 0.01 0.07 0.15 0.00 0.15 0.15 0.10 0 S
Vertex Spinning 201312 19.91 0.10 0.03 0.07 0.86 -0.79 -0.79 -0.79 -0.40 0 S
Vertex Spinning 201403 19.91 0.06 0.15 -0.09 0.86 -0.95 -0.95 -0.95 -0.47 0 S
Vertex Spinning 201406 19.91 0.06 0.01 0.05 0.83 -0.78 -0.78 -0.78 -0.39 0 S
Vertex Spinning 201409 19.91 0.11 0.04 0.06 0.41 -0.35 -0.35 -0.35 -1.74 0 S
Vijay Solvex 201312 3.20 260.22 0.00 256.42 0.03 3.82 0.63 3.20 0.91 2.29 2.29 7.15 0 S
Vijay Solvex 201403 3.20 242.78 0.04 241.97 0.00 0.85 -2.51 0.40 2.96 0.92 2.04 2.04 6.38 0 S
Vijay Solvex 201406 3.20 241.93 0.05 237.86 0.01 4.13 1.97 0.57 1.60 0.32 1.28 1.28 4.00 0 S
Vijay Solvex 201409 3.20 213.78 0.05 209.86 0.01 3.98 2.60 0.57 0.81 -0.01 0.82 0.82 2.56 0 S
Vikalp Securities 201312 3.05 0.00 0.03 0.09 0.06 0.00 0.00 0.06 0.02 0.04 0.04 0.13 0 S
Vikalp Securities 201403 3.05 0.01 0.05 0.14 0.10 0.00 0.00 0.10 0.03 0.06 0.06 0.21 0 S
Vikalp Securities 201406 3.05 0.03 0.10 0.07 0.03 0.04 0.01 0.03 0.03 0.09 0 S
Vikalp Securities 201409 3.05 0.03 0.11 0.08 0.03 0.05 0.01 0.03 0.03 0.10 0 S
Vikas GlobalOne 201312 10.10 54.96 0.16 52.54 2.58 2.27 0.53 -0.22 -0.22 -0.29 -0.29 5 C
Vikas GlobalOne 201403 10.17 59.52 1.55 53.59 7.48 2.92 0.63 3.14 0.99 2.15 2.25 0.22 5 C
Vikas GlobalOne 201406 10.17 63.54 0.18 58.90 4.82 2.76 0.71 1.35 0.41 0.95 0.95 0.09 5 C
Vikas GlobalOne 201409 10.17 47.69 0.31 44.14 1.88 5.74 3.06 0.77 1.91 0.57 1.34 1.34 0.13 5 C
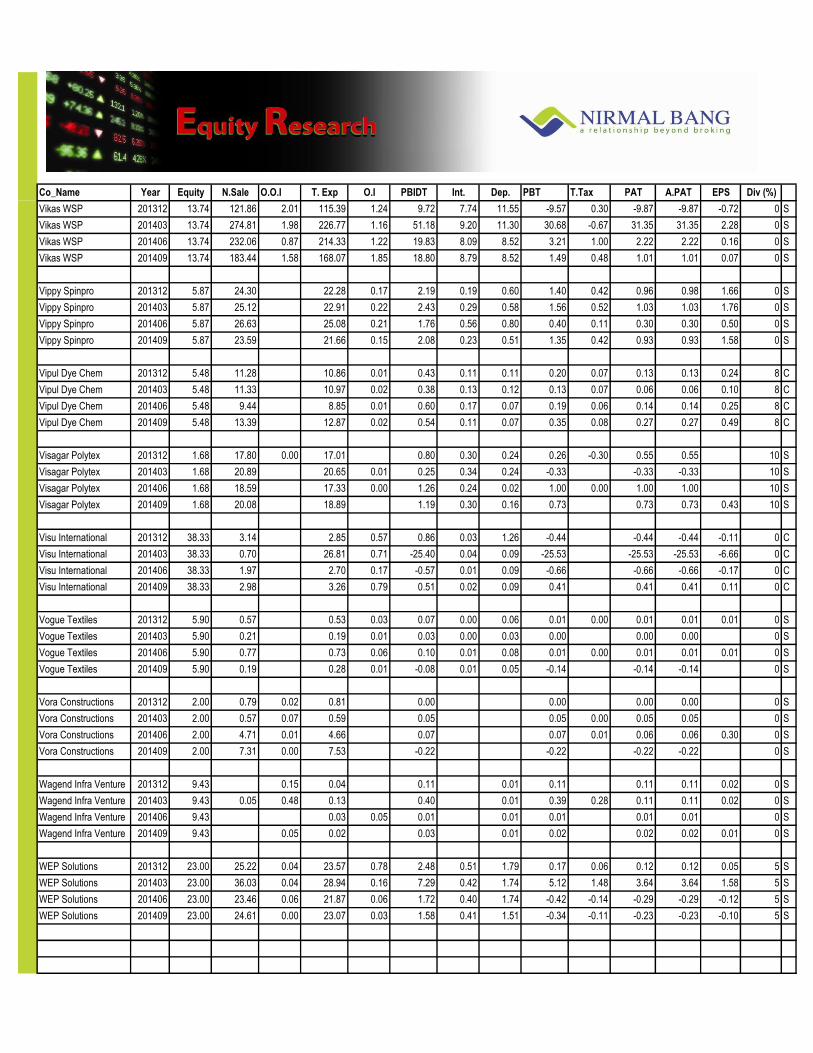
Co_Name Year Equity N.Sale O.O.I T. Exp O.I PBIDT Int. Dep. PBT T.Tax PAT A.PAT EPS Div (%)
Exp
ecte
d R
esu
lts
on
14
Feb
ruar
y 20
15
Vikas WSP 201312 13.74 121.86 2.01 115.39 1.24 9.72 7.74 11.55 -9.57 0.30 -9.87 -9.87 -0.72 0 S
Vikas WSP 201403 13.74 274.81 1.98 226.77 1.16 51.18 9.20 11.30 30.68 -0.67 31.35 31.35 2.28 0 S
Vikas WSP 201406 13.74 232.06 0.87 214.33 1.22 19.83 8.09 8.52 3.21 1.00 2.22 2.22 0.16 0 S
Vikas WSP 201409 13.74 183.44 1.58 168.07 1.85 18.80 8.79 8.52 1.49 0.48 1.01 1.01 0.07 0 S
Vippy Spinpro 201312 5.87 24.30 22.28 0.17 2.19 0.19 0.60 1.40 0.42 0.96 0.98 1.66 0 S
Vippy Spinpro 201403 5.87 25.12 22.91 0.22 2.43 0.29 0.58 1.56 0.52 1.03 1.03 1.76 0 S
Vippy Spinpro 201406 5.87 26.63 25.08 0.21 1.76 0.56 0.80 0.40 0.11 0.30 0.30 0.50 0 S
Vippy Spinpro 201409 5.87 23.59 21.66 0.15 2.08 0.23 0.51 1.35 0.42 0.93 0.93 1.58 0 S
Vipul Dye Chem 201312 5.48 11.28 10.86 0.01 0.43 0.11 0.11 0.20 0.07 0.13 0.13 0.24 8 C
Vipul Dye Chem 201403 5.48 11.33 10.97 0.02 0.38 0.13 0.12 0.13 0.07 0.06 0.06 0.10 8 C
Vipul Dye Chem 201406 5.48 9.44 8.85 0.01 0.60 0.17 0.07 0.19 0.06 0.14 0.14 0.25 8 C
Vipul Dye Chem 201409 5.48 13.39 12.87 0.02 0.54 0.11 0.07 0.35 0.08 0.27 0.27 0.49 8 C
Visagar Polytex 201312 1.68 17.80 0.00 17.01 0.80 0.30 0.24 0.26 -0.30 0.55 0.55 10 S
Visagar Polytex 201403 1.68 20.89 20.65 0.01 0.25 0.34 0.24 -0.33 -0.33 -0.33 10 S
Visagar Polytex 201406 1.68 18.59 17.33 0.00 1.26 0.24 0.02 1.00 0.00 1.00 1.00 10 S
Visagar Polytex 201409 1.68 20.08 18.89 1.19 0.30 0.16 0.73 0.73 0.73 0.43 10 S
Visu International 201312 38.33 3.14 2.85 0.57 0.86 0.03 1.26 -0.44 -0.44 -0.44 -0.11 0 C
Visu International 201403 38.33 0.70 26.81 0.71 -25.40 0.04 0.09 -25.53 -25.53 -25.53 -6.66 0 C
Visu International 201406 38.33 1.97 2.70 0.17 -0.57 0.01 0.09 -0.66 -0.66 -0.66 -0.17 0 C
Visu International 201409 38.33 2.98 3.26 0.79 0.51 0.02 0.09 0.41 0.41 0.41 0.11 0 C
Vogue Textiles 201312 5.90 0.57 0.53 0.03 0.07 0.00 0.06 0.01 0.00 0.01 0.01 0.01 0 S
Vogue Textiles 201403 5.90 0.21 0.19 0.01 0.03 0.00 0.03 0.00 0.00 0.00 0 S
Vogue Textiles 201406 5.90 0.77 0.73 0.06 0.10 0.01 0.08 0.01 0.00 0.01 0.01 0.01 0 S
Vogue Textiles 201409 5.90 0.19 0.28 0.01 -0.08 0.01 0.05 -0.14 -0.14 -0.14 0 S
Vora Constructions 201312 2.00 0.79 0.02 0.81 0.00 0.00 0.00 0.00 0 S
Vora Constructions 201403 2.00 0.57 0.07 0.59 0.05 0.05 0.00 0.05 0.05 0 S
Vora Constructions 201406 2.00 4.71 0.01 4.66 0.07 0.07 0.01 0.06 0.06 0.30 0 S
Vora Constructions 201409 2.00 7.31 0.00 7.53 -0.22 -0.22 -0.22 -0.22 0 S
Wagend Infra Venture 201312 9.43 0.15 0.04 0.11 0.01 0.11 0.11 0.11 0.02 0 S
Wagend Infra Venture 201403 9.43 0.05 0.48 0.13 0.40 0.01 0.39 0.28 0.11 0.11 0.02 0 S
Wagend Infra Venture 201406 9.43 0.03 0.05 0.01 0.01 0.01 0.01 0.01 0 S
Wagend Infra Venture 201409 9.43 0.05 0.02 0.03 0.01 0.02 0.02 0.02 0.01 0 S
WEP Solutions 201312 23.00 25.22 0.04 23.57 0.78 2.48 0.51 1.79 0.17 0.06 0.12 0.12 0.05 5 S
WEP Solutions 201403 23.00 36.03 0.04 28.94 0.16 7.29 0.42 1.74 5.12 1.48 3.64 3.64 1.58 5 S
WEP Solutions 201406 23.00 23.46 0.06 21.87 0.06 1.72 0.40 1.74 -0.42 -0.14 -0.29 -0.29 -0.12 5 S
WEP Solutions 201409 23.00 24.61 0.00 23.07 0.03 1.58 0.41 1.51 -0.34 -0.11 -0.23 -0.23 -0.10 5 S
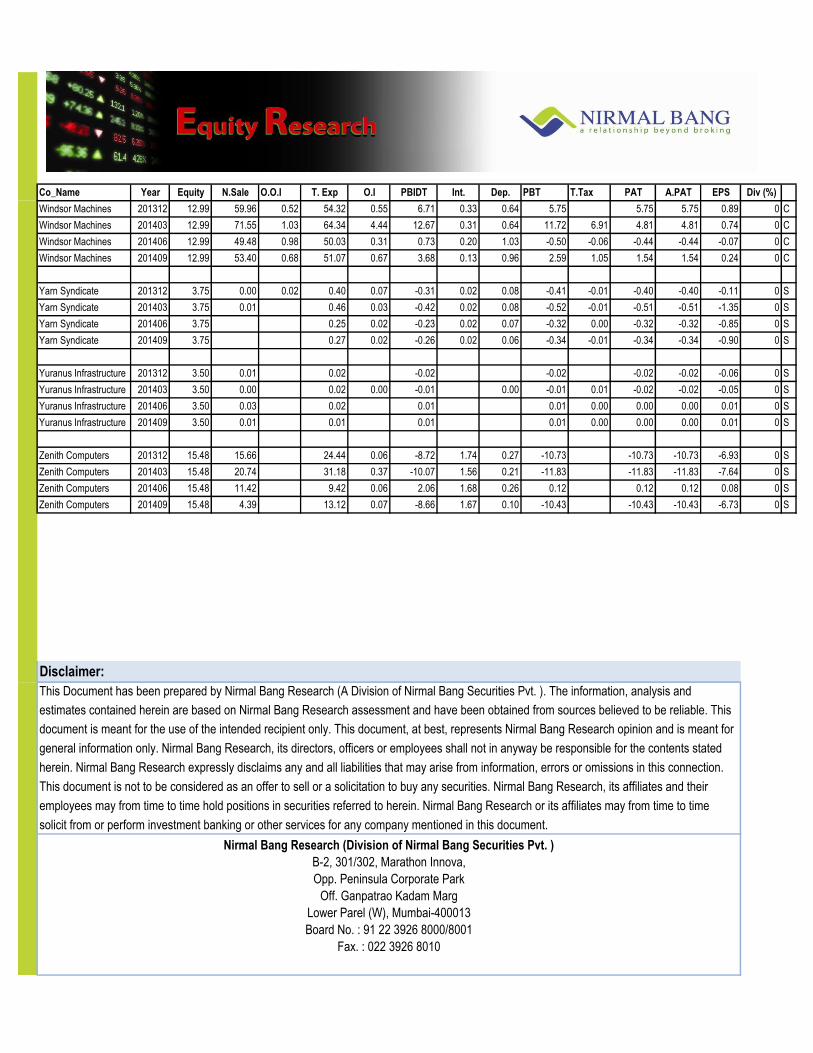
Co_Name Year Equity N.Sale O.O.I T. Exp O.I PBIDT Int. Dep. PBT T.Tax PAT A.PAT EPS Div (%)
Exp
ecte
d R
esu
lts
on
14
Feb
ruar
y 20
15
Windsor Machines 201312 12.99 59.96 0.52 54.32 0.55 6.71 0.33 0.64 5.75 5.75 5.75 0.89 0 C
Windsor Machines 201403 12.99 71.55 1.03 64.34 4.44 12.67 0.31 0.64 11.72 6.91 4.81 4.81 0.74 0 C
Windsor Machines 201406 12.99 49.48 0.98 50.03 0.31 0.73 0.20 1.03 -0.50 -0.06 -0.44 -0.44 -0.07 0 C
Windsor Machines 201409 12.99 53.40 0.68 51.07 0.67 3.68 0.13 0.96 2.59 1.05 1.54 1.54 0.24 0 C
Yarn Syndicate 201312 3.75 0.00 0.02 0.40 0.07 -0.31 0.02 0.08 -0.41 -0.01 -0.40 -0.40 -0.11 0 S
Yarn Syndicate 201403 3.75 0.01 0.46 0.03 -0.42 0.02 0.08 -0.52 -0.01 -0.51 -0.51 -1.35 0 S
Yarn Syndicate 201406 3.75 0.25 0.02 -0.23 0.02 0.07 -0.32 0.00 -0.32 -0.32 -0.85 0 S
Yarn Syndicate 201409 3.75 0.27 0.02 -0.26 0.02 0.06 -0.34 -0.01 -0.34 -0.34 -0.90 0 S
Yuranus Infrastructure 201312 3.50 0.01 0.02 -0.02 -0.02 -0.02 -0.02 -0.06 0 S
Yuranus Infrastructure 201403 3.50 0.00 0.02 0.00 -0.01 0.00 -0.01 0.01 -0.02 -0.02 -0.05 0 S
Yuranus Infrastructure 201406 3.50 0.03 0.02 0.01 0.01 0.00 0.00 0.00 0.01 0 S
Yuranus Infrastructure 201409 3.50 0.01 0.01 0.01 0.01 0.00 0.00 0.00 0.01 0 S
Zenith Computers 201312 15.48 15.66 24.44 0.06 -8.72 1.74 0.27 -10.73 -10.73 -10.73 -6.93 0 S
Zenith Computers 201403 15.48 20.74 31.18 0.37 -10.07 1.56 0.21 -11.83 -11.83 -11.83 -7.64 0 S
Zenith Computers 201406 15.48 11.42 9.42 0.06 2.06 1.68 0.26 0.12 0.12 0.12 0.08 0 S
Zenith Computers 201409 15.48 4.39 13.12 0.07 -8.66 1.67 0.10 -10.43 -10.43 -10.43 -6.73 0 S
This Document has been prepared by Nirmal Bang Research (A Division of Nirmal Bang Securities Pvt. ). The information, analysis and
estimates contained herein are based on Nirmal Bang Research assessment and have been obtained from sources believed to be reliable. This
document is meant for the use of the intended recipient only. This document, at best, represents Nirmal Bang Research opinion and is meant for
general information only. Nirmal Bang Research, its directors, officers or employees shall not in anyway be responsible for the contents stated
herein. Nirmal Bang Research expressly disclaims any and all liabilities that may arise from information, errors or omissions in this connection.
This document is not to be considered as an offer to sell or a solicitation to buy any securities. Nirmal Bang Research, its affiliates and their
employees may from time to time hold positions in securities referred to herein. Nirmal Bang Research or its affiliates may from time to time
solicit from or perform investment banking or other services for any company mentioned in this document.
Nirmal Bang Research (Division of Nirmal Bang Securities Pvt. )
B-2, 301/302, Marathon Innova,
Opp. Peninsula Corporate Park
Off. Ganpatrao Kadam Marg
Lower Parel (W), Mumbai-400013
Board No. : 91 22 3926 8000/8001
Fax. : 022 3926 8010
Disclaimer: