Co-locating wind and solar: Combining powers
15
Co-locating wind and solar: Combining powers Craig Chambers
-
Upload
nsw-resources-energy -
Category
Environment
-
view
80 -
download
1
Transcript of Co-locating wind and solar: Combining powers
Co-locating wind and solar: Combining powers
Craig Chambers
Overview
Wind and solar co-location
1. The concept
2. Benefits and challenges
3. Complementary nature wind and solar resource
4. System sizing and curtailment
5. Heat map and wind farm ranking
6. Summary
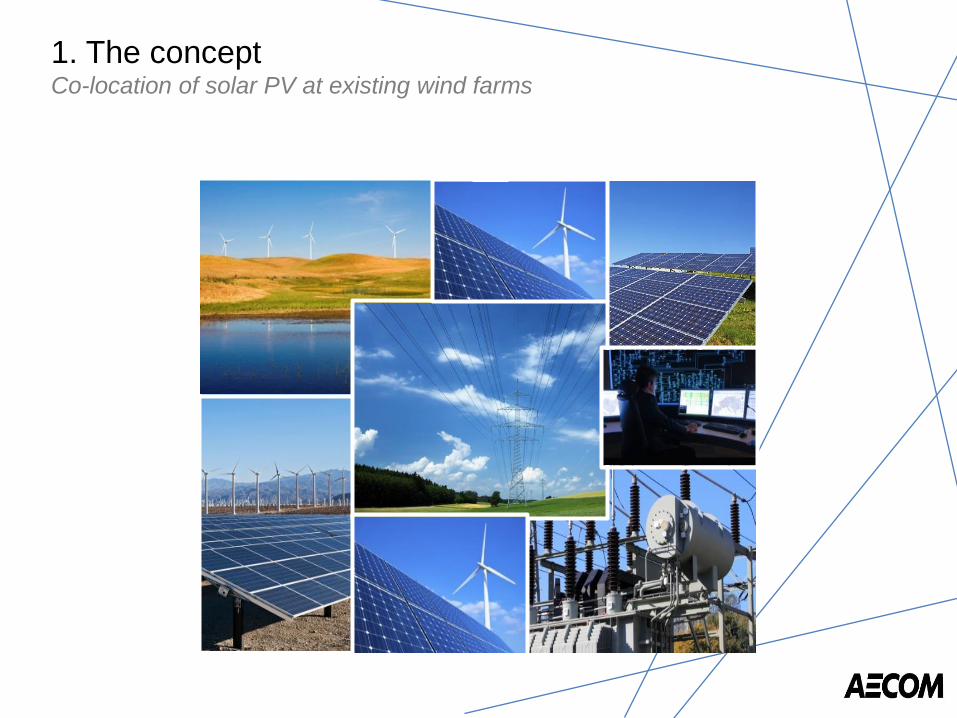
1. The concept Co-location of solar PV at existing wind farms

2. Benefits and challenges Benefits
Benefits
Development cost
Land
Grid connection
PPA
Construction time
O&M facilities
Administration
Additional savings can be
obtained when developing
wind and solar power
plants at the same time
as a greenfield
development.

2. Benefits and challenges Challenges
Challenges
Land use
Sizing & Curtailment
Agreements (GCA, PPA, LPA, O&M)
O&M activities
Community
Selected 10 wind farms for analysis
State Wind Farm Capacity
(MW) Yrs of data available
1 NSW Capital 140 4
2 NSW Gunning 47 3
3 SA Waterloo 111 4
4 SA Snowtown 99 4
5 SA Hallett 1 95 4
6 VIC Waubra 192 4
7 VIC Oaklands Hill 67 3
8 WA Collgar 206 3
9 WA Alinta 89 4
10 WA Emu Downs 80 4
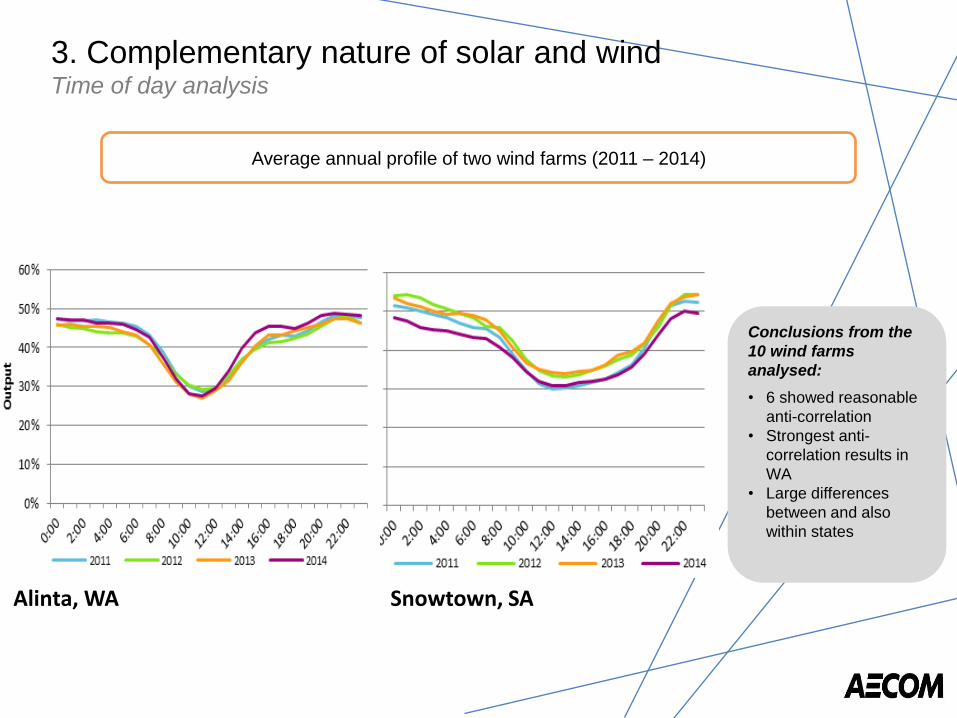
3. Complementary nature of solar and wind Time of day analysis
Alinta, WA Snowtown, SA
Average annual profile of two wind farms (2011 – 2014)
Conclusions from the
10 wind farms
analysed:
• 6 showed reasonable
anti-correlation
• Strongest anti-
correlation results in
WA
• Large differences
between and also
within states

3. Complementary nature of solar and wind Seasonal analysis
Waubra, VIC Collgar, WA
Average seasonal profile of two wind farms (2011 – 2014)
Conclusions from the
10 wind farms
analysed :
• 6 generated more in
Spring
• 2 generated more in
Summer but showed
dips during daylight
hours
• 2 generated more in
Winter (both in WA)

4. System sizing and curtailment Curtailment analysis
Solar PV curtailment versus additional solar capacity on each analysed wind farm (2011 – 2014)
100%
25 – 50%
27% curtailment at Snowtown
Conclusions from the 10
wind farms analysed :
- Snowtown and Hallett
wind farm show high
curtailment mainly due to
its high generation during
the day time
- Suitable penetration with
25%-50% of solar @5%
curtailment
- Curtailment did not
exceed 30% when adding
100% of solar PV.
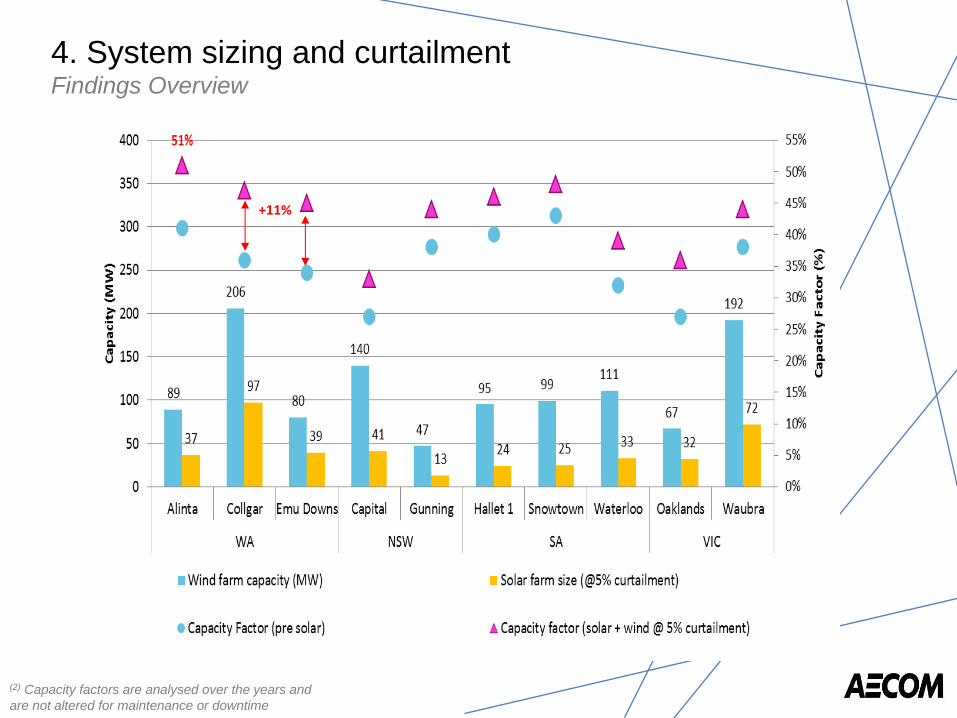
4. System sizing and curtailment Findings Overview
(2) Capacity factors are analysed over the years and
are not altered for maintenance or downtime
+11%
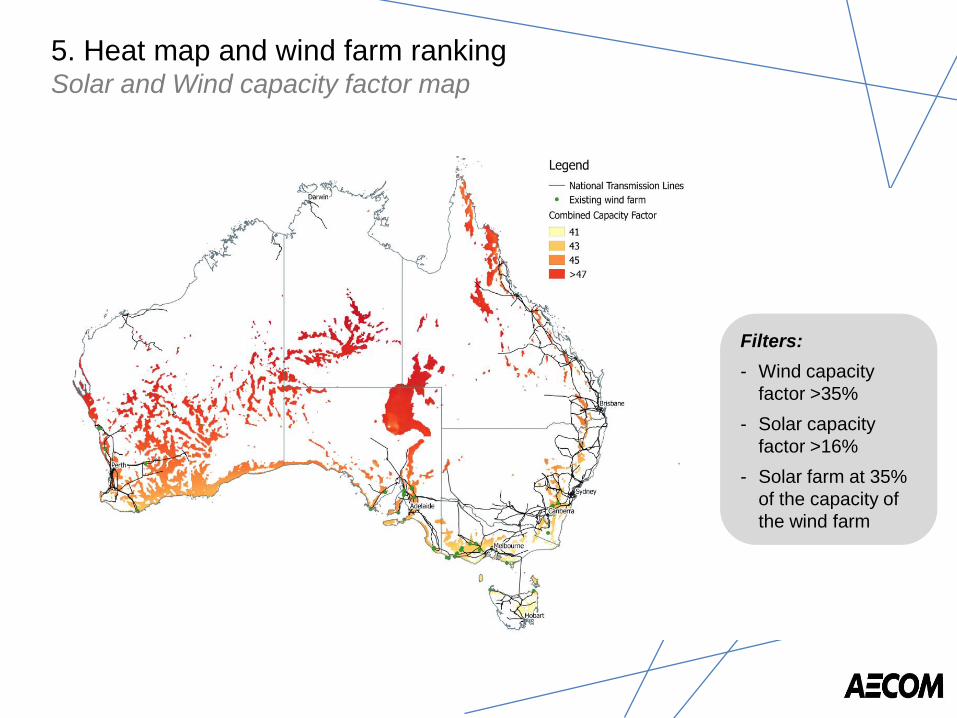
Filters:
- Wind capacity
factor >35%
- Solar capacity
factor >16%
- Solar farm at 35%
of the capacity of
the wind farm
5. Heat map and wind farm ranking Solar and Wind capacity factor map

0.90
0.95
1.00
1.05
1.10
1.15
1.20
0.75 0.85 0.95 1.05 1.15 1.25 1.35 1.45 1.55
Co
st I
nd
ex
Revenue Index
New South Wales South Australia Tasmania Victoria Western Australia
Conclusions:
- Western Australia
provides significant
opportunities
- Victoria and New
South Wales
appear to provide
cost advantages
5. Heat map and wind farm ranking
Ranking of existing wind farms

6. NSW Snapshot C
apit
al W
ind
Far
m
Gu
nn
ing
Win
d F
arm
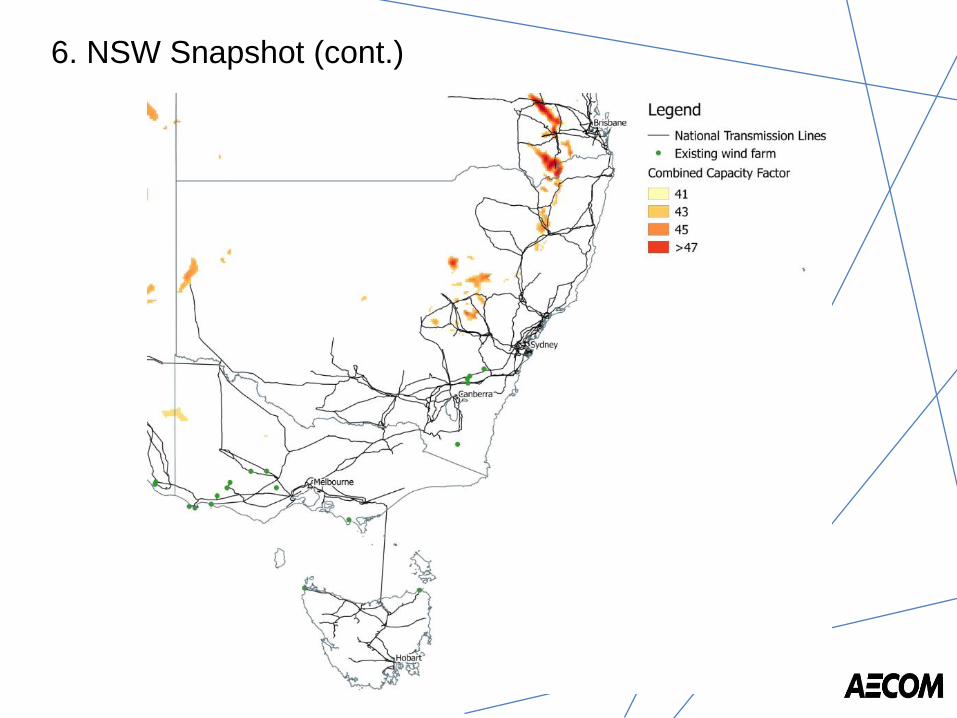
6. NSW Snapshot (cont.)
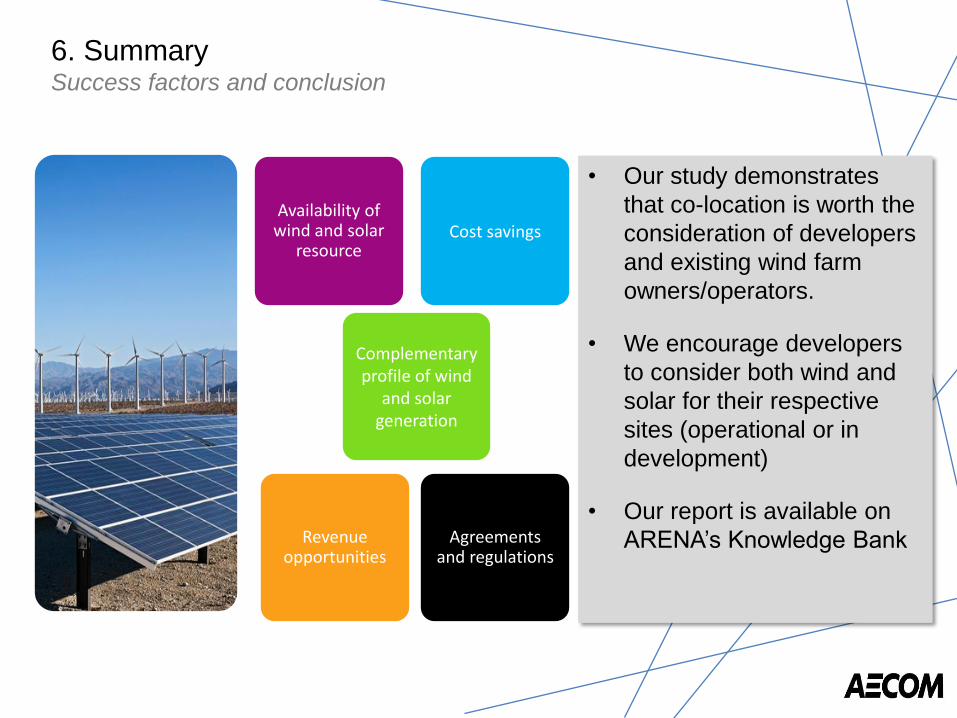
Availability of wind and solar
resource
Complementary profile of wind
and solar generation
Cost savings
Revenue opportunities
Agreements and regulations
• Our study demonstrates
that co-location is worth the
consideration of developers
and existing wind farm
owners/operators.
• We encourage developers
to consider both wind and
solar for their respective
sites (operational or in
development)
• Our report is available on
ARENA’s Knowledge Bank
6. Summary Success factors and conclusion

Thank You Craig Chambers [email protected]