Indian Email Database, Indian Email id Database, All India Email Database, Email Database India

CO2 Baseline Database
for the Indian Power Sector
User Guide
Version 4.0
October 2008
Government of India
Ministry of Power
Central Electricity Authority Sewa Bhawan, R.K.Puram,
New Delhi-66

Revision History of the Database
Version No. Date of Publi-
cation
Main Revisions Compared to Previous Version
1.0 Draft for
Stakeholder
Consultation
4th October
2006
–
1.0 November
2006
- Added data on 10 stations which had been in exclusion worksheet of draft
database
- Adjusted values to latest IPCC Guidance (IPCC 2006 Guidelines for National
Greenhouse Gas Inventories) where IPCC defaults are used
1.1 December
2006
- Adjusted fuel emission factor of lignite to be in line with Initial National Com-
munication figures
2.0 June 2007 - Added data for FY 2005-06, including new stations and units commissioned
during 2005-06
Retroactive changes to data for FY 2000-01 to 2004-05:
- Introduced differentiated default heat rates for open- vs. combined-cycle sta-
tions (gas- and diesel-fired; only applicable where fuel consumption was not
provided by station)
- Refined approximation of unit-level generation where not provided by station,
by taking into account day of commissioning (for build margin)
- Revised fuel consumption for some stations where data became available
3.0 December
2007
- Added data for FY 2006-07, including new stations and units commissioned
during 2006-07
- Adapted calculations and User Guide to ensure consistency with new CDM
methodologies: ACM0002 Version 07, and Tool to Calculate the Emission
Factor for an Electricity System (Version 01.1, EB 35 Annex 12)
4.0 October 2008 - Added data for FY 2007-08, including new stations and units commissioned
during 2007-08
- Adjusted delineation of regional grids
- Adjusted IPCC-based fuel emission factors to account for uncertainty in line
with EB 35 Annex 12
- Baseline Emission Factor as per Methodology ACM0013 included as separate
chapter
Expert Team Contributing to the Database
Central Electricity Authority
Mr. V.S. Verma, Member (Planning)
Mr. Amarjeet Singh, Chief Engineer (C&E)
Mr. B.K. Sharma, Director (C&E)
Mr. Praveen Gupta, Deputy Director (C&E)
Mr. Rajesh Kumar, Assistant Director (C&E)
First Climate (Switzerland) AG
Mr. Urs Brodmann, Managing Partner
Mr. Till Danckwardt, Project Manager
Mr. Mathias Sacher, Project Assistant
Mr. Luca Morganti, Project Manager

III
Foreword
The Clean Development Mechanism (CDM) gives an opportunity to developing countries
in achieving their sustainable development objective, besides providing opportunity to
introduce new and efficient technologies.
India has high potential for CDM projects, particularly in the Power Sector. With large
resources of technical power we can develop innovative CDM projects in energy efficiency
and conservation including R&M schemes for power generation and adopt new and
renewable technologies.
The last version of CO2 Baseline Database for the Indian Power Sector (Version 3.0)
containing data for the year 2006-07 was published in December 2007. The Baseline
Database has benefited all prospective CDM project developers to estimate the amount of
Certified Emission Reduction (CERs).
Northern Regional Grid was synchronised with the integrated Eastern, North Eastern and
Western Grid in August,2006 and the four regional grids have since been operating in
synchronous mode. The emission factors have been worked out based on this new grid
configuration. This publication is the version 4.0 of the CO2 Baseline Database for Indian
Power Sector containing data for the year 2007-08. The emission factors have been
calculated based on Tool approved and published by CDM Executive Board to calculate the
emission factor for an electricity system version 1.1.
The average CO2 emission rate has declined from 0.85 t CO2/ MWh in the year 2002-03 to
0.79 t CO2/MWh in the year 2007-08. All efforts are being made to improve the efficiency of
power generation, transmission and distribution.
I am glad that Central Electricity Authority has also worked out CO2 baseline emission
factor as per CDM approved methodology ACM0013 for the new upcoming supercritical coal
based power plants for availing CDM benefits. This has been included as a part of this book.
The team of CEA officers headed by Shri Amarjeet Singh, Chief Engineer (Conservation
and Efficiency Division) has done a commendable job under the able guidance of Shri V.S.
Verma, Member (Planning), CEA. We are thankful to Dr A. Kaupp, Mr Jens Burgtorf, Smt.
Pamposh Bhat, , GTZ, Climate Change Unit, Mr Urs Brodmann and Dr Axel Michaelowa,
GTZ-CDM-India consultants, who provided guidance and gave useful inputs to the team of
CEA engineers.
New Delhi (Rakesh Nath)
October 2008 Chairperson

IV
Preface
Developing countries like India do not fall in the Annex I category of the Kyoto Protocol but
India has a strong commitment to reduce its emissions of greenhouse gases and mitigate
climate change. Ministry of Power has accorded high priority to the CDM projects in the
power sector. The number of Indian CDM projects registered with the CDM Executive Board
is a good indication to India’s commitment towards protection of the Global Environment. Till
date, more than 358 Indian projects have been registered with the Executive Board. Host
country approval to more than 1100 projects has already been accorded by National CDM
Authority established under the Ministry of Environment and Forest.
CEA undertook the study relating to the baseline data for the Power sector in the country
with a view to obtaining uniformity of approach in the country towards a common objective.
Detailed information was collected from all power generating stations. The database has now
been updated for the year 2007-08 with an endeavour to update on annual basis. The user
guide has been prepared to enable project developers to use the baseline emission data
effectively for CDM benefits. This version of the database has considered synchronous grid
operation of Northern, Eastern, Western and North Eastern Grids (NEWNE) and therefore
publishing Emission factors of NEWNE Grid and Southern Grid. This version has also
taken care of revised version 1.1 of the Tool to calculate the emission factor for an
electricity system published by CDM Executive Board.
The baseline emission database is useful not only to power sector projects but to all the
industrial projects which are improving the efficiency of the process thus saving electricity.
Indian industries have taken a lead in development of large number of CDM projects though
of smaller size. The development of the baseline database would encourage project devel-
opers to pose large CDM projects in hydro power generation, Renovation and Modernisation
of power stations, adoption of super critical technologies in power generation etc.
Based on recently CDM approved methodology for fossil fuel project using less GHG
intensive technology, Central Electricity Authority has also worked out baseline emission
factor for the new supercritical coal based power plants. This has been included as a part of
this book.
I appreciate the efforts put in by all the officers of Central Electricity Authority, GTZ and
Ms Pamposh Bhat of CDM India, in bringing out the updated version for the year 2007-08.
I am confident, that baseline carbon dioxide emissions, developed by CEA will continue to
provide direction to help industry to come up with new CDM project concepts to further con-
solidate and reinforce our effort to save the global environment.
New Delhi (V.S. Verma)
October 2008 Member (Planning)

V
Acknowledgement
India has the distinction of maximum number of registered CDM projects by the CDM Ex-
ecutive Board and I am confident that more and more CDM projects would be got registered
in future. Various CDM projects had been facing the difficulties in establishing the baseline
emissions for calculating authentic Certified Emission Reductions (CERs). Accordingly, Cen-
tral Electricity Authority took the initiative to publish the Carbon di-oxide baseline database
for the Indian Power Sector to assist CDM project developers for speedy approval of their
CDM projects.
The present publication is the result of the trust Ministry of Power, Government of India,
posed in Central Electricity Authority and entrusting us with the responsibility of establishing
the Baseline Carbon dioxide emissions from the Indian power sector. I am thankful to Shri
Anil Razdan, Secretary (Power) and Shri Anil Kumar, Additional Secretary and Shri Gireesh
Pradhan, Additional Secretary, Ministry of Power who provided whole hearted support and
encouragement in developing of Baseline database.
I am grateful to Shri Rakesh Nath, Chairperson, CEA and Shri V.S. Verma, Mem-
ber(Planning), CEA for enlightening us with their valuable views and guidance all along in
developing the Baseline carbon dioxide emissions.
I sincerely thank Dr A. Kaupp and Mr Jens Burgtorf of GTZ and its consultants Mr Urs
Brodmann of First Climate , Dr Axel Michaelowa of Perspectives Climate Change and Ms
Pamposh Bhat, GTZ- Climate Change Unit for providing their expert views in establishing
the baseline emissions.
Central Electricity Authority extends its grateful thanks to all the power sector utili-
ties/organizations and their officers for active co-operation and support rendered by them in
timely furnishing the requisite data to bring out this updated document.
I acknowledge with deep appreciation, the hard work and efforts put in by Shri
B.K.Sharma, Director and Shri Praveen Gupta, Deputy Director, CEA and other officers of
Conservation and Efficiency Division, CEA in compilation of data and evolving the Baseline
carbon dioxide emissions from the power sector. I also thank officers of Thermal, GO&D and
Hydro wings of CEA for their contribution in compiling the database by providing necessary
data and its validation.
All efforts have been made to project the latest data on energy generation to keep high in-
tegrity of the Baseline. Any omission in this could be due to oversight. Suggestions from the
project developers and consultants are welcome to avoid such omissions in future.
New Delhi (Amarjeet Singh)
October 2008 Chief Engineer (C&E)

VI
Message
The Kyoto Protocol’s Clean Development Mechanism is expected to result in emission re-
ductions equivalent to over 2 to 3 billion tonnes of CO2 to the end of 2012. CDM will bring in
investments and technology transfer in developing projects that reduce Greenhouse Gases.
CDM project implementers earn certified emission reduction units which are bought by coun-
tries with emission reduction commitments under the Kyoto protocol. CDM in India can lead
the way to a low carbon economy.
Under Indo-German Bi-lateral Technical Cooperation between the Governments of India and
Germany jointly implemented by GTZ together with partners Central Electricity Authority and
the Bureau of Energy Efficiency under the Ministry of Power have undertaken the task of
Carbon market development in India since 2003. We have together achieved many land-
marks one among which is “Development of the Baseline Data for CDM Projects in the
Power Sector”. This valuable tool for CDM project developers reduces transaction costs and
increases accuracy and consistency of emission reduction calculations. This latest version
also includes CO2 baseline emission factor for coal based power units as applicable to new
coal fired power generating units with supercritical steam parameters.
India was the first nation to develop CO2 baseline emission factor for power sector. It was
presented to the public as an outstanding example of a national effort to support CDM project
developers at the UNFCCC 12th Conference of Parties in Nairobi 2006. We congratulate our
partner in the initiative and its regular updation by Central Electricity Authority Officials and
Personnel as well as our international consultants for their tireless efforts and commitment to
the cause.
Jens Burgtorf Pamposh Bhat Director Director Indo German Energy Programme GTZ- Climate Change Mitigation Programme
VII
Contents
Summary .............................................................................................................................. 1
1 Background and Objective .......................................................................................... 2
2 How to Use the Database............................................................................................. 5
3 Scope of Database ....................................................................................................... 7
4 Data and Calculation Approach................................................................................... 8
4.1 Base Data............................................................................................................. 8
4.2 Annual Data.......................................................................................................... 9
4.3 Calculation of CO2 Emissions ............................................................................. 10
4.4 Adjustment for Inter-Regional and Cross-Border Electricity Transfers ................ 12
4.5 Conservativeness............................................................................................... 12
5 Results ........................................................................................................................ 13
5.1 Results for Fiscal Year 2007-08.......................................................................... 13
5.2 Developments over Time.................................................................................... 14
5.3 Changes compared to Previous Database Versions........................................... 16
6 User Examples............................................................................................................ 17
7 Baseline Emission Factor as per Methodology ACM0013 ....................................... 20
8 Updating Procedure ................................................................................................... 27
9 Further Information .................................................................................................... 27
Appendix A – Systems in India’s Regional Grids............................................................ 28
Appendix B – Assumptions for CO2 Emission Calculations........................................... 31
Appendix C – Grid Emission Factors ............................................................................... 32
Appendix D – Summary of Methodology ACM0002 / Version 07.................................... 34
Appendix E – Abbreviations ............................................................................................. 35

1
Summary
Since the emergence of the Kyoto Protocol and its Clean Development Mechanism (CDM),
energy projects lowering the carbon intensity of the electricity grid can generate additional
revenues from carbon credits. Methodologies approved by the CDM Executive Board have to
be applied to determine the resulting emission reductions, using the “baseline” CO2 emission
factor of the relevant geographical area.
In order to facilitate adoption of authentic baseline emissions data and also to ensure uni-
formity in the calculations of CO2 emission reductions by CDM project developers, Central
Electricity Authority (CEA), in cooperation with GTZ, has compiled a database containing the
necessary data on CO2 emissions for all grid-connected power stations in India.
Due to significant changes in the grid structure, the Indian electricity system is now divided
into two grids, the new Integrated Northern, Eastern, Western, and North-Eastern regional
grids (NEWNE) and the Southern Grid. This version of the database (2007-2008) therefore
starts a new series of data. In addition, the emission factors for the preceding fiscal years
(FY) 2005-06 and 2006-07 have also been back-calculated as per new definition of the grids.
CEA will continue updating the database at the end of each fiscal year, according to the new
grid structure.
Each grid covers several states. As the grids are interconnected, there is inter-state and in-
ter-regional exchange. A small power exchange also takes place with the neighbouring coun-
tries Bhutan and Nepal. For each of the two grids, the main emission factors are calculated in
accordance with the relevant CDM methodologies.
The prevailing baseline emissions based on the data for the FY 2007-08 are shown in Table
S-1. The calculations are based on generation, fuel consumption and fuel quality data ob-
tained from the power stations. Typical standard data were used only for a few stations
where information was not available from the station. Inter-Grid and cross-border electricity
transfers were also taken into account for calculating the CO2 emission baseline.
Table S-1: Weighted average emission factor, simple operating margin (OM), build margin (BM) and combined margin (CM) of all grids for FY 2007-08 (inter-Grid and cross-border electricity transfers included), in tCO2/MWh
Grid Average OM BM CM
NEWNE 0.81 1.00 0.60 0.80
Southern 0.72 0.99 0.71 0.85
India 0.79 1.00 0.63 0.81
Average is the average emission of all stations in the grid, weighted by net generation.
OM is the average emission from all stations excluding the low cost/must run sources.
BM is the average emission of the 20% (by net generation) most recent capacity addition in the grid.
CM is a weighted average of the OM and BM (here weighted 50 : 50).
The baseline emission factor which is to be used for calculating CDM Benefits by the supercritical technology
based power projects has also been calculated by Central Electricity Authority as 0.941 tCO2/MWh for the year
2007-08 in accordance with CDM Executive Board approved methodology ACM0013.
2
1 Background and Objective
Purpose of the CO2 Database
The Clean Development Mechanism (CDM) under the Kyoto Protocol to United Nations
Framework Convention on Climate Change (UNFCCC) provides an opportunity for the Indian
power sector to earn revenue through the reduction of greenhouse gas emissions (GHG),
particularly carbon dioxide (CO2). India has tremendous potential for CDM projects. Power
generation based on higher efficiency technologies such as supercritical technology, inte-
grated gasification combined cycle, and renovation and modernisation of old thermal power
plants, co-generation along with renewable energy sources are some of potential candidates
for CDM in the power sector. Energy efficiency and conservation projects also present them-
selves as eligible CDM projects, as these would also result in energy savings and displace
associated CO2 emissions which otherwise would be produced by grid-connected power sta-
tions.
CDM appears to be a promising mechanism but many implementation issues were to be
addressed like fixing of baseline etc. A need was, therefore, felt to work out an acceptable
and realistic baseline of CO2 emissions for the various regions of the country to enable the
prospective project developers to pose their projects for approval by the CDM Executive
Board. Central Electricity Authority (CEA) accordingly took up in cooperation with GTZ CDM-
India, to compile a database for all grid-connected power stations in India. The purpose of
the database is to establish authentic and consistent quantification of the CO2 emission base-
line which can be readily used by CDM project developers in the Indian power sector. This
would enhance the acceptability of Indian projects and would also expedite the clear-
ance/approval process. India is the first country in the world to have ventured to take up the
complex task of developing such an official baseline for the power sector as a whole.
The baseline emissions for the grids are given in Section 5 (Results) of this User Guide. The
complete updated CO2 Database (Microsoft Excel File) and this User Guide along with all
previous versions is available on the website of Central Electricity Authority: www.cea.nic.in.
The purpose of this User Guide is to provide a ready reference to the underlying calculations
and assumptions used in the CO2 database and to summarise the key results.
Official Status of the Database
The database is an official publication of the Government of India for the purpose of CDM
baselines. It is based on the most recent data available with the Central Electricity Authority.

3
Consistency of the Database with CDM Methodologies
Under the CDM, emission reductions must be quantified using an approved methodology.
Key examples of such methodologies include AMS-I.D and ACM0002 for grid-connected
power generation from renewable sources in small and large- scale projects, respectively.
The latest versions of all approved CDM methodologies are available at the official CDM
website, http://cdm.unfccc.int.
In October 2007, the CDM Executive Board adopted a methodological tool to facilitate the
calculation of baseline emission factors for electricity grids.1 This tool, which is referred to as
the Grid Tool in this user guide, is set to become the main reference for CDM methodologies
involving baseline emission factors for power grids. In particular, ACM0002 was subse-
quently revised and in its latest Version 07 refers to the Grid Tool with respect to the meth-
odological details of the baseline emission factor calculation.
This version is designed to be consistent with version 1.1 of the Tool to calculate
the emission factor for an electricity system published by CDM Executive Board. .. In
comparison with the previous versions of the database, this required only minor
modifications: one with respect to the IPCC default emission factors used (see Section 4.3)
and the other in the calculation of CO2 emissions from imported electricity (see Section 4.4).
Installed Capacity
As a result of the impressive growth attained by the Indian Power Sector, the installed capac-
ity has grown from mere 1,713 MW in 1950 to 144130.17 MW as on 31.03.2008, consisting
of 91906.84 MW Thermal, 35908.76 MW Hydro and 4120 MW Nuclear. Sector-wise details
of installed capacity are shown in Table 1.
Table 1: Sector- wise installed capacity (MW) as on 31.03.2008.
Thermal Nuclear Renew. Total Sector Hydro
Coal Gas Diesel Total
State 26086.76 42047.50 3834.22 604.61 46486.33 0.00 2200.04 74773.13
Central 8592.00 29010.00 6638.99 0.00 35648.99 4120.00 0.00 48360.99
Private 1230.00 4991.38 4183.00 597.14 9771.52 0.00 9994.53 20996.05
All India 35908.76 76048.88 14656.21 1201.75 91906.84 4120.00 12194.57 144130.17
Note: These capacities are not identical with those listed in the Excel database, because the database excludes
renewable , small diesel and steam units but includes the units which are closed during recent years as database
contain data from 2005-06..
1 Tool to calculate the emission factor for an electricity system (Version 1.0), adopted by EB 35 (Annex 12) . See
http://cdm.unfccc.int

4
It is evident from Table 1 that the installed capacity is predominantly coal based and there-
fore, is a major source of carbon dioxide emissions in India. Hence, there exists scope for
reducing the CO2 emissions in the country by way of fuel substitution, increased use of re-
newable energy sources, and also by improving the thermal efficiency of power generation.
Indian Grids
Historically, the Indian power system was divided into five independent regional grids,
namely Northern, Eastern, Western, Southern, and North-Eastern. Each grid covered several
states (see Table 2). Since August 2006, however, all regional grids except the South-
ern Grid have been integrated and are operating in synchronous mode, i.e. at same
frequency. Consequently, the Northern, Eastern, Western and North-Eastern grids will
be treated as a single grid and is being named as NEWNE grid in this document from
FY 2007-08 onwards for the purpose of this CO2 Baseline Database. The Southern grid
has also been planned to be synchronously operated with rest of all Indian Grid by
early 12th Plan (2012-2017). Presently Southern grid is connected with Western and
Eastern grid through HVDC link and HVDC back to back systems.
Power generation and supply within the regional grid is managed by Regional Load Dispatch
Centre (RLDC). The Regional Power Committees (RPCs) provide a common platform for
discussion and solution to the regional problems relating to the grid. Each state meet their
demand with their own generation facilities and also with allocation from power plants owned
by the central sector such as NTPC and NHPC etc. Specific quotas are allocated to each
state from the central sector power plants. Depending on the demand and generation, there
are electricity exports and imports between states in the regional grid. Moreover, there are
also electricity transfers between regional grids, and small exchanges in the form of cross-
border imports and exports (e.g. from Bhutan).
Table 2: Geographical scope of the two electricity grids.
NEWNE Grid Southern Grid
Northern Eastern Western North-Eastern Southern
Chandigarh
Delhi
Haryana
Himachal Pradesh
Jammu & Kashmir
Punjab
Rajasthan
Uttar Pradesh
Uttarakhand
Bihar
Jharkhand
Orissa
West Bengal
Sikkim
Andaman-Nicobar
Chhattisgarh
Gujarat
Daman & Diu
Dadar & Nagar Haveli
Madhya Pradesh
Maharashtra
Goa
Arunachal Pradesh
Assam
Manipur
Meghalaya
Mizoram
Nagaland
Tripura
Andhra Pradesh
Karnataka
Kerala
Tamil Nadu
Pondicherry
Lakshadweep

5
2 How to Use the Database
Structure of the Database
Emission reductions from CDM projects in the power sector are calculated based on the net
electricity generated by the project, and the difference between the emission factors (in
tCO2/MWh) of the baseline and the project activity. The baseline emission factor reflects the
carbon intensity of the displaced amount of grid electricity. This baseline emission factor can
be derived from the data provided in the CO2 Database.
Specifically, the database contains the following elements:
• Worksheet “Data” provides the net generation and the absolute and specific CO2 emis-
sions of each grid-connected power station (see Section 4 for exceptions). It also indi-
cates which stations and units have been included in the operating margin and build
margin, respectively.
• Worksheet “Results” provides the most commonly used aggregate emission factors.
These are calculated from the station data in accordance with the most recent Grid
Tool.2 The emission factors are explained in more detail in the next section.
• Worksheet “Abbreviations” explains the abbreviations used in the “Data” worksheet.
• Worksheet “Assumptions” shows the assumptions that were used for the calculation of
the CO2 emissions at station and unit level, to the extent required.
• Worksheet “Transfers” shows the inter-Grid and cross-border power transfers.
Different Types of Emission Factors
The CDM methodologies which have been approved to date by the CDM Executive Board
distinguish a range of different emission factors. In the Indian context, the following four are
most relevant, and were therefore calculated for each regional grid based on the underlying
station data:
Weighted average:
The weighted average emission factor describes the average CO2 emitted per unit of electric-
ity generated in the grid. It is calculated by dividing the absolute CO2 emissions of all power
stations in the region by the region’s total net generation. Net generation from so-called low-
cost/must-run sources (hydro and nuclear) is included in the denominator.
Simple operating margin (OM):
The operating margin describes the average CO2 intensity of the existing stations in the grid
which are most likely to reduce their output if a CDM project supplies electricity to the grid (or
reduces consumption of grid electricity). “Simple” denotes one out of four possible variants
2 Tool to calculate the emission factor for an electricity system (Version 1.1), adopted by EB 35 (Annex 12) and subsequently
revised to Version 1.1. See http://cdm.unfccc.int

6
listed in the Grid Tool for calculating the operating margin.3 The simple operating margin is
the weighted average emissions rate of all generation sources in the region except so-called
low-cost or must-run sources. In India, hydro and nuclear stations qualify as low-cost / must-
run sources and are excluded. The operating margin, therefore, can be calculated by dividing
the region’s total CO2 emissions by the net generation of all thermal stations. In other words,
it represents the weighted average emissions rate of all thermal stations in the regional grid.
Build margin (BM):
The build margin reflects the average CO2 intensity of newly built power stations that will be
(partially) replaced by a CDM project. In accordance with the Grid Tool, the build margin is
calculated in this database as the average emissions intensity of the 20% most recent capac-
ity additions in the grid based on net generation. Depending on the region, the build margin
covers units commissioned in the last five to ten years.
Combined margin (CM):
The combined margin is a weighted average of the simple operating margin and the build
margin. By default, both margins have equal weights (50%). However, CDM project develop-
ers may chose to argue for different weights. In particular, for intermittent and non-
dispatchable generation types such as wind and solar photovoltaic, the Grid Tool allows to
weigh the operating margin and build margin at 75% and 25%, respectively. However, the
combined margins shown in the database are calculated based on equal weights.
In line with the Grid Tool, if a station is registered as a CDM activity, it is excluded from the
build margin but not from the operating margin.4
3 The two variants “Simple adjusted operating margin” and “Dispatch data analysis operating margin” cannot currently be
applied in India due to lack of necessary data.
4 See EB 35 (Annex 12), pp.5 and 13.

7
3 Scope of Database
The database includes all grid-connected power stations having an installed capacity above
3 MW in case of hydro and above 10 MW for other plant types. The data covers power sta-
tions of both public utilities and independent power producers (IPPs).
Coal
54.2%
Diesel
0.9%Gas
8.8%
Lignite
2.9%
Naphta
0.4%
Oil
1.2%
Nuclear
3.1%
Hydro
27.5%
Figure 1: Breakdown of generation capacity covered by the database. The total corresponds to 133,584 MW as on 31.03.2008.
The following power stations are currently not accounted for in the database:
• Stations or units installed in Andaman and Nicobar Islands and Lakshadweep.
• Captive power stations:
As on 31 March 2008, the installed capacity from captive stations was 24,680.70 MW.
The generation of these stations in 2007-08 was 85431GWh, equalling 12.12% of total
generation in India.
• Non-conventional renewable energy stations:
These include power generation from wind, biomass, solar photovoltaic, and hydro below
3 MW capacity. The installed, grid-connected capacity of these sources was approx.
12194.57 MW as on 31. 03. 2008.5
• Small decentralised generation sets.
5 Ministry of New and Renewable Energy

8
4 Data and Calculation Approach
This section gives an overview on the base data, annual data as well as the approaches
used to calculate station-level and unit-level CO2 emissions.
4.1 Base Data
The following base data parameters were collected for all the stations listed in the CO2 data-
base:
• SNo:
The Station Numbers start at 1 in each regional grid. The numbering has been introduced
for unambiguous referral to each station and to allow for the insertion of additional sta-
tions in a region without having to change the numbers of other regions. All units of a sta-
tion have the same station number. Numbers may change in future database versions.
• Station Name
Name of the power station
• Unit Number:
The units of a station are numbered serially starting with 1. Stations are attributed with
unit number 0 for the purpose of calculations.
• Commissioning Date:
The commissioning date is provided for each unit. Commissioning dates are important for
the determination of the build margin.
• Capacity:
Capacity data is based on declared rated capacities in MW for each unit as of 31st March
2008.
• Grid:
Grid to which the station is connected to. The table below gives the codes for the different
grids used in the database:
Table 3: Code for grids used in the database
Name of the Grid Code
NEWNE Grid (covering former Northern, Eastern, Western and North-Eastern regions) NEWNE
Southern Grid SR
• State:
State where the power station is located.
• Sector:
This denotes whether the station is operated by the central sector, the state authorities,
or the private sector.
• System:
A list of the systems including abbreviations and full names is provided in Appendix A.

9
• Type:
Indicates the type of the station, viz. thermal, nuclear, hydro.
• Fuel:
Fuel 1 and Fuel 2 indicates the main fuels used for power generation at each station. For
example, in coal based stations, Coal is indicated as Fuel 1 and Oil as Fuel 2.
4.2 Annual Data
The annual data columns in the database provide the following: net generation in GWh of the
station, absolute carbon dioxide emissions in metric tonnes, and specific carbon dioxide
emissions in tCO2/MWh, for the three FY 2005-06 to 2007-08. In addition, there are columns
to indicate whether the station is included in the operating margin in the respective year, and
an additional column indicating which units are included in the build margin. If a unit is part of
a registered CDM activity, it is excluded from the build margin, and the CDM registration
number is indicated in the respective column.
CEA has compiled the CO2 Database based upon generation, fuel consumption and fuel
gross calorific value (GCV) data furnished by each power station. In cases where the station
could not provide reliable data for all the relevant parameters, assumptions were made as
described below. Further details on the assumptions made are provided in Appendix B.
Assumptions at Station Level
At the station level, the following assumptions were made where the relevant data could not
be provided by a station:
Net generation:
For hydro stations, only gross generation was available, but not net generation data. There-
fore, the CEA standard value for auxiliary power consumption in hydro units (0.5%) was ap-
plied to derive the net generation from the gross generation data reported by the stations.
Likewise, CEA standard values for auxiliary power consumption had to be applied for some
of the gas- and diesel-fired thermal stations.
Gross Calorific Value (GCV):
Default values were used for some thermal stations where station-specific GCVs were not
available.
Assumptions at Unit Level
At unit level, the following assumptions were made for those units falling into the build margin
(i.e. the most recently built units comprising 20% of net generation):
Gross generation:
For some stations, gross generation data were not available at unit level. Therefore the plant
load factor of the respective station was used to derive the gross generation of the units. For

10
units commissioned after the start of the relevant fiscal year, the gross generation was fur-
ther adjusted pro rata the number of days since commissioning.
Net generation:
Net generation data is generally not measured at unit level. Two distinct approaches were
applied to estimate net generation.
1. The auxiliary consumption (in % of gross generation) of the unit was assumed to be equal
to that of the respective stations in the following cases:
i. All units of a station fall into the build margin; or
ii. All units of a station have the same installed capacity; or
iii. The units in the station have different capacities but do not differ with respect to the
applicable standard auxiliary consumption.
2. In all other cases, standard values for auxiliary consumption adopted by CEA were ap-
plied.
Fuel consumption and GCV:
Fuel consumption and GCV are generally not measured at unit level. Therefore, the specific
CO2 emissions of the relevant units were directly calculated based on heat rates. See Sec-
tion 4.3 for details.
4.3 Calculation of CO2 Emissions
Calculation Approach – Station Level
CO2 emissions of thermal stations were calculated using the formula below:
∑=
×××=
2
1
,,2 )(i
iiyiyiy OxidEFGCVFuelConstationAbsCO ( 1 )
Where:
AbsCO2,y Absolute CO2 emission of the station in the given fiscal year ‘y’
FuelConi,y Amount of fuel of type i consumed in the fiscal year ‘y’
GCVi,y Gross calorific value of the fuel i in the fiscal year ‘y’
EFi CO2 emission factor of the fuel i based on GCV
Oxidi Oxidation factor of the fuel i
The emission and oxidation factors used in the CO2 Database are provided in Appendix B.

11
The emission factors for coal and lignite were based on the values provided in India’s Initial
National Communication under the UNFCCC (Ministry of Environment & Forests, 2004). The
emission factor for coal is supported by the results of an analysis of approx. 120 coal sam-
ples collected from different Indian coal fields. Since the values in the National Communica-
tion are based on the NCV (Net Calorific Value), they were converted to GCV basis using a
formula also furnished in the National Communication. For all other fuels, default emission
factors were derived from the IPCC 2006 Guidelines6. In line with the Grid Tool, the low end
values of the 95% confidence intervals indicated by IPCC were used.7 The IPCC default fac-
tors were converted to GCV basis using IEA default conversion factors.
The oxidation factor for coal and lignite were derived from an analysis performed with data
on the unburnt carbon content in the ash from various Indian coal-fired power stations. The
value of 98% is consistent with the default value provided in the IPCC 1996 Guidelines.8 For
all other fuels, default values provided in the more recent IPCC 2006 Guidelines were used.
Specific CO2 emissions of stations (SpecCO2(station)y) were computed by dividing the abso-
lute emissions (AbsCO2(station)y) estimated above by the station’s net generation (Net-
Gen(station)y).
y
y
ystationNetGen
stationAbsCOstationSpecCO
)(
)()(
2
2 = ( 2 )
Calculation Approach – Unit Level
Unit-level CO2 emissions were only calculated for units falling in the build margin.
The absolute CO2 emissions of thermal units (AbsCO2(unit)y) were derived by multiplying the
specific emissions (SpecCO2(unit)y) with the net generation of each unit (NetGen(unit)y),
where net generation was obtained as described in Section 4.2:
yyy unitNetGenunitSpecCOunitAbsCO )()()( 22 ×= ( 3 )
A unit was assumed to have the same specific emissions as the corresponding station in the
following three cases:
i. If all units of a station fall into the build margin;
ii. If all units of a station have the same installed capacity;
6 2006 IPCC Guidelines for National Greenhouse Gas Inventories, Volume 2: Energy, Table 1.4
7 In accordance with the Tool to calculate the emission factor for an electricity system, Version 1.1
8 IPCC 1996 Revised Guidelines for National Greenhouse Gas Inventories, Volume 3 (Reference Manual), p.1.13

12
iii. If the default specific emissions for the respective station type is higher than the cor-
responding station’s specific emissions, and the concerned unit is capacity-wise
among the largest of the station.
For over 90% of all thermal units in the build margin, one of these cases applied. In the re-
maining cases, the specific emissions of the units were derived from conservative standard
heat rate values, defined as the design heat rate plus 5% (see Appendix B).
4.4 Adjustment for Inter-Grid and Cross-Border Electricity Transfers
The weighted average emission factors and operating margins of each Grid were adjusted
for inter-Grid and cross-border electricity imports and exports, in line with the Grid Tool:
• The relevant amounts of electricity imported and exported are listed in the database
worksheet “Transfers”;
• The CO2 emissions associated with these imports were quantified based on the simple
operating margin of the exporting grid.9;
4.5 Conservativeness
The need to ensure conservativeness of calculations in situations of uncertainty is a funda-
mental principle in the CDM. Assumptions are conservative if they tend to reduce the number
of emission reductions being credited to a CDM project activity. The following approaches
and assumptions contribute to the conservativeness of the database:
• The quality of station-level data was ensured through extensive plausibility testing and
interaction with the station operators.
• In cases of data gaps at station level, standard data from CEA was used. For example,
standard auxiliary power consumption was assumed for a number of gas-fired stations.
Comparison with monitored values shows that these standard values are rather conser-
vative, i.e. they lead to a somewhat lower heat rate and hence lower emissions than ob-
served in many stations.
• Where required, the emission factors of thermal units were also derived from standard
CEA values (design heat rate plus 5%). Again, these values are conservative (i.e. rela-
tively low) compared to the heat rates observed in practice. See Section 4.3 for details
on the build margin calculation.
• The fuel emission factors and oxidation factors used are generally consistent with IPCC
defaults and relevant EB guidance. For coal, the emission factor provided in India’s Ini-
tial National Communication was used (95.8 t CO2/TJ on NCV basis), being somewhat
lower than the IPCC default for sub-bituminous coal (96.1 t CO2/TJ).10
9 This corresponds to Approach c) listed in the Grid Tool (Version 1.1).
10 2006 IPCC Guidelines for National Greenhouse Gas Inventories, Volume 2: Energy, Table 2.2

13
5 Results
Worksheet “Results” in the database provides the net generation and CO2 emissions data
and the resulting emission factors for the two grids in the fiscal years 2005-06 to 2007-08.
The emission factors are also reproduced in Appendix C. The values are rounded off at two
decimals. See database file for additional decimals.
5.1 Results for Fiscal Year 2007-08
Table 4 indicates the development of total emissions by grid over the last three years cov-
ered by the database (values for FY 2005-06 and 2006-2007 have been recalculated accord-
ing to new grid configuration and takes care of adjusted IPCC-based fuel emission factors to
account for uncertainty in line with EB 35 Annex 12 ).
Table 4: Total emissions from the power sector by region for the FY 2005-06 to 2007-08
Absolute Emissions Total ( Million tCO2)
Grid 2005-06 2006-07 2007-08
NEWNE 368.11 385.64 406.56
Southern 101.55 109.02 113.63
India 469.67 494.66 520.19
Table 5 shows the emission factors for FY 2007-08 excluding inter-grid and cross-border
power transfers, whereas Table 6 shows the emission factors for the same year including
these power transfers.
Table 5: Weighted average emission factor, simple operating margin (OM), build mar-gin (BM) and combined margin (CM) of grids for FY 2007-08 (not adjusted for inter-grid and cross-country electricity transfers), in tCO2/MWh
Grid Average OM BM CM
NEWNE 0.82 1.01 0.60 0.80
Southern 0.72 0.99 0.71 0.85
India 0.80 1.01 0.63 0.82
Table 6: Weighted average emission factor, simple operating margin (OM), build margin (BM) and combined margin (CM) of grids for FY 2007-08 (adjusted for inter-grid and cross-country electricity transfers), in tCO2/MWh
Grid Average OM BM CM
NEWNE 0.81 1.00 0.60 0.80
Southern 0.72 0.99 0.71 0.85
India 0.79 1.00 0.63 0.81

14
The observed variations in the emission factors between the different grids originate from the
differing availability and use of coal, gas and hydro resources. Stations fired with other fossil
fuels such as diesel as well as nuclear stations play a less significant role.
A comparison of Table 5 and Table 6 shows that electricity transfers between grids did not
have a significant influence on the emission factors in 2007-08.
Table 7 shows the weighted average specific emissions for fossil fuel-fired power stations in
the two grids. Inter-grid variations arise chiefly from differences in station age and build (in-
stalled capacity and conversion technology).
Table 7: Weighted average specific emissions for fossil fuel-fired stations in FY 2007-08, in tCO2/MWh..
Weighted average specific emissions fuel wise in 2007-08 (tCO2/MWh)
Grid Coal Diesel Gas Lignite Naphtha Oil
NEWNE 1.10 0.63 0.47 1.37 0.44 0.77
Southern 1.01 0.62 0.47 1.41 0.60 0.64
India 1.08 0.62 0.47 1.40 0.45 0.74
Note: Stations for which assumptions had to be made are included in this analysis (see Section 4 for details).
5.2 Developments over Time
Figure 2 illustrates the development of the import-adjusted operating margins over the period
from FY 2005-06 to FY 2007-08. The variations between the years are generally quite small
(see Appendix C for values before import adjustment).
0.00
0.20
0.40
0.60
0.80
1.00
1.20
NEWNE South India
Grid
tCO
2/M
Wh
2005-06
2006-07
2007-08
Figure 2: Development of the operating margin (adjusted for electricity transfers) for India’s grids over the period 2005-06 to 2007-08.

15
Figure 3 shows the build margins for the three FY 2005-06 to 2007-08. Slight changes com-
pared to the previous year are observed for the NEWNE Grid, which are reflected in the total
values for India, while the Southern Grid is practically stable. Changes in the NEWNE Grid
can be explained by variations in the shares of coal, hydro and other generation types
among the units falling into the build margin, as shown in Figure 4. It should be noted that
due to the definition stipulated by the CDM rules, the build margin can react sensitively to a
few large units being added to the grid in a given year. Consequently, the changes observed
here need not necessarily point to longer-term trends.
0.00
0.20
0.40
0.60
0.80
1.00
1.20
NEWNE South India
Grid
tCO
2/M
Wh
2005-06
2006-07
2007-08
Figure 3: Development of the build margins for India’s grids over the period 2005-06 to 2007-08
0%
20%
40%
60%
80%
100%
NEW
NE 0
5-06
NEW
NE 0
6-07
NEW
NE 0
7-08
SR 0
5-06
SR 0
6-07
SR 0
7-08
Indi
a 05
-06
Indi
a 06
-07
Indi
a 07
-08
Hydro
Nuclear
Oil
Naphta
Lignite
Gas
Diesel
Coal
Figure 4: Breakdown of the build margin (comparison of FY 2005-06 to 2007-08) by station and fuel type for grids (shares based on net generation)

16
Figure 5 shows the trends in the import-adjusted combined margins in the period 2005-06 to
2007-08. As a result of the recent decrease in the build margin of the NEWNE Grid, a de-
creasing trend is observed also for the combined margin at the level of the NEWNE Grid and
nation-wide.
0.00
0.20
0.40
0.60
0.80
1.00
1.20
NEWNE South India
Grid
tCO
2/M
Wh
2005-06
2006-07
2007-08
Figure 5: Development of the combined margin (adjusted for electricity transfers) for India’s grids over the period 2005-06 to 2007-08.
5.3 Changes compared to Previous Database Versions
In comparison with the previous version of the Database (Version 3.0), this version includes
the following methodological changes:
– Change from five to two grids, as described in Section 1;
– Accounting for uncertainty in IPCC default emission factors for fuels, by using low
end of 95% confidence intervals (see Section 4.3).
– Baseline Emission Factor as per Methodology ACM0013 included as separate chap-
ter

17
6 User Examples
This section provides two illustrative examples of how the CO2 Database can be applied. The
examples are based on hypothetical renewable energy projects that differ in size and supply
different grids.
Project A is a grid-connected 5 MW small hydropower station located in the State of Assam
(formerly North-Eastern Region, since FY 2007-2008 NEWNE Grid). The station will be
commissioned in 2009. Annual net generation is projected at approx. 17’500 MWh.
• The project qualifies as a small-scale CDM activity since its capacity is below the 15 MW
threshold. Hence it will use the latest version of CDM methodology AMS-I.D for grid-
connected power generation from renewable energy sources.
• Methodology AMS-I.D gives two options for determining the baseline emission factor:
Either the weighted average emissions, or the combined margin of the grid. In this exam-
ple, it is assumed that the promoters choose the weighted average option. In addition, it
is assumed that the promoters choose to adjust the weighted average emission factor for
electricity imports, despite the fact that this is not mandatory under AMS-I.D.
• In the PDD, the expected emission reductions achieved by the hydro station are pro-
jected based on the expected annual generation, and the import-adjusted weighted aver-
age emission factor for the NEWNE Grid in the most recent year for which data is avail-
able (2007-08). The corresponding value is 0.81 t CO2/MWh. Hence the absolute emis-
sion reductions are projected at 0.81 * 17’500 = 14’175 t CO2/yr. The emission reductions
are equal to the baseline emissions, since the project does not result in greenhouse gas
emissions of its own.
• In accordance with AMS-I.D, the promoters will determine the actual baseline emission
factor ex post. The actual emission reductions will then be calculated in each year of the
crediting period based on the observed net generation and the weighted average emis-
sion factor for the respective year.11 The latter would be published annually by CEA.
Project B is a 100 MW grid-connected wind farm located in the State of Tamil Nadu (South-
ern Grid). The project will be commissioned in 2009. Average net supplies to the grid are
projected at 312,500 MWh per year.
• The project exceeds the 15 MW threshold and thus qualifies as a large-scale CDM activ-
ity. Hence it is eligible to use the latest version of methodology ACM0002 for grid-
connected power generation from renewable energy sources.
• Under ACM0002, the combined margin approach is mandatory. In addition, inter-grid
power transfers (imports and exports) must be taken into account.
11 The emission factor of the previous year may be used instead. See request for clarification AM_CLA_0038
(http://cdm.unfccc.int/methodologies/PAmethodologies/Clarifications/index.html).

18
• In contrast to the first example, the promoters decide to fix the baseline emission factor
ex ante. That is, the baseline emission factor is determined based on the most recent
data available, and remains fixed for the duration of the crediting period. The actual
emission reductions will be calculated in each year based on the observed net generation
and the pre-defined baseline emission factor.
• For this ex ante-option, the Grid Tool referred to in the methodology ACM000212 requires
that the operating margin is calculated as the average of the three most recent years
(here 2005-06 to 2007-08). The operating margin to be applied thus works out to 1.00 t
CO2/MWh.
• Since wind is an intermittent energy source, the promoter is allowed to assign a weight of
75% to the operating margin, and 25% to the build margin. The resulting combined mar-
gin is 0.93 t CO2/MWh (75% x 1.00 + 25% x 0.71 for the FY 2007-08). This value is used
for projecting the emission reductions in the PDD as well as for calculating the actual
emission reductions.
The two CDM project activities are summarised in Table 8 below.
12 Tool to calculate the emission factor for an electricity system (Version 01.1), adopted by EB 35 (Annex 12). and subsequently
revised to Version 1.1. See http://cdm.unfccc.int

19
Table 8: Illustration on how to use the CO2 Database for calculating the emission re-ductions of CDM projects
Project A Project B
Project Info
Type: Hydro station Wind park
Size: 5 MW (small-scale according
to CDM criteria)
100 MW (large-scale accord-
ing to CDM criteria)
Projected Generation (net): 17’500 MWh /yr 312’500 MWh/yr
Commissioning year: 2009 2009
Year of CDM registration: 2008 2008
Grid : NEWNE Southern
CDM methodology: AMS-I.D / Version 13 ACM0002 / Version 07
Baseline Emission Factor Calculation
Calculation method: Weighted average Combined margin
Data vintage for projection of
emission reductions:
2007-08 (most recent available
at time of PDD validation)
For OM: 2005-06, 2006-07,
2007-08 (most recent 3 years
available at time of PDD vali-
dation)
For BM: 2007-08
Data vintage for verification of
emission reductions:
Actual year of generation, i.e.
2008-09, 2009-10 etc. (emis-
sion factor fixed ex post)
Same as for projection
(emission factor fixed ex ante)
Accounting of imports: Not mandatory, but done Mandatory
Weights for combined margin: Operating margin: 50%
Build margin: 50%
Operating margin: 75%
Build margin: 25%
(default for intermittent
sources)
Emission Reduction Calculations
Values in tCO2/MWh:
0.81 Weighted average 1.00 Operating margin
0.71 Build margin
0.93 Combined margin
Projected emission reductions: 14’125 t CO2 per year 290’625 t CO2 per year
Actual emission reductions: Monitored net generation x
monitored weighted average
Monitored net generation x
fixed combined margin
20
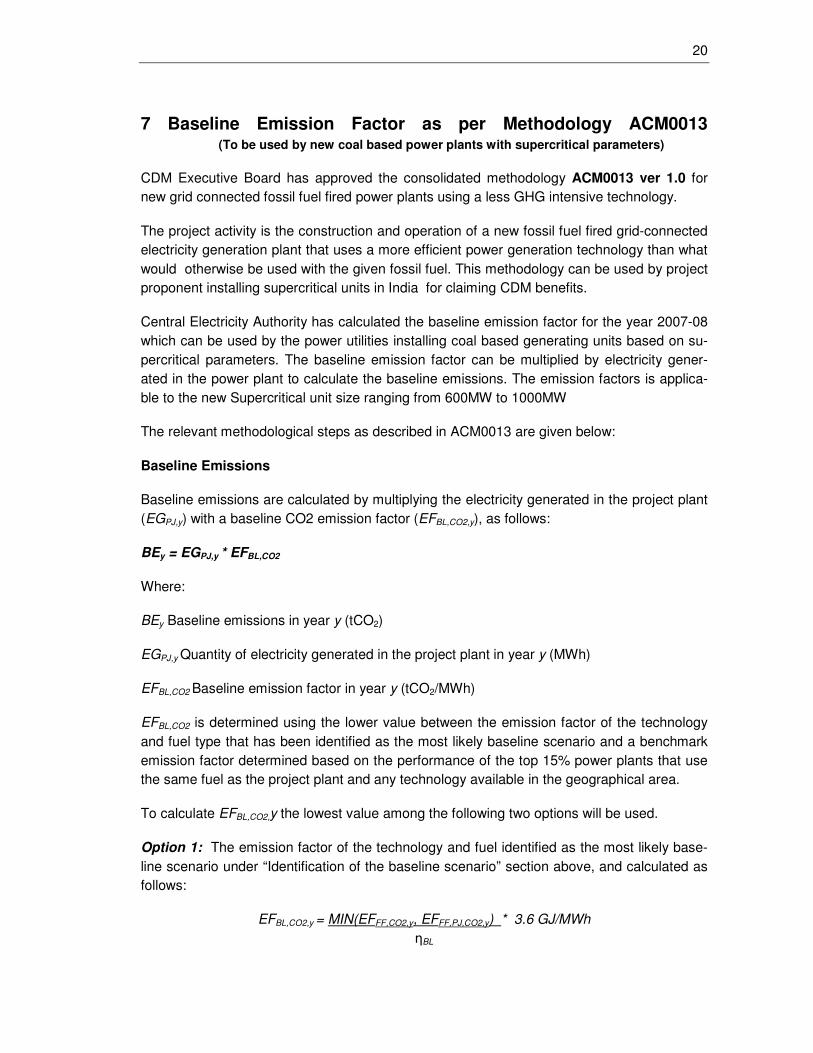
7 Baseline Emission Factor as per Methodology ACM0013 (To be used by new coal based power plants with supercritical parameters)
CDM Executive Board has approved the consolidated methodology ACM0013 ver 1.0 for
new grid connected fossil fuel fired power plants using a less GHG intensive technology.
The project activity is the construction and operation of a new fossil fuel fired grid-connected
electricity generation plant that uses a more efficient power generation technology than what
would otherwise be used with the given fossil fuel. This methodology can be used by project
proponent installing supercritical units in India for claiming CDM benefits.
Central Electricity Authority has calculated the baseline emission factor for the year 2007-08
which can be used by the power utilities installing coal based generating units based on su-
percritical parameters. The baseline emission factor can be multiplied by electricity gener-
ated in the power plant to calculate the baseline emissions. The emission factors is applica-
ble to the new Supercritical unit size ranging from 600MW to 1000MW
The relevant methodological steps as described in ACM0013 are given below:
Baseline Emissions
Baseline emissions are calculated by multiplying the electricity generated in the project plant
(EGPJ,y) with a baseline CO2 emission factor (EFBL,CO2,y), as follows:
BEy = EGPJ,y * EFBL,CO2
Where:
BEy Baseline emissions in year y (tCO2)
EGPJ,y Quantity of electricity generated in the project plant in year y (MWh)
EFBL,CO2 Baseline emission factor in year y (tCO2/MWh)
EFBL,CO2 is determined using the lower value between the emission factor of the technology
and fuel type that has been identified as the most likely baseline scenario and a benchmark
emission factor determined based on the performance of the top 15% power plants that use
the same fuel as the project plant and any technology available in the geographical area.
To calculate EFBL,CO2,y the lowest value among the following two options will be used.
Option 1: The emission factor of the technology and fuel identified as the most likely base-
line scenario under “Identification of the baseline scenario” section above, and calculated as
follows:
EFBL,CO2,y = MIN(EFFF,CO2,y, EFFF,PJ,CO2,y) * 3.6 GJ/MWh
ηBL

21
Where:
EFBL,CO2,y Baseline emission factor in year y (tCO2/MWh)
EFFF,CO2,y baseline emission factor of the baseline fossil fuel type that has been identified as
the most likely baseline scenario (tCO2 / Mass or volume unit)
EFFF,PJ,CO2,y Average CO2 emission factor of the fossil fuel type used in the project plant in
year y (tCO2 / Mass or volume unit)
ηBL is the Energy efficiency of the power generation technology that has been identified as
the most likely baseline scenario
Calculation of baseline efficiency ηBL
For the proposed project activity, the baseline fossil fuel type that has been identified as the most
likely baseline scenario is coal and the fossil fuel to be used in the proposed project activity is
also coal. To calculate η BL , it is assumed that baseline plant would be 500 MW sub critical
power plant based on sub Bituminous coal or imported coal.
Taking normative Gross Heat Rate ( CERC norms) = 2450 kcal/kWh
Auxiliary Power Consumption as per CERC = 7%
i.e. Net Heat rate = 2450 = 2635 kcal/kWh
0.93
Net η BL = 860 = 32.63%
2635
Case (i) Project is using the same coal as baseline coal i.e. (sub Bituminous coal)
Emission factor as per Initial National Communication
EF FF,BL,CO2,y = 90.6 g CO2/MJ
(Emission factor as per Initial National Communication based on GCV basis with
oxidation factor of 0.98)
EF FF,PJ,CO2,Y = 90.6 g CO2/MJ (project is using the same coal as baseline coal)
Using the formula for option 1 above
= Min (90.6, 90.6) X 3.6 GJ
32.63% MWh
= 0.99 t CO2 / MWh

22
Case (ii) Project is using the same coal as baseline coal i.e. (sub Bituminous coal)
Emission factor as per IPCC
EF FF,BL,CO2,y = 90.9 g CO2/MJ
(Emission factors i.e. 96.1 gCO2/MJ on NCV or 90.9 g CO2/MJ on GCV basis with oxida-
tion factor of 0.98)
EF FF,PJ,CO2,Y = 90.9 g CO2/MJ (project is using the same coal as baseline coal)
Using the formula for option 1 above
= Min (90.9,90.9) X 3.6 g CO2/MWh
32.63
= 1.02 t CO2/MWh
Case (iii) Project is using other bituminous coal i.e. imported coal and baseline coal is
sub bituminous.
Considering Project emission factor based on IPCC for other bituminous coal ie imported
coal as 94.6 g CO2/MJ on NCV basis or 89.5 gCO2/MJ on GCV basis with oxidation factor of
0.98
Considering National communication emission factor of 90.6 gCO2/MJ on GCV basis for sub
bituminous baseline coal.
EF FF,BL,CO2,y = 90.6 g CO2/MJ
EF FF,PJ,CO2,Y = 89.5 g CO2/MJ
= Min (90.6,89.5) X 3.6 g CO2/MWh
32.63
= 0.987 tCO2/MWh
Case (iv) Project is using other bituminous coal i.e. imported coal and baseline coal is
sub bituminous coal
Considering both Emission factor ie for imported coal and baseline coal from IPCC default
values
EF FF,BL,CO2,y = 90.9 g CO2/MJ
EF FF,PJ,CO2,Y = 89.5 g CO2/MJ

23
= Min ( 90.9, 89.5) g CO2 /MWh
32.63
= 0.987 t CO2 / MWh
So Minimum emission factor ( Case i to iv) calculated for option 1 is 0.987 t CO2/MWh
Option 2: The average emissions intensity of all power plants j, corresponding to the power
plants whose performance is among the top 15 % of their category, as follows:
EFBL,CO2,y = FCj,x * NCVj,x * EFCO2,j,x
EGj,x
Where:
EFBL,CO2,y Baseline emission factor in year y (tCO2/MWh)
FCj,x Amount of fuel consumed by power plant j in year x (Mass or volume
unit)
NCVj,x Net calorific value of the fossil fuel type consumed by power plant j in year x
(GJ / Mass or volume unit)
EFCO2,j,x CO2 emission factor of the fossil fuel type consumed by power plant j in year x
(tCO2 / Mass or volume unit)
EGj,x Net electricity generated and delivered to the grid by power plant j in year x
X Most recent year prior to the start of the project activity for which data is available
J Top 15% performing power plants (excluding cogeneration plants and including
Power plants registered as CDM project activities), as identified below, among all power
plants in a defined geographical area (India) that have a similar size, are operated at similar
load (i.e. at base load) and use the same fuel type (coal) as the project activity
For determination of the top 15% performer power plants j, the following step-wise approach
is used:
Step 1: Definition of similar plants to the project activity
The sample group of similar power plants should consist of all power plants (except for
cogeneration power plants):
• Those use the same fossil fuel type as the project activity, where fuel types are defined in
the following categories:
-Coal

24
-Oils (e.g. diesel, kerosene, residual oil)
-Natural gas
• Those have been constructed in the previous five years;
• Those have a comparable size to the project activity, defined as the range from 50% to
150% of the rated capacity of the project plant;
• Those are operated in the same load category, i.e. at peak load (defined as a load factor of
less than 3,000 hours per year) or base load (defined as a load factor of more than 3,000
hours per year) as the project activity; and
• Those have operated (supplied electricity to the grid) in the year prior to the start of the pro-
ject activity.
The sample group of plants identified consists of coal based sub-critical power plants that
have a capacity between 330MW to 990MW, have been constructed in last 5 years, operate
at base load and have supplied electricity to the grid before start of the proposed project ac-
tivity.
Step 2: Definition of the geographical area
As per the methodology ACM0013, Version 01, the geographical area to identify similar
power plants is chosen in a manner that the total number of power plants “N” in the sample
group comprises at least 10 plants. As a default, the grid to which the project plant will be
connected should be used. As the number of similar plants, as defined in Step 1, within the
Western regional grid boundary is less than 10, the geographical area is extended to India.
The number of similar plants is now greater than 10.
Step 3: Identification of the sample group
Identify all power plants n that are to be included in the sample group. Determine the total
number “N” of all identified power plants that use the same fuel as the project plant and any
technology available within the geographical area, as defined in Step 2 above.
The sample group should also include all power plants within the geographical area regis-
tered as CDM project activities, which meet the criteria defined in Step 1 above.
The proposed supercritical units that are proposed to be installed are of the range 660 MW to
800 MW. Therefore according to conditions for selection of sample group given in step 1
above ( 50% to 150% criteria), unit sizes above 330 MW upto 990 MW are selected. The
sample group of plants satisfying the above mentioned criteria are 14 units of 500MW. The
list of the units in sample group are given below:

25
Table 9: Details of the thermal units selected under sample Group
SNo NAME UNIT_NO SIZE in MW
1 TALCHER STPS 3 500
2 TALCHER STPS 4 500
3 TALCHER STPS 5 500
4 TALCHER STPS 6 500
5 R_GUNDEM STPS 7 500
6 VINDH_CHAL STPS 10 500
7 VINDH_CHAL STPS 9 500
8 RIHAND 3 500
9 RIHAND 4 500
10 KAHALGAON 6 500
11 BELLARY TPS 1 500
12 SANJAY GANDHI 5 500
13 SIPAT STPS 1 500
14 KAHALGAON 5 500
Step 4: Determination of the plant efficiencies
Calculate the operational efficiency of each power plant n identified in the previous step. The
most recent one-year data available is used. Hence the data for the year 2007-08 was used
in calculations of plant efficiencies.
The operational efficiency of each power plant n in the sample group is calculated as follows:
ηn,x = EGn,x * 860
FCn,x * GCVn,x
Where:
EGn,x :Net electricity generated and delivered to the grid by the power plant n in the year x
(MWh)
FCn,x : Quantity of fuel consumed in the power plant n in year x (Mass or volume unit)

26
GCVn,x : Gross calorific value of the fuel type fired in power plant n in year x (kcal / mass or
volume unit). Calorific value of coal is reported as Gross Calorific Value in kcal/kg by the
power plants in India.
860 : is a conversion factor ( 1 kwh = 860 kcal)
n : are all power plants in the defined geographical area that have a similar size, are oper-
ated at similar load and use the same fuel types as the project activity
x : Most recent year prior to the start of the project activity for which data are available
Step 5: Identification of the top 15% performer plants j
Sort the sample group of N plants from the power plants with the highest to the lowest opera-
tional efficiency. Identify the top 15% performer plants j as the plants with the 1st to Jth high-
est operational efficiency, where the J (the total number of plants j) is calculated as the prod-
uct of N (the total number of plants n identified in step 3) and 15%, rounded down if it is
decimal.4 If the generation of all identified plants j (the top 15% performers) is less than 15%
of the total generation of all plants n (the whole sample group), then the number of plants j
included in the top 15% performer group should be enlarged until the group represents at
least 15% of total generation of all plants n.
Accordingly, two units of 500MW i.e. Talchar STPS unit 3 and 4 are identified as 15% top
performing units. These units also cover more than the 15% of the total net generation of all
plants selected in the sample Group. The operating data has been obtained from all the
identified unit from the respective power utility.
The emission factor calculated in accordance with option 2 works out to be 0.941
tCO2/MWh.
As per the methodology ACM0013, minimum of option 1 and option 2 is to be taken as base-
line emission factor
i.e Minimum ( 0.987, 0.941)
Therefore, the baseline emission factor which is to be used for calculating CDM Bene-
fits for supercritical projects has been calculated as 0.941 tCO2/MWh for the year 2007-
08.

27
7 Updating Procedure
The CO2 Database will be updated annually by CEA and made available on its website:
www.cea.nic.in . Previous versions will be archived by CEA and the main changes relative to
previous database versions will be documented.
8 Further Information
For any further information, contact by email:
Chief Engineer(C&E) Ms. Pamposh Bhat
Central Electricity Authority Director, Climate Change
Sewa Bhawan S-35,1st Floor,Panchsheel Park
R. K. Puram, New Delhi-110066 New Delhi-110017
Email: [email protected] Email: [email protected]
Telefax no.: 91-11-40610030/31/32

28
Appendix A – Systems in India’s Grids
In alphabetical order
Abbreviation Full name
ABAN ABAN Power Company
APGCL Assam Power Generation Corporation Limited
APGENCO Andhra Pradesh Power Generation Co Limited
ASEB Assam State Electricity Board
BBMB Bhakra Beas Management Board
BSEB Bihar State Electricity Board
CESC Calcutta Electric Supply Company Limited
CSEB Chattisgarh State Electricity Board
DPL Durgapur projects Limited
DVC Damodar Valley Corporation
GIPCL Gujarat Industries Power Company Ltd
GMDCL Gujarat Mineral Development Corporation Limited
GMR Energ GMR Energy
GPEC Gujarat Paguthan Energy Corporation Pvt. Limited
GSECL Gujarat State Electricity Corporation Limited
GTE Corp GTE Corporation
GVK Ind. GVK Power & Infrastructure Limited
HEGL HEG Limited
HPGCL Haryana Power Generation Corporation Limited
HPSEB Himachal Pradesh State Electricity Board
INDSIL Indsil Electrosmelt Ltd
IPPGCL Indrapratha Power Generation Co Ltd
JINDAL JSW Energy Limited
JKEB Jammu & Kashmir Electricity Board

29
Continuation
Abbreviation Full name
JPHPL Jai Prakash Hydro Power Limited
JSEB Jharkand State Electricity Board
KPCL Karnataka Power Corporation Limited
KSEB Kerala State Electricity Board
LVS Power LVS Power Limited
MaduraiP Madurai Power Corporation Limited
MAHAGENCO Maharastra State Power Generation Company Limited
MAPS Madras Atomic Power Station
MALANA Malana Power Corporation Limited
MPDC Manipur Power Development Corporation
MEGEB Meghalaya State Electricity Board
MPPCL Madhya Pradesh Power Generating Co. Ltd.
NAPS Narora Atomic Power Station
NCTPP National Capital Thermal Power Plant
NEEPCO North Eastern Electric Power Corporation Ltd
NHDC Narmada Hydro Electric Development Corporation
NHPC National Hydro Electric Corporation
NLC Neyvelli Lignite Corporation Ltd
NPC Nuclear Power Corporation of India Ltd.
NTPC NTPC Ltd
OHPC Orissa Hydro Power Corporation
OPGC Orissa Power Generation Corporation
PPCL Pondichery Power Corporation Limited

30
Continuation
Abbreviation Full name
PPNPG PPN Power Generating Company Pvt. Limited
PSEB Punjab State Electricity Board
RAPS Rajasthan Atomic Power Station
RATANAGIRI Ratnagiri Gas & power Pvt Ltd
REL Reliance Energy Ltd
RPG RP Goenka Group
RRVUNL Rajasthan Rajya Vidyut Utpadan Nigam
Samalpatti Samalpatti Power Company Limited
SJVNL Sutluj Jal Vidyut Nigam Ltd
SPECT. IND Spectrum Power Generation Limited
SSVNL Sardar Sorovar Vidyut Nigam Limited
STPS Super Thermal Power Station
Tata MAH Tata Power Company Limited
Tata PCL Tata Power Company Limited
THDC Tehri Hydroelectric Development Corporation
TNEB Tamilnadu Electricity Board
TVNL Tenughat Vidyut Nigam Limited
UPHPC Uttar Pradesh Hydro Power Corporation Limited
UPRVUNL Uttar Pradesh Rajya Vidyut Utpadan Nigam
VVNL Visvesarya Vidyut Nigam Ltd
WBPDC West Bengal Power Development Corporation Ltd
WBSEB West Bengal State Electricity Board

31
Appendix B – Assumptions for CO2 Emission Calculations
Fuel Emission Factors (EF) (Source: Coal/Lignite - Initial National Communication, Gas/Oil/Diesel/Naphta - IPCC 2006, Corex - own assumption)
Unit Coal Lignite Gas Oil Diesel Naphta Corex
EF based on NCV gCO2 /MJ 95.8 106.2 54.3 75.5 72.6 69.3 0.0
Delta GCV NCV % 3.6% 3.6% 10% 5% 5% 5% n/a
EF based on GCV gCO2 /MJ 92.5 102.5 49.4 71.9 69.1 66.0 0.0
Oxidation Factor - 0.98 0.98 1.00 1.00 1.00 1.00 n/a
Fuel Emission Factor gCO2 /MJ 90.6 100.5 49.4 71.9 69.1 66.0 0.0
n/a = not applicable (i.e. no assumptions were needed)
Assumptions at Station Level (only where data was not provided by station)
Unit Coal Lignite Gas-CC Gas-OC Oil Diesel-Eng Diesel-OC Naphta Hydro Nuclear
Auxiliary Power Consumption % 8.0 10.0 3.0 1.0 3.5 3.5 1.0 3.5 0.5 10.5
Gross Heat Rate kcal /kWh (gross) 2'500 2'713 2'013 3150 2'117 1'975 3'213 2'117 n/a n/a
Net Heat Rate kcal /kWh (net) 2'717 3'014 2'075 3'182 2'193 2'047 3'330 2'193 n/a n/a
Specific Oil Consumption ml /kWh (gross) 2.0 3.0 n/a n/a n/a n/a n/a n/a n/a n/a
GCV kcal /kg (or m3) 3'755 n/a 8'800 n/a 10'100 10'500 10'500 11'300 n/a n/a
Density t /1,000 lt n/a n/a n/a n/a 0.95 0.83 0.83 0.70 n/a n/a
Specific CO2 emissions tCO2 /MWh 1.04 1.28 0.43 0.66 0.66 0.59 0.96 0.61 n/a n/a
n/a = not applicable (i.e. no assumptions were needed)
Assumptions at Unit Level (by capacity; only for units in the BM, where data was not provided by station)
Coal Unit 67.5 MW 120 MW 200-250 MW 500 MW
Gross Heat Rate kcal /kWh 2'750 2'500 2'500 2'425
Auxiliary Power Consumption % 12.0 9.0 9.0 7.5
Net Heat Rate kcal /kWh 3'125 2'747 2'747 2'622
Net Efficiency % 28% 31% 31% 33%
Specific Oil Consumption ml /kWh 2.0 2.0 2.0 2.0
Specific CO2 Emissions tCO2 /MWh 1.19 1.05 1.05 1.00
Lignite Unit 75 MW 125 MW 210/250 MW
Gross Heat Rate kcal /kWh 2'750 2'560 2'713
Auxiliary Power Consumption % 12.0 12.0 10.0
Net Heat Rate kcal /kWh 3'125 2'909 3'014
Net Efficiency % 28% 30% 29%
Specific Oil Consumption ml /kWh 3.0 3.0 3.0
Specific CO2 Emissions tCO2 /MWh 1.32 1.23 1.28
Gas Unit 0-49.9 MW 50-99.9 MW >100 MW
Gross Heat Rate kcal /kWh 1'950 1'910 1'970
Auxiliary Power Consumption % 3.0 3.0 3.0
Net Heat Rate kcal /kWh 2'010 1'969 2'031
Net Efficiency % 43% 44% 42%
Specific CO2 Emissions tCO2 /MWh 0.42 0.41 0.42
Diesel Unit 0.1-1 MW 1-3 MW 3-10 MW >10 MW
Gross Heat Rate kcal /kWh 2'350 2'250 2'100 1'975
Auxiliary Power Consumption % 3.5 3.5 3.5 3.5
Net Heat Rate kcal /kWh 2'435 2'332 2'176 2'047
Specific CO2 Emissions tCO2 /MWh 0.70 0.67 0.63 0.59
Naphta Unit All sizes
Increment to Gas Heat Rate % 2%
Gross Heat Rate kcal /kWh 2'117
Auxiliary Power Consumption % 3.5
Net Heat Rate kcal /kWh 2'193
Specific CO2 Emissions tCO2 /MWh 0.61
Combined Margin Unit
Weight OM % 50%
Weight BM % 50%
Conversion Factors Unit
Energy kJ /kcal 4.1868
MJ /kWh 3.6
Oil
Specific Emission gCO2 /ml 2.89

32
Appendix C – Grid Emission Factors
Note: Values are rounded off at two decimals here. See Database (Excel File, Worksheet
"Results") for additional decimals.
Table A: Values for all grids for FY 2005-06 to 2007-08, excluding inter-grid and cross-
border electricity transfers.
Weighted Average Emission Rate (tCO2/MWh) (excl. Imports)
Grid 2005-06 2006-07 2007-08
NEWNE 0.84 0.83 0.82
Southern 0.73 0.72 0.72
India 0.82 0.80 0.80
Simple Operating Margin (tCO2/MWh) (excl. Imports)
Grid 2005-06 2006-07 2007-08
NEWNE 1.02 1.02 1.01
Southern 1.01 1.00 0.99
India 1.02 1.01 1.01
Build Margin (tCO2/MWh) (excl. Imports)
Grid 2005-06 2006-07 2007-08
NEWNE 0.67 0.63 0.60
Southern 0.71 0.70 0.71
India 0.68 0.65 0.63
Combined Margin (tCO2/MWh) (excl. Imports)
Grid 2005-06 2006-07 2007-08
NEWNE 0.85 0.82 0.80
Southern 0.86 0.85 0.85
India 0.85 0.83 0.82

33
Table B: Values for all grids for FY 2007-08, including inter-grid and cross-border elec-
tricity transfers.
Weighted Average Emission Rate (tCO2/MWh) (incl. Imports)
Grid 2005-06 2006-07 2007-08
NEWNE 0.84 0.82 0.81 *
Southern 0.73 0.72 0.72 *
India 0.81 0.80 0.79
Simple Operating Margin (tCO2/MWh) (incl. Imports)
Grid 2005-06 2006-07 2007-08
NEWNE 1.02 1.01 1.00 *
Southern 1.01 1.00 0.99 *
India 1.02 1.01 1.00
Build Margin (tCO2/MWh) (not adjusted for imports)
Grid 2005-06 2006-07 2007-08
NEWNE 0.67 0.63 0.60
Southern 0.71 0.70 0.71
India 0.68 0.65 0.63
Combined Margin in tCO2/MWh (incl. Imports)
Grid 2005-06 2006-07 2007-08
NEWNE 0.85 0.82 0.80
Southern 0.86 0.85 0.85
India 0.85 0.83 0.81
* = Using approach (c) on p. 4 of "Tool to Calculate the Emission Factor for an Electricity System", Ver. 1.1

34
Appendix D – Summary of Methodology ACM0002 / Version 07
Download ACM0002 at: http://cdm.unfccc.int/methodologies/PAmethodologies/approved.html
ACM0002 is a consolidated CDM methodology for grid-connected power generation from
renewable energy sources. It covers grid-connected renewable power generation project
activities that involve electricity capacity additions. Examples of eligible project types include
run-of-river hydro power plants, and hydro power projects with existing reservoirs where the
volume of the reservoir is not increased; wind energy; geothermal energy; solar energy; and
wave and tidal energy.
The methodology requires the calculation of the baseline emission factor following the com-
bined margin (CM) approach. The combined margin consists of a weighted average of:
• Operating margin (OM);
• Build margin (BM).
The relative weights used to determine the combined margin are by default the same, i.e.
50%. Alternative weights can be used for intermittent power sources.
There are four options to calculate the operating margin, depending on local conditions:
• Simple operating margin. This is the preferred approach for India.
• The other three approaches are: (i) simple adjusted operating margin; (ii) dispatch data analysis; and (iii) average operating margin.
The build margin is the generation-weighted average emission factor of the most recent
power plants, consisting of the larger of (i) the five power plants that have been built most
recently; or (ii) the capacity additions that represent 20% of the system generation that have
been built most recently. In India, the latter approach generally yields the larger sample and
hence must be followed. CDM projects must be excluded from the build margin, as long as
the build margin does not contain generation units older than 10 years.
The operating margin must be adjusted for electricity transfers (imports) from connected
electricity systems (other states/regions, other countries) to the project electricity system.
Generally, no such adjustments are required for the build margin.
The actual emission reductions achieved by a CDM project are calculated based on the
monitored electricity production in each year, and the combined margin (baseline emission
factor). The combined margin is initially calculated from the most recent data available at the
time of PDD submission. It can then either remain fixed for the duration of the project’s cred-
iting period (ex-ante approach), or be updated annually (ex-post approach). The two ap-
proaches have different requirements in terms of data vintage.
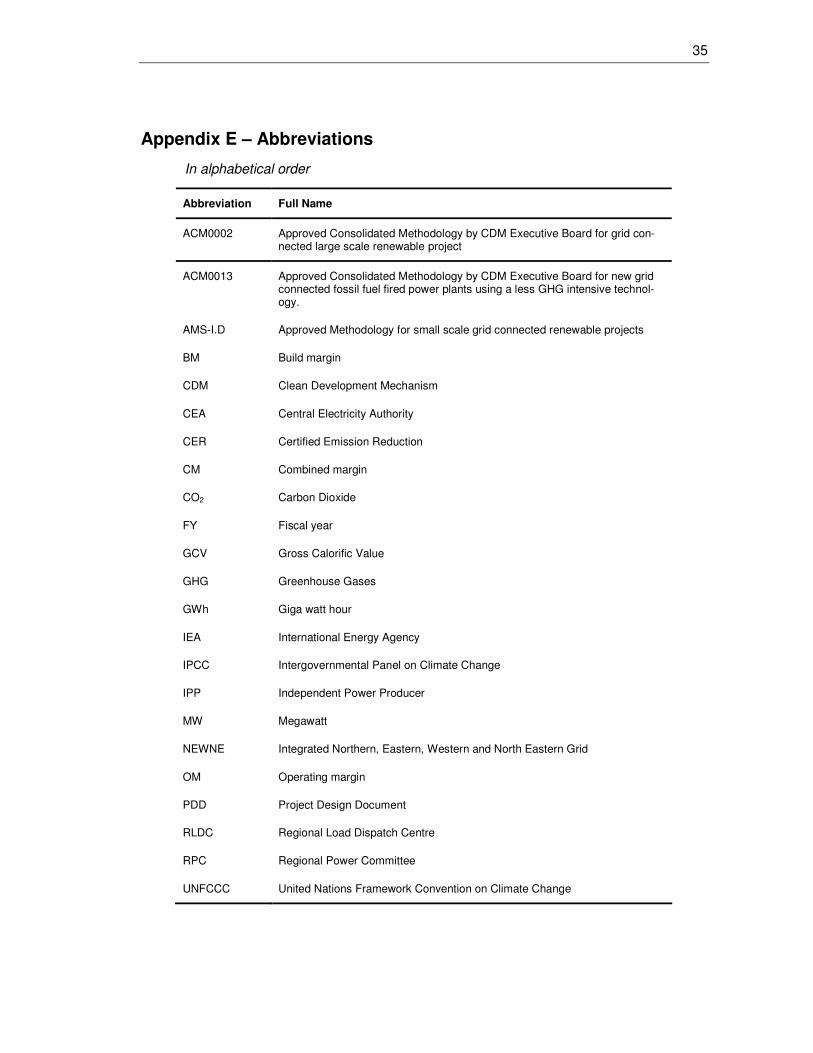
35
Appendix E – Abbreviations
In alphabetical order
Abbreviation Full Name
ACM0002 Approved Consolidated Methodology by CDM Executive Board for grid con-nected large scale renewable project
ACM0013 Approved Consolidated Methodology by CDM Executive Board for new grid connected fossil fuel fired power plants using a less GHG intensive technol-ogy.
AMS-I.D Approved Methodology for small scale grid connected renewable projects
BM Build margin
CDM Clean Development Mechanism
CEA Central Electricity Authority
CER Certified Emission Reduction
CM Combined margin
CO2 Carbon Dioxide
FY Fiscal year
GCV Gross Calorific Value
GHG Greenhouse Gases
GWh Giga watt hour
IEA International Energy Agency
IPCC Intergovernmental Panel on Climate Change
IPP Independent Power Producer
MW Megawatt
NEWNE Integrated Northern, Eastern, Western and North Eastern Grid
OM Operating margin
PDD Project Design Document
RLDC Regional Load Dispatch Centre
RPC Regional Power Committee
UNFCCC United Nations Framework Convention on Climate Change