CO Alarm Conformance Report for Phase I FY 2012
74
CARBON MONOXIDE ALARM CONFORMANCE TESTING TO UL 2034: STANDARD FOR SAFETY FOR CARBON MONOXIDE ALARMS PHASE I FY 2012 TEST RESULTS March, 2014 Prepared By Matthew J. Brookman Directorate for Laboratory Sciences United States Consumer Product Safety Commission 5 Research Place Rockville, MD 20850 This report was prepared by the CPSC staff, and it has not been reviewed or approved by, and may not necessarily reflect the views of, the Commission.
Transcript of CO Alarm Conformance Report for Phase I FY 2012
CARBON MONOXIDE ALARM CONFORMANCE TESTING TO
UL 2034: STANDARD FOR SAFETY FOR CARBON MONOXIDE ALARMS
PHASE I FY 2012 TEST RESULTS
March, 2014
Prepared By Matthew J. Brookman
Directorate for Laboratory Sciences United States Consumer Product Safety Commission
5 Research Place Rockville, MD 20850
This report was prepared by the CPSC staff, and it has not been reviewed or approved by, and may not necessarily reflect the views of, the Commission.

2
This page intentionally left blank.

3
Abstract In 2004, the U.S. Consumer Product Safety Commission (CPSC, Commission) recommended changes to UL 2034, Standard for Safety for Carbon Monoxide Alarms, to require end-of-life signaling, provisions for rapid buildup of carbon monoxide (CO) levels, more realistic environmental test conditions, and display accuracy (UL 2034, 2008). All retail UL-certified CO alarms manufactured after August 2009 are required to incorporate these new changes. A two-phase carbon monoxide alarm conformance testing activity began in FY 2012 to evaluate the performance of currently available retail CO alarms relative to CO sensitivity and environmental condition requirements in UL 2034. In FY 2012, the project focused on Section 39 Sensitivity Test, Section 46.1 Variable Ambient Temperature Test, and Section 36.8 Concentration Display Accuracy. CPSC staff chose CO alarms representing brands and models available on the current retail market. The samples performed well when tested for sensitivity, low and high temperatures, and display accuracy. However, during testing, staff noted that the test chamber was not able to maintain the low relative humidity required for the low temperature test specified by Section 46.1. The data resulting from the tests performed for this section do not accurately represent the performance of the alarms under the exact provisions of the standard and was not included in this report. These tests were repeated with the appropriate conditions in FY 20131.
1 http://www.cpsc.gov/en/Media/Documents/Research--Statistics/Technical-Reports/Home-Maintenance-and-Construction/Portable-Generators/CO-Alarms/Carbon-Monoxide-Alarm-Conformance-Testing-to-UL-2034-2013-Phase-II-Report/.
4
Contents Abstract ........................................................................................................................................... 3 Introduction and Background ......................................................................................................... 5 Test Samples ................................................................................................................................... 7 Experimental Setup ......................................................................................................................... 8 Experimental Procedure .................................................................................................................. 9 Results ........................................................................................................................................... 11
UL 2034 Section 39 Sensitivity Test ........................................................................................ 11 UL 2034 Section 46 Variable Ambient Temperature Test ....................................................... 28 UL 2034 Section 36.8 Concentration Display Accuracy Test .................................................. 35
Previous Test Results .................................................................................................................... 40 Discussion ..................................................................................................................................... 41 Recommendations ......................................................................................................................... 44 References ..................................................................................................................................... 46 Acknowledgements ....................................................................................................................... 47 Appendix ....................................................................................................................................... 48
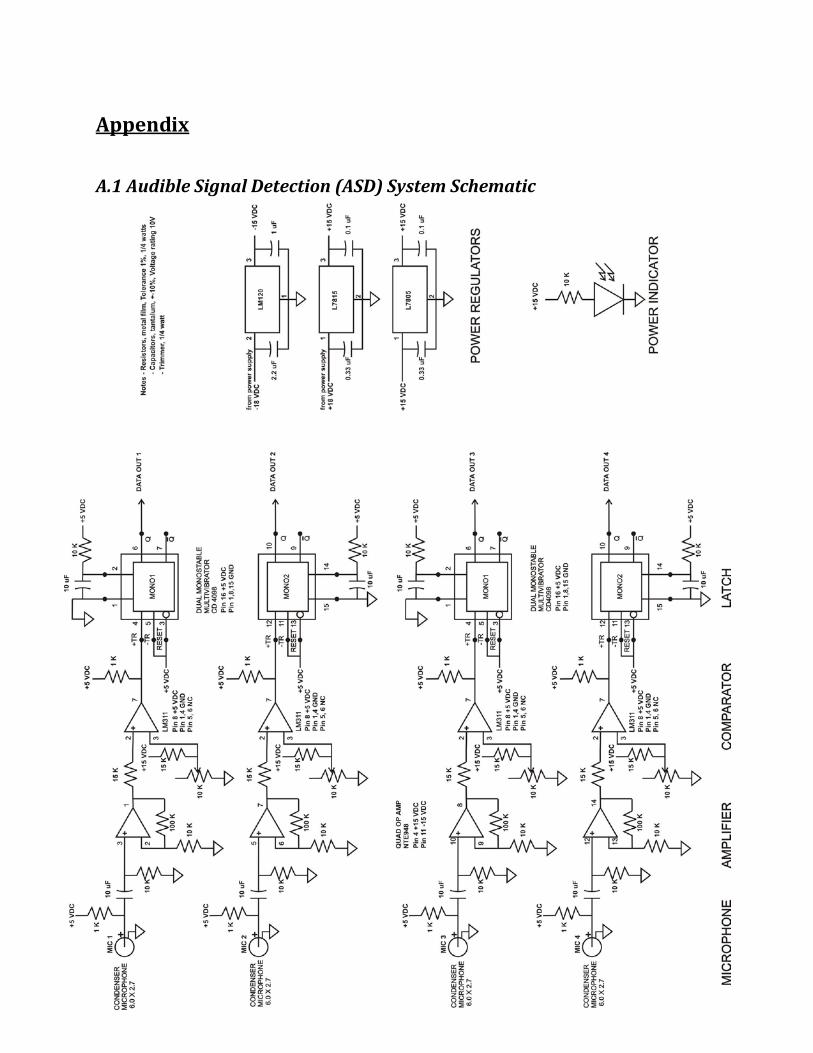
A.1 Audible Signal Detection (ASD) System Schematic ......................................................... 48 A.2 Test Procedures .................................................................................................................. 49 A.3 Effects of Short Refresh Times Between Sensitivity Test Concentrations ........................ 56

5
Introduction and Background
General Overview Residential fuel-burning appliances, engine-driven tools, and automobiles can be potential sources of hazardous elevated carbon monoxide levels. Properly vented and operated fuel-burning appliances can be safe. However, if fuel-burning appliances are not properly installed, used or maintained, the carbon monoxide from these products can accumulate to unsafe levels. In addition, automobiles and engine-driven tools, such as portable generators, which may cause exhaust buildup in a residence, shed, or garage, can create unsafe concentrations of carbon monoxide. In 2009, there were an estimated 146 unintentional non-fire carbon monoxide (CO) poisoning deaths associated with consumer products under the jurisdiction of the U.S. Consumer Product Safety Commission (CPSC, Commission). The estimated annual average from 2007 to 2009 was 169 deaths, with approximately 79 percent of these deaths occurring in a home. These home locations include a residence, such as a detached house, townhouse, apartment, or mobile home, and external structures to a residence, such as detached garages or sheds (Hnatov, 2012). In 2011, staff reviewed the national estimates of households using CO alarms from two housing market data studies. From these studies, staff estimates that the percent of U.S. homes using CO alarms ranges from 36.4 percent (U.S. Census Bureau, 2011) to 50.0 percent (Jarden, 2009). CPSC recommends installation of a CO alarm in the hallway near the bedrooms in each separate sleeping area in every home. These CO alarms should be battery-operated or plug-in with battery backup. The CO alarms should be certified to the requirements of the most recent Underwriters Laboratories Inc. (UL), International Approval Services (IAS), or Canadian Standards Association (CSA) standard for CO alarms. Carbon monoxide is called “the invisible killer” because of the colorless and odorless characteristics of the gas. Early onset of CO poisoning has symptoms similar to the flu, including headache, fatigue, shortness of breath, nausea, and dizziness. High-level CO poisoning progressively results in more severe symptoms that include mental confusion, vomiting, loss of muscular coordination, loss of consciousness, and death. Symptom severity is related to both the CO level and the duration of exposure. In situations where CO levels rise steeply and suddenly, causing rapid, severe oxygen deprivation (hypoxia), or even virtual anoxia (total oxygen deprivation), it is possible for exposed individuals to experience extremely quick onset of confusion, loss of muscular coordination, loss of consciousness, and death without having first experienced milder CO poisoning symptoms associated with low or slowly rising CO-induced hypoxia. CPSC’s public safety information2 on the hazards of CO states that the most important factor for reducing the risk of CO is the proper installation, operation, and maintenance of fuel-burning
2 http://www.cpsc.gov/Safety-Education/Safety-Education-Centers/Carbon-Monoxide-Information-Center/.

6
appliances in the home. CPSC recommends that portable generators be operated outdoors and as far away as possible from open doors, windows, and vents, to prevent CO exhaust from coming indoors. At a minimum, an operating generator should be placed 20 feet from potential entryways3.
Project Goal In 2004, the CPSC successfully recommended changes to UL 2034, Standard for Safety for Carbon Monoxide Alarms, to require end-of-life signaling, provisions regarding performance of the alarm during rapid buildup of CO levels, more realistic test conditions, and display accuracy (UL 2034, 2008). All retail UL-certified CO alarms manufactured after August 2009 are required to incorporate all of these new changes. This project evaluated current alarm performance relative to sensitivity requirements and environmental conditions specified in the 2008 edition of UL 2034. CPSC staff may recommend changes or additions to the UL standard, based on the test results and analysis of the test procedures. The Carbon Monoxide Alarm Conformance Testing (COACT) project began in FY 2012, to evaluate the performance of currently available retail CO alarms relative to CO sensitivity and environmental conditions. Fiscal year 2012 testing focused on the basic sensitivity tests in various specified environmental conditions in the 2008 edition of UL 2034 to determine how CO alarms manufactured after August 2009 are performing in comparison to the alarms previously tested by CPSC in FY 2006.
3 U.S. Department of Health and Human Services, Center for Disease Control and Prevention. http://www.cdc.gov/co/pdfs/generators.pdf

7
Test Samples CPSC staff collected six models of CO alarms currently available in the retail market. Three manufacturers, two models from each manufacturer, and 17 alarms of each model (or a total of 102 alarms) were collected from one retail source. The number of alarms collected was based on previous “out-of-the-box” testing performed by the Gas Technology Institute (GTI), which determined that within their sample lot, approximately 30 percent of alarms malfunctioned out of the box (Clifford, P.K., Siu, D.J., 1998). From each manufacturer, a model with a digital display and a model that was DC-powered were chosen. The digital display units are AC-powered, plug-in with battery backup. The alarms were manufactured after the effective date of the 2008 edition of UL 2034. Table 1 below provides a description of the alarm specifications.
Table 1. CO Alarm Samples Sample
Nos. Manufacture Date
Sensor Digital Display Power A1-A17 Sept 2011 Electrochemical Yes AC plug-in B1-B17 Jul 2011−Dec 2011 Electrochemical No Battery C1-C17 Apr 2011 Electrochemical Yes AC plug-in D1-D17 Mar 2011 Electrochemical No Battery E1-E17 Jan 2012 Semiconductor Yes AC plug-in F1-F17 Apr 2011 Biomimetic No Battery

8
Experimental Setup The CO alarms were tested inside CPSC’s CO alarm testing environmental chamber (Cincinnati Sub-Zero model Z-32 plus), located in room 154 at the CPSC’s National Product Testing and Evaluation Center (NPTEC) in Rockville, MD. The interior volume of the chamber is 0.91 m3 (32 ft3), and the walls are constructed of stainless steel. The test chamber has both temperature control and humidity control. The door on the test chamber is equipped with a glass window, permitting visual observations of each sample during testing. The test chamber was modified to allow for the injection of CO into the test chamber and the removal of mixed gas for analysis and chamber evacuation. Two mass flow controllers (Alicat Scientific, model 500 SCCM-D and model 20 SCCM-D) are used to control the injection rate of pure CO into the chamber volume. Gas samples are continually withdrawn from the chamber through a sample line located within the test chamber. Outside of the test chamber, a pump conveys the mixed gas sample to a nondispersive infrared (NDIR) CO analyzer (Rosemount, model NGA 2000). Before analysis, any water vapor in the gas sample is removed by using a Drierite column and subsequent filters. The CO concentration versus time data are recorded using a data acquisition system, which consists of a personal computer, data acquisition interface hardware, and data acquisition software (OPTO 22 Snap PAC, PAC Display Runtime 9.3). The CO concentration inside the test chamber was recorded every 10 seconds. In addition to collecting data, the data acquisition system controlled the injection rate of CO into the test chamber to maintain the required set points. The response time of the CO alarms was logged using a sound detection system developed by CPSC staff with LabVIEW software. The Audible Signal Detection (ASD) system is used to detect the audible signal emitting from the alarm during normal activation and trouble conditions. The system is capable of differentiating between different signals from one individual alarm due to a high sampling rate in the LabVIEW program. The system also filters out ambient noise and signals from other alarms, such that each alarm is connected to its own independent channel. The ASD schematic is provided in the Appendix. Power for the CO alarms was provided by batteries or by power strips inside the chamber. To deactivate the alarms remotely, a relay system was installed inside the chamber with a switch outside the chamber to disconnect the battery power or battery backup power. The AC power systems were deactivated through the chamber control system. All alarms could be deactivated and reactivated simultaneously without opening the chamber.

9
Experimental Procedure The tests performed in this project are based on the procedures detailed in UL 2034, Standard for Safety for Carbon Monoxide Alarms (UL2034, 2008). The table below lists the tests performed as part of this project phase. Table 2. Project tests Test # Specifications Description
1 Section 39 Sensitivity Test
To determine the capability of a sample of CO alarms currently available on the consumer market to operate as intended of signaling performance when tested for sensitivity at ambient conditions.
2 Section 46.1 Variable Ambient Temperature Test
To determine the capability of a sample of CO alarms currently available on the consumer market to operate as intended of signaling performance when tested for sensitivity at conditions of 32 °F, 15 +5 % relative humidity and 120 °F, 40 +10 % relative humidity.
3 Section 36.8 Concentration
Display Accuracy Test
To determine the capability of a sample of CO alarms with concentration displays currently available on the consumer market to provide an accurate reading of carbon monoxide concentrations at various levels.
Prior to testing, all samples were conditioned for a minimum of 48 hours at 73.4 ± 5 °F and 50 ± 20 % relative humidity (RH) per the requirements of UL 2034. Electrical power was not supplied to the units during conditioning and all batteries were removed. All samples were stored in covered bins during conditioning to minimize any potential contamination. A data log of temperature and humidity in the conditioning area was maintained. The selection of test samples for each test was based on the requirements of UL 2034. Some tests require new, unused alarms; whereas, other tests do not specify this requirement. To begin testing, the test chamber was turned on and set to the desired conditions. The system was permitted to stabilize while the analyzers were calibrated. In general, the analyzers were set to the appropriate concentration range, then zeroed with nitrogen, and finally spanned with a primary standard gas mixture. The analyzers were then purged, the sample pump was activated, and the flow was adjusted to 1.5 standard liters per minute (slpm). After the chamber reached a steady state with the set points of temperature and humidity, the alarms were installed in the chamber. Installation of the alarms includes plugging in all AC leads, installing new batteries into all alarms, testing the alarms for proper function, placing the activation sensor over the audible signaling device, and evenly distributing the alarms throughout the chamber. Once all alarms were installed properly, the chamber was closed, and the ASD system was tested. Each alarm was triggered into alarm mode using the test feature while the data acquisition system recorded the audible signal. Each ASD channel was tested to ensure a secure and reliable

10
detection signal. If an unreliable signal was noted, the microphone lead for the ASD would be replaced, and any additional issues would be repaired immediately. After all of the alarms were installed, gas analyzer calibrations completed, and the ASD was tested and operational, CPSC staff sealed the chamber. The temperature and humidity levels were restabilized, and the alarms were subjected to the specified conditions for a predetermined amount of time to achieve equilibrium with the environment. UL 2034 specifies the environmental conditions required for each test. Upon completion of the equilibration period, the data acquisition (DAQ) systems were reset, and the CO injection system was primed. The mass flow controllers then injected CO into the chamber to achieve the desired concentration within the target time period. The ASD system monitored alarm activation and recorded each signal on an independent data channel. Most CO concentration adjustments were performed by the control program, but on occasion, CPSC staff needed to make manual adjustments to achieve the target concentration within three minutes. The computer system would then take control and stabilize the concentration at the required set point. After the test was completed, the chamber was purged until the gas analyzers indicated CO concentrations less than 1 ppm and the alarms were permitted to reset while being powered. If the alarm required a manual reset with a front panel button, this action was performed after the alarm stopped any audible signal production.
11
Results
UL 2034 Section 39 Sensitivity Test
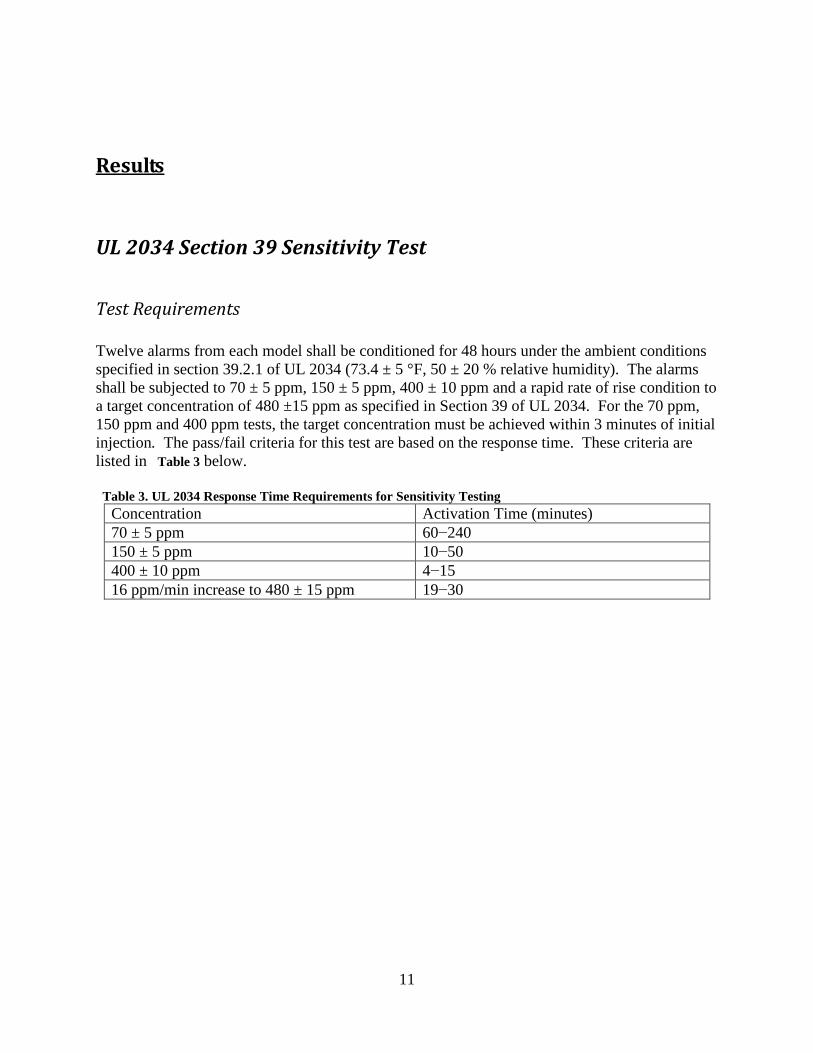
Test Requirements Twelve alarms from each model shall be conditioned for 48 hours under the ambient conditions specified in section 39.2.1 of UL 2034 (73.4 ± 5 °F, 50 ± 20 % relative humidity). The alarms shall be subjected to 70 ± 5 ppm, 150 ± 5 ppm, 400 ± 10 ppm and a rapid rate of rise condition to a target concentration of 480 ±15 ppm as specified in Section 39 of UL 2034. For the 70 ppm, 150 ppm and 400 ppm tests, the target concentration must be achieved within 3 minutes of initial injection. The pass/fail criteria for this test are based on the response time. These criteria are listed in Table 3 below. Table 3. UL 2034 Response Time Requirements for Sensitivity Testing
Concentration Activation Time (minutes) 70 ± 5 ppm 60−240 150 ± 5 ppm 10−50 400 ± 10 ppm 4−15 16 ppm/min increase to 480 ± 15 ppm 19−30

12
Sensitivity Test 1 Results: Samples A and B
Table 4. Sensitivity Test 1 Activation Times: Samples A and B
Activation Times (min)
Sample No. 70
ppm 150 ppm
400 ppm
Rapid Rate of Rise
Activation limits 60-240 10-50 4-15 19-30 A1 82.78 26.61 4.62 20.00 A2 80.78 25.86 4.55 19.75 A3 82.30 26.00 4.25 19.83 A4 79.72 25.41 4.42 19.70 A5 82.58 26.55 4.50 20.22 A6 85.25 26.86 5.07 19.95 A7 78.17 25.30 4.67 19.67 A8 78.60 25.93 4.62 19.75 A9 78.95 25.11 4.19 19.42 A10 79.87 26.58 4.67 20.33 A11 77.62 24.95 4.24 19.67 A12 78.70 25.36 4.20 19.45 B1 92.73 28.63 5.97 20.80 B2 90.50 27.91 5.27 20.52 B3 96.17 29.33 6.17 21.17 B4 87.42 27.90 5.74 20.85 B5 102.52 29.73 6.07 21.53 B6 86.00 27.70 5.54 20.70 B7 159.42 26.96 5.32 20.35 B8 88.58 27.88 5.70 20.52 B9 94.20 29.10 5.94 21.08 B10 85.08 27.30 5.15 20.33 B11 84.50 28.10 6.04 20.87 B12 93.83 29.33 6.17 21.22
13
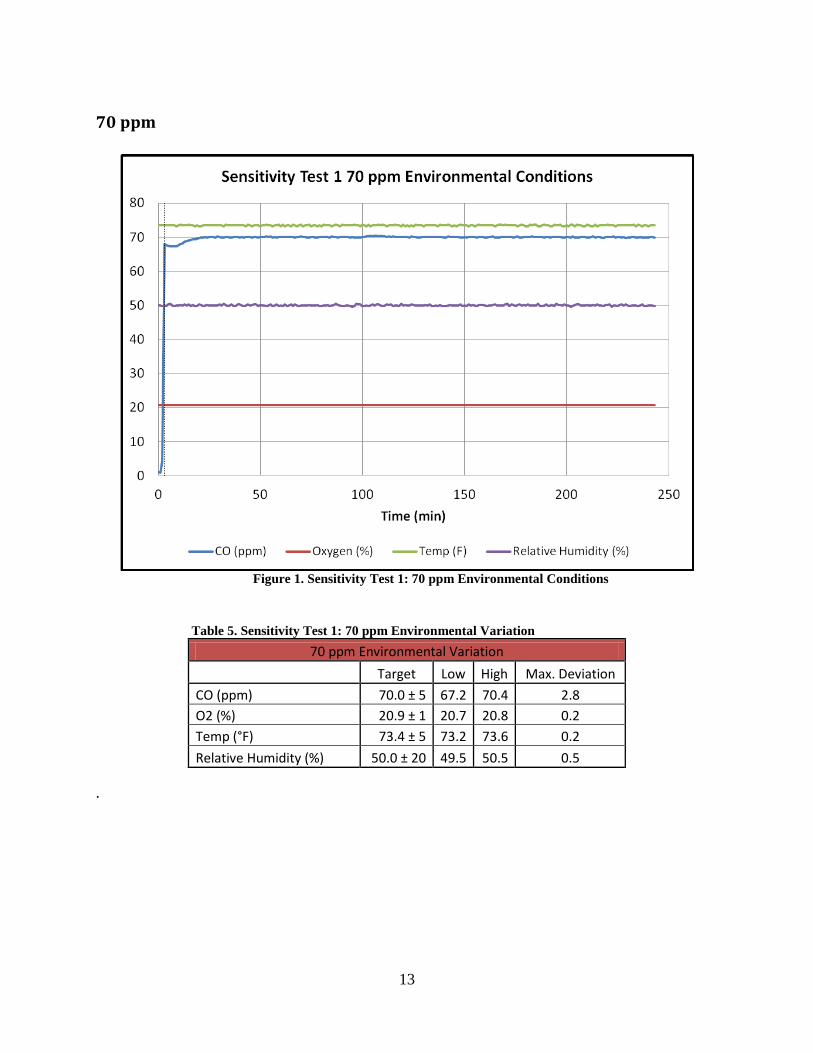
70 ppm
Figure 1. Sensitivity Test 1: 70 ppm Environmental Conditions
Table 5. Sensitivity Test 1: 70 ppm Environmental Variation 70 ppm Environmental Variation
Target Low High Max. Deviation CO (ppm) 70.0 ± 5 67.2 70.4 2.8 O2 (%) 20.9 ± 1 20.7 20.8 0.2 Temp (°F) 73.4 ± 5 73.2 73.6 0.2 Relative Humidity (%) 50.0 ± 20 49.5 50.5 0.5
.

14
150 ppm
Figure 2. Sensitivity Test 1: 150 ppm Environmental Conditions
Table 6. Sensitivity Test 1: 150 ppm Environmental Variation 150 ppm Environmental Variation
Target Low High Max. Deviation CO (ppm) 150.0 ± 5 146.2 150.8 3.8 O2 (%) 20.9 ± 1 21.0 21.0 0.1 Temp (°F) 73.4 ± 5 73.2 73.6 0.2 Relative Humidity (%) 50.0 ± 20 48.9 52.1 2.1

15
400 ppm
Figure 3. Sensitivity Test 1: 400 ppm Environmental Conditions
Table 7. Sensitivity Test 1: 400 ppm Environmental Variation 400 ppm Environmental Variation
Target Low High Max. Deviation CO (ppm) 400.0 ± 10 390.4 391.4 9.6 O2 (%) 20.9 ± 1 21.0 21.0 0.1 Temp (°F) 73.4 ± 5 73.2 73.6 0.2 Relative Humidity (%) 50.0 ± 20 48.9 50.7 1.1

16
Rapid Rate of Rise
Figure 4. Sensitivity Test 1: Rapid Rate of Rise Environmental Conditions
Table 8. Sensitivity Test 1: Rapid Rate of Rise Environmental Conditions RRR Environmental Variation
Target Low High Max. Deviation CO (ppm)* 480.0 ± 15 466.9 472.0 13.1 O2 (%) 20.9 ± 1 21.0 21.0 0.1 Temp (°F) 73.4 ± 5 73.2 73.6 0.2 Relative Humidity (%) 50.0 ± 20 46.9 52.7 3.1
*Average Rate of Rise: 15.37 ppm/min

17
Sensitivity Test 2 Results: Samples C and D
Table 9. Sensitivity Test 2 Activation Times: Samples C and D
Activation Times (min)
Sample No. 70
ppm 150 ppm
400 ppm
Rapid Rate of Rise
Activation Limits 60-240 10-50 4-15 19-30 C1 74.30 19.95 6.56 21.93 C2 75.33 20.38 6.53 22.03 C3 74.25 19.73 6.46 21.32 C4 74.17 22.05 6.55 22.07 C5 74.58 20.72 6.61 22.08 C6 74.25 22.33 6.70 22.23 C7 74.50 22.40 6.66 22.25 C8 74.67 25.77 6.95 22.53 C9 74.25 24.22 6.91 22.33 C10 74.50 21.93 6.58 22.12 C11 74.83 23.22 6.66 22.30 C12 74.08 19.95 6.68 21.87 D1 74.92 20.50 6.71 21.72 D2 72.42 19.83 6.38 21.17 D3 72.97 19.93 6.45 21.42 D4 71.25 19.70 6.36 21.60 D5 72.75 19.97 6.53 21.92 D6 74.42 20.42 6.66 21.25 D7 75.67 21.08 7.05 22.30 D8 68.92 18.83 6.10 20.77 D9 77.17 21.13 6.20 21.38 D10 71.33 19.60 6.43 21.45 D11 73.92 20.17 5.90 20.87 D12 72.42 20.15 6.50 21.70
18
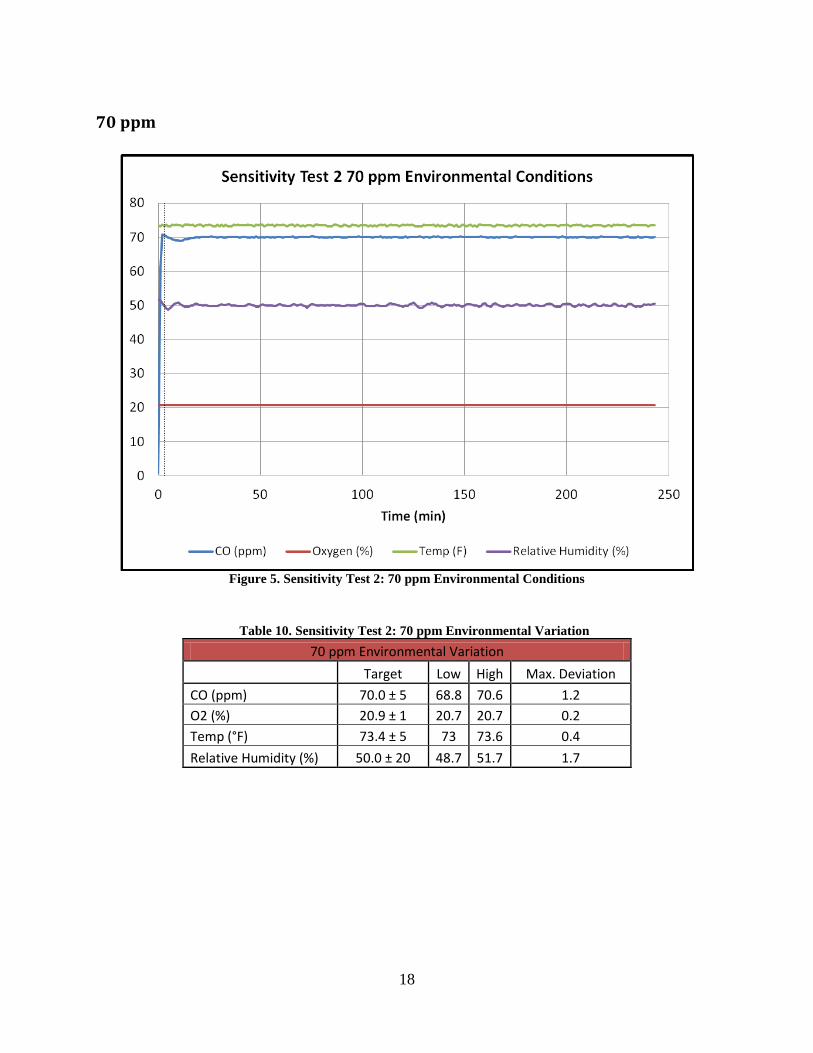
70 ppm
Figure 5. Sensitivity Test 2: 70 ppm Environmental Conditions
Table 10. Sensitivity Test 2: 70 ppm Environmental Variation 70 ppm Environmental Variation
Target Low High Max. Deviation CO (ppm) 70.0 ± 5 68.8 70.6 1.2 O2 (%) 20.9 ± 1 20.7 20.7 0.2 Temp (°F) 73.4 ± 5 73 73.6 0.4 Relative Humidity (%) 50.0 ± 20 48.7 51.7 1.7

19
150 ppm
Figure 6. Sensitivity Test 2: 150 ppm Environmental Conditions
Table 11. Sensitivity Test 2: 150 ppm Environmental Variation 150 ppm Environmental Variation
Target Low High Max. Deviation CO (ppm) 150.0 ± 5 148.9 153.2 3.2 O2 (%) 20.9 ± 1 21.0 21.0 0.1 Temp (°F) 73.4 ± 5 73.2 73.6 0.2 Relative Humidity (%) 50.0 ± 20 46.7 53.4 3.4

20
400 ppm
Figure 7. Sensitivity Test 2: 400 ppm Environmental Conditions
Table 12. Sensitivity Test 2: 400 ppm Environmental Variation 400 ppm Environmental Variation
Target Low High Max. Deviation CO (ppm) 400.0 ± 10 391.9 399.1 8.1 O2 (%) 20.9 ± 1 21.0 21.0 0.1 Temp (°F) 73.4 ± 5 73.2 73.6 0.2 Relative Humidity (%) 50.0 ± 20 48.3 52.2 2.2

21
Rapid Rate of Rise
Figure 8. Sensitivity Test 2: Rapid Rate of Rise Environmental Conditions
Table 13. Sensitivity Test 2 Rapid Rate of Rise Environmental Variation RRR Environmental Variation
Target Low High Max. Deviation CO (ppm)* 480.0 ± 15 466.4 474.6 13.6 O2 (%) 20.9 ± 1 20.9 20.9 0.0 Temp (°F) 73.4 ± 5 73.2 73.6 0.2 Relative Humidity (%) 50.0 ± 20 44.1 65.1 15.1
*Average Rate of Rise: 14.12 ppm/min

22
Sensitivity Test 3 Results: Samples E and F
Table 14. Sensitivity Test 3 Activation Times: Samples E and F
Activation Times (min) Sample No.
70 ppm
150 ppm
400 ppm
Rapid Rate of Rise
Activation Limits 60-240 10-50 4-15 19-30 E1 161.83 12.47 6.12 19.18 E2 158.87 17.35 6.95 21.97 E3 162.88 30.75 6.78 20.60 E4 162.88 21.30 6.08 19.88 E5 N/A 29.00 7.07 21.40 E6 82.80 19.98 6.65 22.18 E7 168.50 24.77 6.13 21.07 E8 162.70 26.62 6.95 21.75 E9 162.33 19.80 6.73 20.10 E14 81.42 13.50 6.08 18.80 E15 162.92 28.68 6.75 21.58 E12 94.08 13.68 5.98 18.45 F1 84.33 31.00 7.97 20.93 F2 80.70 23.62 7.18 20.25 F3 80.00 30.85 8.38 21.08 F16 83.12 25.15 6.43 20.23 F5 83.25 31.92 7.77 21.05 F6 33.17 30.87 8.28 21.37 F17 33.07 25.95 8.07 20.38 F8 77.75 23.67 7.52 20.23 F9 68.08 17.67 6.38 18.47 F10 80.75 24.93 7.80 20.68 F11 85.08 27.00 8.32 20.77 F12 82.53 24.77 7.05 20.28 -Red indicates failure. *N/A = No Activation.

23
70 ppm
Figure 9. Sensitivity Test 3: 70 ppm Environmental Conditions
Table 15. Sensitivity Test 3: 70 ppm Environmental Variation 70 ppm Environmental Variation
Target Low High Max. Deviation CO (ppm) 70.0 ± 5 68.0 70.3 2.0 O2 (%) 20.9 ± 1 20.8 20.8 0.1 Temp (°F) 73.4 ± 5 73 73.6 0.4 Relative Humidity (%) 50.0 ± 20 49.3 50.8 0.8

24
150ppm
Figure 10. Sensitivity Test 3: 150 ppm Environmental Conditions
Table 16. Sensitivity Test 3 150 ppm Environmental Variation 150 ppm Environmental Variation
Target Low High Max. Deviation CO (ppm) 150.0 ± 5 144.6 150.6 5.4 O2 (%) 20.9 ± 1 20.9 20.9 0.0 Temp (°F) 73.4 ± 5 73 73.6 0.4 Relative Humidity (%) 50.0 ± 20 45.8 54.4 4.4

25
400 ppm
Figure 11. Sensitivity Test 3: 400 ppm Environmental Conditions
Table 17. Sensitivity Test 3 400 ppm Environmental Variation 400 ppm Environmental Variation
Target Low High Max. Deviation CO (ppm) 400.0 ± 10 390.2 398.2 9.8 O2 (%) 20.9 ± 1 20.8 20.9 0.1 Temp (°F) 73.4 ± 5 73.2 73.6 0.2 Relative Humidity (%) 50.0 ± 20 49.5 63.2 13.2

26
Rapid Rate of Rise
Figure 12. Sensitivity Test 3: Rapid Rate of Rise Environmental Variation
Table 18. Sensitivity Test 3: Rapid Rate of Rise Environmental Variation RRR Environmental Variation
Target Low High Max. Deviation CO (ppm)* 480.0 ± 15 467.4 478.6 12.6 O2 (%) 20.9 ± 1 20.8 20.8 0.1 Temp (°F) 73.4 ± 5 73 73.6 0.4 Relative Humidity (%) 50.0 ± 20 48.8 52.1 2.1
*Average Rate of Rise: 15.56 ppm/min
27
Sensitivity Test Analysis The Sensitivity Test of UL 2034 is detailed in Section 39 of the standard. This test consists of subjecting a set of 12 alarms from each model to four different carbon monoxide concentrations and basing their performance on a response time interval. As shown in Table 3 above, all alarms must activate within a specified time for each concentration. Additional information on testing procedures is provided in the test plan in the appendix. The environmental conditions for all UL 2034 Section 39 sensitivity testing were within the required specifications. The required environmental conditions for this test set are 73.4 °F ± 5 °F, 50 % ± 20 % relative humidity, and 20.9 % ± 1 % oxygen concentration. Carbon monoxide concentration requirements, including establishing the desired concentrations within 3 minutes were achieved. The tables and charts above show the performance of the alarms and the conditions during testing. The alarms were provided with a minimum of 4 hours of refresh time after the 70 ppm and 150 ppm test; and a minimum of 8 hours of refresh time for the 400 ppm and Rapid Rate of Rise test. All alarms activated within the required time interval for sample sets A, B, C, and D. Each of these sets demonstrated complete conformance to the tests performed. Sample Set E produced one alarm that did not activate during the 70 ppm concentration and another that did not continue to alarm for the duration of the test after activation. Set E also developed two failures due to early activation during the Rapid Rate of Rise test. Sample Set F produced two failures due to early activation during the 70 ppm concentration test and one failure due to early activation during the Rapid Rate of Rise test.

28
UL 2034 Section 46 Variable Ambient Temperature Test
Test Requirements An alarm shall operate for its intended signaling performance requirements when tested at ambient conditions of 32 °F, 15 +5 % relative humidity and 120 °F, 40 +10 % relative humidity. Two alarms per model are to be maintained at both ambient temperatures for at least 3 hours so that thermal equilibrium is reached. The units are then to be tested for sensitivity while connected to a source of supply that is in accordance with section 35.3.1 of UL 2034. If battery operated, the manufacturer’s specified voltage shall be used. During this test, staff noted that the test chamber was unable to maintain the low relative humidity requirement during the low temperature test. For Phase II, a new humidity management system was installed to provide the low levels required. These tests were repeated and reported on in Phase II to evaluate the performance of the samples to the standard requirements4. The data resulting from the noncompliant low temperature tests are not provided in this report.
4 http://www.cpsc.gov/en/Media/Documents/Research--Statistics/Technical-Reports/Home-Maintenance-and-Construction/Portable-Generators/CO-Alarms/Carbon-Monoxide-Alarm-Conformance-Testing-to-UL-2034-2013-Phase-II-Report/.

29
High Temperature Test Results (120 °F):
Table 19. Variable Ambient Temperature 120 °F Test: Activation Times
Activation Times (min)
Sample No. 70
ppm 150 ppm
400 ppm
30 ppm
Activation Limits
60-240 10-50 4-15 No Activation
A1 78.96 24.35 2.97 Pass A2 82.81 24.58 3.00 Pass B1 79.88 26.30 4.10 Pass B2 81.48 25.95 3.60 Pass C1 74.70 19.27 4.50 Pass C2 74.75 16.83 4.35 Pass D1 74.91 19.97 4.60 Pass D3 73.60 19.72 4.43 Pass E1 78.58 12.67 N/A Pass E2 12.35 8.87 N/A 364.21 F1 75.41 16.83 4.33 Pass F3 100.50 25.75 4.38 Pass
-Red indicates failure. *N/A = No Activation.

30
70 ppm
Figure 13. VAT 120 °F: 70 ppm Environmental Conditions
Table 25. VAT 120 °F: 70 ppm Environmental Variation 70 ppm Environmental Variation
Target Low High Max. Deviation CO (ppm) 70.0 ± 5 68.9 72.2 2.2 O2 (%) 20.9 ± 1 20.7 20.7 0.2 Temp (°F) 120 119.5 120.4 0.5 Relative Humidity (%) 40.0 ± 10 37.3 43.7 3.7

31
150 ppm
Figure 14. VAT 120 °F: 150 ppm Environmental Conditions
Table 20. VAT 120 °F: 150 ppm Environmental Variation 150 ppm Environmental Variation
Target Low High Max. Deviation CO (ppm) 150.0 ± 5 148.1 153.3 3.3 O2 (%) 20.9 ± 1 20.8 20.8 0.1 Temp (°F) 120 119.7 120.6 0.6 Relative Humidity (%) 40.0 ± 10 36.9 43.0 3.1

32
400 ppm
Figure 15. VAT 120 °F: 400 ppm Environmental Conditions
Table 21. VAT 120 °F: 400 ppm Environmental Variation 400 ppm Environmental Variation
Target Low High Max. Deviation CO (ppm) 400.0 ± 10 389.8 405.4 10.2 O2 (%) 20.9 ± 1 20.5 20.5 0.4 Temp (°F) 120 119.8 120 0.2 Relative Humidity (%) 40.0 ± 10 39.7 40.3 0.3

33
30 ppm
Figure 16. VAT 120 °F: 30 ppm Environmental Conditions
Table 22. VAT 120 °F: 30 ppm Environmental Variation 30 ppm Environmental Variation
Target Low High Max. Deviation CO (ppm) 30.0 ± 3 29.0 31.1 1.1 O2 (%) 20.9 ± 1 20.6 20.7 0.3 Temp (°F) 120 119.5 120.4 0.5 Relative Humidity (%) 40.0 ± 10 37.8 43.9 3.9

34
Variable Ambient Temperature Test Analysis The Variable Ambient Temperature Test (VAT) consists of subjecting the CO alarm specimens to high and low temperatures and evaluating their performance in the sensitivity test specified in UL2034 Section 39. This test evaluates the alarms’ capabilities to detect CO in extreme temperature environments. Additional information on the test procedures is provided in the Appendix. The environmental conditions for all UL 2034, Section 46 Variable Ambient Temperature testing are within the required specifications, with one exception. The environmental chamber was not capable of maintaining the low relative humidity requirement for the low temperature test. The humidity control system shuts down below 40 °F; therefore, the low temperature test data are invalid regarding conformance to the standard. The required environmental conditions for this test set consist of a low temperature test, 32 °F at 15 ± 5 % relative humidity, and a high temperature test, 120 °F at 40 ± 10 % relative humidity. Oxygen levels must also remain at 20.9 % ± 1 %. Carbon monoxide concentration requirements, including establishing the desired concentrations within 3 minutes, were achieved. The tables and charts above show the performance of the alarms and the conditions during testing to the high temperature requirements. Two alarms from each model were tested to the specifications of UL 2034 Section 46 Variable Ambient Temperature Test. Pass rates were good for the high temperature tests. Sample Set C, D, and F passed all sensitivity requirements during the high temperature test. Sample Set A failed for early response when exposed to 400 ppm. One alarm from Sample B activated early when exposed to 400 ppm as well. Sample Set E contained one alarm that failed all tests. Both alarms from Sample Set E failed to alarm within the required response time for 400 ppm. Both alarms did not activate for the duration of the 400 ppm concentration. Some of the early responses during the 400 ppm test may be attributed to the time it took to reach the target concentration. Three minutes were required to reach the target concentration. This time is within the specification of UL 2034 but may have contributed to the development of early responses in some alarm samples.

35
UL 2034 Section 36.8 Concentration Display Accuracy Test
Test Requirements Section 36.8, Display Accuracy of UL 2034, states that any visual indicator of CO concentration on the CO alarm shall be accurate to within plus or minus 30 percent of the indicated amount. No indication shall be given for CO concentrations less than 30 ppm. The indicator shall comply with the in-service reliability requirements of UL 2034 Section 78.1.2. Testing of this requirement shall be performed at 70, 150, and 400 ppm, in accordance with the requirements of UL 2034 Section 39 Sensitivity. No other test provisions are specified. Three alarms from each model shall be conditioned for 48 hours under the ambient conditions specified in Section 39.2.1 of UL 2034. The alarms shall then be placed in a test chamber as a group and operated for 15 ± 5 minutes. The test chamber shall then be sealed. Carbon monoxide shall be introduced into the test chamber and slowly circulated in the chamber to produce a uniform concentration of 70 ± 5 ppm. This level of carbon monoxide shall be established within 3 minutes after sealing the chamber and shall be maintained throughout the remainder of the test. Once the specified carbon monoxide level has been established, the alarms shall be allowed to stabilize for 15 - 20 minutes. Upon stabilization of the concentration display, the reading on each display and the current concentration in the chamber shall be recorded. The display reading shall be within 30 percent of the chamber concentration. The test chamber shall be purged with fresh air to remove all carbon monoxide. The carbon monoxide alarms shall be reset according to the manufacturer’s instructions, and the test described above shall be repeated with the carbon monoxide concentration maintained at 150 ± 5 ppm. The display reading shall be within 30 percent of the chamber concentration. The test chamber shall be purged with fresh air to remove all carbon monoxide. The carbon monoxide alarms shall be reset according to the manufacturer’s instructions, and the test described above shall be repeated with the carbon monoxide concentration maintained at 400 ± 10 ppm. The display reading shall be within 30 percent of the chamber concentration. This test shall be performed in triplicate with a new set of alarms for each iteration.
36
Concentration Display Accuracy Results
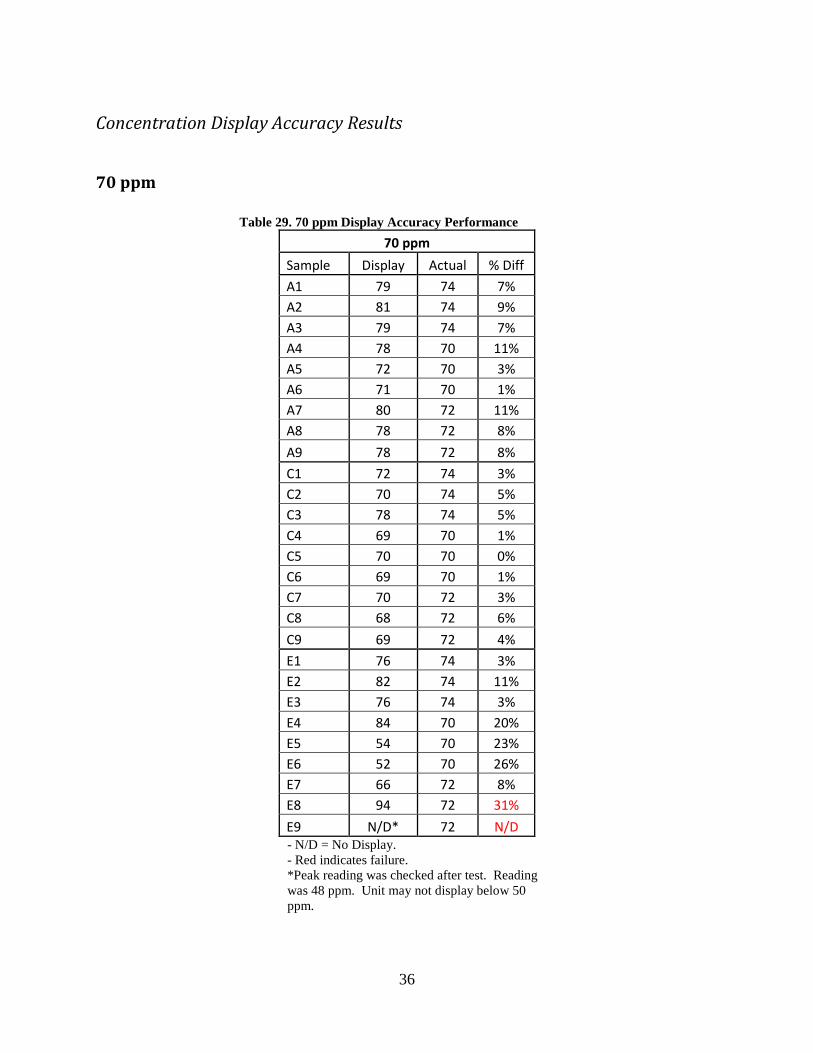
70 ppm
Table 29. 70 ppm Display Accuracy Performance 70 ppm
Sample Display Actual % Diff A1 79 74 7% A2 81 74 9% A3 79 74 7% A4 78 70 11% A5 72 70 3% A6 71 70 1% A7 80 72 11% A8 78 72 8% A9 78 72 8% C1 72 74 3% C2 70 74 5% C3 78 74 5% C4 69 70 1% C5 70 70 0% C6 69 70 1% C7 70 72 3% C8 68 72 6% C9 69 72 4% E1 76 74 3% E2 82 74 11% E3 76 74 3% E4 84 70 20% E5 54 70 23% E6 52 70 26% E7 66 72 8% E8 94 72 31% E9 N/D* 72 N/D - N/D = No Display. - Red indicates failure. *Peak reading was checked after test. Reading was 48 ppm. Unit may not display below 50 ppm.

37
150 ppm
Table 30. 150 ppm Display Accuracy Performance 150 ppm
Sample Display Actual % Diff A1 171 149 15% A2 174 149 17% A3 176 149 18% A4 175 151 16% A5 173 151 15% A6 170 151 13% A7 181 151 20% A8 179 151 19% A9 183 151 21% C1 155 149 4% C2 150 149 1% C3 168 149 13% C4 159 151 5% C5 157 151 4% C6 157 151 4% C7 156 151 3% C8 152 151 1% C9 152 151 1% E1 200 149 34% E2 205 149 38% E3 222 149 49% E4 242 151 60% E5 148 151 2% E6 137 151 9% E7 196 151 30% E8 247 151 64% E9 115 151 24% -Red indicates failure.

38
400 ppm
Table 23. 400 ppm Display Accuracy Performance 400 ppm
Sample Display Actual % Diff A1 445 402 11% A2 448 402 11% A3 454 402 13% A4 445 393 13% A5 440 393 12% A6 432 393 10% A7 460 404 14% A8 447 404 11% A9 458 404 13% C1 390 402 3% C2 379 402 6% C3 424 402 5% C4 392 393 0% C5 393 393 0% C6 386 393 2% C7 391 404 3% C8 380 404 6% C9 379 404 6% E1 404 402 0% E2 398 402 1% E3 426 402 6% E4 416 393 6% E5 402 393 2% E6 380 393 3% E7 404 404 0% E8 422 404 4% E9 354 404 12%

39
Concentration Display Accuracy Test Analysis The Concentration Display Accuracy test was developed from the requirement of 30 percent accuracy described in Section 36.8 of UL 2034. It consists of exposing CO alarm samples to varying concentrations of CO and recording the display reading. This display reading is then compared to the actual concentration of CO in the chamber as measured by the gas analyzer and a percentage is placed on the difference between these two values. Display readings with a difference of more than 30 percent constitute a failure. Additional information on the test procedures is provided in the appendix. The environmental conditions for the test performed based on the requirement of UL 2034, Section 36.8 are within the required specifications. The required environmental conditions established for this test set are 73.4 °F ± 5 °F, 50 % ± 20 % relative humidity, and 20.9 % ± 1 % oxygen concentration. Carbon monoxide concentration requirements, including establishing the desired concentrations within 3 minutes were achieved. The tables and charts above show the performance of the displays. Nine alarms from each model with a visual display of measured CO concentration were tested. The results of this test are shown in Tables 29 -31. Sample Sets A and C provided display accuracies within 30 percent. Sample Set E included two samples that failed to achieve that accuracy for the 70 ppm concentration and six that failed to achieve that accuracy for the 150 ppm concentration. All failures were due to elevated readings, except for one failure to display at 70 ppm.

40
Previous Test Results The following test data are provided from CPSC’s FY 2006 study involving the long-term testing of CO alarms (Tucholski, 2006). This testing shows good conformance to the response time requirements for 150 ppm and 400 ppm concentrations. Table 24. FY 2006 Long Term Testing 150 ppm and 400 ppm Performance Summary Chart (Tucholski, 2006)
Sample Number
Manufacture Date Sensor Type Sub
Sample Test Date
150 ppm Test 400 ppm Test
Response Time
(minutes) UL 2034 Pass/Fail
Response Time
(minutes) UL 2034 Pass/Fail
99-830-4517 Unknown Semiconductor 09 7/18/06 34.17 Pass 11.15 Pass
99-830-4519 Unknown Semiconductor 01 03
7/18/06 33.75 33.98
Pass Pass
11.42 11.52
Pass Pass
05-810-2613 Unknown Electro-chemical
03 04 05 06
8/17/06
13.88 15.17 13.50 14.15
Pass Pass Pass Pass
13.32 13.18 12.57 13.48
Pass Pass Pass Pass
00-792-0681 Dec-99 , Jan-00 Biomimetic
01 05
8/21/06 22.02 24.38
Pass Pass
4.50 4.45
Pass Pass
99-800-1314 Unknown Biomimetic 04 11
7/18/06 13.05 13.05
Pass Pass
2.80 2.80
Pass Pass
05-302-1836 Dec-02 Semiconductor
01 02 05 06
8/23/06
23.27 24.17 11.72 20.63
Pass Pass Pass Pass
7.82 8.90 7.33 7.45
Pass Pass Pass Pass
05-830-5271 Apr-05 Semiconductor
01 02 03 04 05 06
8/23/06
20.50 23.18 4.01 8.35
19.42 7.95
Pass Pass
Fail-Early Fail-Early
Pass Fail-Early
7.53 7.16 9.28 3.63 4.32 3.50
Pass Pass Pass
Fail-Early Pass
Fail-Early
41
Discussion CPSC staff used two methods to evaluate the results of the tests presented above. First, the alarms were compared to the criteria established in UL 2034. Next, a performance analysis relative to the number of delayed or no-activation failure modes was conducted. The two most dangerous failure modes for this product are failures due to delayed activation or failures due to no-activation. Continued exposure beyond the durations and concentrations specified in the general sensitivity test of Section 39 may cause significant health effects, as well as death at high level CO exposures. The UL 2034 sensitivity tests require that the alarms activate within a certain period of time, depending upon the concentration of CO present. This includes a period of time in which the alarms cannot activate so that nuisance alarms from transient levels of carbon monoxide are prevented. The standard also provides test methods in which the alarms are exposed to 30 ppm CO for 30 days or 8 hours, depending on the particular test. During this period, the alarms must not activate. These criteria were established to prevent premature activation, which may lead to a lack of consumer confidence in the performance of the alarms. A reduction in the perceived reliability of CO alarms could lead to consumers disregarding the alarm entirely, even when dangerous levels of CO were present and detected. Table 33 shows the failure rates of the alarms tested based on the activation period specified in UL 2034. The data provided from the tests were also used to evaluate failures due to delayed or no activation. Delayed and no activation scenarios are among the most dangerous failure modes. Table 34 shows the performance of the alarms tested relative to these criteria. The failure rates due to delayed or no activation are significantly lower. Models A, B, C, and D performed well for all sensitivity tests. Model A developed 2 out of 2 failures for the high temperature, 400 ppm test. Model B also had 1 failure out of the 2 units tested to the same specifications. All three of these failures were due to early activations within approximately a minute of the lower threshold of 4 minutes. This type of failure does not expose consumers to a dangerous scenario and would most likely go unnoticed as an issue. Models C and D performed flawlessly throughout all sensitivity tests. Models E and F developed several failures throughout testing. Model E failed 14 out of a total of 64 sensitivity tests, including 3 failures due to delayed or no activation. Model F failed 5 tests total. The alarms with displays generally performed well for the concentration display accuracy test. Sample Set A and C conformed to the standards requirements for all test concentrations. Sample Set E included two samples that failed to achieve that accuracy for the 70 ppm concentration and six that failed to achieve that accuracy for the 150 ppm concentration. All failures were due to elevated readings, except for one failure to display at 70 ppm. According to the basis of acceptability defined in UL 2034, model C and D were the only alarms that conformed to the standard relative to the tests performed. However, only one alarm, model E, produced a potentially dangerous failure mode. The performance of the alarms is similar to the performance shown in the 2006 study (Tucholski, 2006).

42
Table 33. UL2034 Tested CO Alarm Failure Rates
Failure Rates Based on UL 2034 Criteria (Concentrations in PPM) Model 39 Sensitivity Test 46 Variable
Ambient Temp. (Low)*
46 Variable Ambient Temp.
(High)
Total
70 150 400 RRR 70 150 400 30 70 150 400 30 A 0 0 0 0 0 0 0 0 0 0 2 0 2 B 0 0 0 0 0 0 0 0 0 0 1 0 1 C 0 0 0 0 0 0 0 0 0 0 0 0 0 D 0 0 0 0 0 0 0 0 0 0 0 0 0 E 1 0 2 0 2 2 2 0 1 1 2 1 14 F 2 0 1 0 1 1 0 0 0 0 0 0 5
*Humidity requirement of UL 2034 not maintained. Data provided does not represent conformance to the standard.
Table 34. CO Alarm Failure Rates Due to Delayed or No Activation
Failure Rates Based on Delayed or No Activation *Concentrations in PPM Model 39 Sensitivity Test 46 Variable
Ambient Temp. (Low)*
46 Variable Ambient Temp.
(High)
Total
70 150 400 RRR 70 150 400 70 150 400
A 0 0 0 0 0 0 0 0 0 0 0 B 0 0 0 0 0 0 0 0 0 0 0 C 0 0 0 0 0 0 0 0 0 0 0 D 0 0 0 0 0 0 0 0 0 0 0 E 1 0 0 0 0 0 0 0 0 2 3 F 0 0 0 0 0 0 0 0 0 0 0
*Humidity requirement of UL 2034 not maintained. Data provided does not represent conformance to the standard.

Conclusions The carbon monoxide alarms selected from the brands and models that are available on the current retail market performed well when tested for the sensitivity, low and high temperatures, and display accuracy requirements of the UL 2034 standard. During the sensitivity testing, the alarms performed well when tested against the new rapid rate of rise test incorporated into UL 2034 in 2008. Response times were within the required threshold or slightly early. For the 70 ppm, 150 ppm, and 400 ppm tests, the alarms continued to perform well and produced similar results to the 2006 CPSC program. The low temperature test of Section 46.1 did not adhere to the relative humidity requirements specified in UL 2034; therefore, additional testing was performed in FY 2013, Phase II, when these conditions were achievable. Additional systems will be added to the test chamber to produce the low relative humidity required by UL 2034. The data from these tests have not been provided in this report; however, performance was similar to the response times seen in the high temperature test. The high temperature testing provided varying response times. The alarms either responded early or within the required threshold, with few exceptions. Sample Set E continued to activate early, similar to their performance in the low temperature tests. Sample set E also produced one failure during the 30 ppm, 8-hour nuisance alarm test with a full alarm signal. This failure and a failure from Sample Set F due to a trouble signal were the only failures during the nuisance alarm testing for both temperature conditions. Overall performance was good during high temperature conditions, but testing should be repeated to adhere to the low relative humidity requirement in UL 2034 for the low temperature test. References to the performance of the alarms during the low temperature tests in this report are for comparative purposes only. The low temperature test results are not valid with regard to UL 2034 due to the deviation of relative humidity from the test requirements during testing. Display accuracy was shown to be quite good for most alarms. Only one model (Sample Set E) developed display readings outside of the 30 percent accuracy requirement. One of these failures did not display any visual reading, potentially due to the alarm being programmed not to display values below 50 ppm. The performance of the alarms was good, with the exception of failures noted for model E and F in a variety of tests. Overall, performance tended to be brand-specific and may be dependent upon the algorithms used to calculate the carbon monoxide value. The effects of extreme conditions on the alarms also may influence the performance of the alarms by physically interfering with normal operation. The performance of currently available retail market CO alarms is consistent with the good performance shown in previous years’ testing. As for the basis for acceptability in UL 2034, only models C and D passed all of the tests performed. However, only model E developed failure modes that may potentially expose consumers to a dangerous CO situation. Notably, there were only three of these types of failures.
44
Recommendations Several issues were noted during this project. These issues include the inability of the test chamber to adhere to the low relative humidity requirements of the Variable Ambient Temperature, low temperature test; alarm performance dependencies on laboratory provided refresh periods; flow conditions affecting alarm performance; and a vague description of test time criteria in UL 2034. The environmental chamber used for CO alarm testing was not able to control relative humidity below 40 °F. An additional system and program modification are required to reach low relative humidity at low temperatures. The low temperature test of the Variable Ambient Temperature test were performed again in Phase II when the chamber was capable of reaching and maintaining the environmental conditions needed. During the sensitivity testing, it was noted that shorter refresh periods significantly affected the performance of the alarms during subsequent sensitivity tests. The sensitivity tests were continued to completion using minimal refresh periods. This data and analysis are provided in the Appendix. After the first injection of 70 ppm and a short refresh period, some alarms failed the remainder of the concentrations specified in UL 2034 Section 39. This may be caused by a decaying CO concentration value produced from the algorithm used in the CO alarm that has not yet reset to zero prior to initiating the next test. Some algorithms produce a sensed CO concentration value that mimics the development and decay of carboxyhemoglobin (COHb) in the human body during the inhalation of carbon monoxide. This can create a lagging value of carbon monoxide in the CO alarm program that can remain for a significant period of time after being exposed to fresh air for refreshing and resetting. There are no provisions for minimal refresh times in UL 2034, based on the exposure time and concentration. A minimal refresh period for each concentration should be specified in UL 2034 to prevent false failures due to residual CO values within the algorithm. Manufacturer’s instructions are also not clear or consistent regarding how an alarm should be refreshed after exposure to CO levels in a home. Staff believes that this could be addressed more clearly in UL 2034. The flow conditions in the chamber used at the CPSC for CO alarm testing produces a velocity of nearly 300 ft/min across the area where CO alarms are placed. This flow is significantly higher than the velocity within a typical home and UL’s actual testing chambers (~20 ft/min). The difference in velocities near the alarms may influence their performance and skew the results. Staff believes that additional testing is needed to evaluate the effects of flow conditions near the alarms and determine whether this factor needs to be addressed explicitly in UL 2034. Upon completion of this testing, a provision may be recommended to UL to provide limitations on flow within a test chamber for CO alarm testing. The sensitivity tests in UL 2034 require that the target concentration is met within 3 minutes of initiating flow of CO into the test chamber. UL does not specify when the activation time period is to begin, relative to the target concentration being achieved. CPSC staff contacted UL to clarify this requirement, and we determined that the time to activation begins when the target

45
concentration is achieved within the bounds of error specified in UL 2034. Time to activation does not begin at the instant CO begins to enter the chamber. Staff believes this requirement should be stated clearly in the standard. Staff believes that further testing is needed to evaluate the performance of currently available retail market CO alarms. Additional testing is planned that will evaluate conformance to UL 2034 and includes, Section 42.1(A) 30 ppm Stability Test, Section 42.1(C) Cyclic Temperature Test, Section 47.1 Humidity Test, and Section 53 Undervoltage Test. These tests primarily evaluate the effects of environmental conditions on CO alarm performance, as well as CO alarm nuisance activations.

46
References “2009 Jarden Home Safety Survey,” LCWA Research Group: Feb 2009 ed. 23. “American Housing Survey for the United States: 2009,” United States Census Bureau, Current
Housing Reports, Series H-150/09: March, 2011 Clifford, P.K., Siu, D.J., “Performance Testing of Residential CO Alarms,” The Gas Research
Institute Environment and Safety Business Unit, Report No. GRI-98/0284: December 1998
Hnatov, “Non-Fire Carbon Monoxide Deaths Associated with the Use of Consumer Products
2008 Annual Estimates,” U.S. Consumer Product Safety Commission, Bethesda, MD: 2012
Tucholski, D.R., “Carbon Monoxide Alarm Long-Term Testing Program: FY2006 Test Results,”
Directorate for Laboratory Sciences, United States Consumer Product Safety Commission, Washington, D.C.: December 2006
UL 2034 “Standard for Safety for Single and Multiple Station Carbon Monoxide Alarms,” Third
Edition, Underwriters Laboratories Inc. (UL), Northbrook, IL: February 28, 2008
U.S. Department of Health and Human Services, Center for Disease Control and Prevention, http://www.cdc.gov/co/pdfs/generators.pdf.

47
Acknowledgements Arthur Lee, Electrical Engineer, Engineering Sciences Electrical Division, CPSC Maxwell Sanborn, Mechanical Engineer, Laboratory Sciences Mechanical Division, CPSC Gregory Masenheimer, Physical Science Technician, Laboratory Sciences Electrical Division, CPSC Andrew Lock, PhD, Fire Protection Engineer, Laboratory Sciences Electrical Division, CPSC Einstein Miller, Electrical Engineer, Laboratory Sciences Electrical Division, CPSC Brian Baker, Mechanical Engineer, Laboratory Sciences Mechanical Division, CPSC John Massale, Mechanical Engineer, Laboratory Sciences Mechanical Division, CPSC
48
Appendix
A.1 Audible Signal Detection (ASD) System Schematic

49
A.2 Test Procedures
Test Series Summary Standard Number UL 2034 2008 Standard Name Single and Multiple Station Carbon Monoxide Alarms Test
# Specifications Description
1 Section 39 Sensitivity Test
To determine the capability of a sample of CO alarms currently available on the consumer market to operate as intended of signaling performance when tested for sensitivity at ambient conditions.
2 Section 46.1 Variable Ambient Temperature Test
To determine the capability of a sample of CO alarms currently available on the consumer market to operate as intended of signaling performance when tested for sensitivity at conditions of 32 F, 15 +5 % relative humidity and 120 F, 40 +10 % relative humidity.
3 Concentration Display Accuracy
Test Section 36.8
To determine the capability of a sample of CO alarms with Concentration Displays currently available on the consumer market to provide an accurate reading of carbon monoxide concentrations at various levels.

50
Test Details Standard Number UL 2034 2008 Standard Name Single and Multiple Station Carbon Monoxide Alarms
Test # Samples Section Description 1 72 39 Specimens consist of 3 manufacturers, 2 models from
each and 12 samples of each model. New, Unused samples are to be used.
Goal To determine the capability of a sample of CO alarms currently available on the consumer market to operate as intended of signaling performance when tested for sensitivity at ambient conditions. Test Method Summary Preparation: Condition alarms for not less than 48 hours under the ambient conditions specified in section 39.2.1 (73.4 +5 °F or a higher temperature if specified by the manufacturer, 50 +20 % relative humidity, 20.9 +1 % oxygen). Turn on computer and activate Chamber BMS exhaust on BMS computer, ensure chamber is clear of all unnecessary equipment, seal chamber door, shut down purge system, open cylinders 5, 16, and 22, and calibrate CO analyzer. Test: Twelve alarms from each model shall be conditioned for 48 hours under the ambient conditions specified above (section 39.2.1). Two models shall be tested concurrently such that the sensitivity test will be performed 3 times (once for each set of two models). The alarms shall then be placed in a test chamber as a group and operated for 15 + 5 minutes. The test chamber shall then be sealed. Carbon monoxide shall be introduced into the test chamber and slowly circulated in the chamber to produce a uniform concentration of 70 +5 ppm. This level of carbon monoxide shall be established within 3 minutes after sealing the chamber and shall be maintained throughout the remainder of the test. Once the specified carbon monoxide level has been established, the alarms shall actuate within the time range specified in Table 39.1, but not exceed 240 minutes.
The test chamber shall be purged with fresh air to remove all carbon monoxide. The carbon monoxide alarms shall be reset according to the manufacturer’s instructions, and the test

51
described above shall be repeated with the carbon monoxide concentration maintained at 150 + 5 ppm. The alarms shall actuate within the time range specified in Table 39.1, but not exceed 50 minutes. The test chamber shall be purged with fresh air to remove all carbon monoxide. The carbon monoxide alarms shall be reset according to the manufacturer’s instructions, and the test described above shall be repeated with the carbon monoxide concentration maintained at 400 + 10 ppm. The alarms shall actuate within the time range specified in Table 39.1, but not exceed 15 minutes. The test chamber shall be purged with fresh air to remove all carbon monoxide. The carbon monoxide alarms shall be reset according to the manufacturer’s instructions. The test chamber shall be sealed. Conditions within the chamber shall be 73.4 + 5 °F, 50 + 20 % RH. The atmosphere within the chamber shall be mixed in a manner that ensures uniformity of gas concentration, temperature, and humidity. The rapid rate of rise test shall be performed. Carbon monoxide shall be injected into the chamber at a constant rate for 30 + 3 minutes. The rate of CO injection shall be determined by the operator through calculation or from previous test experience to attain a concentration increase of 16 ppm CO per minute. The CO injection rate shall not vary from the initial injection rate by more than 10 % for a 30 + 0.3 minute injection period. After injecting CO into the chamber for 30 + 0.3 minutes, CO gas introduction shall stop and the CO concentration in the chamber shall be monitored for a period of 3 + 0.3 minutes to assure a stable CO concentration of 480 + 15 ppm. Alarms during this test shall activate after 19.0 minutes and before 30.0 minutes. The recovery time for the alarms to reach full reset or refresh value between tests shall not exceed 16 hours (less than 2 ppm CO or clean air values). Safety Considerations: Two CO laboratory trained personnel must be on site at all times if the laboratory is occupied. Safety glasses and personal CO monitors are required. Equipment List
• Alarm Chamber • Alarm Chamber Computer System • Conditioning Chamber • BMS System • Alarm Chamber Analyzer Rack • N2, 0.1% CO, 100% CO • Personal CO Alarms • Audible Signal Detection System (24) • Alarm Pickup DAQ

52
Standard Number UL 2034 2008 Standard Name Single and Multiple Station Carbon Monoxide Alarms
Test # Samples Section Description 2 12 46.1 Specimens consist of 3 manufacturers, 2 models from
each and 2 samples of each model. Use the same samples from the 42.1 (C) test if this test was performed.
Goal To determine the capability of a sample of CO alarms currently available on the consumer market to operate as intended of signaling performance when tested for sensitivity at conditions of 32 °F, 15 +5 % relative humidity and 120 °F, 40 +10 % relative humidity. Test Method Summary Preparation: Condition alarms for not less than 48 hours under the ambient conditions specified in section 39.2.1 (73.4 +5 °F or a higher temperature if specified by the manufacturer, 50 +20 % relative humidity, 20.9 +1 % oxygen). Turn on computer and activate Chamber BMS exhaust on BMS computer, ensure chamber is clear of all unnecessary equipment, seal chamber door, shut down purge system, open cylinders 5, 16, and 22, and calibrate CO analyzer. Test: An alarm shall operate for its intended signaling performance when tested at ambient conditions of 32 °F, 15 +5 % relative humidity and 120 °F, 40 +10 % relative humidity. Two alarms per model are to be maintained at both ambient temperatures for at least 3 hours so that thermal equilibrium is reached. The units are then to be tested for sensitivity while connected to a source of supply that is in accordance with 35.3.1 (see table below). If battery operated, the manufacturer’s specified voltage shall be used.
Sensitivity measurements are to be recorded before and during the Variable Ambient Temperature Test, Section 46, using the CO values listed in Table 39.1, Part A – Alarm, and Part B – False Alarm, except the 30 day test is to be conducted for 8 hours. All alarm samples tested as part of the tests in this section shall comply with these requirements.

53
Perform the sensitivity tests shown in Table 39.1 at the conditions specified in section 39.2.1 with the 30 day test run for only 8 hours. This test will confirm that the alarms were functioning properly prior to the Variable Ambient Temperature Test. Set chamber to 32 °F, 15 +5 % relative humidity. Place the conditioned alarms into the chamber and allow 3 hours at these conditions for the alarms to reach thermal equilibrium. After 3 hours, perform the tests specified in Table 39.1 again. Maintain 32 °F, 15 +5 % relative humidity. After this test set is complete, increase the conditions to 120 °F, 40 +10 % relative humidity and allow the alarms to set at this point for 3 hours in order to reach equilibrium. Repeat the tests specified in Table 39.1 and maintain 120 °F, 40 +10 % relative humidity. Both units shall operate as intended in both ambient conditions. The sensitivity readings shall not, in any case, exceed the limits specified in Table 39.1 with the exception that the 30 day test is operated for only 8 hours. An audible alarm pickup circuit on each alarm will be connected to a DAQ system to monitor the activation of each alarm.
Safety Considerations: Two CO laboratory trained personnel must be on site at all times if the laboratory is occupied. Safety glasses and personal CO monitors are required. Equipment List
• Alarm Chamber • Alarm Chamber Computer System • Conditioning Chamber • BMS System • Alarm Chamber Analyzer Rack • N2, 0.1% CO, 100% CO • Personal CO Alarms • Audible Signal Detection System (12) • Pickup DAQ

54
Standard Number UL 2034 2008 Standard Name Single and Multiple Station Carbon Monoxide Alarms
Test # Samples Section Description 4 3 36.8 Specimens consist of 3 manufacturers, 1 model from
each and 3 samples of each model. Use only the samples tested in section 39 (Test 1).
Goal To determine the capability of a sample of CO alarms with concentration displays currently available on the consumer market to provide an accurate reading of carbon monoxide concentrations at various levels. Test Method Summary Preparation: Condition alarms for not less than 48 hours under the ambient conditions specified in section 39.2.1 (73.4 +5 °F or a higher temperature if specified by the manufacturer, 50 +20 % relative humidity, 20.9 +1 % oxygen). Turn on computer and activate Chamber BMS exhaust on BMS computer, ensure chamber is clear of all unnecessary equipment, seal chamber door, shut down purge system, open cylinders 5, 16, and 22, and calibrate CO analyzer. Test: Section 36.8 states that any indicator of CO concentration shall be accurate to within plus or minus 30 % of the indicated amount. No indication shall be given for CO concentrations less than 30 ppm. The indicator shall comply with the in-service reliability requirements of section 78.1.2. Testing of this shall be performed at 70, 150, and 400 ppm. Three alarms from each model shall be conditioned for 48 hours under the ambient conditions specified above (Preparation, section 39.2.1). The alarms shall then be placed in a test chamber as a group and operated for 15 + 5 minutes. The test chamber shall then be sealed. Carbon monoxide shall be introduced into the test chamber and slowly circulated in the chamber to produce a uniform concentration of 70 +5 ppm. This level of carbon monoxide shall be established within 3 minutes after sealing the chamber and shall be maintained throughout the remainder of the test. Once the specified carbon monoxide level has been established, allow the alarms to stabilize for 15 + 5 minutes. Upon stabilization of the concentration display, record the reading on each display and the current concentration in the chamber. The display reading shall be within 30 % of the chamber concentration. The test chamber shall be purged with fresh air to remove all carbon monoxide. The carbon monoxide alarms shall be reset according to the manufacturer’s instructions, and the test described above shall be repeated with the carbon monoxide concentration maintained at 150 + 5 ppm. The display reading shall be between within 30 % of the chamber concentration. The test chamber shall be purged with fresh air to remove all carbon monoxide. The carbon monoxide alarms shall be reset according to the manufacturer’s instructions, and the test described above shall be repeated with the carbon monoxide concentration maintained at 400 + 10 ppm. The display reading shall be within 30 % of the chamber concentration. This test shall be performed in triplicate with a new set of alarms for each iteration.

55
Safety Considerations: Two CO laboratory trained personnel must be on site at all times if the laboratory is occupied. Safety glasses and personal CO monitors are required. Equipment List
• Alarm Chamber • Alarm Chamber Computer System • Conditioning Chamber • BMS System • Alarm Chamber Analyzer Rack • N2, 0.1% CO, 100% CO • Personal CO Alarms

56
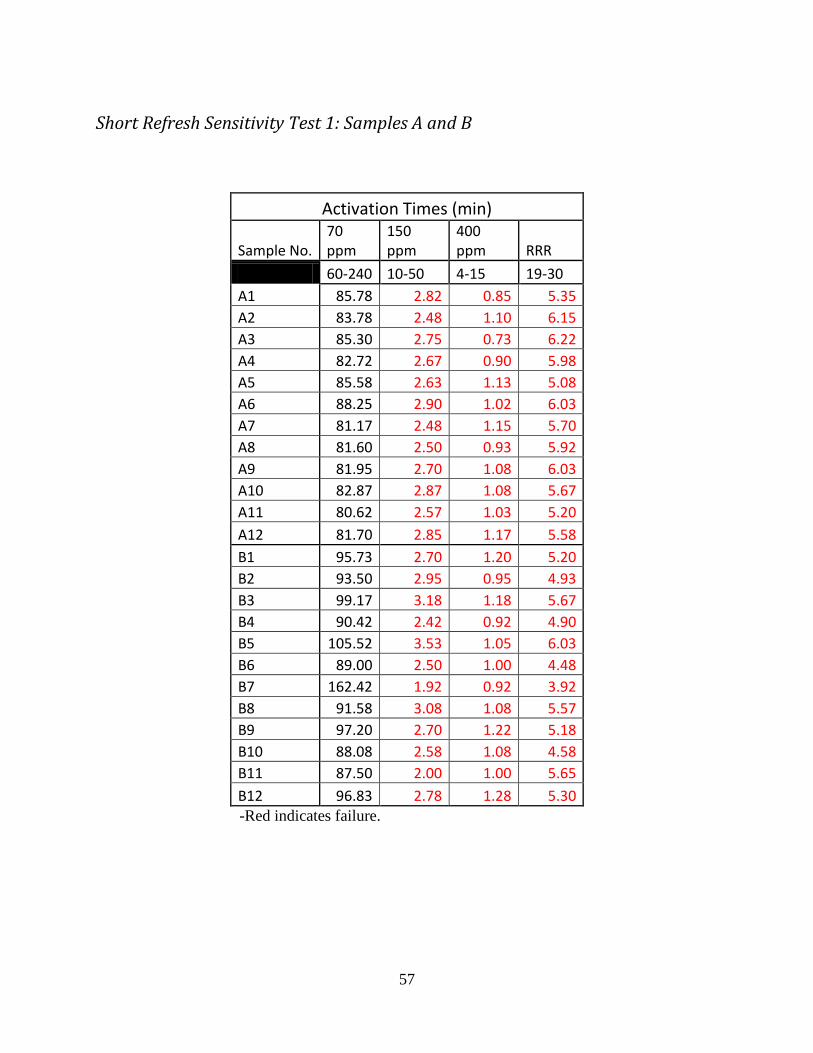
A.3 Effects of Short Refresh Times Between Sensitivity Test Concentrations The results displayed in this section are not corrected for target concentration achievement time. These data also show tests that were performed with minimal refresh periods between tests. The alarms were allowed to remain in fresh air until the audible signal activation stopped. An additional 15 - 30 minutes were provided for continued refreshing and then another test was initiated at the following concentration. Short refresh periods have an effect on the performance of the alarms during subsequent testing dependent on the algorithm used to calculate CO levels. Some alarms use an algorithm that produces a value that varies similar to COHb levels in the human body; therefore, even though the alarms are no longer alarming, there may still be a CO value present in the calculation that is above zero. This residual value shortens the time to audible signal activation for the subsequent test.
57
Short Refresh Sensitivity Test 1: Samples A and B
Activation Times (min)
Sample No. 70 ppm
150 ppm
400 ppm RRR
60-240 10-50 4-15 19-30 A1 85.78 2.82 0.85 5.35 A2 83.78 2.48 1.10 6.15 A3 85.30 2.75 0.73 6.22 A4 82.72 2.67 0.90 5.98 A5 85.58 2.63 1.13 5.08 A6 88.25 2.90 1.02 6.03 A7 81.17 2.48 1.15 5.70 A8 81.60 2.50 0.93 5.92 A9 81.95 2.70 1.08 6.03 A10 82.87 2.87 1.08 5.67 A11 80.62 2.57 1.03 5.20 A12 81.70 2.85 1.17 5.58 B1 95.73 2.70 1.20 5.20 B2 93.50 2.95 0.95 4.93 B3 99.17 3.18 1.18 5.67 B4 90.42 2.42 0.92 4.90 B5 105.52 3.53 1.05 6.03 B6 89.00 2.50 1.00 4.48 B7 162.42 1.92 0.92 3.92 B8 91.58 3.08 1.08 5.57 B9 97.20 2.70 1.22 5.18 B10 88.08 2.58 1.08 4.58 B11 87.50 2.00 1.00 5.65 B12 96.83 2.78 1.28 5.30
-Red indicates failure.

58
70 ppm
70 ppm Environmental Variation Target Low High Max. Dev. CO (ppm) 70.0 ± 5 67.2 70.4 2.8 O2 (%) 20.9 ± 1 20.7 20.8 0.2 Temp (F) 73.4 ± 5 73.2 73.6 0.2 Relative Humidity (%) 50.0 ± 20 49.5 50.5 0.5

59
150 ppm
150 ppm Environmental Variation Target Low High Max. Dev. CO (ppm) 150.0 ± 5 149.7 153.6 3.6 O2 (%) 20.9 ± 1 20.7 20.8 0.2 Temp (F) 73.4 ± 5 73.2 73.6 0.2 Relative Humidity (%) 50.0 ± 20 42.6 64.1 14.1

60
400 ppm
400 ppm Environmental Variation Target Low High Max. Dev. CO (ppm) 400.0 ± 10 400.5 405.9 5.9 O2 (%) 20.9 ± 1 20.7 20.7 0.2 Temp (F) 73.4 ± 5 73.2 73.6 0.2 Relative Humidity (%) 50.0 ± 20 48.6 50.8 1.4

61
Rapid Rate of Rise
RRR Environmental Variation
Target Low High Max. Dev. CO (ppm) 480.0 ± 15 484.5 491.0 11.0 O2 (%) 20.9 ± 1 20.7 20.7 0.2 Temp (F) 73.4 ± 5 73.2 73.6 0.2 Relative Humidity (%) 50.0 ± 20 49.8 50.2 0.2
*Average Rate of Rise: 15.60 ppm/min

62
Short Refresh Sensitivity Test 2: Samples C and D
Activation Times (min)
Sample No. 70 ppm
150 ppm
400 ppm RRR
60-240 10-50 4-15 19-30 C1 76.30 27.62 9.38 21.63 C2 77.33 27.87 9.43 21.58 C3 76.25 21.93 9.03 20.62 C4 76.17 23.42 9.18 21.25 C5 76.58 24.42 9.32 21.48 C6 76.25 27.65 9.37 21.37 C7 76.50 27.67 9.42 21.53 C8 76.67 27.75 9.50 21.88 C9 76.25 27.72 9.50 22.05 C10 76.50 26.80 9.47 21.58 C11 76.83 25.30 9.42 21.45 C12 76.08 21.88 9.22 20.83 D1 76.92 22.80 9.52 21.33 D2 74.42 21.85 9.23 20.42 D3 74.97 22.20 9.25 21.08 D4 73.25 22.97 9.17 21.20 D5 74.75 22.05 9.28 20.97 D6 76.42 22.42 9.35 20.67 D7 77.67 23.22 9.53 21.53 D8 70.92 20.88 8.73 20.20 D9 79.17 23.27 9.13 20.68 D10 73.33 21.58 9.00 20.67 D11 75.92 22.17 9.20 20.52 D12 74.42 22.72 9.13 21.08

63
70 ppm
70 ppm Environmental Variation Target Low High Max. Dev. CO (ppm) 70.0 ± 5 68.8 70.6 1.2 O2 (%) 20.9 ± 1 20.7 20.7 0.2 Temp (F) 73.4 ± 5 73 73.6 0.4 Relative Humidity (%) 50.0 ± 20 48.7 51.7 1.7

64
150 ppm
150 ppm Environmental Variation Target Low High Max. Dev. CO (ppm) 150.0 ± 5 149.8 151.7 1.7 O2 (%) 20.9 ± 1 20.8 20.8 0.1 Temp (F) 73.4 ± 5 73.2 73.6 0.2 Relative Humidity (%) 50.0 ± 20 49.3 51.0 1.0
65
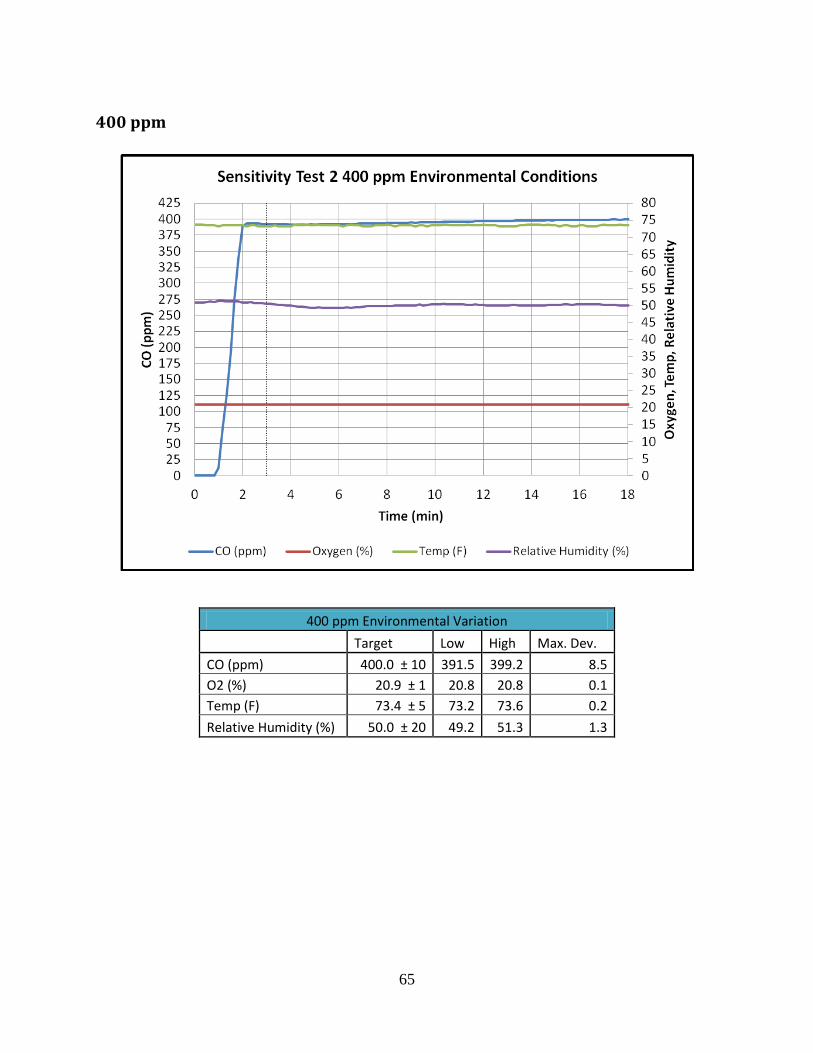
400 ppm
400 ppm Environmental Variation Target Low High Max. Dev. CO (ppm) 400.0 ± 10 391.5 399.2 8.5 O2 (%) 20.9 ± 1 20.8 20.8 0.1 Temp (F) 73.4 ± 5 73.2 73.6 0.2 Relative Humidity (%) 50.0 ± 20 49.2 51.3 1.3

66
Rapid Rate of Rise
RRR Environmental Variation Target Low High Max. Dev. CO (ppm)* 480.0 ± 15 470.0 476.3 10.0 O2 (%) 20.9 ± 1 20.8 20.8 0.1 Temp (F) 73.4 ± 5 73.2 73.6 0.2 Relative Humidity (%) 50.0 ± 20 49.1 50.8 0.9
*Average Rate of Rise: 15.60 ppm/min

67
Short Refresh Sensitivity Test 3: Samples E and F
Activation Times (min) Sample No. 70 ppm 150 ppm 400 ppm RRR 60-240 10-50 4-15 19-30 E1 163.33 4.65 4.43 12.00 E2 160.37 29.25 4.43 12.93 E3 164.38 7.25 3.98 13.75 E4 164.38 4.78 4.47 12.20 E5* N/A* 13.78 4.40 14.58 E6 84.30 5.85 5.00 12.58 E7** 168.50** 15.12 4.17 13.92 E8 164.20 4.55 4.23 12.75 E9 163.83 4.78 4.58 12.33 E14 82.92 4.27 4.25 11.03 E15 164.42 4.68 4.10 13.07 E12 95.58 4.50 4.43 11.53 F1 85.83 32.45 5.83 16.70 F2 82.20 25.33 4.28 14.50 F3 81.50 31.65 5.73 15.25 F13 84.62 32.72 6.55 15.92 F5 84.75 31.45 6.08 14.12 F6 34.67 11.52 3.47 11.05 F14 34.57 7.37 2.27 11.05 F8 79.25 25.25 4.53 14.92 F9 69.58 16.92 2.93 13.15 F10 82.25 25.35 4.28 15.72 F11 86.58 27.27 5.27 15.25 F12 84.03 25.25 3.93 12.58
- Red indicates failure. *Did not activate. **Did not continue to annunciate for the duration of the test, after activation.

68
70 ppm
70 ppm Environmental Variation Target Low High Max. Dev. CO (ppm) 70.0 ± 5 68.0 70.3 2.0 O2 (%) 20.9 ± 1 20.8 20.8 0.1 Temp (F) 73.4 ± 5 73 73.6 0.4 Relative Humidity (%) 50.0 ± 20 49.3 50.8 0.8

69
150ppm
150 ppm Environmental Variation Target Low High Max. Dev. CO (ppm) 150.0 ± 5 149.8 152.9 2.9 O2 (%) 20.9 ± 1 20.8 20.9 0.1 Temp (F) 73.4 ± 5 73.2 73.6 0.2 Relative Humidity (%) 50.0 ± 20 49.1 51.5 1.5
70
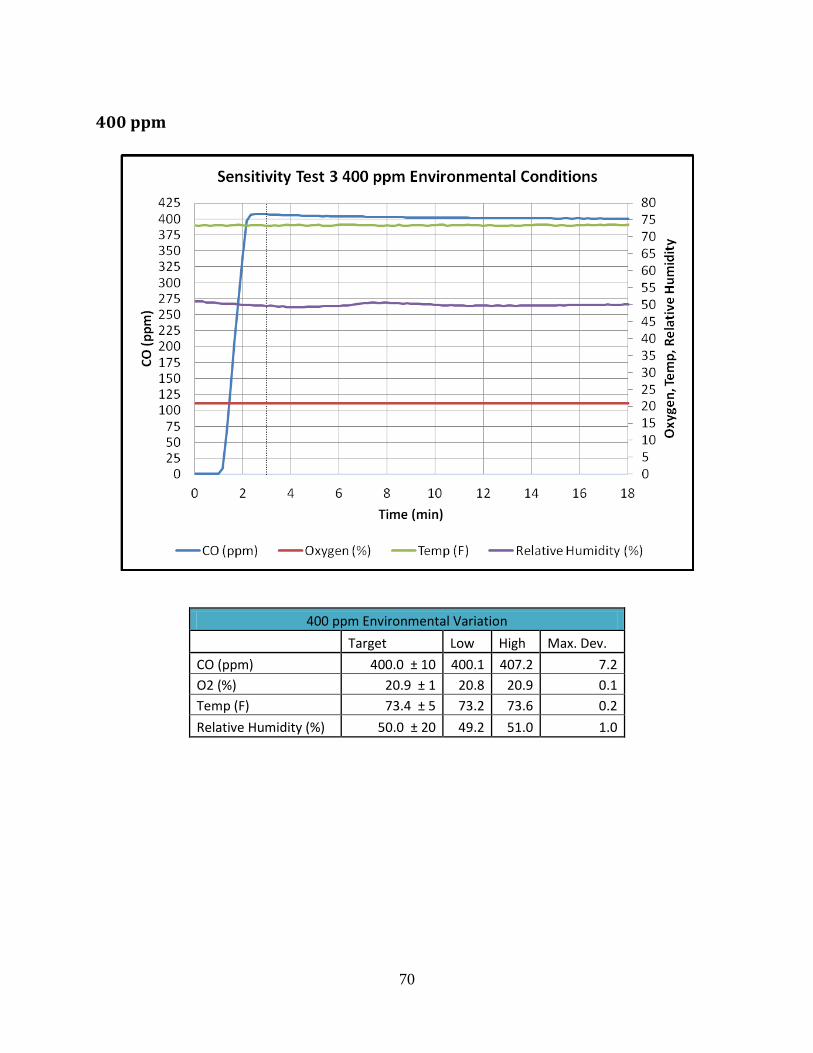
400 ppm
400 ppm Environmental Variation Target Low High Max. Dev. CO (ppm) 400.0 ± 10 400.1 407.2 7.2 O2 (%) 20.9 ± 1 20.8 20.9 0.1 Temp (F) 73.4 ± 5 73.2 73.6 0.2 Relative Humidity (%) 50.0 ± 20 49.2 51.0 1.0

71
Rapid Rate of Rise
RRR Environmental Variation Target Low High Max. Dev. CO (ppm)* 480.0 ± 15 468.2 493.6 13.6 O2 (%) 20.9 ± 1 20.8 20.9 0.1 Temp (F) 73.4 ± 5 73.2 73.6 0.2 Relative Humidity (%) 50.0 ± 20 49.7 51.0 1.0
*Average Rate of Rise: 15.25 ppm/min

72
Short Refresh Sensitivity Test Analysis The environmental conditions for all UL 2034, Section 39 Sensitivity testing were within the required specifications. The required environmental conditions for this test set are 73.4 °F ± 5 °F, 50 % ± 20 % relative humidity, and 20.9 % ± 1 % Oxygen concentration. Carbon monoxide concentration requirements, including establishing the desired concentrations within 3 minutes were achieved. The tables and charts above show the performance of the alarms and the conditions during testing.
Sample Set A Sample Set A alarmed within the time interval for the 70 ppm concentration, but failed to alarm within the required times for the 150 ppm, 400 ppm, and Rapid Rate of Rise concentrations for all 12 samples. In each case of failure, all alarms activated prematurely.
Sample Set B Sample Set B performed the same as Sample Set A. The alarms activated within the time interval required for 70 ppm, but activated early for 150 ppm, 400 ppm, and the Rapid Rate of Rise concentration.
Sample Set C Sample Set C alarmed within the required time interval for each concentration for all samples. This sample demonstrates complete conformance to the requirements tested.
Sample Set D Sample Set D performed identically to Sample Set C. All alarms activated within the specified time interval and displayed complete conformance to the requirements tested.
Sample Set E Sample Set E had 11 of 12 alarms activated within the required time interval for the 70 ppm CO concentration. One alarm did not activate for the duration of the test (240 minutes). A second alarm did not continue to signal after activating from the 70 ppm concentration. Three of 12 alarms activated within the time interval specified for 150 ppm CO. All nine alarms that failed activated early.
73
Eleven of 12 alarms in Sample Set E activated within the time interval specified for a 400 ppm CO concentration. The one failure activated early by only 1 second (3.98 minutes or approximately 3 minutes 59 seconds). All samples for Sample Set E failed to activate between the required 19−30-minute interval for the Rapid Rate of Rise test. All alarms activated early, with an average activation time of 12.72 minutes (12 minutes 43 seconds). The average injection rate for this test was 15.25 ppm/min. The approximate concentration at which the alarms activated during the Rapid Rate of Rise test was 194 ppm CO.
Sample Set F Sample Set F alarmed within the required time interval for 70 ppm CO for all samples. Eleven of 12 alarms activated within the required time interval for 150 ppm CO. The only failure during the 150 ppm CO concentration was an early activation. Eight of the 12 samples activated within the time constraint for 400 ppm CO. The four failures at 400 ppm CO were due to premature activation. All alarms activated early during the Rapid Rate of Rise test. The average time of activation was 14.18 minutes (14 minutes 11 seconds). The approximate concentration at which the alarms activated during the Rapid Rate of Rise test was 216 ppm CO.

74
Short Refresh Sensitivity Test Summary
UL 2034 Section 39 Sensitivity Summary Performance Chart 70 ppm 150 ppm 400 ppm Rapid Rate of Rise Sample # Pass % Pass # Pass % Pass # Pass % Pass # Pass % Pass A 12 100 0 0 0 0 0 0 B 12 100 0 0 0 0 0 0 C 12 100 12 100 12 100 12 100 D 12 100 12 100 12 100 12 100 E 11* 92 3 25 11 92 0 0 F 12 100 11 92 8 67 0 0 Average 71* 99 % 38 53 % 43 60 % 24 33 % * One alarm out of the 11 that activated for 70 ppm CO in Sample Set E did not continue to alarm for the duration of the test. Of the samples tested with short refresh times, 33 percent met all of the requirements that were evaluated. Ninety-nine percent of the alarms tested activated within the required time interval for 70 ppm CO. Fifty-three percent of the alarms tested activated within the required time interval for 150 ppm CO. Sixty percent of the alarms tested activated within the required time interval for 400 ppm CO. Thirty-three percent of the alarms tested activated within the required time interval for the Rapid Rate of Rise test. One hundred fifteen of the 116 failures were due to premature activation and only one did not activate. Short refresh periods affect the performance of the alarms during subsequent testing.