C:N:P stoichiometry at the Bermuda Atlantic Time-series ...
15
Biogeosciences, 12, 6389–6403, 2015 www.biogeosciences.net/12/6389/2015/ doi:10.5194/bg-12-6389-2015 © Author(s) 2015. CC Attribution 3.0 License. C : N : P stoichiometry at the Bermuda Atlantic Time-series Study station in the North Atlantic Ocean A. Singh 1,2 , S. E. Baer 3 , U. Riebesell 2 , A. C. Martiny 4 , and M. W. Lomas 1,3 1 Bermuda Institute of Ocean Sciences, St. George’s, GE01, Bermuda 2 GEOMAR Helmholtz-Zentrum für Ozeanforschung Kiel, 24105 Kiel, Germany 3 Bigelow Laboratory for Ocean Sciences, East Boothbay, ME 04544, USA 4 University of California, Irvine, CA 92697, USA Correspondence to: M. W. Lomas ([email protected]) Received: 28 May 2015 – Published in Biogeosciences Discuss.: 19 June 2015 Revised: 30 September 2015 – Accepted: 23 October 2015 – Published: 9 November 2015 Abstract. Nitrogen (N) and phosphorus (P) availability, in addition to other macro- and micronutrients, determine the strength of the ocean’s carbon (C) uptake, and variation in the N : P ratio of inorganic nutrient pools is key to phyto- plankton growth. A similarity between C : N : P ratios in the plankton biomass and deep-water nutrients was observed by Alfred C. Redfield around 80 years ago and suggested that biological processes in the surface ocean controlled deep- ocean chemistry. Recent studies have emphasized the role of inorganic N : P ratios in governing biogeochemical pro- cesses, particularly the C : N : P ratio in suspended particulate organic matter (POM), with somewhat less attention given to exported POM and dissolved organic matter (DOM). Herein, we extend the discussion on ecosystem C : N : P stoichiome- try but also examine temporal variation in stoichiometric re- lationships. We have analyzed elemental stoichiometry in the suspended POM and total (POM + DOM) organic-matter (TOM) pools in the upper 100 m and in the exported POM and subeuphotic zone (100–500 m) inorganic nutrient pools from the monthly data collected at the Bermuda Atlantic Time-series Study (BATS) site located in the western part of the North Atlantic Ocean. C : N and N : P ratios in TOM were at least twice those in the POM, while C : P ratios were up to 5 times higher in TOM compared to those in the POM. Ob- served C : N ratios in suspended POM were approximately equal to the canonical Redfield ratio (C : N : P = 106 : 16 : 1), while N : P and C : P ratios in the same pool were more than twice the Redfield ratio. Average N : P ratios in the sub- surface inorganic nutrient pool were ∼ 26 : 1, squarely be- tween the suspended POM ratio and the Redfield ratio. We have further linked variation in elemental stoichiometry to that of phytoplankton cell abundance observed at the BATS site. Findings from this study suggest that elemental ratios vary with depth in the euphotic zone, mainly due to differ- ent growth rates of cyanobacterial cells. We have also ex- amined the role of the Arctic Oscillation on temporal pat- terns in C : N : P stoichiometry. This study strengthens our understanding of the variability in elemental stoichiometry in different organic-matter pools and should improve biogeo- chemical models by constraining the range of non-Redfield stoichiometry and the net relative flow of elements between pools. 1 Introduction Nitrogen (N) and phosphorus (P) are critical elements that control primary production in large portions of the surface ocean. Traditionally, N is considered a proximate and P is an ultimate limiting nutrient in surface waters (Tyrrell, 1999), but primary production in the North Atlantic Ocean has been suggested to be P stressed (Wu et al., 2000; Karl et al., 2001; Sañudo-Wilhelmy et al., 2001; Lomas et al., 2010). Alfred C. Redfield first noted the similarity between N : P ra- tios in surface ocean particulate organic matter (POM) and in deep-water inorganic nutrients; this observation was further extended to include carbon (Redfield, 1934). Oceanographic studies have consistently found mean plankton biomass to adhere to the Redfield ratio (C : N : P = 106 : 16 : 1; Redfield, 1958; Copin-Montegut and Copin-Montegut, 1983; Geider Published by Copernicus Publications on behalf of the European Geosciences Union.
Transcript of C:N:P stoichiometry at the Bermuda Atlantic Time-series ...

Biogeosciences, 12, 6389–6403, 2015
www.biogeosciences.net/12/6389/2015/
doi:10.5194/bg-12-6389-2015
© Author(s) 2015. CC Attribution 3.0 License.
C : N : P stoichiometry at the Bermuda Atlantic Time-series Study
station in the North Atlantic Ocean
A. Singh1,2, S. E. Baer3, U. Riebesell2, A. C. Martiny4, and M. W. Lomas1,3
1Bermuda Institute of Ocean Sciences, St. George’s, GE01, Bermuda2GEOMAR Helmholtz-Zentrum für Ozeanforschung Kiel, 24105 Kiel, Germany3Bigelow Laboratory for Ocean Sciences, East Boothbay, ME 04544, USA4University of California, Irvine, CA 92697, USA
Correspondence to: M. W. Lomas ([email protected])
Received: 28 May 2015 – Published in Biogeosciences Discuss.: 19 June 2015
Revised: 30 September 2015 – Accepted: 23 October 2015 – Published: 9 November 2015
Abstract. Nitrogen (N) and phosphorus (P) availability, in
addition to other macro- and micronutrients, determine the
strength of the ocean’s carbon (C) uptake, and variation in
the N : P ratio of inorganic nutrient pools is key to phyto-
plankton growth. A similarity between C : N : P ratios in the
plankton biomass and deep-water nutrients was observed by
Alfred C. Redfield around 80 years ago and suggested that
biological processes in the surface ocean controlled deep-
ocean chemistry. Recent studies have emphasized the role
of inorganic N : P ratios in governing biogeochemical pro-
cesses, particularly the C : N : P ratio in suspended particulate
organic matter (POM), with somewhat less attention given to
exported POM and dissolved organic matter (DOM). Herein,
we extend the discussion on ecosystem C : N : P stoichiome-
try but also examine temporal variation in stoichiometric re-
lationships. We have analyzed elemental stoichiometry in the
suspended POM and total (POM + DOM) organic-matter
(TOM) pools in the upper 100 m and in the exported POM
and subeuphotic zone (100–500 m) inorganic nutrient pools
from the monthly data collected at the Bermuda Atlantic
Time-series Study (BATS) site located in the western part of
the North Atlantic Ocean. C : N and N : P ratios in TOM were
at least twice those in the POM, while C : P ratios were up to
5 times higher in TOM compared to those in the POM. Ob-
served C : N ratios in suspended POM were approximately
equal to the canonical Redfield ratio (C : N : P= 106 : 16 : 1),
while N : P and C : P ratios in the same pool were more than
twice the Redfield ratio. Average N : P ratios in the sub-
surface inorganic nutrient pool were ∼ 26 : 1, squarely be-
tween the suspended POM ratio and the Redfield ratio. We
have further linked variation in elemental stoichiometry to
that of phytoplankton cell abundance observed at the BATS
site. Findings from this study suggest that elemental ratios
vary with depth in the euphotic zone, mainly due to differ-
ent growth rates of cyanobacterial cells. We have also ex-
amined the role of the Arctic Oscillation on temporal pat-
terns in C : N : P stoichiometry. This study strengthens our
understanding of the variability in elemental stoichiometry
in different organic-matter pools and should improve biogeo-
chemical models by constraining the range of non-Redfield
stoichiometry and the net relative flow of elements between
pools.
1 Introduction
Nitrogen (N) and phosphorus (P) are critical elements that
control primary production in large portions of the surface
ocean. Traditionally, N is considered a proximate and P is an
ultimate limiting nutrient in surface waters (Tyrrell, 1999),
but primary production in the North Atlantic Ocean has been
suggested to be P stressed (Wu et al., 2000; Karl et al.,
2001; Sañudo-Wilhelmy et al., 2001; Lomas et al., 2010).
Alfred C. Redfield first noted the similarity between N : P ra-
tios in surface ocean particulate organic matter (POM) and in
deep-water inorganic nutrients; this observation was further
extended to include carbon (Redfield, 1934). Oceanographic
studies have consistently found mean plankton biomass to
adhere to the Redfield ratio (C : N : P= 106 : 16 : 1; Redfield,
1958; Copin-Montegut and Copin-Montegut, 1983; Geider
Published by Copernicus Publications on behalf of the European Geosciences Union.

6390 A. Singh et al.: C : N : P stoichiometry at the Bermuda Atlantic Time-series
and La Roche, 2002), and since then this ratio has become
a fundamental tenet in marine biogeochemistry. Deviations
from the canonical ratio have been used to provide insights
into phytoplankton physiology (Goldman et al., 1979; Quigg
et al., 2003), nutrient limitation of primary production (e.g.,
Falkowski and Raven, 1997; Moore et al., 2013), efficiency
of biological carbon sequestration in the ocean (Sigman and
Boyle, 2000) and the input–output balance of the marine
N cycle (e.g., Gruber and Sarmiento, 1997). Geochemists
use the Redfield conceptual model to determine the state of
the marine N cycle using the N∗ proxy (e.g., Gruber and
Sarmiento, 1997). In the context of this proxy, subsurface
nutrient N : P ratios > 16 : 1 suggest net nitrogen gain, while
ratios < 16 : 1 suggest net nitrogen loss (e.g., Gruber and
Deutsch, 2014). However, this relatively simple point of view
has been shown to yield N2 fixation rates that are overes-
timated by up to 4 times when compared to directly mea-
sured rates (Mills and Arrigo, 2010). In part, this overesti-
mation is due to the production and sedimentation of non-
N2 fixer biomass that can occur at ratios much greater than
the Redfield ratio, particularly in the subtropical and tropical
oceans (Singh et al., 2013; Martiny et al., 2013; Teng et al.,
2014). Furthermore, an ocean circulation model has shown
that the N : P ratio of biological nutrient removal varies ge-
ographically, from 12 : 1 in the polar ocean to 20 : 1 in the
subantarctic zone, regions where N2 fixation is not thought
to be important (Weber and Deutsch, 2010). With a better
understanding of N cycle processes, the validity of the Red-
field model for nutrient uptake has been questioned (Sañudo-
Wilhelmy et al., 2004; Mills and Arrigo, 2010; Zamora et al.,
2010).
Biologically speaking, a fixed N : P ratio, like the Redfield
ratio, would suggest that nutrients are taken up in that ra-
tio during the production of new organic matter (Redfield,
1958; Lenton and Watson, 2000). This conceptual model has
been challenged by the fact that the variability in nutrient
requirements is related to the functioning and evolution of
microbes (Arrigo, 2005). The N : P ratio in phytoplankton
need not be in the canonical ratio and can vary widely from
coastal upwelling to transitional to oligotrophic regions of
the ocean. The observed ratio varies with taxa and growth
conditions (Arrigo et al., 1999; Quigg et al., 2003; Klaus-
meier et al., 2004). For example, it has been shown that non-
Redfield nutrient utilization is common during blooms (Ar-
rigo et al., 1999) and in regions dominated by cyanobacteria
(Martiny et al., 2013). The N : P ratio of Synechococcus and
Prochlorococcus, small and abundant phytoplankton cells in
the open ocean, varies from 13.3 to 33.2 and 15.9 to 24.4,
respectively, during exponential growth, while the ratio can
be as high as 100 during PO3−4 -limited growth (Bertilsson et
al., 2003; (Heldal et al., 2003). Another cyanobacteria, the
N2 fixer Trichodesmium has an N : P ratio that varies from 42
to 125 (Karl et al., 1992), while in general diatoms have a
ratio of ∼ 11 : 1 (Quigg et al., 2003; Letelier and Karl, 1996;
Mahaffey et al., 2005). Excess downward dissolved organic
nitrogen (DON) fluxes relative to NO−3 are associated with
Trichodesmium abundance (Vidal et al., 1999). Thus the rela-
tive abundance of different phytoplankton functional groups
may lead to coupling of N and P cycles in non-Redfieldian
proportions.
Considerable effort has been made to understand the vari-
ability and controls on the N : P ratio in the dissolved in-
organic nutrient pool (e.g., Gruber and Sarmiento, 1997;
Pahlow and Riebesell, 2000; Arrigo, 2005). In contrast, anal-
ysis of C : N : P ratios, in particulate organic matter (POM)
and dissolved organic matter (DOM), are more scarce (Karl
et al., 2001; Letscher et al., 2013). The C : N : P ratio, how-
ever, has great relevance in oceanography, as it connects the
“currency” of the ocean, i.e., carbon, to some of its control-
ling variables (N and P). Here, we present a detailed analy-
sis of C : N : P stoichiometry of POM and TOM along with
N : P stoichiometry of dissolved inorganic nutrients at the
Bermuda Atlantic Time-series Study (BATS) for an 8-year
period. The observed ratios are correlated with and discussed
in the context of co-measured biological parameters such
as cell abundances of different phytoplankton groups and
chlorophyll a. The goal of this study was to quantitatively
assess C : N : P ratios in all (POM, TOM and inorganic nutri-
ents) the pools and the ratios’ deviations from the Redfield
ratio, and relationships to biogeochemical cycling.
2 Methods
2.1 Data availability
Since 1988, the BATS site, located in the western subtropical
North Atlantic Ocean (31◦40′ N, 64◦10′W), has provided a
relatively unique time-series record of nutrient biogeochem-
ical cycles. However, data on total organic C (TOC), total
organic N (TON) and total organic P (TOP) and on partic-
ulate organic C (POC), particulate organic N (PON), and
particulate organic P (POP) have only been collected con-
currently since 2004. These data were collected from seven
different depths (5, 10, 20, 40, 60, 80 and 100 m) over the
euphotic zone. We obtained these data from the BATS web-
site (bats.bios.edu) and analyzed the data record from 2004
to 2012.
2.2 Analytical methods
Samples for nitrate (NO−3 ) and phosphate (PO3−4 ) were grav-
ity filtered (0.8 µm) and frozen (-20◦C) in HDPE bottles until
analysis (Dore et al., 1996). NO−3 and PO3−4 were measured
using a Technicon autoanalyser with an estimated inaccu-
racy of ∼ 0.12 and 0.02 µmol kg−1, respectively (Bates and
Hansell, 2004). The Magnesium Induced Co-precipitation
(MAGIC) soluble reactive P (SRP) method (Karl and Tein,
1997) was used starting in late 2004 to improve both the
sensitivity and the accuracy of the inorganic PO3−4 analysis
(Lomas et al., 2010). POC and PON samples were filtered
Biogeosciences, 12, 6389–6403, 2015 www.biogeosciences.net/12/6389/2015/

A. Singh et al.: C : N : P stoichiometry at the Bermuda Atlantic Time-series 6391
Figure 1. Monthly BATS data on C, N and P in total and particulate organic matter in the top 100 m from January 2004 to April 2012.
on pre-combusted (450 ◦C, 4 h) Whatman GF/F filters (nom-
inal pore size 0.7 µm) and frozen (−20 ◦C) until analysis on
a Control Equipment 240-XA or 440-XA elemental analyzer
(Steinberg et al., 2001; Lomas et al., 2013). POP was ana-
lyzed using the ash-hydrolysis method with oxidation effi-
ciency and standard recovery checks (Lomas et al., 2010).
TOC and TON concentrations were determined using high-
temperature combustion techniques (Carlson et al., 2010).
Total P (TP) concentrations were quantified using a high-
temperature persulfate oxidation technique and TOP calcu-
lated by subtraction of the MAGIC-SRP value (Lomas et al.,
2010). Ideally, DOM concentrations would have been esti-
mated by subtracting POM from its total organic concen-
trations, e.g., [DOC]= [TOC]− [POC], but we did not have
paired TOC (and TON) and POC (and PON) values; corre-
sponding POC (and PON) values were taken at slightly dif-
ferent depths but on the same sampling day. Nevertheless,
subtraction would not have had a substantial impact because,
on average, POC and PON values in the upper 100 m were
< 4 % of TOC and TON, respectively (Fig. 1). Both the ac-
curacy and precision of dissolved organic compound concen-
trations decrease with depth as concentrations of inorganic
nutrients increase to dominate the total pools.
Chlorophyll a pigments were analyzed by HPLC using the
method of van Heukelem and Thomas (2001). Samples for
flow cytometric enumeration of pico- and nanoplankton were
collected on each cruise and analyzed as described in Lomas
et al. (2013). Export fluxes of POC, PON and POP were es-
timated using surface-tethered particle interceptor traps de-
ployed at a depth of 200 m as described in previous publica-
tions (Lomas et al., 2010; Steinberg et al., 2001). Elemental
masses of material captured in sediment traps, trap collection
surface area and deployment length were used to calculate
fluxes (see Lomas et al., 2013, for a more detailed methodol-
ogy on all the described parameters Sect. 2, “Methods”).
2.3 Data processing
Our POM and TOM analysis was restricted to the upper
100 m, which also reflects the approximate mean depth of
the euphotic zone at BATS (Siegel et al., 2001) and the zone
where nutrients are depleted to near analytical detection. All
data presented as elemental ratios are in mol per mol units.
Mixed layer depth was defined as a 0.125 kg m−3 difference
in seawater density from the surface (Gardner et al., 1995).
While mixed layer depths (MLDs) were always deepest dur-
ing winter, the exact timing of the deepest mixing shifted be-
tween years. For example, during 2005, the MLD was deep-
est in March, while it was deepest during February in 2006
(Fig. 3). Therefore, when presenting data on an annual cycle,
we aligned our data to the measured timing of deep mixing
in each year and combined all the data to a single 12-month
composite (e.g., Carlson et al., 2009). Generally the mixed
layer depth was no deeper than ∼ 25 m in summer; thus, we
used this depth range (0–25 m) to represent the “surface” data
and present our analysis in two depth bins: 0–25 and 25–
100 m.
www.biogeosciences.net/12/6389/2015/ Biogeosciences, 12, 6389–6403, 2015

6392 A. Singh et al.: C : N : P stoichiometry at the Bermuda Atlantic Time-series
Figure 2. Monthly stoichiometry during 2004–2010 at 0–100 m. Solid lines are 3-month running means. Error bars are 1σ from the mean
values.
3 Results
We present time-series data of chemical constituents in
POM and TOM pools (Fig. 1). We further calculated depth-
averaged ratios of the chemical constituents. We first cal-
culated the average concentration of each element over the
depth segment (e.g., 0–25 m) and then calculated the ratios
based upon those averages. Over the entire length of the time
series, euphotic zone TON : TOP ratios varied between 34
and 130 (Fig. 2a), while TOC : TOP ratios varied between
450 and 1952 (Fig. 2b) and TOC : TON varied between 11
and 17 (Fig. 2c).
Suspended euphotic zone PON : POP ratios were gener-
ally lower than TON : TOP ratios (Fig. 2, Table 1). The
PON : POP ratio ranged from 7 to 140. Similarly POC : POP
ratios were much lower than TOC : TOP, varying from 45 to
532. The POC : PON ratio ranged between 1 and 19. Elemen-
tal ratios in TOM and POM were significantly greater than
the Redfield ratio (p < 0.05; z test) with the exception of the
POC : PON ratio.
3.1 Annual patterns
3.1.1 Concentrations of POM and TOM
There were annual oscillations in POM pools in the up-
per 100 m (Fig. 1). TOC also showed annual oscilla-
tions; however, TON concentrations were relatively con-
stant throughout the study period. The pattern of TOP
showed an increasing trend from early 2007 until early
2008 (TOP= 0.0936× decimal year− 187.8; r2= 0.77, p
< 0.05). However, there were no long-term sustained
changes in the concentration of POM and TOM.
Biogeosciences, 12, 6389–6403, 2015 www.biogeosciences.net/12/6389/2015/

A. Singh et al.: C : N : P stoichiometry at the Bermuda Atlantic Time-series 6393
Figure 3. Mixed layer depth (MLD) during the sampling period at the BATS site.
3.1.2 C : N : P ratios in POM and TOM
There were no discernible year-to-year trends in the POM
stoichiometry (Fig. 2). The amplitude of variation in the
C : N : P ratios of POM was less than that in those of TOM.
TON : TOP and TOC : TOP ratios showed a decreasing trend
throughout the year 2007 (r2= 0.46, p< 0.05), which was
due to an increasing trend in TOP concentration in that year
(Fig. 1). There was no annual trend in the TOC : TON ratio.
Overall, like POM and TOM concentration patterns, there
were no long-term sustained changes in TOC : N : P ratios.
3.2 Seasonal variations
3.2.1 Concentrations of POM and TOM
There was greater variability in C and N pools in the 0–25 m
range compared to that in the 25–100 m range (Figs. 4 and
5). In the 0–25 m depth range, TOC showed an increasing
trend after deep mixing during the following 5 months be-
fore reaching a plateau (∼ 67 µmol kg−1). POC increased in
the first month after deep mixing and then decreased during
the next 2 months and remained constant (∼ 2 µmol kg−1)
for the rest of the year (Fig. 4a). The pattern in PON was
similar to POC, while those in TON and TOC were opposite
to each other during the first 2 months after mixing and then
increased until the sixth month (Fig. 4a, b). These higher val-
ues of TOC and TON (observed in both the 0–25 and the 25–
100 m depth segments) in the sixth month might be attributed
to the higher occurrence of Trichodesmium colonies during
August at BATS (Orcutt et al., 2001; Singh et al., 2013). TOP
and POP increased during and 1 month after the deep mix-
ing in the 0–25 m depth range (Fig. 4c). Some of these trends
(e.g., higher values of TOC and TON in the sixth month)
were also apparent in the 25–100 m depth range but were not
as prominent as in the 0–25 m depth range (Figs. 4 and 5).
3.2.2 C : N : P ratios in POM and TOM
TON : TOP (68± 9) and PON : POP (36± 11) values were
greater than the Redfield ratio (p < 0.05) (Table 1). Pat-
terns in the TOC : TOP and TON : TOP ratio, on the one
hand, and in POC : POP and PON : POP, on the other, were
similar to each other (Fig. 6a, b). TOC : TOP (983± 168)
and POC : POP (210± 67) values were much higher than
the Redfield ratio of 106 (p< 0.05). TOC : TON (15± 0.5)
increased for the 2 months following deep mixing and de-
creased until the seventh month (Fig. 6c). POC : PON (6± 3)
increased in the month after deep mixing but remained
around the Redfield ratio throughout the year. Minimal vari-
ability in concentration and ratios in the 25–100 m depth
range suggests confinement of the more dynamic biogeo-
chemical processes to within the mixed layer, i.e., to within
0–25 m (Figs. 5 and 7).
3.2.3 N : P ratios in inorganic nutrients
The average NO−3 : PO3−4 ratio was 25.6± 9.1 in the 100–
500 m depth range at BATS, which is greater than the Red-
field ratio (Table 1). We excluded data from the top 100 m in
this analysis due to low precision relative to the mean nutrient
values, which are at or near analytical detection limits due to
active biological uptake. NO−3 and PO3−4 were at their high-
est concentrations before deep mixing and decreased imme-
diately following the month of deepest mixing and remained
constant for the rest of the year (Fig. 8). The decrease in NO−3and PO3−
4 concentrations was likely due to dilution with low-
nutrient surface water during mixing.
3.2.4 N : P ratios in the particulate flux at 200 m
The PON fluxes increased during and peaked immediately
after winter mixing, while POP fluxes showed elevated val-
ues before and shortly after the time of deep mixing (Fig. 8).
The N : P ratio of export fluxes was nearly twice that of the
www.biogeosciences.net/12/6389/2015/ Biogeosciences, 12, 6389–6403, 2015

6394 A. Singh et al.: C : N : P stoichiometry at the Bermuda Atlantic Time-series
Figure 4. Box–whisker plot comparing the annual concentrations of total (open bars) and particulate organic matter (filled bars) relative to
the deep mixing at a depth of 0–25 m at BATS (data used are from January 2005 to December 2011). Bottom and top of the box define the
25 and 75 % data distribution, and the error bars define the 5 and 95 % data distribution. The dark gray vertical bar represents the period of
deep mixing (DM) for each year.
PON : POP ratio in the suspended matter (upper 100 m; Ta-
ble 1).
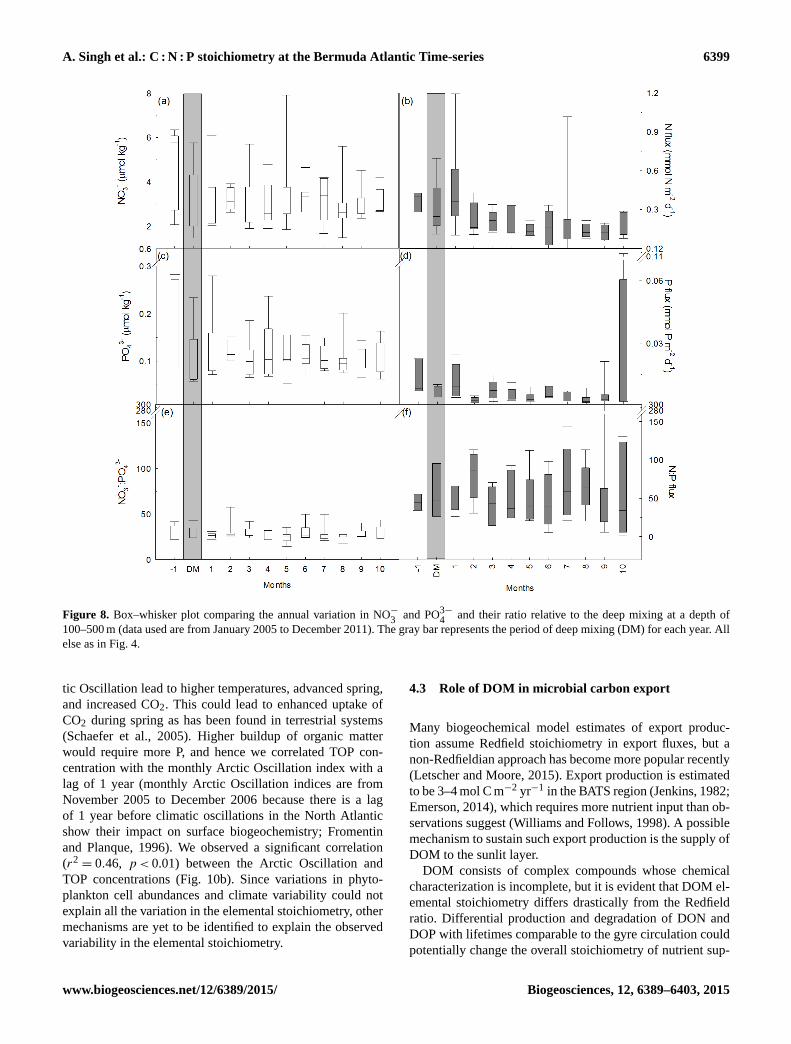
3.2.5 Chlorophyll a and phytoplankton cell abundance
Chlorophyll a values decreased after the spring bloom that
was stimulated by deep mixing (Fig. 9a). Prochlorococcus
was dominant during the oligotrophic period of the year,
while these were least abundant around the time of deep mix-
ing (Fig. 9b). In contrast, Synechococcus and picoeukary-
otes were more abundant during the more productive season
(Fig. 9c,d) and followed the annual pattern in chlorophyll a.
There was no discernible seasonal pattern in nanoeukaryote
abundance (Fig. 9e).
4 Discussion
From the approximately 8 years of BATS data presented
here, it is apparent that the total and particulate-organic mat-
ter C : N : P stoichiometries are not a long-term fixed ecosys-
tem property but vary seasonally and deviate substantially
from the canonical Redfield ratio. Observed C : N : P ratios
in TOM and POM were much greater than the Redfield ra-
tio, averaging 983 : 68 : 1 and 210 : 36 : 1, respectively, for the
entire data set (Figs. 2, 4, 5).
4.1 Connections among POM, TOM and inorganic
nutrients
Redfield hypothesized what was effectively a two-box model
of nutrients shuttling between particulate and dissolved
forms. However, there are a number of different biological,
Biogeosciences, 12, 6389–6403, 2015 www.biogeosciences.net/12/6389/2015/

A. Singh et al.: C : N : P stoichiometry at the Bermuda Atlantic Time-series 6395
Figure 5. Box–whisker plot comparing the annual concentrations of total (open bars) and particulate (filled bars) matter relative to the deep
mixing at a depth of 25–100 m (data used are from January 2005 to December 2011). All else as in Fig. 4.
chemical and physical processes acting on particles as they
settle throughout the water column. Higher N : P ratios in the
particulate fluxes than in the suspended matter could be due
to the preferential export of N or to preferential remineraliza-
tion of P, but similar C : N ratios in the fluxes and suspended
matter would lend more support to the latter scenario (Figs. 4,
8; Table 1; Monteiro and Follows, 2012). The N : P ratio of
export fluxes was also generally more than twice that of the
dissolved NO−3 : PO3−4 ratio at depth (Fig. 8c). The prefer-
ential remineralization of P from settling material could po-
tentially explain this difference, as there is little evidence
for N loss in this well-oxygenated region; however the ad-
vective flux of low-NO−3 : PO3−4 waters needs to be consid-
ered. Indeed, the literature indicates that subeuphotic waters
at BATS are a mixture of water which originated to the north
of the site, which has characteristically low NO−3 : PO3−4 ra-
tios (Bates and Hansell, 2004; Singh et al., 2013). The pro-
cesses of remineralization are not direct from particulate to
inorganic pools, and, indeed, cycling through the dissolved
organic pool, which dominates TOM, is important. One ex-
planation for the TON : TOP ratio being greater than the Red-
field ratio is that TON is less reactive than TOP and broken
down mainly in the subsurface layer (Letscher et al., 2013),
while TOP is labile or semi-labile and both remineralized
and assimilated at a shallower depth (Björkman et al., 2000).
Consequently, TOP has faster turnover times (Clark et al.,
1998). In contrast to this interpretation, our observations sug-
gest that TON and TOP values increase slightly with depth,
suggesting a net (i.e., remineralization exceeding assimila-
tion) flow of material from the particulate organic pool to the
dissolved organic pool for both elements (comparing data in
Figs. 4 and 5).
Our results on the TON : TOP ratio have important impli-
cations for the ocean biogeochemistry of oligotrophic wa-
ters where dissolved organic nitrogen (DON) and phosphorus
(DOP) concentrations in the sunlit layers exceed the concen-
tration of inorganic nutrients by 1 order of magnitude. Dis-
solved organic pools are essential in sustaining phytoplank-
www.biogeosciences.net/12/6389/2015/ Biogeosciences, 12, 6389–6403, 2015

6396 A. Singh et al.: C : N : P stoichiometry at the Bermuda Atlantic Time-series
Table 1. Average concentration (µmol kg−1), molar ratio of various biogeochemical parameters and particle fluxes (mmol m2 d−1) from the
BATS data presented in Fig. 1.
Concentration (C) in the upper 100 m
Parameter C± σ a No. of samples Sampling period
TOC 63.81± 2.86 714 January 2004–December 2011
TON 4.43± 0.50 712 January 2004–December 2011
TOP 0.07± 0.03 547 June 2004–November 2011
POC 2.36± 1.14 844 January 2004–April 2012
PON 0.40± 0.19 845 January 2004–April 2012
POP 0.01± 0.01 696 January 2004–April 2012
Ratio (R)b in the upper 100 m
Parameter R± σ No. of data pointsc Sampling period
TOC : TON 15± 0.5 86 July 2004–December 2011
POC : PON 6± 3 95 January 2004–April 2012
TON : TOP 68± 9 77 July 2004–November 2011
PON : POP 36± 11 88 January 2004–April 2012
TOC : TOP 983± 168 78 July 2004–November 2011
POC : POP 210± 67 88 January 2004–April 2012
Inorganic nutrient stoichiometry in 100–500 m
Parameter (C or R)± σ No. of data points Sampling period
NO−3
2.74± 2.40 3425 October 1988–July 2012
PO3−4
0.11± 0.13 3405 October 1988–July 2012
NO−3
: PO3−4
25.6± 9.1 2415 October 1988–July 2012
Particle fluxes at 200 m
Parameter C± σ No. of samples Sampling period
C 1.68± 1.07 254 January 1989–December 2011
N 0.23± 0.16 254 January 1989–December 2011
P 0.008± 0.014 64 October 2005–December 2011
Ratio in particle fluxes at 200 m
Parameter R± σ No. of data points Sampling period
N : P 57± 46 61 October 2005–December 2011
C : P 287± 269 62 October 2005–December 2011
C : N 7.9± 2.8 252 January 1989–December 2011
a σ is standard deviation of the samples mentioned in next the column. b Ratios and their standard deviations are
derived from the monthly mean values; c one datum would be the mean of many values a particular month of the
concentration in the upper 100 m.
ton growth in these regions (Church et al., 2002; Williams
and Follows, 1998). Nutrient levels determine phytoplank-
ton growth and their stoichiometry (Klausmeier et al., 2004);
TON : TOP in the oligotrophic regions might be more rele-
vant to determine the optimal N : P stoichiometry of phyto-
plankton than the ratio of inorganic pools alone.
4.2 Linkages of concentrations and ratios of POM and
TOM to chlorophyll a and phytoplankton
We hypothesize that C : N : P ratios in the aggregated phyto-
plankton community itself change the elemental stoichiome-
try of the POM and TOM pools. The C : N : P ratio is differ-
ent in different phytoplankton communities, and their biolog-
ical uptake and degradation could potentially change the ele-
mental stoichiometry of the particulate and dissolved organic
matter. The C : N : P ratio varies geographically and its pat-
tern correlates with global variations in temperature, overall
Biogeosciences, 12, 6389–6403, 2015 www.biogeosciences.net/12/6389/2015/

A. Singh et al.: C : N : P stoichiometry at the Bermuda Atlantic Time-series 6397
Figure 6. Box–whisker plot comparing the annual ratios of elemental stoichiometry relative to the deep mixing at a depth of 0–25 m (data
used are from January 2005 to December 2011). All else as in Fig. 4.
nutrient concentrations and phytoplankton functional groups.
These latitudinal patterns in the C : N : P ratio have been at-
tributed to changes in phytoplankton community as polar
(colder) regions have a high abundance of diatoms with low
N : P and C : P ratios, in contrast to the directly measured high
elemental ratios in cyanobacteria from warmer regions (Mar-
tiny et al., 2013). So how and why does the C : N : P ratio vary
in phytoplankton communities? Two mechanisms could ex-
plain the variability in the C : N : P ratios in a phytoplankton
community. The first mechanism suggests that the taxonomic
composition of a phytoplankton community influences its el-
emental composition. Elemental ratios inside a cell are con-
trolled by growth strategies (Klausmeier et al., 2004) . Stud-
ies have reported low C : P and N : P ratios in fast-growing di-
atoms (e.g., Price, 2005), whereas slower-growing cyanobac-
teria have C : P and N : P ratios higher than the Redfield ratio
(Bertilsson et al., 2003; Martiny et al., 2013). More precisely,
it is not so much the growth rate that determines the differ-
ence but the machinery invested in nutrient acquisition versus
protein production.
The second mechanism links the nutrient supply ratio to
a taxonomically “hard-wired” cellular elemental ratio (Rhee,
1978). Chlorophyll a values were anticorrelated with TOC
values (r2= 0.76, p< 0.05). The gradual increase in chloro-
phyll a during the 4 months before deep mixing is due
to similar increase in MLD before deep mixing (Fig. 3),
which suggests that there may be an enhanced nutrient flux
into the upper layer well before deep mixing (e.g., Fawcett
et al., 2014). Prochlorococcus and Synechococcus profiles
were correlated to each other in the first 7 months from
the point of deepest mixing (r2= 0.58, p< 0.05), and there
was no relation in the rest of the year in the 0–25 m depth
range. Furthermore, Synechococcus cell abundance was cor-
related with POC (r2= 0.67, p< 0.05), PON (r2
= 0.47,
p< 0.05), POP (r2= 0.29, p< 0.05) and anticorrelated with
TOC values (r2= 0.72 p< 0.05) in the 0–25 m depth range.
Synechococcus is more abundant during the more produc-
www.biogeosciences.net/12/6389/2015/ Biogeosciences, 12, 6389–6403, 2015

6398 A. Singh et al.: C : N : P stoichiometry at the Bermuda Atlantic Time-series
Figure 7. Box–whisker plot comparing the annual ratios of elemental stoichiometry relative to the deep mixing at depth of 25–100 m (data
used are from January 2005 to December 2011). The gray bar represents the period of deep mixing (DM) for each year. All else as in Fig. 4.
tive season, whereas Prochlorococcus is dominant during the
highly oligotrophic part of the year. Such patterns are typ-
ically observed in many parts of the ocean. The seasonal
pattern of picoeukaryote abundance was similar to that of
Synechococcus (r2= 0.58, p< 0.05) and chlorophyll a(r2
=
0.81, p< 0.05). POC : PON : POP ratios in Prochlorococcus,
Synechococcus and picoeukaryote are 234 : 33 : 1, 181 : 33 : 1
and 118 : 15 : 1, respectively, at the BATS site (Martiny et al.,
2013, and Lomas et al., unpublished data), which clearly sug-
gests imprints of a mixture of Prochlorococcus and Syne-
chococcus on the observed POM stoichiometry presented
in Table 1. The biomass of Prochlorococcus, Synechococ-
cus and picoeukaryotes together contributes ∼ 40 % to the
POC pool (Casey et al., 2013) and ∼ 75 % to the PON pool
(Fawcett et al., 2011), with major contributions from each
group varying seasonally. Hence, variability in biological pa-
rameters could potentially explain a significant fraction of the
variability in the POM and TOM ratios but not all of it. So
what else drives the variability in the C : N : P ratios?
We analyzed trends in the TON : TOP and TOC : TOP ra-
tios for December 2006 to January 2008 data, along with
phytoplankton cell abundances for the top 100 m BATS data.
Since the variation in TON : TOP and TOC : TOP were due
to an increasing trend in TOP, we correlated TOP concentra-
tions with a lag of 3 months (there is a time lag between phy-
toplankton and elemental abundance, as observed by Singh
et al., 2013) in phytoplankton cell abundances (data from
September 2006 to November 2007; Fig. 10a). We observed
a significant anticorrelation (r2= 0.61, p< 0.001) between
nanoeukaryotes and TOP but the data did not correlate with
other phytoplankton groups (Fig. 10a). Given the paucity of
elemental composition data regarding nanoeukaryotes, we
hypothesize that these cells have a high requirement for P
and potentially meet that requirement by assimilating TOP.
We further analyzed this increasing trend in the TOP con-
centration with climate indices. The Arctic Oscillation is
a major climatic phenomenon in the North Atlantic Ocean
(Thompson and Wallace, 1999). Positive trends in the Arc-
Biogeosciences, 12, 6389–6403, 2015 www.biogeosciences.net/12/6389/2015/
A. Singh et al.: C : N : P stoichiometry at the Bermuda Atlantic Time-series 6399
Figure 8. Box–whisker plot comparing the annual variation in NO−3
and PO3−4
and their ratio relative to the deep mixing at a depth of
100–500 m (data used are from January 2005 to December 2011). The gray bar represents the period of deep mixing (DM) for each year. All
else as in Fig. 4.
tic Oscillation lead to higher temperatures, advanced spring,
and increased CO2. This could lead to enhanced uptake of
CO2 during spring as has been found in terrestrial systems
(Schaefer et al., 2005). Higher buildup of organic matter
would require more P, and hence we correlated TOP con-
centration with the monthly Arctic Oscillation index with a
lag of 1 year (monthly Arctic Oscillation indices are from
November 2005 to December 2006 because there is a lag
of 1 year before climatic oscillations in the North Atlantic
show their impact on surface biogeochemistry; Fromentin
and Planque, 1996). We observed a significant correlation
(r2= 0.46, p< 0.01) between the Arctic Oscillation and
TOP concentrations (Fig. 10b). Since variations in phyto-
plankton cell abundances and climate variability could not
explain all the variation in the elemental stoichiometry, other
mechanisms are yet to be identified to explain the observed
variability in the elemental stoichiometry.
4.3 Role of DOM in microbial carbon export
Many biogeochemical model estimates of export produc-
tion assume Redfield stoichiometry in export fluxes, but a
non-Redfieldian approach has become more popular recently
(Letscher and Moore, 2015). Export production is estimated
to be 3–4 mol C m−2 yr−1 in the BATS region (Jenkins, 1982;
Emerson, 2014), which requires more nutrient input than ob-
servations suggest (Williams and Follows, 1998). A possible
mechanism to sustain such export production is the supply of
DOM to the sunlit layer.
DOM consists of complex compounds whose chemical
characterization is incomplete, but it is evident that DOM el-
emental stoichiometry differs drastically from the Redfield
ratio. Differential production and degradation of DON and
DOP with lifetimes comparable to the gyre circulation could
potentially change the overall stoichiometry of nutrient sup-
www.biogeosciences.net/12/6389/2015/ Biogeosciences, 12, 6389–6403, 2015

6400 A. Singh et al.: C : N : P stoichiometry at the Bermuda Atlantic Time-series
Figure 9. Box–whisker plot comparing the annual variation in chlorophyll a and cell counts for Prochlorococcus, Synechococcus, pi-
coeukaryotes, and nanoeukaryotes relative to the deep mixing at a depth of 0–25 m at BATS (data used are from January 2005 to De-
cember 2011). The gray bar represents the period of deep mixing for each year. All else as in Fig. 4.
ply (Voss and Hietanen, 2013). Preferential degradation of
DOP rather than DON expands the niche of diazotrophs be-
yond that created by subsurface denitrification. Diazotrophs
can quickly utilize recycled DOP (Dyhrman et al., 2006). Si-
multaneously, these diazotrophs release DON (Mulholland,
2007), which can be used by other phytoplankton, but this
DON likely has associated DOP. In the P-stressed Sargasso
Sea, DOP contributes up to 50 % of P demand for primary
production (Lomas et al., 2010) and up to 70 % to the ex-
ported POP (Roussenov et al., 2006; Torres-Valdés et al.,
2009). Indeed, a 1-D biogeochemical model for BATS that
included an explicit DOP pool and a generic DOM pool
significantly improved the capture of natural variability in
both particulate (suspended and exported) and dissolved (or-
ganic and inorganic) pools (Salihoglu et al., 2007). These
model results, as well as others connecting DOP cycling to
particulate-P export (e.g., Roussenov et al., 2007), suggest a
strong need for direct rate measurements of DOM production
and assimilation (e.g., Mahaffey et al. 2014).
5 Conclusions
Our time-series analysis suggests temporal and depth vari-
ability in the C : N : P ratio in the Sargasso Sea. C : N : P ra-
tios in TOM were significantly higher than the canonical
Biogeosciences, 12, 6389–6403, 2015 www.biogeosciences.net/12/6389/2015/

A. Singh et al.: C : N : P stoichiometry at the Bermuda Atlantic Time-series 6401
Figure 10. Relationship between TOP (December 2006–January 2008) and (a) cell abundances (natural log transformed) of Prochlorococcus,
Synechococcus, picoeukaryotes and nanoeukaryotes during September 2006–November 2007. Among cell abundances, only nanoeukaryotes
showed a significant relationship with TOP (r2= 0.61, p< 0.001). Panel (b): relationship between TOP and the Arctic Oscillation index
during November 2005–December 2006 (r2= 0.46, p< 0.01).
Redfield ratio, while C : N was similar to the Redfield ra-
tio in the POM. We observed seasonal variability in stoi-
chiometry, but on average the TOC : TON : TOP ratio was
983 : 68 : 1 and the POC : PON : POP was 210 : 36 : 1. Sea-
sonal variation in POM stoichiometry appears to be largely
driven by the growth of Synechococcus during winter mix-
ing, while the flourishing of Prochlorococcus cells during the
oligotrophic period (fall) could also explain some variability
in the stoichiometry. The C : N : P ratio in Prochlorococcus
cells resembles the observed mean POC:PON : POP ratio at
BATS (210 : 36 : 1). The N : P ratio in subsurface inorganic
nutrients was also greater (N : P= 26) than the Redfield ra-
tio in this region. We observed a significant decreasing trend
in TON : TOP and TOC : TOP during 2007, which was due
to an increase in TOP concentration and could have been
partly driven by the Arctic Oscillation and a decrease in the
relative abundance of nanoeukaryotes. Other causes for the
observed variations in the elemental stoichiometry need to
be explored; however, this elemental stoichiometry analysis
may improve biogeochemical models, which have hitherto
assumed Redfield stoichiometry to estimate export fluxes.
Acknowledgements. We sincerely thank the research technicians,
project principal investigators, and captains and crew of BATS
cruises for their contribution to the data and the National Science
Foundation Chemical and Biological Oceanography Programs for
continued support of the BATS program through the following
awards: OCE 88–01089, OCE 93–01950, OCE 9617795, OCE
0326885, OCE 0752366, and OCE-0801991. This work was
financially supported by the Centre of Excellence (CofE) funded
by the Nippon Foundation (NF)–Partnership for Observations of
the Global Ocean (POGO) and a grant (CP1213) from the Cluster
of Excellence 80 “The Future Ocean” to A. Singh.
Edited by: E. Marañón
References
Arrigo, K. R.: Marine microorganisms and global nutrient cycles,
Nature, 437, 349–355, 2005.
Arrigo, K. R., Robinson, D. H., Worthen, D. L., Dunbar, R. B., Di-
Tullio, G. R., VanWoert, M., and Lizotte, M. P.: Phytoplankton
Community Structure and the Drawdown of Nutrients and CO2
in the Southern Ocean, Science, 283, 365–367, 1999.
Bates, N. R. and Hansell, D. A.: Temporal variability of excess ni-
trate in the subtropical mode water of the North Atlantic Ocean,
Mar. Chem., 84, 225–241, 2004.
Bertilsson, S., Berglund, O., Karl, D. M., and Chisholm, S. W.: Ele-
mental composition of marine Prochlorococcus and Synechococ-
cus: Implications for the ecological stoichiometry of the sea,
Limnol. Oceanogr., 48, 1721–1731, 2003.
Björkman, K., Thomson-Bulldis, A. L., and Karl, D. M.: Phospho-
rus dynamics in the North Pacific subtropical gyre, Aquat. Mi-
crob. Ecol., 22, 185–198, 2000.
Carlson, C. A., Morris, R., Parsons, R., Treusch, A. H., Giovannoni,
S. J. and Vergin, K.: Seasonal dynamics of SAR11 populations in
the euphotic and mesopelagic zones of the northwestern Sargasso
Sea, ISME J., 3, 283–295, 2009.
Carlson, C. A., Hansell, D. A., Nelson, N. B., Siegel, D. A., Sme-
thie, W. M., Khatiwala, S., Meyers, M. M., and Halewood, E.:
Dissolved organic carbon export and subsequent remineraliza-
tion in the mesopelagic and bathypelagic realms of the North At-
lantic basin, Deep-Sea Res. II, 57, 1433–1445, 2010.
Casey, J. R., Aucan, J. P., Goldberg, S. R., and Lomas, M. W.:
Changes in partitioning of carbon amongst photosynthetic pico-
and nano-plankton groups in the Sargasso Sea in response to
changes in the North Atlantic Oscillation, Deep Sea Res. II, 93,
58–70, 2013.
Church, M. J., Ducklow, H. W., and Karl, D. M.: Multi-
year increases in dissolved organic matter inventories at Sta-
tion ALOHA in the North Pacific Subtropical Gyre, Limnol.
Oceanogr., 47, 1–10, 2002.
Clark, L. L., Ingall, E. D., and Benner, R.: Marine phosphorus is se-
lectively remineralized, Nature, 393, p. 426, doi:10.1038/30881,
1998.
www.biogeosciences.net/12/6389/2015/ Biogeosciences, 12, 6389–6403, 2015

6402 A. Singh et al.: C : N : P stoichiometry at the Bermuda Atlantic Time-series
Copin-Montegut, C. and Copin-Montegut, G.: Stoichiometry of
carbon, nitrogen, and phosphorus in marine particulate matter,
Deep-Sea Res. II, 30, 31–46, 1983.
Dore, J. E., Houlihan, T., Hebel, D. V., Tien, G. A., Tupas, L. M.,
and Karl, D. M.: Freezing as a method of sample preservation
for the analysis of dissolved inorganic nutrients in seawater, Mar.
Chem., 53, 173–185, 1996.
Dyhrman, S. T., Chappel, P. D., Haley, S. T., Moffet, J. W., Orchard,
E. D., Waterbury, J. B., and Webb, J. B.: Phosphonate utilization
by the globally important marine diazotroph Trichodesmium, Na-
ture, 439, 68–71, 2006.
Emerson, S.: Annual net community production and the biological
carbon flux in the ocean, Global Biogeochem. Cy., 28, 14–28,
2014.
Falkowski, P. G. and Raven, J. A.: Aquatic photosynthesis, Black-
well Science, Oxford, UK, 1997.
Fawcett, S. E., Lomas, M. W., Casey, J. R., Ward, B. B., and Sig-
man, D. M.: Assimilation of upwelled nitrate by small eukaryotes
in the Sargasso Sea, Nat. Geosci., 4, 717–722, 2011.
Fawcett, S. E., Lomas, M. W., Ward, B. B., and Sigman, D. M.:
The counterintuitive effect of summer-to-fall mixed layer deep-
ening on eukaryotic new production in the Sargasso Sea, Global
Biogeochem. Cy., 28, 86–102, 2014.
Fromentin, J.-M. and Planque, B.: Calanus and environment in the
eastern North Atlantic, II. Influence of the North Atlantic Oscil-
lation on C. finmarchicus and C, helgolandicus, Mar. Ecol. Prog.
Ser., 134, 111–118, 1996.
Gardner, W. D., Chung, S. P., Richardson, M. J., and Walsh, I. D.:
The oceanic mixed-layer pump, Deep-Sea Res. II, 42, 757–775,
1995.
Geider, R. J. and La Roche, J.: Redfield revisited: variability of
C : N : P in marine microalgae and its biochemical basis, Eur. J.
Phycol., 37, 1–17, 2002.
Goldman, J. C., McCarthy, J. J., and Peavey, D. G.: Growth rate in-
fluence on the chemical composition of phytoplankton in oceanic
waters, Nature, 279, 210–215, 1979.
Gruber, N. and Deutsch, C. A.: Redfield’s evolving legacy, Nat.
Geosci., 7, 853–855, 2014.
Gruber, N. and Sarmiento, J. L.: Global patterns of marine nitrogen
fixation and Denitrification, Global Biogeochem. Cy., 11, 235–
266, 1997.
Heldal, M., Scanlal, D. J., Norland, S., Thingstad, F., and Mann, N.
H.: Elemental composition of single cells of various strains of
marine Prochlorococcus and Synechococcus using X-ray micro-
analysis, Limnol. Oceanogr., 48, 1732–1743, 2003.
Jenkins, W. J.: Oxygen utilization rates in the North Atlantic sub-
tropical gyre and primary production in oligotrophic systems,
Nature, 300, 246–248, 1982.
Karl, D. M. and Tein, G.: Temporal variability in dissolved phos-
phorus concentrations in the subtropical North Pacific Ocean,
Mar. Chem., 56, 77–96, 1997.
Karl, D. M., Letelier, R., Hebel, D. V., Bird, D. F., and Winn, C.
D.: Trichodesmium blooms and new nitrogen in the north Pacific
gyre, in Marine Pelagic Cyanobacteria: Trichodesmium and other
Diazotrophs, Springer, Netherlands, 219–237, 1992.
Karl, D. M., Björkman, K. M., Dore, J. E., Fujieki, L., Hebel, D.
V., Houlihan, T., Letelier, R. M., and Tupas, L. M.: Ecological
nitrogen-to-phosphorus stoichiometry at station ALOHA, Deep-
Sea Res. II, 48, 1529–1566, 2001.
Klausmeier, C. A., Litchman, E., Daufresne, T., and Levin, S. A.:
Optimal nitrogen-to-phosphorus stoichiometry of phytoplank-
ton, Nature, 429, 171–174, 2004.
Lenton, T. M. and Watson, A. J.: Redfield revisited 1. Regulation of
nitrate, phosphate, and oxygen in the ocean, Global Biogeochem.
Cy., 14, 225–248, 2000.
Letelier, R. M. and Karl, D. M.: Role of Trichodesmium spp. in the
productivity of the subtropical North Pacific Ocean, Mar. Ecol.
Prog. Ser., 133, 263–273, 1996.
Letscher, R. T. and Moore, J. K.: Preferential remineralization of
dissolved organic phosphorus and non-Redfield DOM dynamics
in the global ocean: Impacts on marine productivity, nitrogen fix-
ation, and carbon export, Global Biogeochem. Cy., 29, 325–340,
2015.
Letscher, R. T., Hansell, D. A., Carlson, C. A., Lumpkin, R., and
Knapp, A. N.: Dissolved organic nitrogen in the global surface
ocean: Distribution and fate, Global Biogeochem. Cy., 27, 1–13,
2013.
Lomas, M. W., Burke, A. L., Lomas, D. A., Bell, D. W., Shen, C.,
Dyhrman, S. T., and Ammerman, J. W.: Sargasso Sea phosphorus
biogeochemistry: an important role for dissolved organic phos-
phorus (DOP), Biogeosciences, 7, 695–710, doi:10.5194/bg-7-
695-2010, 2010.
Lomas, M. W., Bates, N. R., Johnson, R. J., Knap, A. H., Steinberg,
D. K., and Carlson, C. A.: Two decades and counting: 24-years of
sustained open ocean biogeochemical measurements in the Sar-
gasso Sea, Deep-Sea Res. II, 93, 16–32, 2013.
Mahaffey, C., Michaels, A. F., and Capone, D. G.: The conundrum
of marine nitrogen fixation, Am. J. Sci., 305, 546–595, 2005.
Mahaffey, C., Reynolds, S., Davis, C. E., and Lohan, M. C.: Alka-
line phosphatase activity in the subtropical ocean: insights from
nutrient, dust and trace metal addition experiments. Front. Mar.
Sci., 1, 1–13, doi:10.3389/fmars.2014.00073, 2014.
Martiny, A. C., Pham, C. T. A., Primeau, F. W., Vrugt, J. A., Moore,
J. K., Levin, S. A., and Lomas, M. W.: Strong latitudinal patterns
in the elemental ratios of marine plankton and organic matter,
Nat. Geosci., 6, 279–283, 2013.
Mills, M. M. and Arrigo, K. R.: Magnitude of oceanic nitrogen fix-
ation influenced by the nutrient uptake ratio of phytoplankton,
Nat. Geosci., 3, 412–416, 2010.
Monteiro, F. M. and Follows, M. J.: On nitrogen fixation and pref-
erential remineralization of phosphorus, Geophys. Res. Lett., 39,
L06607, doi:10.1029/2012GL050897, 2012.
Moore, C. M., Mills, M. M., Arrigo, K. R., Berman-Frank, I., Bopp,
L., Boyd, P. W., Galbraith, E. D., Guieu, C., Jaccard, S. L., Jick-
ells, T. D., La Roche, J., Lenton, T. M., Mahowald, N., Marañón,
E., Marinov, I., Moore, J. K., Nakatsuka, T., Oschlies, A., Saito,
M. A., Thingstad, T. F., Tsuda, A., and Ulloa, A.: Processes and
patterns of oceanic nutrient limitation, Nat. Geosci., 6, 701–710,
2013.
Mulholland, M. R.: The fate of nitrogen fixed by diazotrophs in
the ocean, Biogeosciences, 4, 37–51, doi:10.5194/bg-4-37-2007,
2007.
Orcutt, K. M., Lipschultz, F., Gundersen, K., Arimoto, R., Michaels,
A. F., Knap, A. H., and Gallon, J. R.: A seasonal study of the sig-
nificance of N2 fixation by Trichodesmium spp. at the Bermuda
Atlantic Time-series Study (BATS) site, Deep-Sea Res. II, 48,
1583–1608, 2001.
Biogeosciences, 12, 6389–6403, 2015 www.biogeosciences.net/12/6389/2015/
A. Singh et al.: C : N : P stoichiometry at the Bermuda Atlantic Time-series 6403
Pahlow, M. and Riebesell, U.: Temporal Trends in Deep Ocean Red-
field Ratios, Science, 287, 831–833, 2000.
Price, N. M.: The elemental stoichiometry and composition of an
iron-limited diatom, Limnol. Oceanogr., 50, 1159–1171, 2005.
Quigg, A., Finkel, Z. V., Irwin, A. J., Rosenthal, Y., Ho, T.-Y., Re-
infelder, J. R., Schofield, O., Morel, F. M. M., and Falkowski, P.
G.: The evolutionary inheritance of elemental stoichiometry in
marine phytoplankton, Nature, 425, 291–294, 2003.
Redfield, A. C.: On the proportions of organic derivatives in sea-
water and their relation to the composition of plankton, in James
Johnstone Memorial Volume, university press of liverpool, Liv-
erpool, UK, 176–192, 1934.
Redfield, A. C.: The biological control of chemical factors in the
environment, Am. Sci., 46, 205–221, 1958.
Rhee, G.-Y.: Effects of N : P atomic ratios and nitrate limitation
on algal growth, cell composition, and nitrate uptake, Limnol.
Oceanogr., 23, 10–25, 1978.
Roussenov, V. M., Williams, R. G., Mahaffey, C., and Wolff, G. A.:
Does the transport of dissolved organic nutrients affect export
production in the Atlantic Ocean?, Global Biogeochem. Cy., 20,
GB3002, doi:10.1029/2005GB002510, 2006.
Salihoglu, B., Garcon, V., Oschlies, A., and Lomas, M. W.: Influ-
ence of nutrient remineralization and utilization stoichiometry on
phytoplankton species and carbon export: A modeling study at
BATS, Deep-Sea Res. I, 55, 73–107, 2007.
Sañudo-Wilhelmy, S. A., Kustka, A. B., Gobler, C. J., Hutchins, D.
A., Yang, M., Lwiza, K., Burns, J., Capone, D. G., Raven, J. A.,
and Carpenter, E. J.: Phosphorus limitation of nitrogen fixation
by Trichodesmium in the central Atlantic Ocean, Nature, 411,
66–69, 2001.
Sañudo-Wilhelmy, S. A., Tovar-Sanchez, A., Fu, F.-X., Capone, D.
G., and Hutchins, D. A.: The impact of surface-adsorbed phos-
phorus on phytoplankton Redfield stoichiometry, Nature, 432,
897–901, 2004.
Schaefer, K., Denning, A. S., and Leonard, O.: The winter Arc-
tic Oscillation, the timing of spring, and carbon fluxes in the
Northern Hemisphere, Global Biogeochem. Cy., 19, GB3017,
doi:10.1029/2004GB002336, 2005.
Siegel, D. A., Westberry, T. K., O’Brien, M. C., Nelson, N. B.,
Michaels, A. F., Morrison, J. R., Schott, A., Caporelli, E. A.,
Sorenson, J. C., Maritorena, S., Garver, S. A., Brody, E. A.,
Ubante, J., and Hammer, M. A.: Bio-optical modeling of primary
production on regional scales: the Bermuda BioOptics project,
Deep-Sea Res. II, 48, 1865–1896, 2001.
Sigman, D. M. and Boyle, E. A.: Glacial/interglacial variations in
atmospheric carbon dioxide, Nature, 407, 859–869, 2000.
Singh, A., Lomas, M. W., and Bates, N. R.: Revisiting N2 fixation in
the North Atlantic Ocean: significance of deviations in Redfield
Ratio, atmospheric deposition and climate variability, Deep-Sea
Res. II, 93, 148–158, 2013.
Steinberg, D. K., Carlson, C. A., Bates, N. R., Johnson, R. J.,
Michaels, A. F., and Knap, A. H.: Overview of the US JGOFS
Bermuda Atlantic Time-series Study (BATS): a decade-scale
look at ocean biology and biogeochemistry, Deep-Sea Res. II,
48, 1405–1447, 2001.
Teng, Y.-C., Primeau, F. W., Moore, J. K., Lomas, M. W., and Mar-
tiny, A. C.: Global-scale variations of the ratios of carbon to
phosphorus in exported marine organic matter, Nat. Geosci., 7,
895–898, doi:10.1038/NGEO2303, 2014.
Thompson, D. W. J. and Wallace, J. M.: The Arctic Oscillation sig-
nature in wintertime geopotential height and temperature fields,
Geophys. Res. Lett., 25, 1297–1300, 1999.
Torres-Valdés, S., Roussenov, V. M., Sanders, R., Reynolds, S., Pan,
X., Mather, R., Landolfi, A., Woff, G. A., Achterberg, E. P., and
Williams, R. G.: Distribution of dissolved organic nutrients and
their effect on export production over the Atlantic Ocean, Global
Biogeochem. Cy., 23, GB4019, doi:10.1029/2008GB003389,
2009.
Tyrrell, T.: The relative influences of nitrogen and phosphorus on
oceanic primary production, Nature, 400, 525–531, 1999.
van Heukelem, L. V. and Thoams, C. S.: Computer-assisted high-
performance liquid chromatography method development with
applications to the isolation and analysis of phytoplankton pig-
ments, J. Chromatogr. A, 910, 31–49, 2001.
Vidal, M., Durate, C. M., and Agustí, S.: Dissolved organic nitrogen
and phosphorus pools and fluxes in the central Atlantic Ocean,
Limnol. Oceanogr., 44, 106–115, 1999.
Voss, M. and Hietanen, S.: The depths of nitrogen cycling, Nature,
493, 616–618, 2013.
Weber, T. S. and Deutsch, C. A.: Ocean nutrient ratios governed by
plankton biogeography, Nature, 467, 550–554, 2010.
Williams, R. G. and Follows, M. J.: The Ekman transfer of nutri-
ents and maintenance of new production over the North Atlantic,
Deep-Sea Res. I, 45, 461–489, 1998.
Wu, J., Sunda, W., Boyle, E. A., and Karl, D. M.: Phosphate Deple-
tion in the Western North Atlantic Ocean, Science, 289, 759–762,
2000.
Zamora, L. M., Landolfi, A., Oschlies, A., Hansell, D. A., Dietze,
H., and Dentener, F.: Atmospheric deposition of nutrients and ex-
cess N formation in the North Atlantic, Biogeosciences, 7, 777–
793, doi:10.5194/bg-7-777-2010, 2010.
www.biogeosciences.net/12/6389/2015/ Biogeosciences, 12, 6389–6403, 2015