CNI indicators ISSN 2317-7322 • Year 9 • Number 10 ... · Construction industry survey ISSN...
6
CONSTRUCTION INDUSTRY SURVEY Activity levels in the construction industry have not yet shown robust improvements. On the other hand, the expectations indicators show significant optimism by construction entrepreneurs. Operating capacity utilization and employment levels declined modestly in October and remained at low levels. From 2012 to 2013, the indicator stood at around 70% and is currently at 59%. Activity levels, however, are up from the previous month. The indicators measuring expectations and confidence experienced a significant increase in November, suggesting that construction entrepreneurs are more confident and optimistic about the future. Despite the optimism, their willingness to invest remains stagnant. If broadly positive expectations are confirmed, the operating capacity utilization rate will likely increase before employee numbers are impacted. Optimism increases as entrepreneurs approach investments cautiously ICEI-Construction, Current Conditions Index and Expectations Index for the construction industry Diffusion index (0 to 100 points)* *Figures above 50 points indicate business confidence and improved current conditions and expectations. 50 Increase Decrease NOV 2012 JUL 2013 MAR 2014 NOV JUL 2015 MAR 2016 NOV JUL 2017 MAR 2018 NOV CNI indicators ISSN 2317-7322 • Year 9 • Number 10 • October 2018 ICEI-Construction Current Conditions Index Expectation Index Dividing line
Transcript of CNI indicators ISSN 2317-7322 • Year 9 • Number 10 ... · Construction industry survey ISSN...
CONSTRUCTION INDUSTRY SURVEY
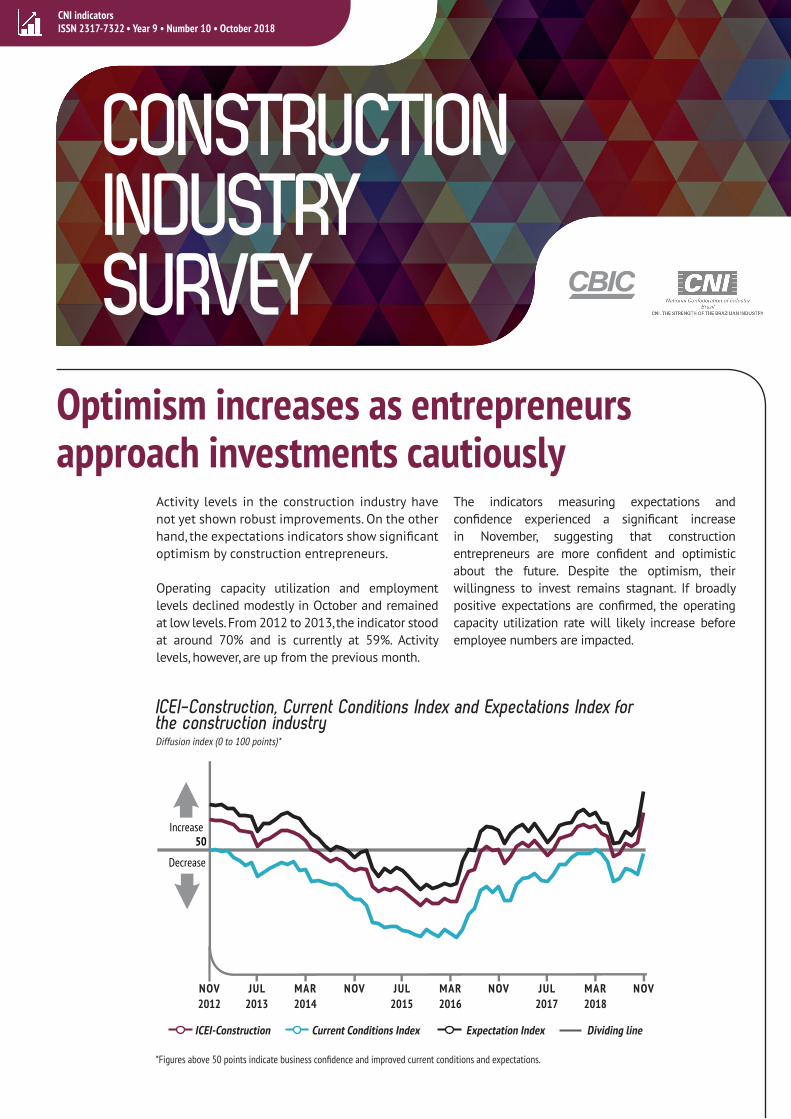
Activity levels in the construction industry have not yet shown robust improvements. On the other hand, the expectations indicators show significant optimism by construction entrepreneurs.
Operating capacity utilization and employment levels declined modestly in October and remained at low levels. From 2012 to 2013, the indicator stood at around 70% and is currently at 59%. Activity levels, however, are up from the previous month.
The indicators measuring expectations and confidence experienced a significant increase in November, suggesting that construction entrepreneurs are more confident and optimistic about the future. Despite the optimism, their willingness to invest remains stagnant. If broadly positive expectations are confirmed, the operating capacity utilization rate will likely increase before employee numbers are impacted.
Optimism increases as entrepreneurs approach investments cautiously
ICEI-Construction, Current Conditions Index and Expectations Index for the construction industry Diffusion index (0 to 100 points)*
*Figures above 50 points indicate business confidence and improved current conditions and expectations.
50
Increase
Decrease
NOV
2012
JUL
2013
MAR
2014
NOV JUL
2015
MAR
2016
NOV JUL
2017
MAR
2018
NOV
CNI indicatorsISSN 2317-7322 • Year 9 • Number 10 • October 2018
ICEI-Construction Current Conditions Index Expectation Index Dividing line
2
Construction industry surveyISSN 2317-7322 • Year 9 • Number 10 • October 2018
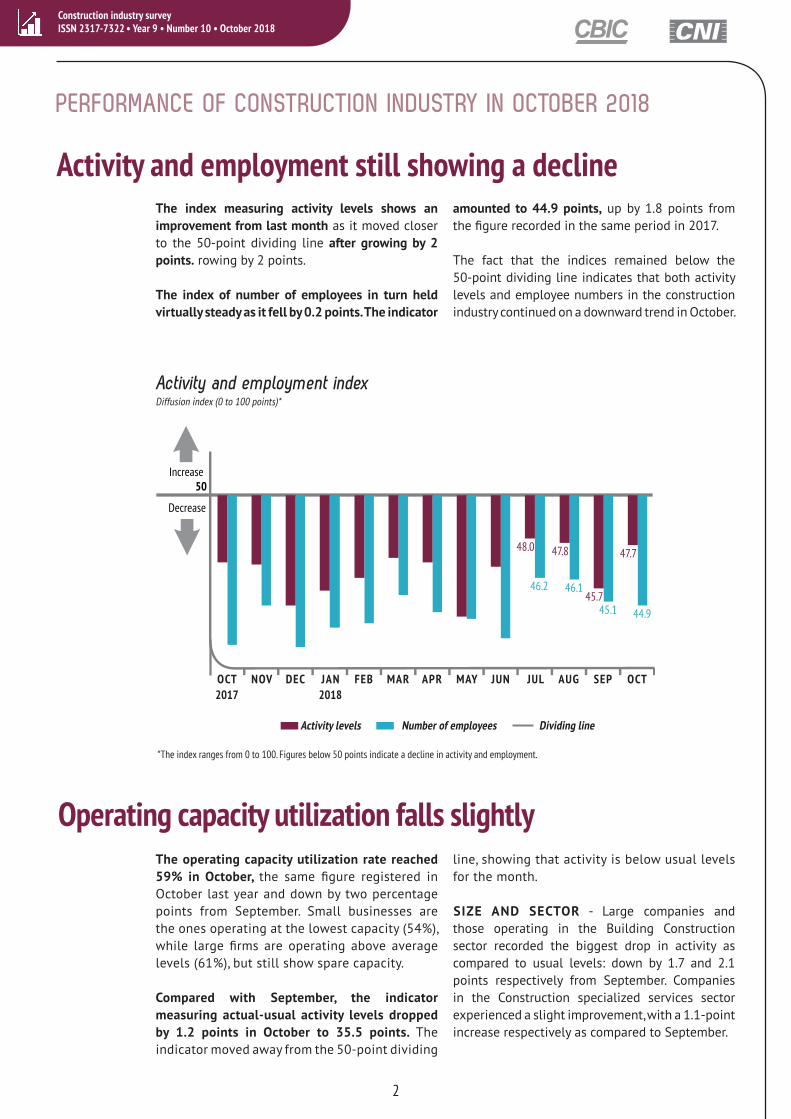
The index measuring activity levels shows an improvement from last month as it moved closer to the 50-point dividing line after growing by 2 points. rowing by 2 points.
The index of number of employees in turn held virtually steady as it fell by 0.2 points. The indicator
Activity and employment still showing a decline
Operating capacity utilization falls slightly
PERFORMANCE OF CONSTRUCTION INDUSTRY IN OCTOBER 2018
amounted to 44.9 points, up by 1.8 points from the figure recorded in the same period in 2017.
The fact that the indices remained below the 50-point dividing line indicates that both activity levels and employee numbers in the construction industry continued on a downward trend in October.
The operating capacity utilization rate reached 59% in October, the same figure registered in October last year and down by two percentage points from September. Small businesses are the ones operating at the lowest capacity (54%), while large firms are operating above average levels (61%), but still show spare capacity.
Compared with September, the indicator measuring actual-usual activity levels dropped by 1.2 points in October to 35.5 points. The indicator moved away from the 50-point dividing
line, showing that activity is below usual levels for the month.
SIZE AND SECTOR - Large companies and those operating in the Building Construction sector recorded the biggest drop in activity as compared to usual levels: down by 1.7 and 2.1 points respectively from September. Companies in the Construction specialized services sector experienced a slight improvement, with a 1.1-point increase respectively as compared to September.
Activity and employment index Diffusion index (0 to 100 points)*
*The index ranges from 0 to 100. Figures below 50 points indicate a decline in activity and employment.
50
Increase
Decrease
OCT
2017
DEC FEB APR JUN AUG OCTNOV JAN
2018
MAR MAY JUL SEP
48.047.8
45.7
47.7
46.2 46.1
45.1 44.9
Activity levels Number of employees Dividing line
3
Construction industry surveyISSN 2317-7322 • Year 9 • Number 10 • October 2018
INDUSTRY’S EXPECTATIONS IN NOVEMBER 2018
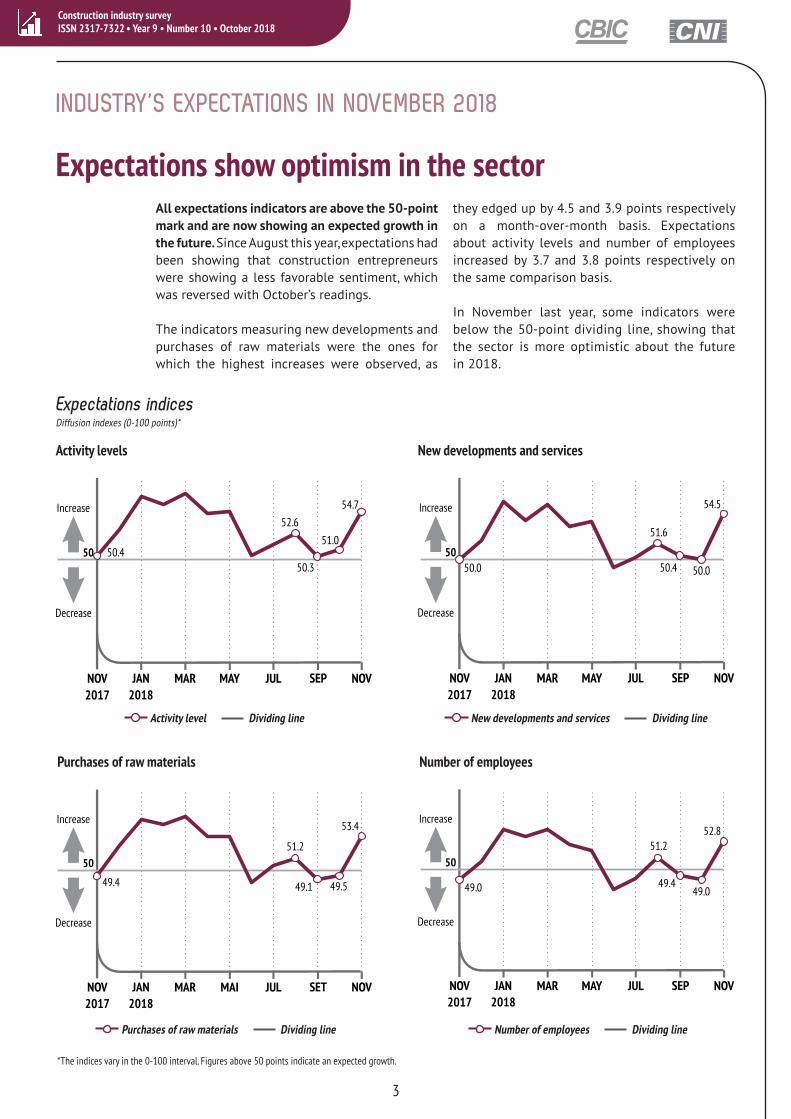
*The indices vary in the 0-100 interval. Figures above 50 points indicate an expected growth.
All expectations indicators are above the 50-point mark and are now showing an expected growth in the future. Since August this year, expectations had been showing that construction entrepreneurs were showing a less favorable sentiment, which was reversed with October’s readings.
The indicators measuring new developments and purchases of raw materials were the ones for which the highest increases were observed, as
Expectations show optimism in the sectorthey edged up by 4.5 and 3.9 points respectively on a month-over-month basis. Expectations about activity levels and number of employees increased by 3.7 and 3.8 points respectively on the same comparison basis.
In November last year, some indicators were below the 50-point dividing line, showing that the sector is more optimistic about the future in 2018.
Expectations indicesDiffusion indexes (0-100 points)*
Activity levels New developments and services
Activity level Dividing line New developments and services Dividing line
50
Increase
Decrease
NOV
2017
JAN
2018
MAR MAY JUL SEP NOV
52.6
50.3
51.0
54.7
50.4 50
Increase
Decrease
NOV
2017
JAN
2018
MAR MAY JUL SEP NOV
51.6
50.4 50.0
54.5
50.0
Purchases of raw materials Number of employees
Purchases of raw materials Dividing line Number of employees Dividing line
50
Increase
Decrease
NOV
2017
JAN
2018
MAR MAI JUL SET NOV
51.2
49.1 49.5
53.4
49.4
50
Increase
Decrease
NOV
2017
JAN
2018
MAR MAY JUL SEP NOV
51.2
49.449.0
52.8
49.0

4
Construction industry surveyISSN 2317-7322 • Year 9 • Number 10 • October 2018
The index measuring investment intentions (purchases of machinery and equipment, research and development, and product or process innovation) amounted to 32.5 points in November, the same figure recorded last month. The index ranges from 0 to 100 points and the higher the reading, the more entrepreneurs are willing to make investments.
Investment intentions remain unchanged in NovemberThe indicator is 1.8 points higher than the figure observed in November last year, but is down by 1.1 points from its 33.6-point historical average.
Investment intentions indexDiffusion index (0-100 points)*
*The index vary in the 0-100 interval. The lower the index, the lower the willingness to invest.
24
28
32
36
26.9
29.8
32.5 32.5
NOV
2015
MAY
2016
NOV MAY
2017
NOV MAY
2018
NOV
5
Construction industry surveyISSN 2317-7322 • Year 9 • Number 10 • October 2018
CONSTRUCTION BUSINESS CONFIDENCE INDEX IN NOVEMBER
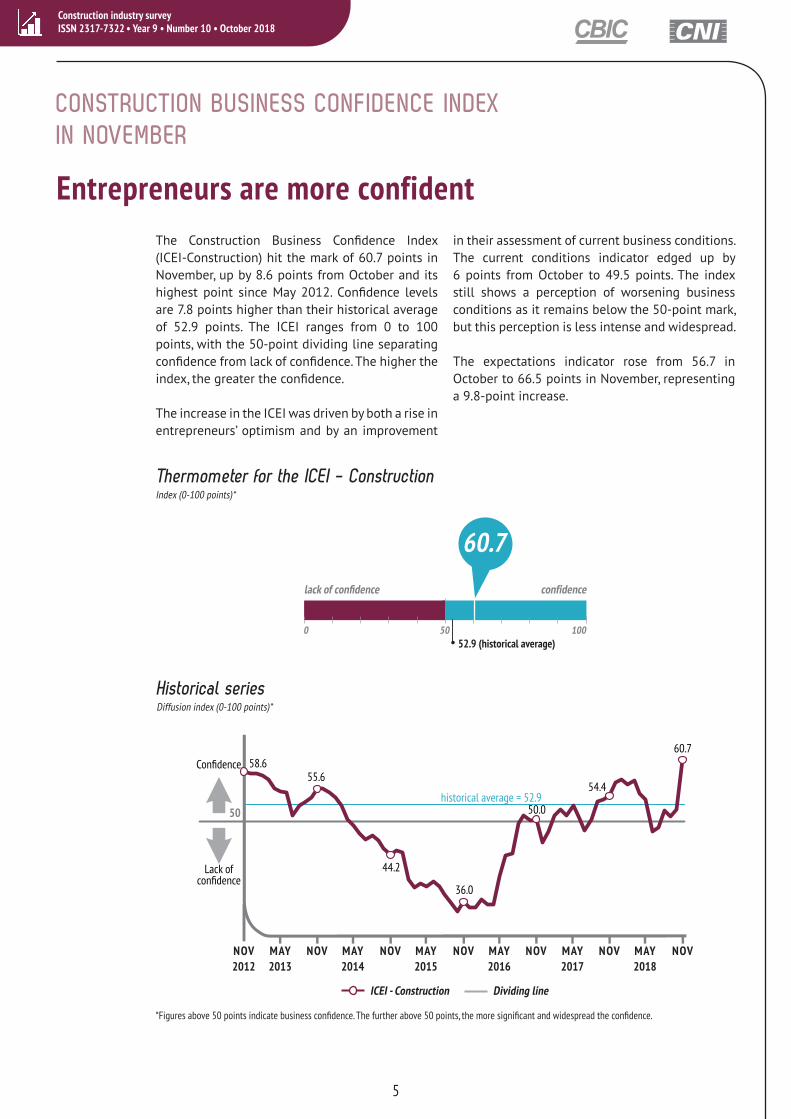
Entrepreneurs are more confident The Construction Business Confidence Index (ICEI-Construction) hit the mark of 60.7 points in November, up by 8.6 points from October and its highest point since May 2012. Confidence levels are 7.8 points higher than their historical average of 52.9 points. The ICEI ranges from 0 to 100 points, with the 50-point dividing line separating confidence from lack of confidence. The higher the index, the greater the confidence.
The increase in the ICEI was driven by both a rise in entrepreneurs’ optimism and by an improvement
Thermometer for the ICEI - ConstructionIndex (0-100 points)*
52.9 (historical average)
lack of confidence confidence
60.7
Historical series Diffusion index (0-100 points)*
*Figures above 50 points indicate business confidence. The further above 50 points, the more significant and widespread the confidence.
ICEI - Construction Dividing line
Confidence
Lack of
confidence
50
NOV
2012
MAY
2013
NOV MAY
2014
NOV MAY
2015
NOV MAY
2016
NOV MAY
2017
NOV MAY
2018
NOV
historical average = 52.9
55.6
44.2
36.0
60.7
58.6
50.0
54.4
in their assessment of current business conditions. The current conditions indicator edged up by 6 points from October to 49.5 points. The index still shows a perception of worsening business conditions as it remains below the 50-point mark, but this perception is less intense and widespread.
The expectations indicator rose from 56.7 in October to 66.5 points in November, representing a 9.8-point increase.
Construction industry surveyISSN 2317-7322 • Year 9 • Number 10 • October 2018
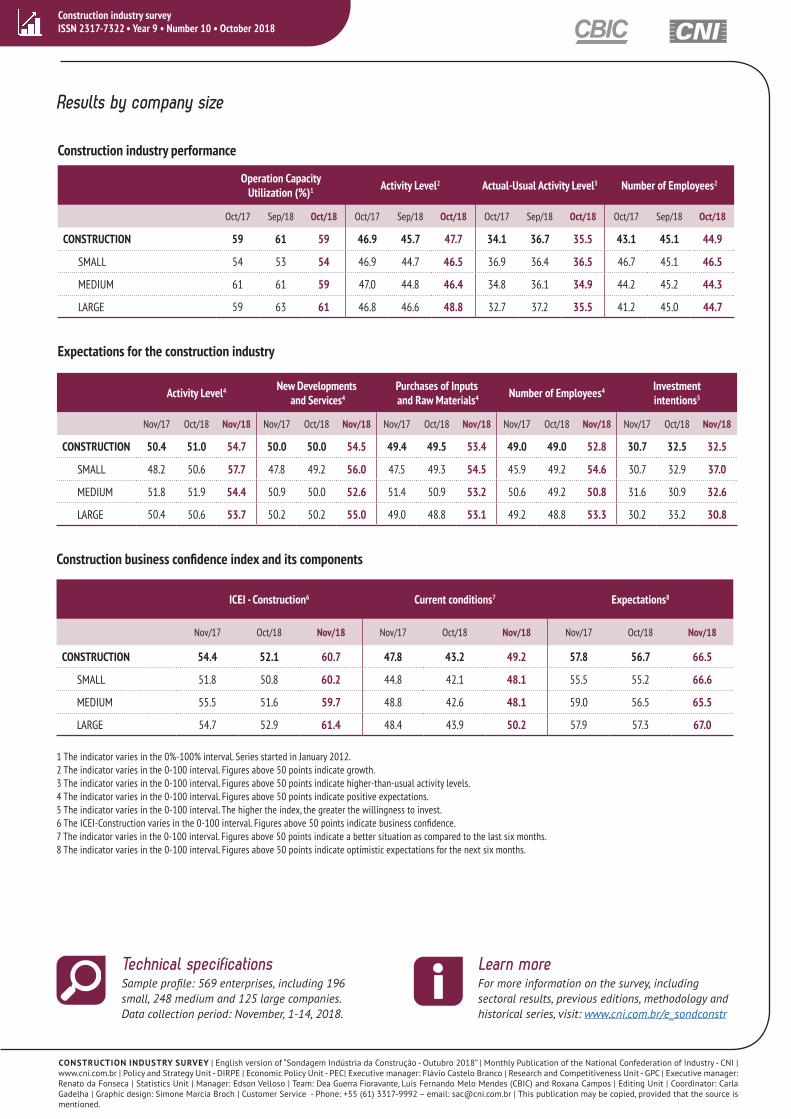
Operation CapacityUtilization (%)1 Activity Level2 Actual-Usual Activity Level3 Number of Employees2
Oct/17 Sep/18 Oct/18 Oct/17 Sep/18 Oct/18 Oct/17 Sep/18 Oct/18 Oct/17 Sep/18 Oct/18
CONSTRUCTION 59 61 59 46.9 45.7 47.7 34.1 36.7 35.5 43.1 45.1 44.9
SMALL 54 53 54 46.9 44.7 46.5 36.9 36.4 36.5 46.7 45.1 46.5
MEDIUM 61 61 59 47.0 44.8 46.4 34.8 36.1 34.9 44.2 45.2 44.3
LARGE 59 63 61 46.8 46.6 48.8 32.7 37.2 35.5 41.2 45.0 44.7
Results by company size
Activity Level4 New Developments and Services4
Purchases of Inputs and Raw Materials4 Number of Employees4 Investment
intentions5
Nov/17 Oct/18 Nov/18 Nov/17 Oct/18 Nov/18 Nov/17 Oct/18 Nov/18 Nov/17 Oct/18 Nov/18 Nov/17 Oct/18 Nov/18
CONSTRUCTION 50.4 51.0 54.7 50.0 50.0 54.5 49.4 49.5 53.4 49.0 49.0 52.8 30.7 32.5 32.5
SMALL 48.2 50.6 57.7 47.8 49.2 56.0 47.5 49.3 54.5 45.9 49.2 54.6 30.7 32.9 37.0
MEDIUM 51.8 51.9 54.4 50.9 50.0 52.6 51.4 50.9 53.2 50.6 49.2 50.8 31.6 30.9 32.6
LARGE 50.4 50.6 53.7 50.2 50.2 55.0 49.0 48.8 53.1 49.2 48.8 53.3 30.2 33.2 30.8
Learn moreFor more information on the survey, including sectoral results, previous editions, methodology and historical series, visit: www.cni.com.br/e_sondconstr
Technical specifications
i
Construction industry performance
Expectations for the construction industry
ICEI - Construction6 Current conditions7 Expectations8
Nov/17 Oct/18 Nov/18 Nov/17 Oct/18 Nov/18 Nov/17 Oct/18 Nov/18
CONSTRUCTION 54.4 52.1 60.7 47.8 43.2 49.2 57.8 56.7 66.5
SMALL 51.8 50.8 60.2 44.8 42.1 48.1 55.5 55.2 66.6
MEDIUM 55.5 51.6 59.7 48.8 42.6 48.1 59.0 56.5 65.5
LARGE 54.7 52.9 61.4 48.4 43.9 50.2 57.9 57.3 67.0
Construction business confidence index and its components
1 The indicator varies in the 0%-100% interval. Series started in January 2012.2 The indicator varies in the 0-100 interval. Figures above 50 points indicate growth.3 The indicator varies in the 0-100 interval. Figures above 50 points indicate higher-than-usual activity levels.4 The indicator varies in the 0-100 interval. Figures above 50 points indicate positive expectations.5 The indicator varies in the 0-100 interval. The higher the index, the greater the willingness to invest.6 The ICEI-Construction varies in the 0-100 interval. Figures above 50 points indicate business confidence.7 The indicator varies in the 0-100 interval. Figures above 50 points indicate a better situation as compared to the last six months. 8 The indicator varies in the 0-100 interval. Figures above 50 points indicate optimistic expectations for the next six months.
Sample profile: 569 enterprises, including 196 small, 248 medium and 125 large companies. Data collection period: November, 1-14, 2018.
CONSTRUCTION INDUSTRY SURVEY | English version of “Sondagem Indústria da Construção - Outubro 2018” | Monthly Publication of the National Confederation of Industry - CNI | www.cni.com.br | Policy and Strategy Unit - DIRPE | Economic Policy Unit - PEC| Executive manager: Flávio Castelo Branco | Research and Competitiveness Unit - GPC | Executive manager: Renato da Fonseca | Statistics Unit | Manager: Edson Velloso | Team: Dea Guerra Fioravante, Luis Fernando Melo Mendes (CBIC) and Roxana Campos | Editing Unit | Coordinator: Carla Gadelha | Graphic design: Simone Marcia Broch | Customer Service - Phone: +55 (61) 3317-9992 – email: [email protected] | This publication may be copied, provided that the source is mentioned.


![NERC 2013/BO…Translate this page%PDF-1.6 %âãÏÓ 7322 0 obj > endobj 7378 0 obj >/Filter/FlateDecode/ID[19E7B1124685BF44B51721D3A21DEDD8>]/Index[7322 220]/Info 7321 0 R/Length](https://static.fdocuments.in/doc/165x107/5ade94877f8b9aa5088e51fd/2013botranslate-this-pagepdf-16-7322-0-obj-endobj-7378-0-obj-filterflatedecodeid19e7b1124685bf44b51721d3a21dedd8index7322.jpg)