CMS Financial Report
135
Fiscal Year 2003 CMS Financial Report U.S. DEPARTMENT OF HEALTH AND HUMAN SERVICES
Transcript of CMS Financial Report

Fiscal Year 2003
CMS Financial Report
U.S. DEPARTMENT OF HEALTH AND HUMAN SERVICES

The CMS is one of the largestpurchasers of health care in theworld. The Medicare, Medicaid, andState Children’s Health Insuranceprograms that we administer providehealth care for one in four Americans.Medicare enrollment has increasedfrom 19 million beneficiaries in 1966to 41 million beneficiaries. Medicaidenrollment has increased from 10million beneficiaries in 1967 to over41 million beneficiaries.
The CMS outlayed $413.4 billion (netof offsetting receipts and Payments tothe Health Care Trust Funds) in fiscalyear (FY) 2003, 19 percent of totalFederal outlays. The only agency thatoutlayed more is the Social SecurityAdministration.
The CMS has approximately 4,600 Federalemployees, but does most of its work through thirdparties. The CMS and its contractors process overone billion Medicare claims annually, monitor quali-ty of care, provide States with matching funds forMedicaid benefits, and develop policies andprocedures designed to give the best possible serviceto beneficiaries. We also assure the safety and quali-ty of medical facilities, provide health insuranceprotection to workers changing jobs, and maintainthe largest collection of health care data in theUnited States.
THE CENTERS FOR MEDICARE &MEDICAID SERVICES AT A GLANCE
2003 Program Enrollment
2003 Federal Outlays
CMS and Its Partners
Employees
CMS 4,600
State Medicaid/SCHIP 34,000
Medicare Contractors 21,100
State Surveyors 6,000
Quality Improvement Orgs. 2,200

i
DEPARTMENT OF HEALTH & HUMAN SERVICES Centers for Medicare & Medicaid Services
Administrator Washington, DC 20201
A Message from the Administrator

ii
CHAPTER TITLEDEPARTMENT OF HEALTH & HUMAN SERVICES Centers for Medicare & Medicaid Services
Acting Deputy Administrator Baltimore, MD 21244-1850
A Message from the Acting Deputy Administrator

iii
DEPARTMENT OF HEALTH & HUMAN SERVICES Centers for Medicare & Medicaid Services
Baltimore, MD 21244-1850
A Message from the Chief Financial Officer

iv

v
FINANCING OF CMS PROGRAMS AND OPERATIONS

A Message from the Administrator . . . . . . . . . . . . . . . . . . . . . . . . . . . . . . i
A Message from the Acting Deputy Administrator . . . . . . . . . . . . . . . . . . . ii
A Message from the Chief Financial Officer. . . . . . . . . . . . . . . . . . . . . . . iii
Financing of CMS Programs and Operations . . . . . . . . . . . . . . . . . . . . . . . v
Agency Organization. . . . . . . . . . . . . . . . . . . . . . . . . . . . . . . . . . . . . . . viii
Management’s Discussion and Analysis . . . . . . . . . . . . . . . . . . . . . . . . . . 1
Overview . . . . . . . . . . . . . . . . . . . . . . . . . . . . . . . . . . . . . . . . . . . . . . . 1
Programs . . . . . . . . . . . . . . . . . . . . . . . . . . . . . . . . . . . . . . . . . . . . . . . 3
Medicare . . . . . . . . . . . . . . . . . . . . . . . . . . . . . . . . . . . . . . . . . . . . . 3
Medicaid . . . . . . . . . . . . . . . . . . . . . . . . . . . . . . . . . . . . . . . . . . . . . 5
State Children’s Health Insurance. . . . . . . . . . . . . . . . . . . . . . . . . . . . . . 8
Other Activities . . . . . . . . . . . . . . . . . . . . . . . . . . . . . . . . . . . . . . . . . 9
Performance Goals . . . . . . . . . . . . . . . . . . . . . . . . . . . . . . . . . . . . . . . 12
Medicare. . . . . . . . . . . . . . . . . . . . . . . . . . . . . . . . . . . . . . . . . . . . . 13
Medicaid and SCHIP . . . . . . . . . . . . . . . . . . . . . . . . . . . . . . . . . . . . . 15
Financial Accomplishments and Statement Highlights . . . . . . . . . . . . . 16
CFO Audit . . . . . . . . . . . . . . . . . . . . . . . . . . . . . . . . . . . . . . . . . . . . 17
Debt Management. . . . . . . . . . . . . . . . . . . . . . . . . . . . . . . . . . . . . . . 18
Medicare Contractor Oversight . . . . . . . . . . . . . . . . . . . . . . . . . . . . . . . 18
Financial Management and Reporting . . . . . . . . . . . . . . . . . . . . . . . . . . 21
Healthcare Integrated General Ledger Accounting System . . . . . . . . . . . . . 23
Financial Statement Highlights . . . . . . . . . . . . . . . . . . . . . . . . . . . . . . 24
Principal Statements and Notes . . . . . . . . . . . . . . . . . . . . . . . . . . . . . . . 27
Consolidated Balance Sheet . . . . . . . . . . . . . . . . . . . . . . . . . . . . . . . . . 27
Consolidated Statement of Net Cost. . . . . . . . . . . . . . . . . . . . . . . . . . . . 28
Consolidated Statement of Changes in Net Position. . . . . . . . . . . . . . . . . . 28
Combined Statement of Budgetary Resources. . . . . . . . . . . . . . . . . . . . . . 29
Consolidated Statement of Financing . . . . . . . . . . . . . . . . . . . . . . . . . . 30
Notes . . . . . . . . . . . . . . . . . . . . . . . . . . . . . . . . . . . . . . . . . . . . . . . 31
TABLE OF CONTENTS

Required Supplementary Stewardship Information . . . . . . . . . . . . . . . . 55
Actuarial Projections . . . . . . . . . . . . . . . . . . . . . . . . . . . . . . . . . . . . . 56
Actuarial Present Values . . . . . . . . . . . . . . . . . . . . . . . . . . . . . . . . . . . 61
Actuarial Assumptions and Sensitivity Analysis. . . . . . . . . . . . . . . . . . . . 63
Trust Fund Finances and Sustainability . . . . . . . . . . . . . . . . . . . . . . . . . 74
Supplementary Information . . . . . . . . . . . . . . . . . . . . . . . . . . . . . . . . . . 76
Consolidating Balance Sheet . . . . . . . . . . . . . . . . . . . . . . . . . . . . . . . . 76
Consolidating Statement of Net Cost . . . . . . . . . . . . . . . . . . . . . . . . . . . 77
Consolidating Statement of Changes in Net Position . . . . . . . . . . . . . . . . . 77
Combining Statement of Budgetary Resources (Required) . . . . . . . . . . . . . . 78
Gross Cost and Exchange Revenue (Required) . . . . . . . . . . . . . . . . . . . . . 79
Consolidated Intragovernmental Balances (Required) . . . . . . . . . . . . . . . . 79
Audit Opinion . . . . . . . . . . . . . . . . . . . . . . . . . . . . . . . . . . . . . . . . . . . . 80
Report of Independent Auditors on Financial Statements . . . . . . . . . . . . . . 84
Report of Independent Auditors on Compliance with Laws and Regulations . . . . . . 87
Report of Independent Auditors on Internal Control . . . . . . . . . . . . . . . . . . 89
Other Congressional Reports . . . . . . . . . . . . . . . . . . . . . . . . . . . . . . . . . 101
Federal Managers’ Financial Integrity Act . . . . . . . . . . . . . . . . . . . . . . . 101
Medicare’s Validation Program for JCAHO Accredited Hospitals . . . . . . . . . 103
Clinical Laboratory Improvement Validation Program . . . . . . . . . . . . . . . 110
Quality Improvement Organizations . . . . . . . . . . . . . . . . . . . . . . . . . . 115
Glossary . . . . . . . . . . . . . . . . . . . . . . . . . . . . . . . . . . . . . . . . . . . . . . . . 117
TABLE OF CONTENTS

DEPA
RT
MEN
T O
F H
EA
LTH
AN
D H
UM
AN
SER
VIC
ES
CEN
TER
SFO
RM
ED
ICA
RE
& M
ED
ICA
IDSE
RV
ICES
ADM
INIS
TRAT
OR
DEPU
TYAD
MIN
ISTR
ATOR
and
Chie
f Ope
ratin
g Of
ficer
Mid
wes
tern
Con
sort
ium
Sout
hern
Con
sort
ium
Nort
heas
tern
Cons
ortiu
m
Prog
ram
Inte
grity
Gro
up
Offic
e of
Fin
anci
alM
anag
emen
tOf
fice
of In
form
atio
nSe
rvic
es
Offic
e of
Equ
alOp
port
unity
and
Civ
ilRi
ghts
Offic
e of
Ope
ratio
nsM
anag
emen
t
Wes
tern
Con
sort
ium
Regi
onal
Offi
ces
Denv
er,S
an F
ranc
isco
,and
Seat
tle
Regi
onal
Offi
ces
Chic
ago
and
Kans
as C
ityRe
gion
al O
ffice
sAt
lant
a an
d Da
llas
Regi
onal
Offi
ces
Bost
on,N
ew Y
ork,
and
Phila
delp
hia
Appr
oved
Str
uctu
reAs
of N
ovem
ber 2
003
Cent
er fo
r Med
icai
dan
d St
ate
Oper
atio
nsCe
nter
for M
edic
are
Man
agem
ent
Cent
er fo
r Ben
efic
iary
Choi
ces
Publ
ic A
ffairs
Offi
ceOf
fice
of L
egis
latio
nOf
fice
of S
trat
egic
Oper
atio
ns a
ndRe
gula
tory
Affa
irs
Offic
e of
the
Actu
ary
Offic
e of
Res
earc
h,De
velo
pmen
t &In
form
atio
n
Offic
e of
Clin
ical
Stan
dard
s an
d Qu
ality
Offic
e of
M
edic
are
Adju
dica
tion
Offic
e of
Hea
lthIn
sura
nce
Port
abili
ty &
Acco
unt.
Act S
tand
ards

1
Management’sDiscussion and
Analysis
Management’sDiscussion and
Analysis
OVERVIEWThe Centers for Medicare & Medicaid Services (CMS), a component of the Departmentof Health and Human Services (HHS), administers Medicare, Medicaid, the StateChildren’s Health Insurance Program (SCHIP), and the Clinical Laboratory ImprovementAmendments (CLIA). Along with the Departments of Labor and Treasury, CMS alsoimplements the insurance reform provisions of the Health Insurance Portability andAccountability Act of 1996 (HIPAA).
The CMS is one of the largest purchasers of health care in the world. Based on the lat-est projections, Medicare and Medicaid (including State funding), represent 33 cents ofevery dollar spent on health care in the United States (U.S.)—or looked at from three

different perspectives, 61 cents of everydollar spent on nursing homes, 47 cents ofevery dollar received by U.S. hospitals,and 27 cents of every dollar spent onphysician services.
The CMS outlays totaled $413.4billion (net of offsetting receipts andPayments to the Health Care Trust Funds)in FY 2003. Our expenses totaled $444.7billion, of which $2.4 billion (less than 1percent) were administrative expenses.
We establish policies for program eligibility and benefit coverage, process over onebillion Medicare claims annually, provide States with funds for Medicaid and SCHIP,ensure quality of health care for beneficiaries, and safeguard funds from fraud, waste,and abuse. Of our approximately 4,600 Federal employees, about 1,600 work in 10regional offices (ROs) around the country to provide direct services to Medicarecontractors, State agencies, health care providers, beneficiaries, and the general public.Approximately 3,000 of our employees work in Baltimore, MD and Washington, DC,where they provide funds to Medicare contractors; write policies and regulations; setpayment rates; safeguard the fiscal integrity of the Medicare and Medicaid programs toensure that benefit payments for medically necessary services are paid correctly the firsttime; recover improper payments; assist law enforcement agencies in the prosecution offraudulent activities; monitor contractor performance; develop and implement customerservice improvements; provide education and outreach activities to beneficiaries andMedicare providers, survey hospitals, nursing homes, labs, home health agencies andother health care facilities; work with State insurance companies; and assist States andTerritories with Medicaid and SCHIP. We also maintain the Nation's largest collection ofhealth care data and provide technical assistance to the Congress, the Executive Branch,universities, and other private sector researchers.
Many important activities are also handled by third parties: (1) an estimated 34,000State employees administer Medicaid and SCHIP; (2) 21,100 employees at 50 Medicarecontractors (27 fiscal intermediaries, 19 carriers, and 4 Durable Medical EquipmentRegional Carriers (DMERCs)) process Medicare claims, provide technical assistance toproviders and service beneficiaries’ needs, including premium billing, and respond toinquiries; (3) 6,000 State employees inspect hospitals, nursing homes, and otherfacilities to ensure that health and safety standards are met; and (4) 2,200 employees at53 Quality Improvement Organizations (QIOs) conduct a wide variety of qualityimprovement programs to ensure quality of care provided to Medicare beneficiaries.
2
CMS MANAGEMENT’S DISCUSSION AND ANALYSIS FY 2003
Expenses are computed using the accrualbasis of accounting that recognizes costswhen incurred and revenues when earnedregardless of the timing of cash receivedor disbursed. Expenses include the effectof accounts receivable and accountspayable on determining the net cost ofoperations. Outlays refer to cashdisbursements made to liquidate anexpense regardless of the fiscal year theexpense was incurred.

PROGRAMS
Medicare
Introduction
Established in 1965 as title XVIII of the Social Security Act, Medicare was legislated as acomplement to Social Security retirement, survivors, and disability benefits, andoriginally covered people aged 65 and over. In 1972, the program was expanded to coverthe disabled, people with end-stage renal disease (ESRD) requiring dialysis or kidneytransplant, and people age 65 or older who elect Medicare coverage.
Medicare processes over one billion fee-for-service (FFS) claims a year, is thenation’s largest purchaser of managed care, and accounts for almost 13 percent of theFederal Budget. Medicare is a combination of three programs: Hospital Insurance,Supplementary Medical Insurance, and Medicare+Choice. Since 1966, Medicareenrollment has increased from 19 million to approximately 41 million beneficiaries.
The President’s FY 2003 budget included a framework for improving andmodernizing the Medicare program, which included adding a drug benefit. During thesummer, both the House and the Senate passed legislation that generally was consistentwith the President’s plan. This effort would result in the largest change to the Medicareprogram since its enactment in 1965.
Hospital Insurance
Hospital Insurance, also known as HI or Medicare Part A, is usually providedautomatically to people aged 65 and over who have worked long enough to qualify forSocial Security benefits and to most disabled people entitled to Social Security or
3
CMS MANAGEMENT’S DISCUSSION AND ANALYSIS FY 2003
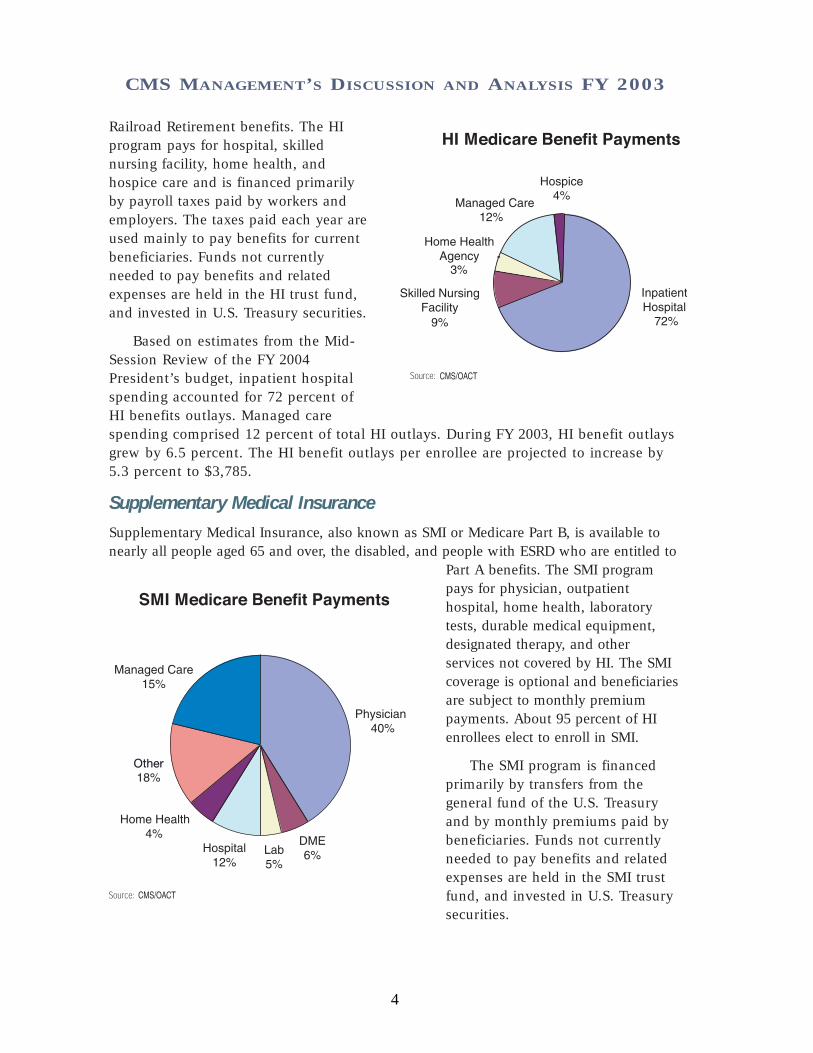
Railroad Retirement benefits. The HIprogram pays for hospital, skillednursing facility, home health, andhospice care and is financed primarilyby payroll taxes paid by workers andemployers. The taxes paid each year areused mainly to pay benefits for currentbeneficiaries. Funds not currentlyneeded to pay benefits and relatedexpenses are held in the HI trust fund,and invested in U.S. Treasury securities.
Based on estimates from the Mid-Session Review of the FY 2004President’s budget, inpatient hospitalspending accounted for 72 percent ofHI benefits outlays. Managed carespending comprised 12 percent of total HI outlays. During FY 2003, HI benefit outlaysgrew by 6.5 percent. The HI benefit outlays per enrollee are projected to increase by5.3 percent to $3,785.
Supplementary Medical Insurance
Supplementary Medical Insurance, also known as SMI or Medicare Part B, is available tonearly all people aged 65 and over, the disabled, and people with ESRD who are entitled to
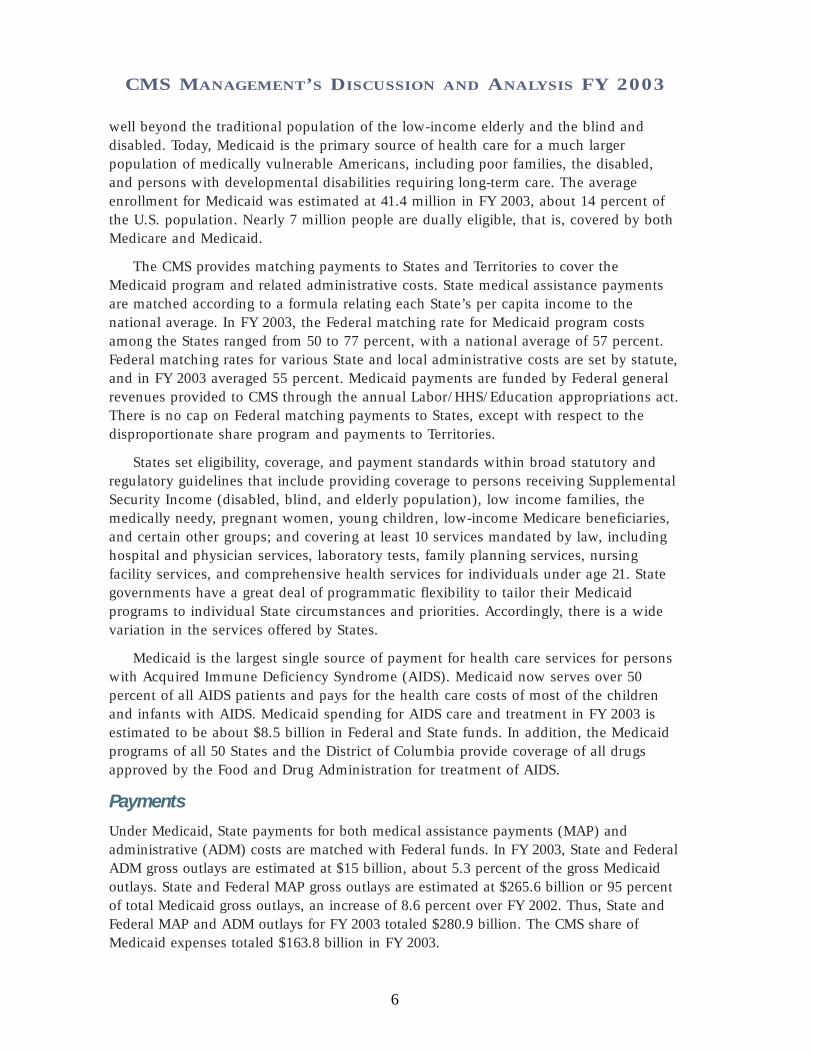
Part A benefits. The SMI programpays for physician, outpatienthospital, home health, laboratorytests, durable medical equipment,designated therapy, and otherservices not covered by HI. The SMIcoverage is optional and beneficiariesare subject to monthly premiumpayments. About 95 percent of HIenrollees elect to enroll in SMI.
The SMI program is financedprimarily by transfers from thegeneral fund of the U.S. Treasuryand by monthly premiums paid bybeneficiaries. Funds not currentlyneeded to pay benefits and relatedexpenses are held in the SMI trustfund, and invested in U.S. Treasurysecurities.
4
CMS MANAGEMENT’S DISCUSSION AND ANALYSIS FY 2003

Also based on estimates, during FY 2003, SMI benefit outlays grew by 8.8 percent.Physician services, the largest component of SMI, accounted for 40 percent of SMIbenefit outlays. The SMI benefit outlays per enrollee are projected to increase 7.4percent to $3,059.
Medicare+Choice
The Balanced Budget Act of 1997 (BBA) created the Medicare+Choice (M+C) program,which was designed to provide more health care coverage choices for Medicarebeneficiaries. Those who are entitled because of age (65 or older) or disability maychoose to join an M+C plan if they are entitled to Part A and enrolled in Part B, if thereis a plan available in their area. Those who are entitled to Medicare because of ESRDmay join an M+C plan only under special circumstances.
Medicare beneficiaries have long had the option to choose to enroll in prepaidhealth care plans that participate in Medicare instead of receiving services undertraditional FFS arrangements. Managed care organizations have their own providers or anetwork of contracting health care providers who agree to provide health care servicesfor health maintenance organizations (HMO) or prepaid health organizations’ members.Managed care organizations currently serve Medicare beneficiaries through coordinatedcare plans, which include HMOs, point-of-service (POS) plans offered by HMOs,preferred provider organizations (PPOs), and provider-sponsored organizations (PSOs).Under M+C, beneficiaries may also choose to join a private FFS plan that is available intwenty-five States. Managed care demonstration projects, as well as cost and HealthCare Prepayment Plans (HCPPs) options, also exist.
All M+C plans are paid a per capita premium, assume full financial risk for all careprovided to Medicare beneficiaries, and must provide all Medicare covered services. ManyM+C plans offer additional services such as prescription drugs, vision and dental benefits tobeneficiaries. Cost contractors are paid a pre-determined monthly amount per beneficiarybased on a total estimated budget. Adjustments to that payment are made at the end of theyear for any variations from the budget. Cost plans must provide all Medicare-coveredservices, but do not always provide the additional services that some risk M+C plans offer.The HCPPs are paid in a manner similar to cost contractors, but cover only non-institutionalPart B Medicare services. Section 1876 cost-based contractors and HCPPs, with certainlimited exceptions, phase out under the BBA provisions.
Managed care outlays are estimated to be $36.4 billion of the total $271.2 billion inMedicare benefit payment outlays in FY 2003.
Medicaid
Introduction
Medicaid is the means-tested health care program for low-income Americans,administered by CMS in partnership with the States. Enacted in 1965 as title XIX of theSocial Security Act, Medicaid was originally legislated to provide medical assistance torecipients of cash assistance. Over the years, Congress incrementally expanded Medicaid
5
CMS MANAGEMENT’S DISCUSSION AND ANALYSIS FY 2003
well beyond the traditional population of the low-income elderly and the blind anddisabled. Today, Medicaid is the primary source of health care for a much largerpopulation of medically vulnerable Americans, including poor families, the disabled,and persons with developmental disabilities requiring long-term care. The averageenrollment for Medicaid was estimated at 41.4 million in FY 2003, about 14 percent ofthe U.S. population. Nearly 7 million people are dually eligible, that is, covered by bothMedicare and Medicaid.
The CMS provides matching payments to States and Territories to cover theMedicaid program and related administrative costs. State medical assistance paymentsare matched according to a formula relating each State’s per capita income to thenational average. In FY 2003, the Federal matching rate for Medicaid program costsamong the States ranged from 50 to 77 percent, with a national average of 57 percent.Federal matching rates for various State and local administrative costs are set by statute,and in FY 2003 averaged 55 percent. Medicaid payments are funded by Federal generalrevenues provided to CMS through the annual Labor/HHS/Education appropriations act.There is no cap on Federal matching payments to States, except with respect to thedisproportionate share program and payments to Territories.
States set eligibility, coverage, and payment standards within broad statutory andregulatory guidelines that include providing coverage to persons receiving SupplementalSecurity Income (disabled, blind, and elderly population), low income families, themedically needy, pregnant women, young children, low-income Medicare beneficiaries,and certain other groups; and covering at least 10 services mandated by law, includinghospital and physician services, laboratory tests, family planning services, nursingfacility services, and comprehensive health services for individuals under age 21. Stategovernments have a great deal of programmatic flexibility to tailor their Medicaidprograms to individual State circumstances and priorities. Accordingly, there is a widevariation in the services offered by States.
Medicaid is the largest single source of payment for health care services for personswith Acquired Immune Deficiency Syndrome (AIDS). Medicaid now serves over 50percent of all AIDS patients and pays for the health care costs of most of the childrenand infants with AIDS. Medicaid spending for AIDS care and treatment in FY 2003 isestimated to be about $8.5 billion in Federal and State funds. In addition, the Medicaidprograms of all 50 States and the District of Columbia provide coverage of all drugsapproved by the Food and Drug Administration for treatment of AIDS.
Payments
Under Medicaid, State payments for both medical assistance payments (MAP) andadministrative (ADM) costs are matched with Federal funds. In FY 2003, State and FederalADM gross outlays are estimated at $15 billion, about 5.3 percent of the gross Medicaidoutlays. State and Federal MAP gross outlays are estimated at $265.6 billion or 95 percentof total Medicaid gross outlays, an increase of 8.6 percent over FY 2002. Thus, State andFederal MAP and ADM outlays for FY 2003 totaled $280.9 billion. The CMS share ofMedicaid expenses totaled $163.8 billion in FY 2003.
6
CMS MANAGEMENT’S DISCUSSION AND ANALYSIS FY 2003

Enrollees
Children comprise nearly half of Medicaid enrollees, but account for only 17 percent ofMedicaid outlays. In contrast, the elderly and disabled comprise 29 percent of Medicaidenrollees, but accounted for 65 percent of program spending. The elderly and disableduse more expensive services in all categories, particularly nursing home services.
Service Delivery Options
Many States are pursuing managed care as an alternative to the FFS system for theirMedicaid programs. Managed health care provides several advantages for Medicaidbeneficiaries, such as enhanced continuity of care, improved preventive care, andprevention of duplicative and contradictory treatments and/or medications. Most Stateshave taken advantage of waivers provided by CMS to introduce managed care planstailored to their State and local needs, and 47 States now offer a form of managed care.The number of Medicaid beneficiaries enrolled in managed care has grown from slightlyunder 15 percent in 1993 to over 57 percent in 2002.
The CMS and the States have worked inpartnership to offer managed care to Medicaidbeneficiaries. Moreover, as a result of the BBA,States may amend their State plan to require cer-tain Medicaid beneficiaries in their State toenroll in a managed care program, such as amanaged care organization or primary care casemanager. Medicaid law provides for two kinds ofwaivers of existing Federal statutes and twoother options through the State plan process toimplement managed care delivery systems:
1) State health reform waivers—Section 1115 of the Social Security Act provides broad discretion to waive certain provisions of
7
CMS MANAGEMENT’S DISCUSSION AND ANALYSIS FY 2003

Medicaid law for experimental, pilot, or demonstration projects. In August 2001, thePresident announced a section 1115 initiative, known as Health Insurance Flexibilityand Accountability, to increase health insurance coverage by coordinating availableMedicaid and SCHIP funding with private insurance options.
2) Freedom of choice waivers—Section 1915(b) of the Social Security Act allows certainprovisions of Medicaid law to be waived to allow States to develop innovativemanaged health care delivery systems.
3) Other State plan options to implement managed care—Section 1932(a) of the SocialSecurity Act allows States to mandate managed care enrollment for certain groups ofMedicaid beneficiaries. Certain populations, including dual eligibles, childrenreceiving SSI, children with special health care needs, and American Indians areexempted from the State plan option. For these groups, States require waivers tomandate enrollment into managed care.
States may also elect to include the Program of All-Inclusive Care for the Elderly(PACE) as a State plan option. The PACE is a prepaid, capitated plan that providescomprehensive health care services to frail, older adults in the community, whoenroll on a voluntary basis and who are eligible for nursing homes according toState standards.
State Children’s Health Insurance
The State Children’s Health Insurance Program (SCHIP) was createdthrough the BBA to address the fact that nearly 11 million Americanchildren—one in seven—were uninsured and therefore at increasedrisk for preventable health problems. Many of these children were inworking families that earned too little to afford private insurance ontheir own, but too much to be eligible for Medicaid. Congress and theAdministration agreed to set aside nearly $40 billion over ten years,beginning in FY 1998, to create SCHIP—the largest health care invest-ment in children since the creation of Medicaid in 1965. These funds
cover the cost of insurance, reasonable costs for administration, and outreach services toget children enrolled. To make sure that funds are used to cover as many children aspossible, funds must be used to cover previously uninsured children, and not to replaceexisting public or private coverage. Important cost-sharing protections were also establishedso families would not be burdened with out-of-pocket expenses they could not afford.
The statute sets the broad outlines of the program's structure, and establishes apartnership between the Federal and State governments. States are given broadflexibility in tailoring programs to meet their own circumstances. States can create orexpand their own separate insurance programs, expand Medicaid, or combine bothapproaches. States can choose among benchmark benefit packages, develop a benefitpackage that is actuarially equivalent to one of the benchmark plans, use the Medicaidbenefit package, or a combination of these approaches.
8
CMS MANAGEMENT’S DISCUSSION AND ANALYSIS FY 2003

States also have the opportunity to set eligibility criteria regarding age, income, andresidency within broad Federal guidelines. The Federal role is to ensure that Stateprograms meet statutory requirements that are designed to ensure meaningful coverageunder the program.
We work closely with States, Congress, and other Federal agencies to meet thechallenge of implementing this program, while at the same time approving State planamendments as quickly as possible. The CMS provides extensive guidance and interiminstructions so States can further develop their plans and use Federal funds to insure asmany children as possible. Since September 30, 1999, all 50 States, the District ofColumbia, and the Territories had approved child health plans. Of these, 19 areMedicaid expansions, 19 are separate State Child Health plans, and 18 are combinationplans. In addition, 170 amendments and 13 section 1115 waivers have been approvedthat provide SCHIP funds to States to cover pregnant women and parents of childrenenrolled in Medicaid or SCHIP.
Other Activities
In addition to making health care payments to providers and States on behalf of our benefi-ciaries, CMS makes other important contributions to the delivery of health care in the U.S.
Survey and Certification Program
We are responsible for assuring the safety and quality of medical facilities, laboratories,providers, and suppliers by setting standards, conducting inspections, certifyingproviders as eligible for program payments, and ensuring that corrective actions aretaken where deficiencies are found. The survey and certification program is designed toensure that providers and suppliers comply with Federal health, safety, and programstandards. We administer agreements with State survey agencies to conduct onsitefacility inspections. Funding is provided through the Program Management and theMedicaid appropriations. Only certified providers, suppliers, and laboratories are eligiblefor Medicare or Medicaid payments. Currently, CMS Survey and Certification staffoversee compliance with Medicare health and safety standards in over 241,000 medicalfacilities of different types, including hospitals, laboratories, nursing homes, homehealth agencies, hospices, and end stage renal disease facilities.
Clinical Laboratory Improvement Program
The Clinical Laboratory Improvement Amendments of 1988 (CLIA) expanded survey andcertification of clinical laboratories from Medicare-participating and interstate commercelaboratories to all facilities testing specimens from the human body. We regulate alllaboratory testing (whether provided to beneficiaries of CMS programs or to others)including those in physicians’ offices. In partnership with the States, we certify andinspect more than 15,000 laboratories each year. The CLIA program is a 100 percent user-fee financed program. The CLIA program is jointly operated by three HHS components:(1) CMS provides financial management of the program, contracts with surveyors to
9
CMS MANAGEMENT’S DISCUSSION AND ANALYSIS FY 2003

inspect labs, and offers general administrative support, (2) TheCenters for Disease Control and Prevention (CDC) provides researchsupport, and (3) The Food and Drug Administration (FDA) overseestest categorization.
Quality of Care
Through QIOs, ESRD Networks, State agencies, and others, CMScollaborates with health care providers and suppliers to promote theimproved health status of Medicare and Medicaid beneficiaries in both FFS and managedcare settings. These collaborative projects often employ a sequential process that includessetting priorities, collecting and analyzing data, identifying opportunities to improve care,establishing performance expectations, and selecting and managing one or moreimprovement strategies. One of the tools for improving patient care is the developmentand dissemination of quality indicators and the publication of performance information.
In November 2001, Secretary Thompson announced the Quality Initiative, hiscommitment to assure quality health care for all Americans through accountability andpublic disclosure. The initiative aims to (a) empower consumers with quality of careinformation to make more informed decisions about their health care, and (b) stimulateand support providers and clinicians to improve the quality of health care. The QualityInitiative was launched nationally in November 2002 for nursing homes (the NursingHome Quality Initiative or NHQI), and is being expanded to the nation’s home healthcare agencies (the Home Health Quality Initiative or HHQI) and hospitals in 2003.
The CMS initiated the NHQI to continue to improve quality of care in nursing homes.Working with measurement experts, the National Quality Forum, and a diverse group ofnursing home industry stakeholders, CMS adopted a set of improved nursing homequality measures. Following pilot testing in November 2002, CMS released quality of careinformation for nearly 17,000 nursing homes in all 50 states, the District of Columbia,and some U.S. Territories on www.medicare.gov. They are important to consumers, areaccurate (reliable, valid, and risk adjusted), can be used to show ways in which facilitiesare different from one another, and can be influenced by the provision of high qualitycare by nursing home staff. The quality measures are just one more piece of theinformation available to help consumers make informed decisions about their nursinghome care. The measures are also intended to motivate nursing homes to improve theircare and to inform discussions about quality between consumers and clinicians.
The HHQI combines new information for consumers about the quality of careprovided by home health agencies with important resources available to improve thequality of home health care. In 2003 CMS is publishing on www.medicare.gov a set ofhome health quality measures on every Medicare-certified home health agency in theUnited States. The quality measures are an additional resource to help consumerscompare the quality of care provided by home health agencies. The quality measuresare also intended to motivate home health agencies to improve care and to informdiscussions about quality between consumers and clinicians.
10
CMS MANAGEMENT’S DISCUSSION AND ANALYSIS FY 2003

We are conducting a similar initiative for hospital quality, although because there are manytechnical details to be resolved, there are a number of complementary developmental activitiesat this time. We are working in three states (Maryland, New York, and Arizona) to pilot test apatient perception of care survey and consumer messages about quality. We are working withthe Department of Public Health in Connecticut to help them implement a state mandate forpublic reporting of hospital quality in a way that makes it consistent with Federal efforts. TheCMS is part of a large national public-private partnership in which hospitals are volunteeringto publicly report clinical and ‘patient perception’ measures. These will be reported onwww.cms.hhs.gov in 2003, and migrated to www.medicare.gov in 2004. We are alsolaunching a ‘pay for performance’ demonstration project to test additional measures for publicreporting and the role of bonus payments as incentives for improvement in quality.
In addition, as we revise our conditions of participation or conditions of coverage forproviders and suppliers, we are focusing on outcome-based requirements that focus onthe patient. We continue to believe that providers and suppliers must ensure that thereis an effective quality assessment and performance improvement program to evaluatethe provision of patient care.
Coverage Policy
In today's health care market, every insurer and health care purchaser must deal withcoverage policy. We established a process that provides current information on coverageissues on the CMS coverage Web site and also facilitates input from all stakeholders,including beneficiaries, through the Medicare Coverage Advisory Committee (MCAC).The MCAC holds open meetings and includes consumer and industry members. We alsorely on state-of-the-art technology assessment and support from other Federal agencies,as well as considerable staff expertise.
Medicare is a leader in evidence-based decision making for coverage policy. Ourown extensive payment data contain additional useful information that is used by theAgency for Healthcare Research and Quality (AHRQ) and others for assessing theeffectiveness of a variety of medical treatments.
Insurance Oversight and Data Standards
We have primary responsibility for implementing and enforcing Federal standards for theMedigap insurance offered to Medicare beneficiaries to help pay the coinsurance anddeductibles that Medicare does not cover. We work with State insurance commissioners’offices to ensure that suspected violations of Federal laws governing the marketing andsales of Medigap are addressed.
We are responsible for implementing and enforcing most of the HIPAA’s administrativesimplification provisions, which are aimed at streamlining healthcare administration and atreducing administrative costs. The HIPAA requires HHS to adopt national uniform standardsfor the electronic transmission of certain health information. As a result, “covered entities”such as health care providers, health plans, billing services and other business partners, whodo business electronically, must use the same health care transactions, code sets, andidentifiers. Although HIPAA does not mandate the collection or electronic transmission ofany health information, it does require that adopted standards be used for any electronic
11
CMS MANAGEMENT’S DISCUSSION AND ANALYSIS FY 2003

transmission of specified transactions, including claims payment, remittance advice, andcoordination of benefits. The HIPAA also requires that patients’ personal health informationmust be more securely guarded and more carefully handled while it is being used by healthcare providers and health plans. In response, CMS issued a regulation outlining theadministrative, technical, and physical safeguards required to protect confidentiality,integrity, and access of protected health care information. We are also responsible forimplementing HIPAA’s requirements for health care providers, health plans, and employersto have standard identifiers for use on standard transactions.
As a result of the insurance reform provisions of HIPAA, CMS has assumed a newrole in relation to State regulation of health insurance and health coverage. We workwith the State Insurance Commissioners’ offices, the U.S. Department of Labor, and theInternal Revenue Service to implement these provisions. The common goal is to improveaccess to the group and individual health insurance markets for certain eligibleindividuals who move from job to job, or who lose their group health insurancecoverage and must purchase coverage in the individual insurance market. These newconsumer protections affect an estimated 160 million individuals.
PERFORMANCE GOALSThe passage of the Government Performance and Results Act (GPRA) in 1993 mandatedthat agencies have strategic plans, annual performance plans (APP), and reports thatmake them accountable stewards of public programs. The CMS has embraced that chargeand has emphasized the themes of accountability, stewardship, and a renewed focus onthe customer with its mission to “assure health care security for beneficiaries” with itsstrategic goals and performance goals.
Our approach to performance measurement under GPRA is to develop goals that arerepresentative of our vast responsibilities. The APP describes CMS performance goals andtheir linkage to longer-term strategic goals and to the budget. It includes the steps toaccomplish each performance goal, and establishes a method and data source formeasuring and reporting.
Our performance goals also reinforce the President’s Management Agenda (PMA).For example, the PMA objective to improve financial performance is reflected by our goalto reduce the percentage of improper payments made under the Medicare fee-for-serviceprogram. Performance goals are also key to the Office of Management & Budget’sProgram Assessment Rating Tool (PART) and support the PMA objective of integratingbudget and performance.
The FY 2003 APP includes 36 goals for CMS programs that highlight major programareas and budget categories. It reflects key Administration and CMS priorities for the nextseveral years. Our performance goals reflect a sensitivity to customer needs and anawareness that meeting those needs will require flexibility and imagination, as well assound business sense.
12
CMS MANAGEMENT’S DISCUSSION AND ANALYSIS FY 2003

In the following sections, we highlight a few of our key FY 2003 performance goalsand outcomes. Our progress on the remaining 33 goals will be submitted with the AnnualPerformance Report along with the President’s budget request for FY 2005.
Medicare
Beneficiaries are Medicare’s primary customers. One of CMS’ primary goals is to assuresatisfaction in the experiences beneficiaries have in accessing care for illness and injurieswhen needed, including their access to care of specialists. In response to the need to
standardize the measurement of and monitor beneficiaries’ experience and satisfaction withthe care they receive through Medicare, CMS developed a series of data collection activitiesunder the Consumer Assessment Health Plans Surveys (CAHPS). The CMS fields thesesurveys annually to representative samples of beneficiaries enrolled in each Medicaremanaged care plan as well as those enrolled in the original Medicare fee-for-service (FFS)plan. The CMS provides comparable sets of specific performance measures collected inCAHPS to Quality Improvement Organizations (QIOs), health plans, and beneficiariesthrough various means, including the National Medicare & You Education Program (NMEP).
The CMS’ multi-year efforts to improve beneficiary satisfaction with the health carethey receive apply to both managed care and FFS. In an effort to capture more completeinformation for the managed care portion, data from a managed care disenrollee survey iscombined with survey data from current managed care enrollees. Baselines and targetswere recalculated in CY 2000 to reflect this change. In order for the increase to bestatistically significant, these are long-term targets with reports due at the end of the5-year period.
13
CMS MANAGEMENT’S DISCUSSION AND ANALYSIS FY 2003

Our FY 2003 target of directing efforts to improve beneficiary satisfaction in both FFSand managed care is being met by continuing to collect and share CAHPS informationfrom beneficiaries with health plans, QIOs, and beneficiaries.
Reduce the Percentage of Improper Payments Made Under the MedicareFee-for-Service Program
One of CMS' key goals is to pay claims properly the first time. This means paying the rightamount to legitimate providers for covered services provided to eligible beneficiaries.Paying claims right the first time saves resources required to recover improper paymentsand ensures the proper expenditure of valuable Medicare trust fund dollars.
Prior to FY 2003, the OIG estimated the amount of the improper payments for Medicareclaims included in the CMS Financial Report. Beginning in FY 2003, this activity wasassumed by CMS with the intention of expanding the number of claims sampled in orderto obtain more detailed information to better identify and correct payment problems.
The 2003 CMS Financial Report includes estimates from the results of two programsused by CMS: the Comprehensive Error Rate Testing (CERT) program with a sample of70,567 claims; and the Hospital Payment Monitoring Program (HPMP) with a sample of57,775 discharges. The CERT program implements a new sampling and reviewmethodology (for non-PPS inpatient hospital claims) that provides estimates of the nationalerror rate with tighter precision. In addition, it employs independent reviewers to makedeterminations for 70,567 claims providing estimates of error rates by contractor, by servicetype, and by provider type.
These programs provide CMS with a much more rigorous set of data to manage ourcontractors, identify and prevent errors, and educate providers who bill our programs. As aresult of the 2003 programs, we believe that the paid claims error rate remains at about thesame rate as last year. Our analysis determined an adjusted paid claims error rate of 5.8percent, or $11.6 billion, compared to an unadjusted 9.8 percent rate ($19.6 billion). Theunadjusted rate reflected an unusually high non-response rate because every non-responsewas treated as an error (54.7% of errors were due to non-responses). We believe the highnon-response rate was due to the impact of HIPAA privacy rules, record requests made byan unfamiliar entity, and like the OIG in the first year they calculated the error rate, generaldifficulties in getting providers to follow-up on record requests. We adjusted the error rateusing a conservative non-response estimate based on the OIG’s average non-response rateof 12 percent for the past 7 years.
For the first time CMS can use the Medicare error rate to show where it is overpayingor underpaying claims, and for what categories of service. Now that CMS has detailederror rates, it can aggressively target its efforts to fix problems they indicate.
The CMS has taken a number of steps to minimize the non-response problem in thefuture. For example, CMS has revised the letters requesting medical records byclarifying the role of the error calculation contractor, explaining that it is not a HIPAAcompliance violation to submit records to the error calculation contractor, and allowingproviders to fax records. As a result, adjustments for non-response should not benecessary for FY 2004.
14
CMS MANAGEMENT’S DISCUSSION AND ANALYSIS FY 2003

The CMS is working with the contractors that pay Medicare claims and the QIOs onaggressive efforts to lower the paid claims error rate, including: (1) developing a tool thatgenerates state-specific hospital billing reports to help QIOs analyze administrative claimsdata, (2) increasing and refining one-on-one educational contacts with providers found tobe billing in error, and (3) developing projects with the QIOs addressing state-specificadmissions necessity and coding concerns, as well as conducting surveillance andmonitoring of inpatient payment error trends by error type.
In addition, CMS has directed the Medicare contractors to develop local efforts tolower the error rate by developing plans that address the cause of the errors, the stepsthey are taking to fix the problems, and other recommendations that will ultimately lowerthe error rate. The CERT program is an important new tool in monitoring contractorperformance. It will provide CMS with the fundamental structure to hold the fee-for-service contractors accountable for the services they provide as CMS moves toperformance-based contracting from simply paying contractors to process Medicare claims.
Medicaid and SCHIP
15
CMS MANAGEMENT’S DISCUSSION AND ANALYSIS FY 2003

The SCHIP and Medicaid programs have made an unprecedentedinvestment to improve the quality of life for millions of vulnerable,uninsured, low-income children. Through title XXI of the Social SecurityAct, States were given the option to expand their Medicaid program,establish a separate SCHIP, or use a combination of both. The CMS’goal is to increase the number of children (up to age 19 for SCHIP; age21 for Medicaid) who are enrolled in regular Medicaid or SCHIP.During FY 2002, there were approximately 30 million children enrolledin SCHIP and Medicaid, which is about 2,750,000 over the previous year's level.
When CMS first implemented this GPRA enrollment goal, the objective was to enrollfive million children in the program by FY 2005. Based on this objective, we set our initialtargets to increase enrollment by one million over the previous year. Because we haveexceeded this goal and are now seeing States face fiscal challenges that may affectprogram outreach and enrollment, we are unsure about future projections and havedecided to set our FY 2003 target to increase enrollment by five percent over the previousyear. We expect FY 2003 data in early CY 2004.
FINANCIAL ACCOMPLISHMENTS ANDSTATEMENT HIGHLIGHTSFor the fifth consecutive year, we received an unqualified audit opinion on our financialstatements from the auditors, indicating that our financial statements are fairlypresented in all material respects. Of particular significance, we achieved such amilestone under a greatly accelerated timeline—more than two months earlier than lastyear. Our strategic vision for financial management is: To develop and maintain astrong financial management operation to meet the changing requirements andchallenges of the twenty-first century as we continue to safeguard the assets of theMedicare trust funds. To accomplish this vision, our four key financial managementobjectives are to: (1) improve financial reporting, guidance, and contractor oversight byproviding timely, reliable, and accurate financial information so that CMS managementand other decision makers make timely and accurate program and administrativedecisions, (2) design and implement effective financial management systems thatcomply with the Federal Financial Management Improvement Act (FFMIA), (3) improvedebt collection and internal accounting operations, and (4) validate key financial data toensure its accuracy and reliability.
16
CMS MANAGEMENT’S DISCUSSION AND ANALYSIS FY 2003

CFO Audit
We received our first unqualified audit opinion on our financialstatements in FY 1999. While obtaining an unqualified opinionremains an important goal, we continue to make financialmanagement improvements. For example, we have improved internal controls and theunderlying financial reporting processes to ensure that we can generate accuratefinancial data on an on-going and timely basis. However, our auditors have concernsover some aspects of contractor financial reporting. One of the major issues remaining isthe status of accounts receivable, most of which are maintained on our behalf by ourfiscal intermediaries (FI) and carriers. These organizations, commonly referred to asMedicare contractors, have contracted with CMS to administer the day-to-day operationsof the Medicare program. They pay claims, audit provider cost reports, and establishand collect overpayments. Because the systems used by the Medicare contractors havenot always produced data that were adequately supported, our auditors have haddifficulty validating their accounts receivable balances.
Accounts Receivable
To continue receiving an unqualified opinion, our financial statements have to properlyreflect accounts receivable at their true economic value based on provisions providedwithin the Office of Management and Budget Circular A-129, Managing Federal CreditPrograms. Medicare accounts receivable consist primarily of provider and beneficiaryoverpayments, and Medicare Secondary Payer (MSP) receivables of paid claims that wesubsequently determined that Medicare should have been the secondary rather than theprimary payer.
We continue to use independent certified public accountants (CPAs) to reviewMedicare contractor accounts receivable balances in order to validate the receivableamounts reported to CMS and the adequacy of their internal controls. For FY 2003, theconsultants conducted reviews at 15 Medicare contractors, which comprised about 80percent of the accounts receivable balance reflected in last year’s financial statements.Additionally, the scope of these reviews included the timely implementation of Medicarecontractors’ financial management corrective action plans (CAPs).
The reviews disclosed a total of $98.3 million errors (principal only) ($91.1 millionnon-MSP and $7.2 million MSP) resulting in the accounts receivable being overstated by$11.6 million ($5.0 million non-MSP and $6.6 million MSP). These amounts continue toindicate significant progress and reflect our enduring commitment to generate accuratefinancial statements.
While we have made significant improvements in financial reporting, our auditorscontinue to report a material weakness in the financial systems, analyses, and oversightarea. Our long-term solution to this material weakness is the Healthcare IntegratedGeneral Ledger Accounting System (HIGLAS). The HIGLAS will provide CMS with anintegrated financial management system that conforms to government-wide
17
CMS MANAGEMENT’S DISCUSSION AND ANALYSIS FY 2003

requirements and will strengthen management of Medicare accounts receivable. Untilthis system is implemented, we will compensate for the lack of a modernized systemthrough other means.
Debt Management
We collect the majority of our debt because most overpay-ments are recognized timely, thus allowing future claims tobe offset against current overpayments. Debts that are over180 days delinquent are subject to the Debt CollectionImprovement Act (DCIA). Under the DCIA, Federal agenciesare required to refer all eligible debts over 180 days
delinquent to the Department of Treasury (Treasury) for cross-servicing and/or TreasuryOffset Program (TOP). Debts referred to the TOP are housed in the National InteractiveDatabase and matched to the Federal payments for potential offset. Debts referred forcross-servicing, which is the other primary collection tool used by the Treasury’sFinancial Management Service, can have a variety of collection activities, includingsending additional demand letters, referring debts to the TOP, referring debts to privatecollection agencies, negotiating repayment agreements, and eventually referring somedebts to the Department of Justice for litigation, if necessary. The HHS Program SupportCenter (PSC) serves as the Debt Collection Center (DCC) for all CMS debts. Themajority of all CMS debts (MSP and non-MSP) are referred to Treasury, via the PSC, forcross-servicing and referral to TOP.
Our debt referral process encompasses all Medicare contractors, CO, and ROs, whoforward demand letters to the delinquent debtors and input the debt information into ourDebt Collection System (DCS) to transmit the debt electronically to the PSC for referral toTreasury. During FY 2003, we referred approximately $700 million of delinquent debt toTreasury for cross-servicing and TOP. This brought our total gross delinquent debtreferred to approximately $6.2 billion, which is about 96 percent of the total net eligibleto be referred. Our goal is to have 100 percent of our eligible delinquent debt referred toTreasury for cross-servicing and TOP by the end of the first quarter of FY 2004.
Medicare Contractor Oversight
Medicare contractors administer the day-to-day operations of the Medicare program bypaying claims, auditing provider cost reports, and establishing and collecting overpay-ments. As part of these activities, Medicare contractors are required to maintain a vastarray of financial data. Due to the materiality of this data, we must have assurances as toits validity and accuracy.
In FY 2002, the financial statement auditors reported that CMS continued to buildupon prior efforts to improve its oversight of Medicare contractors and that it shouldcontinue to enhance its review of information included in its financial statements.Progress in these areas is ongoing through the workgroups comprised of CO and RO
18
CMS MANAGEMENT’S DISCUSSION AND ANALYSIS FY 2003
consortia staff that address the areas identified by auditors:follow up on CAPs, reconciliations of funds expended to paidclaims, trend analysis, and internal controls. The workgroupshave defined CO and RO roles and responsibilities, anddeveloped national strategic plans to strengthen our Medicarecontractor financial management oversight.
Corrective Action Plans
The CMS conducts various financial management and electronic data processing (EDP)audits and reviews performed by the OIG, GAO, independent CPA firms, and CMS ROand CO staff to provide reasonable assurance that Medicare contractors have developedand implemented sound internal controls. The results of these reviews indicate whetherthe contractors’ internal controls are operating as designed and identify existingdeficiencies. Correcting these deficiencies is essential to improve financial management.Therefore, audit resolution remains a top priority at CMS. Medicare contractors, ROs, andCO components are required to prepare an initial CAP, which describes activities tocorrect all identified findings. Additionally, quarterly updates to the CAPs are required.The CMS reviews all initial CAPs and quarterly CAP updates for adequacy.
During FY 2003, the CMS CAP Workgroup revised the manual policies and proce-dures for the reporting and implementation of CAPs by the Medicare contractors toprovide additional clarification regarding the submission of the “Universal CAP Report”that was developed in FY 2002. The CAP report consolidates all findings identifiedduring CFO initiated audits, SAS 70 reviews, and reviews of accounts receivablebalances. It also standardizes the format of CAP submissions and facilitates CMS’monitoring responsibilities of these reports. Training on the changes to our procedureswas provided during our annual CFO training conferences. Furthermore, we arecompleting the development of a CAP database that will enable us to monitor theimplementation of the CAPs more efficiently, analyze recurring findings, and generatereports based on select criteria. Designated CO and RO staff will have access to thesystem, thereby eliminating the need for the creation of multiple spreadsheets to bemanually created and updated.
The CAP Workgroup also developed a CAP review protocol for CO and RO staff.This protocol provides a consistent step-by-step approach for following up on andresolving open financial findings. The protocol includes a standard closeout letter toreport the results of the review and recommendation for CAP closure.
We also used independent CPA firms to conduct CAP follow-up reviews during theSAS 70 reviews and accounts receivable agreed upon procedure reviews that wereperformed in FY 2003.
CMS-1522 Reconciliations
On a monthly basis, Medicare contractors perform a reconciliation of their FormCMS-1522 Funds Expended Report to their paid claims or system reports. Althoughcontractors are required to submit this reconciliation to CMS each month, the financial
19
CMS MANAGEMENT’S DISCUSSION AND ANALYSIS FY 2003

statement auditors continue to identify this area as a material weakness during theannual CFO audit.
During FY 2003, the CMS-1522 Cash Reconciliation Workgroup worked with theOffice of Inspector General and issued reconciliation procedures to Medicare contractorswho process and pay claim under the Fiscal Intermediary Shared System (FISS) andMulti-Carrier System (MCS). The detailed procedures require Medicare contractors toreconcile, on a monthly basis, total funds expended by CMS to the correspondingMedicare claims that have been submitted and paid. The System Maintainers arecurrently programming system changes and the procedures are anticipated to beeffective January 2004.
The CMS selected and performed reviews at 11 Medicare contractor locations duringFY 2003. Teams consisting of CMS RO and CO staff completed the reviews. DuringFY 2004, the workgroup will continue to perform reviews of the Form CMS-1522reporting and reconciliation processes at a sample of contractors.
Trend Analysis
We continue to enhance our analytical tools to provide thesteps to identify potential errors, unusual variances, systemweaknesses or inappropriate patterns of financial dataaccumulation. The Trend Analysis Workgroup has revisedpolicies and updated procedures for performing trend analysisof critical financial related data, such as accounts receivable
and quarterly financial statements, reported by CMS and our Medicare contractors. Thesetools allow us to perform more extensive data analyses and determine the need foradditional actions to ensure that problems are adequately resolved.
To ensure that accounts receivable balances reported are reasonable, Medicarecontractors are required to perform trend analysis on a quarterly basis and maintaindocumentation supporting it. During the annual CFO training conferences, the workgroupprovides trend analysis training to the Medicare contractors. Additionally, the workgroupprovides training to CO and RO staff on the review procedures that are used to reviewthe adequacy of Medicare contractors’ quarterly trending analysis submissions.
Internal Controls
To continue our emphasis on the importance of internal controls, the CertificationPackage on Internal Controls (CPIC) Workgroup continued to develop and communi-cate a heightened awareness of internal controls within the Medicare contractor com-munity. In FY 2003, members of the CPIC workgroup tested the CPIC protocol reviewat four Medicare contractors for the FY 2002 CPIC submission. The workgroup alsoupdated manual instructions that provide guidelines and policies to the Medicarecontractors to enable them to strengthen their internal control procedures. This included
20
CMS MANAGEMENT’S DISCUSSION AND ANALYSIS FY 2003

the annual update of the control objectives. The past several years have confirmed aneed for a structured internal control strategy and process for CMS. In the past, we havebeen criticized for not providing a level of assurance that Medicare contractors hadadequate systems of internal controls that were in place and operating efficiently. Webelieve the procedures and methods set forth in this manual will alleviate the problemsand weaknesses for which the program has been cited.
Additionally, we require all Medicare contractors to submit an annual CPIC on theirMedicare operations by October 15 of each FY. In the CPIC, contractors are required toreport their material weaknesses identified during the FY. They are also required tomaintain an internal list of reportable conditions. We require CAPs for all materialweaknesses reported in the CPICs. During FY 2003, we also contracted with CPA firmsto conduct SAS 70 internal control reviews of 24 Medicare contractors. The reviewsindicated that 22 Medicare contractors reviewed had one or more exceptions. To ensurethat the exceptions are properly addressed in a timely manner, we requested thecontractors to develop and submit CAPs. For FY 2004, we will continue to perform theseSAS 70 reviews and monitor contractors’ progress for implementing their CAPs.
Financial Management and Reporting
To achieve accurate financial reporting and reliable internal controls, we have identifiedthe following areas as significant.
Budget Execution
We continue to improve our budget execution for the Program ManagementAppropriation. The Financial Management Investment Board (FMIB), comprised ofsenior staff representing each CMS component, recommends allocations of resources insupport of our priorities. The CMS Deputy Administrator/Chief Operating Officer makesthe final operating plan allocations. In addition, we establish lapse targets for eachProgram Management allotment, and manage funds aggressively to meet those targets.This ensures available funds are identified timely and allocated to fund our priorities.
Guidance to Medicare Contractors
Medicare contractors provide much of the financial data CMS uses to manage theMedicare program. It is vital that they manage resources effectively and report accuratefinancial data. Therefore, we have continued to hold Medicare contractors accountablefor improved financial management. We do so by requiring them to fix all deficienciesidentified by the annual CFO audits and reviews and to report to us on a quarterly basison their progress.
During FY 2003, we continued to revise and issue Medicare contractor financialreporting instructions. These instructions include revising policies regarding thecalculation of the allowance for uncollectible accounts, recognizing and reporting non-MSP and MSP currently not collectible (CNC) debt, and recognizing and reporting claims
21
CMS MANAGEMENT’S DISCUSSION AND ANALYSIS FY 2003

accounts receivable. In addition, revisions were made to the format of the financialreports to enable Medicare contractors to provide more detailed financial data.
We also revised and clarified financial reporting and debtcollection policies and procedures based on findings from CFOaudits, oversight reviews, and SAS 70 internal control reviews.The evaluation of findings resulting from these reviews allowsus to perform risk analysis and profiling of Medicare contractorsto determine where our resources should be focused and whereadditional guidance is needed. Additionally, we clarified our guidance requiring Medicarecontractors to perform trend analysis procedures of its Medicare accounts receivablebalances on a quarterly basis. Our goal is to continue to improve the consistency ofinformation provided by the Medicare contractors.
We conducted two national training conferences for the Medicare contractors andROs. We presented our revised policies and procedures for financial reporting and trendanalysis, and also emphasized the importance of debt referral and internal controlsdocumentation. With assurances that data is valid and complete, we have greaterconfidence in the accuracy and reliability of the financial information reported.
Our Medicare contractor financial management manual provides guidance on budgetpreparation and execution, overpayments, debt collection, accounts receivable, contractorfinancial reports, and enhances contractors’ ability to map their internal controlenvironment, and assists us in the development of training on internal control require-ments. The manual is Internet-accessible.
Financial Reporting
In FY 2003, we continued to improve our financial statement reporting process withinCO. All financial data, including data provided by Treasury and other Federal agencies,was included in our general ledger. This facilitated the preparation of the financial state-ments by eliminating manual entries into spreadsheets to determine necessary adjust-ments. It also provided the auditors with a clearer audit trail.
We continued preparing automated formatted financial statements produced directlyfrom the Financial Accounting and Control System (FACS). This enabled the system toproduce an audit trail documenting manual adjustments made to accounts that affectthe financial statements. We also produced interim financial statements for the quartersending December 31, 2002, March 31, 2003, and June 30, 2003, and, for the sixthconsecutive year, submitted our financial statements through the automated financialstatement system implemented by HHS.
We have also complied with Treasury’s November 2003 reporting requirement forthe Federal Agencies Centralized Trial Balance System (FACTS) II and the January 2003reporting requirements for FACTS I. We continued to improve the operation of FACS byprogramming and implementing numerous accounting enhancements. These changesensured that we met new program and Treasury requirements, as well as improved ouradministrative and accounting operations.
22
CMS MANAGEMENT’S DISCUSSION AND ANALYSIS FY 2003

Medicare Secondary Payer
Our efforts in the MSP area saved the Medicare trust funds approximately $4.6 billiondollars in FY 2003. In addition, the MSP area has been actively pursuing delinquentdebts owed the Medicare Program as a result of the enactment of the DCIA.
The CMS continues to pursue Voluntary Data Sharing Agreements (VDSAs) withinsurers and large employers to secure health care coverage information on workingenrollees and dependents. Current participation (52 insurers and large employers) in theVDSA process represents over 40 percent of the Medicare beneficiary population. Ofthese, 10 were signed in FY 2003 including, among others, the Office of PersonnelManagement, the largest Federal employer in the U.S. Active negotiations continue witha dozen other large employers and insurers, and we are in technical discussion with anestimated 20 other interested entities.
Other Initiatives
For the past several years, the number of unsettled managed care cost reports has beendecreasing. The total backlog of unsettled managed care cost reports at the close of 2003was 133. Disallowances resulting from FY 2003 settlement activity amounted to about $50million. We have historically experienced a rate of return of about 22 to 1. For FY 2003,we had a rate of return of 20 to 1. The remaining backlog of unsettled managed care costreports still represents a challenge to CMS because these cost reports have critical issuesthat must be resolved with Managed Care Organizations (MCOs). Therefore, it is projectedthat settlement activity will remain stable in the future fiscal years.
We also made important accomplishments in our administrative payment areas. Wecontinued to pay all of our administrative payments on time in accordance with thePrompt Payment Act. Over 97 percent of our vendor reimbursements and virtually 100percent of our travel reimbursements are made electronically.
Healthcare Integrated General Ledger Accounting System
Although our CFO auditors have found that Medicarecontractors’ claims processing systems are operating effectivelyin paying claims, they were not designed to meet therequirements of a dual entry, general ledger accounting system.As a result, they do not meet the provisions of the FFMIA.Therefore, a key element of our strategic vision is to acquire an
FFMIA-compliant financial management system that will include all Medicare contractors.This project is called the Healthcare Integrated General Ledger Accounting System(HIGLAS). As part of this effort, CMS will replace the FACS, which accumulates all of theCMS financial activities, both programmatic and administrative, in its general ledger.
Following the guidance of OMB Circular A-130, Management of FederalInformation Resources, we acquired a commercial-off-the-shelf (COTS) product forHIGLAS. IBM is the systems integrator. Oracle Corporation and Electronic Data Systems
23
CMS MANAGEMENT’S DISCUSSION AND ANALYSIS FY 2003

are providing the financial accounting software and application service provider services,respectively. Implementing an integrated general ledger program will give CMS enhancedoversight of contractor accounting systems and provide high quality, timely data fordecision-making and performance measurement.
The HIGLAS project began with a pilot program with one Medicare contractor(Palmetto Government Benefit Administrators) that processes primarily hospital andother institutional claims, and another Medicare contractor (Empire Blue Cross BlueShield) that processes primarily physician and supplier claims. The pilot phase willreengineer the accounting business process of the Medicare contractors to support theaccounting software.
Once completed, the system will be thoroughly tested to ensure it works correctlyand can handle the large volume of financial transactions generated by the Medicareprogram before a final decision is made to install the accounting system for Medicareand all its contractors. Full implementation is projected for the end of FY 2007.
The new system will also strengthen management of Medicare accounts receivableand allow more timely and effective collection activities on outstanding debts. Theseimprovements in financial reporting by CMS and its contractors are essential to retainingan unqualified opinion on our financial statements, meeting the requirements of keyFederal legislation, and safeguarding government assets.
Financial Statement Highlights
Consolidated Balance Sheet
The Consolidated Balance Sheet presents amounts of future economic benefits owned ormanaged by CMS (assets), amounts owed (liabilities), and amounts that comprise thedifference (net position). The CMS Consolidated Balance Sheet shows $314.9 billion inassets. The bulk of these assets are in the Trust Fund Investments totaling $280.3billion, which are invested in U.S. Treasury Special Issues, special public obligations forexclusive purchase by the Medicare trust funds. Trust fund holdings not necessary tomeet current expenditures are invested in interest-bearing obligations of the UnitedStates or in obligations guaranteed as to both principal and interest by the United States.The next largest asset is the Fund Balance with Treasury of $18.5 billion, most of whichis for Medicaid and SCHIP. Liabilities of $48.9 billion consist primarily of theEntitlement Benefits Due and Payable of $48.1 billion. The CMS net position totals$266.0 billion and reflects the cumulative results of the Medicare trust fund investmentsand the unexpended balance for SCHIP.
Consolidated Statement of Net Cost
The Consolidated Statement of Net Cost shows a single amount—the actual net cost ofCMS operations for the period by program. The three major programs that CMSadministers are Medicare, Medicaid, and SCHIP. The majority of CMS expenses areallocated to these programs.
24
CMS MANAGEMENT’S DISCUSSION AND ANALYSIS FY 2003

Total Benefit Payments were $441.1 billion for FY 2003. Administrative Expenses were$2.4 billion, less than 1 percent of total net Program/Activity Costs of $416.2 billion.
The net cost of the Medicare program including benefit payments, QualityImprovement Organizations, Medicare Integrity Program spending, and administrativecosts, was $250.1 billion. The HI total costs of $154.2 billion were offset by $1.6 billionin premiums. The SMI total costs of $124.3 billion were offset by premiums of $26.8billion. Medicaid total costs of $161.7 billion represent expenses incurred by the Statesand Territories that were reimbursed by CMS during the fiscal year, plus accruedpayables. The SCHIP total costs were $4.4 billion.
Consolidated Statement of Changes in Net Position
The Consolidated Statement of Changes in Net Positionshows the net cost of operations less financing sources otherthan exchange revenues, and the net position at the end ofperiod. The line, Appropriations Used, represents theMedicaid appropriations used of $161.4 billion, $89.9 billionin transfers from Payments to Health Care Trust Funds to HIand SMI, SCHIP appropriations of $4.4 billion, and Ticket to Work appropriations of$14 million. Medicaid and SCHIP are financed by a general fund appropriation providedby Congress. Employment tax revenue is Medicare's portion of payroll and self-employment taxes collected under the Federal Insurance Contribution Act (FICA) andSelf-Employment Contribution Act (SECA) for the HI trust fund totaling $149.8 billion.The Federal matching contribution is income to the SMI program from a general fundappropriation (Payments to Health Care Trust Funds) of $84.3 billion, that matchesmonthly premiums paid by beneficiaries.
Combined Statement of Budgetary Resources
The Combined Statement of Budgetary Resources provides information about theavailability of budgetary resources, as well as their status at the end of the year. The CMStotal budgetary resources were $545.2 billion. Obligations of $544.7 billion leave unoblig-ated balances of $511 million (of which $204 million is not available). Total outlays were$531.7 billion. When offset by $28.4 billion relating to collection of premiums, the netoutlays were $503.3 billion. When further offset by the $89.9 billion in the Payments toHealth Care Trust Funds, the net outlays to the public were $413.4 billion.
Consolidated Statement of Financing
The Consolidated Statement of Financing is a reconciliation of the preceding statements.Accrual-based measures used in the Consolidated Statement of Net Cost differ from theobligation-based measures used in the Combined Statement of Budgetary Resources,especially in the treatment of liabilities. A liability not covered by budgetary resourcesmay not be recorded as a funded liability in the budgetary accounts of CMS’ generalledger, which supports the Report on Budget Execution and Budgetary Resources (SF133) and the Combined Statement of Budgetary Resources. Therefore, these liabilities
25
CMS MANAGEMENT’S DISCUSSION AND ANALYSIS FY 2003

are recorded as contingent liabilities on the general ledger. Based on appropriationlanguage, they are considered “funded” liabilities for purposes of the ConsolidatedBalance Sheet, Consolidated Statement of Net Cost, and Consolidated Statement ofChanges in Net Position. A reconciling item has been entered on the ConsolidatedStatement of Financing.
Required Supplementary Stewardship Information (RSSI)
As required by the Statement of Federal Financial Accounting Standards (SFFAS)Number 17, CMS has included information about the Medicare trust funds—HI andSMI. The RSSI assesses the sufficiency of future budgetary resources to sustain programservices and meet program obligations as they come due. The information is drawnfrom the 2003 Annual Report of the Boards of Trustees of the Federal HospitalInsurance and Federal Supplementary Medical Insurance Trust Funds, whichrepresents the official government evaluation of the financial and actuarial status of theMedicare trust funds.
Limitations of the Financial Statements
The financial statements have been prepared to report the financial position and resultsof operations of CMS, pursuant to the requirements of 31 U.S.C. 3515(b) and the ChiefFinancial Officers Act of 1990 (P.L. 101-576).
While these financial statements have been prepared from CMS’ general ledger andsubsidiary reports and supplemented with financial data provided by the U.S. Treasuryin accordance with the formats prescribed by OMB, the statements are in addition tothe financial reports used to monitor and control budgetary resources that are preparedfrom the same books and records. These statements use accrual accounting, and someamounts shown will differ from those in other financial documents, such as theBudget of the U.S. Government and the annual report of the Boards of Trustees for HIand SMI, which are presented on a cash basis. The statements should be read with therealization that they are for a component of the United States government, a sovereignentity. One implication of this is that liabilities cannot be liquidated without legislationthat provides resources to do so. The accuracy and propriety of the informationcontained in the principal financial statements and the quality of internal control restswith management.
26
CMS MANAGEMENT’S DISCUSSION AND ANALYSIS FY 2003

CONSOLIDATED BALANCE SHEETAs of September 30, 2003 and 2002
(in millions)
FY 2003 FY 2002Consolidated Consolidated
Totals Totals
ASSETSIntragovernmental Assets:
Fund Balance with Treasury (Note 2) $18,536 $19,182Trust Fund Investments (Note 3) 280,300 271,933 Accounts Receivable, Net (Note 4) 700 634 Other Assets:
Anticipated Congressional Appropriation (Note 5) 11,830 10,399Other 3
Total Intragovernmental Assets 311,369 302,148
Cash and Other Monetary Assets 843 375Accounts Receivable, Net (Note 6) 2,620 3,612 General Property, Plant and Equipment, Net 13 9Other 72 54
TOTAL ASSETS $314,917 $306,198
LIABILITIES (Note 9)Intragovernmental Liabilities:
Accounts Payable $246 $224Accrued Payroll and Benefits 3 5Other Intragovernmental Liabilities (Note 7) 233 312
Total Intragovernmental Liabilities 482 541
Federal Employee and Veterans’ Benefits 11 10 Entitlement Benefits Due and Payable (Note 8) 48,123 44,576Accrued Payroll and Benefits 46 56 Other Liabilities (Note 7) 256 212
TOTAL LIABILITIES 48,918 45,395
NET POSITIONUnexpended Appropriations 13,441 14,096 Cumulative Results of Operations 252,558 246,707
TOTAL NET POSITION $265,999 $260,803
TOTAL LIABILITIES AND NET POSITION $314,917 $306,198
The accompanying notes are an integral part of these statements.
27
PrincipalStatements and Notes
PrincipalStatements and Notes

CONSOLIDATED STATEMENT OF NET COSTFor the Years Ended September 30, 2003 and 2002
(in millions)
FY 2003 FY 2002Consolidated Consolidated
Totals TotalsNET PROGRAM/ACTIVITY COSTS
GPRA ProgramsMedicare $250,074 $231,132Medicaid 161,721 150,101 SCHIP 4,360 3,662
Net Cost - GPRA Programs 416,155 384,895
Other ActivitiesCLIA 33 19Ticket to Work Incentive 14 9Other (4) 1
Net Cost - Other Activities 43 29
NET COST OF OPERATIONS (Note 10) $416,198 $384,924
The accompanying notes are an integral part of these statements.
CONSOLIDATED STATEMENT OF CHANGES IN NET POSITIONFor the Years Ended September 30, 2003 and 2002
(in millions)
FY 2003 FY 2002Cumulative Cumulative
Results Unexpended Results Unexpendedof Operations Appropriations of Operations Appropriations
BEGINNING BALANCES $246,707 $14,096 $223,382 $11,674
Budgetary Financing Sources:Appropriations Received 261,307 247,188Appropriations Transferred-in/out (1,167) (1,050) Other Adjustments (Note 11) (5,143) (4,348)Appropriations Used 255,652 (255,652) 239,368 (239,368)Nonexchange Revenue (Note 12) 167,200 169,828 Transfers-in/out
Without Reimbursement (Note 13) (836) (976)
Other Financing Sources:Imputed Financing from Costs Absorbed by Others 33 29
TOTAL FINANCING SOURCES 422,049 (655) 408,249 2,422
NET COST OF OPERATIONS 416,198 384,924
ENDING BALANCES $252,558 $13,441 $246,707 $14,096
The accompanying notes are an integral part of these statements.
28
CMS PRINCIPAL STATEMENTS AND NOTES FY 2003

COMBINED STATEMENT OF BUDGETARY RESOURCESFor the Years Ended September 30, 2003 and 2002
(in millions)FY 2003 FY 2002
Combined CombinedTotals Totals
Budgetary Resources:Budget authority:
Appropriations received $547,308 $532,604 Net transfers (1,162) (1,050)
Unobligated balance:Beginning of period 3,358 400Net transfers, actual (5)
Spending authority from offsetting collections:Earned:
Collected 65 93Receivable from Federal sources (26)
Change in unfilled customer orders:Advance received (4) 5Without advance from Federal sources 6
Transfers from trust funds 2,645 2,388
SUBTOTAL 2,712 2,460
Recoveries of prior year obligations 7,228 7,256 Temporarily not available pursuant to Public Law (7,674) (28,031)Permanently not available (6,589) (3,582)
TOTAL BUDGETARY RESOURCES $545,176 $510,057
Status of Budgetary Resources:Obligations incurred: (Note 15)
Direct $544,589 $506,602Reimbursable 76 97
SUBTOTAL 544,665 506,699
Unobligated balance: Apportioned 307 3,151
Unobligated balance not available 204 207
TOTAL STATUS OF BUDGETARY RESOURCES $545,176 $510,057
Relationship of Obligations to Outlays:Obligated balance, net, beginning of period $17,901 $18,587Obligated balance, net, end of period:
Accounts receivable (1,185) (1,144)Unfilled customer orders from Federal sources (6)Undelivered orders 11,842 12,552Accounts payable 10,296 6,493
Outlays:Disbursements 534,343 499,832Collections (2,664) (2,163)
SUBTOTAL 531,679 497,669
LESS: OFFSETTING RECEIPTS 28,432 25,951
NET OUTLAYS $503,247 $471,718The accompanying notes are an integral part of these statements.
29
CMS PRINCIPAL STATEMENTS AND NOTES FY 2003

CONSOLIDATED STATEMENT OF FINANCINGFor the Years Ended September 30, 2003 and 2002
(in millions)FY 2003 FY 2002
Consolidated Consolidated Totals Totals
RESOURCES USED TO FINANCE ACTIVITIES:Budgetary Resources Obligated:
Obligations incurred $544,665 $506,699Less: Spending authority from offsetting collections and recoveries 9,940 9,716Obligations net of offsetting collections and recoveries 534,725 496,983Less: Offsetting receipts 28,432 25,951
NET OBLIGATIONS 506,293 471,032
Other Resources:Imputed financing from costs absorbed by others 33 29
NET OTHER RESOURCES USED TO FINANCE ACTIVITIES 33 29
TOTAL RESOURCES USED TO FINANCE ACTIVITIES $506,326 $471,061
RESOURCES USED TO FINANCE ITEMS NOT PART OF THE NET COST OF OPERATIONS:
Change in budgetary resources obligated for goods,services and benefits ordered but not yet provided $(689) $(451)
Resources that fund expenses recognized in prior periods 39,526 39,196Resources that finance the acquisition of assets 8Other resources or adjustments to net obligated resources
that do not affect net cost of operations 94,490 87,220
TOTAL RESOURCES USED TO FINANCE ITEMS NOT PART OF THE NET COST OF OPERATIONS 133,335 125,965
TOTAL RESOURCES USED TO FINANCE THE NET COST OF OPERATIONS $372,991 $345,096
COMPONENTS OF THE NET COST OF OPERATIONS THAT WILL NOT REQUIRE OR GENERATE RESOURCES IN THE CURRENT PERIOD:
Components Requiring or Generating Resources in Future Periods:Accrued unfunded entitlement benefit costs $39,326 $39,526Liability for unmatched SMI premiums (Note 5) 3,381Increase in annual leave liability 1 1 (Increase) in exchange revenue receivable from the public 1,289 749Other 1
TOTAL COMPONENTS OF NET COST OF OPERATIONS THAT WILL REQUIRE OR GENERATE RESOURCES IN FUTURE PERIODS 43,998 40,276
Components Not Requiring or Generating Resources: Depreciation and amortization 4 4Other (795) (452)
TOTAL COMPONENTS OF NET COST OF OPERATIONS THAT WILL NOT REQUIRE OR GENERATE RESOURCES (791) (448)
TOTAL COMPONENTS OF NET COST OF OPERATIONS THAT WILLNOT REQUIRE OR GENERATE RESOURCES IN THE CURRENT PERIOD 43,207 39,828
NET COST OF OPERATIONS $416,198 $384,924
The accompanying notes are an integral part of these statements.
30
CMS PRINCIPAL STATEMENTS AND NOTES FY 2003

The CMS is a separate financial reporting entity ofHHS. The financial statements have been preparedto report the financial position and results ofoperations of CMS, as required by the ChiefFinancial Officers Act of 1990. The statementswere prepared from CMS' accounting records inaccordance with accounting principles generallyaccepted in the United States (GAAP) and theform and content specified by the Office ofManagement and Budget (OMB) in OMB Bulletin01-09. As discussed later in this Note, OMB hasexempted CMS from certain requirements of OMBCircular No. A-11 regarding obligations incurredand recoveries of prior year obligations.
The financial statements cover all theprograms administered by CMS. The programsadministered by CMS are shown in twocategories, Medicare and Health. The Medicareprograms include:
Medicare Hospital Insurance (HI)Trust FundMedicare contractors are paid by CMS to processMedicare claims for hospital inpatient services,hospice, and certain skilled nursing and homehealth services. Benefit payments made by theMedicare contractors for these services, as wellas administrative costs, are charged to the HItrust fund. The CMS payments to managed careplans are also charged to this fund. The financialstatements include HI trust fund activitiesadministered by the Department of the Treasury(Treasury). This trust fund has permanentindefinite authority.
Medicare Supplementary MedicalInsurance (SMI) Trust FundMedicare contractors are paid by CMS to processMedicare claims for physicians, medicalsuppliers, hospital outpatient services andrehabilitation, end stage renal disease (ESRD),rural health clinics, and certain skilled nursingand home health services. Benefit payments
made by the Medicare contractors for theseservices, as well as administrative costs, arecharged to the SMI trust fund. The CMSpayments to managed care plans are alsocharged to this fund. The financial statementsinclude SMI trust fund activities administered byTreasury. This trust fund has permanentindefinite authority.
Medicare Integrity Program (MIP)The Health Insurance Portability andAccountability Act, Public Law 104-191,established the MIP and codified the programintegrity activities previously known as“payment safeguards.” This account is alsocalled the Health Care Fraud and Abuse Control(HCFAC) Program, or simply “Fraud and Abuse.”The CMS contracts with eligible entities toperform such activities as medical andutilization reviews, fraud reviews, cost reportaudits, and the education of providers andbeneficiaries with respect to payment integrityand benefit quality assurance issues. The MIP isfunded by the HI trust fund.
Payments to the Health Care TrustFunds AppropriationThe Social Security Act provides for payments tothe HI and SMI trust funds for SMI (appropriatedfunds to provide for Federal matching of SMIpremium collections) and HI (for the Uninsuredand Federal Uninsured Payments). In addition,funds are provided by this appropriation to coverthe Medicaid program's share of CMS’administrative costs. To prevent duplicativereporting, the Fund Balance, UnexpendedAppropriation, Financing Sources andExpenditure Transfers of this appropriation arereported only in the Medicare HI and SMIcolumns of the financial statements.
31
CMS PRINCIPAL STATEMENTS AND NOTES FY 2003
NOTE 1:SUMMARY OF SIGNIFICANT ACCOUNTING POLICIES
Reporting Entity

Permanent AppropriationsA transfer of general funds to the HI trust fund inamounts equal to Self-Employment ContributionAct (SECA) tax credits and the increase to the taxpayment from Old Age Survivors and DisabilityInsurance (OASDI) beneficiaries is made through75X0513 and 75X0585, respectively. The SocialSecurity Amendments of 1983 provided creditsagainst the HI taxes imposed by the SECA on theself-employed for calendar years 1984 through1989. The amounts reported in FY 2003 areadjustments for late or amended tax returns. TheSocial Security Amendments of 1994, provided foradditional tax payments from Social Security andTier 1 Railroad Retirement beneficiaries.
The Health programs include:
MedicaidMedicaid, the health care program for low-incomeAmericans, is administered by CMS in partnershipwith the States. Grant awards limit the funds thatcan be drawn by the States to cover currentexpenses. The grant awards, prepared at thebeginning of each quarter and amended asnecessary, are an estimate of the CMS share ofStates' Medicaid costs. At the end of each quarter,States report their expenses (net of recoveries) forthe quarter, and subsequent grant awards areissued by CMS for the difference betweenapproved expenses reported for the period andthe grant awards previously issued.
The State Children’s Health InsuranceProgram (SCHIP)SCHIP, included in the Balanced Budget Act of1997 (BBA), was designed to provide healthinsurance for children, many of whom comefrom working families with incomes too high toqualify for Medicaid, but too low to affordprivate health insurance. The BBA set asidefunds for ten years to provide this new insurancecoverage. The grant awards, prepared at thebeginning of each quarter and amended asnecessary, are based on a State approved plan toimplement SCHIP. At the end of each quarter,States report their expenses (net of recoveries)for the quarter, and subsequent grant awards areissued by CMS for the difference betweenapproved expenses reported for the period andthe grant awards previously issued.
The Ticket to Work and WorkIncentives Improvement ProgramThe Ticket to Work and Work IncentivesImprovement Act of 1999, Public Law 106-170,established two grant programs. The Actprovides funding for Medicaid infrastructuregrants to support the design, establishment andoperation of State infrastructures to help workingpeople with disabilities purchase health coveragethrough Medicaid. The Act also provides fundingfor States to establish Demonstrations to MaintainIndependence and Employment, which willprovide Medicaid benefits and services to workingindividuals who have a condition that, withoutmedical assistance, will result in disability.
Health Maintenance Organization(HMO) Loan and Loan Guarantee FundThe HMO Loan and Loan Guarantee Fund wasoriginally established to provide working capitalto HMOs during their initial period of operationsand to guarantee loans made by private lendersto HMOs. The last loan commitments were madein FY 1983. Direct loans to HMOs were sold,with a guarantee, to the Federal Financing Bank(FFB). The FFB purchase proceeds were thenused as capital for additional direct loans.Therefore, the fund operates as a revolving fund.Currently, CMS collects principal and interestpayments from HMO borrowers, and, in turn,pays the FFB.
Program Management User Fees:Medicare+Choice,Clinical Laboratory ImprovementProgram, and Other User FeesThis account operates as a revolving fundwithout fiscal year restriction. The BBAestablished the Medicare+Choice program thatrequires managed care plans to make paymentsfor their share of the estimated costs related toenrollment, dissemination of information, andcertain counseling and assistance programs.These user fees are devoted to educationalefforts for beneficiaries and outreach partners.The Clinical Laboratory ImprovementAmendments of 1988 (CLIA) marked the firstcomprehensive effort by the Federal governmentto regulate medical laboratory testing. The CMSand the Public Health Service share
32
CMS PRINCIPAL STATEMENTS AND NOTES FY 2003

responsibility for the CLIA program, with CMShaving the lead responsibility for financialmanagement. Fees for registration, certificates,and compliance determination of all U.S. clinicallaboratories are collected to finance the program.Other user fees are charged for certification ofsome nursing facilities and for sale of the dataon nursing facilities surveys. Proceeds from thesale of data from the public use files andpublications under the Freedom of InformationAct (FOIA) are also credited to this fund.
Program Management AppropriationThe Program Management Appropriationprovides CMS with the major source ofadministrative funds to manage the Medicareand Medicaid programs. The funds for thisactivity are provided from the HI and SMI trustfunds, the general fund, and reimbursableactivities. The Payments to the Health Care TrustFunds Appropriation reimburses the Medicare HItrust fund to cover the Medicaid program's shareof CMS administrative costs (see Note 13). Userfees collected from managed care plans seekingFederal qualification and funds received fromother federal agencies to reimburse CMS forservices performed for them are credited to theProgram Management Appropriation.
The cost related to the Program ManagementAppropriation is allocated among all programsbased on the CMS cost allocation system. It isreported in the Medicare and Health columns ofthe Consolidating Statement of Net Cost in theSupplementary Information section.
Basis of PresentationThe financial statements have been prepared toreport the financial position and results ofoperations of CMS, pursuant to the requirementsof 31 U.S.C. 3515(b), the Chief Financial OfficersAct of 1990 (P.L. 101-576), as amended by theGovernment Management Reform Act of 1994.
These financial statements have beenprepared from the CMS general ledger inaccordance with GAAP and the formatsprescribed by the OMB Bulletin 01-09. Someamounts shown will differ from those in otherfinancial documents, such as the Budget of theU.S. Government and the annual report of theBoards of Trustees for HI and SMI, which arepresented on a cash basis.
Basis of AccountingThe CMS uses the Government's StandardGeneral Ledger account structure and followsaccounting policies and guidelines issued by HHS.The financial statements are prepared on anaccrual basis. Individual accounting transactionsare recorded using both the accrual basis andcash basis of accounting. Under the accrualmethod, expenses are recognized when resourcesare consumed, without regard to the payment ofcash. Under the cash method, expenses arerecognized when cash is outlayed. The CMSfollows standard budgetary accounting principlesthat facilitate compliance with legal constraintsand controls over the use of Federal funds.
The CMS uses the cash basis of accountingin the Medicare program to record benefitpayments disbursed during the fiscal year,supplemented by the accrual method to estimatethe value of benefit payments incurred but notyet paid as of the fiscal year end. Revenues arealso recognized both when earned (withoutregard to receipt of cash) and, in the case of HIand SMI premiums, when collected.Employment taxes earmarked for the Medicareprogram are recorded on a cash basis.
The CMS uses the cash basis of accounting inthe Medicaid and SCHIP programs to record fundspaid to the States during the fiscal year,supplemented by the accrual method to estimatethe value of expenses (net of recoveries) not yetreported to CMS as of the end of the fiscal year.
Balance SheetThe Balance Sheet presents amounts of futureeconomic benefits owned or managed by CMS(assets), amounts owed (liabilities), and amountswhich comprise the difference (net position). Themajor components are described below.
Assets
Fund Balances are funds with Treasury that areprimarily available to pay current liabilities.Cash receipts and disbursements are processedby Treasury. The CMS also maintains lockboxesat commercial banks for the deposit of SMIpremiums from States and third parties and forcollections from HMO plans.
Trust Fund Investments are investments (plusthe accrued interest on investments) held byTreasury. Sections 1817 for HI and 1841 for SMI
33
CMS PRINCIPAL STATEMENTS AND NOTES FY 2003

of the Social Security Act require that trust fundinvestments not necessary to meet currentexpenditures be invested in interest-bearingobligations of the United States or in obligationsguaranteed as to both principal and interest bythe United States. These investments are carriedat face value as determined by Treasury. Interestincome is compounded semiannually (June andDecember) and was adjusted to include anaccrual for interest earned from July 1 toSeptember 30.
Accounts Receivable, Net consists of amountsowed to CMS by other Federal agencies and thepublic. Amounts due are presented net of anallowance for uncollectible accounts.
Medicare Secondary Payer (MSP) Accounts Receivable (A/R) consists of amounts owed to Medicare by insurance companies, employers, beneficiaries, and/or providers for payments made by Medicare that should have been paid by the primary payer. Receipts are transferred to the HI or SMI trust fund upon collection. Amounts due are presented net of an allowance for uncollectible accounts. The allowance for uncollectible accounts is based on past collection experience and an analysis of the outstanding balances.
Medicare Non-MSP A/R consists of amounts owed to Medicare by medical providers and others because Medicare made payments that were not due, for example, excess payments that were determined to have been made once provider cost reports were audited. Non-MSP A/R represent entity receivables and, once collected, are transferred to the HI or SMI trust fund. Amounts due are presented net of an allowance for uncollectible accounts. The allowance for uncollectible accounts is based on past collection experience and an analysis of the outstanding balances.
Cash and Other Monetary Assets are the totalamount of time account balances at theMedicare contractor commercial banks. TheChecks Paid Letter-of-Credit method is used forreimbursing Medicare contractors for thepayment of covered Medicare services. Medicarecontractors issue checks against a MedicareBenefits account maintained at commercialbanks. In order to compensate commercial banksfor handling the Medicare Benefits accounts,
Medicare funds are deposited into non-interest-bearing time accounts. The earnings allowanceson the time accounts are used to reimburse thecommercial banks.
Property, Plant and Equipment (PP&E) arerecorded at full cost of purchase, including allcosts incurred to bring the PP&E to a form andlocation suitable for its intended use, net ofaccumulated depreciation. All PP&E with aninitial acquisition cost of $25,000 or more and anestimated useful life of 2 years or greater iscapitalized. The PP&E is depreciated on astraight-line basis over the estimated useful life ofthe asset. Normal maintenance and repair costsare expensed as incurred.
Liabilities
Liabilities represent amounts owed by CMS. Inaccordance with Public Law and existing Federalaccounting standards, no liability is recorded forany future payment to be made on behalf ofcurrent workers contributing to the Medicare HItrust fund.
Liabilities covered by available budgetaryresources include (1) new budget authority,(2) spending authority from offsettingcollections, (3) recoveries of unexpired budgetauthority, (4) unobligated balances of budgetaryresources at the beginning of the year, and(5) permanent indefinite appropriation orborrowing authority.
Liabilities not covered by budgetary resourcesare incurred when funding has not yet been madeavailable through Congressional appropriations orcurrent earnings. The CMS recognizes suchliabilities for employee annual leave earned butnot taken, amounts billed by the Department ofLabor for Federal Employee’s Compensation Act(FECA) payments, and for portions of theEntitlement Benefits Due and Payable liability forwhich no obligations have been incurred. ForCMS revolving funds, all liabilities are funded asthey occur.
Accounts Payable consists of amounts due forgoods and services received, progress in contractperformance, interest due on accounts payable,and other miscellaneous payables.
Federal Employee and Veterans’ Benefits consistof the actuarially-determined estimate of futurebenefits earned by Federal employees andVeterans, but not yet due and payable. These costsinclude pensions, other retirement benefits, and
34
CMS PRINCIPAL STATEMENTS AND NOTES FY 2003
other post-employment benefits. These benefits pro-grams are normally administered by the Office ofPersonnel Management (OPM) and not by CMS.
Entitlement Benefits Due and Payablerepresents the liability for Medicare and Medicaidmedical services incurred but not paid as ofSeptember 30. The Medicare liability is developedby the Office of the Actuary (OACT) and includes(a) an estimate of claims incurred that may or maynot have been submitted to the Medicarecontractors but were not yet approved for payment,(b) actual claims that have been approved forpayment by the Medicare contractors for whichchecks have not yet been issued, (c) checks thathave been issued by the Medicare contractors inpayment of a claim and that have not yet beencashed by payees, (d) periodic interim paymentsfor services rendered in FY 2003 but paid in FY2004, and (e) an estimate of retroactive settlementsof cost reports submitted to the Medicarecontractors by health care providers. OMB hasexempted CMS from the Circular No. A-11 require-ment to report obligations for the MedicareEntitlement Benefits Due and Payable when theliability is incurred. Therefore, for budgetarypurposes, obligations for the Medicare EntitlementBenefits Due and Payable are recorded at the timethe Medicare contractors’ banks request reimburse-ment for checks presented for payment, in anamount equal to the payments, rather than record-ing the obligation when the liability is incurred.
The Medicaid estimate represents the net ofunreported expenses incurred by the States lessamounts owed to the States for overpayment ofMedicaid funds to providers, anticipated rebatesfrom drug manufacturers, and settlements ofprobate and fraud and abuse cases. The FY 2003estimate was developed based on historicalrelationships between prior Medicaid netpayables and current Medicaid activity. TheFY 2002 estimate is based on informationprovided by the States.
Accrued Payroll and Benefits consist of FederalEmployee’s Compensation Act (FECA) paymentsdue to the Department of Labor and the estimatedliability for salaries, wages, funded annual leaveand sick leave that has been earned but is unpaid.
Other Liabilities are the retirement plansutilized by CMS employees; the Civil ServiceRetirement System (CSRS) or the FederalEmployees Retirement System (FERS). UnderCSRS, CMS makes matching contributions equalto 7 percent of pay. The CMS does not report
CSRS assets, accumulated plan benefits, orunfunded liabilities, if any, applicable to itsemployees. Reporting such amounts is theresponsibility of OPM.
Most employees hired after December 31,1983 are automatically covered by FERS. Aprimary feature of FERS is that it offers a savingsplan to which CMS is required to contribute1 percent of pay and to match employeecontributions up to an additional 4 percent ofpay. For employees covered by FERS, CMS alsocontributes the employer’s matching share ofSocial Security taxes.
Net Position
Net Position contains the following components:
Unexpended Appropriations include the portion of CMS’ appropriations represented by undelivered orders and unobligated balances.
Cumulative Results of Operationsrepresent the net results of operations since the inception of the program plus the cumulative amount of prior period adjustments.
Statement of Net CostThe Statement of Net Cost shows only a singledollar amount: the actual net cost of CMS' oper-ations for the period by program. UnderGovernment Performance and Results Act(GPRA), CMS is required to identify the missionof the agency and develop a strategic plan andperformance measures to show that desiredoutcomes are being met. The three majorprograms that CMS administers are: Medicare,Medicaid, and SCHIP. The bulk of CMS’expenses are allocated to these programs. TheMIP is included in Medicare. The costs related tothe Program Management Appropriation arecost-allocated to all three major components.The net cost of operations of the CLIA programand other programs are shown separately under“Other Activities.”
Although the following terms do not appearin the Statement of Net Cost, they are an integralpart in the calculation of a program’s net cost ofoperations:
Program/Activity Costs represent the grosscosts or expenses incurred by CMS for allactivities.
35
CMS PRINCIPAL STATEMENTS AND NOTES FY 2003

Benefit Payments are payments by Medicare contractors, CMS, and Medicaid State agencies to health care providers for their services.
Administrative Expenses represent the costs of doing business by CMS and its partners.
Exchange Revenues (or earned revenues) arisewhen a Government entity provides goods andservices to the public or to another Governmententity for a fee.
Premiums Collected are used to finance SMI benefits and administrative expenses. Monthly premiums paid by Medicare beneficiaries are matched by the Federal government through the general fund appropriation, Payments to the Health Care Trust Funds. Section 1844 of the Social Security Act authorizes appropriated funds to match SMI premiums collected, and outlines the ratio for the match as well as the method to make the trust funds whole ifinsufficient funds are available in the appropriation to match all premiums received in the fiscal year.
Net Cost of Operations is the differencebetween the program’s gross costs and its relatedexchange revenues.
Statement of Changes in Net PositionThe Statement of Changes in Net Position(SCNP) reports the change in net position duringthe fiscal year that occurred in the two compo-nents of net position: Cumulative Results ofOperations and Unexpended Appropriations. TheSCNP comprises the following major line items:
Prior Period Adjustments are either correctionsof errors or changes in accounting principleswith retroactive effect that increase or decreasenet position.
Budgetary Financing Sources display financingsources and nonexchange revenue that are alsobudgetary resources, as reported on theStatement of Budgetary Resources.
Appropriations Received show the amounts ofappropriations received in the current fiscal year.
Budgetary Financing Sources (Other thanExchange Revenues) arise primarily fromexercise of the Government's power to demandpayments from the public (e.g., taxes, duties,fines, and penalties). These include
appropriations used, transfers of assets fromother Government entities, donations, andimputed financing.
Appropriations Used and Federal MatchingContributions are described in the MedicarePremiums section above. For financial statementpurposes, appropriations used are recognized asa financing source as expenses are incurred. Atransfer of general funds to the HI trust fund inan amount equal to SECA tax credits is madethrough the Payments to the Health Care TrustFunds Appropriation. The Social SecurityAmendments of 1983 provided credits againstthe HI taxes imposed by the SECA on the self-employed for calendar years 1984 through 1989.
Employment Tax Revenue is the primarysource of financing for Medicare’s HI program.Medicare’s portion of payroll and self-employ-ment taxes is collected under FICA and SECA.Employees and employers were both required tocontribute 1.45 percent of earnings, with nolimitation, to the HI trust fund. Self-employedindividuals contributed the full 2.9 percent oftheir net income.
Transfers-in/Transfers-out report the transfersof funds between CMS programs or betweenCMS and other Federal agencies. Examplesinclude transfers made from CMS’ Payment tothe Health Care Trust Fund appropriation to theHI and SMI trust funds and the transfersbetween the HI and SMI trust funds and CMS’Program Management appropriation.
Statement of Budgetary ResourcesThe Statement of Budgetary Resources providesinformation about the availability of budgetaryresources as well as their status at the end of theyear. Budgetary Statements were developed foreach of the budgetary accounts. In this state-ment, the Program Management and theProgram Management User Fee accounts arecombined and are not allocated back to theother programs. Also, there are no intra-CMSeliminations in this statement.
Unobligated Balances—beginning of periodrepresent funds available. These funds areprimarily HI and SMI trust fund balancesinvested by the Treasury.
Budget Authority represents the funds availablethrough appropriations, direct spendingauthority, obligations limitations, unobligatedbalances at the beginning of the period or
36
CMS PRINCIPAL STATEMENTS AND NOTES FY 2003

transferred in during the period, spendingauthority from offsetting collections, and anyadjustments to budgetary authority.
Obligations Incurred consist of expendedauthority and the change in undelivered orders.OMB has exempted CMS from the Circular No.A-11 requirement to report the recoveries of prioryear obligations separately on the SF-133.Furthermore, current system limitations preventCMS from reporting the recoveries of prior yearobligations. Therefore, recoveries of prior yearobligations have not been reported separatelywithin the financial statements.
Adjustments are increases or (decreases) tobudgetary resources. Increases include recoveriesof prior year obligations; decreases includebudgetary resources temporarily not available,rescissions, and cancellations of expired and no-year accounts.
Statement of FinancingThe Statement of Financing is a reconciliation ofthe preceding statements. Accrual-based measuresused in the Statement of Net Cost differ from theobligation-based measures used in the Statement ofBudgetary Resources, especially in the treatment ofliabilities. A liability not covered by budgetaryresources may not be recorded as a funded liabilityin the budgetary accounts of CMS’ general ledger,which supports the Report on Budget Execution(SF-133) and the Statement of Budgetary Resources.Therefore, these liabilities are recorded ascontingent liabilities on the general ledger. Basedon appropriation language, they are considered“funded” liabilities for purposes of the BalanceSheet, Statement of Net Cost and Statement ofChanges in Net Position. A reconciling item hasbeen entered on the Statement of Financing, whichhas been prepared on a consolidated basis, exceptfor the budgetary information used to calculate netobligations (budgetary resources), which must bepresented on a combined basis.
Use of Estimates in PreparingFinancial StatementsPreparation of financial statements in accordancewith Federal accounting standards requires CMSto make estimates and assumptions that affectthe reported amounts of assets and liabilities anddisclosure of contingent assets and liabilities atthe date of the financial statements and thereported amounts of revenues and expenses
during the reporting period. Actual results maydiffer from those estimates.
Intra-Governmental Relationships andTransactionsIn the course of its operations, CMS hasrelationships and financial transactions withnumerous Federal agencies. For example, CMSinteracts with the Social Security Administration(SSA) and Treasury. The SSA determineseligibility for Medicare programs, and alsoallocates a portion of Social Security benefitpayments to the Medicare Part B trust fund forSocial Security beneficiaries who elect to enrollin the Medicare Part B program. The Treasuryreceives the cumulative excess of Medicarereceipts and other financing sources, and issuesinterest-bearing securities in exchange for theuse of those monies. At the Government-widelevel, the assets related to the trust funds onCMS’ financial statements and the correspondingliabilities on the Treasury’s financial statementsare eliminated.
Comparative DataIn accordance with OMB Bulletin 01-09 CMS haspresented comparative Consolidated BalanceSheets, Consolidated Statements of Net Cost,Consolidated Statements of Changes in NetPosition, Combined Statements of BudgetaryResources, Consolidated Statements of Financingand Notes to the Financial Statements.
ReclassificationsCertain FY 2002 balances have been reclassifiedto conform to FY 2003 financial statementpresentations, the effect of which is immaterial.
Estimation of Obligations Related toCanceled AppropriationsAs of September 30, 2003, CMS has canceledover $136 million in cumulative obligations toFY 1997 and prior years in accordance with theNational Defense Authorization Act of FiscalYear 1991 (P.L. 101-150). Based on the paymentsmade in FYs 1999 through 2003 related tocanceled appropriations, CMS anticipates anadditional $1.5 million will be paid from currentyear funds for canceled obligations.
37
CMS PRINCIPAL STATEMENTS AND NOTES FY 2003

NOTE 2:FUND BALANCES (Dollars in Millions)
FY 2003 ConsolidatedTotals
FUND BALANCES:Trust Funds
HI Trust Fund Balance (1) $(206)SMI Trust Fund Balance (1) (178)
Revolving FundsHMO Loan (2) 10 CLIA (2) 116
Appropriated FundsMedicaid 8,788 SCHIP 9,754TWI (2) 234
Other Fund TypesCMS Suspense Account (2) 5Program Management Reimbursables (2) 13
TOTAL FUND BALANCES $18,536
STATUS OF FUND BALANCES WITH TREASURY:Unobligated Balance
Available $307Unavailable (2,702)
Obligated Balance not yet Disbursed 20,931
TOTAL STATUS OF FUND BALANCES WITH TREASURY $18,536
(1) The portions of the HI and SMI fund balances comprising the remaining fund balance in the Payments to the Health Care Trust Funds appropriation are not available for use by the trust funds. The respective amounts are $45 million in HI and no remaining fund balance in SMI (see Note 5).
(2) These fund balances are reported in the Supplementary Information section under the “All Others” columnof the Consolidating Balance Sheet.
FY 2002 ConsolidatedTotals
FUND BALANCES:Trust Funds
HI Trust Fund Balance (1) $162SMI Trust Fund Balance (1) 2,763
Revolving FundsHMO Loan (2) 11 CLIA (2) 129
Appropriated FundsMedicaid 5,040 SCHIP 10,933TWI (2) 117
Other Fund TypesCMS Suspense Account (2) 11Program Management Reimbursables (2) 16
TOTAL FUND BALANCES $19,182
STATUS OF FUND BALANCES WITH TREASURY:Unobligated Balance
Available $3,152Unavailable (1,872)
Obligated Balance not yet Disbursed 17,902
TOTAL STATUS OF FUND BALANCES WITH TREASURY $19,182
(1) The portions of the HI and SMI fund balances comprising the remaining fund balance in the Payments tothe Health Care Trust Funds appropriation are not available for use by the trust funds. The respective amounts are $3 million in HI and $3,014 million in SMI.
(2) These fund balances are reported in the Supplementary Information section under the “All Others” columnof the Consolidating Balance Sheet.
38
CMS PRINCIPAL STATEMENTS AND NOTES FY 2003

NOTE 3:TRUST FUND INVESTMENTS, NET (Dollars in Millions)
Medicare Investments
FY 2003 Maturity InterestRange Range Value
HICertificate June 2004 4 1/2% $2,948Bonds June 2004 to June 2018 3 1/2 - 8 3/4% 248,375Accrued Interest 3,657
TOTAL HI INVESTMENTS $254,980
SMIBonds June 2008 to June 2016 5 1/4 - 7 1/4% $24,921Accrued Interest 399
TOTAL SMI INVESTMENTS $25,320
TOTAL MEDICARE INVESTMENTS $280,300
FY 2002 Maturity InterestRange Range Value
HICertificate June 2003 4 3/8% $3,385Bonds June 2003 to June 2017 5 1/4 - 9 1/4% 225,521Accrued Interest 3,597
TOTAL HI INVESTMENTS $232,503
SMICertificate June 2003 4 3/8% $1,179Bonds June 2004 to June 2016 5 1/4 - 8 3/4% 37,626Accrued Interest 625
TOTAL SMI INVESTMENTS $39,430
TOTAL MEDICARE INVESTMENTS $271,933
Trust Fund Investments are investments (plus the accrued interest on investments) held by Treasury. Sections 1817for HI and 1841 for SMI of the Social Security Act require that trust fund investments not necessary to meet currentexpenditures be invested in interest-bearing obligations of the United States or in obligations guaranteed as to bothprincipal and interest by the United States. These investments are carried at face value as determined by Treasury.Interest income is compounded semiannually (June and December) and was adjusted to include an accrual forinterest earned from July 1 to September 30.
39
CMS PRINCIPAL STATEMENTS AND NOTES FY 2003

NOTE 4:INTRAGOVERNMENTAL ACCOUNTS RECEIVABLE, NET (Dollars in Millions)
FY 2003Medicare All Combined Intra-CMS ConsolidatedHI SMI Medicaid SCHIP Others Total Eliminations Total
Expenditure Transfer-in $355 $4,102 $88 $3 $19 $4,567 $(4,567)Nonexpenditure Transfer-in 1,193 349 1,542 (1,542)Railroad Retirement Principal 406 406 $406Military Service Contribution 147 147 147Interest on OASDI FY 2001
Warrant 147 147 147TOTAL INTRAGOVERNMENTAL ACCOUNTS RECEIVABLE, NET $2,248 $4,451 $88 $3 $19 $6,809 $(6,109) $700
FY 2002Medicare All Combined Intra-CMS ConsolidatedHI SMI Medicaid SCHIP Others Total Eliminations Total
Expenditure Transfer-in $323 $690 $87 $3 $41 $1,144 $(1,144)Nonexpenditure Transfer-in 462 260 722 (722)Railroad Retirement Principal 412 412 $412Military Service Contribution 123 123 123Interest on OASDI FY 2001
Warrant 99 99 99TOTAL INTRAGOVERNMENTAL ACCOUNTS RECEIVABLE, NET $1,419 $950 $87 $3 $41 $2,500 $(1,866) $634
Intragovernmental accounts receivable represent CMS claims for payment from other Federal agencies. CMSaccounts receivable for transfers from the HI and SMI trust funds maintained by the Treasury Bureau of Public Debt(BPD) are eliminated against BPD’s corresponding liabilities to CMS in the Consolidated Balance Sheet.
NOTE 5:ANTICIPATED CONGRESSIONAL APPROPRIATION
40
CMS PRINCIPAL STATEMENTS AND NOTES FY 2003
The CMS has recorded $11,830 million inanticipated Congressional appropriations($10,399 in FY 2002) to cover liabilities incurredas of September 30 by the Medicaid program andthe Payments to the Health Care Trust Funds, asdiscussed below:
MedicaidBeginning in FY 1996, CMS has accrued anexpense and liability for Medicaid claims incurredbut not reported (IBNR) as of September 30. In FY2003, the IBNR expense exceeded the availableunexpended Medicaid appropriations in theamount of $8,449 million ($10,399 in FY 2002). Areview of appropriation language by CMS’ Officeof General Counsel (OGC) has resulted in adetermination that the Medicaid appropriation’sindefinite authority provision allows for the entire
IBNR amount to be reported as a funded liability.Consequently, CMS has recorded a $8,449 millionanticipated appropriation in FY 2003 ($10,399 inFY 2002) for IBNR claims that exceed theavailable appropriation.
Payments to the Health Care Trust FundsThe SMI program is financed primarily by thegeneral fund appropriation, Payments to theHealth Care Trust Funds, and by monthly premi-ums paid by beneficiaries. Section 1844 of theSocial Security Act authorizes funds to be appro-priated from the general fund to match premiumspayable and deposited in the Trust Fund. Section1844 also outlines the ratio for the match and themethod to make the trust funds whole if insuffi-cient funds are available in the appropriation tomatch all SMI premiums received in the fiscal year.

NOTE 6:ACCOUNTS RECEIVABLE, NET (Dollars in Millions)
FY 2003 Medicare All Consolidated HI SMI Medicaid Others Total
Provider & Beneficiary OverpaymentAccounts Receivable Principal $2,663 $1,299 $462 $4,424Less:Allowance for Uncollectible Accounts Receivable (1,524) (907) (439) (2,870) Accounts Receivable, Net 1,139 392 23 1,554
Medicare Secondary Payer (MSP)Accounts Receivable Principal 103 58 30 191 Less:Allowance for Uncollectible Accounts Receivable (56) (34) (27) (117) Accounts Receivable, Net 47 24 3 74
CMPs & Other RestitutionsAccounts Receivable Principal 129 319 1 449 Less:Allowance for Uncollectible Accounts Receivable (123) (294) (1) (418) Accounts Receivable, Net 6 25 31
Fraud and AbuseAccounts Receivable Principal 116 139 255 Less:Allowance for Uncollectible Accounts Receivable (114) (137) (251)Accounts Receivable, Net 2 2 4
Managed CareAccounts Receivable Principal 2 4 2 8 Less:Allowance for Uncollectible Accounts Receivable (1) (3) _______ (4)Accounts Receivable, Net 1 1 2 4
Medicare PremiumsAccounts Receivable Principal 144 338 482Less:Allowance for Uncollectible Accounts Receivable (40) (37) (77)Accounts Receivable, Net 104 301 405
Audit DisallowancesAccounts Receivable Principal 4 8 $1,123 1,135 Less:Allowance for Uncollectible Accounts Receivable (1) (2) (593) (596)Accounts Receivable, Net 3 6 530 539
Other Accounts ReceivableAccounts Receivable Principal 53 20 73Less:Allowance for Uncollectible Accounts Receivable (44) (20) (64)Accounts Receivable, Net 9 9
TOTAL ACCOUNTS RECEIVABLE PRINCIPAL $3,161 $2,165 $1,176 $515 $7,017
Less: Allowance for Uncollectible Accounts Receivable (1,859) (1,414) (637) (487) (4,397)
TOTAL ACCOUNTS RECEIVABLE, NET $1,302 $751 $539 $28 $2,620
41
CMS PRINCIPAL STATEMENTS AND NOTES FY 2003
The appropriated amount is an estimate calculatedannually by CMS’ OACT and can be insufficient inany particular fiscal year. In FY 2003, the estimatewas insufficient and the matching ceased prior tothe close of the fiscal year. At September 30approximately $3,334.6 million should have beenmatched to premiums paid by beneficiaries. OACTcalculated an additional $46.4 million in interest onthe unmatched amount, leaving a cumulativeliability of $3,381 million owed to SMI. When thisoccurs, Section 1844 allows for a reimbursement tobe made to the SMI Trust Fund from the Payments
to the Health Care Trust Funds appropriationenacted for the following year. Consequently, CMShas recorded a $3,381 million anticipated appropri-ation in FY 2003 for the amount of the unmatchedSMI premiums. Although the actual transfer offunds will occur in FY 2004, CMS has reported the$3,381 million as revenues earned in FY 2003.
In addition, the $3,381 million in unmatchedSMI premiums is reported as a liability “requiringor generating resources in future periods” on theConsolidated Statement of Financing.

FY 2002 Medicare All Consolidated HI SMI Medicaid Others Total
Provider & Beneficiary OverpaymentAccounts Receivable Principal $3,472 $1,642 $621 $5,735Less:Allowance for Uncollectible Accounts Receivable (1,920) (1,085) (571) (3,576) Accounts Receivable, Net 1,552 557 50 2,159
Medicare Secondary Payer (MSP)Accounts Receivable Principal 34 13 2 49 Less:Allowance for Uncollectible Accounts Receivable (6) (1) __ (7) Accounts Receivable, Net 28 12 2 42
CMPs & Other RestitutionsAccounts Receivable Principal 111 324 2 437 Less:Allowance for Uncollectible Accounts Receivable (102) (236) (2) (340) Accounts Receivable, Net 9 88 97
Fraud and AbuseAccounts Receivable Principal 114 128 242 Less:Allowance for Uncollectible Accounts Receivable (112) (125) (237)Accounts Receivable, Net 2 3 5
Managed CareAccounts Receivable Principal 1 8 3 12 Less:Allowance for Uncollectible Accounts Receivable __ (3) (3) (6)Accounts Receivable, Net 1 5 6
Medicare PremiumsAccounts Receivable Principal 151 337 488Less:Allowance for Uncollectible Accounts Receivable (40) (37) (77)Accounts Receivable, Net 111 300 411
Audit DisallowancesAccounts Receivable Principal 1 $1,430 1,431 Less:Allowance for Uncollectible Accounts Receivable __ (539) (539)Accounts Receivable, Net 1 891 892
Other Accounts ReceivableAccounts Receivable Principal 32 10 42 Less:Allowance for Uncollectible Accounts Receivable (32) (10) (42)Accounts Receivable, Net
TOTAL ACCOUNTS RECEIVABLE PRINCIPAL $3,883 $2,453 $1,462 $638 $8,436
Less: Allowance for Uncollectible Accounts Receivable (2,180) (1,487) (571) (586) (4,824)
TOTAL ACCOUNTS RECEIVABLE, NET $1,703 $966 $891 $52 $3,612
42
CMS PRINCIPAL STATEMENTS AND NOTES FY 2003

Medicare accounts receivable are primarilycomposed of provider and beneficiary overpay-ments, and MSP overpayments. The MSPreceivables are composed of paid claims inwhich Medicare should have been the secondaryrather than the primary payer. Claims that havebeen identified to a primary payer are includedin the MSP receivable amount. Accountsreceivable data were primarily obtained fromdata provided by the Medicare contractors.
Currently Not Reportable/CurrentlyNot Collectible DebtIn FY 1999, CMS implemented a number ofpolicy changes in the reporting of delinquentaccounts receivable. Provisions within the Officeof Management and Budget (OMB) CircularA-129, Managing Federal Credit Programs,allow an agency to move certain uncollectibledelinquent debts into memorandum entries,which removes the receivable from the financialstatements. The policy provides for certain debtsto be written off closed without any furthercollection activity or reclassified as CurrentlyNot Reportable. (This is also referred to asCurrently Not Reportable/Collectible). Thiscategory of debt will continue to be referred forcollection and litigation, but will not be reportedon the financial statements because of theunlikelihood of collecting it. While these debtsare not reported on the financial statements, theCurrently Not Reportable/Collectible processpermits and requires the use of collection toolsof the Debt Collection Improvement Act of 1996.This allows delinquent debt to be worked untilthe end of its statutory collection life cycle.
In FY 2003, CMS continued the implementa-tion of this policy and again performed analysesof its accounts receivable. CMS also continued tomanage this debt by referring a significantportion of debt to Treasury for offset and cross-servicing in accordance with the Debt CollectionImprovement Act of 1996.
Recognition of MSP AccountsReceivableMSP accounts receivable are recorded on thefinancial statements as of the date the MSPrecovery demand letter is issued. However, theMSP accounts receivable ending balance reflects
an adjustment for expected reductions to grouphealth plan accounts receivable for situationswhere CMS receives valid documented defensesto its recovery demands.
Write Offs and AdjustmentsThe implementation of the revised policies andother initiatives undertaken in recent fiscalyears resulted in significant adjustments andwrite offs made to CMS’ accounts receivablebalance. CMS’ financial reporting reflectedadditional adjustments, resulting from thevalidation and reconciliation efforts performed,revised policies and supplemental guidanceprovided by CMS to the Medicare contractors.The accounts receivable ending balancecontinues to reflect adjustments for accountsreceivable which have been reclassified asCurrently Not Reportable debt.
The allowance for uncollectible accountsreceivable derived this year has been calculatedfrom data based on the agency’s collection activityand the age of the debt for the most current fiscalyear, while taking into consideration the averageuncollectible percentage for the past five years. TheMedicaid accounts receivable has been recorded ata net realizable value based on an historic analysisof actual recoveries and the rate of disallowancesfound in favor of the States. Such disallowancesare not considered bad debts; the States elect toretain the funds until final resolution.
Non-entity AssetsAssets are either “entity” (the reporting entityholds and has authority to use the assets in itsoperations) or “non-entity” (the reporting agencyholds but does not have authority to use in itsoperations). Before FY 2000 CMS reported itsentity and non-entity assets in separate sectionsof the balance sheet. Since FY 2000 CMS hasreported its entity and non-entity assets in asingle combined section.
The only non-entity assets on CMS’Consolidating Balance Sheet are receivables forinterest and penalties, net for the amount of $28million ($51 million in FY 2002). The accruedinterest associated with Provider and Beneficiary,MSP and Managed Care overpayments appearunder All Others.
43
CMS PRINCIPAL STATEMENTS AND NOTES FY 2003

NOTE 7:OTHER LIABILITIES (Dollars in Millions)
FY 2003 Medicare All ConsolidatedHI SMI Medicaid Others Total
Intragovernmental:Uncollected Revenue due Treasury $45 $112 $28 $185 Other 16 26 $3 3 48
TOTAL OTHER INTRAGOVERNMENTAL LIABILITIES $61 $138 $3 $31 $233
Deferred Revenue $59 $188 $247Suspense Account Deposit Funds $5 5 Other 3 1 4
TOTAL OTHER LIABILITIES $62 $188 $6 $256
FY 2002 Medicare All ConsolidatedHI SMI Medicaid Others Total
Intragovernmental:Uncollected Revenue due Treasury $68 $150 $51 $269 Other 9 15 $2 17 43
TOTAL OTHER INTRAGOVERNMENTAL LIABILITIES $77 $165 $2 $68 $312
Deferred Revenue $43 $150 $193 Suspense Account Deposit Funds $11 11 Other 5 3 8
TOTAL OTHER LIABILITIES $48 $153 $11 $212
CMS routinely receives premium payments on behalf of select categories of beneficiaries from third parties. In someinstances, the payments received exceed the amount billed. As of the end of the accounting period, the excesscollections are reported as deferred revenue received that will be applied against the next month’s premium bill.
44
CMS PRINCIPAL STATEMENTS AND NOTES FY 2003
Potential LiabilityThe CMS routinely processes and settles costreports and payment issues for institutionalproviders and healthcare insurers. As part of thisprocess, some providers/insurers have filed suitschallenging the amount of reimbursement towhich they claim entitlement. CMS cannotreasonably estimate the probability of theproviders successfully winning their suits or the
exact amount of the potential loss to theMedicare trust funds.
In the opinion of management, the resolutionof these matters will not have a material impacton the results of operations and financialcondition of CMS.
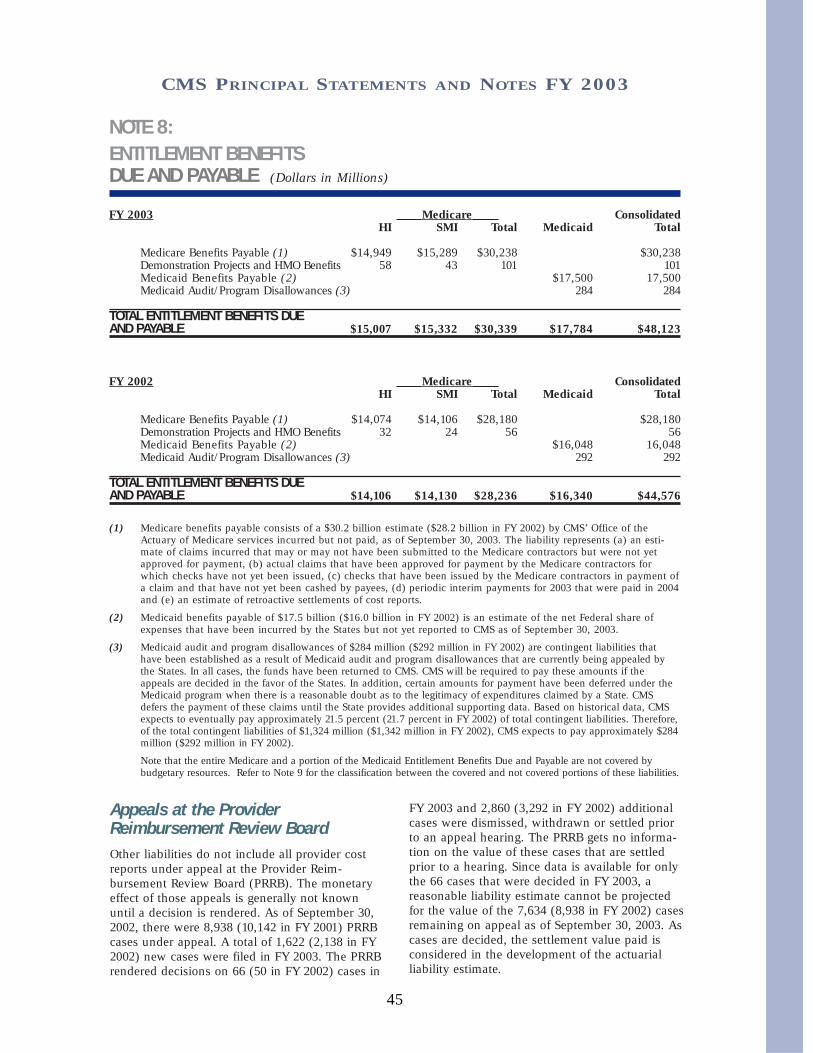
NOTE 8:ENTITLEMENT BENEFITS DUE AND PAYABLE (Dollars in Millions)
FY 2003 Medicare ConsolidatedHI SMI Total Medicaid Total
Medicare Benefits Payable (1) $14,949 $15,289 $30,238 $30,238Demonstration Projects and HMO Benefits 58 43 101 101 Medicaid Benefits Payable (2) $17,500 17,500Medicaid Audit/Program Disallowances (3) 284 284
TOTAL ENTITLEMENT BENEFITS DUE AND PAYABLE $15,007 $15,332 $30,339 $17,784 $48,123
FY 2002 Medicare ConsolidatedHI SMI Total Medicaid Total
Medicare Benefits Payable (1) $14,074 $14,106 $28,180 $28,180Demonstration Projects and HMO Benefits 32 24 56 56 Medicaid Benefits Payable (2) $16,048 16,048Medicaid Audit/Program Disallowances (3) 292 292
TOTAL ENTITLEMENT BENEFITS DUE AND PAYABLE $14,106 $14,130 $28,236 $16,340 $44,576
(1) Medicare benefits payable consists of a $30.2 billion estimate ($28.2 billion in FY 2002) by CMS’ Office of theActuary of Medicare services incurred but not paid, as of September 30, 2003. The liability represents (a) an esti-mate of claims incurred that may or may not have been submitted to the Medicare contractors but were not yetapproved for payment, (b) actual claims that have been approved for payment by the Medicare contractors forwhich checks have not yet been issued, (c) checks that have been issued by the Medicare contractors in payment ofa claim and that have not yet been cashed by payees, (d) periodic interim payments for 2003 that were paid in 2004and (e) an estimate of retroactive settlements of cost reports.
(2) Medicaid benefits payable of $17.5 billion ($16.0 billion in FY 2002) is an estimate of the net Federal share ofexpenses that have been incurred by the States but not yet reported to CMS as of September 30, 2003.
(3) Medicaid audit and program disallowances of $284 million ($292 million in FY 2002) are contingent liabilities thathave been established as a result of Medicaid audit and program disallowances that are currently being appealed bythe States. In all cases, the funds have been returned to CMS. CMS will be required to pay these amounts if theappeals are decided in the favor of the States. In addition, certain amounts for payment have been deferred under theMedicaid program when there is a reasonable doubt as to the legitimacy of expenditures claimed by a State. CMSdefers the payment of these claims until the State provides additional supporting data. Based on historical data, CMSexpects to eventually pay approximately 21.5 percent (21.7 percent in FY 2002) of total contingent liabilities. Therefore,of the total contingent liabilities of $1,324 million ($1,342 million in FY 2002), CMS expects to pay approximately $284million ($292 million in FY 2002).
Note that the entire Medicare and a portion of the Medicaid Entitlement Benefits Due and Payable are not covered bybudgetary resources. Refer to Note 9 for the classification between the covered and not covered portions of these liabilities.
45
CMS PRINCIPAL STATEMENTS AND NOTES FY 2003
Appeals at the ProviderReimbursement Review BoardOther liabilities do not include all provider costreports under appeal at the Provider Reim-bursement Review Board (PRRB). The monetaryeffect of those appeals is generally not knownuntil a decision is rendered. As of September 30,2002, there were 8,938 (10,142 in FY 2001) PRRBcases under appeal. A total of 1,622 (2,138 in FY2002) new cases were filed in FY 2003. The PRRBrendered decisions on 66 (50 in FY 2002) cases in
FY 2003 and 2,860 (3,292 in FY 2002) additionalcases were dismissed, withdrawn or settled priorto an appeal hearing. The PRRB gets no informa-tion on the value of these cases that are settledprior to a hearing. Since data is available for onlythe 66 cases that were decided in FY 2003, areasonable liability estimate cannot be projectedfor the value of the 7,634 (8,938 in FY 2002) casesremaining on appeal as of September 30, 2003. Ascases are decided, the settlement value paid isconsidered in the development of the actuarialliability estimate.

NOTE 9:LIABILITIES NOT COVERED BY BUDGETARY RESOURCES (Dollars in Millions)
FY 2003 Medicare All Combined Intra-CMS ConsolidatedHI SMI Medicaid Others Total Eliminations Total
Intragovernmental:Accrued Payroll and Benefits $1 $2 $3 $3Liability for Unmatched SMI Premiums 3,381 3,381 $(3,381)
TOTAL INTRAGOVERNMENTAL $1 $3,383 $3,384 $(3,381) $3
Entitlement Benefits Due and Payable $15,007 $15,332 $8,987 $39,326 $39,326
Federal Employee and Veterans’ Benefits 3 7 1 11 11
Accrued Payroll and Benefits 9 20 1 30 30
TOTAL LIABILITIES NOT COVERED BY BUDGETARY RESOURCES $15,020 $18,742 $8,989 $42,751 $(3,381) $39,370
TOTAL LIABILITIES COVERED BYBUDGETARY RESOURCES $1,879 $1,558 $8,802 $37 $12,276 $(2,728) $9,548
TOTAL LIABILITIES $16,899 $20,300 $17,791 $37 $55,027 $(6,109) $48,918
FY 2002 Medicare All Combined Intra-CMS ConsolidatedHI SMI Medicaid Others Total Eliminations Total
Intragovernmental:Accrued Payroll and Benefits $1 $3 $1 $5 $5
TOTAL INTRAGOVERNMENTAL $1 $3 $1 $5 $5
Entitlement Benefits Due and Payable $14,106 $14,130 $11,290 $39,526 $39,526
Federal Employee and Veterans’ Benefits 3 7 10 10
Accrued Payroll and Benefits 9 18 2 29 29
TOTAL LIABILITIES NOT COVERED BY BUDGETARY RESOURCES $14,119 $14,158 $11,292 $1 $39,570 $39,570
TOTAL LIABILITIES COVERED BYBUDGETARY RESOURCES $1,172 $1,387 $5,053 $79 $7,691 $(1,866) $5,825
TOTAL LIABILITIES $15,291 $15,545 $16,345 $80 $47,261 $(1,866) $45,395
Liabilities not covered by budgetary resources are incurred when funding has not yet been made available throughCongressional appropriations or current earnings. The CMS recognizes such liabilities for employee annual leaveearned but not taken, amounts billed by the Department of Labor for Federal Employee’s Compensation Act(FECA) payments, and for portions of the Entitlement Benefits Due and Payable liability for which no obligationshave been incurred. For CMS revolving funds, all liabilities are funded as they occur.
46
CMS PRINCIPAL STATEMENTS AND NOTES FY 2003

NOTE 10:NET COST OF OPERATIONS (Dollars in Millions)
FY 2003 Medicare Total All Consolidated
HI SMI Medicare Medicaid SCHIP Others Totals
PROGRAM/ACTIVITY COSTS
Medicare
Fee for Service $133,183 $105,662 $238,845 $238,845
Managed Care 19,269 17,132 36,401 36,401
Medicaid/SCHIP/TWI $161,480 $4,355 $14 165,849
CLIA 90 90
TOTAL PROGRAM/ACTIVITY COSTS $152,452 $122,794 $275,246 $161,480 $4,355 $104 $441,185
OPERATING COSTS
Medicare Integrity Program $1,023 $1,023 $1,023
Quality Improvement Organizations 280 $70 350 350
Bad Debt Expense and Writeoffs (321) (73) (394) $66 (328)
Reimbursable Expenses 2 5 7 1 $(4) 4
Administrative Expenses 754 1,444 2,198 169 $5 2,372
Depreciation and Amortization 1 2 3 3
Imputed Cost Subsidies 10 21 31 2 33
Other Expenses 17 33 50 3 53
TOTAL OPERATING COSTS $1,766 $1,502 $3,268 $241 $5 $(4) $3,510
TOTAL COSTS $154,218 $124,296 $278,514 $161,721 $4,360 $100 $444,695
LESS: EXCHANGE REVENUES:
Medicare Premiums Collected $1,598 $26,834 $28,432 $28,432
CLIA Revenues $57 57
Other Exchange Revenues 4 4 8 8
TOTAL EXCHANGE REVENUES $1,602 $26,838 $28,440 $57 $28,497
TOTAL NET COST OF OPERATIONS $152,616 $97,458 $250,074 $161,721 $4,360 $43 $416,198
47
CMS PRINCIPAL STATEMENTS AND NOTES FY 2003

FY 2002 Medicare Total All ConsolidatedHI SMI Medicare Medicaid SCHIP Others Totals
PROGRAM/ACTIVITY COSTSMedicare
Fee for Service $129,246 $91,367 $220,613 $220,613
Managed Care 17,847 15,942 33,789 33,789
Medicaid/SCHIP/TWI $149,371 $3,656 $8 153,035
CLIA 78 78
TOTAL PROGRAM/ACTIVITY COSTS $147,093 $107,309 $254,402 $149,371 $3,656 $86 $407,515
OPERATING COSTS
Medicare Integrity Program $968 $968 $968
Quality Improvement Organizations 244 $71 315 315
Bad Debt Expense and Writeoffs (895) 134 (761) $548 (213)
Reimbursable Expenses $2 2
Administrative Expenses 694 1,398 2,092 176 $6 1 2,275
Depreciation and Amortization 1 2 3 3
Imputed Cost Subsidies 9 18 27 2 29
Other Expenses 14 30 44 4 48
TOTAL OPERATING COSTS $1,035 $1,653 $2,688 $730 $6 $3 $3,427
TOTAL COSTS $148,128 $108,962 $257,090 $150,101 $3,662 $89 $410,942
LESS: EXCHANGE REVENUES:
Medicare Premiums Collected $1,524 $24,427 $25,951 $25,951
CLIA Revenues $59 59
Other Earned Revenues 7 7 1 8
TOTAL EXCHANGE REVENUES $1,531 $24,427 $25,958 $60 $26,018
TOTAL NET COST OF OPERATIONS $146,597 $84,535 $231,132 $150,101 $3,662 $29 $384,924
48
CMS PRINCIPAL STATEMENTS AND NOTES FY 2003
For purposes of financial statement presentation,non-CMS administrative costs are consideredexpenses to the Medicare trust funds when out-layed by Treasury even though some funds mayhave been used to pay for assets such as propertyand equipment. In this regard, the SSA reported$62.0 million ($70.7 million in FY 2002) ofProperty and Equipment, Net attributable to theMedicare program as of September 30, 2003. Thisamount is not included in CMS’ ConsolidatingBalance Sheet as assets related to the Medicareprogram. However, funds withdrawn from the trustfunds by SSA during FY 2003 to pay for this
activity are reported as Transfers-out in theStatement of Changes in Net Position. The SSAadministrative costs are reported to CMS byTreasury. These expenses are also reported by SSAon their FY 2003 Annual Financial Statement. TheCMS administrative costs have been allocated tothe Medicare, Medicaid, SCHIP and TWI programsbased on the CMS cost allocation system.Administrative costs allocated to the Medicareprogram include $1.2 billion ($1.1 billion in FY2002) paid to Medicare contractors to carry outtheir responsibilities as CMS’ agents in theadministration of the Medicare program.

NOTE 11:BUDGETARY FINANCING SOURCES: OTHER ADJUSTMENTS (Dollars in Millions)
FY 2003 Medicare ConsolidatedHI SMI Medicaid SCHIP Other Total
Unexpended Appropriations
Withdrawal of Expired or $(3) $(3,015) $(2) $(3,020)Canceled Year Authority
Net Change in Anticipated 3,381 $(1,951) 1,430Congressional Appropriation
Return of Indefinite Authority (1,347) (1,347)
Redistribution of SCHIP $(2,206) (2,206)
TOTAL OTHER ADJUSTMENTS $(3) $366 $(3,298) $(2,206) $(2) $(5,143)
FY 2002 Medicare ConsolidatedHI SMI Medicaid SCHIP Total
Unexpended Appropriations
Reversal of Accrual of FY 2001 $(2,630) $(2,630)Income Tax on OASDI
Reversal of Accrual of FY 2001 $(1,592) (1,592)Federal Matching Contributions
Net Increase in Anticipated $3,455 3,455Congressional Appropriation
Withdrawal of Appropriation (2) (760) (762)
Redistribution of SCHIP FY 1999 $(2,819) (2,819)Appropriation
TOTAL OTHER ADJUSTMENTS $(2,632) $(1,592) $2,695 $(2,819) $(4,348)
Other adjustments include increases or decreases to Unexpended Appropriations that result from transactions otherthan the receipt of appropriations, transfers in or out of appropriated authority, or the expenditure of appropriations.Such transactions include the return to the Treasury general fund of expired or canceled year authority, the netincrease or decrease resulting from the accrual of anticipated Congressional appropriations, or other adjustments.
49
CMS PRINCIPAL STATEMENTS AND NOTES FY 2003

NOTE 12:TAXES AND OTHER NON-EXCHANGE REVENUE (Dollars in Millions)
FY 2003 __Medicare__ ConsolidatedHI SMI Total
FICA Tax Receipts $139,934 $139,934
SECA Tax Receipts 9,905 9,905
Trust Fund Investment Interest 14,846 $2,220 17,066
Interest on FY 2001 OASDI Warrant 48 48
Criminal Fines 2 2
Civil Monetary Penalties and Damages 233 233
Administrative Fees 7 7
Other Income 2 3 5
TAXES AND OTHER NON-EXCHANGE REVENUE $164,977 $2,223 $167,200
FY 2002 __Medicare__ ConsolidatedHI SMI Total
FICA Tax Receipts $141,990 $141,990
SECA Tax Receipts 10,038 10,038
Trust Fund Investment Interest 14,127 $2,837 16,964
Interest on FY 2001 OASDI Warrant 67 67
Criminal Fines 430 430
Civil Monetary Penalties and Damages 326 326
Administrative Fees 10 10
Other Income 1 2 3
TAXES AND OTHER NON-EXCHANGE REVENUE $166,989 $2,839 $169,828
50
CMS PRINCIPAL STATEMENTS AND NOTES FY 2003
For periods after December 31, 1993, employeesand employers are each required to contribute1.45 percent of employees' wages, and self-employed persons are required to contribute 2.90percent of net income, with no limitation, to theHI trust fund. The Social Security Act requires thetransfer of these contributions from the GeneralFund of Treasury to the HI trust fund based onthe amount of wages certified by the
Commissioner of Social Security from SSA recordsof wages established and maintained by SSA inaccordance with wage information reports. TheSSA uses the wage totals reported annually byemployers via the quarterly Internal RevenueService Form 941 as the basis for conductingquarterly certification of regular wages.

NOTE 13:OTHER TRANSFERS-IN/OUT (Dollars in Millions)
FY 2003
Transfers-in Without Reimbursement Medicare All Combined Intra-CMS ConsolidatedHI SMI Medicaid SCHIP Others Total Eliminations Total
Medicare Benefit Transfers $151,529 $121,767 $273,296 $(273,296)
Transfers to HCFAC 1,052 1,052 (1,052)
Federal Matching Contributions 84,286 84,286 (84,286)
Allocation to CMS Programs 771 1,577 $176 $5 $3 2,532 (2,532)
Fraud and Abuse Appropriation 114 114 (114)
Transfer-Uninsured Coverage 393 393 (393)
Prog. Mngmt. Admin. Expense (1) 120 120 (120)
Military Service Contribution 28 4 32 $32
Income Tax OASDI Benefits (2) 8,318 8,318 (8,318)
Railroad Retirement Principal 389 389 389
Medicaid Part B Premiums 112 112 (112)
Gifts and Miscellaneous 2 2 2
TOTAL TRANSFERS-IN $162,716 $207,634 $288 $5 $3 $370,646 $(370,223) $423
FY 2003
Transfers-out Without Reimbursement Medicare All Combined Intra-CMS ConsolidatedHI SMI Medicaid SCHIP Others Total Eliminations Total
SSA Administrative Expenses $(601) $(635) $(1,236) $(1,236)
Medicare Benefit Transfers (151,529) (121,767) (273,296) $273,296
Transfers to HCFAC (1,052) (1,052) 1,052
Federal Matching Contributions (84,286) (84,286) 84,286
Transfers to Program Management (854) (1,678) (2,532) 2,532
Fraud and Abuse Appropriation (114) (114) 114
Transfer-Uninsured Coverage (393) (393) 393
Prog. Mngmt. Admin. Expense (1) (120) (120) 120
Income Tax OASDI Benefits (2) (8,318) (8,318) 8,318
Medicaid Part B Premiums (112) (112) 112
Office of the Secretary (6) (3) (9) (9)
Payment Assessment Commission (5) (4) (9) (9)
Railroad Retirement Board (5) (5) (5)
TOTAL TRANSFERS-OUT $(162,992) $(208,490) $(371,482) $370,223 $(1,259)
TOTAL TRANSFERS-IN/OUTWITHOUT REIMBURSEMENT $(276) $(856) $288 $5 $3 $(836) $(836)
51
CMS PRINCIPAL STATEMENTS AND NOTES FY 2003

FY 2002
Transfers-in Without Reimbursement Medicare All Combined Intra-CMS ConsolidatedHI SMI Medicaid SCHIP Others Total Eliminations Total
Medicare Benefit Transfers $145,722 $107,322 $253,044 $(253,044)
Transfers to HCFAC 1,235 1,235 (1,235)
Federal Matching Contributions 76,726 76,726 (76,726)
Allocation to CMS Programs 692 1,481 $188 $6 $19 2,386 (2,386)
Fraud and Abuse Appropriation 101 101 (101)
Transfer-Uninsured Coverage 442 442 (442)
Prog. Mngmt. Admin. Expense (1) 202 202 (202)
Military Service Contribution 41 40 81 $81
Income Tax OASDI Benefits (2) 8,316 8,316 (8,316)
Railroad Retirement Principal 373 373 373
Medicaid Part B Premiums 2 2 (2)
Gifts and Miscellaneous 1 1 2 2
TOTAL TRANSFERS-IN $157,125 $185,570 $190 $6 $19 $342,910 $(342,454) $456
FY 2002
Transfers-out Without Reimbursement Medicare All Combined Intra-CMS ConsolidatedHI SMI Medicaid SCHIP Others Total Eliminations Total
SSA Administrative Expenses $(706) $(700) $(1,406) $(1,406)
Medicare Benefit Transfers (145,722) (107,322) (253,044) $253,044
Transfers to HCFAC (1,235) (1,235) 1,235
Federal Matching Contributions (76,726) (76,726) 76,726
Transfers to Program Management (890) (1,496) (2,386) 2,386
Fraud and Abuse Appropriation (101) (101) 101
Transfer-Uninsured Coverage (442) (442) 442
Prog. Mngmt. Admin. Expense (1) (202) (202) 202
Income Tax OASDI Benefits (2) (8,316) (8,316) 8,316
Medicaid Part B Premiums (2) (2) 2
Office of the Secretary (8) (5) (13) (13)
Payment Assessment Commission (5) (3) (8) (8)
Railroad Retirement Board (5) (5) (5)
TOTAL TRANSFERS-OUT $(157,627) $(186,259) $(343,886) $342,454 $(1,432)
TOTAL TRANSFERS-IN/OUTWITHOUT REIMBURSEMENT $(502) $(689) $190 $6 $19 $(976) $(976)
(1) During FY 2003, the Payments to the Health Care Trust Funds appropriation paid the HI trust fund$120 million ($202 million in FY 2002) to cover the Medicaid, SCHIP and TWI programs’ share ofCMS’ administrative costs.
(2) The Omnibus Budget Reconciliation Act of 1993 increased the maximum percentage of Old AgeSurvivors and Disability Insurance (OASDI) benefits that are subject to Federal income taxation undercertain circumstances from 50 percent to 85 percent. The revenues, resulting from this increase, aretransferred to the HI trust fund.
52
CMS PRINCIPAL STATEMENTS AND NOTES FY 2003
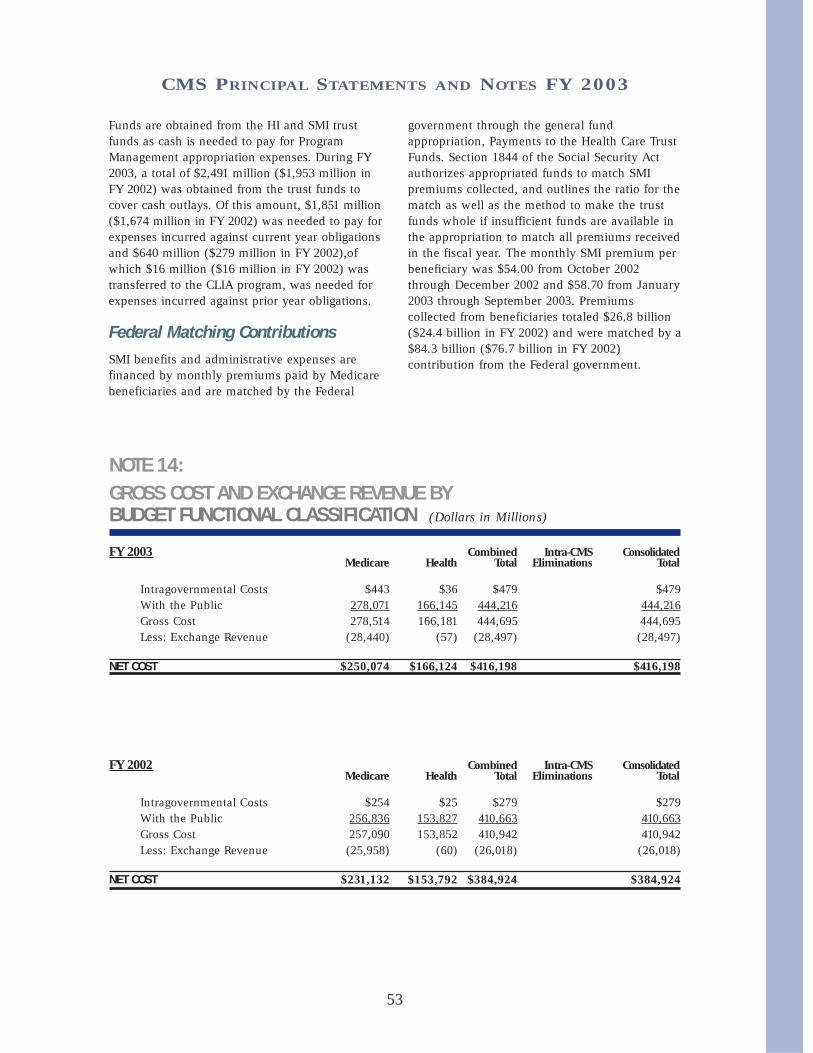
NOTE 14:GROSS COST AND EXCHANGE REVENUE BYBUDGET FUNCTIONAL CLASSIFICATION (Dollars in Millions)
FY 2003 Combined Intra-CMS ConsolidatedMedicare Health Total Eliminations Total
Intragovernmental Costs $443 $36 $479 $479 With the Public 278,071 166,145 444,216 444,216 Gross Cost 278,514 166,181 444,695 444,695 Less: Exchange Revenue (28,440) (57) (28,497) (28,497)
NET COST $250,074 $166,124 $416,198 $416,198
FY 2002 Combined Intra-CMS ConsolidatedMedicare Health Total Eliminations Total
Intragovernmental Costs $254 $25 $279 $279 With the Public 256,836 153,827 410,663 410,663 Gross Cost 257,090 153,852 410,942 410,942 Less: Exchange Revenue (25,958) (60) (26,018) (26,018)
NET COST $231,132 $153,792 $384,924 $384,924
53
CMS PRINCIPAL STATEMENTS AND NOTES FY 2003
Funds are obtained from the HI and SMI trustfunds as cash is needed to pay for ProgramManagement appropriation expenses. During FY2003, a total of $2,491 million ($1,953 million inFY 2002) was obtained from the trust funds tocover cash outlays. Of this amount, $1,851 million($1,674 million in FY 2002) was needed to pay forexpenses incurred against current year obligationsand $640 million ($279 million in FY 2002),ofwhich $16 million ($16 million in FY 2002) wastransferred to the CLIA program, was needed forexpenses incurred against prior year obligations.
Federal Matching Contributions SMI benefits and administrative expenses arefinanced by monthly premiums paid by Medicarebeneficiaries and are matched by the Federal
government through the general fundappropriation, Payments to the Health Care TrustFunds. Section 1844 of the Social Security Actauthorizes appropriated funds to match SMIpremiums collected, and outlines the ratio for thematch as well as the method to make the trustfunds whole if insufficient funds are available inthe appropriation to match all premiums receivedin the fiscal year. The monthly SMI premium perbeneficiary was $54.00 from October 2002through December 2002 and $58.70 from January2003 through September 2003. Premiumscollected from beneficiaries totaled $26.8 billion($24.4 billion in FY 2002) and were matched by a$84.3 billion ($76.7 billion in FY 2002)contribution from the Federal government.

NOTE 15:STATEMENT OF BUDGETARYRESOURCES DISCLOSURES (Dollars in Millions)
FY 2003 CombinedDirect Reimbursable Totals
Category A $16,679 $71 $16,750Category B 523,948 5 523,953Exempt 3,962 3,962
TOTAL $544,589 $76 $544,665
FY 2002 CombinedDirect Reimbursable Totals
Category A $19,474 $95 $19,569Category B 483,266 2 483,268Exempt 3,862 3,862
TOTAL $506,602 $97 $506,699
FY 2003 CombinedBalances
TRUST FUND BALANCES, BEGINNING $265,620Receipts 285,984Less Obligations 277,258Less Transfers 1,052Excess of Receipts Over Obligations 7,674
TRUST FUND BALANCES, ENDING $273,294
FY 2002 CombinedBalances
TRUST FUND BALANCES, BEGINNING $237,589Receipts 285,416Less Obligations 256,392Less Transfers 993Excess of Receipts Over Obligations 28,031
TRUST FUND BALANCES, ENDING $265,620
54
CMS PRINCIPAL STATEMENTS AND NOTES FY 2003
The amounts of direct and reimbursableobligations incurred against amounts apportioned
under Category A, Category B and Exempt fromApportionment are shown below:
Legal Arrangements Affecting Use ofUnobligated BalancesAll trust fund receipts collected in the fiscal yearare reported as new budget authority in theStatement of Budgetary Resources. The portion oftrust fund receipts collected in the fiscal year thatexceeds the amount needed to pay benefits andother valid obligations in that fiscal year isprecluded by law from being available forobligation. This excess of receipts over obliga-tions is reported as Temporarily Not Available
Pursuant to Public Law in the Statement ofBudgetary Resources and, therefore, is notclassified as budgetary resources in the fiscal yearcollected. However, all such excess receipts areassets of the trust funds and currently becomeavailable for obligation as needed. The entiretrust fund balances in the amount of $273,294million ($265,620 million in FY 2002) as ofSeptember 30, 2003 are included in Investmentson the Balance Sheet. The following tablepresents trust fund activities and balances for FY2003 and FY 2002 (in millions):

Medicare, the largest health insurance program in the country, has helped fund medicalcare for the nation’s aged and disabled for almost four decades. A brief description ofthe provisions of Medicare’s Hospital Insurance (HI) and Supplementary MedicalInsurance (SMI) trust funds is included on pages 3–5 of this financial report.
The required supplementary stewardship information (RSSI) contained in this sectionis presented in accordance with the requirements of the Federal Accounting StandardsAdvisory Board (FASAB). Included are a description of the long-term sustainability andfinancial condition of the program and a discussion of trends revealed in the data.
RSSI material is generally drawn from the 2003 Annual Report of the Boards ofTrustees of the Federal Hospital Insurance and Federal Supplementary MedicalInsurance Trust Funds, which represents the official government evaluation of thefinancial and actuarial status of the Medicare trust funds. Unless otherwise noted, alldata are for calendar years, and all projections are based on the Trustees’ intermediateset of assumptions.
Printed copies of the Trustees Report may be obtained from CMS’ Office of theActuary (410-786-6386). The report is also available online at www.cms.hhs.gov/publi-cations/trusteesreport/default.asp.
Please note that the 2003 Trustees Report for Medicare (issued March 17, 2003) wasused as the source document for this FY 2003 CFO Financial Report. We anticipate thatthe Government-wide financial statement report for FY 2003 (expected to be issuedMarch 31, 2004) will contain updated information from the 2004 Trustees Report (whichis expected to be issued on or near March 15, 2004). Thus, some data related to theMedicare trust funds contained in this FY 2003 CFO Financial Report may differ fromthat contained in the FY 2003 Financial Report of the United States Government.
55
RequiredSupplementaryStewardshipInformation
RequiredSupplementary StewardshipInformation

56
REQUIRED SUPPLEMENTARY STEWARDSHIP INFORMATION
ACTUARIAL PROJECTIONS
Cashflow in Nominal Dollars
Using nominal dollars1for short-term projections paints a reasonably clear picture of expected
performance with particular attention on cashflow and trust fund balances. Over longerperiods, however, the changing value of the dollar can complicate efforts to compare dollaramounts in different periods and can create severe barriers to interpretation, since projectionsmust be linked to something that the mind can comprehend in today’s experience.
For this reason, long-range (75-year) Medicare projections in nominal dollars are seldomused and are not presented here. Instead, nominal-dollar estimates for the HI trust fund aredisplayed only through the projected date of depletion, currently the year 2026. Estimates forSMI are presented only for the next 10 years, primarily due to the fact that under presentlaw, the SMI trust fund is automatically in financial balance every year.
HIChart 1 shows the actuarial estimates of HI income, expenditures, and assets for each of thenext 24 years, in nominal dollars. Income includes payroll taxes, income from the taxation ofSocial Security benefits, interest earned on the U.S. Treasury securities held by the trust fund,and other miscellaneous revenue. Expenditures include benefit payments and administrativeexpenses. The estimates are for the “open group” population—all persons who will participateduring the period as either taxpayers or beneficiaries, or both—and consist of payments from,and on behalf of, employees now in the workforce, as well as those who will enter theworkforce over the next 24 years. The estimates also include expenditures attributable to thesecurrent and future workers, in addition to current beneficiaries.
_______________________________________1
Dollar amounts that are not adjusted for inflation or other factors are referred to as “nominal.”

As chart 1 shows, under the intermediate assumptions HI expenditures would begin toexceed income including interest in 2018 and income excluding interest in 2013. Thissituation is due in part to the attainment of Medicare eligibility, starting in 2011, of thoseborn during the 1946-1964 baby boom. It also arises as a result of health cost increases thatare expected to continue to grow faster than workers’ earnings. Beginning in 2018, the trustfund would start redeeming trust fund assets; in 2026, the assets would be depleted.
The projected year of depletion of the trust fund is very sensitive to assumed futureeconomic and other trends. Under less favorable conditions the cash flow could turnnegative much earlier and thereby accelerate asset exhaustion. On the other hand, morefavorable conditions could delay the date of asset exhaustion.
By law, Medicare trust fund assets are invested in special U.S. Treasury Securities,which earn interest while Treasury uses those cash resources for other Federalpurposes. During times of Federal “on-budget” surpluses, this process reduces theFederal debt held by the public. In times of Federal budget deficits, Medicare surplusesreduce the amount that must be borrowed from the public to finance those deficits. Thetrust fund assets are claims on the Treasury that, when redeemed, will have to befinanced by raising taxes, borrowing from the public, or reducing other Federalexpenditures. (When the assets are financed by borrowing, the effect is to defer today’scosts to later generations who will ultimately repay the funds being borrowed fortoday’s Medicare beneficiaries.) The existence of large trust fund balances, therefore,represents an important obligation of the Government to pay future Medicare benefitsbut does not necessarily make it easier for the Government to pay those benefits.
SMIChart 2 shows the actuarial estimates of SMI income, expenditures, and assets for each ofthe next 10 years, in nominal dollars. Whereas HI estimates are displayed through the year2026, SMI estimates cover only the next 10 years, as SMI differs fundamentally from HI inregard to the way it is financed. In particular, SMI financing is not at all based on payrolltaxes but instead on monthly premiums and income from the general fund of the U.S.Treasury—both of which are established annually to cover the following year’s expenditures.Estimates of SMI income and expenditures, therefore, are virtually the same, as illustrated inchart 2, and so are not shown in nominal dollars separately beyond 10 years.
Income includes monthly premiums paid by, or on behalf of, beneficiaries, transfersfrom the general fund of the U.S. Treasury, and interest earned on the U.S. Treasurysecurities held by the trust fund.
2Chart 2 displays only total income; it does not
represent income excluding interest. The difference between the two is not visiblegraphically since interest is not a significant source of income.3 Expenditures includebenefit payments as well as administrative expenses.
_______________________________________2
In the financial statements for CMS, Medicare income and expenditures are shown from a “trust fund perspective.” All sources of income to the trust funds are reflected, and the actuarial projections can be used to assess the financial status of each trust fund. Corresponding estimates for Medicare and other Federal social insurance programs are also shown in the annual Financial Report of the United States Government, also known as the consolidated financial statement. On a consolidated basis, the estimates are shown from a “Federal budget perspective.” In particular, certain categories of trust fund income—primarily interest payments and SMI general revenues—are excluded because they represent intragovernmental transfers, rather than revenues received from the public. Thus, the consolidated financial statement focuses not on the financial status of individual trust funds, but on the overall balance between revenues and outlays for the Federal budget. Each perspective is appropriate and useful for its intended purpose.
3Interest income is generally about 3 percent of total SMI income.
57
REQUIRED SUPPLEMENTARY STEWARDSHIP INFORMATION

As chart 2 indicates, SMI income is very close to expenditures. As noted earlier, thisis due to SMI’s financing mechanism. Under present law, SMI is automatically infinancial balance every year, regardless of future economic and other conditions.
HI Cashflow as a Percent of Taxable Payroll
Each year, estimates of the financial and actuarial status of the HI trust fund areprepared for the next 75 years. Because of the difficulty in comparing dollar values fordifferent periods without some type of relative scale, income and expenditure amountsare shown relative to the earnings in covered employment that are taxable under HI(referred to as “taxable payroll”).
Chart 3 illustrates income excluding interest and expenditures as a percentage oftaxable payroll over the next 75 years. As it was in the 2001and 2002 reports, the perbeneficiary long-range growth in the 2003 report is assumed to be the level of per capitagross domestic product (GDP) growth plus 1 percentage point—reflecting an expectationthat the impact of advances in medical technology on health care costs will continue,both in Medicare and in the health sector as a whole.
Since HI payroll tax rates are not scheduled to change in the future under presentlaw, payroll tax income as a percentage of taxable payroll will remain constant at 2.90percent. Income from taxation of benefits will increase only gradually as a greaterproportion of Social Security beneficiaries become subject to such taxation over time.Thus, as chart 3 shows, the income rate is not expected to increase significantly overcurrent levels. On the other hand, expenditures as a percentage of taxable payrollsharply escalate—in part due to health care cost increases that exceed wage growth, butalso due to the attainment of Medicare eligibility of those born during the 1946-1964baby boom.
58
REQUIRED SUPPLEMENTARY STEWARDSHIP INFORMATION

HI and SMI Cashflow as a Percent of GDP
Expressing Medicare incurred expenditures as a percentage of the GDP gives a relativemeasure of the size of the Medicare program compared to the general economy. TheGDP represents the total value of goods and services produced in the United States.This measure provides an idea of the relative financial resources that will be necessaryto pay for Medicare services.
HIChart 4 shows HI income excluding interest and expenditures over the next 75 yearsexpressed as a percentage of GDP. In 2002, the expenditures were $152.5 billion, whichwas 1.5 percent of GDP. Following slight reductions over the next 5 years, this percentageis projected to increase steadily throughout the remainder of the 75-year period.
SMIBecause of the SMI financing mechanism in which income mirrors expenditures, it isnot necessary to test for long-range imbalances between income and expenditures.Rather, it is more important to examine the projected rise in expenditures and theimplications for beneficiary premiums and Federal general revenue payments.
Chart 5 shows SMI expenditures over the next 75 years expressed as a percentage ofGDP. In 2002, SMI expenditures were $113.2 billion, which was 1.1 percent of GDP.After 2005, this percentage is projected to increase steadily, reflecting growth in thevolume and intensity of services provided per beneficiary throughout the projectionperiod, together with the effects of the baby boom eligibility for retirement.
59
REQUIRED SUPPLEMENTARY STEWARDSHIP INFORMATION
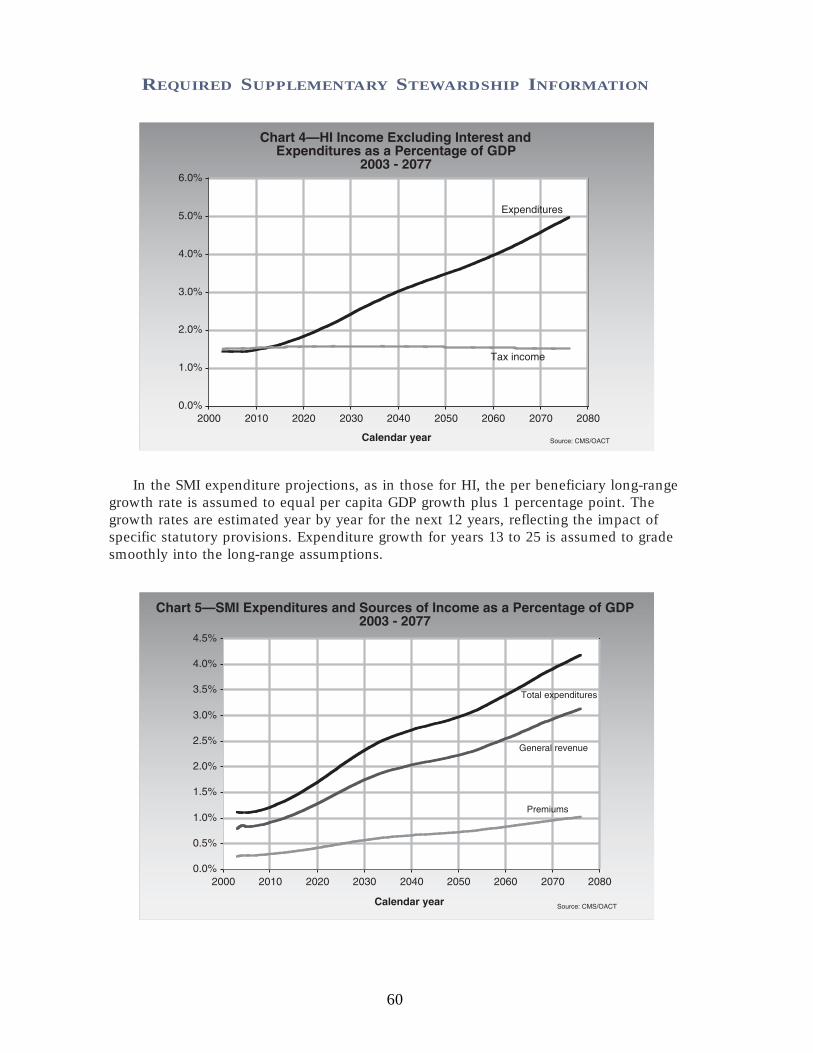
In the SMI expenditure projections, as in those for HI, the per beneficiary long-rangegrowth rate is assumed to equal per capita GDP growth plus 1 percentage point. Thegrowth rates are estimated year by year for the next 12 years, reflecting the impact ofspecific statutory provisions. Expenditure growth for years 13 to 25 is assumed to gradesmoothly into the long-range assumptions.
60
REQUIRED SUPPLEMENTARY STEWARDSHIP INFORMATION

Also shown in chart 5 are SMI general revenue transfers and premium income expressedas a percentage of GDP.
4Under present law, premiums will cover roughly 25 percent of total
expenditures. As indicated, both sources of revenue would increase more rapidly than theGDP over time, to match the faster growth rates for SMI expenditures.
Worker-to-Beneficiary Ratio
HIAnother way to evaluate the long-range outlook of the HI trust fund is to examine theprojected number of workers per HI beneficiary. Chart 6 illustrates this ratio over thenext 75 years. For the most part, current benefits are paid for by current workers. Theretirement of the baby boom generation will therefore be financed by the relativelysmaller number of persons born after the baby boom. In 2002, every beneficiary hadalmost 4.0 workers to pay for his or her benefit. In 2030, however, after the last babyboomer turns 65, there will be only about 2.4 workers per beneficiary. The projectedratio continues to decline until there are just 2.0 workers per beneficiary in 2077.
ACTUARIAL PRESENT VALUESProjected future expenditures can be summarized by computing an “actuarial presentvalue.” This value represents the lump-sum amount that, if invested today in trust fund
_______________________________________4
See footnote 2 regarding the treatment of SMI general revenue income in the consolidated financial statement of the U.S. government.
61
REQUIRED SUPPLEMENTARY STEWARDSHIP INFORMATION

securities, would be just sufficient to pay each year’s expenditures over the next 75years, with the fund being drawn down to zero at the end of the period. Similarly,future revenues (excluding interest) can be summarized as a single, equivalent amountas of the current year.
Actuarial present values are calculated by discounting the future annual amounts of non-interest income and expenditures at the assumed rates of interest credited to the HI and SMItrust funds. Present values are computed as of the beginning of the 75-year projection periodfor three different groups of participants: current workers and other individuals who havenot yet attained eligibility age; current beneficiaries who have attained eligibility age; andnew entrants, or those who are expected to become participants in the future.
Table 1 sets forth, for each of these three groups, the actuarial present values of all futureHI and SMI expenditures and all future non-interest income for the next 75 years. Also shownis the net present value of cashflow, which is calculated by subtracting the actuarial presentvalue of future expenditures from the actuarial present value of future income.
TABLE 1 Actuarial Present Values of Hospital Insurance and
Supplementary Medical Insurance Revenues and Expenditures:75-year Projection as of January 1, 2003
(In billions)
_______ HI _______ ______ SMI2
_____ __
Actuarial present value1of estimated future income 2003 2002 2001 2000 2003 2002 2001 2000
(excluding interest) received from or on behalf of:
Current participants3who, at the start of projection period:
Have not yet attained eligibility age (ages 15-64) $4,510 $4,408 $4,136 $3,757 $8,796 $7,423 $7,378 $6,109Have attained eligibility age (age 65 and over) 128 125 113 97 1,160 1,008 1,032 934
Those expected to become participants (under age 15) 3,773 3,753 3,507 3,179 2,817 2,402 2,370 1,616All current and future participants $8,411 $8,286 $7,757 $7,033 $12,773 $10,833 $10,780 $8,659
Actuarial present value1of estimated future expenditures
4
paid to or on behalf of:
Current participants3who, at the start of projection period:
Have not yet attained eligibility age (ages 15-64) $10,028 $9,195 $8,568 $6,702 $8,845 $7,463 $7,415 $6,094Have attained eligibility age (age 65 and over) 1,897 1,747 1,693 1,681 1,306 1,132 1,159 1,051
Those expected to become participants (under age 15) 2,653 2,470 2,225 1,349 2,622 2,238 2,206 1,514All current and future participants $14,577 $13,412 $12,487 $9,732 $12,773 $10,833 $10,780 $8,659
Actuarial present value1of estimated future income
(excluding interest) less expenditures -6,166 -5,126 -4,730 -2,700 0 0 0 0
Trust fund assets at start of period 235 209 177 141 34 41 44 45
Assets at start of period plus actuarial present value1of esti-
mated future income (excluding interest) less expenditures -$5,931 -$4,917 $-4,553 $-2,558 $34 $41 $44 $45___________________________________________________1
Present values are computed on the basis of the intermediate set of economic and demographic assumptions specified in the Report of the Boards of Trustees for the year shown and over the 75-year projection period beginning January 1 of that year.
2SMI income includes premiums paid by beneficiaries and general revenue contributions made on behalf of beneficiaries. See footnote 2 on page 57 concerning treatment of SMI general revenues in the consolidated financial statement of the U.S. government.
3Current participants are the "closed group" of individuals age 15 and over at the start of the period. The projection period for these current participants would theoretically cover all of their working and retirement years, a period that could be greater than 75 years in some instances. As a practical matter, the present values of future income and expenditures from/for current participants beyond 75 years are not material. The projection period for new entrants covers the next 75 years.
4Expenditures include benefit payments and administrative expenses.
Note: Totals do not necessarily equal the sums of rounded components.
62
REQUIRED SUPPLEMENTARY STEWARDSHIP INFORMATION
As shown in table 1, the HI trust fund has an actuarial deficit of more than $5.9trillion over the 75-year projection period, as compared to more than $4.9 trillion in the2002 financial report. SMI, on the other hand, does not have similar problems because itis automatically in financial balance every year due to its financing mechanism.5
The existence of a large actuarial deficit for the HI trust fund indicates that, underreasonable assumptions as to economic, demographic, and health cost trends for the future,HI income is expected to fall substantially short of expenditures in the long range. Althoughthe deficits are not anticipated in the immediate future, as indicated by the preceding cash-flow projections, they nonetheless pose a serious financial problem for the HI trust fund.
A figure as large as $5.9 trillion can be difficult to interpret without some relativebasis of comparison. To put this number in perspective, it is helpful to consider that thepresent value of future taxable payroll over the same 75-year period is estimated to be$256 trillion in the 2003 Trustees Report. Thus, the $5.9-trillion deficit representsapproximately 2.3 percent of future taxable payroll.
It is important to note that no liability has been recognized on the balance sheet for futurepayments to be made to current and future program participants beyond the existing “incurredbut not reported” Medicare claim amounts as of September 30, 2003. This is because Medicareis accounted for as a social insurance program rather than a pension program. Accounting fora social insurance program recognizes the expense of benefits when they are actually paid, orare due to be paid, because benefit payments are primarily nonexchange transactions and,unlike employer-sponsored pension benefits for employees, are not considered deferredcompensation. Accrual accounting for a pension program, by contrast, recognizes retirementbenefit expenses as they are earned so that the full actuarial present value of the worker’sexpected retirement benefits has been recognized by the time the worker retires.
ACTUARIAL ASSUMPTIONS ANDSENSITIVITY ANALYSISIn order to make projections regarding the future financial status of the HI and SMI trustfunds, various assumptions have to be made. First and foremost, the estimatespresented here are based on the assumption that the trust funds will continue underpresent law. In addition, the estimates depend on many economic and demographicassumptions, including changes in wages and the consumer price index (CPI), fertilityrates, immigration rates, and interest rates. In most cases, these assumptions vary fromyear to year during the first 5 to 30 years before reaching their ultimate values for theremainder of the 75-year projection period._______________________________________5
As noted in footnote 2 on page 57, the actuarial deficit is calculated from a trust fund perspective, reflecting all sources of income and expenditures to or from the HI and SMI trust funds. If, instead, a budget perspective is considered, as used in the consolidated financial statement, one would compare Medicare outlays to the public with revenues received directly from the public. On this basis, transfers to the SMI trust fund from the general fund of the Treasury would be excluded, with the result that the present value of projected SMI expenditures through 2077 would exceed the present value of projected SMI premium revenue alone by $9.6 trillion. When added to the corresponding differential for HI, the present value of expenditures for theMedicare program overall is projected to exceed receipts from the public by $15.8 trillion. This budget impact reflects both (i) the cost to the Federal budget of SMI general revenues provided under current law and (ii) the amount that HI revenues would have to be increased to enable HI benefits to be paid at their currently scheduled level—for which there is no provision in current law.
63
REQUIRED SUPPLEMENTARY STEWARDSHIP INFORMATION

Table 2 shows some of the underlying assumptions used in the projections ofMedicare spending displayed in this section. Further details on these assumptions areavailable in the Social Security and Medicare Trustees Reports for 2003. In practice, anumber of specific assumptions are made for each of the different types of serviceprovided by the Medicare program (for example, hospital care and physician services).These assumptions include changes in the utilization, volume, and intensity of eachtype of service. The per beneficiary cost increases displayed in table 2 reflect the overallimpact of these more detailed assumptions.
TABLE 2Medicare Assumptions
Annual percentage change in:
Per beneficiary cost3
Fertility Net Real wage Real Real Interestrate
1immigration differential
2Wages CPI GDP HI SMI rate
4
2003 2.04 1,200,000 1.6 3.9 2.3 2.9 2.0 5.5 2.8
2005 2.03 1,150,000 1.6 4.3 2.7 3.5 3.3 4.2 3.5
2010 2.01 1,025,000 1.2 4.2 3.0 2.5 4.2 5.7 2.9
2020 1.98 950,000 1.1 4.1 3.0 1.9 4.3 5.4 2.9
2030 1.95 900,000 1.1 4.1 3.0 1.9 5.9 5.5 2.9
2040 1.95 900,000 1.1 4.1 3.0 1.9 5.9 5.2 2.9
2050 1.95 900,000 1.1 4.1 3.0 1.8 5.2 4.9 2.9
2060 1.95 900,000 1.1 4.1 3.0 1.8 5.4 5.4 2.9
2070 1.95 900,000 1.1 4.1 3.0 1.8 5.5 5.2 2.9
2077 1.95 900,000 1.1 4.1 3.0 1.8 5.3 5.1 2.9
________________________________________________________________________
1Average number of children per woman.
2Difference between percentage increases in wages and the CPI.
3See text for nature of this assumption.
4Average rate of interest earned on new trust fund securities, above and beyond rate of inflation.
Estimates made in prior years have sometimes changed substantially because ofrevisions to the assumptions, which are due either to changed conditions or to more recentexperience. Furthermore, it is important to recognize that actual conditions are very likely todiffer from the projections presented here, since the future cannot be anticipated withcertainty. In order to illustrate the magnitude of the sensitivity of the long-range projections,six of the key assumptions were varied individually to determine the impact on the HIactuarial present values and net cashflows.
6The assumptions varied are the fertility rate, net
immigration, real-wage differential, CPI, real-interest rate, and health care cost factors.7
_______________________________________6
Sensitivity analysis is not done for the SMI trust fund due to its financing mechanism. Any change in assump-tions would have no impact on the net cashflow, since the change would affect income and expenditures equally.
7The sensitivity of the projected HI net cash flow to variations in future mortality rates is also of interest. At this time, however, relatively little is known about the relationship between improvements in life expectancy and the associated changes in health status and per beneficiary health expenditures. As a result, it is not possible at present to prepare meaningful estimates of the HI mortality sensitivity.
64
REQUIRED SUPPLEMENTARY STEWARDSHIP INFORMATION
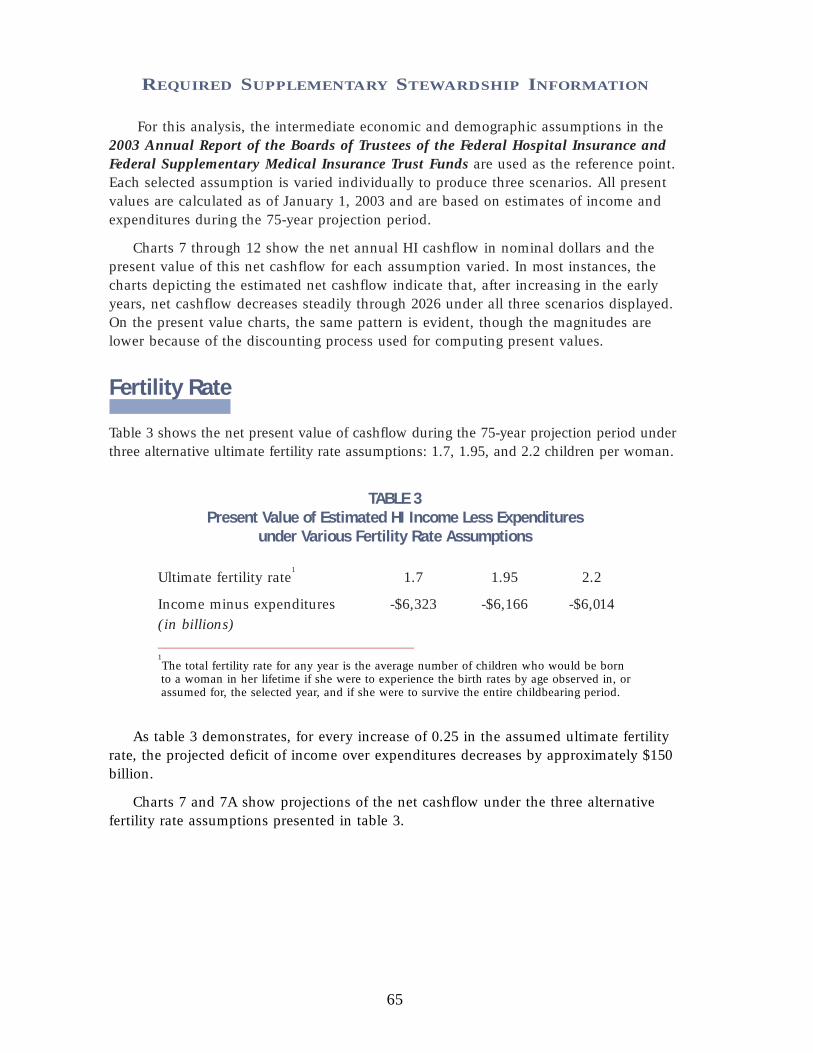
For this analysis, the intermediate economic and demographic assumptions in the2003 Annual Report of the Boards of Trustees of the Federal Hospital Insurance andFederal Supplementary Medical Insurance Trust Funds are used as the reference point.Each selected assumption is varied individually to produce three scenarios. All presentvalues are calculated as of January 1, 2003 and are based on estimates of income andexpenditures during the 75-year projection period.
Charts 7 through 12 show the net annual HI cashflow in nominal dollars and thepresent value of this net cashflow for each assumption varied. In most instances, thecharts depicting the estimated net cashflow indicate that, after increasing in the earlyyears, net cashflow decreases steadily through 2026 under all three scenarios displayed.On the present value charts, the same pattern is evident, though the magnitudes arelower because of the discounting process used for computing present values.
Fertility Rate
Table 3 shows the net present value of cashflow during the 75-year projection period underthree alternative ultimate fertility rate assumptions: 1.7, 1.95, and 2.2 children per woman.
TABLE 3Present Value of Estimated HI Income Less Expenditures
under Various Fertility Rate Assumptions
Ultimate fertility rate1
1.7 1.95 2.2
Income minus expenditures -$6,323 -$6,166 -$6,014(in billions)___________________________________1The total fertility rate for any year is the average number of children who would be born to a woman in her lifetime if she were to experience the birth rates by age observed in, orassumed for, the selected year, and if she were to survive the entire childbearing period.
As table 3 demonstrates, for every increase of 0.25 in the assumed ultimate fertilityrate, the projected deficit of income over expenditures decreases by approximately $150billion.
Charts 7 and 7A show projections of the net cashflow under the three alternativefertility rate assumptions presented in table 3.
65
REQUIRED SUPPLEMENTARY STEWARDSHIP INFORMATION

As charts 7 and 7A indicate, the fertility rate assumption has only a negligibleimpact on projected HI cashflows over the next 30 years. This is because higher fertilityin the first year does not affect the labor force until roughly 20 years have passed(increasing HI payroll taxes slightly) and has virtually no impact on the number ofbeneficiaries within this period. Over the full 75-year period, the changes are somewhatgreater, as illustrated by the present values in table 3.
66
REQUIRED SUPPLEMENTARY STEWARDSHIP INFORMATION

Net Immigration
Table 4 shows the net present value of cashflow during the 75-year projection periodunder three alternative net immigration assumptions: 672,500 persons, 900,000 persons,and 1,300,000 persons per year.
TABLE 4Present Value of Estimated HI Income Less Expenditures
under Various Net Immigration Assumptions
Ultimate net immigration 672,500 900,000 1,300,000Income minus expenditures -$6,379 -$6,166 -$5,849(in billions)
As shown in table 4, for every increase of 100,000 persons on the ultimate netimmigration assumption, the deficit of income over expenditures decreases by nearly$100 billion.
Charts 8 and 8A show projections of the net cashflow under the three alternative netimmigration assumptions presented in table 4.
As charts 8 and 8A indicate, this assumption has an impact on projected HI cash-flow starting almost immediately. Because immigration tends to occur among youngerindividuals, the number of covered workers is affected immediately, while the numberof beneficiaries is affected much less quickly. Nonetheless, variations in net immigrationresult in fairly small differences in cashflow.
67
REQUIRED SUPPLEMENTARY STEWARDSHIP INFORMATION

Real-Wage Differential
Table 5 shows the net present value of cashflow during the 75-year projection periodunder three alternative ultimate real-wage differential assumptions: 0.6, 1.1, and 1.6percentage points. In each case, the CPI is assumed to be 3.0 percent, yielding ultimatepercentage increases in average annual wages in covered employment of 3.6, 4.1, and4.6 percent, respectively.
TABLE 5Present Value of Estimated HI Income Less Expenditures
under Various Real-Wage Assumptions
Ultimate percentage increase in wages - CPI 3.6 - 3.0 4.1 - 3.0 4.6 - 3.0
Ultimate percentage increase in 0.6 1.1 1.6real-wage differential
Income minus expenditures (in billions) -$6,538 -$6,166 -$5,816
Table 5 shows the net present value of cashflow during the 75-year projection periodunder three alternative ultimate real-wage differential assumptions: 0.6, 1.1, and 1.6percentage points. In each case, the CPI is assumed to be 3.0 percent, yielding ultimatepercentage increases in average annual wages in covered employment of 3.6, 4.1, and4.6 percent, respectively.
As indicated in table 5, for every half-point increase in the ultimate real-wagedifferential assumption, the deficit of income over expenditures decreases byapproximately $360 billion.
68
REQUIRED SUPPLEMENTARY STEWARDSHIP INFORMATION

As charts 9 and 9A indicate, this assumption has a fairly large impact on projectedHI cashflow very early in the projection period. Higher real-wage differentialassumptions immediately increase both HI expenditures for health care and wages forall workers. Though there is a full effect on wages and payroll taxes, the effect onbenefits is only partial, since not all health care costs are wage-related.
69
REQUIRED SUPPLEMENTARY STEWARDSHIP INFORMATION

Consumer Price Index
Table 6 shows the net present value of cashflow during the 75-year projection periodunder three alternative ultimate CPI rate-of-increase assumptions: 2.0, 3.0, and 4.0percent. In each case, the ultimate real-wage differential is assumed to be 1.1 percent,yielding ultimate percentage increases in average annual wages in covered employmentof 3.1, 4.1, and 5.1 percent, respectively.
TABLE 6Present Value of Estimated HI Income Less Expenditures
under Various CPI-Increase Assumptions
Ultimate percentage increase in wages - CPI 3.1 - 2.0 4.1 - 3.0 5.1 - 4.0
Income minus expenditures (in billions) -$6,189 -$6,166 -$6,182
Table 6 demonstrates that for every 1-point change in the ultimate CPI-increaseassumption, the deficit of income over expenditures changes by approximately $20 billion.
Charts 10 and 10A show projections of the net cashflow under the three alternativeCPI rate-of-increase assumptions presented in table 6.
As charts 10 and 10A indicate, this assumption has a large impact on projected HIcashflow in nominal dollars but only a negligible impact when the cashflow is expressedas present values. The relative insensitivity of the projected present values of HI cash-flow to different levels of general inflation occurs because inflation tends to affect bothincome and costs equally. In nominal dollars, however, a given deficit “looks bigger”
70
REQUIRED SUPPLEMENTARY STEWARDSHIP INFORMATION

under high-inflation conditions but is not significantly different when it is expressed asa present value or relative to taxable payroll. This sensitivity test serves as a usefulexample of the limitations of nominal-dollar projections over long periods.
Real-Interest Rate
Table 7 shows the net present value of cashflow during the 75-year projection periodunder three alternative ultimate real-interest assumptions: 2.1, 2.9, and 3.6 percent. Ineach case, the ultimate annual increase in the CPI is assumed to be 3.0 percent,resulting in ultimate annual yields of 5.1, 5.9, and 6.6 percent, respectively.
TABLE 7Present Value of Estimated HI Income Less Expenditures
under Various Real-Interest Assumptions
Ultimate real-interest rate 2.1 % 2.9 % 3.6 %Income minus expenditures -$8,962 -$6,166 -$4,501(in billions)
As illustrated in table 7, for every increase of 0.1 in the ultimate real-interest ratepercentage, the deficit of income over expenditures decreases by approximately $300 billion.
Charts 11 and 11A show projections of the net cashflow under the three alternativereal-interest assumptions presented in table 7.
71
REQUIRED SUPPLEMENTARY STEWARDSHIP INFORMATION

As shown in charts 11 and 11A, the present values of the net cashflow are moresensitive to the interest assumption than is the nominal net cashflow. This is not anindication of the actual role that interest plays in HI financing. In actuality, interest financesvery little of the cost of the HI trust fund because, under the intermediate assumptions, thefund is projected to be relatively low and exhausted by 2026. These results illustrate thesubstantial sensitivity of present value measures to different interest rate assumptions. Withhigher assumed interest, the very large deficits in the more distant future are discountedmore heavily (that is, are given less weight), and the overall net present value is smaller.
72
REQUIRED SUPPLEMENTARY STEWARDSHIP INFORMATION

Health Care Cost Factors
Table 8 shows the net present value of cashflow during the 75-year projection periodunder three alternative assumptions of the annual growth rate in the aggregate cost ofproviding covered health care services to beneficiaries. These assumptions are that theultimate annual growth rate in such costs, relative to taxable payroll, will be 1 percentslower than the intermediate assumptions, the same as the intermediate assumptions,and 1 percent faster than the intermediate assumptions. In each case, the taxable payrollwill be the same as that which was assumed for the intermediate assumptions.
TABLE 8Present Value of Estimated HI Income Less Expenditures
under Various Health Care Cost Growth Rate AssumptionsAnnual cost/payroll relative growth rate -1 percentage Intermediate +1 percentage
point assumptions point
Income minus expenditures (in billions) -$1,583 -$6,166 -$13,684
Table 8 demonstrates that if the ultimate growth rate assumption is 1 percentagepoint lower than the intermediate assumptions, the deficit of income over expendituresdecreases by $4,583 billion. On the other hand, if the ultimate growth rate assumptionis 1 percentage point higher than the intermediate assumptions, the deficit increasesmore substantially, by $7,518 billion.
Charts 12 and 12A show projections of the net cashflow under the three alternativeannual growth rate assumptions presented in table 8.
73
REQUIRED SUPPLEMENTARY STEWARDSHIP INFORMATION
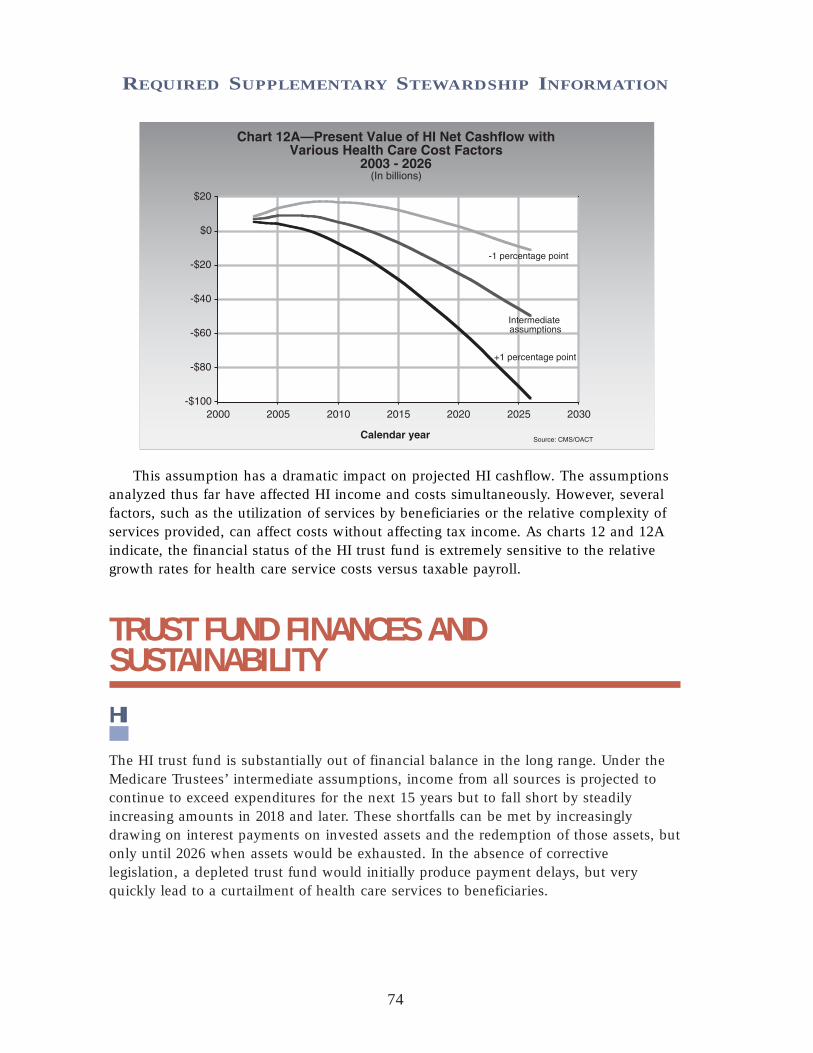
740
This assumption has a dramatic impact on projected HI cashflow. The assumptionsanalyzed thus far have affected HI income and costs simultaneously. However, severalfactors, such as the utilization of services by beneficiaries or the relative complexity ofservices provided, can affect costs without affecting tax income. As charts 12 and 12Aindicate, the financial status of the HI trust fund is extremely sensitive to the relativegrowth rates for health care service costs versus taxable payroll.
TRUST FUND FINANCES ANDSUSTAINABILITY
HI
The HI trust fund is substantially out of financial balance in the long range. Under theMedicare Trustees’ intermediate assumptions, income from all sources is projected tocontinue to exceed expenditures for the next 15 years but to fall short by steadilyincreasing amounts in 2018 and later. These shortfalls can be met by increasinglydrawing on interest payments on invested assets and the redemption of those assets, butonly until 2026 when assets would be exhausted. In the absence of correctivelegislation, a depleted trust fund would initially produce payment delays, but veryquickly lead to a curtailment of health care services to beneficiaries.
REQUIRED SUPPLEMENTARY STEWARDSHIP INFORMATION

Bringing the HI trust fund into actuarial balance over the next 75 years under theintermediate assumptions would require very substantial increases in revenues and/orreductions in benefits. These changes are needed in part as a result of the impendingretirement of the baby boom generation.
SMI
The financing established for the SMI trust fund for calendar year 2003, along with aportion of trust fund assets, is estimated to be sufficient to cover expenditures for thatyear and to still preserve an adequate contingency reserve in the fund. Moreover, for allfuture years, trust fund income is projected to equal expenditures—but only becausebeneficiary premiums and government general revenue contributions are set to meetexpected costs each year. However, a critical issue for the SMI trust fund is the impactof the past and expected rapid growth of SMI costs, which place steadily increasingdemands on beneficiaries and society at large.
The SMI trust fund’s automatic financing provisions prevent crises such as thosefaced in the mid-1990s by the HI trust fund, the assets of which were projected to beexhausted in the near future. As a result, there has been substantially less attentiondirected toward the financial status of the SMI trust fund than to the HI trust fund—even though SMI expenditures have increased faster than HI expenditures in most yearsand are expected to continue to do so for a number of years in the future.
Medicare Overall
The projections shown in this section continue to demonstrate the need for theAdministration and the Congress to address the financial challenges facing Medicare—both the long-range financial imbalance facing the HI trust fund and the continuingproblem of rapid growth in SMI expenditures. In their 2003 annual report to Congress,the Medicare Boards of Trustees emphasize the seriousness of these concerns and urgethe nation’s policy makers to take “effective and decisive action…to build upon thestrong steps taken in recent reforms.” They also state: “Consideration of further reformsshould occur in the relatively near future.”
75
REQUIRED SUPPLEMENTARY STEWARDSHIP INFORMATION

CONSOLIDATING BALANCE SHEETAs of September 30, 2003
(in millions)
MEDICARE HEALTH Combined Intra-CMS ConsolidatedHI SMI Total Medicaid SCHIP All Others Totals Eliminations Totals
ASSETSIntragovernmental Assets:
Fund Balance with Treasury $(206) $(178) $(384) $8,788 $9,754 $378 $18,536 $18,536 Trust Fund Investments 254,980 25,320 280,300 280,300 280,300 Accounts Receivable, Net 2,248 4,451 6,699 88 3 19 6,809 $(6,109) 700
Other Assets:Anticipated Congressional
Appropriation 3,381 3,381 8,449 11,830 11,830Other 1 2 3 3 3
Total Intragovernmental Assets 257,023 32,976 289,999 17,325 9,757 397 317,478 (6,109) 311,369
Cash & Other Monetary Assets 214 629 843 843 843Accounts Receivable, Net 1,302 751 2,053 539 28 2,620 2,620General Property, Plant
& Equipment, Net 4 8 12 1 13 13Other 26 36 62 4 6 72 72
TOTAL ASSETS $258,569 $34,400 $292,969 $17,869 $9,757 $431 $321,026 $(6,109) $314,917
LIABILITIESIntragovernmental Liabilities:
Accounts Payable $1,750 $4,605 $6,355 $6,355 $(6,109) $246Accrued Payroll and Benefits 1 2 3 3 3Other Intragovernmental Liabilities 61 138 199 $3 $31 233 233
Total Intragovernmental Liabilities 1,812 4,745 6,557 3 31 6,591 (6,109) 482
Federal Employee & Veterans’ Benefits 3 7 10 1 11 11 Entitlement Benefits Due & Payable 15,007 15,332 30,339 17,784 48,123 48,123 Accrued Payroll & Benefits 15 28 43 3 46 46 Other Liabilities 62 188 250 6 256 256
TOTAL LIABILITIES 16,899 20,300 37,199 17,791 37 55,027 (6,109) 48,918
NET POSITION Unexpended Appropriations 45 3,380 3,425 $9,755 261 13,441 13,441Cumulative Results of Operations 241,625 10,720 252,345 78 2 133 252,558 252,558
TOTAL NET POSITION $241,670 $14,100 $255,770 $78 $9,757 $394 $265,999 $265,999
TOTAL LIABILITIES & NET POSITION $258,569 $34,400 $292,969 $17,869 $9,757 $431 $321,026 $(6,109) $314,917
76
SupplementaryInformationSupplementary Information
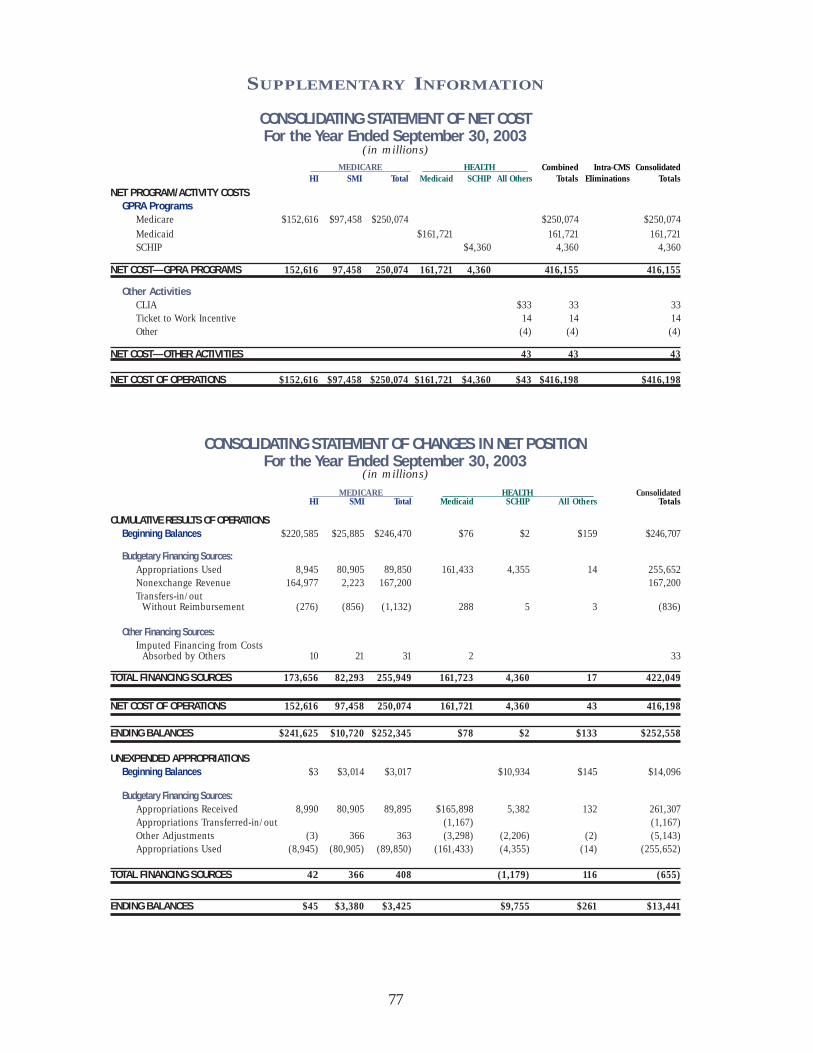
CONSOLIDATING STATEMENT OF NET COSTFor the Year Ended September 30, 2003
(in millions)MEDICARE HEALTH Combined Intra-CMS Consolidated
HI SMI Total Medicaid SCHIP All Others Totals Eliminations Totals
NET PROGRAM/ACTIVITY COSTSGPRA Programs
Medicare $152,616 $97,458 $250,074 $250,074 $250,074Medicaid $161,721 161,721 161,721 SCHIP $4,360 4,360 4,360
NET COST—GPRA PROGRAMS 152,616 97,458 250,074 161,721 4,360 416,155 416,155
Other ActivitiesCLIA $33 33 33Ticket to Work Incentive 14 14 14Other (4) (4) (4)
NET COST—OTHER ACTIVITIES 43 43 43
NET COST OF OPERATIONS $152,616 $97,458 $250,074 $161,721 $4,360 $43 $416,198 $416,198
CONSOLIDATING STATEMENT OF CHANGES IN NET POSITIONFor the Year Ended September 30, 2003
(in millions)
MEDICARE ______ HEALTH ______ ConsolidatedHI SMI Total Medicaid SCHIP All Others Totals
CUMULATIVE RESULTS OF OPERATIONSBeginning Balances $220,585 $25,885 $246,470 $76 $2 $159 $246,707
Budgetary Financing Sources:Appropriations Used 8,945 80,905 89,850 161,433 4,355 14 255,652Nonexchange Revenue 164,977 2,223 167,200 167,200 Transfers-in/out
Without Reimbursement (276) (856) (1,132) 288 5 3 (836)
Other Financing Sources:Imputed Financing from Costs
Absorbed by Others 10 21 31 2 33
TOTAL FINANCING SOURCES 173,656 82,293 255,949 161,723 4,360 17 422,049
NET COST OF OPERATIONS 152,616 97,458 250,074 161,721 4,360 43 416,198
ENDING BALANCES $241,625 $10,720 $252,345 $78 $2 $133 $252,558
UNEXPENDED APPROPRIATIONSBeginning Balances $3 $3,014 $3,017 $10,934 $145 $14,096
Budgetary Financing Sources:Appropriations Received 8,990 80,905 89,895 $165,898 5,382 132 261,307Appropriations Transferred-in/out (1,167) (1,167)Other Adjustments (3) 366 363 (3,298) (2,206) (2) (5,143)Appropriations Used (8,945) (80,905) (89,850) (161,433) (4,355) (14) (255,652)
TOTAL FINANCING SOURCES 42 366 408 (1,179) 116 (655)
ENDING BALANCES $45 $3,380 $3,425 $9,755 $261 $13,441
77
SUPPLEMENTARY INFORMATION

COMBINING STATEMENT OF BUDGETARY RESOURCES (Required)For the Year Ended September 30, 2003
(in millions)MEDICARE Payments to Program Ticket HMO Combined
HI SMI HCFAC Trust Funds Mgmt. Medicaid SCHIP to Work Loan Totals
Budgetary Resources:Budget Authority:
Appropriations received $175,804 $110,180 $89,895 $17 $165,898 $5,382 $132 $547,308Net transfers (1,052) $1,057 (1,167) (1,162)
Unobligated Balance:Beginning of period 44 3,017 204 82 $11 3,358Net transfers, actual (5) (5)
Spending authority fromoffsetting collections:Earned:
Collected 3 62 65Change in unfilled
customer orders:Advance received (4) (4)Without advance
from Federal sources 6 6Transfers from trust funds 2,533 112 2,645
SUBTOTAL 3 2,597 112 2,712
Recoveries of prioryear obligations 117 290 4,445 2,376 7,228
Temporarily notavailable pursuant toPublic Law (21,699) 14,025 (7,674)
Permanently notavailable (3,017) (19) (1,347) (2,206) (6,589)
TOTAL BUDGETARY RESOURCES $153,053 $124,205 $1,216 $89,895 $3,089 $167,941 $5,552 $214 $11 $545,176
Status of Budgetary Resources:
Obligations Incurred:Direct $153,053 $124,205 $1,179 $89,850 $2,796 $167,941 $5,545 $20 $544,589Reimbursable 5 71 76
SUBTOTAL 153,053 124,205 1,184 89,850 2,867 167,941 5,545 20 544,665
Unobligated Balance:Apportioned 5 45 56 7 194 307
Unobligated Balancenot available 27 166 $11 204
TOTAL STATUS OFBUDGETARY RESOURCES $153,053 $124,205 $1,216 $89,895 $3,089 $167,941 $5,552 $214 $11 $545,176
Relationship of Obligations to Outlays:
Obligated Balance, net,beginning of period $968 $922 $213 $(219) $5,049 $10,934 $34 $17,901
Obligated Balance, net,end of period:Accounts receivable (1,185) (1,185)Unfulfilled customer
orders from Federalsources (6) (6)
Undelivered orders 671 197 243 944 9,748 39 11,842Accounts payable 557 875 7 60 8,797 10,296
Outlays:Disbursements 152,793 124,055 1,030 $89,850 2,497 159,748 4,355 15 534,343Collections (3) (2,549) (112) (2,664)
SUBTOTAL 152,793 124,055 1,027 89,850 (52) 159,636 4,355 15 531,679
LESS: OFFSETTING RECEIPTS 1,598 26,834 28,432
NET OUTLAYS $151,195 $97,221 $1,027 $89,850 $(52) $159,636 $4,355 $15 $503,247
78
SUPPLEMENTARY INFORMATION
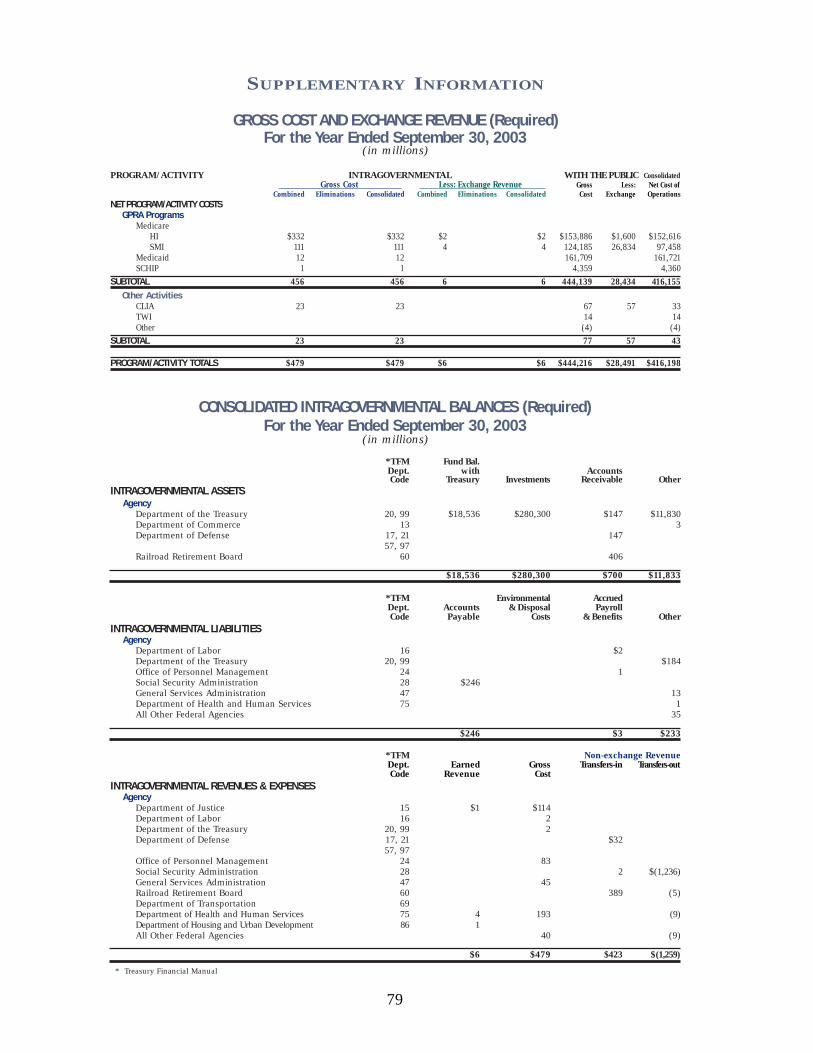
GROSS COST AND EXCHANGE REVENUE (Required)For the Year Ended September 30, 2003
(in millions)
PROGRAM/ACTIVITY INTRAGOVERNMENTAL WITH THE PUBLIC ConsolidatedGross Cost Less: Exchange Revenue Gross Less: Net Cost of
Combined Eliminations Consolidated Combined Eliminations Consolidated Cost Exchange OperationsNET PROGRAM/ACTIVITY COSTS
GPRA ProgramsMedicare
HI $332 $332 $2 $2 $153,886 $1,600 $152,616SMI 111 111 4 4 124,185 26,834 97,458
Medicaid 12 12 161,709 161,721SCHIP 1 1 4,359 4,360
SUBTOTAL 456 456 6 6 444,139 28,434 416,155Other Activities
CLIA 23 23 67 57 33TWI 14 14 Other (4) (4)
SUBTOTAL 23 23 77 57 43
PROGRAM/ACTIVITY TOTALS $479 $479 $6 $6 $444,216 $28,491 $416,198
CONSOLIDATED INTRAGOVERNMENTAL BALANCES (Required)For the Year Ended September 30, 2003
(in millions)
*TFM Fund Bal.Dept. with AccountsCode Treasury Investments Receivable Other
INTRAGOVERNMENTAL ASSETSAgency
Department of the Treasury 20, 99 $18,536 $280,300 $147 $11,830Department of Commerce 13 3 Department of Defense 17, 21 147
57, 97 Railroad Retirement Board 60 406
$18,536 $280,300 $700 $11,833
*TFM Environmental AccruedDept. Accounts & Disposal PayrollCode Payable Costs & Benefits Other
INTRAGOVERNMENTAL LIABILITIESAgency
Department of Labor 16 $2 Department of the Treasury 20, 99 $184Office of Personnel Management 24 1Social Security Administration 28 $246 General Services Administration 47 13Department of Health and Human Services 75 1All Other Federal Agencies 35
$246 $3 $233
*TFM Non-exchange RevenueDept. Earned Gross Transfers-in Transfers-outCode Revenue Cost
INTRAGOVERNMENTAL REVENUES & EXPENSESAgency
Department of Justice 15 $1 $114 Department of Labor 16 2 Department of the Treasury 20, 99 2 Department of Defense 17, 21 $32
57, 97 Office of Personnel Management 24 83 Social Security Administration 28 2 $(1,236)General Services Administration 47 45 Railroad Retirement Board 60 389 (5)Department of Transportation 69 Department of Health and Human Services 75 4 193 (9)Department of Housing and Urban Development 86 1All Other Federal Agencies 40 (9)
$6 $479 $423 $(1,259)
* Treasury Financial Manual
79
SUPPLEMENTARY INFORMATION

80
Department of Health and Human Services
CENTERS FOR MEDICARE & MEDICAID
SERVICES
Audit Opinion Audit Opinion

81

82

83
SUPPLEMENTARY SECTION

84
CHAPTER TITLE
PricewaterhouseCoopers LLP
Suite 800W
1301 K St., N.W.
Washington DC 20005-3333
Telephone (202) 414 1000
Facsimile (202) 414 1301
Report of Independent Auditors
To the Administrator of the Centers for Medicare & Medicaid Services and the Inspector General of the Department of Health and Human Services
We have audited the accompanying consolidated balance sheet of the Centers for Medicare
and Medicaid Services (CMS) and its components as of September 30, 2003, and the related
consolidated statements of net cost, of changes in net position and of financing, and the
combined statement of budgetary resources for the year then ended. These financial
statements are the responsibility of the CMS’ management. Our responsibility is to express an
opinion on these financial statements based on our audit. We did not audit the financial
statements of the Health Programs which are a major subset of the CMS administered
programs, which statements reflect total combined assets of $28,057 million and total
combined net costs of $166,081 million, as of and for the year ended September 30, 2003.
Those statements and financial information were audited by other auditors whose report
thereon has been furnished to us, and our opinion expressed herein, insofar as it relates to the
amounts included for the Health Programs, is based solely on the report of the other auditors.
The consolidated and combined financial statements of the CMS as of September 30, 2002,
and for the year then ended were audited by other auditors whose report dated December 10,
2002, expressed an unqualified opinion on those statements.
We conducted our audit in accordance with auditing standards generally accepted in the United States of America; the standards applicable to financial audits contained in Government Auditing Standards, issued by the Comptroller General of the United States; and Office of Management and Budget (OMB) Bulletin No. 01-02, Audit Requirements for
Federal Financial Statements. Those standards require that we plan and perform the audit to obtain reasonable assurance about whether the financial statements are free of material misstatement. An audit includes examining, on a test basis, evidence supporting the amounts and disclosures in the financial statements. An audit also includes assessing the accounting principles used and significant estimates made by management, as well as evaluating the overall financial statement presentation. We believe that our audit and the report of other auditors provides a reasonable basis for our opinion. In our opinion, based on our audit and the report of other auditors, the consolidated and combined financial statements referred to above and appearing on pages 27 through 54 of this financial report, present fairly, in all material respects, the financial position of the CMS, as of

85
SUPPLEMENTARY SECTION
Report of Independent Auditors
September 30, 2003, and their net cost, changes in net position, budgetary resources, and reconciliation of net cost to budgetary resources for the fiscal year then ended in conformity with accounting principles generally accepted in the United States of America. As discussed in Note 1 to the financial statements, the Office of Management and Budget has exempted the CMS from certain requirements of OMB Circular No. A-11, Preparation,
Submission and Execution of the Budget, for fiscal years 2003 and prior. Specifically, for the Medicare program, the CMS is exempted from reporting Medicare entitlements due and payable as obligations in the statement of budgetary resources and from reporting recoveries of prior year obligations on the statement of budgetary resources.
Our audit was conducted for the purpose of forming an opinion on the consolidated and combined financial statements of CMS taken as a whole. The required supplementary information, schedule of budgetary resources, included on page 78 of the financial report, is not a required part of the consolidated and combined financial statements but is supplementary information required by OMB Bulletin No. 01-09. This information, and the consolidating information included on pages 76 and 77 of this financial report are presented for purposes of additional analysis of the consolidated and combined financial statements rather than to present the financial position, changes in net position, budgetary resources and reconciliation of net cost to budgetary resources of the individual the CMS programs. Such information has been subjected to the auditing procedures applied in the audit of the consolidated and combined financial statements and, in our opinion, is fairly stated in all material respects in relation to the consolidated and combined financial statements taken as a whole.
The required supplementary information included on pages i to viii, 1 to 26, and 79 of this financial report and the required supplementary stewardship information included on pages 55 to 75 of this financial report, are not required parts of the financial statements but are supplementary information required by OMB Bulletin No. 01-09 and the Federal Accounting Standards Advisory Board. We have applied certain limited procedures to such information, which consisted principally of inquiries of management regarding the methods of measurement and presentation of the supplementary information. However, we did not audit the information and express no opinion on it.
The other accompanying information included on pages 80 to 83 and 101 to the end of this financial report, are presented for purposes of additional analysis and are not a required part of the financial statements. Such information has not been subjected to the auditing procedures applied in the audit of the consolidated and combined financial statements and, accordingly, we express no opinion on it.

86
SUPPLEMENTARY SECTION
Report of Independent Auditors
In accordance with Government Auditing Standards, we have also issued a report dated November 7, 2003 on our consideration of the CMS’ internal control and a report dated November 7, 2003 on its compliance with laws and regulations. Those reports are an integral part of an audit performed in accordance with Government Auditing Standards and should be read in conjunction with this report in considering the results of our audit.
November 7, 2003
87
SUPPLEMENTARY SECTION
PricewaterhouseCoopers LLP
Suite 800W
1301 K St., N.W.
Washington DC 20005-3333
Telephone (202) 414 1000
Facsimile (202) 414 1301
Report of Independent Auditors on Compliance with Laws and Regulations
To the Administrator of the Centers for Medicare & Medicaid Services and the Inspector General of the Department of Health and Human Services
We have audited the accompanying consolidated balance sheets of the Centers for Medicare
and Medicaid Services (CMS) and its components as of September 30, 2003, and the related
consolidated statements of net cost, of changes in net position and of financing, and the
combined statement of budgetary resources for the year then ended and have issued a report
thereon dated November 7, 2003. We conducted our audit in accordance with auditing
standards generally accepted in the United States of America; the standards applicable to
financial audits contained in Government Auditing Standards, issued by the Comptroller
General of the United States; and Office of Management and Budget (OMB) Bulletin No. 01-
02, Audit Requirements for Federal Financial Statements.
We did not audit the financial statements of the Health Programs which are a major subset of
the CMS administered programs, which statements reflect total combined assets of $28,057
million and total combined net costs of $166,081 million, as of and for the year ended
September 30, 2003. Those statements were audited by other auditors whose report thereon
has been furnished to us, and our report on the CMS’ compliance with laws and regulations
herein, insofar as it relates to Health Programs is based solely on the report of the other
auditors.
Management of the CMS is responsible for compliance with laws and regulations applicable
to the CMS. As part of obtaining reasonable assurance about whether the financial statements
are free of material misstatement, we and other auditors performed tests of the CMS'
compliance with certain provisions of laws and regulations, non-compliance with which could
have a direct and material effect on the determination of financial statement amounts and
certain other laws and regulations specified in OMB Bulletin No. 01-02, including the
requirements referred to in the Federal Financial Management Improvement Act of 1996
(FFMIA). However, the objective of our audit of the financial statements was not to provide
an opinion on overall compliance with such provisions and, accordingly, we do not express
such an opinion.

88
CHAPTER TITLE
Report of Independent Auditors on Compliance with Laws and Regulations
The results of our and other auditors’ tests of the CMS’ compliance with the provisions of laws and regulations described in the preceding paragraph, exclusive of FFMIA, disclosed no instances of non-compliance that are required to be reported under Government Auditing
Standards and OMB Bulletin No. 01-02.
Under FFMIA, we are required to report whether the CMS’ financial management systems substantially comply with (1) the Federal financial management systems requirements, (2) the applicable Federal accounting standards, and (3) the United States Standard General Ledger at the transaction level. To meet this requirement, we performed tests of compliance with FFMIA section 803(a) requirements. The results of our tests disclosed instances, noted in the following paragraph, where the CMS' financial management systems did not substantially comply with the FFMIA requirements.
We reported that the CMS has material weaknesses related to (1) internal controls surrounding Financial Systems, Analyses and Oversight as well as (2) internal controls surrounding Electronic Data Processing for the Medicare program. We believe that these matters, taken together, represent substantial non-compliance with the Federal financial management system requirements under FFMIA. Further details surrounding these findings, together with our recommendations for corrective action have been reported separately to the CMS in our report on internal control dated November 7, 2003.
This report is intended solely for the information and use of the management of the CMS and the Department of Health and Human Services (HHS), the Office of the Inspector General of HHS, the OMB, and Congress. This report is not intended to be and should not be used by anyone other than these specified parties.
November 7, 2003

89
CHAPTER TITLE
PricewaterhouseCoopers LLP
Suite 800W
1301 K St., N.W.
Washington DC 20005-3333
Telephone (202) 414 1000
Facsimile (202) 414 1301
Report of Independent Auditors on Internal Control
To the Administrator of the Centers for Medicare & Medicaid Services and the Inspector General of the Department of Health and Human Services
We have audited the accompanying consolidated balance sheet of the Centers for Medicare
and Medicaid Services (CMS) and its components as of September 30, 2003, and the related
consolidated statements of net cost, of changes in net position and of financing, and the
combined statement of budgetary resources for the year then ended and have issued a report
thereon dated November 7, 2003. We conducted our audit in accordance with auditing
standards generally accepted in the United States of America; the standards applicable to
financial audits contained in Government Auditing Standards, issued by the Comptroller
General of the United States; and Office of Management and Budget (OMB) Bulletin No. 01-
02, Audit Requirements for Federal Financial Statements.
We did not audit the financial statements of the Health Programs which are a major subset of
the CMS administered programs, which statements reflect total combined assets of $28,057
million and total combined net costs of $166,081 million, as of and for the year ended
September 30, 2003. Those statements were audited by other auditors whose report thereon
has been furnished to us, and our report on the CMS’ internal control over financial reporting
herein, insofar as it relates to the Health Programs, is based solely on the report of the other
auditors.
Management of the CMS is responsible for establishing and maintaining effective internal
control. The objectives of internal control are to provide management with reasonable, but not
absolute, assurance that: (a) transactions be properly recorded, processed, and summarized to
permit the preparation of the consolidated and combined financial statements in accordance
with Federal accounting standards and the safeguarding of assets against loss from
unauthorized acquisition, use or disposition and (b) transactions are executed in accordance
with (i) laws governing the use of budget authority and other laws and regulations that could
have a direct and material effect on the consolidated financial statements and (ii) any other
laws, regulations and government wide policies identified in OMB Bulletin No. 01-02.
In planning and performing our audit we considered the CMS’ internal control over financial
reporting by obtaining an understanding of the CMS’ internal control, determined whether
internal control had been placed in operation, assessed control risk, and performed tests of

90
AUDIT OPINION AND MANAGEMENT RESPONSE
Report of Independent Auditors on Internal Control
control in order to determine our auditing procedures for the purpose of expressing our audit
opinion on the financial statements. We limited our internal control testing to those controls
necessary to achieve the objectives described in OMB Bulletin No. 01-02. We did not test all
internal controls relevant to operating objectives as broadly defined by the Federal Managers’
Financial Integrity Act of 1982, such as those controls relevant to ensuring efficient
operations. The objective of our audit was not to provide assurance on internal control.
Consequently, we do not provide an opinion on internal control.
In addition, we considered the CMS’ internal control over Required Supplementary
Stewardship Information by obtaining an understanding of the CMS’ internal control,
determined whether these internal controls had been placed in operation, assessed control risk,
and performed tests of controls as required by OMB Bulletin No. 01-02 and not to provide
assurance on these internal controls. Accordingly, we do not provide an opinion on such
controls.
Finally, with respect to internal control related to performance measures reported on pages 11
to 23, we obtained an understanding of the design of significant internal controls relating to
the existence and completeness assertions, as required by OMB Bulletin No. 01-02. Our
procedures were not designed to provide assurance on internal control over reported
performance measures, and, accordingly, we do not provide an opinion on such controls.
Our consideration of the internal control over financial reporting would not disclose all matters
in the internal control over financial reporting that might be reportable conditions. Under
standards issued by the American Institute of Certified Public Accountants, reportable
conditions are matters coming to our attention relating to significant deficiencies in the design
or operation of the internal control that, in our judgment could adversely affect the agency’s
ability to record, process, summarize, and report financial data consistent with the assertions
by management in the financial statements. Material weaknesses are reportable conditions in
which the design or operation of one of more of the internal control components does not
reduce to a relatively low level the risk that misstatements in amounts that would be material
in relation to the financial statements being audited may occur and not be detected within a
timely period by employees in the normal course of performing their assigned functions.
Because of inherent limitations in internal controls, misstatements, losses, or noncompliance
may nevertheless occur and not be detected. However, we noted certain matters involving the
internal control that we consider to be material weaknesses.

91
AUDIT OPINION AND MANAGEMENT RESPONSE
Report of Independent Auditors on Internal Control
Material Weaknesses
Financial Systems, Analyses and Oversight (Repeat Condition)
Over the past year, CMS has made significant progress in addressing the financial systems,
analyses and oversight weaknesses noted during fiscal year 2002:
The CMS referred an additional $700 million in delinquent debt to Treasury, which brings the total referrals to approximately 96% of all eligible debt.
The CMS continued the use of workgroups comprised of central office and regional office consortia staff to serve as subject matter experts responsible for addressing four key areas: follow up on corrective action plans (CAPs), reconciliation of funds expended to paid claims, trend analyses, and internal controls.
The CMS CAP Workgroup revised the manual policies and procedures for the reporting and implementation of CAPs by the Medicare contractors to provide additional clarification regarding the submission of the “Universal CAP Report” that was developed in FY 2002.
The CMS-1522 Cash Reconciliation Workgroup worked with the Office of Inspector General and issued reconciliation procedures to Medicare contractors who process and pay claims under the Fiscal Intermediary Standard System (FISS) and Multi-Carrier System (MCS).
The CMS continued performing Statement on Auditing Standards (SAS) 70 reviews documenting and assessing internal controls at Medicare contractor sites. These reviews include assessing contractors' progress in implementing corrective actions for prior reviews.
In addition, the CMS continued to make progress toward the implementation of Healthcare Integrated General Ledger Accounting System (HIGLAS). Some of the achievements for the current year include:
Putting the technical infrastructure in place to pay HIGLAS claims at two of the largest contractors.
Developing functional and technical solutions and a testing protocol so that the initial functionality of the HIGLAS system can be tested at two of the largest contractors.
However, while progress has been made during the current year, we continued to note
significant weaknesses regarding the CMS’ financial systems, analyses and oversight.

92
AUDIT OPINION AND MANAGEMENT RESPONSE
Report of Independent Auditors on Internal Control
Lack of Integrated Financial Management System
The CMS' financial management systems are not compliant with the Federal Financial
Management Improvement Act of 1996 (FFMIA). FFMIA requires agencies to implement and
maintain financial management systems that comply with Federal financial management
systems requirements as defined by the Joint Financial Management Improvement Program
(JFMIP). More specifically, FFMIA requires Federal agencies to have an integrated financial
management system that provides effective and efficient interrelationships between software,
hardware, personnel, procedures, controls, and data contained within the systems. The lack of
an integrated financial management system continues to impair the CMS' and the Medicare
contractors' abilities to efficiently and effectively support and analyze accounts receivable and
other financial reports.
For example, Medicare contractors currently rely on a combination of claims processing
systems, personal computer based software applications and other ad hoc systems to tabulate,
summarize and prepare information presented to the CMS on the 750 – Statement of Financial
Position Reports and the 751 – Status of Accounts Receivable Reports. These reports are the
primary basis for the accounts receivable amounts reported within the financial statements.
Because the CMS, and the CMS contractors, do not have a JFMIP compliant financial
management system, the preparation of the 750/751 reports, and the review and monitoring of
individual accounts receivable are dependent on labor intensive manual processes subject to
the increased risk of inconsistent, incomplete or inaccurate information being submitted to the
CMS. Likewise the reporting mechanism used by the CMS contractors to reconcile and report
funds expended, the 1522 – Monthly Contractor Financial Report, are heavily dependent on
inefficient, labor intensive, manual processes, subject to the increased the risk of inconsistent,
incomplete, or inaccurate information being submitted to the CMS.
Financial Analyses and Reporting--Medicare Contractors
Our overall results identified improvements regarding the CMS’ oversight of the Medicare
contractors, however continuing weaknesses impact the CMS' ability to analyze and accurately
report financial information in a timely basis.
The CMS has self-reported that during the fiscal year a total of $98.3 million in errors were
discovered by certified public accountants hired by the CMS to review accounts receivable
transactions processed by the CMS contractors. Collectively, these errors resulted in an
overstatement of accounts receivable of $11.6 million, which was corrected by CMS. These
errors were attributable in part to the following internal control findings identified through
procedures utilized by the CMS to manage the CMS contractors:

93
AUDIT OPINION AND MANAGEMENT RESPONSE
Report of Independent Auditors on Internal Control
Contractors were not sending demand letters in a timely manner as required by existing policy and procedures.
Contractors were not maintaining adequate audit trails for Medicare Secondary Payor recoveries.
Contractors were not implementing policies and procedures to accurately refer debt to Treasury for collection.
Contractors were not maintaining adequate documentation to support the classification, accumulation or reporting of accounts receivable.
Contractors were not accurately calculating interest on outstanding accounts receivable.
During our testing of accounts receivable at nine CMS contractors, we noted other indicators
of control weaknesses which are also attributable to the previously discussed system
weaknesses. The manual processes that the CMS and the contractors have implemented to
track and report accounts receivable are inefficient and labor intensive, subject to the type of
internal control findings noted below:
At one contractor, credit balances owed to providers were inappropriately offset against valid accounts receivable due from other providers.
At one contractor, cash received but not applied against a corresponding account receivable, was inappropriately excluded from the 750/751 report.
At three contractors, documentation to support the application of cash against existing accounts receivable was not maintained.
At one contractor, the detailed accounts receivable reports could not be reconciled to the aging of accounts receivable reported on the 750/751 reports.
At one contractor, the periodic interim payment receivable balances could not be reconciled to the supporting documentation.
At one contractor, the allowance for doubtful accounts was understated due to the fact that the contractor had failed to accurately report the corresponding accounts receivable balance.
At one contractor, cash received was not applied against existing accounts receivable in a timely manner.
The regional offices are responsible for reviewing various reports submitted by the Medicare
contractors. During our audit, we noted that the regional offices were not completing the
required reviews in a timely manner; specifically we noted that in one of the two regional
offices visited, the review and approval of the Currently Not Collectible (CNC) reports was
not completed in a timely manner for MSP debt. Furthermore, we noted instances when the
CNC debt being approved for write-off should have been written off during the previous fiscal

94
CHAPTER TITLE
Report of Independent Auditors on Internal Control
year, indicating that the previous reviews may not have been completed in accordance with the
CMS policies and procedures.
Ensuring that policies and procedures are consistently implemented and ensuring the
availability of documentation used to support management decisions is a requirement of OMB
A-123 and GAO’s internal control standards.
Recommendations
We recommend that the CMS continue to develop and refine its financial management
systems and processes to improve its accounting, analysis, and oversight of Medicare activity.
Specifically,
Establish an integrated financial management system for use by Medicare contractors
and the CMS' central and regional offices to promote consistency and reliability in
recording and reporting financial information, including accounts receivable and claim
activity. Additionally, CMS should continue its efforts to promote uniform reporting
procedures by the Medicare contractors.
Continue to refine procedures to provide a mechanism for the CMS central and
regional offices to monitor contractors' activities and enforce compliance with the
CMS financial management procedures. This may include obtaining detailed
subsidiary ledgers and related support from contractors for the CMS regional and
central offices; reviewing subsidiary ledgers for reasonableness and reviewing
reconciliations prepared by the contractors on a periodic basis.
Managed Care Organization Oversight
PwC requested the CMS Central Office to provide a complete set of the formal policies and
procedures utilized throughout fiscal year 2003 to process, approve and accept the applications
for managed care organizations applying to join the Managed Care program. CMS provided
PwC with various versions of the requested policy guidance, but was unable to provide a
complete set of the formal policies and procedures utilized throughout fiscal year 2003.
Having this type of documentation readily available is a requirement of OMB Circular No. A-
123, Management Accountability and Control, and a requirement of GAO’s Standards for
Internal Control in the Federal Government. The inability of the CMS to readily provide a
comprehensive set of the guidance used throughout fiscal year 2003 increases the risk of
inappropriately accepting a managed care organization into this program.

95
CHAPTER TITLE
Report of Independent Auditors on Internal Control
During our testing, we requested that the CMS provide the supporting documentation for
applications which were processed and approved during the current fiscal year. Due in part to
the lack of formalized guidance discussed in the proceeding paragraph, the CMS Central
Office was unable to provide to PwC consistently completed documentation to support the
CMS’ acceptance of managed care organizations into the Managed Care program. For
example, PwC requested that the CMS provide documented evidence regarding items, such as
state licensure. Having this type of documentation readily available for audit is a requirement
of OMB A-123 and GAO’s internal control standards.
The CMS was unable to provide to PwC sufficient documentation to evidence the on-going
monitoring of managed care organizations by the regional offices in accordance with the CMS
policies and procedures provided to PwC during the audit. Internal documentation maintained
by the CMS noted that the managed care organization had “met” the required element, but
documentation to evidence how the particular element was met was unavailable for review
during our audit. Furthermore, we noted other inconsistencies regarding the documentation
that was available for review. For example, we noted that some regions maintained
worksheets and other documents to evidence the reviews. However, other regions did not
maintain this same type of evidence to support the reviews.
Recommendations
We recommend that the CMS continue to develop and refine its financial management
systems and processes to improve its accounting, analysis, and oversight of Managed Care
activity. Specifically,
Establish and implement formal policies and procedures for the approval of applications of organizations into the Managed Care program.
Ensure that existing policies and procedures for the on-going monitoring of
organizations within the Managed Care program are consistently implemented and that the monitoring of these organizations is documented in accordance with appropriate standards and guidelines.
Medicare Electronic Data Processing (Repeat Condition)
Background and Scope of Review
The CMS relies on extensive information systems operations at its central office and Medicare
contractor sites to administer the Medicare program and to process and account for Medicare

96
CHAPTER TITLE
Report of Independent Auditors on Internal Control
expenditures. Internal controls over these operations are essential to ensure the integrity,
confidentiality and reliability of the Medicare data and to reduce the risk of errors, fraud and
other illegal acts.
Our internal control testing covered both general and application controls. General controls
involve organizational security plans, referred to as entity-wide security plans (EWSP), access
controls (physical and logical), application development and program change controls,
segregation of duties, operating systems software for servers and mainframe platforms, and
service continuity plans and testing. General controls provide the foundation to ensure the
integrity of application systems and combined with application level controls are essential to
ensure proper processing of transactions and integrity of stored data. Application controls
include controls over input, processing of data, and control over output from CMS application
systems.
Our audits included general controls at 17 sites: the CMS central office and 16 Medicare
contractors. We reviewed application controls at the CMS central office for several systems
integral to Medicare financial information. We also reviewed application controls at six of the
Medicare contractors which included the Fiscal Intermediary Standard System (FISS), the
Viable Processing Systems (VIPS) and Viable Medicare System (VMS), the Arkansas Part A
Standard System (APASS), the Multi Carrier System (MCS) and the Common Working File
(CWF) System. Our audit also relied on the work and findings of the SAS 70 reviews for the
16 Medicare contractors audited.
Further, we conducted vulnerability reviews of network controls at 16 of the sites audited.
The vulnerability reviews included both external and internal penetration testing and network
vulnerability assessments, including security configurations of network servers. Both the
scope of the vulnerability testing and the number of sites tested were significantly expanded
this year.
A number of general and application control findings were identified which is consistent with
that found in prior years. Additionally, our vulnerability testing noted numerous security
settings/controls that required enhancement. The majority of weaknesses were noted at the
Medicare contractors, rather than the CMS central office. Our procedures disclosed no
evidence of actual system compromise of security; however, we consider the cumulative effect
of the weaknesses noted to comprise a material weakness to CMS.
Entity-wide Security Program (EWSP) - These programs provide the foundation for the
security culture and awareness of the organization. A sound EWSP is the cornerstone to
ensure effective security controls throughout the organization. Our audit noted several

97
CHAPTER TITLE
Report of Independent Auditors on Internal Control
contractor locations for which an emphasis on a robust and true entity-wide security program
was not in existence. In these locations, security was treated as a directive, rather than a
cultural norm that guides daily activities. As a result, numerous weaknesses were noted in the
areas of access and systems software controls. An overriding factor in the pervasiveness of
poor security controls was that these sites had designated security administration duties to
personnel who did not possess the proper background and education to perform their job
requirements and that other resources were only minimally directed to security programs,
training and understanding. We also noted instances where security administration duties
were improperly segregated from the duties of application programming. We also noted
numerous sites that did not have an overall EWSP in place. Security controls cannot be
effective without a robust, detailed EWSP that is fully sponsored and practiced by the senior
management of the contractor sites. Robust plans require proper training and understanding
and include security personnel with proper background and education to ensure the function of
the program.
Logical and Physical Access Controls – Access controls ensure that critical systems assets
are physically protected from unauthorized access and that logical controls provide assurance
that only authorized personnel may access data and programs maintained on systems. Our
audit noted findings regarding physical and logical access during our controls testing. Further,
our vulnerability testing noted a large number of security settings/controls that required
enhancement. Our external penetration testing was successful at multiple sites, primarily
caused by poor or non-existent security settings resulting from the lack of sufficient security
configuration standards for the network computers tested. Our testing of access controls also
noted that we were easily able to bypass security controls without prior knowledge of the
systems tested and that numerous security weaknesses existed that would allow internal users
to easily access sensitive systems, program and data without proper authorization. Our review
did not disclose any exploitation of critical systems tested.
The lack of specific guidance for computer security configuration settings and effective entity-
wide security programs, administered by personnel with proper knowledge and experience,
prevents contractors from providing adequate security controls that would ensure that only
properly authorized personnel access sensitive CMS data and programs.
Application Security, Development and Program Change Controls – Application security,
development and program change controls provide assurance that programs are developed
with standards that ensure their effectiveness, efficiency, accuracy, security and maintenance
and that only authorized and properly tested programs are implemented for production use.
Our audit noted that contractor processing sites have the ability to turn on and off front-end
edits in the FISS system. This issue presents an important area of concern because the ability

98
CHAPTER TITLE
Report of Independent Auditors on Internal Control
to negate system edits degrades the ability to ensure that only proper data is introduced into
these systems and ultimately, the CWF and the National Claims History (NCH) System. We
also noted that application changes are being implemented without complete testing and that
application change control procedures were not followed at several sites, including the CMS
central office. We also noted several sites at which application programmers have the ability
to directly update production source code for applications thereby bypassing application
change controls.
Systems Software – Systems software is a set of computer programs designated to operate
and control the processing activities for all applications processed on a specific computer,
including network servers, mainframe systems, and personal computers. Controls over access
to, and use of, such software are especially critical. Our audits noted numerous findings
during our general controls testing for systems software system settings/controls for network
servers that required enhancement.
Changes to systems software – Our audit noted that systems software change procedures and/or controls were not in place or consistently followed at many of the sites tested. Failure to control systems software changes can seriously impact the security and effectiveness of data and operations because systems software provides the foundation to operate all of the computers used.
Access to systems software programs and files – Our audit noted numerous instances of poor password controls that could allow unauthorized access to systems software programs and files. Findings were noted regarding systems software on mainframe, Windows, Unix, firewall and router servers audited. The lack of security configuration standards contributes to the weaknesses noted and the ability of our external penetration teams to penetrate multiple sites tested.
Service Continuity Planning and Testing – Service continuity relates to the readiness of a
site in the case of a system outage or event that disrupts normal processing of operations.
Without approved, documented, and tested business and system continuity plans, there is no
assurance that normal operations may be recovered efficiently and timely.
Incomplete and/or inadequately tested plans - Our audit noted findings related to incomplete plans or inadequate testing at both contractor sites and at the CMS central office. Failure to ensure complete, tested and viable plans could severely impact CMS processing operations.
Overall Conclusion - During FY 2003, CMS made progress by issuing the Acceptable Risk
Safeguards document. This document provides much greater specificity on security standards
99
CHAPTER TITLE
Report of Independent Auditors on Internal Control
and will complement the Business Partners Systems Security Manual previously provided as
guidance to the contractors. CMS has also continued its programs to review the contractors
through SAS 70 audits, an extensive contractor self-assessment program and reporting process
and greater central oversight by contractor management. Additionally, CMS has requested
and received system security plans from its contractors and has a promising certification and
accreditation program initiative featuring system vulnerability assessments. However, the
number of findings documented during our audit indicates that improvements are still needed.
Efforts to address the findings noted within budgetary constraints are challenged by the decentralized nature of Medicare operations and the complexity of fee-for-service processing. CMS has indicated the President’s budget for FY 04 includes a funding request for IT modernization. According to CMS officials, its modernization program represents a longer term solution to simplify the application software code and change controls needed for more robust security. CMS has also stated its contractor reform initiative, including data center consolidation, will shorten the security perimeter by reducing the number of contractors and data centers.
Recommendations
We recommend that the CMS continue to strengthen controls over Medicare electronic data
processing. Specifically,
That the CMS management provide additional guidance to the contractors through the issuance of a centralized set of specific security models for all platforms used in the CMS system (central office, contractors and maintainers). The security standards should clearly outline the required control settings and parameters suggested to ensure that each platform is properly secured for use. Adoption of server security models set by NSA and/or NIST and the DoD for mainframe systems is highly recommended.
That the CMS management develop and implement policies and procedures to monitor
compliance with the security models for all platforms maintained within the CMS central office, the CMS contractor sites and the maintainer sites.
* * * * * * *
We also identified other less significant matters that will be reported to the CMS management
in a separate consolidated management recommendation letter.

100
CHAPTER TITLE
Report of Independent Auditors on Internal Control
This report is intended solely for the information and use of the management of the CMS and
Health and Human Services, the Office of the Inspector General of Health and Human
Services, the OMB, and Congress. This report is not intended to be and should not be used by
anyone other than these specified parties.
November 7, 2003

FEDERAL MANAGERS’FINANCIAL INTEGRITY ACTThe Federal Managers’ Financial Integrity Act (FMFIA) requires executive agencies to reportannually if: (1) they have reasonable assurance that their management controls protect theirprograms and resources from fraud, waste, and mismanagement, and if any material weak-nesses exist in their controls, and (2) their financial management systems conform withFederal financial management systems requirements.
The CMS assesses its management controls and financial management systemsthrough: (1) management control reviews, (2) management self-certifications, (3) Officeof Inspector General (OIG) audits, (4) the CFO financial audit, (5) other reviewmechanisms, such as Statement on Auditing Standards No. 70 (SAS 70) internal controlreviews, and (6) certification and accreditation of systems. As of September 30, 2003, themanagement controls and financial management systems of CMS provided reasonableassurance that the objectives of FMFIA were achieved. However, two materialweaknesses (repeated from prior years) existed and a noncompliance was identified.
Material Weakness 1:Financial Systems, Analyses, and Oversight
The Medicare contractors continue to make improvements in maintaining supportingrecords for Medicare activities and year-end accounts receivable balances. However,because the contractors lack a formal, integrated accounting system to accumulate andreport financial information, they use ad hoc, labor-intensive reports, which increasesthe risk of material misstatement or omission. In addition, Medicare contractor controlsover accounts receivable continue to need improvement.
101
CHAPTER TITLE
OtherCongressional
Reports
OtherCongressional
Reports

We continue to contract with Independent Public Accountants to test financialmanagement internal controls and to analyze accounts receivable at Medicarecontractors. The CMS workgroups serve as subject matter experts responsible foraddressing four key areas: follow up on CAPs, reconciliations of funds expended topaid claims, trend analysis, and internal controls. As CMS progresses toward its long-term goal of developing an integrated general ledger system, we continue to providetraining to the Medicare contractors to promote a uniform method of reporting andaccounting for accounts receivable and related financial data.
Material Weakness 2:Medicare Electronic Data Processing (EDP) Controls
We rely on extensive EDP operations at CMS and the Medicare contractors to administerthe Medicare program and to process and account for Medicare expenditures. Internalcontrols over these operations are essential to ensure the integrity, confidentiality, andreliability of critical data while reducing the risk of errors, fraud, and other illegal acts.The material weakness for Medicare EDP controls is very complex and requires time andresources. The CMS has made substantial investment and progress in strengtheningsecurity at the Medicare contractors. The strategy in eliminating the material weakness isrooted in the CMS modernization initiative that will further improve our security posture.
We continue to make progress toward resolving this issue. The CMS SecurityRequirements adhere to guidelines in the Office of Management and Budget CircularA-130 and implement effective control procedures. We have implemented numeroussafeguards in the core security requirements areas of access control, system software,segregation of duties, and service continuity. We also developed an entity-wide securityprogram for all significant production applications and related users. We have developeda program to formally have all of our systems certified and accredited by the end ofFY 2005.
NoncomplianceThe CMS financial management systems—because they are not integrated—do notconform to government-wide requirements. We have implemented a comprehensiveplan to bring our financial systems into compliance. Specifically, we have initiated stepsto implement an integrated general ledger system known as HIGLAS for the Medicarecontractors, regional and central offices. The HIGLAS will integrate our current financialsystems with the Medicare contractors’ three existing standard claims processingsystems. In addition, the current mainframe-based financial system will be replaced byHIGLAS, a web-based system. The HIGLAS is expected to be fully operational by 2007.
102
OTHER CONGRESSIONAL REPORTS

MEDICARE’S VALIDATION PROGRAM FORJCAHO ACCREDITED HOSPITALS
Introduction
Section 1865 of the Social Security Act (the Act) provides that hospitals accredited bythe Joint Commission on Accreditation of Health Care Organizations (JCAHO) aredeemed to meet the Medicare Conditions of Participation (CoPs). While JCAHO-accredited hospitals are not subject to routine Medicare surveys by the State surveyagencies, subsection 1864(c) of the Act authorizes the Secretary to enter into anagreement with any such State agency to survey JCAHO-accredited hospitals on aselective sample basis, or in response to allegations of significant deficiencies which, ifsubstantiated, would adversely affect the health and safety of patients. The Act furtherrequires, at section 1875, the Secretary to include an evaluation of the JCAHOaccreditation process for hospitals in an annual report to Congress. This evaluation isreferred to as the hospital validation program.
The purpose of the hospital validation program is to determine if the JCAHOaccreditation process provides a reasonable assurance that accredited hospitals are incompliance with the statutory requirements set forth at subsection 1861(e) of the Act forparticipation in the Medicare program as hospitals. In FY 2002, CMS randomly selectedapproximately 5 percent of all JCAHO-accredited hospitals to receive a validation survey.For FY 2003, the number of hospitals selected to receive a validation survey willdecrease to approximately 1 percent of all JCAHO-accredited hospitals.
The JCAHO accreditation survey assesses a hospital’s compliance with the JCAHOstandards. Following the completion of an on-site survey, the JCAHO makes anaccreditation decision. The accreditation decisions include: accreditation, accreditationwith requirements for improvement (formerly accreditation with Type I recommenda-tions), conditional accreditation, and accreditation denied.
1Accreditation means that the
hospital meets all JCAHO standards and requirements. Accreditation with requirementsfor improvement means that the hospital is granted accreditation with the assurancethat the identified recommendations for improvement are corrected. The JCAHOrequires hospitals with requirements for improvement to submit a written progressreport or undergo a follow-up survey. Conditional accreditation results when a hospitalis not in substantial compliance with JCAHO standards, but is believed to be capable of
_______________________________________1JCAHO accreditation decisions also include preliminary denial of accreditation and provisional accreditation.
[The CMS does not recognize provisional accreditation for deeming.] The JCAHO considers all hospitals to be‘accredited’ except those that are not accredited. The CMS currently accepts the JCAHO definition fordeeming purposes.
103
OTHER CONGRESSIONAL REPORTS

achieving acceptable compliance within a stipulated time period. Findings of correction,which serve as the basis for further consideration of awarding full accreditation, mustbe demonstrated through a short-term follow-up survey. Table 1 summarizes the JCAHOaccreditation decisions for Medicare-approved hospitals receiving a triennial survey infiscal years 2001 and 2002.
TABLE 1JCAHO Accreditation Decisions,
Medicare-Approved Hospitals Surveyed in FY 2001 and FY 2002
Accreditation Decisions No. Hospitals in 2001 No. Hospitals in 2002(Percent) (Percent)
Accreditation 167 257 (10.8) (16.7)
Accreditation with 1349 1306 Requirements for Improvement (87.3) (82.7)
Conditional 28 14 Accreditation (1.8) (0.9)
Preliminary Denial 1 1 of Accreditation (0.06) (0.06)
Accreditation Denied 0 1 (0) (0.06)
Total Surveyed 1545 1578 (100) (100)
Sample Validation Surveys
A total of 205 sample validation surveys were performed in JCAHO-accredited hospitalsduring FY 2002. The validation sample includes the following categories:
1. Traditional surveys
2. Focused surveys
3. Conditional surveys
The traditional validation survey is a full survey in which the hospital is evaluatedfor compliance with all Medicare CoPs. The traditional survey is the “look behind”method historically used by CMS for validation surveys and is conducted within 60 daysfollowing the hospital’s JCAHO accreditation survey. There were 112 traditionalvalidation surveys conducted during FY 2002.
104
OTHER CONGRESSIONAL REPORTS

The focused validation survey is designed to evaluate a hospital’s ability to maintaincompliance with the Medicare requirements between JCAHO accreditation surveys.Focused surveys are conducted between 60 days and six months following the hospital’sJCAHO accreditation survey and examine specific standards of national or regionalinterest to CMS. The focused areas for FY 2002 were the Medicare CoPs for Patients’Rights, Nursing Services, Pharmaceutical Services and Quality Assurance as it pertainsto pharmaceutical services and medication administration. A total of 89 focused surveyswere conducted in FY 2002.
The conditional validation survey is a full survey conducted at a hospital that hasreceived a conditional accreditation decision as a result of their JCAHO accreditationsurvey. The State agency performs the survey approximately six to eight monthsfollowing the JCAHO survey. There were four conditional validation surveys conductedduring FY 2002.
Validation Survey Findings
In FY 2002, a total of 205 JCAHO-accredited hospitals received a validation survey.Table 2 presents the number of validation surveys performed, along with the compliancedeterminations (i.e., if the results of a validation survey showed noncompliance with oneor more CoPs, the hospital was ‘out of compliance’). A hospital may have haddeficiencies of a lesser severity (e.g., standard level) and still be considered incompliance. This table also includes a comparison of the compliance pattern betweenvalidation surveys of accredited hospitals and routine surveys of non-accredited hospitals.
TABLE 2Compliance Determinations of Validation and
Non-Accredited Hospital Surveys, FY 2002
Survey Type No. Hospitals Out of No. Hospitals In TotalCompliance Compliance(Percent) (Percent)
Sample Validations 41 164 205 (20.0) (80.0)
Routine Non- 53 227 280Accredited (18.9) (81.1)
Table 3 presents compliance determinations for JCAHO-accredited hospitals bycategory of validation survey for FY 2002.
105
OTHER CONGRESSIONAL REPORTS

TABLE 3JCAHO-Accredited Hospitals Out of Compliance
by Validation Survey Category for FY 2002
Survey Type No. Hospitals Out of No. Hospitals In TotalCompliance Compliance
Traditional 35 77 112 Focused 6 83 89 Conditional 1 3 4
The three health and safety CoPs found out of compliance most frequently for the205 validation surveys performed in FY 2002 are shown in table 4. The three CoPsfound out of compliance most frequently for the 280 non-accredited hospitals surveyedin FY 2002 are shown for comparison.
TABLE 4Most Frequently Cited Conditions of Participation
During Surveys, FY 2002
Accredited Hospitals Frequency Non-Accredited Hospitals Frequency
1 Physical Environment 25 Physical Environment 20 (Includes Life Safety Code) (Includes Life Safety Code)
2 Patients’ Rights 8 Quality Assurance 17
3 Quality Assurance 7 Governing Body 16
Allegation Surveys
In addition to sample validation surveys, CMS conducts substantial allegation(complaint) surveys on JCAHO-accredited hospitals. The CMS evaluates each complaintreceived on an accredited hospital. Based on that evaluation, if CMS believes that thehospital may have a CoP out of compliance, CMS will then authorize the State agency toconduct a substantial allegation survey.
In FY 2002, 2,933 allegation surveys of JCAHO-accredited hospitals were conductedwith 100 found out of compliance with one or more CoPs. This means that 3 percent ofthe allegation surveys were substantiated by findings of non-compliance. Also, 338allegation surveys of non-accredited hospitals were conducted with 34 found out ofcompliance with one or more CoPs. This means 10 percent of the allegation surveys innon-accredited hospitals were substantiated by findings of non-compliance at the CoPlevel. Table 5 summarizes the most frequently cited CoPs found during allegationsurveys of accredited and non-accredited hospitals.
106
OTHER CONGRESSIONAL REPORTS

TABLE 5Most Frequently Cited Conditions of Participation
During Allegation Surveys, 2002
ACCREDITED HOSPITALS NON-ACCREDITED HOSPITALSCondition Not Met Frequency Condition Not Met Frequency
1 Nursing Services 47 Patients’ Rights 12
2 Quality Assurance 32 Infection Control 7
3 Patients’ Rights 24 Nursing Services 6Governing Body Quality Assurance
Disparity Rate
The rate of disparity is the percentage of sample validation surveys for which a Statesurvey agency finds noncompliance with one or more Medicare conditions and nocomparable condition level deficiency was cited by the accreditation organization, whereit is reasonable to conclude that the deficiencies were present at the time of theaccreditation organization’s most recent survey.
Of the 112 traditional validation surveys performed in JCAHO-accredited hospitals inFY 2002, the State survey agencies found non-compliance with one or more conditions in35 hospitals. Comparison of the JCAHO-accreditation survey reports with the validationsurvey reports for these hospitals revealed that in 25 of the 35 hospitals, the accreditationsurvey did not identify deficiencies comparable to the condition level deficiencies cited bythe State agency surveyors. This equals an overall disparity rate of 22 percent, a decreasefrom a disparity rate of 24 percent in FY 2001. Consistent with FY 2001, Life Safety Code(LSC) deficiencies account for more than 50 percent of the overall disparity rate.
The calculation of the disparity rate for FY 2002 includes only the universe oftraditional validation surveys performed (112) by the State survey agencies. While thesmall number of focused surveys in FY 2001 was included in last year’s disparity ratecalculation, we did not include the findings from the 89 focused surveys and the fourconditional surveys performed in the calculation of this year’s disparity rate. We believethat calculating the rate of disparity using a large number of focused surveys would notbe consistent with the regulatory definition for rate of disparity and would provide aninaccurate representation of the JCAHO performance.
The focused validation survey, designed to evaluate a hospital’s ability to maintaincompliance with the Medicare requirements between JCAHO accreditation surveys,examined only a select set of CoPs. Because these surveys were performed between 60days and six months following the JCAHO accreditation survey, it is not reasonable toconclude that the deficiencies were present at the time of that accreditation survey. Of
107
OTHER CONGRESSIONAL REPORTS

the 89 focused surveys conducted, only six hospitals (6.7 percent) were found to haveone or more condition-level deficiencies in the areas surveyed.
The conditional validation surveys were full surveys in which the State agencysurveyors examined all the Medicare CoPs. However, because these surveys wereconducted between six and eight months following the JCAHO accreditation survey it isnot reasonable to expect the same findings to be identified during both the State agencyand JCAHO surveys. Furthermore, a conditional accreditation decision by the JCAHOrequires the hospital to take immediate corrective action to address the identifiedproblems. Therefore, CMS would expect that the deficiencies identified during theJCAHO accreditation survey would be corrected before the time the validation survey isconducted.2 In three of the four conditional validation surveys performed duringFY 2002, the hospitals were found to be in compliance with all Medicare CoPs at thetime of the State agency survey. While not enough information is available at this timeto formulate definitive conclusions, CMS believes that the methodology behind a JCAHOaccreditation decision of conditional is an effective means to bring the hospital into fullcompliance within a reasonable timeframe.
As set forth in regulation at 42 CFR 488.8(d), accreditation programs with adisparity rate of 20 percent or more are subject to review by CMS to determine if thatorganization has adopted and maintains requirements for accreditation that arecomparable to CMS requirements. The CMS initiated and performed a comprehensivereview of the JCAHO requirements for LSC. In August of 2002, as a result of that review,CMS shared with the JCAHO a number of recommendations that we believe willimprove the JCAHO evaluation of LSC compliance in hospitals. A summary of theserecommendations was included in last year’s report on the hospital validation program.3
The JCAHO is currently making significant revisions to the process they use toevaluate hospitals that reflect a new beneficiary-centered approach to the survey. Theserevisions are also designed around the concept that accredited hospitals should be incontinuous compliance with the JCAHO standards. As part of this approach, the JCAHOwill require accredited hospitals to perform certain ongoing and periodic assessments.These assessments will be sent to the JCAHO for review and discussion of both thefindings and the organization’s plan for improvement. Included in this will also be theStatement of Conditions (SOC)/Plan for Improvement (PFI) process.
As the JCAHO continues to pilot test this new survey process, they have committedto also test changes to the evaluation of compliance with the Life Safety Code that areconsistent with the recommendations made by CMS. Additionally, the JCAHO iscurrently in discussion with the American Society of Healthcare Engineering (ASHE) topilot test collaborative review of the SOC and PFI documents. The JCAHO would
_________________________________2For hospitals granted conditional accreditation, the JCAHO conducts a follow-up survey, generally three to six months following the hospital’s accreditation survey to determine that the hospital has implemented the necessary corrective actions.
3For more information, please see the CMS Financial Report, Fiscal Year 2002.
108
OTHER CONGRESSIONAL REPORTS
provide ASHE with a copy of the SOC and PFI documents for an expert review, theresults of which would be made available to surveyors prior to the start of the JCAHOaccreditation survey.
The CMS anticipates that the validation survey results for FY 2003 will reflect someof the improvements that the JCAHO has made in their evaluation of LSC. Additionally,CMS believes the adoption of the 2000 edition of the Life Safety Code by both the JCAHOand CMS in September 2003 will help address some of the differences in validationfindings. The CMS and JCAHO continue to work together to ensure that the JCAHO’sstandards for LSC and survey requirements are at least as strong as those of Medicare.
Changing the Evaluation Methodology
In response to concerns raised several years ago by the GAO and OIG regarding thequality of care in our nation’s hospitals, CMS implemented a quality improvementinitiative that included a review of the hospital validation program and tested additionalvalidation survey types that might be used to improve JCAHO accountability for itsperformance when accrediting hospitals. These survey types, the Focused survey andConcurrent/Observational survey were piloted on a limited basis during FY 2001 andFY 2002.4 In 2001, CMS contracted for an independent evaluation of the current hospitalvalidation program, the changes proposed by CMS, and to suggest additional measuresthat could be used to evaluate the JCAHO performance. The CMS is currentlyconsidering suggestions for improvement made by the contractor, including anevaluation of the procedures JCAHO uses to monitor hospitals’ correction ofdeficiencies. The current validation system does not assess this aspect of JCAHOperformance—yet it is crucial to CMS’ determination of whether JCAHO accreditationprovides reasonable assurance of hospitals’ continuing compliance with the MedicareCoPs. Another suggestion is to gather the descriptive information about JCAHO’saccreditation-related activities (e.g., number of accreditation surveys conducted, numberof complaints received regarding JCAHO-accredited hospitals) currently obtained on aregular basis and in a way that is more useful to CMS in the monitoring of JCAHOactivities. Trends in this data and in JCAHO performance measures could then betracked more effectively.
The CMS is expecting to see considerable changes in the JCAHO accreditationprocess beginning in 2004 as they begin the rollout of their new accreditationmethodology and survey process. During future reporting periods, CMS will worktowards evaluating JCAHO’s ability to promote their hospitals’ correction of deficienciesand of developing a measure of how well JCAHO follows this procedure. The CMS willalso work with JCAHO to obtain more comprehensive and regular information about theorganization’s accreditation activities and to expedite the exchange of data andinformation between the two organizations.
____________________________________4The Concurrent/Observational survey was tested during FY 2001; the Focused survey was tested during bothFY 2001 and FY 2002. For additional information, please refer to the CMS Financial Report, Fiscal Year 2002.
109
OTHER CONGRESSIONAL REPORTS

CLINICAL LABORATORY IMPROVEMENTVALIDATION PROGRAM
Introduction
This report on the Clinical Laboratory Improvement Validation Program covers theevaluations of fiscal year 2002 performance by the six accreditation organizationsapproved under the Clinical Laboratory Improvement Amendments of 1988 (CLIA). Thesix organizations are as follows:
• American Association of Blood Banks (AABB)
• American Osteopathic Association (AOA)
• American Society of Histocompatibility and Immunogenetics (ASHI)
• COLA
• College of American Pathologists (the College)
• Joint Commission on Accreditation of Healthcare Organizations (Joint Commission)
We appreciate the cooperation of all of the organizations in providing theirinspection schedules and results. While an annual performance evaluation of eachapproved accreditation organization is required by law, we see this as an opportunityto present information about, and dialogue with, each organization in our mutualinterest in improving the quality of testing performed by clinical laboratories acrossthe nation.
Legislative Authority and Mandate
Section 353 of the Public Health Service Act, as amended by CLIA, requires anylaboratory that performs testing on human specimens to meet the requirementsestablished by the Department of Health and Human Services (HHS) and have in effectan applicable certificate. Section 353 further provides that a laboratory meeting thestandards of an approved accreditation organization may obtain a CLIA Certificate ofAccreditation. Under the CLIA Certificate of Accreditation, the laboratory is not routinelysubject to direct federal oversight by CMS. Instead, the laboratory receives an inspectionby the accreditation organization in the course of maintaining its accreditation, and byvirtue of this accreditation, is “deemed” to meet the CLIA requirements. The CLIArequirements pertain to quality assurance and quality control programs, records,equipment, personnel, proficiency testing and others to assure accurate and reliablelaboratory examinations and procedures.
In section 353(e)(2)(D), the Secretary is required to evaluate each approvedaccreditation organization by inspecting a sample of the laboratories they accredit and
110
OTHER CONGRESSIONAL REPORTS

“such other means as the Secretary determines appropriate.” In addition, section353(e)(3) requires the Secretary to submit to Congress an annual report on the results ofthe evaluation. This report is submitted to satisfy that requirement.
Regulations implementing section 353 are contained in 42 CFR part 493 LaboratoryRequirements. Subpart E of part 493 contains the requirements for validationinspections, which are conducted by CMS or its agent to ascertain whether thelaboratory is in compliance with the applicable CLIA requirements. Validationinspections are conducted no more than 90 days after the accreditation organization’sinspection, on a representative sample basis or in response to a complaint. The resultsof these validation inspections or “surveys” provide:
• on a laboratory-specific basis, insight into the effectiveness of the accreditation organization’s standards and accreditation process; and
• in the aggregate, an indication of the organization’s capability to assure laboratory performance equal to or more stringent than that required by CLIA.
The CLIA regulations, in section 493.575 of subpart E, provide that if the validationinspection results over a one-year period indicate a rate of disparity of 20 percent ormore between the findings in the accreditation organization's results and the findings ofthe CLIA validation surveys, CMS can re-evaluate whether the accreditation organizationcontinues to meet the criteria for an approved accreditation organization (also called“deeming authority”). Section 493.575 further provides that CMS has the discretion toconduct a review of an accreditation organization program if validation review findings,irrespective of the rate of disparity, indicate such widespread or systematic problems inthe organization's accreditation process that the requirements are no longer equivalentto CLIA requirements.
Validation Reviews
The validation review methodology focuses on the actual implementation of anorganization’s accreditation program described in its request for approval. Theaccreditation organization’s standards, as a whole, were approved by CMS as beingequivalent to, or more stringent than, the CLIA condition-level requirements,1 as awhole. This equivalency is the basis for granting deeming authority.
In evaluating an organization’s performance, it is important to examine whether theorganization’s inspection findings are similar to the CLIA validation survey findings. It isalso important to examine whether the organization’s inspection process sufficientlyidentifies, brings about correction, and monitors for sustained correction, laboratorypractices and outcomes that do not meet their accreditation standards, so thatequivalency of the accreditation program is maintained.
____________________________________1A condition-level requirement pertains to the significant, comprehensive requirements of CLIA, as opposedto a standard-level requirement, which is more detailed, more specific. A condition-level deficiency is an inadequacy in the laboratory’s quality of services that adversely affects, or has the potential to adversely affect, the accuracy and reliability of patient test results.
111
OTHER CONGRESSIONAL REPORTS
The organization’s inspection findings are compared, case-by-case for eachlaboratory in the sample, to the CLIA validation survey findings at the condition level.If it is reasonable to conclude that one or more of those condition-level deficiencies waspresent in the laboratory’s operations at the time of the organization’s inspection, yetthe inspection results did not note them, the case is a disparity. When all of the cases ineach sample have been reviewed, the “rate of disparity” for each organization iscalculated by dividing the number of disparate cases by the total number of validationsurveys, in the manner prescribed by section 493.2 of the CLIA regulations.
Number of Validation Surveys Performed
As directed by the CLIA statute, the number of validation surveys should be sufficient to“allow a reasonable estimate of the performance” of each accreditation organization. Arepresentative sample of the more than 15,000 accredited laboratories received avalidation survey in 2002. Laboratories seek and relinquish accreditation on an ongoingbasis, so the number of laboratories accredited by an organization during any given yearfluctuates. Moreover, many laboratories are accredited by more than one organization.Each laboratory holding a Certificate of Accreditation, however, is subject to only onevalidation survey—for the organization it selected to maintain its CLIA certification,irrespective of the number of accreditations it attains.
Nationwide, fewer than 500 of the accredited laboratories used AABB, AOA, or ASHIaccreditation for CLIA purposes. Given these proportions, very few validation surveyswere performed in laboratories accredited by those organizations. The overwhelmingmajority of accredited laboratories in the CLIA program used their accreditation byCOLA, the College, or the Joint Commission, thus the sample sizes for theseorganizations were larger. The sample sizes are usually proportionate to eachorganization’s representation in the universe of accredited laboratories, however trueproportionality is not always possible due to the complexities of scheduling.
The number of validation surveys performed for each organization is specifiedbelow in the summary findings for the organization.
Results of the Validation Reviewsof Each Accreditation Organization
American Association of Blood Banks
Rate of disparity: No disparity
Approximately 220 laboratories used their AABB accreditation for CLIA purposes.Five validation surveys were conducted. No condition-level deficiencies were cited onany of the surveys, thus disparity was precluded.
112
OTHER CONGRESSIONAL REPORTS

American Osteopathic Association
Rate of disparity: No disparity
For CLIA purposes, approximately 50 laboratories used their AOA accreditation.Three validation surveys were conducted. This year, as in the previous years of CLIAvalidation review, disparity was precluded because no condition-level deficiencies werecited on any of the surveys.
American Society of Histocompatibility and Immunogenetics
Rate of disparity: No disparity
Approximately 130 laboratories used their ASHI accreditation for CLIA purposes.Five validation surveys were conducted. Condition-level compliance was found in all thevalidation surveys, thus disparity was precluded this year, as in the previous years ofCLIA validation review.
COLA
Rate of disparity: 1 percent
Validation surveys were conducted at 144 COLA-accredited laboratories. Eleven ofthe laboratories were cited with condition-level deficiencies. Comparable deficiencieswere not noted by COLA in nine out of the eleven laboratories cited with condition-leveldeficiencies.
Following is a listing of the laboratory identification number, location and condition-level deficiencies of the laboratories where COLA findings were disparate.
CLIA number Location CLIA Conditions
17D0452210 Kansas Proficiency Testing—Enrollment and Testing of Samples
28D0456083 Nebraska Personnel—Laboratory Director Personnel—Technical Consultant
College of American Pathologists
Rate of disparity: 7 percent
A total of 75 validation surveys were conducted at laboratories accredited by theCollege; however, two were removed from the pool: one for administrative reasons, andone because it was performed more than 90 days after the accreditation inspection.Among the remaining 73 laboratories, six were cited with condition-level deficiencies.Comparable deficiencies were noted by the College in only one of the six laboratoriescited with condition-level deficiencies.
Following is a listing of the CLIA identification number, location, and condition-leveldeficiencies of the laboratories where the College’s findings were disparate.
113
OTHER CONGRESSIONAL REPORTS

CLIA number Location CLIA Conditions
04D0467983 Arkansas Personnel—Technical Consultant, moderate complexity
04D0469292 Arkansas Quality Assurance
16D0384964 Iowa Proficiency Testing—Enrollment and Testing of SamplesProficiency Testing—Successful Participation
19D0464540 Louisiana Quality Control—Bacteriology Quality Control—General Immunology Quality Control—Routine Chemistry Quality Control—Endocrinology Quality Control—Toxicology Quality Control—Hematology Personnel—Laboratory Director, moderate complexityQuality Assurance
45D0940696 Texas Proficiency Testing—Successful Participation Personnel—Laboratory Director, moderate complexityQuality Assurance
Joint Commission on Accreditation of Healthcare Organizations
Rate of disparity: 8 percent
During this validation period, a total of 88 validation surveys were conducted atlaboratories accredited by the Joint Commission. One survey was removed from thepool for administrative reasons. Among the remaining 87 laboratories, eight were citedwith condition-level deficiencies. Comparable deficiencies were noted by the JointCommission in only one of the eight laboratories cited with condition-level deficiencies.
Following is a listing of the CLIA identification number, location and condition-leveldeficiencies of the laboratories where the Joint Commission’s findings were disparate.
CLIA number Location CLIA Conditions
05D0542002 California Quality Assurance
05D0552389 California Quality Assurance
19D0464915 Louisiana Quality Control—Routine Chemistry Personnel—Laboratory Director Quality Assurance
19D0649118 Louisiana Quality Control—Routine Chemistry Personnel—Laboratory Director Quality Assurance
19D0668410 Louisiana Quality Control—Hematology Personnel—Laboratory Director Quality Assurance
45D0506417 Texas Quality Assurance
52D0397129 Wisconsin PT Enrollment and Testing of Samples Quality Control—Hematology Personnel—Laboratory Director
114
OTHER CONGRESSIONAL REPORTS

Conclusion
The CMS has performed this validation review in order to evaluate and report toCongress on the performance of the six laboratory accreditation organizations approvedunder CLIA. The findings of the validation review for fiscal year 2002 indicate that all ofthe accreditation organizations performed at a level well below the 20 percent disparitythreshold that would trigger a deeming authority review. Moreover, the validationreview did not reveal widespread or systematic problems in accreditation processes thatcause the equivalency of any organization’s accreditation program to be questioned.
QUALITY IMPROVEMENTORGANIZATIONS (QIOs)Over the last several years, CMS has re-engineered the QIO program to better meet ourstrategic goal of improving the health status of Medicare beneficiaries. The QIOs stillperform quality assurance activities in accordance with their original mandate.However, the principal focus of the QIO program has evolved from a mix of utilizationreview, diagnosis related group (DRG) validation, and quality of care review to anexpanded approach that features emphasis on quality improvement projects through theHealth Care Quality Improvement Program (HCQIP). For the seventh round of QIOcontracts, now in the second year of a 3-year cycle, focused strategic efforts are alsobeing directed at Medicare program integrity via the Hospital Payment MonitoringProgram (HPMP) in compliance with the Balanced Budget Act.
The HCQIP relies on provider-based quality improvement, a data driven externalmonitoring system based on quality indicators, and sharing of comparative data andbest practices with providers to stimulate improvement. The QIOs conduct a widevariety of improvement projects on important clinical and non-clinical topics that havethe potential to improve care provided to many Medicare beneficiaries. Such projectsvary in size depending on the study purpose and design. For example, there are nationalprojects featuring clinical topic areas that CMS has determined to have a high impact onMedicare beneficiaries; where the process measures are linked to outcomes; where roomfor improvement exists; and where QIOs have experience with the topic. Similarly,individual QIOs also design and structure local projects whereby they workcollaboratively with specific providers and managed care plans in their areas,particularly with respect to disadvantaged and/or under-served beneficiary groups. TheQIOs also conduct pilot projects in alternative provider settings.
Consistent with our strategic goal to promote the fiscal integrity of CMS programs,the HPMP activities are part of the Comprehensive Plan for Program Integrity to ensureMedicare hospital inpatient claims are billed and paid appropriately. Using CMS-
115
OTHER CONGRESSIONAL REPORTS

116
OTHER CONGRESSIONAL REPORTS
developed baseline data, each QIO is required to identify the extent of payment errorsoccurring in its area and implement appropriate educational interventions aimed atchanging provider behavior and decreasing the observed payment error rate.
Under Federal budget rules, the QIO program is defined as mandatory rather thandiscretionary because QIO costs are financed directly from the Medicare trust funds andare not subject to the annual appropriations process. The QIO outlays in FY 2003 totaled$350.4 million, which compares with $354.0 million spent in FY 2002.
In FY 2003, CMS administered 53 QIO performance-based contracts, one per State,the District of Columbia, the Virgin Islands, and Puerto Rico. Program compliance isensured via performance-based evaluation measures for both project results and programintegrity efforts, as well as use of inter-rater reliability measures and InternationalOrganization for Standardization (ISO) 9000-type documentation of QIO processes.

A
Accrual Accounting: A basis of accounting that recognizes costs when incurred andrevenues when earned and includes the effect of accounts receivable and accountspayable when determining annual net income.
Actuarial Soundness: A measure of the adequacy of Hospital Insurance andSupplementary Medical Insurance financing as determined by the difference betweentrust fund assets and liabilities for specified periods.
Administrative Costs: General term that refers to Medicare and Medicaid administrativecosts, as well as CMS administrative costs. Medicare administrative costs are comprisedof the Medicare related outlays and non-CMS administrative outlays. Medicaidadministrative costs refer to the Federal share of the States’ expenditures foradministration of the Medicaid program. The CMS administrative costs are the costs ofoperating CMS (e.g., salaries and expenses, facilities, equipment, rent and utilities).These costs are accounted for in the Program Management account.
B
Balanced Budget Act of 1997 (BBA): Major provisions provided for the State Children’sHealth Insurance Program, Medicare+Choice, and expansion of preventive benefits.
Beneficiary: A person entitled under the law to receive Medicare or Medicaid benefits(also referred to as an enrollee).
Benefit Payments: Funds outlayed or expenses accrued for services delivered tobeneficiaries.
117
GLOSSARY
GlossaryGlossary

C
Carrier: A private business, typically an insurance company, that contracts with CMS toreceive, review, and pay physician and supplier claims.
Cash Basis Accounting: A basis of accounting that tracks outlays or expendituresduring the current period regardless of the fiscal year the service was provided or theexpenditure was incurred.
Clinical Laboratory Improvement Amendments of 1988 (CLIA): Requires anylaboratory that performs testing on specimens derived from humans to meet therequirements established by the Department of Health and Human Services and have ineffect an applicable certificate.
Cost-Based Health Maintenance Organization (HMO)/Competitive Medical Plan (CMP):A type of managed care organization that will pay for all of the enrollees/members’medical care costs in return for a monthly premium, plus any applicable deductible orco-payment. The HMO will pay for all hospital costs (generally referred to as Part A) andphysician costs (generally referred to as Part B) that it has arranged for and ordered.Like a health care prepayment plan (HCPP), except for out-of-area emergency services, ifa Medicare member/enrollee chooses to obtain services that have not been arranged forby the HMO, he/she is liable for any applicable deductible and co-insurance amounts,with the balance to be paid by the regional Medicare intermediary and/or carrier.
D
Demonstrations: Projects and contracts that CMS has signed with various health careorganizations. These contracts allow CMS to test various or specific attributes such aspayment methodologies, preventive care, and social care, and to determine if suchprojects/pilots should be continued or expanded to meet the health care needs of theNation. Demonstrations are used to evaluate the effects and impact of various healthcare initiatives and the cost implications to the public.
Discretionary Spending: Outlays of funds subject to the Federal appropriations process.
Disproportionate Share Hospital (DSH): A hospital with a disproportionately largeshare of low-income patients. Under Medicaid, States augment payment to thesehospitals. Medicare inpatient hospital payments are also adjusted for this added burden.
Durable Medical Equipment (DME): Purchased or rented items such as hospital beds,wheelchairs, or oxygen equipment used in a patient’s home.
Durable Medical Equipment Regional Carrier (DMERC): A company that contracts toprocess Medicare claims for Durable Medical Equipment (DME).
118
GLOSSARY

E
Expenditure: Expenditure refers to budgeted funds actually spent. When used in thediscussion of the Medicaid program, expenditures refer to funds actually spent asreported by the States. This term is used interchangeably with Outlays.
Expense: An outlay or an accrued liability for services incurred in the current period.
F
Federal General Revenues: Federal tax revenues (principally individual and businessincome taxes) not identified for a particular use.
Federal Insurance Contribution Act (FICA) Payroll Tax: Medicare’s share of FICA isused to fund the HI trust fund. Employers and employees each contribute 1.45 percentof taxable wages, with no compensation limits, to the HI trust fund.
Federal Medical Assistance Percentage (FMAP): The portion of the Medicaid programthat is paid by the Federal government.
Federal Managers’ Financial Integrity Act (FMFIA): A program that identifiesmanagement inefficiencies and areas vulnerable to fraud and abuse so that suchweaknesses can be corrected with improved internal controls.
H
Health Care Prepayment Plan (HCPP): A type of managed care organization. In returnfor a monthly premium, plus any applicable deductible or co-payment, all or most of anindividual’s physician services will be provided by the HCPP. The HCPP will pay for allservices it has arranged for (and any emergency services) whether provided by its ownphysicians or its contracted network of physicians. If a member enrolled in an HCPPchooses to receive services that have not been arranged for by the HCPP, he/she isliable for any applicable Medicare deductible and/or coinsurance amounts, and anybalance would be paid by the regional Medicare carrier.Health Insurance Portability and Accountability Act of 1996 (HIPAA): Majorprovisions include portability provisions for group and individual health insurance,establishes the Medicare Integrity Program, and provides for standardization of healthdata and privacy of health records.
Hospital Insurance (HI): The part of Medicare that pays hospital and other institutionalprovider benefit claims, also referred to as Part A.
119
GLOSSARY

I
Information Technology (IT): The term commonly applied to maintenance of datathrough computer systems.
Intermediary: A private business—typically an insurance company—that contracts withCMS to process hospital and other institutional provider benefit claims.
Internal Controls: Management systems and policies for reasonably documenting,monitoring, and correcting operational processes to prevent and detect waste and toensure proper payment. Also known as management controls.
M
Mandatory Spending: Outlays for entitlement programs such as Medicaid andMedicare benefits.
Material Weakness: A serious flaw in management or internal controls requiring high-priority corrective action.
Medicare Current Beneficiary Survey (MCBS): A comprehensive source of informationon the health, health care, and socioeconomic and demographic characteristics of aged,disabled, and institutional Medicare beneficiaries.
Medicare Contractor: A collective term for the carriers and intermediaries who processMedicare claims.
Medicare+Choice: A provision in the BBA that restructures CMS authority to contractwith a variety of managed care entities, including health maintenance organizations(HMO) and Competitive Medical Plans (CMP), both of which were previously allowedto participate in Medicare, as well as preferred provider organizations (PPO) andpreferred supplier organizations (PSO), religious fraternal benefit society plans, privatefee-for-service-plans, and medical saving accounts (MSAs), for which the BBAauthorizes a special demonstration for up to 390,000 beneficiaries.
Medicare Integrity Program (MIP): A provision in HIPAA that sets up a revolving fundto support the CMS program integrity program.
Medicare Trust Funds: Treasury accounts established by the Social Security Act for thereceipt of revenues, maintenance of reserves, and disbursement of payments for the HIand SMI programs.
Medical Review/Utilization Review (MR/UR): Contractor reviews of Medicare claimsto ensure that the service was necessary and appropriate.
120
GLOSSARY

Medicare Secondary Payer (MSP): A statutory requirement that private insurers whoprovide general health insurance coverage to Medicare beneficiaries must paybeneficiary claims as primary payers.
O
Obligation: Budgeted funds committed to be spent.
Outlay: Budgeted funds actually spent. When used in the discussion of the Medicaidprogram, outlays refer to amounts advanced to the States for Medicaid benefits.
P
Part A: The part of Medicare that pays hospital and other institutional provider benefitclaims, also referred to as Medicare Hospital Insurance or “HI.”
Part B: The part of Medicare that pays physician and supplier claims, also referred to asMedicare Supplementary Medical Insurance or “SMI.”
Payment Safeguards: Activities to prevent and recover inappropriate Medicare benefitpayments, including MSP, MR/UR, provider audits, and fraud and abuse detection.
Program Management: The CMS operational account. Program Management suppliesCMS with the resources to administer Medicare, the Federal portion of Medicaid, andother CMS responsibilities. The components of Program Management are: Medicarecontractors, survey and certification, research, and administrative costs.
Provider: A health care professional or organization that provides medical services.
Q
Quality Improvement Organizations: Formerly known as Peer Review Organizations(PROs), QIOs monitor the quality of care provided to Medicare beneficiaries to ensurethat health care services are medically necessary, appropriate, provided in a propersetting, and is of acceptable quality.
R
Recipient: An individual covered by the Medicaid program (also referred to as abeneficiary).
121
GLOSSARY

122
GLOSSARY
Risk-Based Health Maintenance Organization (HMO)/Competitive Medical Plan (CMP):A type of managed care organization. After any applicable deductible or co-payment, allof an enrollee/member’s medical care costs are paid for in return for a monthlypremium. However, due to the ”lock-in” provision, all of the enrollee/member’s services (except for out-of-area emergency services) must be arranged for by the riskHMO. Should the Medicare enrollee/member choose to obtain service not arranged for by the plan, he/she will be liable for the costs. Neither the HMO nor the Medicareprogram will pay for services from providers that are not part of the HMO’s health caresystem/network.
Revenue: The recognition of income earned and the use of appropriated capital fromthe rendering of services in the current period.
S
Self Employment Contribution Act (SECA) Payroll Tax: Medicare’s share of SECA isused to fund the HI trust fund. Self-employed individuals contribute 2.9 percent oftaxable annual net income, with no limitation.
State Certification: Inspections of Medicare provider facilities to ensure compliancewith Federal health, safety, and program standards.
State Children’s Health Insurance Program (SCHIP) (also known as Title XXI):A provision of the BBA that provides federal funding through CMS to States so that theycan expand child health assistance to uninsured, low-income children.
Supplementary Medical Insurance (SMI): The part of Medicare that pays physicianand supplier claims, also referred to as Part B.
T
Ticket to Work and Work Incentives Improvement Act of 1999: This legislationamends the Social Security Act and increases beneficiary choice in obtainingrehabilitation and vocational services, removes barriers that require people withdisabilities to choose between health care coverage and work, and assures that disabledAmericans have the opportunity to participate in the workforce.

Timothy B. HillChief Financial Officer and Director,Office of Financial Management
Deborah A. Taylor, CPADeputy Director,Office of Financial Management
Maria Montilla, CPAActing Deputy Director, Accounting Management Group andDirector, Division of Financial Oversight
Dennis CzulewiczDirector,Division of Accounting Operations
For additional information on the following, please call or email:
Financial ReportJulie Frank, CPA(410) [email protected]
Paul Konka(410) [email protected]
Financial Statement PreparationMargaret Bone(410) [email protected]
Robert Fox, CPA(410) [email protected]
Jeff Chaney, CPAActing Deputy Chief Financial Officer and Acting Director,Accounting Management Group
Richard FosterChief Actuary
Marvin Washington, CPADirector, Division of Financial Reporting and Debt Referral
Kurt PleinesDirector,Division of Accounting Systems
Karen FediDirector,Division of Premium Billingand Collections
Healthcare Integrated GeneralLedger Accounting System ProjectJohn Moeller(410) [email protected]
Performance MeasuresHarriet Rubinson(410) [email protected]
More information relating to CMS is available at www.cms.hhs.gov.
The CMS welcomes comments andsuggestions on both the content andpresentation of this report. Please sendthem to Paul Konka by email orCMS, Mail Stop C3-13-08, 7500 SecurityBlvd., Baltimore, MD 21244-1850.
123
CMS KEY FINANCIALMANAGEMENT OFFICIALS

U.S. Department of Health and Human ServicesTommy G. Thompson, Secretary
Centers for Medicare & Medicaid ServicesThomas A. Scully, Administrator
The Chief Financial Officers (CFO) Act of 1990 (P.L. 101-576) marks a major effortto improve U.S. Government financial management and accountability. In pursuitof this goal, the Act instituted a new Federal financial management structure and
process modeled on private sector practices. It also established in all major agencies theposition of Chief Financial Officer with responsibilities including annual publication offinancial statements and an accompanying report. The form and content of thisFinancial Report follows guidance provided by the Department of Health and HumanServices, the Office of Management and Budget, and the General Accounting Office. Itreflects the Centers for Medicare & Medicaid Services’s support of the spirit andrequirements of the CFO Act and our continuing commitment to improve agencyfinancial reporting.
U.S. Department of Health and Human ServicesCenters for Medicare & Medicaid Services7500 Security BoulevardBaltimore, Maryland 21244-1850

U.S. Department of Health & Human ServicesCenters for Medicare & Medicaid Services
7500 Security BoulevardBaltimore, MD 21244-1850
www.cms.hhs.govwww.medicare.gov