CMIA CONFERENCE ON 14 TH SEP, 2013 AT AURANGABAD ASHOK PENDSE, TBIA.
26
CMIA CONFERENCE ON 14 TH SEP, 2013 AT AURANGABAD ASHOK PENDSE, TBIA
-
Upload
arabella-park -
Category
Documents
-
view
217 -
download
2
Transcript of CMIA CONFERENCE ON 14 TH SEP, 2013 AT AURANGABAD ASHOK PENDSE, TBIA.

CMIA CONFERENCE ON 14TH SEP, 2013 AT
AURANGABAD
ASHOK PENDSE,TBIA

CHALLENGES BEFORE INDUSTRY IN RESPECT OF
ELECTRICITY TARIFF

TARIFF
When the electricity tariff is substantial with respect to cost of production it makes large impact.
Eg:- Metal processing, Plastic, Ice, The Case of Ice factory The Case of Dubai
TARIFF COMPARISON NOV’12
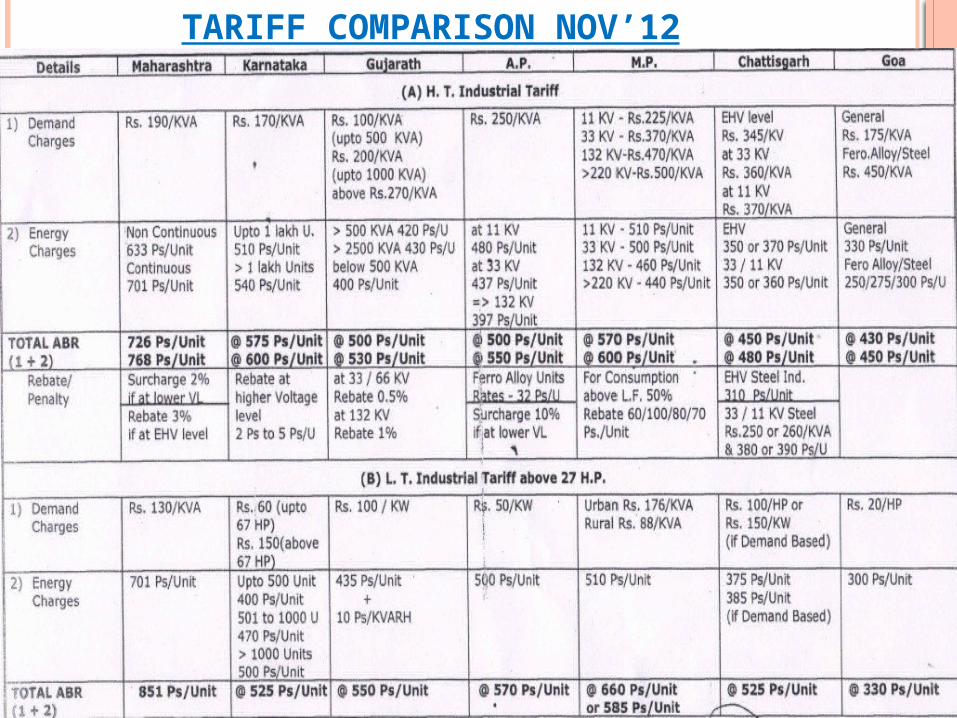
INDUSTRIAL CONSUMPTION OF MSEDCL(MU) FOR 13-14
INDUSTRIAL CONSUMPTION
HT INDUSTRY (35%)LT INDUSTRY (5%)OTHER (60%)

INDUSTRIAL CONSUMPTION OF MSEDCL(MU) FOR 14-15
INDUSTRIAL CONSUMPTION
HT INDUSTRY (34.5%)LT INDUSTRY (5.4%)OTHERS (60.1%)

INDUSTRIAL CONSUMPTION OF MSEDCL(MU) FOR 15-16
INDUSTRIAL CONSUMPTION
HT INDUSTRY (35.2%)LT INDUSTRY (5.2%)OTHERS (59.6%)

TARIFF As it can be seen almost 40% of consumption
comes from industry, which contributes to largest chunk of Rs. 9000/- crores cross subsidy and hence,
MSEDCL and GOM should be concerned about health of industry.

WHY THE TARIFF IS HIGH?
YEAR 13-14 14-15 15-16
POWER PURCHASE COST (Rs. Crores)
41078 53329 62325
Average Revenue requirement (Rs. Crores)
57839 64705 72761
Power purchase cost (%)
71% 82% 85%
Average cost of supply (Rs/Unit)
6.34 6.57 6.84

POWER PURCHASE SCENE
13-14 14-15 15-16
MU Rs/Unit MU Rs/Unit MU Rs/Unit
MSPGCL 47675 4.11 56370 4.49 65278 4.70
NTPC 22882 2.56 24728 2.83 26424 2.98
NPCIL 5070 2.67 5070 2.81 5070 2.95
RGPPL 3119 4.43 1723 7.51 1723 7.51
JSW 2048 3.70 2048 3.95 2048 4.24
MUNDRA 5480 2.78 5480 2.87 5480 2.98
ADANI 8394 2.83 17390 3.01 5473 3.02
INDIA BULLS
2736 3.26 8108 3.92 8108 4.00
CAPTIVE 1600 3.58 1600 3.50 1600 3.50
TRADERS 2197 3.65 - 3.92 - 4.10

POWER PURCHASE SCENE
YEAR 13-14 14-15 15-16
MSPGCL 42% 41% 43%
NTPC + NPCIL 25% 22% 21%
JSW + MUNDRA + ADANI + INDIA BULLS + CPP +
TRADERS
20% 26% 23%
OTHERS 13% 11% 13%
POWER PURCHASE SCENE
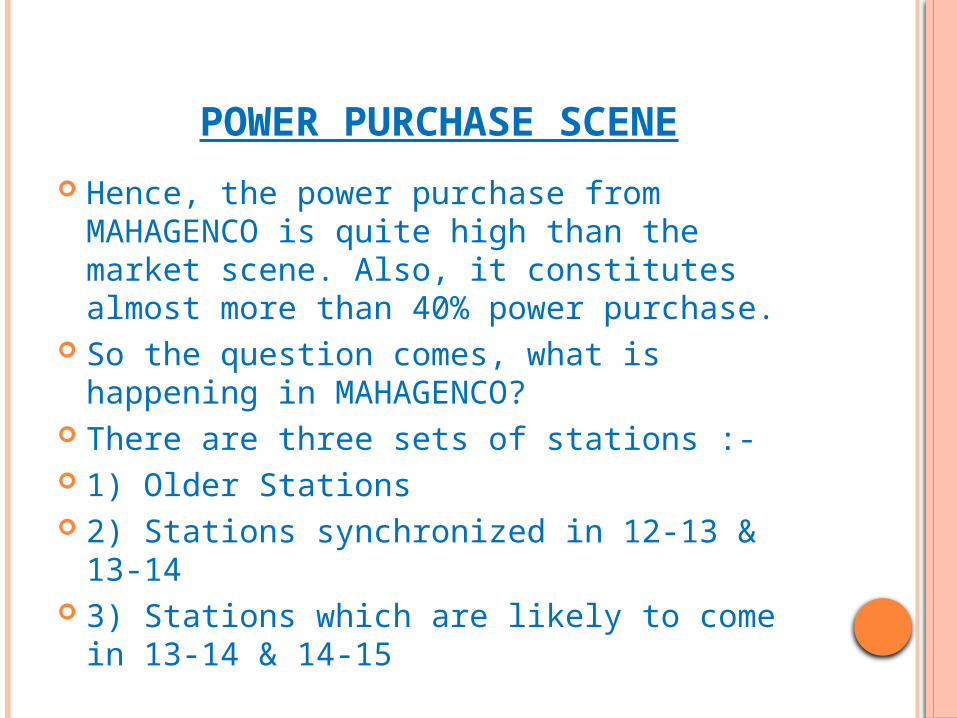
Hence, the power purchase from MAHAGENCO is quite high than the market scene. Also, it constitutes almost more than 40% power purchase.
So the question comes, what is happening in MAHAGENCO?
There are three sets of stations :- 1) Older Stations 2) Stations synchronized in 12-13 & 13-14 3) Stations which are likely to come in 13-14
& 14-15

OLDER STATIONS
YEAR 13-14
Net Gen. (MU’s)
ARR (Rs.Crores)
Bhusawal 2498 863
Chandrapur 13631 3611
Nasik 3825 1756
Koradi 3173 1418
Parli 2362 968
Khaperkheda
4818 1587
Total 30607 10203 Rs. 3.33

RECENT STATIONS
13-14
Net Gen. (MU’s)
ARR (Rs. Crore)
Paras 3&4 3171 1192
Parli 6&7 2352 1217
Khaperkheda 5 3499 1572
Total 9022 3981 Rs.4.44/ Unit

UPCOMING STATIONS
13-14 & 14-15 Rs/Unit
Bhusawal 4 500MW 4.26/-
Bhusawal 5 500MW 4.28/-
Chandrapur 8 500MW 5.09/-
Parli 8 250MW 4.71/-
Koradi 8 660MW 5.22/-
POWER PURCHASE SCENE
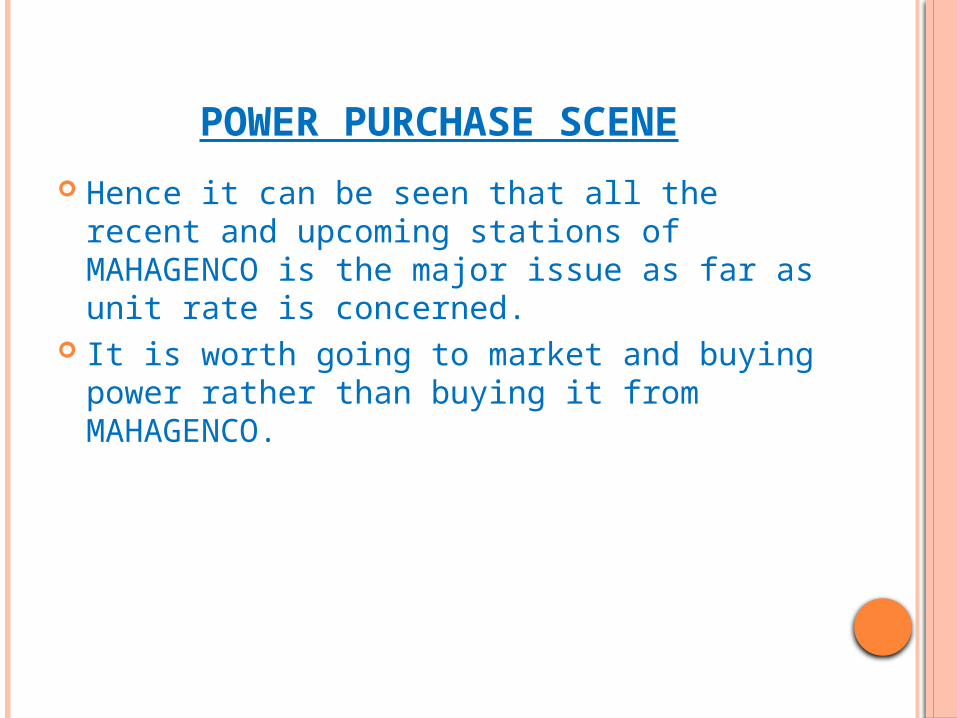
Hence it can be seen that all the recent and upcoming stations of MAHAGENCO is the major issue as far as unit rate is concerned.
It is worth going to market and buying power rather than buying it from MAHAGENCO.

CAPITAL EXPENDITURE OF MSEDCL
For feeder separation Rs.2000 Crores already spent. Hence the demand has been controlled. It virtually means load shedding being done through agricultural pumps.
So far about Rs.3500 Crores have been spent. Whereas the total outlet is about Rs.14000 Crores.
The main objectives of Capex are :- 1) Improvement in the quality of supply. 2) Reduction in loss. 3) Catering to increased demands to existing
customers. 4) Meeting the demand of newer customers.

PASSIVE ROLE
Stay with MSEDCL , and pursue reduction and minimum increase in the
tariff for present and future years. To do this :- A) Participate in public hearing and specific
hearing of not only MSEDCL but also generation. B) With the help of media, newspapers, forums, etc. bring to the notice of common man
regarding high electricity tariff. C) Bring to the notice of the govt. the unviable
tariff of industry as compared to other states. D) Make efforts with MERC to bring down the
open access limit from 1MW to 100 KVA.

ACTIVE ROLE
Go away from MSEDCL, The two choices : A) Captive power plant. B) Open Access. There are four components which need to be
addressed in both the cases: 1) Power purchase cost 2) Wheeling charges 3) System Loss 4) Cross subsidy surcharge In case of captive CSS is not applicable.

CAPTIVE POWER PLANT “Captive generating plant” means a power plant
set up by any person to generate electricity primarily for his own use and includes a power plant set up by any co-operative society or association of persons for generating electricity primarily for use of members of such cooperative society or association of person
13 “company“ means a company formed and registered under the Companies Act, 1956 and includes anybody corporate under a Central, State or Provincial Act;
(49) “person” shall include any company or body corporate or association or body of individuals, whether incorporated or not, or artificial juridical person

CAPTIVE POWER PLANT i) not less than twenty six percent of the ownership is held
by the captive user(s), and (ii) not less than fifty one percent of the aggregate
electricity generated in such plant, determined on an annual basis, is consumed for the captive use:
Provided that in case of power plant set up by registered cooperative society, the conditions mentioned under paragraphs at (i) and (ii) above shall be satisfied collectively by the members of the cooperative society: Provided further that in case of association of persons, the captive user(s) shall hold not less than twenty six percent of the ownership of the plant in aggregate and such captive user(s) shall consume not less than fifty one percent of the electricity generated, determined on an annual basis, in proportion to their shares in ownership of the power plant within a variation not exceeding ten percent

CAPTIVE POWER PLANT
Three points emerge:1) All put together 26% equity minimum
2) They must consume minimum 51% generation
3) The consumption should be proportional to equity, in a financial year, with (+/-10%) variation allowed.
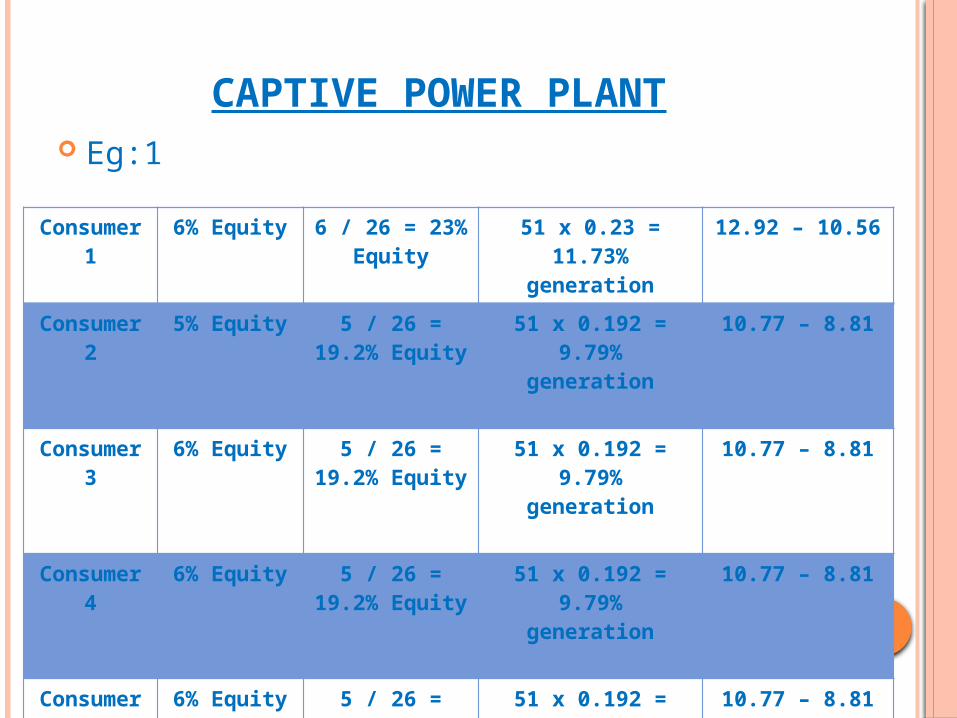
CAPTIVE POWER PLANT Eg:1
Consumer 1
6% Equity 6 / 26 = 23% Equity
51 x 0.23 = 11.73%
generation
12.92 – 10.56
Consumer 2
5% Equity 5 / 26 = 19.2% Equity
51 x 0.192 = 9.79%
generation
10.77 – 8.81
Consumer 3
6% Equity 5 / 26 = 19.2% Equity
51 x 0.192 = 9.79%
generation
10.77 – 8.81
Consumer 4
6% Equity 5 / 26 = 19.2% Equity
51 x 0.192 = 9.79%
generation
10.77 – 8.81
Consumer 5
6% Equity 5 / 26 = 19.2% Equity
51 x 0.192 = 9.79%
generation
10.77 – 8.81
26% Equity
%Equity distribution
Generation distribution
Variation allowed
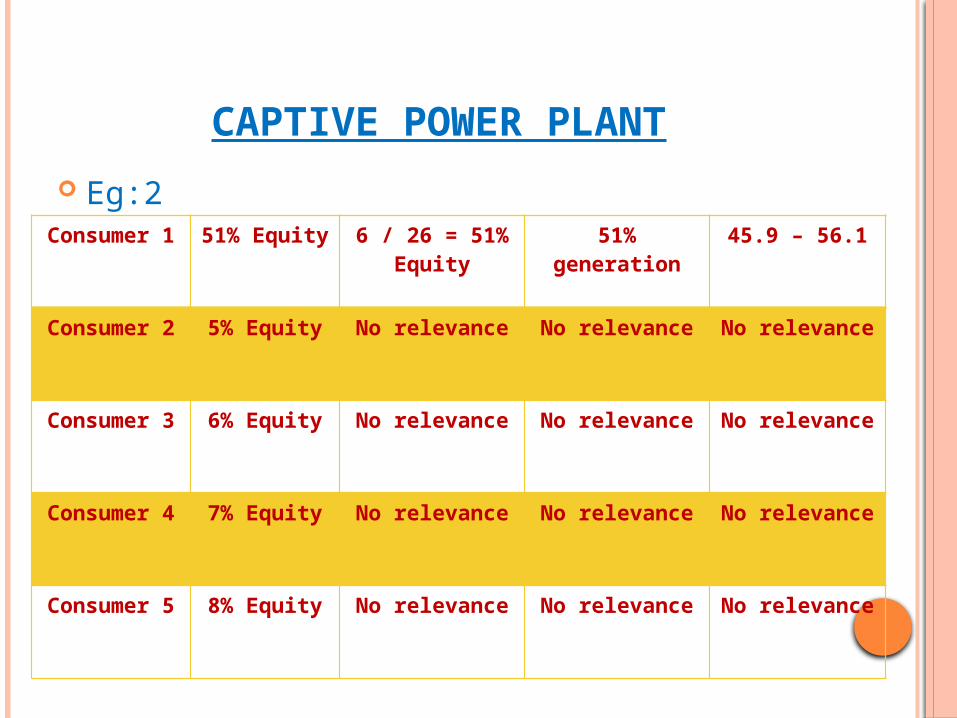
CAPTIVE POWER PLANT
Eg:2Consumer
151%
Equity6 / 26 = 51%
Equity51%
generation45.9 – 56.1
Consumer 2
5% Equity No relevance No relevance No relevance
Consumer 3
6% Equity No relevance No relevance No relevance
Consumer 4
7% Equity No relevance No relevance No relevance
Consumer 5
8% Equity No relevance No relevance No relevance

TO CONCLUDE
If you stay with MSEDCL then go to passive role to control the cost.
If you go away from MSEDCL do active role, one of them is captive power plant.