CMHS National Evaluation Data Profile Report Cuyahoga Tapestry System of Care Cleveland, Ohio...
51
CMHS National Evaluation CMHS National Evaluation Data Profile Report Data Profile Report Cuyahoga Tapestry System of Care Cuyahoga Tapestry System of Care Cleveland, Ohio Cleveland, Ohio Prepared by the National Evaluation Team at ICF Macro, May 2009 1
-
Upload
wilfrid-franklin -
Category
Documents
-
view
214 -
download
0
Transcript of CMHS National Evaluation Data Profile Report Cuyahoga Tapestry System of Care Cleveland, Ohio...

CMHS National EvaluationCMHS National EvaluationData Profile ReportData Profile Report
Cuyahoga Tapestry System of CareCuyahoga Tapestry System of CareCleveland, Ohio Cleveland, Ohio
Prepared by the National Evaluation Team at ICF Macro, May 2009
1
Data Profile Reports April 2009 Data are from the CMHS National Evaluation of the Comprehensive Community Mental Health Services for Children and Their Families Program. This report is based on data downloaded April 13, 2009.
2
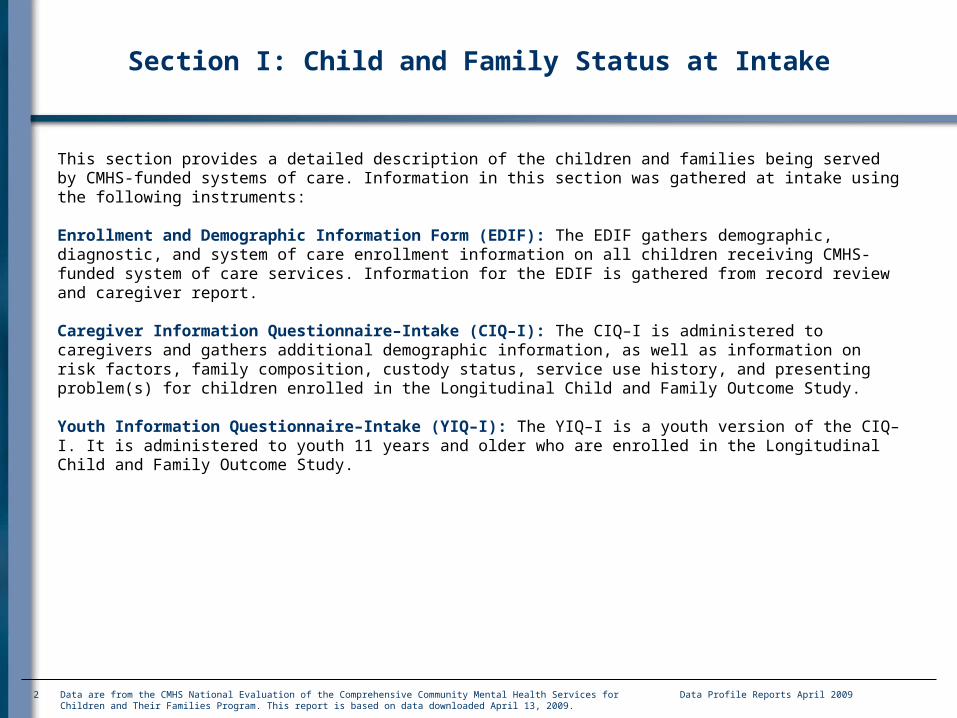
Section I: Child and Family Status at Intake
This section provides a detailed description of the children and families being served by CMHS-funded systems of care. Information in this section was gathered at intake using the following instruments:
Enrollment and Demographic Information Form (EDIF): The EDIF gathers demographic, diagnostic, and system of care enrollment information on all children receiving CMHS-funded system of care services. Information for the EDIF is gathered from record review and caregiver report.
Caregiver Information Questionnaire–Intake (CIQ–I): The CIQ–I is administered to caregivers and gathers additional demographic information, as well as information on risk factors, family composition, custody status, service use history, and presenting problem(s) for children enrolled in the Longitudinal Child and Family Outcome Study.
Youth Information Questionnaire–Intake (YIQ–I): The YIQ–I is a youth version of the CIQ–I. It is administered to youth 11 years and older who are enrolled in the Longitudinal Child and Family Outcome Study.
Data Profile Reports April 2009 Data are from the CMHS National Evaluation of the Comprehensive Community Mental Health Services for Children and Their Families Program. This report is based on data downloaded April 13, 2009.
3
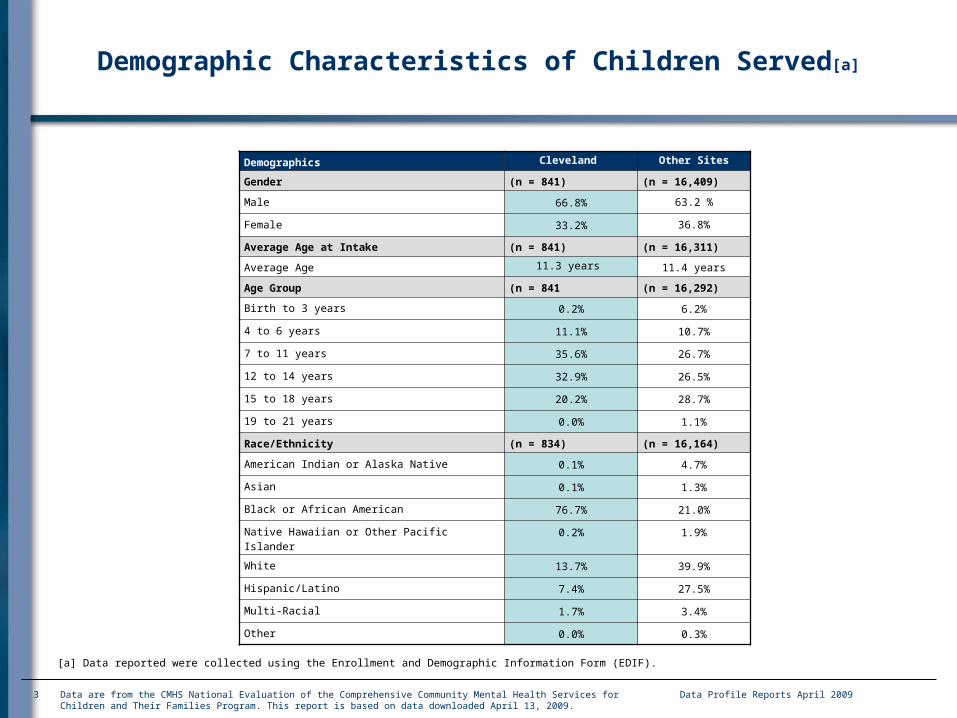
Demographic Characteristics of Children Served[a]
[a] Data reported were collected using the Enrollment and Demographic Information Form (EDIF).
Demographics Cleveland Other Sites
Gender (n = 841) (n = 16,409)
Male 66.8% 63.2 %
Female 33.2% 36.8%
Average Age at Intake (n = 841) (n = 16,311)
Average Age 11.3 years 11.4 years
Age Group (n = 841 (n = 16,292)
Birth to 3 years 0.2% 6.2%
4 to 6 years 11.1% 10.7%
7 to 11 years 35.6% 26.7%
12 to 14 years 32.9% 26.5%
15 to 18 years 20.2% 28.7%
19 to 21 years 0.0% 1.1%
Race/Ethnicity (n = 834) (n = 16,164)
American Indian or Alaska Native 0.1% 4.7%
Asian 0.1% 1.3%
Black or African American 76.7% 21.0%
Native Hawaiian or Other Pacific Islander 0.2% 1.9%
White 13.7% 39.9%
Hispanic/Latino 7.4% 27.5%
Multi-Racial 1.7% 3.4%
Other 0.0% 0.3%

Data Profile Reports April 2009 Data are from the CMHS National Evaluation of the Comprehensive Community Mental Health Services for Children and Their Families Program. This report is based on data downloaded April 13, 2009.
4
DSM–IV Axis I and Axis II Diagnoses[a]
Diagnosis[b] Cleveland(n = 833)
Other Sites(n = 13,074)
Attention-Deficit/Hyperactivity Disorders 53.3% 28.6%
Mood Disorders 40.8% 33.1%
Oppositional Defiant Disorder 25.7% 22.4%
PTSD and Acute Stress Disorder 10.6% 8.4%
Adjustment Disorders 8.4% 14.3%
Disruptive Behavior Disorder 6.6% 6.5%
Conduct Disorders 6.0% 6.4%
Other 5.0% 11.0%
Anxiety Disorders 5.0% 6.8%
Mental Retardation 4.1% 2.3%
V code[c] 4.0% 7.8%
Impulse Control Disorders 3.2% 2.6%
Pervasive Developmental Disorders 2.4% 2.6%
Learning, Motor Skills, and Communication Disorders 2.4% 3.4%
Schizophrenia and Other Psychotic Disorders 1.8% 2.3%
Substance Use Disorders[d] 1.0% 5.7%
Personality Disorders 0.4% 1.0%
Substance Induced Disorders 0.0% 0.2%[a] Data reported were collected using the Enrollment and Demographic Information Form (EDIF).[b] Because youth may have more than one diagnosis, percentages for diagnoses may sum to more than 100%.[c] V Code refers to Relational Problems, Problems Related to Abuse or Neglect, and additional conditions. Percentage excludes V71.09 (No Axis I or II diagnosis).[d] Substance Use Disorders include caffeine intoxication.
Data Profile Reports April 2009 Data are from the CMHS National Evaluation of the Comprehensive Community Mental Health Services for Children and Their Families Program. This report is based on data downloaded April 13, 2009.
5
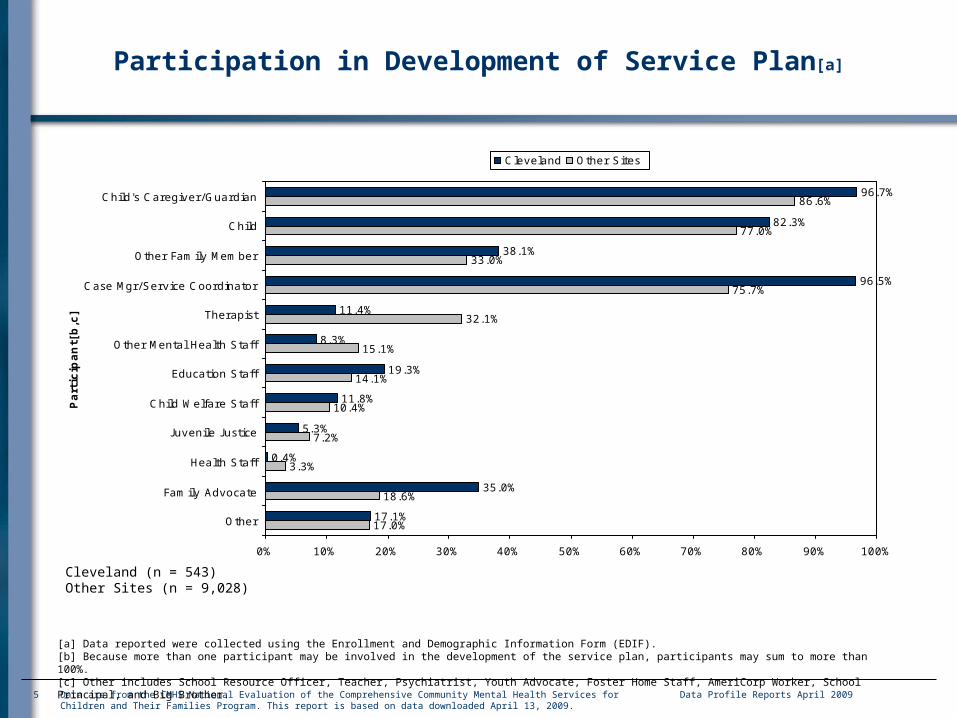
Participation in Development of Service Plan[a]
96.7%
82.3%
38.1%
96.5%
11.4%
8.3%
19.3%
11.8%
5.3%
0.4%
35.0%
17.1%
86.6%
77.0%
33.0%
75.7%
32.1%
15.1%
14.1%
10.4%
7.2%
3.3%
18.6%
17.0%
0% 10% 20% 30% 40% 50% 60% 70% 80% 90% 100%
Child's Caregiver/Guardian
Child
Other Family Member
Case Mgr/Service Coordinator
Therapist
Other Mental Health Staff
Education Staff
Child Welfare Staff
Juvenile J ustice
Health Staff
Family Advocate
Other
Part
icip
an
t[b
,c]
Cleveland Other Sites
Cleveland (n = 543)Other Sites (n = 9,028)
[a] Data reported were collected using the Enrollment and Demographic Information Form (EDIF).[b] Because more than one participant may be involved in the development of the service plan, participants may sum to more than 100%.[c] Other includes School Resource Officer, Teacher, Psychiatrist, Youth Advocate, Foster Home Staff, AmeriCorp Worker, School Principal, and Big Brother.

Data Profile Reports April 2009 Data are from the CMHS National Evaluation of the Comprehensive Community Mental Health Services for Children and Their Families Program. This report is based on data downloaded April 13, 2009.
6
Presenting Problems[a] Reported ‒‒ Record Review
Cleveland (n = 840)Other Sites (n = 15,617)
[a] Data reported were collected using the Enrollment and Demographic Information Form (EDIF) and the Youth Information Questionnaire (YIQ).[b] Because youth may present with more than one problem, percentages may sum to more than 100%.
13.8%
34.6%
18.6%
60.6%
76.7%
5.0%
14.2%
3.6%
2.4%
4.4%
15.4%
73.9%
0.6%
3.7%
16.7%
36.0%
28.8%
36.4%
56.4%
10.8%
34.1%
5.4%
4.6%
6.0%
13.0%
29.6%
5.0%
13.5%
0% 10% 20% 30% 40% 50% 60% 70% 80% 90% 100%
Suicidal I deation/Self-I njury
Depression
Anxiety
Hyperactivity and Attention
Conduct/Delinquency
Substance Use
Adjustment
Psychotic Behaviors
Pervasive Developmental Disability
Specific Developmental Disability
Learning Disability
School Performance
Eating Disorder
Other
Pre
sen
tin
g P
rob
lem
s[b
]
Cleveland Other Sites

Data Profile Reports April 2009 Data are from the CMHS National Evaluation of the Comprehensive Community Mental Health Services for Children and Their Families Program. This report is based on data downloaded April 13, 2009.
7
Presenting Problems[a] Reported ‒‒ Youth Self-Report
7.9%
18.8%
5.5%
28.5%
53.3%
1.2%
15.8%
0.6%
2.4%
0.0%
4.8%
10.9%
0.6%
11.5%
14.4%
30.1%
13.8%
17.2%
52.6%
11.0%
13.3%
3.5%
1.3%
0.7%
7.4%
19.1%
0.8%
12.2%
0% 10% 20% 30% 40% 50% 60% 70% 80% 90% 100%
Suicidal I deation/Self-I njury
Depression
Anxiety
Hyperactivity and Attention
Conduct/Delinquency
Substance Use
Adjustment
Psychotic Behaviors
Pervasive Developmental Disability
Specific Developmental Disability
Learning Disability
School Performance
Eating Disorder
Other
Pre
sen
tin
g P
rob
lem
s[b
]
Cleveland Other Sites
Cleveland (n = 165)Other Sites (n = 2,229)
[a] Data reported were collected using the Enrollment and Demographic Information Form (EDIF) and the Youth Information Questionnaire (YIQ).[b] Because youth may present with more than one problem, percentages may sum to more than 100%.
Data Profile Reports April 2009 Data are from the CMHS National Evaluation of the Comprehensive Community Mental Health Services for Children and Their Families Program. This report is based on data downloaded April 13, 2009.
8
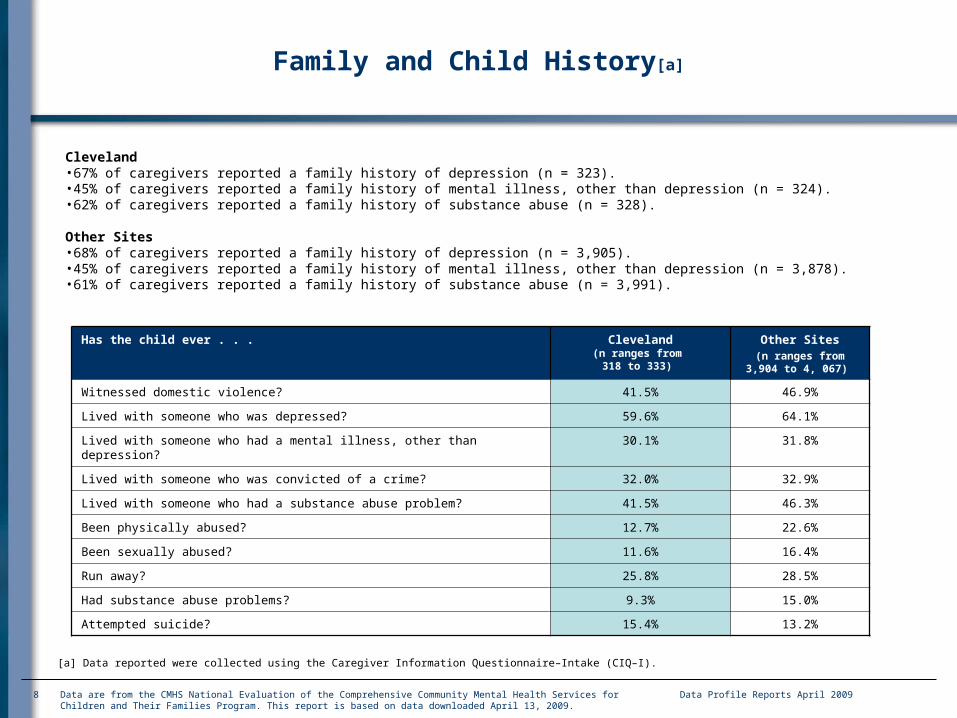
Family and Child History[a]
Has the child ever . . . Cleveland(n ranges from
318 to 333)
Other Sites(n ranges from
3,904 to 4, 067)
Witnessed domestic violence? 41.5% 46.9%
Lived with someone who was depressed? 59.6% 64.1%
Lived with someone who had a mental illness, other than depression? 30.1% 31.8%
Lived with someone who was convicted of a crime? 32.0% 32.9%
Lived with someone who had a substance abuse problem? 41.5% 46.3%
Been physically abused? 12.7% 22.6%
Been sexually abused? 11.6% 16.4%
Run away? 25.8% 28.5%
Had substance abuse problems? 9.3% 15.0%
Attempted suicide? 15.4% 13.2%
[a] Data reported were collected using the Caregiver Information Questionnaire–Intake (CIQ–I).
Cleveland •67% of caregivers reported a family history of depression (n = 323).•45% of caregivers reported a family history of mental illness, other than depression (n = 324).•62% of caregivers reported a family history of substance abuse (n = 328).
Other Sites •68% of caregivers reported a family history of depression (n = 3,905).•45% of caregivers reported a family history of mental illness, other than depression (n = 3,878).•61% of caregivers reported a family history of substance abuse (n = 3,991).

Data Profile Reports April 2009 Data are from the CMHS National Evaluation of the Comprehensive Community Mental Health Services for Children and Their Families Program. This report is based on data downloaded April 13, 2009.
9
Custody Status[a,b] at Intake
12.9%
64.9%
4.2%
4.5%
0.3%
1.8%
7.2%
0.0%
2.4%
1.8%
25.2%
48.3%
4.2%
5.2%
0.5%
1.9%
7.7%
0.2%
4.6%
2.4%
0% 10% 20% 30% 40% 50% 60% 70% 80% 90% 100%
Two Parents[c]
Biological Mother Only
Biological Father Only
Adoptive Parent(s)
Sibling(s)
Aunt and/or Uncle
Grandparent(s)
Adult Friend
Ward of the State
Other
Cleveland Other Sites
Cleveland (n = 333)Other Sites (n =4,084)
[a] Data reported were collected using the Caregiver Information Questionnaire–Intake (CIQ–I).[b] Custody Status is collected on the CIQ and refers to legal custody. This may not reflect living arrangement, which is collected on the LSQ.[c] Includes two biological parents, or one biological parent and a step or adoptive parent.
Data Profile Reports April 2009 Data are from the CMHS National Evaluation of the Comprehensive Community Mental Health Services for Children and Their Families Program. This report is based on data downloaded April 13, 2009.
10
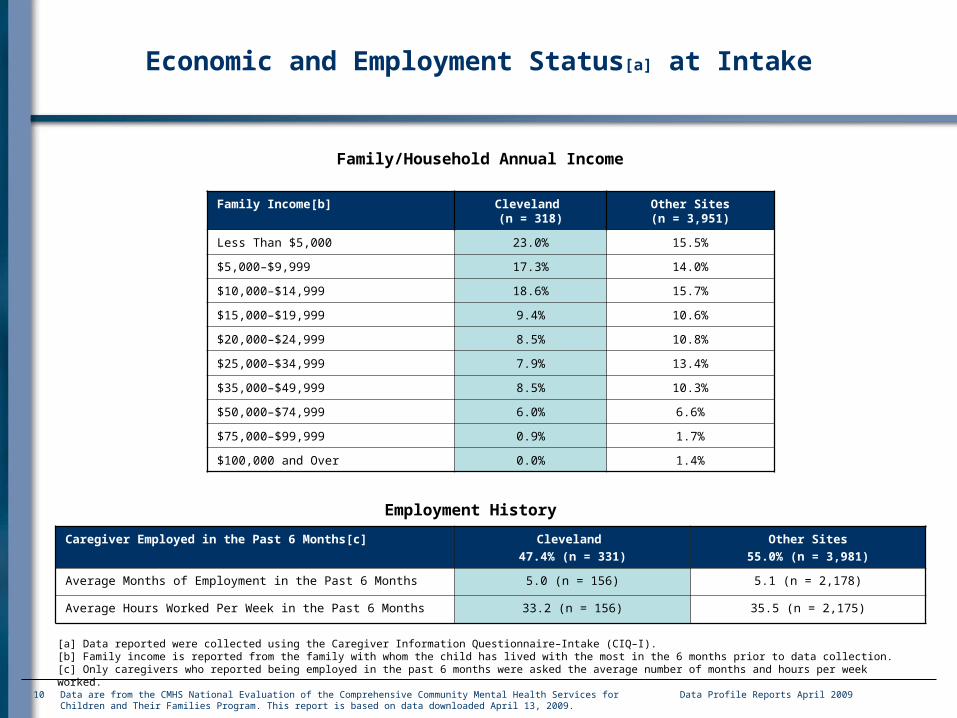
Economic and Employment Status[a] at Intake
Family/Household Annual Income
Family Income[b] Cleveland (n = 318)
Other Sites(n = 3,951)
Less Than $5,000 23.0% 15.5%
$5,000–$9,999 17.3% 14.0%
$10,000–$14,999 18.6% 15.7%
$15,000–$19,999 9.4% 10.6%
$20,000–$24,999 8.5% 10.8%
$25,000–$34,999 7.9% 13.4%
$35,000–$49,999 8.5% 10.3%
$50,000–$74,999 6.0% 6.6%
$75,000–$99,999 0.9% 1.7%
$100,000 and Over 0.0% 1.4%
Employment History
Caregiver Employed in the Past 6 Months[c] Cleveland 47.4% (n = 331)
Other Sites55.0% (n = 3,981)
Average Months of Employment in the Past 6 Months 5.0 (n = 156) 5.1 (n = 2,178)
Average Hours Worked Per Week in the Past 6 Months 33.2 (n = 156) 35.5 (n = 2,175)
[a] Data reported were collected using the Caregiver Information Questionnaire–Intake (CIQ–I).[b] Family income is reported from the family with whom the child has lived with the most in the 6 months prior to data collection.[c] Only caregivers who reported being employed in the past 6 months were asked the average number of months and hours per week worked.
Data Profile Reports April 2009 Data are from the CMHS National Evaluation of the Comprehensive Community Mental Health Services for Children and Their Families Program. This report is based on data downloaded April 13, 2009.
11
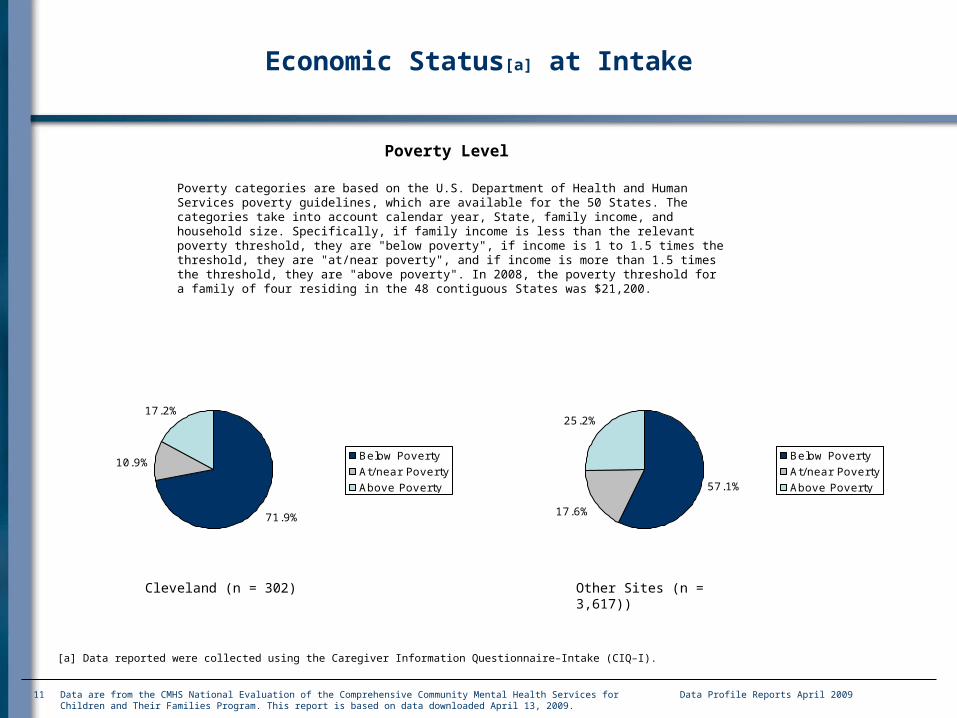
Economic Status[a] at Intake
Poverty Level
Poverty categories are based on the U.S. Department of Health and Human Services poverty guidelines, which are available for the 50 States. The categories take into account calendar year, State, family income, and household size. Specifically, if family income is less than the relevant poverty threshold, they are "below poverty", if income is 1 to 1.5 times the threshold, they are "at/near poverty", and if income is more than 1.5 times the threshold, they are "above poverty". In 2008, the poverty threshold for a family of four residing in the 48 contiguous States was $21,200.
71.9%
10.9%
17.2%
Below PovertyAt/near PovertyAbove Poverty
Cleveland (n = 302)
[a] Data reported were collected using the Caregiver Information Questionnaire–Intake (CIQ–I).
57.1%
17.6%
25.2%
Below PovertyAt/near PovertyAbove Poverty
Other Sites (n = 3,617))
Data Profile Reports April 2009 Data are from the CMHS National Evaluation of the Comprehensive Community Mental Health Services for Children and Their Families Program. This report is based on data downloaded April 13, 2009.
12
Section I: Education
This section provides information on children’s education status and experiences in school. Information in this section was taken from the Education Questionnaire Revised (EQ–R).
The EQ–R is administered to caregivers. It gathers information on school attendance, grade level, academic performance, school settings, Individual Education Plans, extracurricular activities, and disciplinary actions for children and youth enrolled in the Longitudinal Outcome Study. The questions cover all levels of schooling from prekindergarten to postsecondary institutions such as colleges and vocational/trade schools.

Data Profile Reports April 2009 Data are from the CMHS National Evaluation of the Comprehensive Community Mental Health Services for Children and Their Families Program. This report is based on data downloaded April 13, 2009.
13
School Attendance and Performance[a] at Intake
• In Cleveland, 99% of children aged 5–18 years attended school in the past 6 months (n = 328).• In other sites, 97% of children aged 5–18 years attended school in the past 6 months (n = 3,797).
• In Cleveland, 99% of children of all ages attended school in the past 6 months (n = 333).• In other sites, 94% of children of all ages attended school in the past 6 months (n = 4,115).
[a] Data reported were collected using the Education Questionnaire–Revised (EQ–R). This instrument collects data on the status of the child/family in the 6 months prior to the interview.
School Attendance and Performance Cleveland Other Sites
Average Number of Excused and Unexcused Absences in the Past 6 Months
(n = 303) (n = 3,474)
Perfect Attendance 10.9% 17.0%
Less Than 1 Day Per Month 21.1% 23.5%
About 1 Day a Month 18.2% 19.6%
About 1 Day Every 2 Weeks 11.2% 13.9%
About 1 Day a Week 5.9% 8.3%
2 Days Per Week 14.9% 7.1%
3 or More Days Per Week 17.8% 10.6%
School Performance at Intake (n = 300) (n = 3,406)
Grade Average 'A' 5.0% 8.3%
Grade Average 'B' 17.3% 21.7%
Grade Average 'C' 30.7% 23.4%
Grade Average 'D' 13.3% 9.4%
Failing About Half or More Classes 31.0% 21.0%
School Does Not Grade the Children 2.3% 13.9%
Other 0.3% 2.4%
14
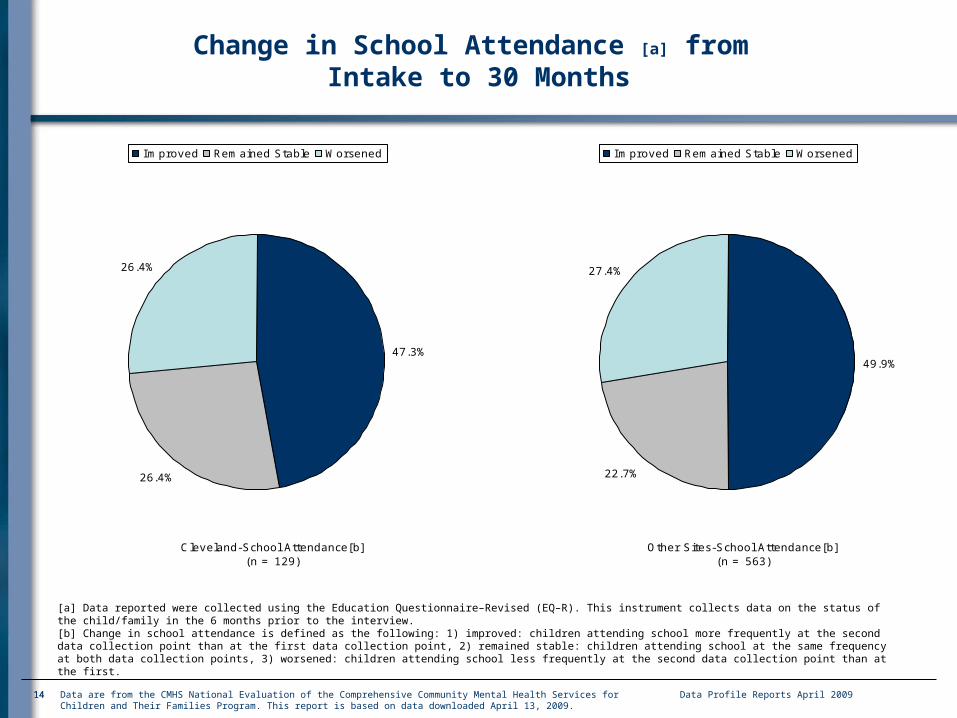
Change in School Attendance [a] from Intake to 30 Months
Cleveland-School Attendance[b](n = 129)
47.3%
26.4%
26.4%
Improved Remained Stable Worsened
[a] Data reported were collected using the Education Questionnaire–Revised (EQ–R). This instrument collects data on the status of the child/family in the 6 months prior to the interview.[b] Change in school attendance is defined as the following: 1) improved: children attending school more frequently at the second data collection point than at the first data collection point, 2) remained stable: children attending school at the same frequency at both data collection points, 3) worsened: children attending school less frequently at the second data collection point than at the first.
Other Sites-School Attendance[b](n = 563)
49.9%
22.7%
27.4%
Improved Remained Stable Worsened
14 Data Profile Reports April 2009 Data are from the CMHS National Evaluation of the Comprehensive Community Mental Health Services for Children and Their Families Program. This report is based on data downloaded April 13, 2009.
15
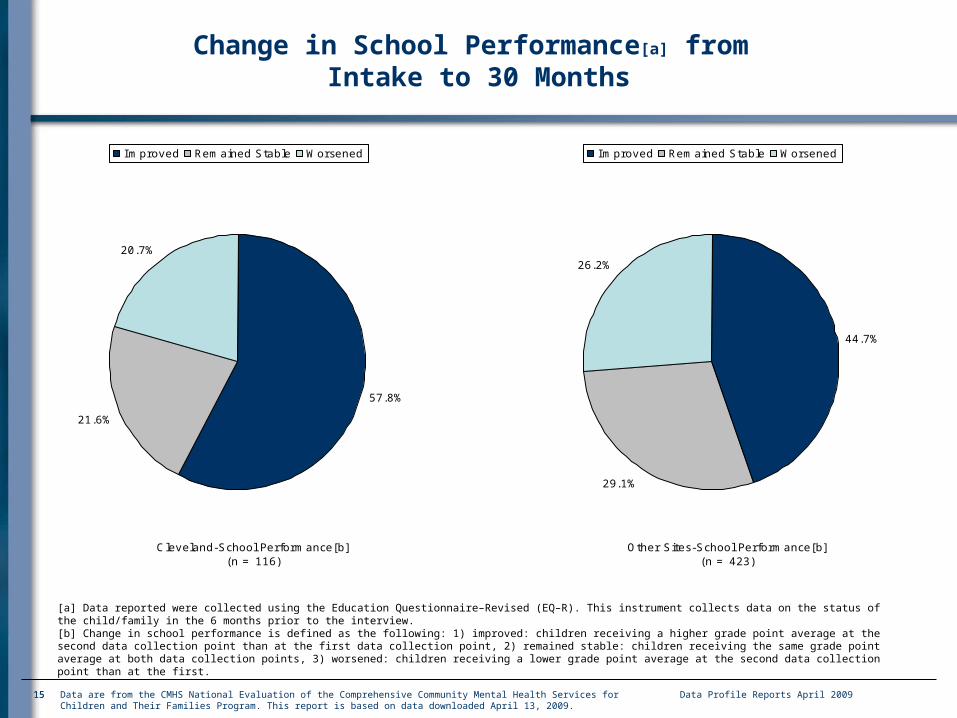
Change in School Performance[a] from Intake to 30 Months
Cleveland-School Performance[b](n = 116)
57.8%
21.6%
20.7%
Improved Remained Stable Worsened
[a] Data reported were collected using the Education Questionnaire–Revised (EQ–R). This instrument collects data on the status of the child/family in the 6 months prior to the interview.[b] Change in school performance is defined as the following: 1) improved: children receiving a higher grade point average at the second data collection point than at the first data collection point, 2) remained stable: children receiving the same grade point average at both data collection points, 3) worsened: children receiving a lower grade point average at the second data collection point than at the first.
Other Sites-School Performance[b](n = 423)
44.7%
29.1%
26.2%
Improved Remained Stable Worsened
15 Data Profile Reports April 2009 Data are from the CMHS National Evaluation of the Comprehensive Community Mental Health Services for Children and Their Families Program. This report is based on data downloaded April 13, 2009.

16
Educational Placements and Individualized Educational Plans (IEP)[a] at Intake
[a] Data reported were collected using the Education Questionnaire–Revised (EQ–R). This instrument collects data on the status of the child/family in the 6 months prior to the interview.[b] Because individuals may have more than one educational placement, educational placements may sum to more than 100%.[c] Includes home-based instruction and combination of home schooling and home-based instruction.[d] Includes hospital, juvenile justice facility, residential treatment center, group home, and group shelter.[e] Because individuals may have more than one reason for having an IEP, the reasons for having an IEP may sum to more than 100%.
Educational Placements in the 6 Months Prior to Intake[b] Cleveland(n = 304)
Other Sites (n = 3,541)
Regular Public Day School 87.8% 84.6%
Regular Private Day/Boarding School 7.6% 2.7%
Home Schooling[c] 1.3% 2.5%
Alternative/Special Day School 9.5% 16.2%
School in 24-Hour Restrictive Setting[d] 1.0% 8.3%
Postsecondary School 0.0% 0.2%
Daycare or After-School Care Program 11.3% 14.8%
Other 2.0% 3.4%
Percent with IEP (n = 303) (n = 3,522)
Individualized Education Plan 54.8% 49.1%
Reasons for IEP[e] (n = 166) (n = 1,712)
Behavioral/Emotional Problems 86.1% 74.5%
Learning Disability 54.2% 54.5%
Developmental Disability or Mental Retardation 17.5% 14.2%
Vision or Hearing Impairment 3.6% 3.7%
Speech Impairment 16.9% 17.2%
Physical Disability 3.6% 2.9%
Other 4.2% 5.8%
16 Data Profile Reports April 2009 Data are from the CMHS National Evaluation of the Comprehensive Community Mental Health Services for Children and Their Families Program. This report is based on data downloaded April 13, 2009.
17
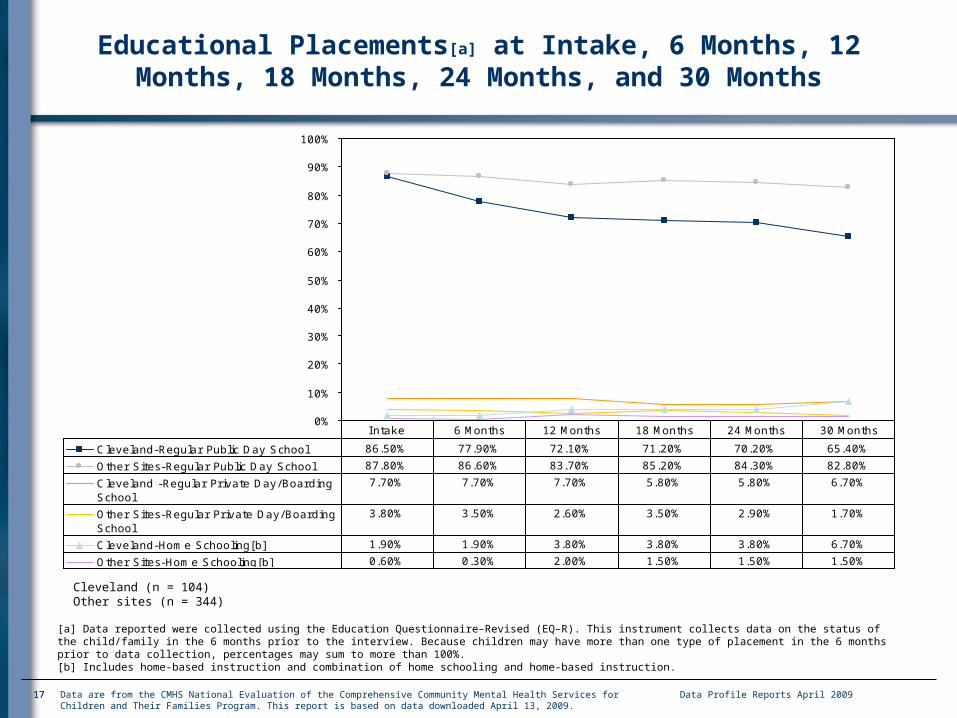
Educational Placements[a] at Intake, 6 Months, 12 Months, 18 Months, 24 Months, and 30 Months
0%
10%
20%
30%
40%
50%
60%
70%
80%
90%
100%
Cleveland-Regular Public Day School 86.50% 77.90% 72.10% 71.20% 70.20% 65.40%
Other Sites-Regular Public Day School 87.80% 86.60% 83.70% 85.20% 84.30% 82.80%
Cleveland -Regular Private Day/BoardingSchool
7.70% 7.70% 7.70% 5.80% 5.80% 6.70%
Other Sites-Regular Private Day/BoardingSchool
3.80% 3.50% 2.60% 3.50% 2.90% 1.70%
Cleveland-Home Schooling[b] 1.90% 1.90% 3.80% 3.80% 3.80% 6.70%
Other Sites-Home Schooling[b] 0.60% 0.30% 2.00% 1.50% 1.50% 1.50%
I ntake 6 Months 12 Months 18 Months 24 Months 30 Months
[a] Data reported were collected using the Education Questionnaire–Revised (EQ–R). This instrument collects data on the status of the child/family in the 6 months prior to the interview. Because children may have more than one type of placement in the 6 months prior to data collection, percentages may sum to more than 100%.[b] Includes home-based instruction and combination of home schooling and home-based instruction.
Cleveland (n = 104)Other sites (n = 344)
17 Data Profile Reports April 2009 Data are from the CMHS National Evaluation of the Comprehensive Community Mental Health Services for Children and Their Families Program. This report is based on data downloaded April 13, 2009.

18
Educational Placements[a] at Intake, 6 Months, 12 Months, 18 Months, 24 Months, and 30 Months
continued
0%
10%
20%
30%
40%
50%
60%
70%
80%
90%
100%
Cleveland-Alternative/Special Day School 10.60% 22.10% 26.00% 23.10% 28.80% 22.10%
Other Sites-Alternative/Special DaySchool
14.20% 16.30% 15.10% 17.70% 16.30% 17.40%
Cleveland-School in 24-Hour RestrictiveSetting[b]
1.00% 1.90% 3.80% 3.80% 3.80% 5.80%
Other Sites-School in 24-Hour RestrictiveSetting[b]
4.70% 4.40% 5.50% 4.10% 2.60% 4.40%
Cleveland-Postsecondary School 0.00% 0.00% 0.00% 0.00% 0.00% 0.00%
Other Sites-Postsecondary School 0.30% 0.30% 0.30% 0.60% 0.60% 1.50%
Cleveland-Other 1.00% 3.80% 2.90% 2.90% 0.00% 3.80%
Other Sites-Other 4.10% 1.70% 0.90% 0.00% 2.00% 1.20%
I ntake 6 Months 12 Months 18 Months 24 Months 30 Months
Cleveland (n = 104)Other sites (n = 344)
[a] Data reported were collected using the Education Questionnaire–Revised (EQ–R). This instrument collects data on the status of the child/family in the 6 months prior to the interview. Because children may have more than one type of placement in the 6 months prior to data collection, percentages may sum to more than 100%.[b] Includes hospital, juvenile justice facility, residential treatment center, group home, and group shelter.
18 Data Profile Reports April 2009 Data are from the CMHS National Evaluation of the Comprehensive Community Mental Health Services for Children and Their Families Program. This report is based on data downloaded April 13, 2009.
Data Profile Reports April 2009 Data are from the CMHS National Evaluation of the Comprehensive Community Mental Health Services for Children and Their Families Program. This report is based on data downloaded April 13, 2009.
19
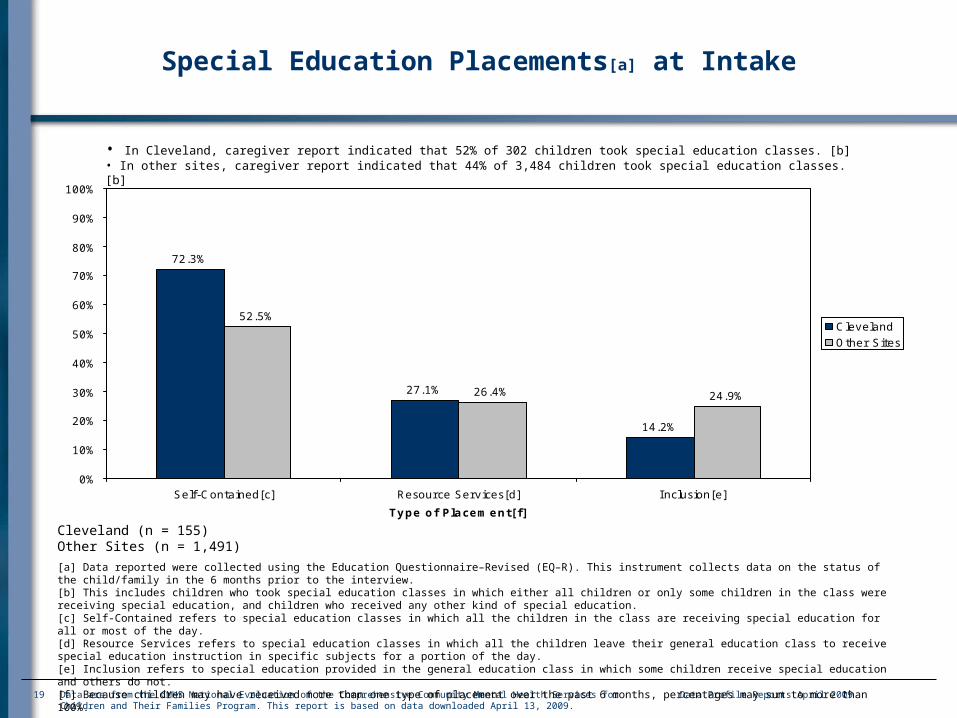
Special Education Placements[a] at Intake
• In Cleveland, caregiver report indicated that 52% of 302 children took special education classes. [b]• In other sites, caregiver report indicated that 44% of 3,484 children took special education classes.[b]
72.3%
27.1%
14.2%
52.5%
26.4% 24.9%
0%
10%
20%
30%
40%
50%
60%
70%
80%
90%
100%
Self-Contained[c] Resource Services[d] I nclusion[e]
Type of Placement[f]
Cleveland
Other Sites
Cleveland (n = 155)Other Sites (n = 1,491)
[a] Data reported were collected using the Education Questionnaire–Revised (EQ–R). This instrument collects data on the status of the child/family in the 6 months prior to the interview.[b] This includes children who took special education classes in which either all children or only some children in the class were receiving special education, and children who received any other kind of special education.[c] Self-Contained refers to special education classes in which all the children in the class are receiving special education for all or most of the day.[d] Resource Services refers to special education classes in which all the children leave their general education class to receive special education instruction in specific subjects for a portion of the day.[e] Inclusion refers to special education provided in the general education class in which some children receive special education and others do not.[f] Because children may have received more than one type of placement over the past 6 months, percentages may sum to more than 100%.
Data Profile Reports April 2009 Data are from the CMHS National Evaluation of the Comprehensive Community Mental Health Services for Children and Their Families Program. This report is based on data downloaded April 13, 2009.
20
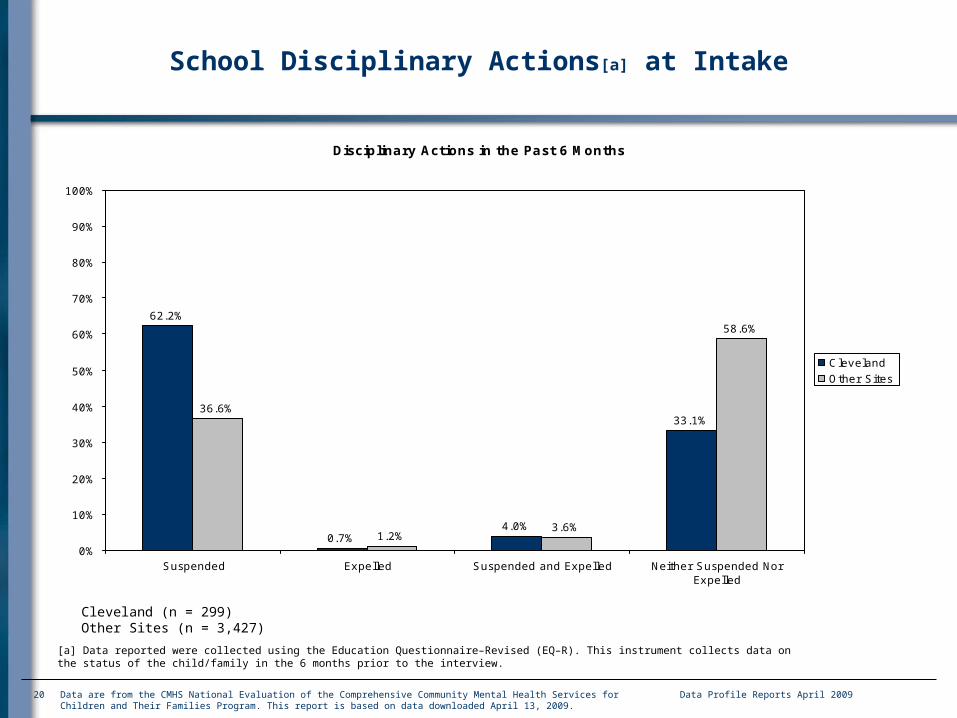
School Disciplinary Actions[a] at Intake
Disciplinary Actions in the Past 6 Months
62.2%
0.7%4.0%
33.1%36.6%
1.2%3.6%
58.6%
0%
10%
20%
30%
40%
50%
60%
70%
80%
90%
100%
Suspended Expelled Suspended and Expelled Neither Suspended NorExpelled
ClevelandOther Sites
Cleveland (n = 299)Other Sites (n = 3,427)
[a] Data reported were collected using the Education Questionnaire–Revised (EQ–R). This instrument collects data on the status of the child/family in the 6 months prior to the interview.
Data Profile Reports April 2009 21
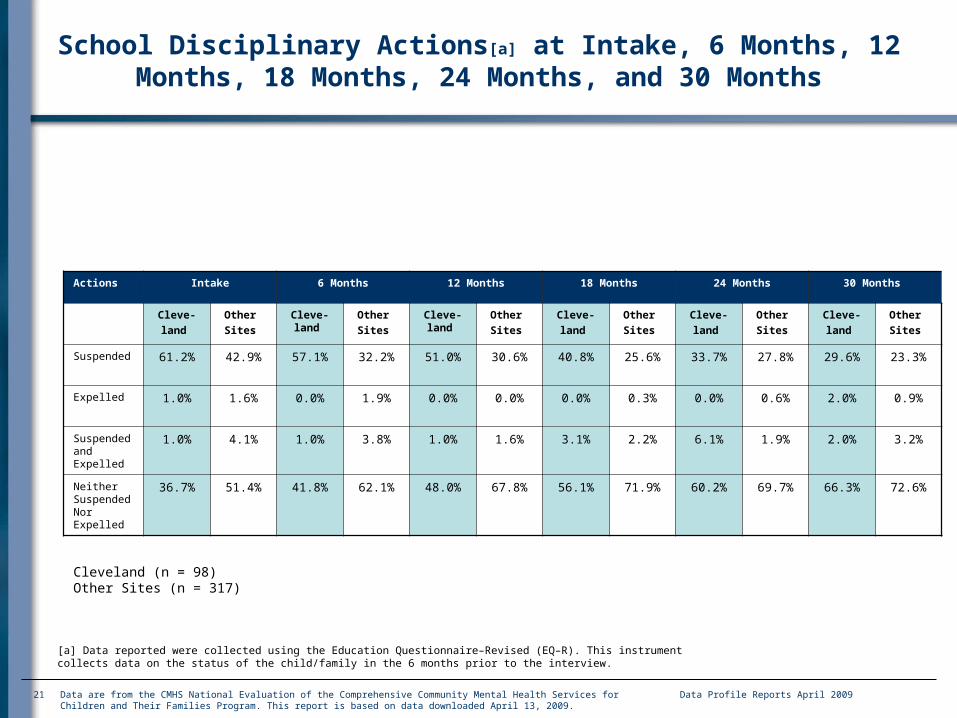
School Disciplinary Actions[a] at Intake, 6 Months, 12 Months, 18 Months, 24 Months, and 30 Months
Actions Intake 6 Months 12 Months 18 Months 24 Months 30 Months
Cleve-land
Other Sites
Cleve-land
Other Sites
Cleve-land
Other Sites
Cleve-land
Other Sites
Cleve-land
Other Sites
Cleve-land
Other Sites
Suspended 61.2% 42.9% 57.1% 32.2% 51.0% 30.6% 40.8% 25.6% 33.7% 27.8% 29.6% 23.3%
Expelled 1.0% 1.6% 0.0% 1.9% 0.0% 0.0% 0.0% 0.3% 0.0% 0.6% 2.0% 0.9%
Suspended and Expelled
1.0% 4.1% 1.0% 3.8% 1.0% 1.6% 3.1% 2.2% 6.1% 1.9% 2.0% 3.2%
Neither Suspended Nor Expelled
36.7% 51.4% 41.8% 62.1% 48.0% 67.8% 56.1% 71.9% 60.2% 69.7% 66.3% 72.6%
Cleveland (n = 98)Other Sites (n = 317)
[a] Data reported were collected using the Education Questionnaire–Revised (EQ–R). This instrument collects data on the status of the child/family in the 6 months prior to the interview.
Data are from the CMHS National Evaluation of the Comprehensive Community Mental Health Services for Children and Their Families Program. This report is based on data downloaded April 13, 2009.
Data Profile Reports April 2009 Data are from the CMHS National Evaluation of the Comprehensive Community Mental Health Services for Children and Their Families Program. This report is based on data downloaded April 13, 2009.
22
Section II: Juvenile Justice Involvement
This section provides information on youth’s contact with the criminal justice system. Information in this section was taken from the Delinquency Survey–Revised (DS–R).
The DS–R gathers information on the types of illegal, violent, or delinquent activities youth have engaged in, along with the frequency of these acts. It also gathers information on law enforcement contacts and the results of those contacts. The DS–R is administered to youth 11 years and older who are enrolled in the Longitudinal Outcome Study. Since only youth who are 11 years or older complete the DS–R, the number of participants who responded to each item may be noticeably less than in previous slides.

Data Profile Reports April 2009 Data are from the CMHS National Evaluation of the Comprehensive Community Mental Health Services for Children and Their Families Program. This report is based on data downloaded April 13, 2009.
23
Criminal Justice History[a] at Intake
•In Cleveland, 57% of youth reported some type of criminal justice contact prior to intake (n = 201).•In other sites, 54% of youth reported some type of criminal justice contact prior to intake (n = 2,337).
Have you ever been . . .?
34.3%
30.5%
36.3%
16.0%
25.9%
9.5%
29.6%
38.1%
28.1%
19.4%
32.2%
16.8%
0% 10% 20% 30% 40% 50% 60% 70% 80% 90% 100%
Questioned by the Police?[b]
Arrested?
Told to Appear in Court?[b]
Convicted of a Crime?)
On Probation?
Sentenced to a Secure Facility?
Cleveland Other Sites
[a] Data reported were collected using the Delinquency Survey–Revised (DS–R). Because participants may have had multiple criminal justice contacts, percentages may sum to more than 100%.[b] Because you were suspected of committing a crime.
Cleveland (n ranges from 200 to 201)Other Sites (n ranges from 2,321 to 2,331)

Data Profile Reports April 2009 Data are from the CMHS National Evaluation of the Comprehensive Community Mental Health Services for Children and Their Families Program. This report is based on data downloaded April 13, 2009.
24
Criminal Justice History[a,b] at Intake, 6 Months, 12 Months, 18 Months, 24 Months, and 30 Months
•In the past 6 months have you been . . .?
0%
10%
20%
30%
40%
50%
60%
70%
80%
90%
100%
Cleveland - Questioned by the P olice?[c] (n = 51) 11.80% 7.80% 19.60% 17.60% 23.50% 23.50%
Other Sites - Questioned by the P olice?[c] (n = 287 ) 20.60% 12.90% 11.80% 12.90% 9.80% 11.80%
Cleveland - Arrested? (n = 52) 11.50% 5.80% 3.80% 5.80% 3.80% 7.70%
Other Sites - Arrested? (n = 289) 20.10% 10.70% 9.70% 8.70% 8.00% 8.70%
Cleveland- Told to Appear in Court?[c] (n = 52) 17.30% 9.60% 13.50% 15.40% 15.40% 9.60%
Other Sites - Told to Appear in Court?[c] (n = 279 ) 15.40% 9.70% 7.90% 8.20% 9.30% 10.40%
Intake 6 Months 12 Months 18 Months 24 Months 30 Months
[a] Data reported were collected using the Delinquency Survey–Revised (DS–R). This instrument collects data on the status of the child/family in the 6 months prior to the interview.[b] Because participants may have had multiple criminal justice contacts, percentages may sum to more than 100%.[c] Because you were suspected of committing a crime.

Data Profile Reports April 2009 Data are from the CMHS National Evaluation of the Comprehensive Community Mental Health Services for Children and Their Families Program. This report is based on data downloaded April 13, 2009.
25
Criminal Justice History[a,b] at Intake, 6 Months, 12 Months, 18 Months, 24 Months, and 30 Months
continued
•In the past 6 months have you been . . .?
0%
10%
20%
30%
40%
50%
60%
70%
80%
90%
100%
Cleveland - Convicted of a Crime? (n = 52) 7.70% 3.80% 7.70% 5.80% 11.50% 1.90%
Other Sites - Convicted of a Crime? (n = 288) 7.30% 5.90% 4.50% 4.20% 3.80% 3.50%
Cleveland - On P robation? (n = 52) 13.50% 15.40% 13.50% 15.40% 15.40% 15.40%
Other Sites - On P robation? (n = 289 ) 14.50% 13.50% 14.90% 12.50% 11.80% 10.40%
Cleveland - Sentenced to Secure Facility? (n = 52) 0.00% 1.90% 3.80% 3.80% 5.80% 5.80%
Other Sites - Sentenced to Secure Facility? (n =287 ) 8.40% 4.50% 3.80% 4.20% 5.20% 5.20%
Intake 6 Months 12 Months 18 Months 24 Months 30 Months
[a] Data reported were collected using the Delinquency Survey–Revised (DS–R). This instrument collects data on the status of the child/family in the 6 months prior to the interview.[b] Because participants may have had multiple criminal justice contacts, percentages may sum to more than 100%.[c] Because you were suspected of committing a crime.

Data Profile Reports April 2009 Data are from the CMHS National Evaluation of the Comprehensive Community Mental Health Services for Children and Their Families Program. This report is based on data downloaded April 13, 2009.
26
Delinquent Behavior[a] at Intake, 6 Months, 12 Months, 18 Months, 24 Months, and 30 Months
In the past 6 months, have you . .
Intake 6 Months 12 Months 18 Months 24 Months 30 Months
Cleveland
Other Sites
Cleveland
Other Sites
Cleveland
Other Sites
Cleveland
Other Sites
Cleveland
Other Sites
Cleveland
Other Sites
Violent Crimes[b]
Been a bully or threatened other people without use of a weapon?
23.1% 32.3% 23.1% 30.2% 25.0% 18.9% 23.1% 19.2% 21.2% 17.9% 19.2% 13.4%
Hit someone or got into a physical fight?
67.3% 54.1% 53.8% 43.8% 51.9% 35.5% 30.8% 32.8% 32.7% 31.0% 38.5% 31.0%
Property Crimes[b]
Taken something from a store without paying for it?
17.3% 21.7% 13.5% 17.6% 9.6% 17.2% 17.3% 12.4% 13.5% 8.3% 7.7% 8.3%
Bought, received, possessed, or sold any stolen goods?
5.8% 10.3% 5.8% 7.5% 3.8% 6.8% 5.8% 4.5% 7.7% 1.7% 3.8% 2.4%
Other Crimes[b]
Been in trouble with the police for skipping school?
9.8% 17.9% 3.9% 10.1% 5.9% 5.8% 5.9% 7.4% 7.8% 5.4% 13.7% 7.4%
Been in trouble with the police for running away?
16.0% 16.5% 10.0% 12.0% 10.0% 8.8% 4.0% 4.9% 8.0% 7.0% 8.0% 5.3%
[a] Data reported were collected using the Delinquency Survey–Revised (DS–R). This instrument collects data on the status of the child/family in the 6 months prior to the interview.[b] The two most frequently reported crimes (as reported at intake) within each category are presented here.
Cleveland (n ranges from 50 to 52)Other Sites (n ranges from 257 to 292)

Data Profile Reports April 2009 Data are from the CMHS National Evaluation of the Comprehensive Community Mental Health Services for Children and Their Families Program. This report is based on data downloaded April 13, 2009.
27
Section III: Child Clinical Measures
This section provides clinical information on the children participating in the Longitudinal Outcome Study. Information on functional impairment, depression, and anxiety is presented, along with information on children’s behavioral and emotional problems. Finally, measures of children’s behavioral and emotions strengths are included in addition to measures of adaptive behaviors. Information in this section was taken from the following instruments:
Columbia Impairment Scale (CIS): The CIS, administered to caregivers, provides a global measure of impairment. CIS scores range from 0 to 52. Higher scores indicate a greater level of impairment. A score of 15 or higher is considered clinically impaired.
Revised Children’s Manifest Anxiety Scale (RCMAS): The RCMAS, completed by youth, measures anxiety. The RCMAS is comprised of four subscales: Worry/Oversensitivity, Social Concerns/Concentration, Physiological Anxiety, and the Lie Scale. The Lie Scale measures inaccurate self-report. It may indicate that the child is "faking good", or that the child has an inflated view of him/herself. Scores for each subscale are converted to standardized scores (T-scores), and have varying ranges; minimum values range from 2 to 3 and maximum values range from 17 to 19. Higher scores indicate a greater level of anxiety. The RCMAS total anxiety T-score ranges from 18 to 92. Total T-scores greater than 60 indicate high levels of impairment.
Reynolds Adolescent Depression Scale–2nd Edition (RADS–2): The RADS–2, completed by youth, measures adolescent depression. RADS–2 is comprised of four subscales: Dysphoric Mood, Anhedonia/Negative Affect, Negative Self-Evaluation, and Somatic Complaints. Scores are converted to standardized scores (T-scores), and have varying ranges; minimum values range from 29 to 40 and maximum scores range from 76 to 90. Total T-scores of less than 61 represent Normal range, 61 to 64 represent Mild clinical depression range, 65 to 69 represent Moderate clinical depression range, and greater than or equal to 70 represent Severe clinical depression range.

Data Profile Reports April 2009 Data are from the CMHS National Evaluation of the Comprehensive Community Mental Health Services for Children and Their Families Program. This report is based on data downloaded April 13, 2009.
28
Section III: Child Clinical Measures, continued
Child Behavioral Checklist (CBCL 6–18): The CBCL 6–18 is administered to caregivers and measures behavioral and emotional problems in children aged 6 to 18. The CBCL 6–18 produces eight narrow-band syndrome scores: anxious/depressed, withdrawn/depressed, somatic complaints, social problems, thought problems, attention problems, rule-breaking behavior, and aggressive behavior; two broadband syndrome scores: internalizing and externalizing; and a total problem score. T-scores between 65 and 69 (93rd and 97th percentile) on the narrow-band syndrome scales are in the borderline clinical range. T-scores 70 or above are in the clinical range. On the internalizing, externalizing, and total problem scales, T-scores between 60 and 63 (84th and 90th percentile) are in the borderline clinical range. T-scores 64 or above are in the clinical range.
The CBCL is also comprised of three competence subscales, as well as a Total Competence scale. Higher scores on the competence scales indicate greater competence. The three competence subscales have a T-score range from 20 to 65, with scores under 30 in the clinical range (i.e., less competence) (2nd percentile), scores between 31 and 36 in the borderline clinical range, and scores over 36 below the clinical range (i.e., greater competence). The Total Competence scale has a T-score range from 10 to 80, with scores under 37 in the clinical range (i.e., less competence), scores between 37 and 40 in the borderline clinical range, and scores over 40 below the clinical range (i.e., greater competence).
Data Profile Reports April 2009 Data are from the CMHS National Evaluation of the Comprehensive Community Mental Health Services for Children and Their Families Program. This report is based on data downloaded April 13, 2009.
29
Section III: Child Clinical Measures, continued
Behavioral and Emotional Rating Scale–Second Edition, Parent Rating Scale (BERS–2C): The BERS–2C is administered to caregivers. It measures children’s emotional and behavioral strengths in six different areas: interpersonal strength, family involvement, intrapersonal strength, school functioning, affective strength, and career strength. Scaled scores on the strength subscales range from 1 to 16, with an average score between 8 and 12. Higher scores indicate greater strengths.
A strength index can be calculated and is based on the sum of the subscale scores, excluding career strength. The strength index ranges from 38 to 161, with an average index in the 90–110 range. A higher index indicates greater overall strengths.
Behavioral and Emotional Rating Scale–Second Edition, Youth Rating Scale (BERS–2Y): The BERS–2Y is a youth version of the BERS–2C. It is administered to youth 11 years and older. As with the caregiver version, the BERS–2Y measures children’s emotional and behavioral strengths in six different areas: interpersonal strength, family involvement, intrapersonal strength, school functioning, affective strength, and career strength. On the youth version, however, scaled scores on the strength subscales range from 1 to 18, but the average range remains the same at 8–12. The calculation, range, and average score of the strength index remain the same as well (i.e., 38 to 161, with an average index between 90 and 110). Higher subscale scores and strength indexes indicate greater overall strengths.

Data Profile Reports April 2009 Data are from the CMHS National Evaluation of the Comprehensive Community Mental Health Services for Children and Their Families Program. This report is based on data downloaded April 13, 2009.
30
Percent Scoring in the Clinical Range[a] of Impairment, Anxiety, and Depression at Intake, 6 Months, 12 Months, 18 Months, 24 Months, and 30 Months
0%
10%
20%
30%
40%
50%
60%
70%
80%
90%
100%
Cleveland CIS Total Impairment (n =158)
93.0% 88.6% 86.1% 79.7% 78.5% 79.1%
Other Sites CI S Total Impairment (n =523)
79.90% 71.10% 66.90% 61.80% 61.00% 59.50%
Cleveland RCMAS Total Anxiety (n = 51) 33.3% 29.4% 27.5% 21.6% 7.8% 13.7%
Other Sites RCMAS Total Anxiety (n =297)
33.30% 30.30% 27.30% 26.60% 26.30% 25.60%
Cleveland RADS Total Depression (n =52)
26.9% 25.0% 19.2% 15.4% 9.6% 13.5%
Other Sites RADS Total Depression (n =52)
22.60% 19.30% 17.90% 18.90% 15.90% 12.30%
Intake 6 Months 12 Months 18 Months 24 Months 30 Months
[a] A score of 15 or higher is considered clinically impaired on the Columbia Impairment Scale (CIS). A total T-score greater than 60 indicates a high level of impairment on the Revised Children’s Manifest Anxiety Sale (RCMAS). A score of 61 or higher on the Reynolds Adolescent Depression Scale–Second Edition (RADS–2) indicates a clinical level of depression. The CIS collects data on the status of the child/family in the 6 months prior to the interview. The RCMAS and RADS–2 measure problems at the time of the interview.

Data Profile Reports April 2009 Data are from the CMHS National Evaluation of the Comprehensive Community Mental Health Services for Children and Their Families Program. This report is based on data downloaded April 13, 2009.
31
Reliable Change Index[a] of Impairment, Anxiety, and Depression from Intake to 30 Months
3.00% 4.00% 6.80%10.80%
3.90% 6.90%
62.40%67.30% 60.80%
58.80%67.50%
68.10%
34.5%28.7% 32.4% 30.4% 28.6% 25.0%
0%
10%
20%
30%
40%
50%
60%
70%
80%
90%
100%
Cleveland - CIS TotalImpairment
(n = 165)
Other Sites - CISTotal Impairment
(n = 743)
Cleveland - RCMAS Total Anxiety
(n = 74)
Other Sites - RCMASTotal Anxiety
(n = 454)
Cleveland - RADS–2Total Depression
(n = 77)
Other Sites - RADS–2Total Depression
(n = 452)
Measure[b]
Worsened Remained Stable Improved
[a] The Reliable Change Index (RCI) is a relative measure that compares a child's or caregiver's scores at two different points in time and indicates whether a change in score shows significant improvement, worsening, or stability (i.e., no significant change).[b] Data reported were collected using Columbia Impairment Scale (CIS). This instrument collects data on the status of the child/family in the 6 months prior to the interview. The Revised Children’s Manifest Anxiety Scale (RCMAS), and Reynolds Adolescent Depression Scale–Second Edition (RADS–2) measure problems at the time of the interview.
Data Profile Reports April 2009 Data are from the CMHS National Evaluation of the Comprehensive Community Mental Health Services for Children and Their Families Program. This report is based on data downloaded April 13, 2009.
32
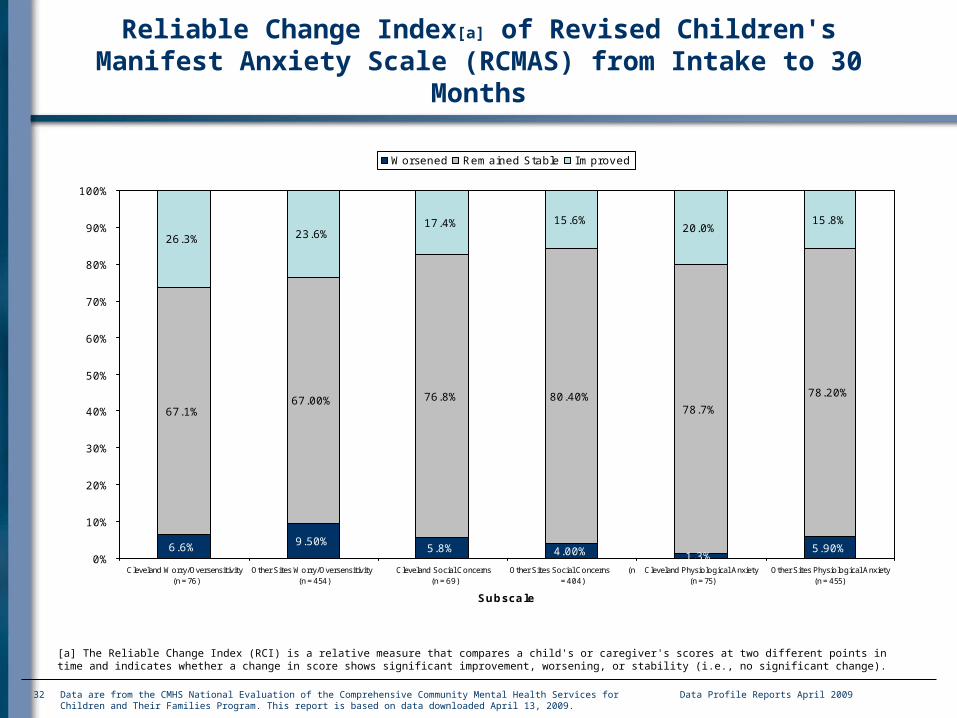
Reliable Change Index[a] of Revised Children's Manifest Anxiety Scale (RCMAS) from Intake to 30 Months
6.6% 9.50%5.8% 4.00% 1.3%
5.90%
67.1%67.00% 76.8% 80.40%
78.7%
78.20%
26.3% 23.6%17.4% 15.6%
20.0%15.8%
0%
10%
20%
30%
40%
50%
60%
70%
80%
90%
100%
Cleveland Worry/Oversensitivity (n = 76)
Other Sites Worry/Oversensitivity (n = 454)
Cleveland Social Concerns (n = 69)
Other Sites Social Concerns (n= 404)
Cleveland Physiological Anxiety (n = 75)
Other Sites Physiological Anxiety(n = 455)
Subscale
Worsened Remained Stable Improved
[a] The Reliable Change Index (RCI) is a relative measure that compares a child's or caregiver's scores at two different points in time and indicates whether a change in score shows significant improvement, worsening, or stability (i.e., no significant change).
Data Profile Reports April 2009 Data are from the CMHS National Evaluation of the Comprehensive Community Mental Health Services for Children and Their Families Program. This report is based on data downloaded April 13, 2009.
33
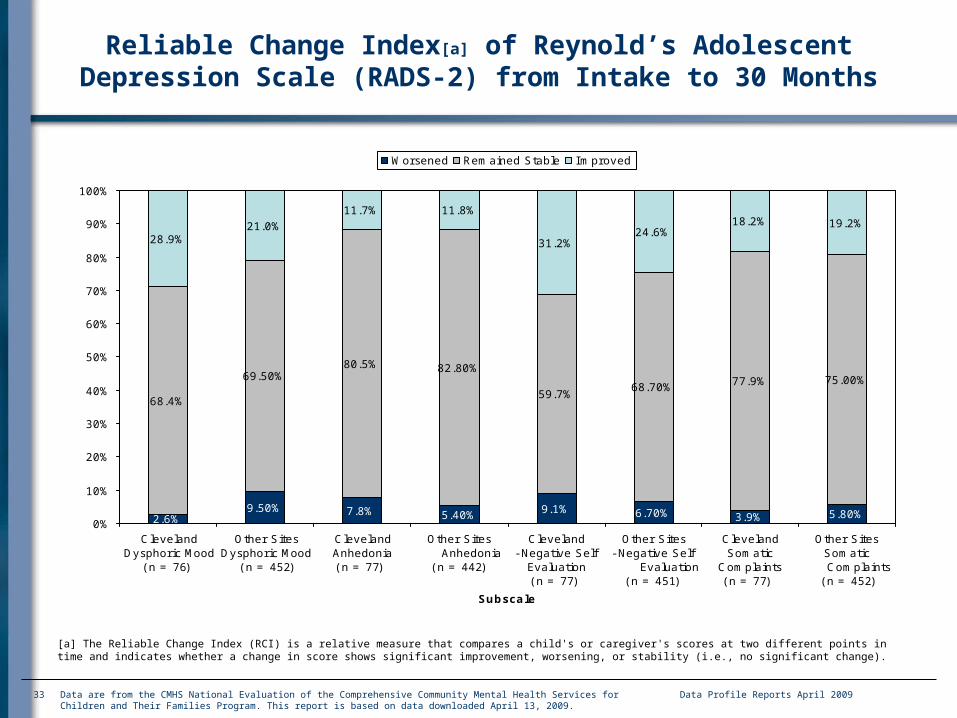
Reliable Change Index[a] of Reynold’s Adolescent Depression Scale (RADS-2) from Intake to 30 Months
2.6%9.50% 7.8% 5.40% 9.1% 6.70% 3.9% 5.80%
68.4%
69.50%80.5% 82.80%
59.7%68.70% 77.9% 75.00%
28.9%21.0%
11.7% 11.8%
31.2%24.6%
18.2% 19.2%
0%
10%
20%
30%
40%
50%
60%
70%
80%
90%
100%
ClevelandDysphoric Mood
( n =76)
Other SitesDysphoric Mood
( n =452)
ClevelandAnhedonia( n =77)
Other Sites Anhedonia
( n =442)
Cleveland-Negative Self
Evaluation( n =77)
Other Sites-Negative Self
Evaluation( n =451)
ClevelandSomatic
Complaints( n =77)
Other SitesSomatic
Complaints ( n =452)
Subscale
Worsened Remained Stable Improved
[a] The Reliable Change Index (RCI) is a relative measure that compares a child's or caregiver's scores at two different points in time and indicates whether a change in score shows significant improvement, worsening, or stability (i.e., no significant change).

Data Profile Reports April 2009 Data are from the CMHS National Evaluation of the Comprehensive Community Mental Health Services for Children and Their Families Program. This report is based on data downloaded April 13, 2009.
34
Reliable Change Index[a] of Child Behavior and Emotional Problems in Children Ages 6 to 18 Years[b]
from Intake to 30 Months
3.30% 4.20% 3.90% 6.00%
67.80%57.40% 59.20% 53.10%
28.9%
38.4% 36.8%40.9%
0%
10%
20%
30%
40%
50%
60%
70%
80%
90%
100%
Cleveland - I nternalizingProblems (n = 152)
Other Sites - I nternalizingProblems (n = 667)
Cleveland- ExternalizingProblems (n = 152)
Other Sites - ExternalizengProblems (n = 667)
Subscale
Worsened Remained Stable Improved
[a] The Reliable Change Index (RCI) is a relative measure that compares a child's or caregiver's scores at two different points in time and indicates whether a change in score shows significant improvement, worsening, or stability (i.e., no significant change).[b] Data reported were collected using the Child Behavioral Checklist 6–18 (CBCL 6–18). This instrument collects data on the status of the child/family in the 6 months prior to the interview.
Data Profile Reports April 2009 Data are from the CMHS National Evaluation of the Comprehensive Community Mental Health Services for Children and Their Families Program. This report is based on data downloaded April 13, 2009.
35
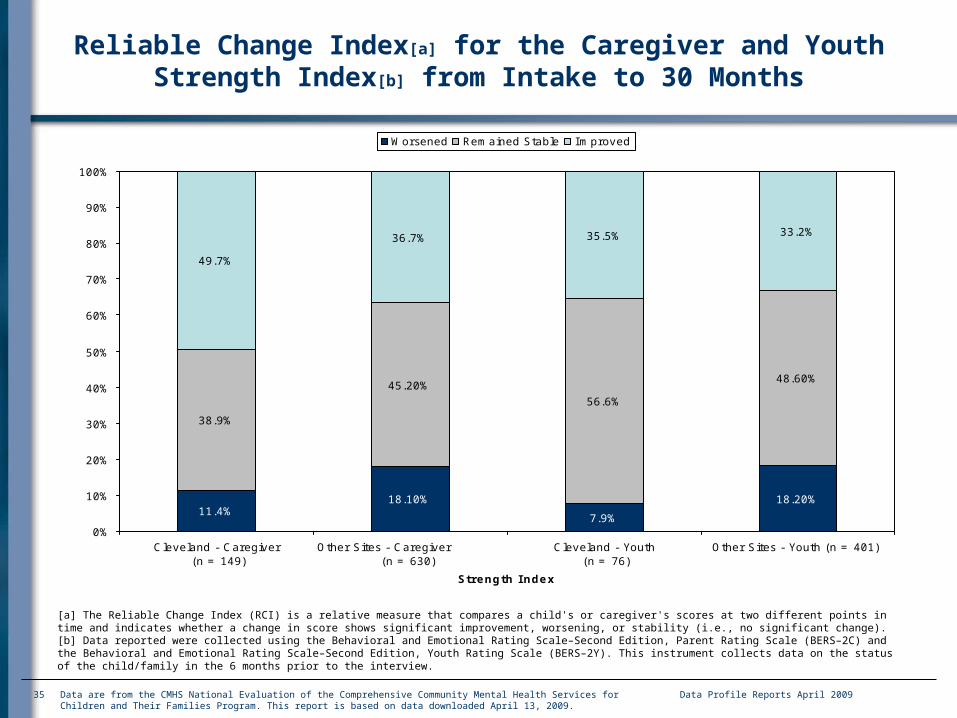
Reliable Change Index[a] for the Caregiver and Youth Strength Index[b] from Intake to 30 Months
11.4%18.10%
7.9%
18.20%
38.9%
45.20%56.6%
48.60%
49.7%
36.7% 35.5% 33.2%
0%
10%
20%
30%
40%
50%
60%
70%
80%
90%
100%
Cleveland - Caregiver (n = 149)
Other Sites - Caregiver (n = 630)
Cleveland - Youth (n = 76)
Other Sites - Youth (n = 401)
Strength Index
Worsened Remained Stable Improved
[a] The Reliable Change Index (RCI) is a relative measure that compares a child's or caregiver's scores at two different points in time and indicates whether a change in score shows significant improvement, worsening, or stability (i.e., no significant change).[b] Data reported were collected using the Behavioral and Emotional Rating Scale–Second Edition, Parent Rating Scale (BERS–2C) and the Behavioral and Emotional Rating Scale–Second Edition, Youth Rating Scale (BERS–2Y). This instrument collects data on the status of the child/family in the 6 months prior to the interview.

Data Profile Reports April 2009 Data are from the CMHS National Evaluation of the Comprehensive Community Mental Health Services for Children and Their Families Program. This report is based on data downloaded April 13, 2009.
36
Reliable Change Index[a] of Caregiver Strain[b] from Intake to 30 Months
6.7% 7.20% 4.9% 2.20% 4.9% 3.00%9.2% 7.50%
52.8% 52.70%
82.8% 85.40%
64.4%63.50%
46.6%45.10%
40.5% 40.0%
12.3% 12.4%
30.7% 33.5%
44.2% 47.4%
0%
10%
20%
30%
40%
50%
60%
70%
80%
90%
100%
Cleveland -Objective Strain
(n = 163)
Other Sites -Objective Strain
(n = 732)
Cleveland -Subjective
ExternalizedStrain
(n = 163)
Other Sites -Subjective
ExternalizedStrain
(n = 734)
Cleveland -Subjective
InternalizedStrain
(n = 163)
Other Sites -Subjective
InternalizedStrain (n = 734)
Cleveland -Global Strain
(n = 163)
Other Sites -Global Strain
(n = 730)
Subscale
Worsened Remained Stable Improved
[a] The Reliable Change Index (RCI) is a relative measure that compares a caregiver's scores at two different points in time and indicates whether a change in score shows significant improvement, worsening, or stability (i.e., no significant change).[b] Data reported were collected using the Caregiver Strain Questionnaire (CGSQ). This instrument collects data on the status of the caregiver in the 6 months prior to the interview.

Data Profile Reports April 2009 Data are from the CMHS National Evaluation of the Comprehensive Community Mental Health Services for Children and Their Families Program. This report is based on data downloaded April 13, 2009.
37
Child and Family Service Use[a] between Intake and 6 Months
•In Cleveland, caregiver reports at 6 months indicated that, on average, children received 5.1 types of services between intake and 6 months (n = 249).•In other sites, caregiver reports at 6 months indicated that, on average, children received 5.1 types of services between intake and 6 months (n = 2,568).
Support Services
20.4%
84.2%
5.7%
6.9%
0.0%
0.4%
36.6%
23.0%
12.5%
23.9%
7.3%
10.2%
42.0%
2.8%
9.1%
66.0%
5.4%
12.0%
2.6%
3.3%
26.9%
27.4%
14.9%
22.0%
10.5%
20.3%
34.6%
2.9%
0% 10% 20% 30% 40% 50% 60% 70% 80% 90% 100%
Family Preservation
Case Management
Day Treatment
Behavioral/Therapeutic Aide
Independent Living
Transition
Family Support
Recreation Activities
Afterschool Programs
Transportation
Respite
Flexible Funds
I nformal Support
Vocational Training
Cleveland Other Sites
[a] Data reported were collected using the Multi-Sector Service Contacts–Revised (MSSC–R) questionnaire. This instrument collects data on the services received by the child/family in the 6 months prior to the interview.
Cleveland (n ranges from 240 to 249)Other Sites (n ranges from 2,541 to 2,557)
Data Profile Reports April 2009 Data are from the CMHS National Evaluation of the Comprehensive Community Mental Health Services for Children and Their Families Program. This report is based on data downloaded April 13, 2009.
38
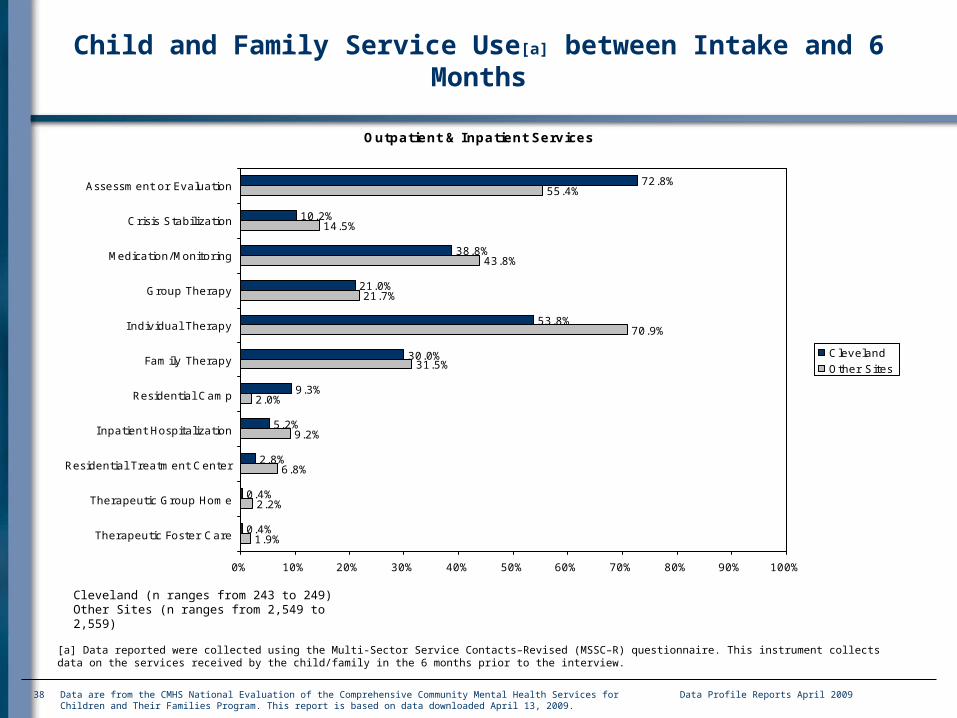
Child and Family Service Use[a] between Intake and 6 Months
Outpatient & Inpatient Services
72.8%
10.2%
38.8%
21.0%
53.8%
30.0%
9.3%
5.2%
2.8%
0.4%
0.4%
55.4%
14.5%
43.8%
21.7%
70.9%
31.5%
2.0%
9.2%
6.8%
2.2%
1.9%
0% 10% 20% 30% 40% 50% 60% 70% 80% 90% 100%
Assessment or Evaluation
Crisis Stabilization
Medication/Monitoring
Group Therapy
Individual Therapy
Family Therapy
Residential Camp
Inpatient Hospitalization
Residential Treatment Center
Therapeutic Group Home
Therapeutic Foster Care
ClevelandOther Sites
[a] Data reported were collected using the Multi-Sector Service Contacts–Revised (MSSC–R) questionnaire. This instrument collects data on the services received by the child/family in the 6 months prior to the interview.
Cleveland (n ranges from 243 to 249)Other Sites (n ranges from 2,549 to 2,559)
Data Profile Reports April 2009 Data are from the CMHS National Evaluation of the Comprehensive Community Mental Health Services for Children and Their Families Program. This report is based on data downloaded April 13, 2009.
39
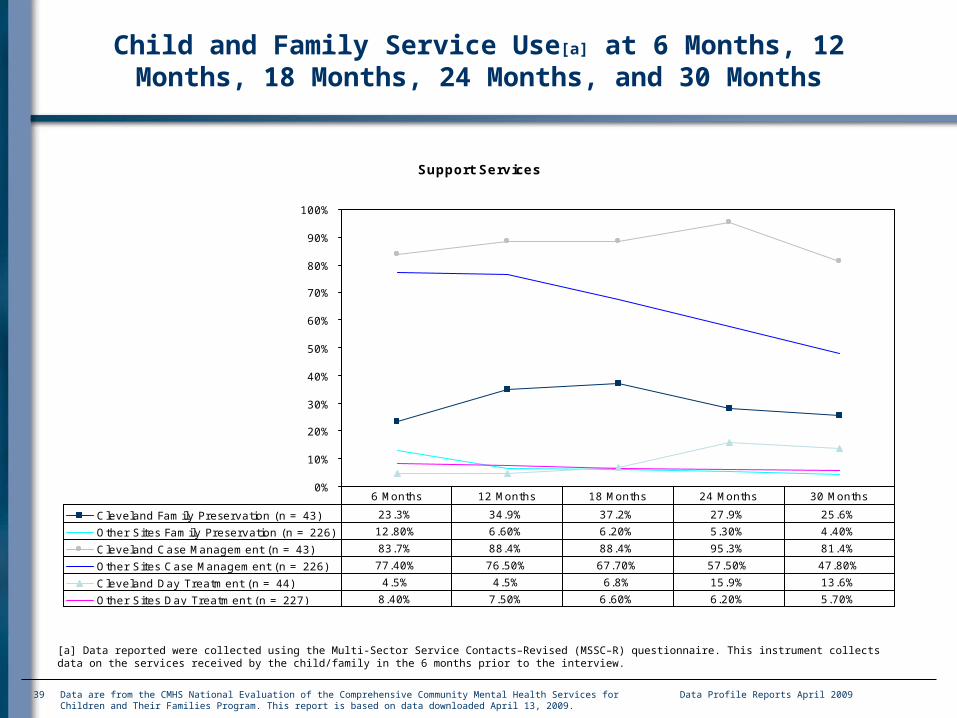
Child and Family Service Use[a] at 6 Months, 12 Months, 18 Months, 24 Months, and 30 Months
Support Services
0%
10%
20%
30%
40%
50%
60%
70%
80%
90%
100%
Cleveland Family Preservation (n = 43) 23.3% 34.9% 37.2% 27.9% 25.6%
Other Sites Family Preservation (n = 226) 12.80% 6.60% 6.20% 5.30% 4.40%
Cleveland Case Management (n = 43) 83.7% 88.4% 88.4% 95.3% 81.4%
Other Sites Case Management (n = 226) 77.40% 76.50% 67.70% 57.50% 47.80%
Cleveland Day Treatment (n = 44) 4.5% 4.5% 6.8% 15.9% 13.6%
Other Sites Day Treatment (n = 227) 8.40% 7.50% 6.60% 6.20% 5.70%
6 Months 12 Months 18 Months 24 Months 30 Months
[a] Data reported were collected using the Multi-Sector Service Contacts–Revised (MSSC–R) questionnaire. This instrument collects data on the services received by the child/family in the 6 months prior to the interview.

Data Profile Reports April 2009 Data are from the CMHS National Evaluation of the Comprehensive Community Mental Health Services for Children and Their Families Program. This report is based on data downloaded April 13, 2009.
40
Child and Family Service Use[a] at 6 Months, 12 Months, 18 Months, 24 Months, and 30 Months
Support Services
0%
10%
20%
30%
40%
50%
60%
70%
80%
90%
100%
Cleveland Behavioral/Therapeutic Aide (n= 42)
11.9% 4.8% 4.8% 9.5% 7.1%
Other Sites Behavioral/Therapeutic Aide(n = 225)
15.60% 14.20% 8.90% 10.70% 5.80%
Cleveland I ndependent Living (n = 44) 0.0% 0.0% 0.0% 4.5% 2.3%
Other Sites I ndependent Living (n = 222) 1.80% 3.20% 2.30% 4.50% 4.10%
Cleveland Transition (n = 43) 0.0% 0.0% 0.0% 0.0% 0.0%
Other Sites Transition (n = 221) 1.80% 1.80% 2.30% 1.80% 2.30%
Cleveland Family Support (n = 41) 46.3% 48.8% 43.9% 36.6% 31.7%
Other Sites Family Support (n = 220) 40.50% 33.20% 33.20% 21.40% 17.30%
6 Months 12 Months 18 Months 24 Months 30 Months
[a] Data reported were collected using the Multi-Sector Service Contacts–Revised (MSSC–R) questionnaire. This instrument collects data on the services received by the child/family in the 6 months prior to the interview.
Data Profile Reports April 2009 Data are from the CMHS National Evaluation of the Comprehensive Community Mental Health Services for Children and Their Families Program. This report is based on data downloaded April 13, 2009.
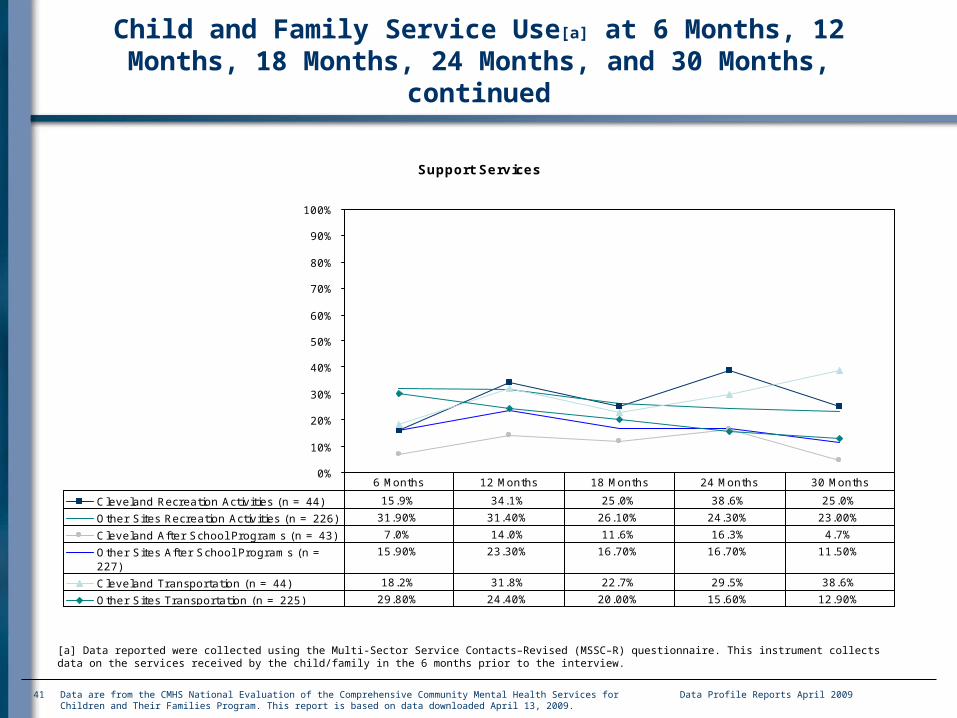
41
Child and Family Service Use[a] at 6 Months, 12 Months, 18 Months, 24 Months, and 30 Months, continued
Support Services
0%
10%
20%
30%
40%
50%
60%
70%
80%
90%
100%
Cleveland Recreation Activities (n = 44) 15.9% 34.1% 25.0% 38.6% 25.0%
Other Sites Recreation Activities (n = 226) 31.90% 31.40% 26.10% 24.30% 23.00%
Cleveland After School Programs (n = 43) 7.0% 14.0% 11.6% 16.3% 4.7%
Other Sites After School Programs (n =227)
15.90% 23.30% 16.70% 16.70% 11.50%
Cleveland Transportation (n = 44) 18.2% 31.8% 22.7% 29.5% 38.6%
Other Sites Transportation (n = 225) 29.80% 24.40% 20.00% 15.60% 12.90%
6 Months 12 Months 18 Months 24 Months 30 Months
[a] Data reported were collected using the Multi-Sector Service Contacts–Revised (MSSC–R) questionnaire. This instrument collects data on the services received by the child/family in the 6 months prior to the interview.

Data Profile Reports April 2009 Data are from the CMHS National Evaluation of the Comprehensive Community Mental Health Services for Children and Their Families Program. This report is based on data downloaded April 13, 2009.
42
Child and Family Service Use[a] at 6 Months, 12 Months, 18 Months, 24 Months, and 30 Months, continued
Support Services
0%
10%
20%
30%
40%
50%
60%
70%
80%
90%
100%
Cleveland Respite (n = 43) 4.7% 14.0% 11.6% 14.0% 11.6%
Other Sites Respite (n = 222) 22.10% 20.30% 18.90% 15.80% 9.50%
Cleveland Flexible Funds (n = 41) 7.3% 19.5% 14.6% 14.6% 9.8%
Other Sites Flexible Funds (n = 227) 23.30% 28.60% 20.30% 17.60% 10.60%
Cleveland I nformal Support (n = 43) 41.9% 34.9% 39.5% 34.9% 37.2%
Other Sites I nformal Support (n = 226) 39.40% 43.80% 39.40% 37.20% 35.00%
Cleveland Vocational Training (n = 44) 2.3% 4.5% 4.5% 4.5% 2.3%
Other Sites Vocational Training (n = 221) 5.00% 5.00% 6.80% 6.30% 5.40%
6 Months 12 Months 18 Months 24 Months 30 Months
[a] Data reported were collected using the Multi-Sector Service Contacts–Revised (MSSC–R) questionnaire. This instrument collects data on the services received by the child/family in the 6 months prior to the interview.

Data Profile Reports April 2009 Data are from the CMHS National Evaluation of the Comprehensive Community Mental Health Services for Children and Their Families Program. This report is based on data downloaded April 13, 2009.
43
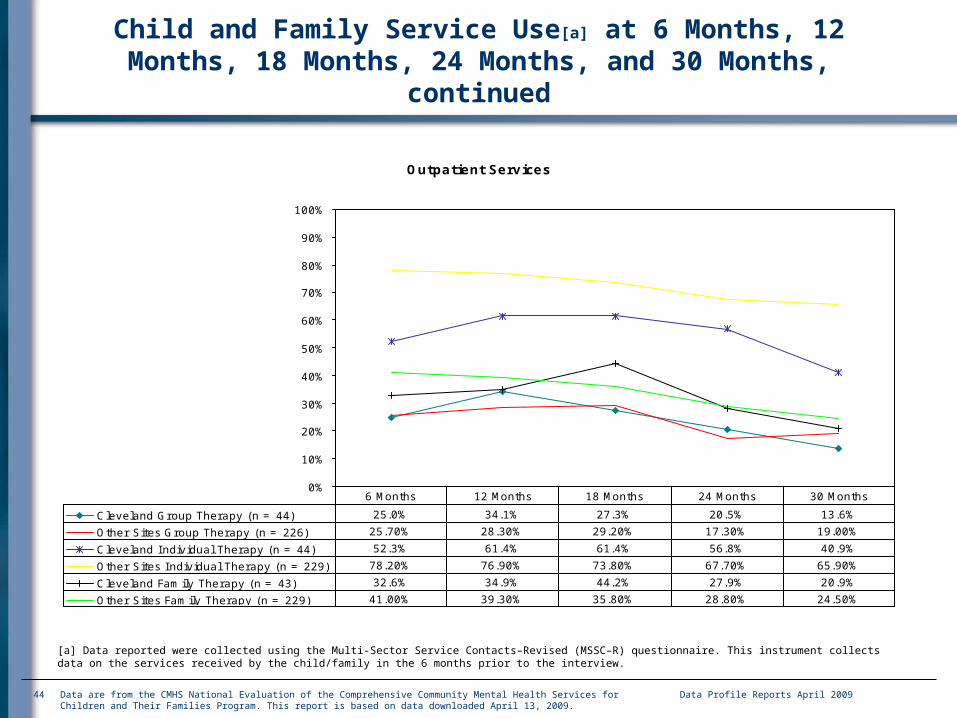
Child and Family Service Use[a] at 6 Months, 12 Months, 18 Months, 24 Months, and 30 Months, continued
Outpatient Services
0%
10%
20%
30%
40%
50%
60%
70%
80%
90%
100%
Cleveland Assessment or Evaluation (n =44)
88.6% 79.5% 61.4% 61.4% 56.8%
Other Sites Assessment or Evaluation (n =218
63.80% 51.40% 47.70% 43.10% 33.90%
Cleveland Crisis Stabilization (n = 43) 7.0% 9.3% 14.0% 14.0% 11.6%
Other Sites Crisis Stabilization (n = 226) 22.10% 10.20% 13.30% 10.20% 9.70%
Cleveland Medication/Monitoring (n = 44) 38.6% 31.8% 40.9% 40.9% 34.1%
Other Sites Medication/Monitoring (n =227)
66.50% 63.40% 64.30% 63.00% 63.40%
6 Months 12 Months 18 Months 24 Months 30 Months
[a] Data reported were collected using the Multi-Sector Service Contacts–Revised (MSSC–R) questionnaire. This instrument collects data on the services received by the child/family in the 6 months prior to the interview.
Data Profile Reports April 2009 Data are from the CMHS National Evaluation of the Comprehensive Community Mental Health Services for Children and Their Families Program. This report is based on data downloaded April 13, 2009.
44
Child and Family Service Use[a] at 6 Months, 12 Months, 18 Months, 24 Months, and 30 Months, continued
Outpatient Services
0%
10%
20%
30%
40%
50%
60%
70%
80%
90%
100%
Cleveland Group Therapy (n = 44) 25.0% 34.1% 27.3% 20.5% 13.6%
Other Sites Group Therapy (n = 226) 25.70% 28.30% 29.20% 17.30% 19.00%
Cleveland I ndividual Therapy (n = 44) 52.3% 61.4% 61.4% 56.8% 40.9%
Other Sites I ndividual Therapy (n = 229) 78.20% 76.90% 73.80% 67.70% 65.90%
Cleveland Family Therapy (n = 43) 32.6% 34.9% 44.2% 27.9% 20.9%
Other Sites Family Therapy (n = 229) 41.00% 39.30% 35.80% 28.80% 24.50%
6 Months 12 Months 18 Months 24 Months 30 Months
[a] Data reported were collected using the Multi-Sector Service Contacts–Revised (MSSC–R) questionnaire. This instrument collects data on the services received by the child/family in the 6 months prior to the interview.

Data are from the CMHS National Evaluation of the Comprehensive Community Mental Health Services for Children and Their Families Program. This report is based on data downloaded April 13, 2009.
45
Child and Family Service Use[a] at 6 Months, 12 Months, 18 Months, 24 Months, and 30 Months, continued
Inpatient Services
0%
10%
20%
30%
40%
50%
60%
70%
80%
90%
100%
Cleveland Residential Camp (n = 44) 6.8% 9.1% 9.1% 4.5% 4.5%
Other Sites Residential Camp (n = 226) 2.70% 0.90% 1.30% 1.30% 1.30%
Cleveland I npatient Hospitalization (n =44)
6.8% 4.5% 2.3% 2.3% 4.5%
Other Sites I npatient Hospitalization (n =227)
16.70% 10.60% 9.70% 5.30% 5.30%
Cleveland Residential Treatment Center(n = 44)
2.3% 4.5% 4.5% 6.8% 6.8%
Other Sites Residential Treatment Center(n = 226)
8.80% 7.50% 8.40% 6.20% 7.10%
Cleveland Therapeutic Group Home (n =44)
0.0% 0.0% 0.0% 2.3% 2.3%
6 Months 12 Months 18 Months 24 Months 30 Months
[a] Data reported were collected using the Multi-Sector Service Contacts–Revised (MSSC–R) questionnaire. This instrument collects data on the services received by the child/family in the 6 months prior to the interview.
Data Profile Reports April 2009
Data Profile Reports April 2009 Data are from the CMHS National Evaluation of the Comprehensive Community Mental Health Services for Children and Their Families Program. This report is based on data downloaded April 13, 2009.
46
Disclaimer
The views expressed in written conference materials or publications and by speakers and moderators at HHS-sponsored conferences, do not necessarily reflect the official policies of the Department of Health and Human Services, nor does mention of trade names, commercial practices, or organizations imply endorsement by the U.S. Government.

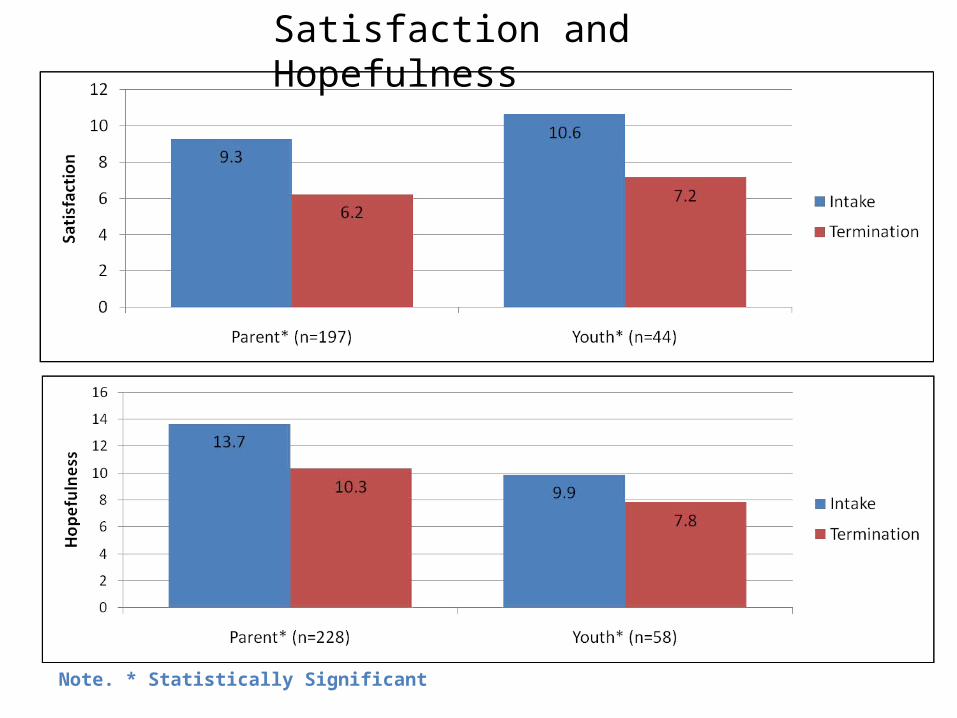
Note. * Statistically Significant
Problem Severity and Functioning

Reliable Improvement
Partial Improvement
No Reliable Change
Partial Deterioration
Reliable Deterioration
PEPBench-mark* PEP
Bench-mark* PEP
Bench-mark* PEP
Bench-mark* PEP
Bench-mark*
Youth
Problem Severity(n=88) 64% 44% 13% 8% 15% 32% 2% 6% 7% 10%
Functioning(n=86) 57% 42% 13% 13% 17% 27% 5% 6% 8% 13%
Parent
Problem Severity(n=265) 66% 49% 12% 8% 11% 26% 4% 6% 6% 11%
Functioning(n=261) 62% 48% 8% 10% 14% 21% 5% 6% 11% 14%
Worker
Problem Severity(n=396) 70% 44% 10% 9% 10% 31% 5% 6% 5% 10%
Functioning(n=394) 62% 38% 10% 12% 12% 30% 3% 7% 13% 14%
* Large County Results 2007 - Large counties included in the analysis are those over 300,000 which include Franklin, Lucas, Cuyahoga, Hamilton, Summit, Lorain, Stark, Montgomery and Butler.
Reliable Change in Problem Severity and Functioning from Initial Assessment to Termination
Note. * Statistically Significant
Satisfaction and Hopefulness
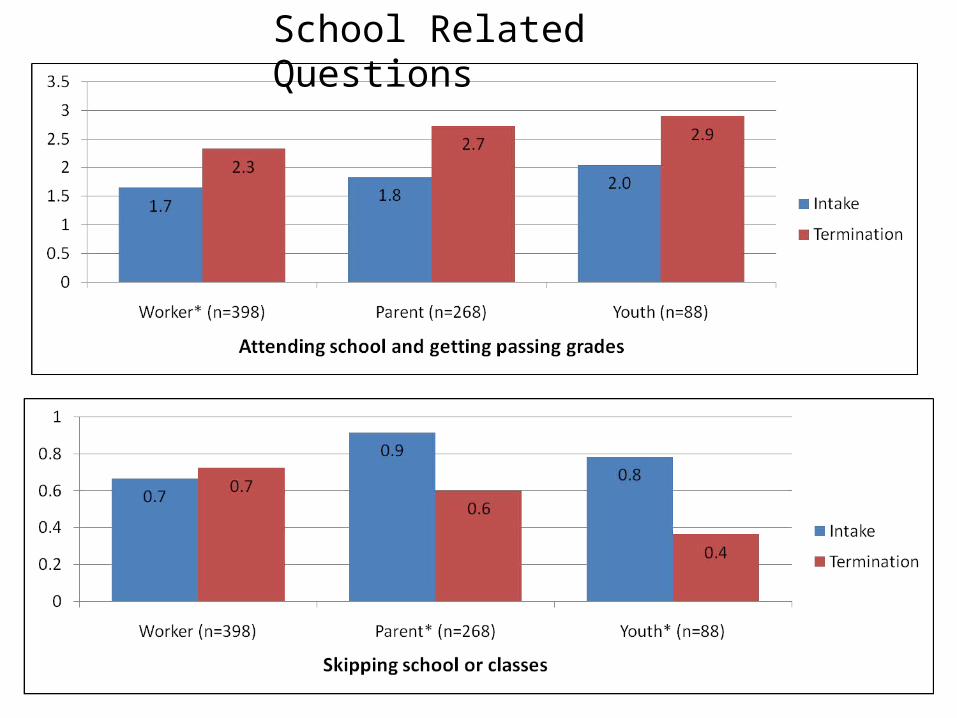
School Related Questions

Family Related Questions