CME Commodity Products - Futures Broker - Trading Futures · PDF fileCME Dairy Futures and...
36
An Introduction to Trading CME Dairy Futures and Options CME Commodity Products
-
Upload
trinhthien -
Category
Documents
-
view
230 -
download
1
Transcript of CME Commodity Products - Futures Broker - Trading Futures · PDF fileCME Dairy Futures and...

An Introduction to TradingCME Dairy Futures and Options
CME Commodity Products

Global Leadership in the Financial Marketplace
CME is the largest and most diverse financial exchange in the world for trading
futures and options – handling nearly 800 million contracts worth more than
$460 trillion in a single year. Founded in 1898, we serve the risk-management
needs of customers around the globe by offering the widest range of benchmark
financial products available on any exchange, traded via our CME Globex
electronic trading platform and on our trading floors. Our innovative products
cover major market segments – including commodities, interest rates, equities,
foreign exchange and alternative investment products – and improve the way
these markets work for customers everywhere. In addition, our clearing house
matches and settles all trades and guarantees the creditworthiness of every
transaction that takes place in our markets.
CME Commodity Products
CME agricultural commodity products help farmers and agribusinesses manage
the constant price risks they face, enabling them to lock in profits, enhance
business planning and more effectively serve their markets. Commodity-related
businesses that use CME Commodity products to support and strengthen their
operations are able to provide products to their customers at better prices.

Futures trading is not suitable for all investors, and involves the risk of loss. Futures are a leveraged investment, and because onlya percentage of a contract’s value is required to trade, it’s possible to lose more than the amount of money you’ve deposited fora futures position. Therefore, you should only use funds that you can afford to lose without affecting your lifestyle. And only aportion of those funds should be devoted to any one trade because you can’t expect to profit on every trade.
All references to options in this brochure refer to options on futures
The Globe Logo, Globex® and CME® are trademarks of CME. All other trademarks are the property of their respective owners. The information within this brochure
has been compiled by CME for general purposes only. CME assumes no responsibility for any errors or omissions. Additionally, all examples in this brochure are
hypothetical situations, used for explanation purposes only, and should not be considered investment advice or the results of actual market experience. All matters
pertaining to rules and specifications herein are made subject to and are superseded by official CME rules. Current CME rules should be consulted in all cases
concerning contract specifications.
Copyright © 2005 CME. All rights reserved.

1An Introduction to Trading CME Dairy Futures and Options
PAGE
INTRODUCTION 2
CME DAIRY PRODUCT FUTURES AND OPTIONS 3
ABOUT THE DAIRY INDUSTRY 5
TRADING CME DAIRY FUTURES 14
What Are CME Dairy Futures Contracts? 14
Hedging with CME Dairy Futures 15
Trading Examples 16
TRADING OPTIONS ON CME DAIRY FUTURES 18
What Are Options on Futures? 18
Options as Price Insurance 18
Trading Examples 20
KEY DAIRY REPORTS 22
CONTRACT SPECIFICATIONS 25
CME Milk (Class III) Futures and Options 25
CME Class IV Milk Futures and Options 26
CME Butter Futures and Options 27
CME Cash-Settled Butter Futures and Options 28
CME Nonfat Dry Milk Futures and Options 29
Electronic Trading and CME Dairy Futures 31
Fully Integrated Clearing 31
GETTING STARTED 32
Listing of CME Commodity Products 32
Table of Contents

2 cme.com
Dairy producers and manufacturers today face many chal-
lenges in operations and in marketing. Dairy prices fluctu-
ate from month-to-month and make it difficult to ensure
meeting breakeven costs. CME dairy futures and options,
however, serve as useful tools for managing the risks
inherent to the dairy industry. Options on CME dairy
futures, in particular, allow producers and manufacturers
to limit their price risks, while leaving open the door for
profit potential. These markets also attract traders who are
willing to accept the risk, in return for potential profits,
that dairy professionals seek to transfer.
What Are Futures and Options?
Futures contracts are standardized, legally binding agree-
ments to buy or sell a specific product or financial instru-
ment in the future. The buyer and seller of a futures con-
tract agree on a price today for a product to be delivered
or settled in cash at a future date. Each contract specifies
the quantity, quality and the time and location of delivery
and payment.
The value of a futures contract is derived from an underly-
ing financial measure or market, such as commodity
prices, equity index levels, foreign exchange rates or inter-
est rates – hence the term derivatives. As the value of the
underlying measure or market changes, the value of the
futures contract based on that measure or market also
changes. Institutions and individuals that face financial risk
based on the movement of the underlying measure or
market can buy or sell futures that will change in value to
offset that financial risk. Such transactions are known as
hedging. Institutions and individuals also buy and sell
futures hoping to profit from price changes. These transac-
tions are considered speculation.
CME also offers investors options on futures. Options can
be thought of as insurance policies. The option buyer pays
a price for the right – but not the obligation – to buy or
sell a futures contract within a stated period of time at a
predetermined price. The combination of options and
futures – both risk-management tools – can give market
participants the leverage of futures and the more limited
risk of options. Options provide the opportunity to limit
losses while maintaining the possibility of profiting from
favorable changes in the futures price.
Introduction

3An Introduction to Trading CME Dairy Futures and Options
CME offers five different dairy product futures and options:
two on different types of milk, two different butter contracts,
and a nonfat dry milk contract.
CME Milk Class III
Milk Class III is also known by the industry as cheese milk.
The CME Milk Class III contract represents milk used
mainly in the manufacturing of cheddar cheese. All factors
affecting milk production and cheese cash prices influence
the price direction of this contract. The CME Milk Class III
contract is quite “user-friendly” to trade and lists contracts
out 24 months. Hedgers and speculators watch factors
affecting milk production and the cheese cash market for
pricing indicators.
CME Milk Class IV
Milk Class IV is used to produce butter and nonfat dry
milk. All factors affecting milk production along with
butter and nonfat dry milk cash prices influence the price
direction of the CME Milk Class IV contract. CME Milk
Class IV contracts were introduced in 2000 in response to
industry needs to hedge milk classified for usage in butter
production and dried milk products. The contract is a
“mirror” image of the CME Milk contract trading specifi-
cations. But instead of focusing on cash cheese for market
price indicators, hedgers and traders are attuned to factors
affecting milk production and the Cash Butter market.
CME Nonfat Dry Milk
Nonfat Dry Milk is a product of the manufacturing of
butter; it can be stored, used in various feed and food
sources and/or reconstituted into milk. CME Nonfat Dry
Milk futures contracts broaden the scope for dairy industry
trading as the product readily trades worldwide.
CME Butter
CME Butter futures reflect cash market supply, demand
and cold storage stocks fundamental information, and
offer spread trade opportunities as butter is placed in
storage for holiday (seasonal) demand period. CME Butter
futures contracts offer both hedgers and traders a storable
product to trade. Storable contracts create spreading
opportunities between deliverable contract months. As
the supply and demand for the cash product changes,
the need arises for the butter industry to store product
or take product out of storage. This movement creates
pricing relationship differences between the nearest
contract month and the most distant ones.
CME Cash-Settled Butter
Another butter contract – CME Cash-Settled Butter futures
– is an electronically traded contract based on 20,000
pounds Grade AA butter, one-half the contract size of the
pit-traded CME Butter futures, which has a delivery trade
unit of 40,000 pounds. This contract was designed to meet
the needs of industry participants who the prefer the fea-
tures of cash settlement over the current physical delivery
contract. Settlement is based on the first-released USDA
monthly weighted average price of butter in the U.S. This
contract provides producers a liquid, cash-settled hedging
mechanism, while also enabling buyers in this industry to
hedge their exposure to price fluctuations in butterfat.
Modern Dairy Markets LLC serves as market maker for
this contract, helps ensure liquidity, and maintains a contin-
uous, transparent and competitive market.
CME Dairy Product Futures and Options

4 cme.com
Large and Complex
The U.S. dairy business is a $35 billion business (at whole-
sale) with extreme volatility in pricing. Cows produce a
perishable product – milk – 2-3 times per day, 365 days
per year. From there, dairy manufacturers turn this raw
commodity into finished goods for thousands of uses,
from drinking milk that is consumed within a few weeks,
to dried milk powder that may be stored for several years.
Along the marketing chain, the milk will change hands
many times. Most dairy farmers belong to (and own equity
in) a cooperative, which stands ready to buy the farmers’
milk whether the market is long or short. Other farmers
ship directly to proprietary dairy processors. Most coopera-
tives are also manufacturers, processing the raw milk into
drinking milk, cheese, butter and milk powder that is sold
to users of dairy products such as distributors, retailers,
foodservice operators and food processors. Co-ops also
serve an important market-balancing function by selling
raw milk to proprietary processors and manufacturers, and
manufacturing storable products (butter, milk powder)
when milk supplies are excessive for current market needs.
Heavily Regulated
The dairy industry is one of the most heavily regulated
segments in all of agriculture. Through its support price
program, the U.S. government agrees to buy dairy com-
modities at a minimum level (cwt. basis) – $1.13 for block
cheese, $1.10 for barrel cheese, $1.05 for butter, $0.80
for non-fortified nonfat dry milk and $0.81 for fortified
nonfat dry milk. This purchase level acts as a floor on dairy
prices when supplies get excessive. However, the commer-
cial dairy markets, such as the CME cash butter, cheese
and nonfat dry milk markets, can and have traded below
the support prices. For example, during February 2003
CME block cheese traded as low as $0.9925.
The availability of imports tends to act as a practical ceiling
on dairy prices. Quotas and tariffs are in place to prevent
massive volumes of imports from flooding the U.S. market,
but when U.S. prices move too far out of line from world
prices, imports begin to enter the country and act as a
damper on U.S. prices, especially when supplies get too
short.
Highly Sensitive to Changes in Supply and Demand
The dairy markets are unique in that they react very
dramatically to small changes in supply and demand.
Reductions in supply of 1% or less can send prices soaring
50% or more within a few months. Increases of 1% or
less can send prices reeling by the same magnitude.
Increasing Volatility, Decreasing Price Supports
Since the mid-1980s, the government has steadily
decreased its support price, leading to greater volatility
in the dairy markets. In the last 4 years, the Class III milk
price has averaged $12.01, with a high month of $20.55
and a low month of $8.57.
Since 2000, the price has fallen between $11.00 and
$13.00 just 10 times in 56 months. Twenty-eight months
it has been above $13.00; 30 times it has been below
$11.00 (see Milk Class III price chart).
About the Dairy Industry

5An Introduction to Trading CME Dairy Futures and Options
23.00
19.00
15.00
11.00
7.00
23.00
19.00
15.00
11.00
7.00
Jan
-00
Jun
-00
Nov-
00
Apr-
01
Sep
-01
Feb-0
2
Jul-0
2
Dec
-02
May
-03
Oct
-03
Mar
-04
Aug
-04
Jan
-05
Jun
-05
Class III Milk Prices
($/c
wt.
)
16.50
14.50
12.50
10.50
8.50
16.50
14.50
12.50
10.50
8.50
Class IV Milk Prices
($/c
wt.
)
Jan-
00
May
-00
Sep-
00
Jan-
01
May
-01
Sep-
01
Jan-
02
May
-02
Sep-
02
Jan-
03
May
-03
Sep-
03
Jan-
04
May
-04
Sep-
04
Jan-
05
May
-05
Sep-
05The Class IV price has averaged $12.03 since January 2000 with a high month of $15.59
and a low month of $9.73 (see Milk Class IV price chart).

6 cme.com
Highly Sensitive to Changes in Supply and Demand
The dairy markets are unique in that they react very
dramatically to small changes in supply and demand.
Reductions in supply of 1% or less can send prices soaring
50% or more within a few months. Increases of 1% or
less can send prices reeling by the same magnitude.
Increasing Volatility, Decreasing Price Supports
Since the mid-1980s, the government has steadily
decreased its support price, leading to greater volatility in
the dairy markets. In the last 14 years, the Class III milk
price has averaged $11.92, with a high month of $17.34
and a low month of $8.57.
Since 1996, the price has fallen between $11.00 and
$13.00 just 27 times in 91 months. Twenty-seven months
it’s been above $13.00; 37 times it’s been below $11.00
(see Milk Class III price chart).
Growing Appeal of Dairy Futures
Against this backdrop, activity in dairy futures has increased
significantly in the last couple years. In 2004, more than
1379 CME Class III Milk futures contracts a day were traded.
70.000
60.000
50.000
40.000
30.000
20.000
10.000
0
Monthly Class III Milk Open Interest (Futures and Options)
Jan-
99
Aug
-99
May
-00
Feb-
01
Nov
-01
Aug
-02
May
-03
Dec
-03
Feb-
04
Sep-
04
Jun-
05

7An Introduction to Trading CME Dairy Futures and Options
Milk and Product Production TrendsAttrition and Advances
The primary means for assessing supply conditions in
the dairy industry is through milk production. The U.S.
dairy industry is a growth industry with an average annual
increase in production of 1.0% since the 1980s (see U.S.
Milk Production chart). U.S. milk production totaled
approximately 1710 billion pounds in 2004. Periodic
changes in milk production are largely a function of price
and “Mother Nature” factors such as weather and feed
quality, though occasionally, such as with the “Whole
Herd Buyout” of 1984, production changes can be the
result of government intervention.
The historical 1% gain in milk production each year has
been driven by a 2% increase in milk per cow and a 1%
decline in cow numbers.
177,000
167,000
157,000
147,000
137,000
127,000
U.S. Milk Production
(Bill
ion
lbs.
)
177,000
167,000
157,000
147,000
137,000
127,000
1980
1981
1982
1983
1984
1985
1986
1987
1988
1989
1990
1991
1992
1993
1994
1995
1996
1997
1998
1999
2000
2001
2002
2003
2004

8 cme.com
Advances in output per cow are attributed to genetics,
feeding and cow comfort. Changes in milk per cow are
largely due to the attrition of lower producing herds,
weather conditions and changes in feed and forage quality
due to price or availability. Milk production per cow spans
from a low in Louisiana of 11,620 lbs. to a high of 23,486
lbs. in Arizona. Typically states west of the Rockies post
herd averages over 20,000 lbs. annually and increase at a
rate closer to 1% rather than 2%. As a result, it is uncer-
tain if long-term milk production per cow will continue to
increase at a rate of 2% annually, since the national aver-
age rises through attrition of lower producing herds as
well as increased production per cow. (see Annual U.S.
Milk Production Per Cow).
The U.S. dairy herd currently totals about 9.1 million head.
Herd numbers declined steadily from the mid-1980s to late
1990s due to structural changes in the industry. However,
in the past five years the rate of decline in the U.S. dairy
11,500
11,000
10,500
10,000
9,500
9,000
U.S. Milk Cows(M
illio
n H
ead)
1980
1982
1984
1986
1988
1990
1992
1994
1996
1998
2000
2002
2004
19,500
18,500
17,500
16,500
15,500
14,500
13,500
12,500
11,500
Annual U.S. Milk Production per Cow (lbs.)
1980
1981
1982
1983
1984
1985
1986
1987
1988
1989
1990
1991
1992
1993
1994
1995
1996
1997
1998
1999
2000
2001
2002
2003
2004
herd has dwindled to almost nothing (see U. S. Milk
Cows chart). This perhaps is an indication that the dairy
herd has reached a balance to support demand for young
stock in our herds.

9An Introduction to Trading CME Dairy Futures and Options
Seasonality of Milk ProductionHigher Production Means Lower Butterfat
Milk production variability is due in part to the seasonality
of the milk supply. Historically, June was the month with
greatest milk production. However, as the result of grow-
ing milk supplies in the West, which has an earlier peak,
May is now the month with the greatest milk production
(see Seasonality of Milk Production chart).
The term “flush” is used to describe the seasonal period of
highest milk output per cow. This usually coincides with
spring after cows produce a calf and enter the peak of
their milk production cycle. Other factors contributing to
the “flush” include genetics, feed quantity and quality and
climate conditions.
As milk production increases during the flush season,
however, the percentages of butterfat and protein compo-
nents in the milk decrease. The annual average butterfat
content of milk is 3.77%. During the course of the year it
will range from a high of 3.80% in November and January
to a low of 3.56% in June and July (see “Seasonality of
Butterfat” chart).
1.06
1.04
1.02
1.00
.98
.96
.94
Seasonality of Milk Production (20 Major States – Indexed)
J F M A M J J A S O N D
3.8
3.7
3.6
3.5
Seasonality of Butterfat (By Federal Milk Order Marketing Area)
perc
ent
J F M A M J J A S O N D
10 cme.com
Schools vs. Manufacturers
About 5% of fluid milk is consumed through schools, so
raw milk supplies fluctuate throughout the year based on
the school calendar. In late May, when schools are winding
down for the year, school milk lines shut down and more
milk is available for manufacturing. In mid-August, fluid
processors begin refilling the pipeline for school milk, leav-
ing less milk available for manufacturing. To a smaller
degree, these fluctuations occur around the spring and
winter school breaks as well.
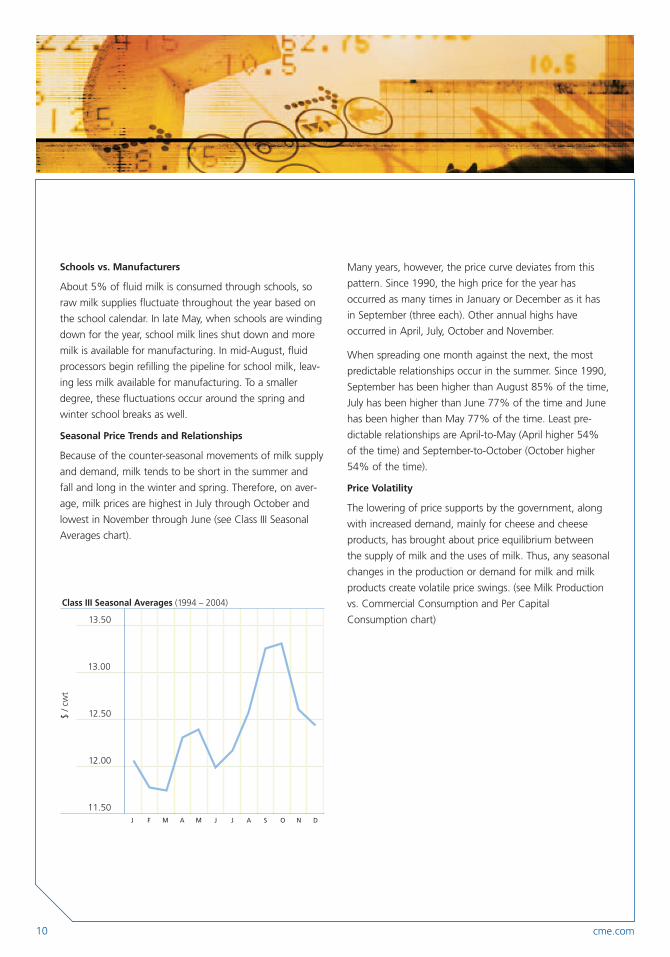
Seasonal Price Trends and Relationships
Because of the counter-seasonal movements of milk supply
and demand, milk tends to be short in the summer and
fall and long in the winter and spring. Therefore, on aver-
age, milk prices are highest in July through October and
lowest in November through June (see Class III Seasonal
Averages chart).
Many years, however, the price curve deviates from this
pattern. Since 1990, the high price for the year has
occurred as many times in January or December as it has
in September (three each). Other annual highs have
occurred in April, July, October and November.
When spreading one month against the next, the most
predictable relationships occur in the summer. Since 1990,
September has been higher than August 85% of the time,
July has been higher than June 77% of the time and June
has been higher than May 77% of the time. Least pre-
dictable relationships are April-to-May (April higher 54%
of the time) and September-to-October (October higher
54% of the time).
Price Volatility
The lowering of price supports by the government, along
with increased demand, mainly for cheese and cheese
products, has brought about price equilibrium between
the supply of milk and the uses of milk. Thus, any seasonal
changes in the production or demand for milk and milk
products create volatile price swings. (see Milk Production
vs. Commercial Consumption and Per Capital
Consumption chart)13.50
13.00
12.50
12.00
11.50
Class III Seasonal Averages (1994 – 2004)
$ / c
wt
J F M A M J J A S O N D

11An Introduction to Trading CME Dairy Futures and Options
180
160
140
120
100
180
160
140
120
100
Milk Production vs. Commercial Consumption
Milk Production Commercial Consumption
Billi
on lb
s.
1980
1981
1982
1983
1984
1985
1986
1987
1988
1989
1990
1991
1992
1993
1994
1995
1996
1997
1998
1999
2000
2001
2002
2003
2004
4.0
3.5
3.0
2.5
2.0
1.5
0.5
0.0
Per-capita Consumption (1965 vs. 1980 vs. 2003)
Poun
ds, e
xcep
t flu
id m
ilk, w
hich
is in
gal
lons
Milk &Cream (gal)
Butter Amer.Cheese
Non-Amer.Cheese
TotalCheese
CottageCheese
IceCream
Low-fat Ice Cream
NFDM Whey
4.0
3.5
3.0
2.5
2.0
1.5
0.5
0.0
1965 1 980 2003
12 cme.com
Federal Milk Marketing Orders
The Federal Milk Marketing Orders were established in
1937 to provide “orderly” marketing conditions for inter-
state commerce, income parity for farmers, and to increase
bargaining power of farmers. About 70% of the U.S. milk
production is covered by the Federal Orders. California is
the only major milk producing region that is not in a
Federal Order. California, however, operates its own state
milk pricing plan that is similar to the Federal Orders.
Specifically the Federal Orders set the price of milk used in
the following classes:
» Class I – Fluid drinking milk
» Class II – Soft products, like yogurt and ice cream,
and dairy-based drinks
» Class III – Cheese, including cream cheese
» Class IV – Butter and dried milk powders
A dairy manufacturer that participates in the Federal Order
pays into a pool the announced class price (plus a compet-
itive premium usually) for the milk it converts into finished
dairy products. For example, a fluid milk processor who
also produces ice cream would pay the Class I milk price
and butterfat price used to produce a gallon of 2% milk. It
would pay the Class II price for milk and butterfat used to
produce ice cream.
Meanwhile a dairy farmer within the Federal Order
receives a market-average price or “blend price” based on
the way milk is used in that market. For example, in
Wisconsin, which is predominantly a cheese-production
state, a dairy farmer’s blend price typically consists of
about 20% of the Class I price, 2.5% of the Class II price,
75% of the Class III price and 2.5% of the Class IV price.
Classified Pricing
All class prices within the Federal Orders are calculated
from product price formulas.
The Class I price is determined based on the higher of
either the Class III or Class IV price using USDA surveyed
price data from the first two weeks of the month. This,
plus a Class I Differential, determines the Class I price
for the following month. The Class II price is the Class IV
price, plus $0.70 per cwt.
But the two key formulas are the Class III and Class IV
prices – the two prices traded at CME. Both prices are cal-
culated from a full month of USDA-surveyed price data
and published on the Friday before the fifth of the follow-
ing month. (If the fifth is a Friday, it is published on that
Friday.) In other words, the July Class III and IV prices were
calculated and published on Friday, August 1. CME Class III
and IV futures contracts settle to these USDA prices.
The Class III Price Formula
The Class III Price formula is determined from three com-
ponents: a butterfat price, a protein price and an other
solids price. These prices are derived from weighted aver-
ages of USDA surveyed cheese, butter and whey prices for
the month. The formulas are:
Butterfat Price = Round ((NASS Grade AA
Butter Price – $0.115) x 1.2, 4)
» $0.115 is the butter manufacturing cost.
» 1.2 equals the pounds of butter produced from
one pound of butterfat.
» 4 represents the number of decimal points the
price is rounded to.
13An Introduction to Trading CME Dairy Futures and Options
Protein Price = Round ((NASS Cheese Price – $0.165)
x 1.383 + (((NASS Cheese Price – $0.165) x 1.572) –
((BF x 0.9)) x 1.17, 4)
[Note: This is a two-part formula because the first multiplier – 1.383
– represents the contribution of protein to the cheese yield, while
the second multiplier – 1.572 – reflects the contribution of butterfat
to the cheese yield.]
» The NASS cheese price is the weighted average of
the block and barrel cheese prices for the month.
USDA adds 3.0¢ per lb. to the barrel cheese price
before calculating the weighted average. USDA does
this to avoid using a different make allowance for
both block and barrel cheese prices. Traditionally
the industry has recognized a 3.0¢/lb. discount to
produce barrel cheese. This is also reflected in the
USDA support prices for block and barrel cheese
at $1.1314 per lb. and $1.1014 per lb., respectively.
» $0.165 is the cheese manufacturing cost.
» The 1.383 and 1.572 reflect yield factors.
» 90% of the butterfat value is removed from the
protein value to reflect the whey cream that is not
used in cheese making.
Other Solids Price = ((NASS Whey Price – $0.159) x
1.03, 4)
The Class III Price = (3.5 x BF price) + ((3.1 x Protein
price) + (5.9 x Other Solids price)) x .965
» $0.159 is the whey manufacturing cost.
» If the NASS whey price is less than the manufacturing
allowance, the Other Solids Price can be negative.
» 1.03 is the yield factor.
The Class IV Price Formula
Nonfat Milk Solids Price per hundredweight =
Round((NASS NFDM Price – $0.14) x .99),4)) x 9,2)
» Butterfat Price =Round ((NASS Grade AA Butter
Price – .115) x 1.2, 4)
» The Class IV Price is reported at 3.5% BF
and 96.5% SNF
In the Nonfat Milk Solids Price:
» The make allowance is $0.14 per pound.
» 0.99 is a yield factor per pound.
» 9 is the yield factor of pounds of nonfat dry milk
powder produced from 100 pounds of skim milk.
Milk Pricing Outside of the Federal Orders
California is the only major milk producing region that
is not included in a Federal Milk Marketing Order. (Most
of Idaho’s milk is regulated in the Western Order.) The
milk price received by dairy farmers and paid by processors
in California is regulated by California’s Department
of Agriculture.
Milk pricing within California is similar to Federal Order
pricing. The major differences are California has five classes
of milk (Federal Orders have four) and California uses
CME spot block cheese and butter prices in its formulas
(Federal Orders use USDA NASS surveys).
Like the Federal Orders, California maintains separate
manufacturing milk price classes. Class 4b is the cheese-
milk price, and the Class 4a price is the butter-powder.
In 2003, California also added a whey value component
to its 4b price. In California, 44% of the milk goes into
cheese (Class 4b), 30% goes to butter/powder (Class 4a),
17% goes to drinking milk (Class I) and the balance is split
between soft dairy products and frozen dairy products.
Federal Orders are voted into existence by dairy operators
and cooperatives within a region. In theory, if a majority
of producers in California voted to be part of the Federal
Order system, one could be established.

14 cme.com
What Are CME Dairy Futures?
CME dairy futures are legally binding obligations to buy or
sell a specific amount of a specific dairy commodity – milk,
butter and nonfat dry milk – that meets set grades and
standards on some future date. All CME dairy futures
contracts require a fulfillment, or binding obligation, on
the part of the trader at some time before the contract
expires. Traders of a CME dairy contract may fulfill contract
obligations by offsetting in the futures market (entering an
opposite trade order) any time prior to contract expiration,
or by accepting an automatic offset at the appropriate
announced price on the date of the announcement.
CME dairy contracts offer easy entry into the dairy mar-
kets. The futures contracts trade each month, offering
both producers and processors a chance to lessen the
pricing impact of the monthly dairy price announcements.
The contracts can be offset at any time, or can be held
through contract expiration and be automatically offset
at the USDA announced price for Class III and IV Milk.
Buy low/sell high, or vice versa
As with all market transactions, the basic goal in trading
futures is to buy low and sell high so as to make a profit.
In futures, it is just as easy to initiate a trade by selling a
futures contract first as it is to buy first. Dairy producers
concerned about profits declining in the future can sell
dairy futures; while users and manufacturers of milk and
dairy products can protect against price increases by buy-
ing futures.
Some people trade CME dairy futures to speculate on
dairy prices, hoping to make a profit by being on the right
side of trades as prices go up or down. A speculator who
thinks prices will be going higher will buy – go long - dairy
futures. Speculators who think prices will be moving lower
will sell dairy futures. To close out or offset the initial trans-
actions, they will take the opposite positions – selling con-
tracts that they bought, or buying contracts that they sold.
Trading CME Dairy Futures
Type of Positions Price Advantage In: To Offset Position
Sell = Short Down Markets (Loses in up markets) Buy Back Contract
Buy = Long Up Markets(Loses in down markets) Sell Back Contract
Although it is risky, it is in a sense that simple. Let’s look at an example. What happens
if it is April and a trader either buys or sells a July CME Milk futures at $12.00
per hundredweight?
In April, a customer trades July CME Milk futures at $12/cwt
If July prices are Assuming the contract was Assuming the contract wasbought at $12 (to close: sell) sold at $12 (to close: buy)
$13 $1 profit $1 loss
$12 $0 $0
$11 $1 loss $1 profit

15An Introduction to Trading CME Dairy Futures and Options
Hedging with CME Dairy Futures
Hedgers use futures in a different way. While speculators
take the risk, hedgers in dairy futures are typically in
businesses related to buying or selling dairy commodities.
They use futures to lock in a known price for a dairy
commodity, hoping that profits or losses on their futures
positions will hopefully counteract their gains or losses
in the cash markets. Cash Futures
Owner of Inventory Seller of Contracts (Short)
» Risk in Down Markets » Gain in Down Markets
User of (Needs) Inventory Seller of Contracts (Short)
» Risk in Up Markets » Gain in Up Markets
NOTE: Even though the correlation between dairy futures prices and cash
prices is typically close enough to offer price protection; it is unlikely that
hedging will exactly offset cash price fluctuations. Knowing the relationship
of price moves between the cash dairy markets and futures markets helps
make hedging decisions more strategic and effective. The difference in
price between the cash and futures markets is called basis.

16 cme.com
Trading Examples
Short Hedge Examples (Zero Basis*)
Suppose it is April and a producer or milk cooperative
decides to protect a certain price level for milk to be sold
in July in the cash market. Since the cash price risk is in
down markets, the producer or cooperative decides to
sell milk futures.
Example: Sell 1 July Futures Contract at $13
If both futures and cash prices decline…
Cash Price + July Futures Futures Gain = Selling Price*
$13 $13 + $0 = $13
$12 $12 + $1 = $13
$11 $11 + $2 = $13
If both futures and cash prices increase…
Cash Price + July Futures Futures Gain = Selling Price*
$13 $13 – $0 = $13
$14 $14 – $1 = $13
$15 $15 – $2 = $13
In a falling market the lower cash selling price is offset by
the futures gain. In either case, the hedger’s goal is to
establish a selling price of $13 per hundredweight for milk.
*Commissions and basis not reflected in example.
The Long (Buy) Hedge
A long hedge can be used to offset the risk of price
increases until a customer is ready to procure milk. Thus, by
taking a long futures position (buying futures), a customer
can offset price risk by being short milk (needing milk).
Cash Futures
Need Milk (Short) Buyer of Contracts (Long)
» Price Risk in Up Markets » Gain in Up Markets
User of (Needs) Inventory Buyer of Contracts (Long)
» Risk in Up Markets » Gain in Up Markets
Long Hedge Examples (Zero Basis*)
In April a dairy firm decides to protect a certain price level
for milk to be bought in July in the cash market. Since the
price (cash) risk is in rising markets, the dairy firm decides
to buy milk futures.
Example: Buy 1 July Futures Contract at $13
If both futures and cash prices increase…
Cash Price + July Futures Futures Gain = Selling Price*
$13 $13 + $0 = $13
$14 $14 + $1 = $13
$15 $15 + $2 = $13
If both futures and cash prices decline…
Cash Price + July Futures Futures Gain = Selling Price*
$13 $13 – $0 = $13
$12 $12 – $1 = $13
$11 $11 – $2 = $13
In a rising market the higher cash purchase price is
offset by the futures gain. In either case, the hedger’s
goal is to establish a purchase price of $13 per
hundredweight for milk.
*Commissions and basis not reflected in example.

17An Introduction to Trading CME Dairy Futures and Options
How Futures Accounts Work
As with all futures trading, each open CME dairy futures
contract must be backed by a performance bond (margin)
account. During each trading session, each account is
“marked-to-the market” (the current or closing market
price of each contract) and money is transferred into or
out of each account accordingly. Customers may be asked
to post more performance bond funds if prices move too
far against their positions. If prices move in favor of a
customer, his or her account is also credited accordingly.
For example, assume there is a $1,000 performance bond
requirement and a maintenance margin of $800 for each
CME Milk contract. (Margins are subject to change;
customers need to check with their brokers.)
A customer who opens an account and deposits a $1,000
initial margin has an account balance of $1,000. If the
customer buys (goes long) a June CME Milk contract at
$12.00, and the price closes up one cent at $12.01, the
customer’s account balance increases to $1,020. On the
other hand, if the milk market closes down one cent at
$11.99 at the end of the day, the account balance
decreases to $980. Similarly, a trader selling (going short)
a June CME Milk contract at $12.00 would see a decrease
of $20 in his or her account balance if the contract closed
up one cent and an increase of $20 if the milk contract
month closed down one cent.
Margining a Futures Trade
Along with the initial performance bond requirements,
CME also sets a minimum maintenance performance bond
for each commodity. This level is set as a “trigger” point
for margin calls. In the above example (initial performance
bond $1,000 and maintenance of $800), a customer’s
account balance would have to drop $220 ($1,000 – $220
= $780) or (11 cents x $20) to have an account balance
below $800 and be subject to a margin call. The customer
is obligated to meet the call to re-establish the account
balance to $1,000, or be subject to automatic removal
from the market.
Commodity Brokers
All futures contracts are traded the same way. Both
hedgers and speculators need to establish a
futures/options account with a commodities brokerage
firm and comply with the firm’s contract performance
bond requirements. CME dairy futures are traded through
registered commodity brokers, although the CME Cash-
Settled Butter contract can be traded electronically directly
by customers who have accounts with futures brokerage
firms and are connected to the CME Globex platform.
Brokers charge a commission on each transaction and
there is also a fee for trading electronically. Brokers often
advise their customers on which market orders to use and
help provide both fundamental and technical information
on market price outlook. Customers who need a futures
broker can go to the CME Web site at www.cme.com or
ask others for recommendations.

18 cme.com
Trading Options on CME Dairy Futures
What Are Options on Futures?
An option is the right, but not the obligation, to buy or
sell a futures contract at a specific price within a specific
expiration date. Trading options on futures is similar to
trading futures, but with a great deal of additional flexibili-
ty. Options on CME dairy futures are listed in the same
trading months as futures contracts. Because CME dairy
options are based on CME dairy futures, their technical
specifications are almost identical. Like futures contracts,
options contracts also have expiration dates. CME Milk
options, for example, expire on the business day prior to
the USDA Class III and IV announcement.
There are two types of options on futures.
» Put: The right to sell a futures contract at a certain price.
Put options act as insurance against a down market,
and thus are useful to sellers of dairy commodities.
» Call: The right to buy a futures contract at a certain
price. Call options enable buyers of dairy commodities
to purchase protection against rising dairy prices
Puts increase in value if prices fall, and decrease in value
if prices rise. Puts give the buyer (holder) the right to exer-
cise into a sell (short) futures position at a fixed price.
Calls increase in value if prices rise, and decrease in value if
prices fall. Calls give the buyer (holder) the right to exercise
into a buy (long) futures position at a fixed price.
Options as Price Insurance
People do not drive motor vehicles without insurance.
Firms can purchase similar protection against price disaster
in the dairy markets by understanding and correctly using
options on CME dairy futures. Options give the buyer price
insurance against a market that takes a turn for the worse
in terms of a current or anticipated cash position.
The cost of an option is the premium, similar to an insurance
premium, which is paid up front. The amount of a premium
is a function of:
» The amount of time until the option expires
» The strike price in relation to the current futures price
» The volatility of the underlying futures contract
The price at which a buyer has the right to buy or sell a
specific futures contract is known as the strike price or
exercise price. Buyers of CME dairy puts or calls may
choose from many strike prices. For example, buyers of
CME milk futures have access to strike prices listed at
intervals of $.25. Thus, if futures are at $12, strike prices
will be available both above and below $12, such as
$12.50, $12.25, $12.00, $11.75, $11.50, and so on.
Put premiums cost more at higher strike prices, since a
put owner can sell futures at a higher level. Call premiums
cost more at lower strike prices, since a call owner can buy
futures at a lower price. As futures prices change over the
life of an option, so do premiums. The premium value
changes every time the underlying futures price changes.
Premiums for CME dairy options are quoted in terms of
dollars/hundredweight ($/cwt.) Thus a $.50 premium for a
CME Milk contract would cost $1,000 ($.50 x 2000 cwt.)
per contract.
Buyers of options can only lose the premium paid.
Speculators who buy options will lose the premium paid
if their estimate of market movement is wrong, but can
profit substantially if they are right. Hedgers who buy
options also have limited loss and unlimited gain potential.
They can use options to protect their cash positions from
adverse price moves, while retaining most of the gain in
cash value from favorable price moves.

19An Introduction to Trading CME Dairy Futures and Options
CME Dairy Put Options:Insurance Against Falling Markets
Sellers of dairy commodities purchase price protection
against a down market by buying CME dairy put options.
Advantages of buying puts include:
» No performance bond (margin) requirements.
A premium is paid in full up front.
» Buying puts establishes a price protection level for
dairy commodities sold in the future.
» Put options gain in value as the futures price falls.
» Put options expire worthless if the market ends up
higher. Holders take advantage of the higher cash
market and are out only the cost of the premium.
CME Dairy Call Options:Insurance Against Rising Markets
Buyers of dairy commodities are protected against higher
prices in the future by purchasing CME dairy call options.
Advantages of buying calls are:
» No performance bond (margin) requirements.
A premium is paid in full up front.
» Buying calls sets a price protection level for dairy
commodities to be purchased in the future.
» Call options gain in value as the futures price rises.
» Calls expire worthless if the market ends up lower.
Holders take advantage of a lower cash market
and are out only the cost of the premium.
Exiting from Options Positions
The buyer of a CME dairy option can exit the position in
four ways:
» Offset the option – Sell back the same option
(put or call) and receive the gain in value
» Let the option cash-settle at expiration and collect
gains in value
» Exercise the option – Take the futures position
» Let the option expire
The Underlying Contract
The futures contract which the buyer has the right to sell
or buy is known as the underlying futures contract. In the
following table, the underlying contract is the July CME
Milk futures contract. The table also shows the varying
amounts of put and call premiums at specific strike prices.
In April, July CME Milk Futures at $13
Strike Price ( $/cwt ) July Option Premiums/Value ( $/cwt )PUTS CALLS
$14 $1.00 $.10
$13 $.50 $.50
$12 $.10 $1.00

20 cme.com
Examples of Trading Options
on CME Dairy Futures
Put Example
Say it is April and July CME Milk futures are at $12/cwt.
What happens if a trader buys a July $12 put for
$.50/cwt.? The July $12 put will have value if futures
prices fall below $12.00: If prices go above $12.00,
however, they will expire worthless.
In April, July CME Milk futures = $12/cwt.
Buy July $12 put at $.50/cwt.
PREMIUM Value of Price Futures in July $12 put–Paid Results
$14 $0 – $.50 $ .50 cost
$12 $0 – $.50 $ .50 cost
$10 $0 – $.50 $ 1.50 profit
A speculator selling back a $12 put would have a $3000
($2.00 x 2000 cwt. – $.50 x 2,000 cwt. premium cost) per
contract profit if futures prices fell $2. There would be a
$1000 ($.50 x 2000 cwt.) per contract cost if prices stayed
the same or if they rose $2 (commission not included).
Hedgers would use this put option in a different way.
If prices fall, the option profit would protect a minimum
selling price and act as an insurance policy for milk. If
prices rise, the option loss (cost of premium) would be
offset by the better cash selling position.
Call Example
In the same situation as above, a July $12 CME Milk call
may be worth $.50/cwt. in April. What would happen if a
trader buys a call at that price? In July the $12 call will
have value if prices stay above $12, or expire worthless if
the futures price falls below $12.
In April, July futures = $12/cwt.
Buy July $12 call at $.50/cwt.
PREMIUM Value of Price Futures in July $12 put–Paid Results
$14 $2 – $.50 $ 1.50 profit
$12 $0 – $.50 $ .50 cost
$$10 $0 – $.50 $ .50 cost
A speculator selling back a $12 call would have a $3000
per contract profit if futures prices rose $2. There would
be a $1000 per contract loss if prices stayed the same
or fell $2 (commission not included).
Hedgers would use this call option in a different way.
If prices rose, the option profit would protect a maximum
purchase price for milk. If prices fall, the option loss
(cost of premium) would be offset by the better cash
buying position.

21An Introduction to Trading CME Dairy Futures and Options
The following are additional examples to show how put
and call options can be used and how price changes affect
the outcomes in both cases.
Put Option Example (Zero Basis)
In April, July futures are at $13, and a producer/cooperative
buys a July 13 Milk put option for $.50/cwt, or $1000 total
($.50 x 2000 cwt.). What can happen in July?
PUT OPTIONSIf July Futures Cash Value of Cost of SellingPurchase Price* Price + 13 Put – 13 Put Price*
$15 $15 $0 – $.50 $14.50 $15
$13 $13 $0 – $.50 $12.50 $13
$11 $11 $2 – $.50 $12.50 $11
If the futures price is $15 in July, the $13 put option
expires worthless, and the producer/cooperative sells
fluid milk in a higher cash market. If futures are $11, the
producer/cooperative realizes a $2 gain which compensates
for the lower cash selling price. If prices are lower than
$11, the put increases in value to hold the price protection
level of $12.50.
*Commissions and basis not reflected in example.
Call Option Example (Zero Basis)
In April, July futures are at $13, and a dairy processor buys
a July 13 Milk call option for $.50, or $1000 ($.50 x 2000
cwt.). What can happen in July?
CALL OPTIONSIf July Futures Cash Value of Cost ofPurchase Price* Price – 13 Put + 13 Put
$15 – $2 + $.50 $13.50
$13 – $0 + $.50 $13.50
$11 – $0 + $.50 $11.50
If the futures price is $11 in July, the $13 call option expires
worthless, and the processor will buy milk in a lower cash
market. If futures are $15, the processor realizes a $2 gain
which compensates for the higher cash purchase price.
If prices are even higher, the call gains in value to hold the
price protection level of $13.50.
*Commissions and basis not reflected in example.

22 cme.com
Prices in the CME dairy futures and options markets
are primarily driven by changes in the underlying cash
markets. However, traders still look to scheduled
government reports to provide indications of future
market direction. Reports can be viewed on the CME
Web site at http://www.cme.com/commodities
and include the following key sources:
USDA – NASS Reports
Dairy Product Prices are reported each Friday at 7:30 a.m.
Central Time. These prices are used to calculate the
Federal Order class prices. NASS-survey cheese and butter
prices typically lag CME cash prices by 1–2 weeks – more
if prices are more volatile. NASS prices also tend to run
1–2 cents lower than CME weekly averages.
http://usda.mannlib.cornell.edu
Search for NASS Reports, keywords: dairy prices
Dairy Products is the monthly production report for man-
ufactured dairy products released near the fourth of each
month. It contains the production data from the prior year,
prior month and current month for the key dairy products
like American cheese, total cheese, butter, nonfat dry milk
and whey powder. Traders watch this report to identify
production trends. For instance, when cheese production is
reported lower than the previous year, it is interpreted as
friendly for Class III prices.
http://usda.mannlib.cornell.edu
Milk Production is the most eagerly watched government
report for dairy traders. It is published on or before the
17th of each month, containing production figures for the
“selected 20 states,” which produce about 85% of the
nation’s milk. (See Milk Production, % Change vs. Prior
Year chart) From that data USDA estimates monthly U.S.
milk production. The report features the number of milk
cows in the selected 20 states, output per cow and total
production. When production is reported less than the
prior year the report is typically interpreted as bullish;
when production exceeds the prior year by more than 1%
it usually is interpreted as bearish. When cow numbers are
increasing, it indicates the nation’s productive capacity is
growing, a bearish price signal. When cow numbers are
decreasing, it indicates a contraction in productive capaci-
ty, sending a bullish signal.
http://usda.mannlib.cornell.edu
Key Dairy Reports
9.0%
6.0%
3.0%
0.0%
–3.0%
–6.0%
Milk Production, % Change vs. Prior Year (20 selected states)
1997 1998 1999 2000 2001 2002 2003

23An Introduction to Trading CME Dairy Futures and Options
Cold Storage is released around the 20th of each month,
providing information on cheese and butter inventories.
Because of the seasonality of dairy production and
consumption, there’s significant seasonality to inventory
patterns as well. Commercial American cheese stocks
typically increase from December 1 through July 31,
then decline rapidly in August, September, October and
November. (See Commercial American Cheese Stocks
chart) Commercial butter stocks typically build from
December 1 through May 31, and decline from July
through November. Deviations from this normal pattern,
or significant variances from previous-years’ holdings
(higher or lower), send signals that can move the market
(see Commercial Butter Stocks chart ).
http://usda.mannlib.cornell.edu
Livestock Slaughter is released between the 17th and
24th of each month, providing information on how many
dairy cows have been sent to slaughter in the previous
month. When slaughter figures are above the previous
year, it suggests increased culling and a future decline
in cow numbers, a bullish price indicator. When the
slaughter trend is down, it suggests less culling and a
subsequent increase in cow numbers, a bearish indicator.
http://usda.mannlib.cornell.edu
Agricultural Prices, which includes the Milk-Feed Price
ratio, is released near the last day of the month. This
ratio, which expresses the relationship between the price
of milk and the cost of cow feed needed to produce
that milk, indicates whether it’s generally profitable
for a farmer to expand cows. A high ratio – for instance,
when the price of milk is relatively high and the cost
of feed is relatively low – typically presages increased
milk production. Conversely, a low ratio – such as when
the price of milk is relatively low and the cost of feed
is relatively high – typically is a leading indicator of
decreased milk production.
http://usda.mannlib.cornell.edu
540
460
380
300
220
Commercial American Cheese Stocks (December 31)
Mill
ions
lbs.
‘89 ‘90 ‘91 ‘92 ‘93 ‘94 ‘95 ‘96 ‘97 ‘98 ‘99 ‘00 ‘01 ‘02 ‘03
160
120
80
40
0
Commercial Butter Stocks (December 31)
Mill
ions
lbs.
‘90 ‘91 ‘92 ‘93 ‘94 ‘95 ‘96 ‘97 ‘98 ‘99 ‘00 ‘01 ‘02 ‘03
24 cme.com
USDA – AMS Reports
Federal Order Class Prices are announced twice monthly
– at mid-month for the Advanced Prices for the current
month, and at the beginning of the month for the Class
and Component Prices for the previous month.
http://www.ams.usda.gov/dairy/orders.htm
Dairy Market News, published each Friday, provides
weekly commentary on fundamental conditions and fac-
tors that effect supply, demand and inventories. Dairy
Market News’ market analysts call industry participants
every week to capture the market tone of all dairy com-
modities. The report also summarizes official government
reports, figures and programs.
http://www.ams.usda.gov/dairy
USDA – ERS Reports
World Agricultural Supply & Demand Estimates (WASDE),
released between the 10th and 12th of each month,
provides government forecasts of fiscal year crop harvests
and milk supply and demand. Estimates represent USDA’s
fiscal year (for dairy, October 1 through September 30).
Forecasts of corn, bean and hay supplies give early warning
of where feed costs will be; higher costs could indicate a
cutback in milk supplies, while lower costs could indicate
an increase in milk supplies.
Livestock, Dairy & Poultry Outlook, released in partial
form at mid-month and complete form at the end
of the month, provides forecasts and analysis from
USDA economists. Roughly every other month’s
report includes an in-depth analysis of supply, demand,
stocks and price trends. Monthly tables include
“Commercial Disappearance” numbers, as well as
estimates of production, consumption, government
purchases and prices for the upcoming year.
CME Reports
Butter Stocks, released every Tuesday afternoon at 2 p.m.
CT, captures inventories of butter at CME-approved
warehouses for the prior week. Deliverable supply also
is reported, letting traders know how much butter
could potentially be offered on the CME cash butter
market in any given week. Note that all data collected
for government and CME reports are voluntary and
unaudited. Most data are reported initially as preliminary
estimates, revised a month later, and then again in
an annual summary.
Daily Dairy Report
This report offers daily updates on the supplies of milk
and is available online at no cost.
www.dailydairyreport.com
Weather
Traders pay close attention to weather reports to watch
how extremes might effect milk production-per-cow.
Cows are conditioned for normal weather patterns in
their region, and cow-comfort measures added in recent
years such as fans and misters in the Southern tier
have reduced the amount of stress that cows undergo.
However, when weather patterns deviate from the
norm – say, extended periods that are hotter than
normal in the summer, wetter than normal in the spring
or colder than normal in the winter – production-per-cow
responds adversely.
Conversely, normal, or milder-than-average weather
generally results in improvements in production-per-cow.
Weather also directly impacts crop planting and harvests.
Adverse weather in the Corn Belt can result in lower
supplies, and higher prices, of feed grains.

25An Introduction to Trading CME Dairy Futures and Options
CME Milk (Class III) Futures
Ticker Symbol DA
Trading Unit1 200,000 pounds of Grade A
cow’s milk
Price Quote Cents per pound
Minimum Price $.01 per cwt. = $20.00 per contractFluctuation (tick)
Daily Price Limit $.75 per cwt. = $1,500 per contract
Contract Months Every calendar month
extending out 24 months
Trading Hours 9:40 a.m. – 1:10 p.m.
(Chicago Time)2 Last day: 9:40 a.m. – 12:10 p.m.
Last Day of Trading Business day prior to USDA Class III
Milk Price announcement. The Class
III Milk price is issued on the first
Friday of the following month, if
that Friday is the fifth, or on the
preceding Friday, if that Friday is not.
Settlement3 Cash-settled to the Monthly USDA
Class III Milk Price (2,000 times the
Milk price). Class III Milk is used for
the production of cheese
1 Consult CME Rules for more detail.
2 Closing times may vary; consult the CME Web site for holiday schedule.
3 Visit the CME Web site for additional dairy trading information, including
dairy spot prices for Cheddar Cheese blocks and barrels.
Options on CME Milk (Class III) Futures
Ticker Symbol Calls: DA Puts: DA
Trading Unit One Milk futures contract
Strike Prices Intervals of 25 cents;
e.g., $11.25, $11.50, $11.75
Minimum Price $.01 per pound = $20.00 per
Fluctuation (tick)1 contract (cabinet = $10.00)
Daily Price Limit None
Contract Months 24 calendar months
Trading Hours 9:40 a.m. – 1:12 p.m.
(Chicago Time)2 Last day: 9:40 a.m. – 12:10 p.m.
Last Day of Trading Same as futures
Minimum No performance bond required for
Performance Bond put or call option buyers, but the
premium must be paid in full;
option sellers must meet additional
performance bond requirements
as determined by the Standard
Portfolio Analysis of Risk (SPAN®)
performance bond system.
Exercise Procedure3 An option may be exercised by the
buyer up to and including the last
day of trading. To exercise, the
clearing member representing the
buyer submits an Exercise Notice
to the Clearing House by 7:00 p.m.
on the day of exercise.
1 A trade may occur at a nominal price (cabinet) whether or not it results
in liquidation of positions for both parties to the trade.
2 Closing times may vary; consult the CME Web site for holiday schedule.
3 Consult your broker for additional information or specific requirements,
policies and procedures.
Contract Specifications

26 cme.com
CME Class IV Milk Futures
Ticker Symbol DK
Trading Unit1, 3 200,000 pounds of CME
Class IV Grade A cow’s milk
Price Quote Cents per pound
Minimum Price $.01 per pound =
Fluctuation (tick) $20.00 per contract
Daily Price Limit $.75 per pound =
$1,500 per contract
Contract Months Every calendar month extending
out 18 months
Trading Hours 9:40 a.m. – 1:10 p.m.
(Chicago Time)2 Last day: 9:40 a.m. – 12:10 p.m.
Last Day of Trading Business day prior to USDA Class IV
Milk Price announcement. The Class
IV Milk price is issued on the first
Friday of the following month, if
that Friday is the fifth, or on the
preceding Friday, if that Friday is not.
Settlement3 Cash-settled to the Monthly USDA
Class IV Milk Price (2,000 times the
Milk price). Class IV Milk is used
for the production of butter and
nonfat dry milk powder
1 Consult CME Rules for more detail.
2 Closing times may vary; consult the CME Web site for holiday schedule.
3 Visit the CME Web site for additional dairy trading information, including
spot butter price (M, W, F) and powder prices (daily).
Options on CME Class IV Milk Futures
Ticker Symbol Calls: DK Puts: DK
Trading Unit One CME Class IV Milk
futures contract
Strike Prices Intervals of 25 cents per pound;
e.g., $11.25, $11.50, $11.75
Premium Quotation Cents per pound;
e.g., $.20 premium = $400.00
Minimum Price $.01 per pound = $20.00 per
Fluctuation (tick)1 contract (cabinet = $10.00)
Daily Price Limit None
Contract Months 18 calendar months
Trading Hours 9:40 a.m. – 1:12 p.m.
(Chicago Time)2 Last day: 9:40 a.m. – 12:10 p.m.
Last Day of Trading Same as futures
Minimum No performance bond required for
Performance Bond put or call option buyers, but the
premium must be paid in full;
option sellers must meet additional
performance bond requirements
as determined by the Standard
Portfolio Analysis of Risk (SPAN®)
performance bond system.
Exercise Procedure3 An option may be exercised by the
buyer up to and including the last
day of trading. To exercise, the
clearing member representing the
buyer submits an Exercise Notice
to the Clearing House by 7:00 p.m.
on the day of exercise.
1 A trade may occur at a nominal price (cabinet) whether or not it results
in liquidation of positions for both parties to the trade.
2 Closing times may vary; consult the CME Web site for holiday schedule.
3 Consult your broker for additional information or specific requirements,
policies and procedures..

27An Introduction to Trading CME Dairy Futures and Options
CME Butter Futures
Trading Unit 40,000 pounds of Grade AA butter
Point Descriptions 1 point = $.0001 per pound = $4.00
Contract Listing Six months of March, May, July,
September, October and December.
Strike Price Interval N/A
Product Code Clearing = DB Ticker = DB
Trading Venue Floor
Trading Hours 9:30 a.m. to 1:10 p.m.
(Chicago Time) LTD (12:10p.m. If the LTD is on a
day that the market closes early,
then the time is 11:10 a.m.)
Strike N/A
Limits $0.05/lb, 500 pts, $2000
Expandable price limits,
see Rule 5102.D
Minimum Fluctuation Regular; 0.00025 = $10.00
CME Butter Options
Trading Unit One CME Butter Futures Contract
Point Descriptions 1 point = $.0001 per pound = $4.00
Contract Listing Mar, May, Jul, Sep, Oct, Dec
and Flex Options
Strike Price Interval Cents per pound at $0.02
intervals (i.e., 1.20, 1.22, 1.24)
Product Code Clearing = DB Ticker = DB
Trading Venue Floor
Trading Hours 9:30 a.m. to 1:12 p.m.
(Chicago Time) LTD (12:10p.m. If the LTD is on a
day that the market closes early,
then the time is 11:10 a.m.)
Listed All listed series
Strike All listed intervals
Limits N/A
Minimum Fluctuation Regular; 0.00025 = $10.00
Cab 0.000125 = $5.00

28 cme.com
CME Cash-Settled Butter Futures
Trading Unit 20,000 times the USDA monthly weighted average price per pound in the US for Grade AA Butter
Point Descriptions 1 point = .00025 per pound = $5.00
Contract Listing Twelve consecutive calendar months.
Strike Price Interval N/A
Product Code Clearing = CB Ticker = CB
Trading Venue CME Globex®
Trading Hours 9:30 a.m. – 1:10 p.m. (12:10 p.m. LTD)
(Chicago Time)
Listed All listed months
Strike N/A
Limits $.05 per pound expanded to $.10 per pound after one day limit move.
No limits during last 5 days of the expiring contract month.
Minimum Fluctuation Regular; 0.00025 = $5.00

29An Introduction to Trading CME Dairy Futures and Options
CME Nonfat Dry Milk Futures
Trading Unit 44,000 pounds of Grade A
and Extra Grade Dry Milk
Point Descriptions 1 point = $0.001 per pound = $4.40
Contract Listing Twelve consecutive months
on a monthly cycle.
Strike Price Interval $0.02 intervals; e.g., $1.00,
$1.02 etc. Nearest contract month
$0.01; e.g., $1.01, $1.02, etc.
Product Code Clearing = NF Ticker = NF
Trading Venue Floor
Trading Hours 9:25 a.m. to 1:10 p.m.
(Chicago Time) LTD (12:10 p.m. If the LTD is on a
day that the market closes early,
then the time is 11:10 a.m.)
Listed All listed series
Strike All listed intervals
Limits N/A
Minimum Fluctuation Regular; 0.00025 = $11.00
Cab 0.000125 = $5.50
Options on CME Nonfat Dry Milk Futures
Trading Unit One CME Nonfat Dry Milk
Futures Contract
Point Descriptions 1 point = $0.001 per pound = $4.40
Contract Listing Twelve consecutive months
on a monthly cycle.
Strike Price Interval $0.02 intervals; e.g., $1.00,
$1.02 etc. Nearest contract month
$0.01 e.g. $1.01, $1.02, etc..
Product Code Clearing = NF Ticker = NF
Trading Venue Floor
Trading Hours 9:25 a.m. to 1:12 p.m.
(Chicago Time) LTD (12:10 p.m. If the LTD is on a
day that the market closes early,
then the time is 11:10 a.m.)
Listed All listed series
Strike All listed intervals
Limits N/A
Minimum Fluctuation Regular; 0.00025 = $11.00
Cab 0.000125 = $5.50

30 cme.com
Comparison of CME Dairy Products
CME Milk CME Milk CME CME Cash- CME Non-Fat(Class III) (Class IV) Butter Settled Butter Dry Milk
Size 200,000 lbs. 200,000 lbs. 40-43,000 lbs. 20,000 lbs. 44,000 lbs.
Hours 9:40 a.m. – 9:20 a.m. – 9:30 a.m. – 9:30 a.m. – 9:25 a.m. –
1:10 p.m. 1:10 p.m. 1:10 p.m. 1:10 p.m. 1:10 p.m.
Monday – Friday Monday – Friday Monday – Friday Monday – Friday Monday – Friday
(12:10 p.m. last
trading day)
Trading Platform CME Trading Floor CME Trading Floor CME Trading Floor CME Globex CME Trading Floor
Delivery Cash-Settled Cash-Settled Physical Cash-Settled Cash-Settled
Grade Class III Class IV AA AA A Extra
Hard Cheese Butter/Powder
Launched Fluid Delivery: 7/10/00 9/5/95 9/18/05 11/16/98
1/11/96
Cash-Settled
5/3/96
Month All Calendar 18 Calendar Mar, May, Jul, All Calendar All Calendar
Months; Out Months Sep, Oct, Dec Months Months
24 Months
31An Introduction to Trading CME Dairy Futures and Options
Electronic Trading and CME Dairy Futures
As a leader in electronically traded derivatives products,
CME offers customers access to a growing number of our
commodity futures contracts on its CME Globex trading
platform. CME Cash-Settled Butter futures trade exclusive-
ly on CME Globex, as do CME Fertilizer futures. CME
Livestock products – CME Live Cattle, CME Feeder Cattle
and CME Lean Hogs – trade electronically simultaneously
with the trading of these products on the CME trading
floor, as do and CME Frozen Pork Bellies. Traders are able
to see free real-time price quotes in the CME Livestock
markets at www.cme.com/e-livestockquotes, where cur-
rent prices are posted continuously. Other CME commodity
products, such as CME Milk (Class III and Class IV), CME
Butter, CME Nonfat Dry Milk and CME Random Length
Lumber, trade exclusively on the CME trading floor.
The CME Globex trading platform is made available to
traders through 800 direct connections in 36 countries
around the world. In addition, we provide direct access
through telecommunications hubs in London as well as
Amsterdam, Dublin, Frankfurt, Gibraltar, Milan, Paris and
Singapore. This accessibility enables traders to trade when
they wish – and also to take quick action whenever major
market changes take place.
The platform’s open architecture enables customers to
access CME Globex using their own proprietary trading
applications or the systems provided by futures brokers
and independent software vendors, as well as a CME-pro-
vided trading application. Traders are able to see the top
prices and other data right on their screen and transac-
tions are executed in less than a second. The advanced
capabilities of the CME Globex platform allow traders to
execute all of the traditional (outright) transactions in
futures as well as a variety of spread trades, including
highly complex options spreads.
Fully Integrated Clearing
At CME, we operate our own clearing house that matches
and settles all trades and guarantees the creditworthiness
of every transaction that takes place in our markets. Our
integrated clearing function ensures the safety and sound-
ness of our markets and helps differentiate us from our
competitors.
With CME Clearing serving as counterparty to every trade
– e.g., in the clearing process it becomes the buyer to each
seller of a futures contract and the seller to each buyer –
the risk of default is virtually eliminated. Performance bond
(collateral) deposits are required at each level in the clear-
ing process – customer to broker, broker to clearing firm,
clearing firm to clearing house. The performance bond is a
good-faith deposit that represents the minimum amount
of protection against potential losses.
CME Clearing handles more than 92 percent of all futures
and options contracts traded in the U.S. This requires man-
agement of the substantial exposure that results from
transferring more than $460 trillion of risk and guarantee-
ing the performance of each of nearly 800 million con-
tracts annually. On a daily basis, we hold nearly $45 billion
of collateral deposits to support the transactions that are
being made in CME markets. Twice daily, we move
between $1.5 billion and $6 billion of funds to and from
market participants.

32 cme.com
Getting Started in CME Dairy Products
Before trading futures or options on CME Dairy products,
a company or individual must have a commodity broker.
Commodity brokers can be located in branch offices of a
CME clearing firm or in independent brokerage houses (IBs)
associated with a CME clearing firm. It is important to shop
around to find a broker that is the right fit for the trader.
Once the company or individual has found a broker with
whom they feel comfortable and who understands their
trading plan, the company or individual will need to open
an account. This requires signing a customer security deposit
statement, which binds an individual customer or an organi-
zation to make good on any losses incurred in the course of
trading. In addition, a Risk Disclosure Document needs to be
signed that indicates that the customer understand the risks
of futures and options trading. Then, once the customers
have deposited the required amount of performance bond,
they may begin trading.
Today’s greater need for risk management and hedging
tools has required investors to become increasingly sophisti-
cated about futures and options on futures products. In
light of growing global demand and expanding electronic
accessibility, CME commodities are generating increased
opportunities for hedgers and speculators in these markets.
With customers around the world, a diverse product line,
deep, liquid markets, and strategic alliances with other
exchanges, CME is truly a global marketplace. Why not
make it yours?
For additional information about CME commodity products,
please visit our Web site at www.cme.com/commodities. You
will be able to access a number of other brochures and mar-
keting and education materials that can answer your ques-
tions or help you to begin trading these products.
Additionally, if you would like to talk to a CME representa-
tive, please call our Customer Service Line, 1-800-331-3332.
Outside the U.S., please call 312-930-2316.
CME Commodity Products
CME offers a range of futures and options on livestock –
cattle and hogs – as well as on several dairy-related prod-
ucts. Additional commodity products are based on lumber
and three types of fertilizer.
CME Livestock Futures
» CME Feeder Cattle Futures and Options (young cattle)
» CME Live Cattle Futures and Options (market ready
animals)
» CME Lean Hog Futures and Options
» CME Frozen Pork Belly Futures and Options (the first
futures on frozen meat products, launched in 1961)
CME Lumber Futures
» CME Random Length Lumber
CME Dairy Futures
» CME Class III Milk Futures and Options
» CME Class IV Milk Futures and Options
» CME Butter Futures and Options
» CME Cash-Settled Butter Futures
» CME Nonfat Dry Milk Futures and Options
CME Fertilizer Futures
» CME DAP Futures
» CME UAN Futures
» CME Urea Futures

IDEAS THAT CHANGE THE WORLDTM
AC017/1.5M/1105