
CMD total print version FINAL - Hydro, a global supplier · Construction Machinery & Equipment...
36
Kathrine Fog, SVP Corporate Strategy & Analyses Market Outlook
Transcript of CMD total print version FINAL - Hydro, a global supplier · Construction Machinery & Equipment...

Kathrine Fog, SVP Corporate Strategy & Analyses
Market Outlook

Macro and downstream
67

Improving macro environment evident in aluminium demand
68
Semis demand at or above GDP in key regions
Source: Thomson Reuters, Republished under license from CRU International Ltd
Semis demand annual growth, key regions(%)
0%
2%
4%
6%
8%
10%
China North America Western Europe World ex. China
2016 2017
40
45
50
55
60
65S
ep-1
1
Apr-1
2
Nov
-12
Jun-
13
Jan-
14
Aug
-14
Mar
-15
Oct
-15
May
-16
Dec
-16
Jul-1
7USA ISM Eurozone China NBS China Caixin
Increasing production
Contractingproduction
Manufacturing PMI’s

Substitution trend in automotive progressing
69
US semis demand in automotive remains positive although car sales have overall moderated in 2017
Source: Thomson Reuters, Republished under license from CRU International Ltd
Semis demand in transport, annual growth(%)
0%
2%
4%
6%
8%
10%
US Western Europe
2016 2017 E 2018 E
50
60
70
80
90
100
110
120
130
Jan-08 Jan-09 Jan-10 Jan-11 Jan-12 Jan-13 Jan-14 Jan-15 Jan-16 Jan-17
US light vehicle sales Eurozone car registration
US and European automotive indicators(Index, Jan. 2008=100)

Automotive demand for aluminium supporting several semis productsCar makers utilizing aluminium to reduce weight and increase fuel-efficiency
70
Source: Hydro analysis, Republished under license from CRU International Ltd*Other includes e.g wire
0
5
10
15
20
25
30
2010 2011 2012 2013 2014 2015 2016 2017 2018 2019 2020
Castings Extrusions Other* Rolled products
7 %
7 %
4 %
Global semis demand for transport sector by product form(Mill t)
CAGR 2016-20
Level ofsubstitution
High-growth automotive segment with substantial further potential due to aluminium’s superior inherent properties

New segments and applications supporting aluminium demand
71
Marine / Offshore applications Zero-emission electrical car ferries in 100% aluminium for light-weighting
Industrial applications, ex. furnitures
B&C, ex. Supertall buildings
Middle and high voltage cables, wireand cables for electrical applications
Transportation, truck & trailer applications
Automotive, stong drive towards EV Aluminium in solar panels

Rolled products demand driven by transport segment
72
Transport share increasing in total rolled products demand
General rolled products demand, selected regions • Continued substitution trend in transport main
demand driver• Growth in packaging driven by can stock and
foil in emerging markets
0%
2%
4%
6%
2014 2015 2016 2017 E 2018 E
North America Europe*
Source: Hydro Analysis, Republished under license from CRU International Ltd*Total EU27+EFTA
YoY-growth
Expected market development
50%
17%
14%
8%
5%4% 2%
PackagingTransportConstructionMachinery & EquipmentConsumer durablesElectricalOther
Global segment composition, rolled products(2017)

Extrusion market supported by continued momentum in B&C market and improving demand in transport
73
Source: Thomson Reuters, Hydro Analysis, Republished under license from CRU International Ltd
62%14%
12%
5%4%
3%
Construction TransportMachinery & equipment ElectricalConsumer durables Other
Global segment composition, extrusion(2017)
Housing market indicatorsIndex, Jan 2010=100
80
100
120
140
160
180
200
220
240
Jan-
10Ju
l-10
Jan-
11Ju
l-11
Jan-
12Ju
l-12
Jan-
13Ju
l-13
Jan-
14Ju
l-14
Jan-
15Ju
l-15
Jan-
16Ju
l-16
Jan-
17Ju
l-17
US Building permitsUS Housing startsEU construction order book
US truck and trailer marketMonthly shipments, annual growth
-50%
-30%
-10%
10%
30%
50%
70%
90%
Jan-
10Ju
l-10
Jan-
11Ju
l-11
Jan-
12Ju
l-12
Jan-
13Ju
l-13
Jan-
14Ju
l-14
Jan-
15Ju
l-15
Jan-
16Ju
l-16
Jan-
17Ju
l-17
Light trucks Heavy duty trucks

Solid extrusion demand growth in several key regions
74
Gradual improvement expected in Europe, Chinese demand growth estimated to moderate
Source: Hydro Analysis, Republished under license from CRU International Ltd
• US housing market still sustaining positive momentum
• Construction activity in Europe continues to improve from low levels
• South America returning to positive demand growth
• Softer construction growth impactingChinese demand
Expected market development
0%
5%
10%
2016 2017E 2018E
Asia ex. China
Extrusion demand, selected regionsYoY-growth
0%
5%
10%
2016 2017E 2018E
Western Europe
-15%
-10%
-5%
0%
5%
10%
2016 2017E 2018E
South America
0%
5%
10%
2016 2017E 2018E
China
0%
5%
10%
2016 2017E 2018E
North America

0%
2%
4%
6%
8%
10%
12%
0
50
100
150
200
250
300
350
Jan-10 Jan-11 Jan-12 Jan-13 Jan-14 Jan-15 Jan-16 Jan-17
Foil Sheet & strip Extrusions* Net semis exports as share of semis production (RHS)
Largely stable Chinese semis exports last yearLimited extrusion exports to Europe and North America, extrusion stocks transferred from Mexico to Vietnam
Source: CRU, Antaike, Hydro Analysis*Mainly extrusions, but also including some smaller semis categories such as wire**US extrusion duties imposed in 2010, impacting volumes from 2011
Monthly Chinese net semis exports (12-month moving average)Thousand tonnes
0
200
400
600
800
1000
1200
1400
2007 2008 2009 2010 2011 2012 2013 2014 2015 2016
Asia North America Europe Oceania Latin America Middle East Africa
Annual Chinese extrusion exports, by regionThousand tonnes
**
75

Source: Hydro Analysis, Antaike
Trade flows partly impacted by trade measures
76
Chinese semis exports by destination – Asia key region
(2016)
AsiaAfricaNorth AmericaEuropeMiddle EastLatin AmericaOceania
US• Import duties
on semis• Dumping cases• Signals on
more protection
Europe• Import duties
on semis• Dumping cases
44%
9%
15%
11%
10%
8%3%
Asia• Some import
duties• India introducing
duties

Primary metal market
77

Recap CMD 2016: Global primary market expected to be largely balanced also in 2017
78
Source: CRU, Hydro Analysis
30 000
35 000
40 000
45 000
50 000
55 000
60 000
65 000
2006 2007 2008 2009 2010 2011 2012 2013 2014 2015 2016E 2017E
Supply Demand
Global (’000 mt)
Supply influences 2017
Chinese restarts
Chinese curtailments
Key regions in China adding capacity
Indian projects
Demand influences 2017
Momentum in Chinese construction and transport sector
Continued strong transport segment
Steady development US and Eurozone
Global growth expectations 2017
Demand: 3-5 %Supply: 4-6 %
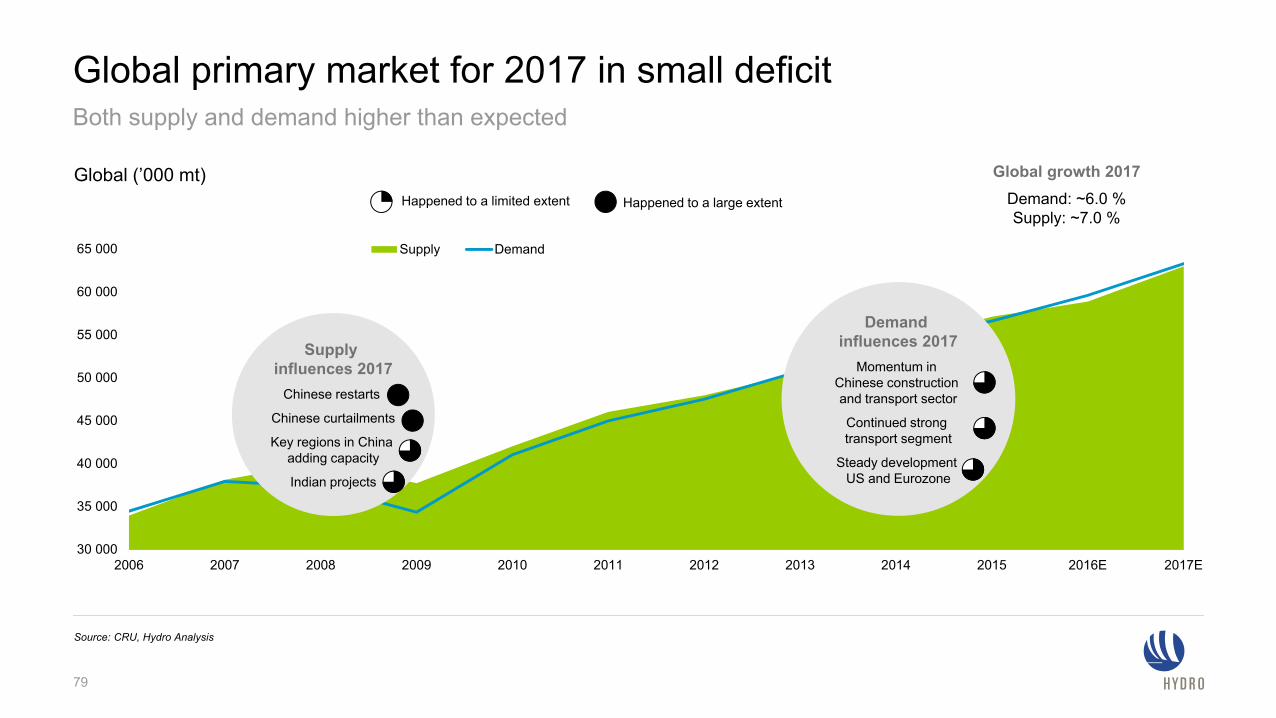
Global primary market for 2017 in small deficit
79
Both supply and demand higher than expected
Source: CRU, Hydro Analysis
30 000
35 000
40 000
45 000
50 000
55 000
60 000
65 000
2006 2007 2008 2009 2010 2011 2012 2013 2014 2015 2016E 2017E
Supply Demand
Global (’000 mt)
Supply influences 2017
Chinese restarts
Chinese curtailments
Key regions in China adding capacity
Indian projects
Demand influences 2017
Momentum in Chinese construction and transport sector
Continued strong transport segment
Steady development US and Eurozone
Global growth 2017Demand: ~6.0 %Supply: ~7.0 %
Happened to a limited extent Happened to a large extent

Global primary market expected to be largely balanced in 2018
80
Primary supply and demand growth expected to be largely similar
Source: CRU, Hydro Analysis
30 000
35 000
40 000
45 000
50 000
55 000
60 000
65 000
70 000
2006 2007 2008 2009 2010 2011 2012 2013 2014 2015 2016E 2017E 2018E
Supply Demand
Global (’000 mt)
Supply influences 2018Winter shutdowns
SOE projects in China
Limited growth for privatecompanies in China
US restarts
Indian projects
Demand influences 2018
Gradual slowdown in Chinese construction and transport sector
Continued strong transport segment
European and US growth continues
Global growth expectations 2018
Supply and demand: 4-5 %

Supply-side reform and environmental shutdowns moderating Chinese primary supply growth
81
Xinfa
Weiqiao
500
1 300
1 800
2+26 affected area for environmental shutdowns
Xinjiang Jiarun 200
1 000
East Hope 800
300
Inner Mongolia Jinlian
• Several industries, including steel, cement, coal and aluminium have been ordered to halt production during the winter heating from November 15th and March 15th
• The winter season shutdowns are also impacting carbon anode and alumina production• The primary shutdowns in Shandong are related to Xinfa, as Weiqiao is not estimated
to further cut its aluminium production during the winter season due to largely overlap with supply-side reform
• Due to lack of approvals several operational smelters have been forced to shut down production
• Private companies such as Weiqiao, East Hope and Xinfahave been most affected to date
• Planned and potential projects have also been affected by the policy, subduing production growth going forward
Supply side reformEnvironmental shutdowns
Supply-side reform Environmental shutdowns
Annual production effect (‘000t)
Shandong Regions impacted by winter
shutdowns
Henan
Shanxi
Shandong
Source: CRU, Hydro Analysis
~500

Key drivers for China’s aluminium expansion losing momentum
82
PastDrivers for aluminium capacity
Demand growth
Lack of environmental restrictions
Energy availability
Access to financing
Raw material access
• Continued strong growth short-term, but expected to slow longer term• Export market impacted by trade restrictions
• From softer to harder constraints: strong enforcement of environmental shutdowns during winter shutdown
• Competitive advantage of coal-rich regions moderating, combined with rising coal prices
• Environmental issues will further challenge coal-based production
• Tighter financial liquidity perceived as constraint for potential capacity new-builds and restarts
• Supply-side reform limiting new projects, especially by private players
• Depleting domestic bauxite reserves, more dependent on imports• Carbon producers also impacted by environmental shutdowns
Present
Supportive of capacityexpansions
Moderating capacityexpansions
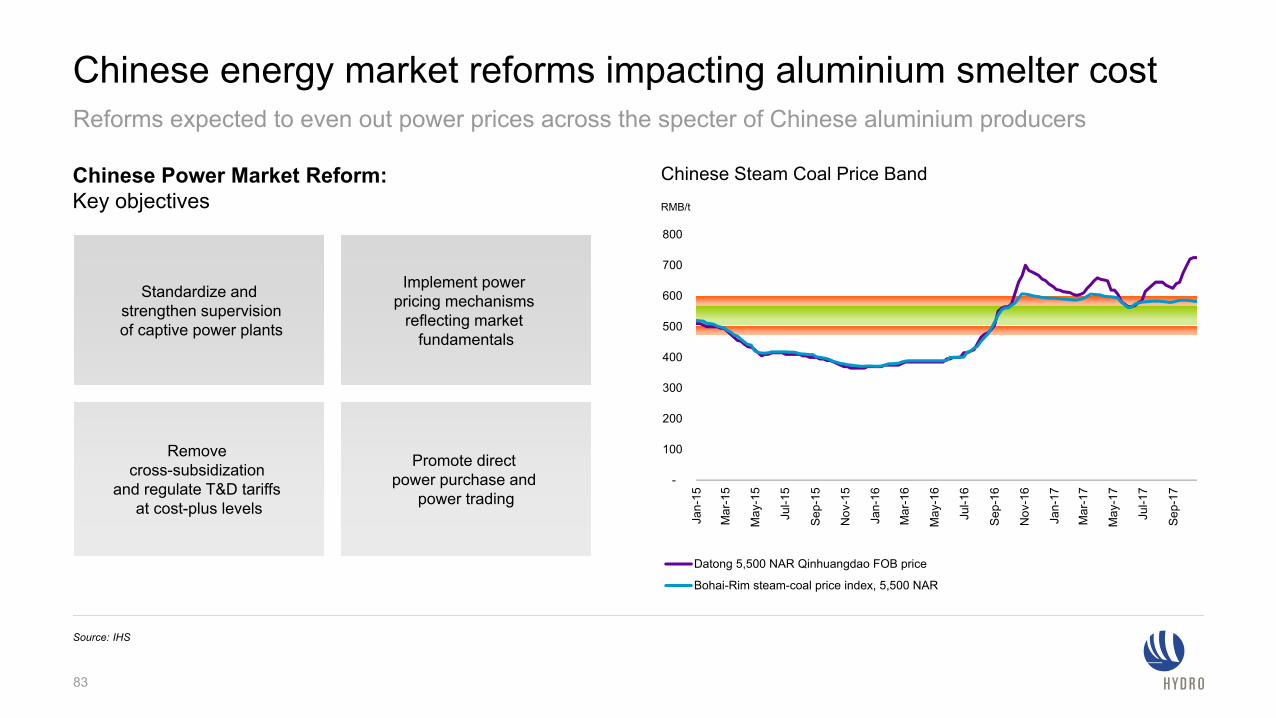
Chinese energy market reforms impacting aluminium smelter cost
-
100
200
300
400
500
600
700
800
Jan-
15
Mar
-15
May
-15
Jul-1
5
Sep
-15
Nov
-15
Jan-
16
Mar
-16
May
-16
Jul-1
6
Sep
-16
Nov
-16
Jan-
17
Mar
-17
May
-17
Jul-1
7
Sep
-17
Datong 5,500 NAR Qinhuangdao FOB price
Bohai-Rim steam-coal price index, 5,500 NAR
Source: IHS
Implement power pricing mechanisms
reflecting market fundamentals
Remove cross-subsidization
and regulate T&D tariffs at cost-plus levels
Promote direct power purchase and
power trading
Standardize andstrengthen supervisionof captive power plants
Chinese Power Market Reform:Key objectives
Chinese Steam Coal Price BandRMB/t
Reforms expected to even out power prices across the specter of Chinese aluminium producers
83

500
750
1 000
1 250
1 500
1 750
2 000
2 250
2 500
0 10 000 20 000 30 000 40 000 50 000 60 000
2016 Spot curve, Nov. 2017
Higher and steeper cost curve in 2017 compared to 2016
84
Higher end of the cost curve dominated by Chinese smelters
Source: Hydro analysis, IHS, Platts, Republished under license from CRU International Ltd
Cost pressure in 2017Higher coal prices
Higher alumina pricesHigher carbon costs
Business operating cost (BOC)USD/t
Index: Jan 2016 = 100
0
50
100
150
200
250
Q1-16 Q2-16 Q3-16 Q4-16 Q1-17 Q2-17 Q3-17 Q4-17
Chinese steam coal Alumina PAX Pet coke FOB US Gulf
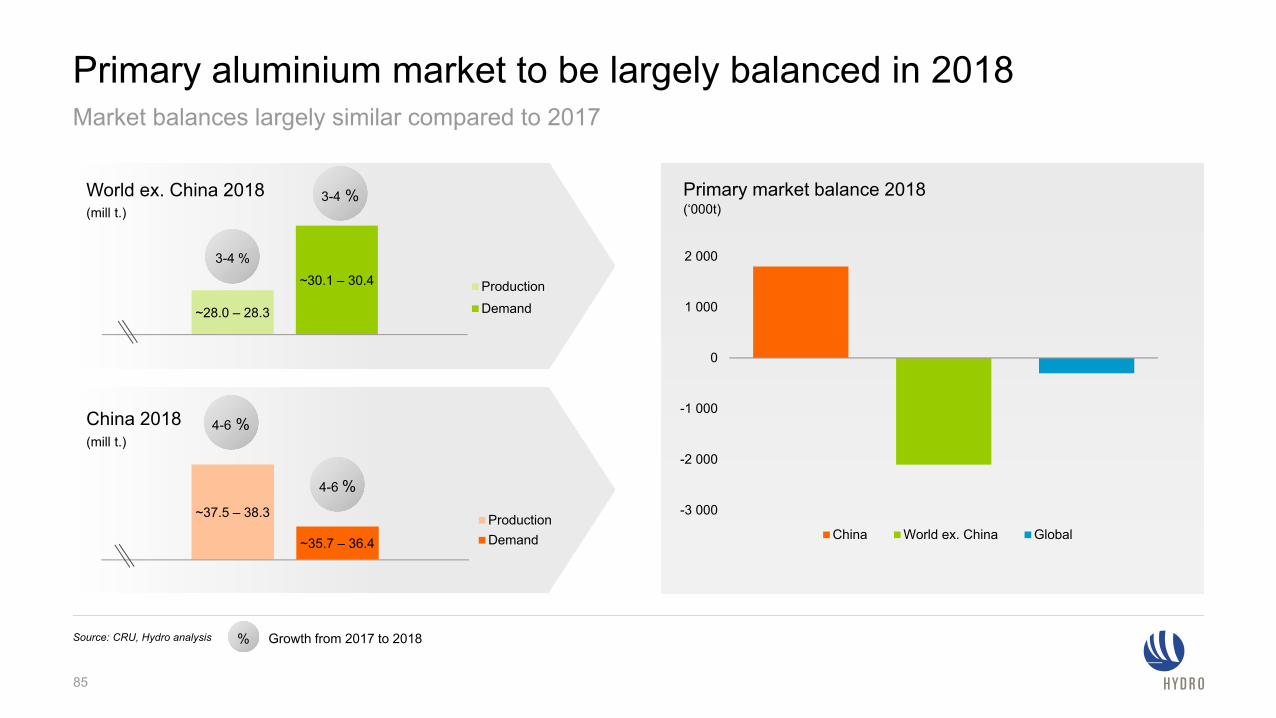
Primary aluminium market to be largely balanced in 2018
85
Market balances largely similar compared to 2017
Source: CRU, Hydro analysis
~28.0 – 28.3
~30.1 – 30.4 ProductionDemand
~37.5 – 38.3
~35.7 – 36.4
ProductionDemand
3-4 %
3-4 %
4-6 %
4-6 %-3 000
-2 000
-1 000
0
1 000
2 000
China World ex. China Global
World ex. China 2018
China 2018
Primary market balance 2018(‘000t)
% Growth from 2017 to 2018
(mill t.)
(mill t.)
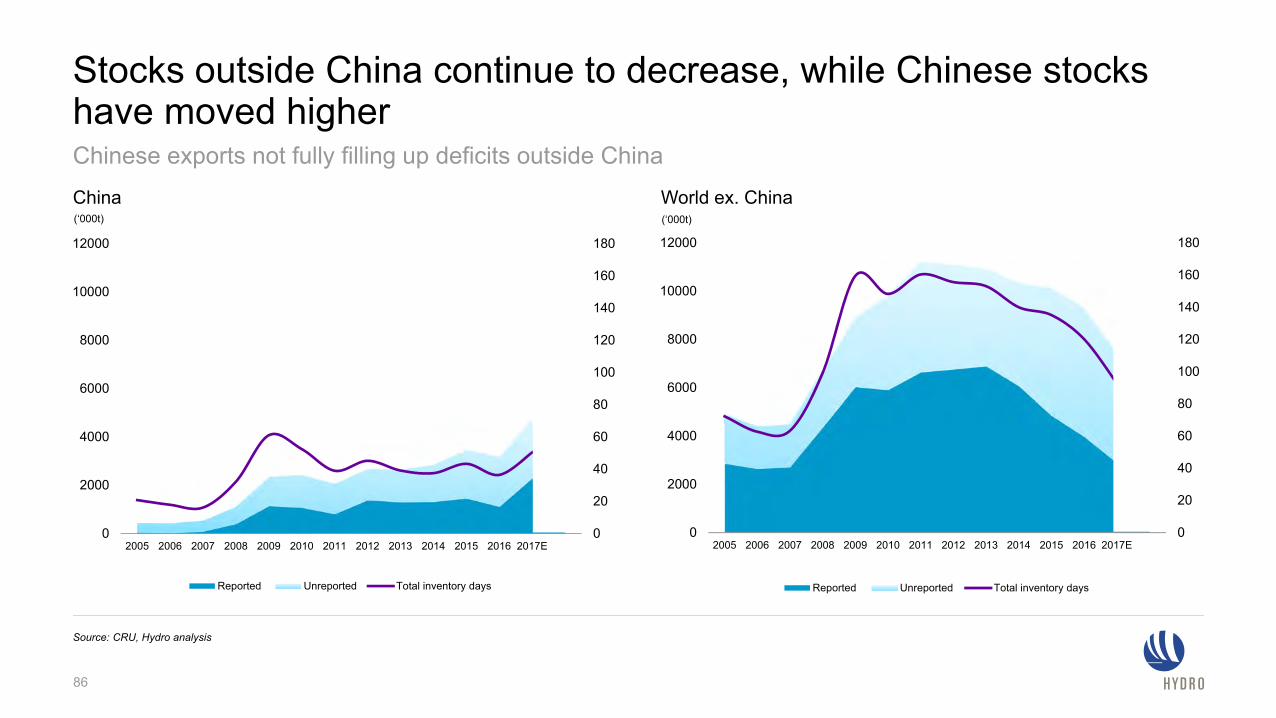
Stocks outside China continue to decrease, while Chinese stocks have moved higher
86
Chinese exports not fully filling up deficits outside China
Source: CRU, Hydro analysis
0
20
40
60
80
100
120
140
160
180
0
2000
4000
6000
8000
10000
12000
2005 2006 2007 2008 2009 2010 2011 2012 2013 2014 2015 2016 2017E
Reported Unreported Total inventory days
China
0
20
40
60
80
100
120
140
160
180
0
2000
4000
6000
8000
10000
12000
2005 2006 2007 2008 2009 2010 2011 2012 2013 2014 2015 2016 2017E
Reported Unreported Total inventory days
World ex. China(‘000t) (‘000t)

Inventory days approaching historically tight levels in world outside China in 2018
87
Chinese inventory days expected to increase, but not substantially
Source: CRU, Hydro analysis
0
20
40
60
80
100
120
140
160
180
0
2000
4000
6000
8000
10000
12000
2005 2006 2007 2008 2009 2010 2011 2012 2013 2014 2015 2016 2017E 2018E
Total stocks Total inventory days
0
20
40
60
80
100
120
140
160
180
0
2000
4000
6000
8000
10000
12000
2005 2006 2007 2008 2009 2010 2011 2012 2013 2014 2015 2016 2017E 2018E
Total stocks Total inventory days
China World ex. China(‘000t) (‘000t)

All-in price level supported by higher LME and premiums in 2017, prices in NOK supported by continued weak NOK vs USD
88
Source: Metal Bulletin, MW/MJP: Platts, Reuters Ecowin, Hydro analysis
0
100
200
300
400
500
600
700
800
900
Jan-
08
Jul-0
8
Jan-
09
Jul-0
9
Jan-
10
Jul-1
0
Jan-
11
Jul-1
1
Jan-
12
Jul-1
2
Jan-
13
Jul-1
3
Jan-
14
Jul-1
4
Jan-
15
Jul-1
5
Jan-
16
Jul-1
6
Jan-
17
Jul-1
7
Extrusion ingot over standard ingot Standard ingot duty paidExtrusion ingot duty paid
USD/mt
10 000
12 000
14 000
16 000
18 000
20 000
1 400
1 800
2 200
2 600
3 000
Jan 11 Oct 11 Jul 12 Apr 13 Jan 14 Oct 14 Jul 15 Apr 16 Jan 17 Oct 17
LME cash LME cash + Europe duty paidLME cash + US Midwest LME Cash + Europe dutypaid NOK (RHS)
USD/mt NOK/mt

Bauxite and alumina market
89

Chinese primary production dependent on imported resources
90
Around 37% based on imported raw material (average 2013-2017)
Source: CRU, China customs, 2017 forecast Hydro analysis
0
10
20
30
40
50
60
70
80
90
100
Primary production Alumina Bauxite
100 % 93.7 %
6.3 %
63.3 %
30.4 %
% of Primary Production
Imported
Imported
Domestic
Domestic
2017f40%

Bauxite production in China to decline, triggering more imports
• Depleting resources not sufficient to sustain operations in key provinces:− inland refineries may convert to imported
bauxite or relocate to southern provinces
− new refinery capacity in coastal region, dependent on imported bauxite
− refinery capacity outside of China
• Bauxite (equivalent) imports could increase from ~70 Mtpy in 2017 to ~150 Mtpy in 2025
Chinese bauxite imports set to increase
91
Source: CM Group (ept 2017, $50/t cif bauxite scenario) * alumina imports as bauxite equivalent
Chinese bauxite production and importsMtpy
0
50
100
150
200
250
2006 2007 2008 2009 2010 2011 2012 2013 2014 2015 2016 2017 2018 2019 2020 2021 2022 2023 2024 2025
hist domestic production forecast domestic prod alumina import * imports

Guinea’s bauxite production is rising
• Committed capacity increasing to ~70 Mtpy by 2020
• Substantial bauxite resources available− 20+ billion mt within 150 km of coast
− Low reactive silica
• Chinese SOE bauxite and alumina projects more likely following USD20bn loan to Guinea
• Social instability could hamper investments − Higher HSE and community standards required
0
10
20
30
40
50
60
70
80
2015 2016 2017e 2018e 2019e 2020e
Guinea bauxite production (million mt)
CBG Kindia Dian-Dian SMB/WAP EGA (GAC) Alufer
92
Projects to add 25-30 Mtpa of bauxite export capacity, resource base could support additional volumes
Source: CRU, Hydro analysis

Altantic
Pacific
2013 2017
Chinese bauxite imports increasingly exposed to freight
93
Freight represents ~20 to 60% of the CIF price, freight rates increasing from low levels
Source: China customs, Bloomberg, Hydro analysisNote: 2017 is Jan-Sep annualized
0
1000
2000
3000
Feb-
13
Jun-
13
Oct
-13
Feb-
14
Jun-
14
Oct
-14
Feb-
15
Jun-
15
Oct
-15
Feb-
16
Jun-
16
Oct
-16
Feb-
17
Jun-
17
Oct
-17
Origin of Chinese bauxite imports
Baltic Dry Index
20
30
40
50
60
70
80
90
Jul-09 Jul-10 Jul-11 Jul-12 Jul-13 Jul-14 Jul-15 Jul-16 Jul-17
Indonesia Australia India Brazil Guinea Malaysia
CIF China, USD/t

100
150
200
250
300
350
400
0 20 000 40 000 60 000 80 000 100 000 120 000 140 000
2016 Spot curve, Nov. 2017
Higher alumina cost curve in 2017 compared to 2016
94
Higher end of the cost curve dominated by Chinese refineries
Source: Bloomberg, IHS, CM, CRU
USD/tShandong
average$302
Index: Jan 2016 = 100
0
50
100
150
200
250
300
Jan-16 Apr-16 Jul-16 Oct-16 Jan-17 Apr-17 Jul-17 Oct-17
Fuel Oil, US Gulf Caustic ChinaCaustic US Gulf Bauxite Henan
Cost pressure in 2017Higher caustic prices
Higher Chinese bauxite pricesHigher freight costs

Chinese winter shutdowns affecting alumina supply Overall alumina impact likely to exceed smelter winter shutdowns
0
500
1000
1500
2000
2500
Shanxi HenanShandong - other Shandong - Weiqiao
Source: CM, CRU
(’000kt)
Alumina production lost to winter cuts(annualized production effect)
Current Extended Scope of 2+26City Policy
Beijing, Tianjin
Rest of 2+26
2+26+3
Henan Blanket cut
Shanxi Lvliang
Shanxi Jinzhong
2+26 affected area for environmental shutdowns
Inner Mongolia
LiaoningHebei
Shanxi
Henan
Shandong
Guizhou
Guangxi
Chalco`s Hebei refinery project relocated to Guangxi coast due to environmental policy
95

Alumina market balancing, Chinese additions also outside China
96
Limited capacity increases outside China
Source: Hydro analysis
Curtailed 2015 - 16
Capacity additions ex. China
Bubble size represents capacity 1 Mt
Point Comfort (2.3)
Paranam (2.25)
Chinese additions
Chinese refineries outside China
Atlantic curtailments• Atlantic market rebalancing
through curtailments• Corpus Christi and Paranam
restarts unlikely
Capacity additions ex. China• Middle East and India adding
capacity to supply own value chain
• Friguia restart in Guinea
Ras Al Khair (1.8)Al Taweelah (2.0)
Chinese additons• Chinese companies increasing
alumina production in Jamaica and Indonesa
• Domestic capacity additions, of which half located coastal
Alpart (1.65)Nhan Co (0.65)
Kendawangan (1.0)
Chinese additions2018: ~4.0 Mt
Friguia (0.65)India (1.0)Corpus Christi (1.63)
Being dismantled

Alumina prices rise amid policy implementation uncertainty
97
Market tightness, high metal prices, and increasing costs support prices
Source: Platts, Bloomberg
Market balances• New smelter projects ramping up in China• Re-stocking ahead of winter• Tighter market balance in China, less volumes
available outside China
Cost inflation• Higher caustic soda costs• Higher transport costs in China (road & rail)• Higher Chinese domestic bauxite prices
Other factors• Environmental inspections, shut down of
unsafe and small bauxite mines• Uncertainty regarding upcoming winter
heating season cuts
Recent alumina price drivers Platts alumina index (PAX, to 22 Nov 2017))PercentUSD/t
12%
14%
16%
18%
20%
22%
24%
150
200
250
300
350
400
450
500
550
Aug
201
0
Jan
2011
Jun
2011
Nov
201
1
Apr
201
2
Aug
201
2
Jan
2013
June
201
3
Nov
201
3
Apr
201
4
Aug
201
4
Jan
2015
June
201
5
Nov
201
5
Mar
201
6
Aug
201
6
Jan
2017
June
201
7
Nov
201
7
PAX % of LME 3M

Long-term outlook and summary
98

Strong demand drivers in key aluminium segments
Strong growth drivers across segments providing solid demand outlook
99
Source: CRU, Hydro Analysis
UrbanizationCopper substitution
UrbanizationHousing market recovery in mature regionsEnergy neutral buildings
Improving industrial sentiment in mature regionsManufacturing activity and industrial growth in emerging countries
UrbanizationEnvironmentally-friendly solutions
Transport
Construction
Electrical
Machinery & equipment
Packaging& foil
Growth in automotive vehicle productionAluminium content in cars increasingGrowth in other transport modes, e.g. railway
3 – 4 %
2 – 3 %
2 – 3 %
3 – 4 %
2 – 3 %
2000-17Global semis demand per segment, CAGR
5.0 %
6.5 %
7.0 %
6.0 %
4.0 %
2017-27
Global semis demand(CAGR 00-17)
5.5 %
Global semis demand
(CAGR 17-27)
~3 %
China:14.7 %
ROW:2.3%
China and ROW:~3 %
Still encouraging demand outlook from strong base – converging demand China and outside China
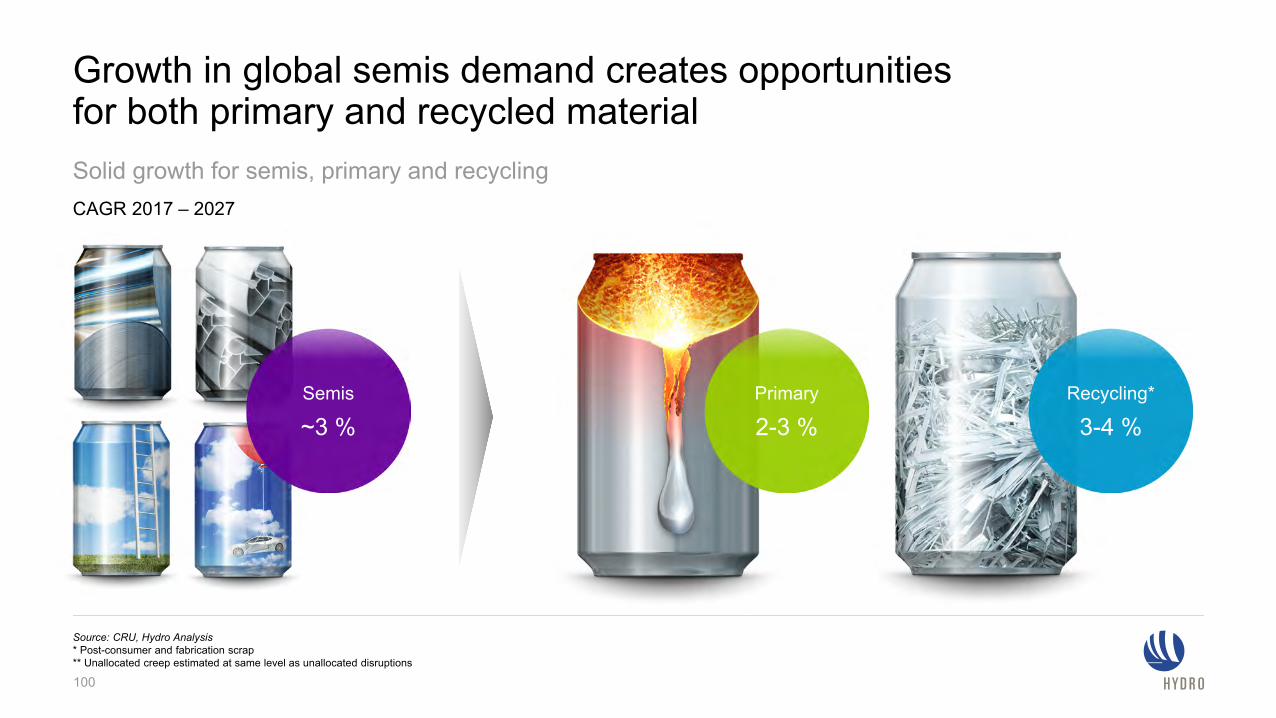
Growth in global semis demand creates opportunities for both primary and recycled material
100
Solid growth for semis, primary and recycling
Source: CRU, Hydro Analysis* Post-consumer and fabrication scrap** Unallocated creep estimated at same level as unallocated disruptions
CAGR 2017 – 2027
Semis
~3 %Primary
2-3 %Recycling*
3-4 %

• Solid long-term demand outlook supported bystrong growth drivers across segments
• Chinese primary supply moderating due to policy reform
• Global primary market largely balanced this year and next
• Cost curve pressured upwards by rising alumina and coal prices, with regional differences
• Recycling growth accelerating with increased generation of post-consumer scrap
• Chinese bauxite import dependency continues to increase
• Alumina market impacted by cost push and tightermarket balances
101