Cma Data Op Input Nirc
15
ICICI Bank Limited Name : RITIKA SYSTEMS PRIVATE LIMITED Audited Audited Provisionals Projected Projected Year 2011 2012 2013 2014 2015 Number of months 12 12 12 12 12 i. Domestic Sales 3259.9 3753.4 4600.0 5060.0 5566.0 ii. Export Sales 0.0 0.0 0.0 0.0 0.0 3259.9 3753.4 4600.0 5060.0 5566.0 Less : Excise Duty 9.7 4.3 4.9 6.0 6.6 3250.2 3749.1 4595.1 5054.0 5559.4 % age rise (+) or fall (-) in net sales N/A 15.3% 22.6% 10.0% 10.0% Cost of Sales i. Raw materials 2941.4 3396.3 4204.2 4624.1 5086.5 a. Imported 0.0 0.0 0.0 0.0 0.0 b. Indigenous 2941.4 3396.3 4204.2 4624.1 5086.5 ii. Other Spares 0.0 0.0 0.0 0.0 0.0 a. Imported 0.0 0.0 0.0 0.0 0.0 b. Indigenous 0.0 0.0 0.0 0.0 0.0 iii. Depreciation 12.2 14.1 14.1 14.1 14.1 iv. Other Manufacturing Exp 43.2 24.6 30.2 33.2 36.5 v Sub-total 2996.8 3434.9 4248.4 4671.3 5137.0 vi. Add: Opening Stock-in-process 23.6 25.6 6.1 7.5 8.2 vii 3020.4 3460.5 4254.5 4678.8 5145.3 viii Deduct: Closing Stock-in-process 25.6 6.1 7.5 8.2 9.1 ix Cost of Production 2994.7 3454.4 4247.1 4670.6 5136.2 x Add: Opening Stock of finished goods 0.0 0.0 0.0 0.0 0.0 xi 2994.7 3454.4 4247.1 4670.6 5136.2 xii Deduct: Closing Stock of finished goods 0.0 0.0 0.0 0.0 0.0 Sub-total (Total Cost of Sales) 2994.7 3454.4 4247.1 4670.6 5136.2 Selling, general and administrative expenses 169.1 185.8 227.8 250.5 275.6 3163.8 3640.3 4474.8 4921.1 5411.8 Operating Profit before Interest 86.4 108.9 120.3 132.9 147.6 3.5 3.3 6.7 18.4 18.8 0.0 0.0 0.0 0.0 0.0 3.5 3.3 6.7 18.4 18.8 Operating Profit after Interest 82.9 105.6 113.6 114.5 128.8 i. Add: Other non-operating Income 18.9 23.0 28.2 31.0 34.1 ii. Deduct: Other non-operating expenses 0.0 0.0 0.0 0.0 0.0 iii. 18.9 23.0 28.2 31.0 34.1 Profit before tax/loss 101.8 128.6 141.8 145.5 162.9 Sub-total Sub-total Interest Interest on Fixed Loans / Term loans Other Int Net of other non-operating income / expenses ASSESSMENT OF WORKING CAPITAL REQUIREMENTS FORM II - OPERATING STATEMENT Sales Gross Sales Net Sales Sub-total 17/01/2013 CMA DATA OP INPUT NIRC (Form_II) Page 1
Transcript of Cma Data Op Input Nirc

ICICI Bank Limited
Name : RITIKA SYSTEMS PRIVATE LIMITED
Audited Audited Provisionals Projected Projected
Year 2011 2012 2013 2014 2015
Number of months 12 12 12 12 12
i. Domestic Sales 3259.9 3753.4 4600.0 5060.0 5566.0
ii. Export Sales 0.0 0.0 0.0 0.0 0.0
3259.9 3753.4 4600.0 5060.0 5566.0
Less : Excise Duty 9.7 4.3 4.9 6.0 6.6
3250.2 3749.1 4595.1 5054.0 5559.4
% age rise (+) or fall (-) in net sales N/A 15.3% 22.6% 10.0% 10.0%
Cost of Sales
i. Raw materials 2941.4 3396.3 4204.2 4624.1 5086.5
a. Imported 0.0 0.0 0.0 0.0 0.0
b. Indigenous 2941.4 3396.3 4204.2 4624.1 5086.5
ii. Other Spares 0.0 0.0 0.0 0.0 0.0
a. Imported 0.0 0.0 0.0 0.0 0.0
b. Indigenous 0.0 0.0 0.0 0.0 0.0
iii. Depreciation 12.2 14.1 14.1 14.1 14.1
iv. Other Manufacturing Exp 43.2 24.6 30.2 33.2 36.5
v Sub-total 2996.8 3434.9 4248.4 4671.3 5137.0
vi. Add: Opening Stock-in-process 23.6 25.6 6.1 7.5 8.2
vii 3020.4 3460.5 4254.5 4678.8 5145.3
viii Deduct: Closing Stock-in-process 25.6 6.1 7.5 8.2 9.1
ix Cost of Production 2994.7 3454.4 4247.1 4670.6 5136.2
x Add: Opening Stock of finished goods 0.0 0.0 0.0 0.0 0.0
xi 2994.7 3454.4 4247.1 4670.6 5136.2
xii Deduct: Closing Stock of finished goods 0.0 0.0 0.0 0.0 0.0
Sub-total(Total Cost of Sales) 2994.7 3454.4 4247.1 4670.6 5136.2
Selling, general and administrative expenses 169.1 185.8 227.8 250.5 275.6
3163.8 3640.3 4474.8 4921.1 5411.8
Operating Profit before Interest 86.4 108.9 120.3 132.9 147.6
3.5 3.3 6.7 18.4 18.8
0.0 0.0 0.0 0.0 0.0
3.5 3.3 6.7 18.4 18.8
Operating Profit after Interest 82.9 105.6 113.6 114.5 128.8
i. Add: Other non-operating Income 18.9 23.0 28.2 31.0 34.1
ii. Deduct: Other non-operating expenses 0.0 0.0 0.0 0.0 0.0
iii. 18.9 23.0 28.2 31.0 34.1
Profit before tax/loss 101.8 128.6 141.8 145.5 162.9
Sub-total
Sub-total
Interest
Interest on Fixed Loans / Term loans
Other Int
Net of other non-operating income / expenses
ASSESSMENT OF WORKING CAPITAL REQUIREMENTS
FORM II - OPERATING STATEMENT
Sales
Gross Sales
Net Sales
Sub-total
17/01/2013 CMA DATA OP INPUT NIRC (Form_II) Page 1

ICICI Bank Limited
32.3 42.5 43.9 45.1 50.5
32.3 42.5 43.9 45.1 50.5
0.0 0.0 0.0 0.0 0.0
0.0 0.0 0.0 0.0 0.0
Net Profit / Loss 69.5 86.1 97.8 100.4 112.4
a. Equity dividend paid / proposed amount
(Interim Div paid + Final Div proposed) 11.9 39.6 39.6 39.6 39.6
b. Dividend Rate (% age)
Retained Profit 57.6 46.5 58.2 60.8 72.8
Retained Profit / Net Profit (% age) 82.8% 54.0% 59.5% 60.6% 64.8%
Provision for taxes
Income Tax provision
Deferred Tax Liability
Deferred Tax Asset
17/01/2013 CMA DATA OP INPUT NIRC (Form_II) Page 2

ICICI Bank Limited
FORM III - ANALYSIS OF BALANCE SHEET
LIABILITIES
Name : RITIKA SYSTEMS PRIVATE LIMITED
0
Audited Audited Provisionals Projected Projected
Year 2011 2012 2013 2014 2015
Number of months 12 12 12 12 12
CURRENT LIABILITIES
1 Short-term borrowing from banks
i. From applicant banks 0.0 0.0 100.0 100.0 100.0
ii. From other banks 0.0 0.0 0.0 0.0 0.0
iii. (of which BP & BD) 0.0 0.0 0.0 0.0 0.0
Sub-total[i + ii] (A) 0.0 0.0 100.0 100.0 100.0
2 Short term borrowings from others 0.0 0.0 0.0 0.0 0.0
3 Sundry Creditors for goods 288.3 397.2 724.6 766.9 809.6
4 28.6 18.1 11.1 12.2 13.4
5 Provision for Taxation 0.0 0.0 0.0 0.0 0.0
6 Dividend payable 0.0 0.0 0.0 0.0 0.0
7 Other statutory liabilities (due within 1 year) 5.9 3.9 4.8 5.3 5.8
8 0.0 0.0 0.0 0.0 0.0
9 Other current liabilities & provisions -0.2 9.0 11.1 12.2 13.4
a. Interest Accrued but not due 0.0 0.0 0.0 0.0 0.0
b. Interest Accrued and due 0.0 0.0 0.0 0.0 0.0
c. Creditors for Expenses 0.0 0.0 0.0 0.0 0.0
d. Other current liabilities -0.2 9.0 11.1 12.2 13.4
Sub total [2 to 9] (B) 322.5 428.3 751.5 796.6 842.2
10 Total current liabilities[A + B] 322.5 428.3 851.5 896.6 942.2
TERM LIABILITIES
11 Debentures (not maturing within 1 year) 0.0 0.0 0.0 0.0 0.0
12 Preference Shares (redeemable after 1 year) 0.0 0.0 0.0 0.0 0.0
13 Term loans 0.0 0.0 0.0 0.0 0.0
14 Defferd Tax Liability 0.0 0.0 0.0 0.0 0.0
15 Other term liabilities 0.0 0.0 0.0 0.0 0.0
16 Total Term Liabilities[11 to 15] 0.0 0.0 0.0 0.0 0.0
17 Total Outside Liabilities[10 + 16] 322.5 428.3 851.5 896.6 942.2
NET WORTH
18 Ordinary Share Capital 34.1 34.1 34.1 34.1 34.1
19 Share Application Money 0.0 0.0 0.0 0.0 0.0
20 General Reserve 45.0 53.6 398.8 398.8 398.8
21 Balnce in profit and loss a/c 411.5 449.3 162.3 223.1 295.8
22 Share Premium 0.0 0.0 0.0 0.0 0.0
Advance received from customers
Instalments of term loans / debentures etc. (due within
1 year)
17/01/2013 CMA DATA OP INPUT NIRC (Form_III) Page 3

ICICI Bank Limited
23 Revaluation Reserve 0.0 0.0 0.0 0.0 0.0
24 Other Reserves 0.0 0.0 0.0 0.0 0.0
25 Quasi Equity 0.0 0.0 0.0 0.0 0.0
26 Net Worth 490.5 537.0 595.2 656.0 728.8
TOTAL LIABILITIES[17 + 26] 813.0 965.2 1446.7 1552.6 1671.0
FORM III - ANALYSIS OF BALANCE SHEET
LIABILITIES
Audited Audited Provisionals Projected Projected
Year 2011 2012 2013 2014 2015
Number of months 12 12 12 12 12
CURRENT ASSETS
1 181.7 109.6 34.3 37.7 41.5
i. Cash Balance 0.5 0.3 0.4 0.4 0.5
ii. Bank Balance 181.2 109.2 33.9 37.3 41.0
2 Investments (other than long term) 136.4 50.7 37.2 40.9 45.0
i. Govt. and other trustee securities 0.0 0.0 0.0 0.0 0.0
ii. Fixed Deposits with banks 136.4 50.7 37.2 40.9 45.0
4 Sundry Debtors 68.9 291.2 668.9 735.7 809.3
i. Domestic Receivables ( including bills purchased and discounted)68.9 291.2 668.9 735.7 809.3
ii. Export Receivables ( including bills purchased and discounted)0.0 0.0 0.0 0.0 0.0
5 Inventories 168.2 183.1 332.8 366.1 402.7
i. Raw Material 142.6 177.0 325.3 357.8 393.6
a. Imported 0.0 0.0 0.0 0.0 0.0
b. Indigenous 142.6 177.0 325.3 357.8 393.6
ii. Stocks-in-process 25.6 6.1 7.5 8.2 9.1
iii. Finished Goods 0.0 0.0 0.0 0.0 0.0
iv. Stores and Spares 0.0 0.0 0.0 0.0 0.0
a. Imported 0.0 0.0 0.0 0.0 0.0
b. Indigenous 0.0 0.0 0.0 0.0 0.0
6 Advances recoverable in cash or in kind 1.7 2.2 2.7 3.0 3.3
7 Advances to suppliers of raw materials 0.0 0.0 0.0 0.0 0.0
8 Advance Income Tax 0.8 0.2 0.3 0.3 0.3
9 Other current assets (specify major items) 30.0 70.0 55.8 61.3 67.5
a. Prepaid Expenses 2.3 2.9 3.6 3.9 4.3
b. Other Advances / current asset 27.7 67.1 52.2 57.4 63.1
10 Total Current Assets (1 to 10) 587.7 707.0 1131.9 1245.0 1369.5
FIXED ASSETS
11 Gross Block 159.5 166.9 166.9 166.9 166.9
12 Add : Capital Work in Progress 0.0 90.6 178.6 178.6 178.6
13 159.5 257.5 345.5 345.5 345.5
14..Less Accumulated Depreciation 74.1 88.2 102.3 116.3 130.4
Net Block (13-14) 85.3 169.3 243.2 229.2 215.1
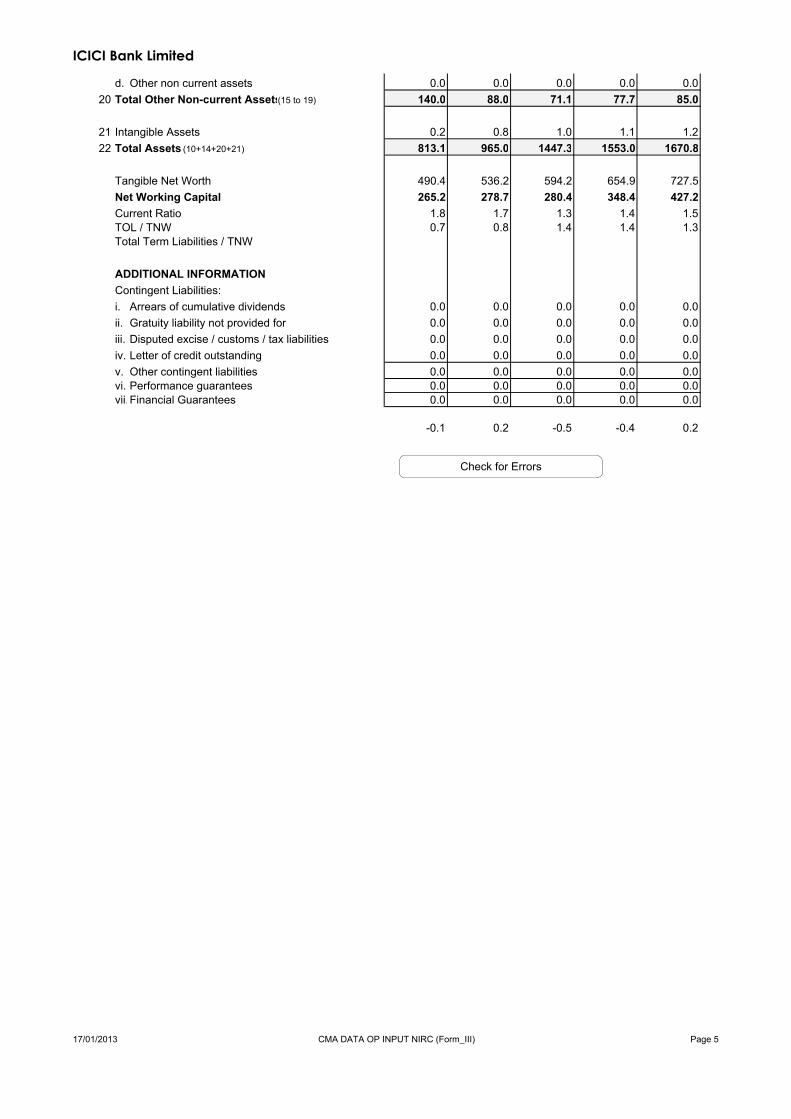
OTHER NON-CURRENT ASSETS
15 Exposure in group companies 0.0 0.0 0.0 0.0 0.0
a. Investments 0.0 0.0 0.0 0.0 0.0
b. Advances 0.0 0.0 0.0 0.0 0.0
16 Debtors more than six months 137.5 51.5 63.1 69.4 76.4
17 Investments 0.0 34.0 5.0 5.0 5.0
18 Fixed Deposits ( Non Current ) 0.0 0.0 0.0 0.0 0.0
19 Others 2.4 2.4 3.0 3.3 3.6
a. Dues from directors / partners / promoters 0.0 0.0 0.0 0.0 0.0
b. Advances to suppliers of capital goods 0.0 0.0 0.0 0.0 0.0
c. Security deposits with government departments 2.4 2.4 3.0 3.3 3.6
Total
Cash and Bank Balance
17/01/2013 CMA DATA OP INPUT NIRC (Form_III) Page 4
ICICI Bank Limited
d. Other non current assets 0.0 0.0 0.0 0.0 0.0
20 Total Other Non-current Assets(15 to 19) 140.0 88.0 71.1 77.7 85.0
21 Intangible Assets 0.2 0.8 1.0 1.1 1.2
22 Total Assets (10+14+20+21) 813.1 965.0 1447.3 1553.0 1670.8
Tangible Net Worth 490.4 536.2 594.2 654.9 727.5
Net Working Capital 265.2 278.7 280.4 348.4 427.2
Current Ratio 1.8 1.7 1.3 1.4 1.5
TOL / TNW 0.7 0.8 1.4 1.4 1.3
Total Term Liabilities / TNW
ADDITIONAL INFORMATION
Contingent Liabilities:
i. Arrears of cumulative dividends 0.0 0.0 0.0 0.0 0.0
ii. Gratuity liability not provided for 0.0 0.0 0.0 0.0 0.0
iii. Disputed excise / customs / tax liabilities 0.0 0.0 0.0 0.0 0.0
iv. Letter of credit outstanding 0.0 0.0 0.0 0.0 0.0
v. Other contingent liabilities 0.0 0.0 0.0 0.0 0.0
vi. Performance guarantees 0.0 0.0 0.0 0.0 0.0
vii.Financial Guarantees 0.0 0.0 0.0 0.0 0.0
-0.1 0.2 -0.5 -0.4 0.2
Check for Errors
17/01/2013 CMA DATA OP INPUT NIRC (Form_III) Page 5
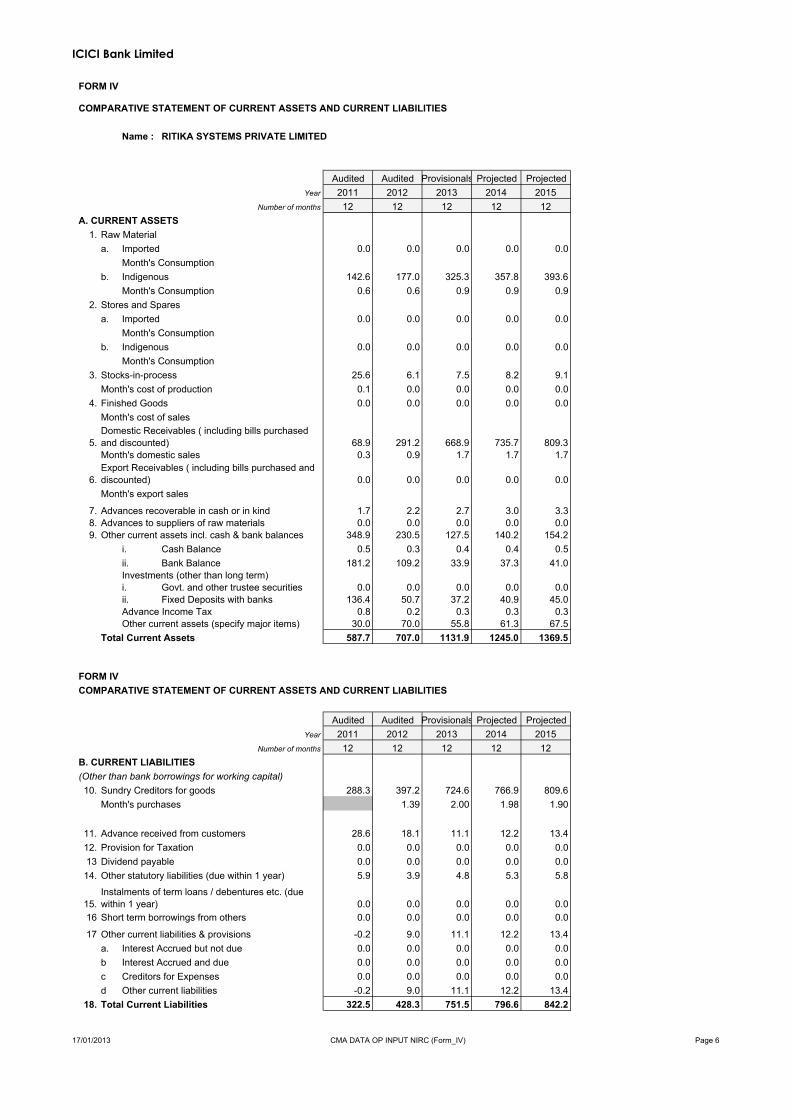
ICICI Bank Limited
FORM IV
COMPARATIVE STATEMENT OF CURRENT ASSETS AND CURRENT LIABILITIES
Name : RITIKA SYSTEMS PRIVATE LIMITED
Audited Audited Provisionals Projected Projected
Year 2011 2012 2013 2014 2015
Number of months 12 12 12 12 12
A. CURRENT ASSETS
1.
a. Imported 0.0 0.0 0.0 0.0 0.0
Month's Consumption
b. Indigenous 142.6 177.0 325.3 357.8 393.6
Month's Consumption 0.6 0.6 0.9 0.9 0.9
2. Stores and Spares
a. Imported 0.0 0.0 0.0 0.0 0.0
Month's Consumption
b. Indigenous 0.0 0.0 0.0 0.0 0.0
Month's Consumption
3. Stocks-in-process 25.6 6.1 7.5 8.2 9.1
Month's cost of production 0.1 0.0 0.0 0.0 0.0
4. Finished Goods 0.0 0.0 0.0 0.0 0.0
Month's cost of sales
5. 68.9 291.2 668.9 735.7 809.3
Month's domestic sales 0.3 0.9 1.7 1.7 1.7
6. 0.0 0.0 0.0 0.0 0.0
Month's export sales
7. 1.7 2.2 2.7 3.0 3.3
8. Advances to suppliers of raw materials 0.0 0.0 0.0 0.0 0.0
9. Other current assets incl. cash & bank balances 348.9 230.5 127.5 140.2 154.2
i. Cash Balance 0.5 0.3 0.4 0.4 0.5
ii. Bank Balance 181.2 109.2 33.9 37.3 41.0
i. Govt. and other trustee securities 0.0 0.0 0.0 0.0 0.0
ii. Fixed Deposits with banks 136.4 50.7 37.2 40.9 45.0
Advance Income Tax 0.8 0.2 0.3 0.3 0.3
Other current assets (specify major items) 30.0 70.0 55.8 61.3 67.5
Total Current Assets 587.7 707.0 1131.9 1245.0 1369.5
FORM IV
COMPARATIVE STATEMENT OF CURRENT ASSETS AND CURRENT LIABILITIES
Audited Audited Provisionals Projected Projected
Year 2011 2012 2013 2014 2015
Number of months 12 12 12 12 12
B. CURRENT LIABILITIES
(Other than bank borrowings for working capital)
10. Sundry Creditors for goods 288.3 397.2 724.6 766.9 809.6
Month's purchases 1.39 2.00 1.98 1.90
11. 28.6 18.1 11.1 12.2 13.4
12. Provision for Taxation 0.0 0.0 0.0 0.0 0.0
13 Dividend payable 0.0 0.0 0.0 0.0 0.0
14. Other statutory liabilities (due within 1 year) 5.9 3.9 4.8 5.3 5.8
15. 0.0 0.0 0.0 0.0 0.0
16 0.0 0.0 0.0 0.0 0.0
17 -0.2 9.0 11.1 12.2 13.4
a. 0.0 0.0 0.0 0.0 0.0
b 0.0 0.0 0.0 0.0 0.0
c Creditors for Expenses 0.0 0.0 0.0 0.0 0.0
d Other current liabilities -0.2 9.0 11.1 12.2 13.4
18. 322.5 428.3 751.5 796.6 842.2Total Current Liabilities
Advance received from customers
Instalments of term loans / debentures etc. (due
within 1 year)
Short term borrowings from others
Other current liabilities & provisions
Interest Accrued but not due
Interest Accrued and due
Raw Material
Domestic Receivables ( including bills purchased
and discounted)
Export Receivables ( including bills purchased and
discounted)
Advances recoverable in cash or in kind
Investments (other than long term)
17/01/2013 CMA DATA OP INPUT NIRC (Form_IV) Page 6
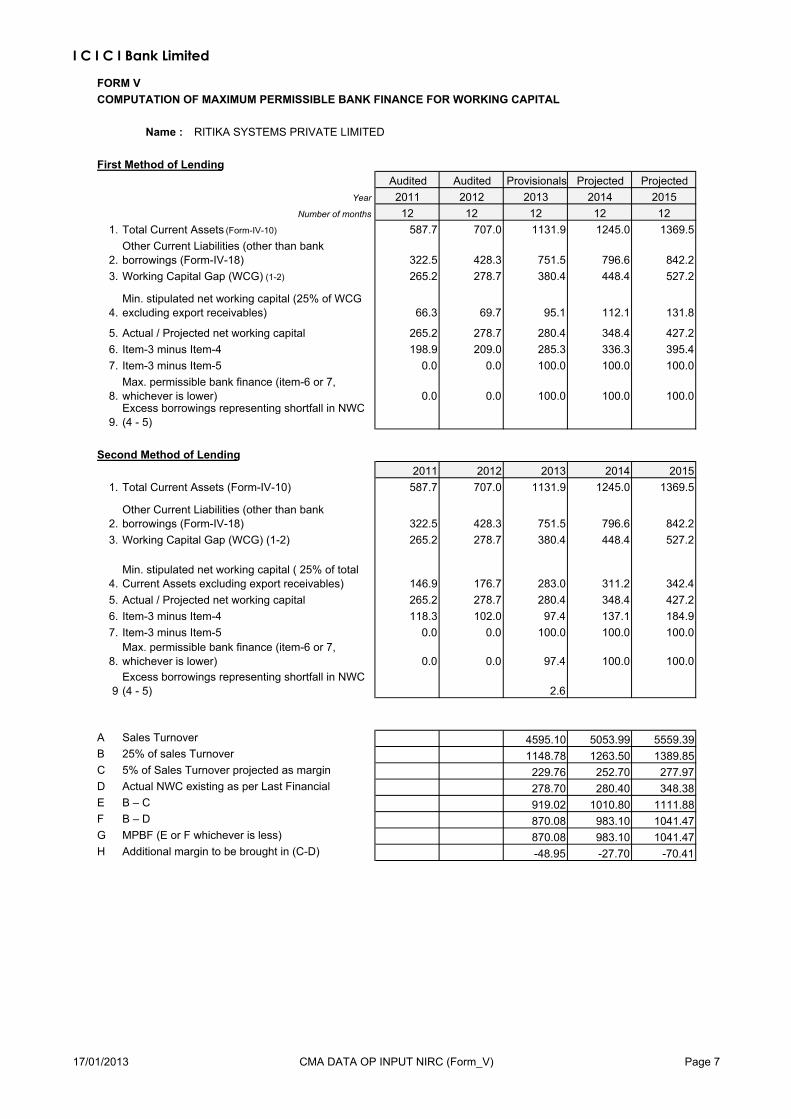
I C I C I Bank Limited
FORM V
COMPUTATION OF MAXIMUM PERMISSIBLE BANK FINANCE FOR WORKING CAPITAL
Name : RITIKA SYSTEMS PRIVATE LIMITED
First Method of Lending
Audited Audited Provisionals Projected Projected
Year 2011 2012 2013 2014 2015
Number of months 12 12 12 12 12
1. Total Current Assets (Form-IV-10) 587.7 707.0 1131.9 1245.0 1369.5
2. 322.5 428.3 751.5 796.6 842.2
3. Working Capital Gap (WCG) (1-2) 265.2 278.7 380.4 448.4 527.2
4. 66.3 69.7 95.1 112.1 131.8
5. Actual / Projected net working capital 265.2 278.7 280.4 348.4 427.2
6. Item-3 minus Item-4 198.9 209.0 285.3 336.3 395.4
7. Item-3 minus Item-5 0.0 0.0 100.0 100.0 100.0
8. 0.0 0.0 100.0 100.0 100.0
9.
Second Method of Lending
2011 2012 2013 2014 2015
1. Total Current Assets (Form-IV-10) 587.7 707.0 1131.9 1245.0 1369.5
2. 322.5 428.3 751.5 796.6 842.2
3. Working Capital Gap (WCG) (1-2) 265.2 278.7 380.4 448.4 527.2
4. 146.9 176.7 283.0 311.2 342.4
5. Actual / Projected net working capital 265.2 278.7 280.4 348.4 427.2
6. Item-3 minus Item-4 118.3 102.0 97.4 137.1 184.9
7. Item-3 minus Item-5 0.0 0.0 100.0 100.0 100.0
8. 0.0 0.0 97.4 100.0 100.0
9 2.6
A 4595.10 5053.99 5559.39
B 1148.78 1263.50 1389.85
C 229.76 252.70 277.97
D 278.70 280.40 348.38
E 919.02 1010.80 1111.88
F 870.08 983.10 1041.47
G 870.08 983.10 1041.47
H -48.95 -27.70 -70.41
Max. permissible bank finance (item-6 or 7,
whichever is lower)
Excess borrowings representing shortfall in NWC
(4 - 5)
Other Current Liabilities (other than bank
borrowings (Form-IV-18)
Min. stipulated net working capital (25% of WCG
excluding export receivables)
Max. permissible bank finance (item-6 or 7,
whichever is lower)Excess borrowings representing shortfall in NWC
(4 - 5)
Other Current Liabilities (other than bank
borrowings (Form-IV-18)
Min. stipulated net working capital ( 25% of total
Current Assets excluding export receivables)
MPBF (E or F whichever is less)
Additional margin to be brought in (C-D)
Sales Turnover
25% of sales Turnover
5% of Sales Turnover projected as margin
Actual NWC existing as per Last Financial
StatementB – C
B – D
17/01/2013 CMA DATA OP INPUT NIRC (Form_V) Page 7

ICICI Banking Corporation Ltd.
FORM VI
FUNDS FLOW STATEMENT
Name : RITIKA SYSTEMS PRIVATE LIMITED
Audited Provisionals Projected Projected
Year 2012 2013 2014 2015
Number of months 12 12 12 12
1. SOURCES
a. Net Profit 86.1 97.8 100.4 112.4
b. Depreciation 14.1 14.1 14.1 14.1
c. Increase in Capital 0.0 0.0 0.0 0.0
d. Increase in Term Liabilities 0.0 0.0 0.0 0.0
e. Decrease in
i. Fixed Assets
ii. Other non-current Assets 51.4 16.6
f.
g. TOTAL 151.5 128.5 114.5 126.5
2. USES
a. Net loss
b. Decrease in Term Liabilities
c. Increase in
i. Fixed Assets 98.0 88.0 0.0 0.0
ii. Other non-current Assets 6.7 7.4
d. Dividend Payments 39.6 39.6 39.6 39.6
e. 39.6 39.6 39.6 39.6
f. 177.2 167.2 85.9 86.6
3. Long Term Surplus (+) / Deficit (-) [1-2] -25.7 -38.7 28.5 39.8
4. Increase/decrease in current assets
* (as per details given below) 119.3 425.0 113.0 124.5
5. 105.8 323.3 45.1 45.7
6. Increase/decrease in working capital gap 13.5 101.7 68.0 78.8
7. Net Surplus / Deficit (-) [3-6] -39.2 -140.4 -39.4 -39.0
8. Increase/decrease in bank borrowings 0.0 100.0 0.0 0.0
9. Increase/decrease in NET SALES 498.9 846.0 458.9 505.4
* Break up of item-4
i. Increase/decrease in Raw Materials 34.4 148.4 32.5 35.8
ii. Increase/decrease in Stocks-in-Process -19.5 1.4 0.7 0.8
iii. Increase/decrease in Finished Goods 0.0 0.0 0.0 0.0
Others
Others
TOTAL
Increase/decrease in current liabilities other than
bank borrowings
17/01/2013 CMA DATA OP INPUT NIRC (Form_VI) Page 8

ICICI Banking Corporation Ltd.
iv. Increase/decrease in Receivables
a) Domestic 222.3 377.7 66.8 73.6
b) 0.0 0.0 0.0 0.0
v. Increase/decrease in Stores & Spares 0.0 0.0 0.0 0.0
vi. Increase/decrease in other current assets -117.9 -102.5 13.0 14.3
119.3 425.0 113.0 124.5
Export
TOTAL
17/01/2013 CMA DATA OP INPUT NIRC (Form_VI) Page 9

ICICI Bank Limited
Name : RITIKA SYSTEMS PRIVATE LIMITED
Audited Audited Provisionals Projected Projected
2011 2012 2013 2014 2015
Number of months 12 12 12 12 12
1 Total Operating Income(TOI) 3250.2 3749.1 4595.1 5054.0 5559.4
2 E B I D T A 98.6 122.9 134.3 147.0 161.7
3 E B I D T A/ TOI (%) 3.0% 3.3% 2.9% 2.9% 2.9%
4 Interest 3.5 3.3 6.7 18.4 18.8
5 Depreciation 12.2 14.1 14.1 14.1 14.1
6 Operating Profit after Dep.& Int. 82.9 105.6 113.6 114.5 128.8
7 Non Operating Income/Exps. 18.9 23.0 28.2 31.0 34.1
8 P B T 101.8 128.6 141.8 145.5 162.9
9 P A T 69.5 86.1 97.8 100.4 112.4
10 PAT/ TOI (%) 2.1% 2.3% 2.1% 2.0% 2.0%
11 Net Cash Accruals (NCA) 81.7 100.2 111.9 114.5 126.5
12 Net Fixed Assets 85.3 169.3 243.2 229.2 215.1
13 Tangible Networth (TNW) 490.4 536.2 594.2 654.9 727.5
14 Exposure in Group Co./Sub.
--- Investments 0.0 0.0 0.0 0.0 0.0
--- Loans and Advances 0.0 0.0 0.0 0.0 0.0
15 Adjusted T N W (ATNW) 490.4 536.2 594.2 654.9 727.5
16 Long Term Debt (LTD) 0.0 0.0 0.0 0.0 0.0
17 Short Term Debt (STD) 0.0 0.0 0.0 0.0 0.0
18 Working Cap. Bank Finance 0.0 0.0 100.0 100.0 100.0
19 Financial guarantees 0.0 0.0 0.0 0.0 0.0
20 Total Debt 0.0 0.0 100.0 100.0 100.0
21 TOL 322.5 428.3 851.5 896.6 942.2
21 Total Debt/ ATNW 0.0 0.0 0.2 0.2 0.1
22 L T D / AT N W 0.0 0.0 0.0 0.0 0.0
23 T O L / T N W 0.7 0.8 1.4 1.4 1.3
24 T O L / A T N W 0.7 0.8 1.4 1.4 1.3
25 Total Current Assets 587.7 707.0 1131.9 1245.0 1369.5
26 Total Current Liabilities 322.5 428.3 851.5 896.6 942.2
27 Net Working Capital 265.2 278.7 280.4 348.4 427.2
28 Current Ratio 1.8 1.7 1.3 1.4 1.5
29 R O C E (%) 24.6% 27.3% 22.4% 20.4% 20.8%
30 Interest Coverage Ratio 19.2 24.7 13.6 5.5 5.9
31 Total Debt/Net Cash Accrual 0.0 0.0 0.9 0.9 0.8
32 Inventory Turnover days 20.2 19.1 28.2 28.2 28.2
33 Debtors Turnover days 22.9 32.9 57.4 57.4 57.4
34 Creditors Turnover days 0.0 41.7 59.9 59.3 56.9
35 DSCR (in case of term loan) #DIV/0! #DIV/0! #DIV/0! #DIV/0!
Fund Flow Analysis
2012 2013 2014 2015
151.5 128.5 114.5 126.5
177.2 167.2 85.9 86.6
-25.7 -38.7 28.5 39.8
20.3% 60.1% 10.0% 10.0%
Pattern of TCA Funding
Year ended / Ending March 31 2011 2012 2013 2014 2015
Sundry Creditors 49.1% 56.2% 64.0% 61.6% 59.1%
Other Current Liabilities 5.8% 4.4% 2.4% 2.4% 2.4%
Bank Borrowings 0.0% 0.0% 8.8% 8.0% 7.3%
Long Term funds 45.1% 39.4% 24.8% 28.0% 31.2%
100.0% 100.0% 100.0% 100.0% 100.0%
Surplus/Deficit
Surplus / Incremental build up of current assets (%)
Total
KEY FINANCIAL INDICATORS
Sr. No. Parameters
Financial Year
Long Term Sources
Long Term uses
17/01/2013 CMA DATA OP INPUT NIRC (Key Finacials) Page 10

ICICI Bank Limited
17/01/2013 CMA DATA OP INPUT NIRC (Key Finacials) Page 11

Year 2012 2013 2014 2015
Nature of Financials Audited Provisionals Projected Projected
No of months 12 12 12 12
Cash Flows from Operating activities
Net profit before taxation 128.6 141.8 145.5 162.9
Adjustment for :
Depreciation 14.1 14.1 14.1 14.1
Dividend Received 0.0 0.0 0.0 0.0
Interest expenses 3.3 6.7 18.4 18.8
Interest Received -22.9 -28.1 -30.9 -34.0
Profit / Loss on sale of fixed assets / investments 0.0 0.0 0.0 0.0
Extraordinary income / expenses 0.0 0.0 0.0 0.0
Operating profit before working capital changes 123.0 134.4 147.1 161.8
Changes in current assets ( exclud cash and bank balances) -191.4 -500.2 -109.6 -120.7
Change in Debtors -222.3 -377.7 -66.8 -73.6
Change in Stock -14.9 -149.8 -33.2 -36.6
Change in other current assets 45.8 27.2 -9.6 -10.5
Changes in current liabilities( exclud div and debts) 105.8 423.3 45.1 45.7
Change in creditors 108.9 327.4 42.4 42.7
Change in bank finance 0.0 100.0 0.0 0.0
Change in other current liabilities -3.2 -4.1 2.7 3.0
Cash generated from operations 37.4 57.5 82.5 86.7
Income tax for the current year ( excluding deferred tax) 42.5 43.9 45.1 50.5
Cash from opeartions before extraordinary items -5.1 13.5 37.4 36.2
Extraordinary items 0.0 0.0 0.0 0.0
Net cash from operating activities ( 1 ) -5.1 13.5 37.4 36.2
Cash Flows from Investing activities
Dividend Received 0.0 0.0 0.0 0.0
Interest Received 22.9 28.1 30.9 34.0
Purchase / Sale of Fixed Assets 0.0 0.0 0.0 0.0
Purchase / Sale of Intangible Assets 0.0 0.0 0.0 0.0
Change in Non current assets 52.0 16.8 -6.6 -7.3
Net cash from investing activities ( 2 ) 74.9 44.9 24.3 26.7
Cash Flows from Financing activities
Interest expenses -3.3 -6.7 -18.4 -18.8
Dividend paid -39.6 -39.6 -39.6 -39.6
Increase / Decrease in Share Capital 0.0 0.0 0.0 0.0
Change in Share Premium 0.0 0.0 0.0 0.0
Change in Debentures / Preference Shares 0.0 0.0 0.0 0.0
Change in Term Debt 0.0 0.0 0.0 0.0
Change in other short / long term debts 0.0 0.0 0.0 0.0
Net cash from financing activities ( 3 ) -42.9 -46.3 -58.0 -58.4
Net increase in cash / bank balance ( 4 ) = ( 1 ) + ( 2 ) + ( 3 ) 26.9 12.1 3.7 4.5
Cash / Bank Balance at the beginning of period ( 5 ) 181.7 109.6 34.3 37.7
Cash / Bank Balance at the end of period ( 4 ) + ( 5 ) 208.6 121.7 38.0 42.2
Cash / Bank Balance at the end of period ( As per input sheet ) 109.6 34.3 37.7 41.5
Check 99.1 87.4 0.3 0.7
CASH FLOW STATEMENT
RITIKA SYSTEMS PRIVATE LIMITED


Trend Analysis of Components of Cost
Nature of Financials Audited Audited ProvisionalsProjected Projected
Year 2011 2012 2013 2014 2015
12 12 12 12 12
Sales growth
Domestic 15.1 22.6 10.0 10.0
Exports #DIV/0! #DIV/0! #DIV/0! #DIV/0!
% growth in sales 15.3% 22.6% 10.0% 10.0%
Sales 100.0% 100.0% 100.0% 100.0% 100.0%
RM Consumed 90.5% 90.6% 91.5% 91.5% 91.5%
Spares consumed 0.0% 0.0% 0.0% 0.0% 0.0%
Other Manufacturing Exp 1.3% 0.7% 0.7% 0.7% 0.7%
Change in WIP -0.1% 0.5% 0.0% 0.0% 0.0%
Change in Finished goods 0.0% 0.0% 0.0% 0.0% 0.0%
Administartive and Selling Exp 5.2% 5.0% 5.0% 5.0% 5.0%
EBIDTA 3.0% 3.3% 2.9% 2.9% 2.9%
Depreciation 0.4% 0.4% 0.3% 0.3% 0.3%
Interest 0.1% 0.1% 0.1% 0.4% 0.3%
Operating Profit 2.6% 2.8% 2.5% 2.3% 2.3%
Non Operating Income 0.6% 0.6% 0.6% 0.6% 0.6%
Non Operating Expenses 0.0% 0.0% 0.0% 0.0% 0.0%
PBT 3.1% 3.4% 3.1% 2.9% 2.9%
Tax 1.0% 1.1% 1.0% 0.9% 0.9%
PAT 2.1% 2.3% 2.1% 2.0% 2.0%

Name of the customer :
Financial Year End :
BALANCE SHEET : ASSETS 2011 2012 2013 2014 2015 BALANCE SHEET : LIABILITIES 2011 2012 2013 2014 2015
Number of months 12 12 12 12 12 Number of months 12 12 12 12 12
Cash and Marketable Securities 318.0 160.3 71.5 78.6 86.5 Short Term Debts 0.0 0.0 0.0 0.0 0.0
Debtors 68.9 291.2 668.9 735.7 809.3 Creditors 288.3 397.2 724.6 766.9 809.6
Inventory 168.2 183.1 332.8 366.1 402.7 Working Capital Bank Finance 0.0 0.0 100.0 100.0 100.0
Other Current Assets 32.5 72.4 58.7 64.6 71.1 Other Current Liabilities 34.2 31.1 27.0 29.7 32.6
CURRENT ASSETS 587.7 707.0 1131.9 1245.0 1369.5 CURRENT LIABILITIES 322.5 428.3 851.5 896.6 942.2
Net Fixed Assets 85.3 169.3 243.2 229.2 215.1 Tangible Net Worth 490.4 536.2 594.2 654.9 727.5
Non Current Assets 140.0 88.0 71.1 77.7 85.0 Long Term Debt 0.0 0.0 0.0 0.0 0.0
TOTAL ASSETS 813.0 964.2 1446.3 1551.8 1669.6 TOTAL LIABILITIES 812.8 964.4 1445.7 1551.5 1669.8
PROFIT & LOSS 2011 2012 2013 2014 2015 CASH FLOWS 2011 2012 2013 2014 2015
SALES 3250.2 3749.1 4595.1 5054.0 5559.4 NET CASH ACCRUALS 81.7 100.2 111.9 114.5 126.5
COST OF SALES 2994.7 3454.4 4247.1 4670.6 5136.2
SELLING AND ADMINISTRATION 169.1 185.8 227.8 250.5 275.6 OPERATING ACTIVITIES -5.1 13.5 37.4 36.2 537.6
EBIDTA 98.6 122.9 134.3 147.0 161.7 INVESTING ACTIVITIES 74.9 44.9 24.3 26.7 12.4
INTEREST 3.5 3.3 6.7 18.4 18.8 FINANCING ACTIVITIES -42.9 -46.3 -58.0 -58.4 -29.2
DEPRECIATION 12.2 14.1 14.1 14.1 14.1
OPERATING PROFIT 82.9 105.6 113.6 114.5 128.8 NET CHANGE IN CASH 26.9 12.1 3.7 4.5 520.8
PBT 101.8 128.6 141.8 145.5 162.9
PAT 69.5 86.1 97.8 100.4 112.4
CHANGE IN TNW 490.4 45.8 58.0 60.7 72.7
RATIOS 2011 2012 2013 2014 2015 RATIOS 2011 2012 2013 2014 2015
EBIDTA Margins 3.0% 3.3% 2.9% 2.9% 2.9% Total Debt 0.0 0.0 100.0 100.0 100.0
PAT Margins 2.1% 2.3% 2.1% 2.0% 2.0% Total Debt / NCA 0.0 0.0 0.9 0.9 0.8
Growth in Sales N/A 15.3% 22.6% 10.0% 10.0% Total Debt / EBIDTA 0.0 0.0 0.7 0.7 0.6
TOL / TNW 0.7 0.8 1.4 1.4 1.3
Days Payable 0 42 60 59 57
Days Receivable 8 28 53 53 53 Interest Coverage 19.2 24.7 13.6 5.5 5.9
Days Inventory 20 19 29 29 29 DSCR 0.0 #DIV/0! #DIV/0! #DIV/0! #DIV/0!
RITIKA SYSTEMS PRIVATE LIMITED
31st March