STP-I STP-2 · 12/11/2019 · STP-I STP-2 . Title: Mobile Created Date: 12/11/2019 10:07:54 AM

WASTEWATER PLANT PERFORMANCE EVALUATION
April 13, 2010 – June 15, 2010
Clymer Borough Municipal Authority STP Water Pollution Control Facility
NPDES #PA0090140
Bureau of Water Standards & Facility Regulation POTW Optimization Program

Clymer Borough Municipal Authority Wastewater Plant Performance Evaluation
Department of Environmental Protection Bureau of Water Standards and Facility Regulation
Table of Contents
1. Executive Summary .................................................................................................................... 1 2. Background................................................................................................................................. 3 3. PA American-Two Lick Creek Drinking Water Plant................................................................ 4
Plant Description......................................................................................................................... 4 Raw Water Sampling Results ..................................................................................................... 5 Discussion................................................................................................................................... 8
4. Initial Observations..................................................................................................................... 9 Plant Description......................................................................................................................... 9 Past Performance ...................................................................................................................... 10 Current Performance................................................................................................................. 11
Headworks ............................................................................................................................ 12 Aeration................................................................................................................................. 13 Secondary Settling ................................................................................................................ 13 Bio-solids removal ................................................................................................................ 13 Disinfection........................................................................................................................... 14
5. Equipment Installation & Calibration....................................................................................... 15 Continuous Digital Monitoring............................................................................................. 15 Laboratory Equipment .......................................................................................................... 15
6. Process Monitoring ................................................................................................................... 17 Interpretation of Data............................................................................................................ 17 Microscopy with Digital Photography.................................................................................. 29 Field Sampling ...................................................................................................................... 30
7. Process Control ......................................................................................................................... 31 Permit Modifications ............................................................................................................ 31 General.................................................................................................................................. 31 Solids Tracking ..................................................................................................................... 31 DO findings........................................................................................................................... 32 ORP....................................................................................................................................... 32 DO Profile............................................................................................................................. 33 DO Grab Testing................................................................................................................... 34 Nitrate and Ammonia Nitrogen ............................................................................................ 34 pH, Temperature ................................................................................................................... 35 Flow Measurement................................................................................................................ 35 Laboratory Tests ................................................................................................................... 35 Method 1623 Pathogen Test Results: ................................................................................... 36
8. Conclusions............................................................................................................................... 37 Considerations for Operational Modifications...................................................................... 37 DO control ............................................................................................................................ 37 Optimum Levels for Nitrification ......................................................................................... 37 Pathogen control ................................................................................................................... 38 Laboratory methods .............................................................................................................. 38 Inflow/Infiltration ................................................................................................................. 38 Solids Management and Inventory Control .......................................................................... 38

Clymer Borough Municipal Authority Wastewater Plant Performance Evaluation
Department of Environmental Protection Bureau of Water Standards and Facility Regulation
ATTACHMENTS
A—Program Description………………………………………………………………… A-1 POTW Optimization Program Description and Goals Wastewater Plant Performance Evaluation Potential Benefits B—WPPE Team…………………………………………………………………………. B-1 C—Suggested Sampling Frequencies……………………………………………………. C-1 D—Treatment Schematic………………………………………………………………… D-1 E— Municipal Authority of Clymer Laboratory Sample Results…………………........... E-1 Effluent, Upstream, and Downstream Mixed Liquor Suspended Solids, Return Activated Sludge, and Influent F—2010 Flow Data, April 2010 through June 2010…………………………………….. F-1 G—Equipment Deployed………………………………………………………………… G-1 Digital, Continuously Monitoring Probes Laboratory Equipment On-Loan H—Process Control Results……………………………………………………………… H-1 I—Graphs: Monthly Monitoring Examples……………………………………………… I-1 J—Graphs: Daily Monitoring Examples………………………………………………… J-1 K—Equipment Placement Photographs………………………………………………….. K-1

Clymer Borough Municipal Authority Wastewater Plant Performance Evaluation
Department of Environmental Protection Bureau of Water Standards and Facility Regulation
FIGURES
Figure 1: PA American-Two Lick Creek water treatment plant schematic.…………………….. 5 Figure 2: PATLC water treatment plant raw water nutrient sampling results……………..…….. 6 Figure 3: PATLC water treatment plant raw water Giardia lamblia/Cryptosporidium results….. 6 Figure 4: Historical raw water data, Giardia/Cryptosporidium..……………….……………….. 7 Figure 5: Historical raw water data for pH and Alkalinity ………………….…………………... 8 Figure 6: Clymer WWTP and PATLC drinking water intake …….……………………………. 10 Figure 7: 2008-2010 Hydraulic Loadings ..……………………………………………………... 12 Figure 8: Daily flow readings over WPPE .…………………………………………………….. 13 Figure 9: DO/Ammonia/Nitrate readings during attempted on/off aeration denitrification trial... 17 Figure 10: DO vs. time, June 2, 2010………………………………………………………………18 Figure 11: DO vs. time, June 4, 2010……………………………………………………...……….19 Figure 12: ORP, Nitrate & Ammonia Nitrogen, June 4, 2010…………………………….……… 20 Figure 13: DO and Ammonia, June 22, 2010……………………………………………………... 21 Figure 14: Mixed Liquor Suspended Solids-North Aeration……………………………………… 22 Figure 15: Mixed Liquor Suspended Solids-South Aeration……………………………………… 23 Figure 16: Effluent nutrient reduction over the course of the WPPE……………………………... 24 Figure 17: Influent vs. Effluent Total Nitrogen concentration……………………………………. 25 Figure 18: Influent vs. Effluent Total Phosphorus concentration…………………………………. 25 Figure 19: Influent vs. Effluent Ammonia Nitrogen concentration………………………..……… 26 Figure 20: Cryptosporidium oocysts levels……………………………………………………….. 26 Figure 21: Giardia lamblia levels…………………………………………………………………. 27 Figure 22: Giardia lamblia/TSS comparison………………………..………..…………………... 28 Figure 23: Giardia lamblia/Flow comparison………………………………..…………………… 28 Figure 24: South aeration tank-4/23/10…………………………………………………………… 29 Figure 25: South aeration tank-4/23/10…………………………………………………………… 29 Figure 26: North aeration tank-5/4/10…………………………………………………………….. 30 Figure 27: North aeration tank-5/4/10…………………………………………………………….. 30 Figure 28: DO profile of the Clymer north aeration unit………………………………………….. 33 Figure 29: DO profile of the Clymer south aeration unit………………………………………….. 34 Figure 30: MLSS vs. Centrifuge solids comparison chart for the south aeration tank..……….….. 39 Figure 31: MLSS vs. Centrifuge solids comparison chart for the north aeration tank……………. 40 Figure 32: 2009 sludge removal estimation………………………………………………………. 41 Figure 33: Clymer wastewater treatment plant process flow schematic…………………………... D-1 Figure 34: Clymer wastewater treatment plant monthly flow data………………………………... F-2 Figure 35: Locations of on-line process monitoring equipment…………………………………... G-2 Figure 36: DO values during the month of May 2010…………………………………………….. I-1 Figure 37: Ammonia Nitrogen values during the month of May 2010…………………………… I-1 Figure 38: DO values, May 6, 2010………………………………………………………………. J-1 Figure 39: ORP values, May 6, 2010……………………………………………………………… J-1 Figure 40: Nitrate values, May 6, 2010…………………………………………………………… J-2 Figure 41: Ammonia Nitrogen values, May 6, 2010……………………………………………… J-2 Figure 42: DO, ORP, and pH probes installed in south aeration tank…………………………….. K-1 Figure 43: Nitrate and NH4D probes installed in south aeration tank…………………………….. K-2 Figure 44: Solids drying bed number 2…………………………………………………………….K-3 Figure 45: Laboratory testing area………………………………………………………………… K-4 Figure 46: Computer setup area…………………………………………………………………… K-5 Figure 47: Effluent metering pit just prior to stream discharge…………………………………… K-6

Clymer Borough Municipal Authority Wastewater Plant Performance Evaluation
Department of Environmental Protection Bureau of Water Standards and Facility Regulation
TABLES Table 1: Clymer WWTP 2008 DMR data summary……..….…………….…………….. 11 Table 2: Clymer WWTP 2009 DMR data summary……..………………………….….. 11 Table 3: Initial sampling locations and analyses………………………………………... 30 Table 4: ORP Chart……………………………………………………………………… 33 Table 5: Method 1623 test results……………………………………………………….. 36 Table 6: Optimum nitration indicators…………………………………………………... 37 Table 7: Suggested sampling frequencies………………………………………………... C-1 Table 8: Clymer sample data…………………………………………..……………….... E-2 Table 9: Clymer sample data……………………………………………………...………E-3 Table 10: Clymer wastewater treatment plant flow data …………………………..…....... F-1 Table 11: Clymer bench sheet…………………………………………………..………..... H-1 Table 12: Clymer bench sheet………………………………………………….………….. H-2 Disclaimers: The mention of a particular brand of equipment is in no way an endorsement for any specific company. The Department urges the permittee to research available products and select those which are the most applicable for its situation.
The goal of the Department’s Wastewater Optimization Program is to improve water quality at drinking water intakes by optimizing upstream wastewater plant effluent quality. This often times involves permittees achieving effluent quality above and beyond any permit requirements.
Clymer Borough Municipal Authority Wastewater Plant Performance Evaluation
Department of Environmental Protection Page 1 of 41 Bureau of Water Standards and Facility Regulation
1. Executive Summary The Pennsylvania Department of Environmental Protection (DEP) conducted a Wastewater Plant Performance Evaluation (WPPE) of the Clymer Borough Municipal Authority’s (CBMA) wastewater treatment plant (WWTP) from April through June 2010. A WPPE is an evaluation of existing operations and practices followed by small-scale operational changes meant to optimize effluent quality. The purpose for optimizing effluent quality is to reduce pathogens and nutrients at drinking water intakes directly downstream of the subject facility, with an overall goal of improving surface water quality. The WPPE was performed by staff of DEP’s Operations Monitoring and Training Division, Bureau of Water Standards and Facility Regulation (BWSFR). The WPPE program is conducted under terms of a federal grant administered by the United States Environmental Protection Agency (USEPA). The following items summarize some of the important findings identified during the WPPE:
• Plant operations appear be optimal with solids levels at approximately 2000 mg/l during the summer months. As the temperatures decrease, it may be necessary to increase solids levels to maintain nitrification.
• Dissolved Oxygen (DO) above 3.5 mg/L in the aeration tanks essentially represents wasted energy. It is optimal to maintain DO levels no less than 1.5 mg/L during the aeration phase to ensure that nitrification is occurring in the aeration basins. Levels during the project often dipped to 0.0 mg/L during the day leading to increases in Ammonia levels due to decreased nitrification efficiency in the aeration units.
• It may be advantageous to purchase an updated DO meter. Some DO sensors utilize luminescent measurement of DO instead of membrane sensors which are prone to fouling when utilized in the mixed liquor. On-line DO monitors, if connected to a controller for the blower motors would further maximize treatment and minimize power consumption.
• Solids control is very important to the extended aeration process. While current practices include weekly mixed liquor solids testing additional testing for % solids using a centrifuge can provide a quick and representative snapshot of current solids levels in the mixed liquor and return activated sludge streams. The solids removal process may be a limiting factor due to the small size of the sludge holding tank at this site.
• There were 2 significant rain events (over 1”) during the course of the WPPE which contributed to a temporary significant increase of influent flow.
• Microscopic evaluation of the mixed liquor confirmed the decrease in nitrification efficiency and limited free oxygen availability at times when the mixed liquor suspended solids were on the higher end of the operating spectrum.
• Influent wastewater is currently analyzed for Carbonaceous Biochemical Oxygen Demand (CBOD); this should be changed to Biochemical Oxygen Demand (BOD)
• When Oxidation Reduction Potential (ORP) drops to levels below the 130-160 millivolts range, the Ammonia levels will begin to rise.

Clymer Borough Municipal Authority Wastewater Plant Performance Evaluation
Department of Environmental Protection Page 2 of 41 Bureau of Water Standards and Facility Regulation
The following items have been identified as focus points to assist in optimization efforts. Operators should review the focus points and are encouraged to incorporate them into their daily operating procedures when feasible. While some of these items will require more of the operator’s time to perform, the outcome is expected to be favorable by improving the plants discharge quality and thereby improving downstream water quality. Focus points are listed in order of importance.
• Consider purchasing a centrifuge for conducting percent solids testing. This will provide results within approximately 15 minutes and, once the values are validated through mixed liquor solids analysis, can be used as a process monitoring tool to control solids throughout the plant.
• Consider having an evaluation conducted of the blower efficiency, and if necessary, having the blowers replaced with more efficient or larger sized blowers as required.
• Contact the contract laboratory to ensure they are analyzing the influent wastewater for 5-day BOD.
• Without the luxury of a larger sludge digester to remove solids from the secondary treatment process, the facility would benefit from the installation of on-line processing equipment to monitor Total Suspended Solids (TSS). This would allow the operators to quickly make adjustments in the treatment process and identify times when solids removal is necessary.
• DO levels in the aeration basins often dip to 0.0 mg/L during the day. A combination of increased air supply and reduced mixed liquor solids levels should help to correct this deficiency and maintain nitrification efficiency.
• Purchasing a meter capable of monitoring DO utilizing luminescent technology and ORP should allow the operator to more accurately monitor and optimize the treatment process.
• Continue monitoring Mixed Liquor Suspended Solids (MLSS) along with settleability testing to identify when solids removal is necessary. In addition, monitoring the mixed liquor for % solids would add a quick and accurate measurement of solids inventory on those days when the total solids tests is not performed. These tests should be conducted at least twice per week.
• Continue to record and trend data to troubleshoot periods of reduced performance. • Operators should attempt to maintain the Sludge Volume Index (SVI) levels in the
aeration tanks to a range between 50 -100 which should allow for optimum treatment conditions and settling characteristics. Levels during the WPPE average 165. Levels much over 100 could lead to decreased settling in the clarifiers.

Clymer Borough Municipal Authority Wastewater Plant Performance Evaluation
Department of Environmental Protection Page 3 of 41 Bureau of Water Standards and Facility Regulation
2. Background The CBMA WWTP is a 0.24 MGD extended aeration treatment process. The service area includes Clymer Borough and Green Township, Indiana County and the waste stream is comprised mostly of domestic sewage with no large industrial users. A gas chlorination system is used for disinfection of the treated wastewater before being discharged to Two Lick Creek. The CBMA discharge is located approximately 7.5 miles upstream of the PA American-Two Lick Creek (PATLC) drinking water intake. Due to the proximity of the discharge and intake this wastewater plant was selected to participate in a Wastewater Plant Performance Evaluation.
The Pennsylvania Department of Environmental Protection (DEP) has undertaken a new project in its Bureau of Water Standards and Facility Regulation (BWSFR) to improve the quality of surface waters used for drinking water by optimizing wastewater treatment plant operations to reduce pathogens and nutrients in the effluent from the WWTP. BWSFR’s optimization program is called the Wastewater Plant Performance Evaluation (WPPE) and is modeled on the successful program for drinking water filtration plants that has been operating for the past twenty plus years, the Filter Plant Performance Evaluation (FPPE) program. The WPPE program is fully explained in Attachment A.
DEP contacted CBMA with a request to deploy and operate the instrumentation at their WWTP located in Clymer Borough, Indiana County, for a period of two months in order to assess current plant operations and provide the operator with process monitoring data to make process modifications improving effluent quality and downstream surface water quality at the PATLC drinking water intake.
DEP utilized on-line probes installed within the secondary treatment processes. In addition, DEP brought, to the facility’s laboratory, instruments and test kits that were used during the evaluation and available for the plant operators’ use. This equipment supplements the on-line continuous monitoring and provides operators with the opportunity to utilize test equipment used in making process control adjustments. The goal is to familiarize operators with process control testing that can be performed to trend their plant data which will assist them in making decisions to optimize their treatment process.
The Department recommends that the Authority review the report and the plant operator continue to maintain and improve plant performance through the use of regular process monitoring and control and data trending to ensure the facility is capable of producing effluent water quality that exceeds current and planned future concentration and loading limits. On-line monitoring equipment for DO and TSS could be used to optimize the wastewater treatment process at Clymer. If the blower motors were utilized based on an oxygen demand basis there could be periods of reduced usage over the evening hours and associated electrical cost savings that may provide a payback period desirable to the CBMA. This issue could prove more important as rate caps expire and the cost of electrical usage increases. Attachment B lists the WPPE team and participating members of the CBMA.

Clymer Borough Municipal Authority Wastewater Plant Performance Evaluation
Department of Environmental Protection Page 4 of 41 Bureau of Water Standards and Facility Regulation
3. PA AmericanTwo Lick Creek Drinking Water Plant
Plant Description The following information was gathered from the most recent PATLC Filter Plant Performance Evaluation report. Samples collected during the FPPE indicated 5 Giardia cysts (0.47 cysts per liter) but no presumptive Cryptosporidium oocysts in the source water sample collected during the evaluation.
The PATLC water treatment facility obtains its source water from a low-weir intake impoundment on Two Lick Creek and pumped to the plant. Pebble lime, coagulant, chlorine, non-ionic polymer and powdered activated carbon (if needed) are added to the raw water line prior to in-line static mixer. The coagulated water then discharges to one of three Aldrich units. Each Aldrich unit provides flocculation, with a vertical shaft paddle mixer, clarification via an up-flow solids contact area (sludge blanket) and filtration through dual-media perifilters. The combined filter effluent is treated with chlorine, fluoride, and caustic soda prior to discharge through 2 baffled clearwells operated in series and the finished water is pumped into the distribution/storage system.
Source water for the plant is obtained from Two Lick Creek. Upstream of the intake, the creek drains a large watershed that contains the Two Lick Creek impoundment, areas of concentrated livestock, communities with sewage treatment plants, on-lot sewage systems, and other activities such as timbering, mining, and gas well drilling, all of which can impact water quality characteristics. However, a tributary (Ramsey Run), which is near the plant intake can quickly affect water quality in Two Lick Creek. As a result, turbidity levels in the creek can fluctuate rapidly during rain events, with monitoring records showing that plant influent (raw water) turbidities reached 655 NTU during the January through December 2008 period (Figure 2). During this period, raw water turbidity levels on Two Lick Creek were generally under 20 NTU, and averaged approximately 9 NTU. Accordingly, operators at the PATLC plant are faced with rapid raw water turbidity spikes occurring between periods of stable turbidities. The CBMA WWTP is located approximately 7.5 miles upstream of the drinking water intake.
Figure 1 depicts the layout of the PATLC drinking water treatment facility on Two Lick Creek.

Clymer Borough Municipal Authority Wastewater Plant Performance Evaluation
Department of Environmental Protection Page 5 of 41 Bureau of Water Standards and Facility Regulation
Bureau of Water Supply Management March 2009
PAWC – Two Lick Creek Plant
P
P
P
P
P
P
P
P
PP
PP
PP
PP
limecarbon (as needed)ferric chloridechlorinepolymer
in-linestaticmixer
wash waterstorage tank
clearwell #2
P
P
P
P
P
P
P
P
PP
PP
PP
PP
distribution&
storage
clearwell #1
Aldrich units
Two Lick Creek
wastewater lagoonbackwash/sludge waste
supernatantdischarge
chlorinecaustic soda
fluoride
Figure 1. PA American-Two Lick Creek water treatment plant schematic
Raw Water Sampling Results Figures 2 and 3 graphically depict the sample results collected downstream of the CBMA WWTP discharge at the PATLC drinking water intake. All downstream samples were collected from the raw water tap at the drinking water plant before any chemical treatment had occurred.

Clymer Borough Municipal Authority Wastewater Plant Performance Evaluation
Department of Environmental Protection Page 6 of 41 Bureau of Water Standards and Facility Regulation
PA American - IndianaRaw Water Nutrients
-0.5
0
0.5
1
1.5
24/
13/1
0
4/27
/10
5/4/
2010
5/10
/201
0
5/19
/10
5/25
/10
6/8/
10
Sample Date
NO
3-N
, NH
3-N
, Pho
s, T
ot N
mg/
L
0
5
10
15
20
25
Chl
orid
es (m
g/L) NO3-N
NH3-NPhosTot NChloride
Figure 2. PATLC water treatment plant raw water nutrient sampling results
5/10/20105/25/10
6/8/10
Giardia, cysts/~10L
Cryptosporidium, oocysts/~10L
00
0
1
00
0
0.5
1
Sample Date
PA American-IndianaRaw water- Giardia and Cryptosporidium Results
Figure 3. PATLC water treatment plant raw water Giardia lamblia/Cryptosporidium results
Clymer Borough Municipal Authority Wastewater Plant Performance Evaluation
Department of Environmental Protection Page 7 of 41 Bureau of Water Standards and Facility Regulation
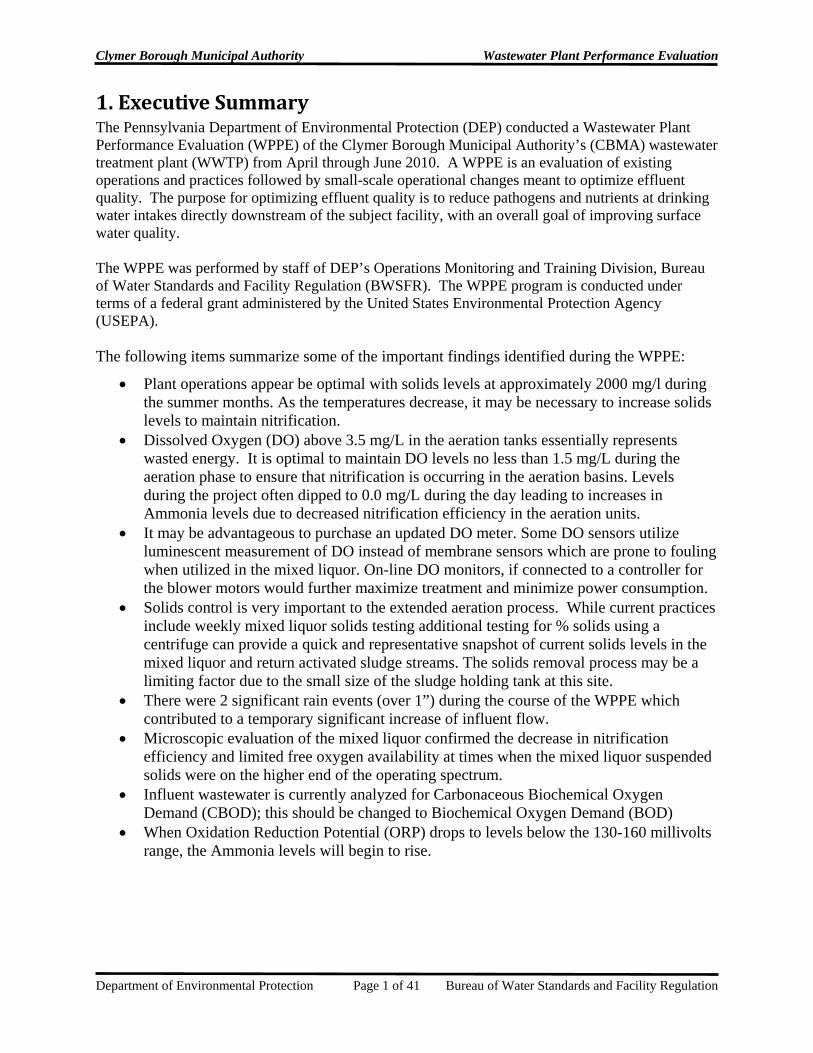
Historical raw water sampling for Cryptosporidium and Giardia was consistent when compared with the most results collected during the WPPE. Figure 4 compares the pathogen sample data collected during Filter Plant Performance Evaluations dating to 2000 through the most recent WPPE data collected in 2009-2010. The Cryptosporidium and Giardia have declined significantly over the past ten years; all samples collected during the WPPE were negative for Cryptosporidium and only one positive sample for Giardia.
PA American-Indiana Drinking Water IntakeHistorical Raw Water Sample Data
178.2
13.2 185 1 0 00 0 0 0
9.923.1 23
-21838587898
118138158178198
5/16
/00
6/23
/03
4/11
/06
3/24
/09
5/10
/10
5/25
/10
6/8/
2010
Sample Date
Gia
rdia
, cys
ts/~
10L
C
rypt
ospo
ridiu
m, o
ocys
ts/~
10L
GiardiaCryptosporidium
Figure 4. Historical raw water data, Giardia/Cryptosporidium

Clymer Borough Municipal Authority Wastewater Plant Performance Evaluation
Department of Environmental Protection Page 8 of 41 Bureau of Water Standards and Facility Regulation
Figure 5 compares Alkalinity and pH over the last ten years. The pH and alkalinity had minor fluctuations; the cause of which is beyond the scope of this project.
PA American-Indiana Drinking Water InakeHistorical Raw Water Sample Data
0
510
15
20
2530
35
40
5/16/0
0
6/23/0
3
4/11/0
6
3/24/0
9
4/13/1
0
4/27/1
05/4
/10
5/10/1
0
5/19/1
0
5/25/1
0
6/8/20
10
Sample Date
Alk
alin
ity, m
g/L
6.6
6.8
7
7.2
7.4
7.6
7.8
pH, s
.u.
AlkalinitypH
Figure 5. Historical raw water data for pH and Alkalinity
Discussion The distance between the CBMA STP discharge and the PATLC drinking water plant raw water intake is approximately 7.5 miles. While the raw water sampling results did not provide any direct correlation to the optimization results at the Clymer STP, the large dilution factor in the Two Lick Creek reservoir is believed to have a direct impact on the raw water results. In addition, there may be some vertical and horizontal stratification because of temperature and side stream influence. Nevertheless, the optimization efforts at the CBMA WWTP provided information relevant to optimizing wastewater operations at the plant which does contribute to the raw water utilized by the PATLC drinking water plant. These results are further discussed in the Process Control section.

Clymer Borough Municipal Authority Wastewater Plant Performance Evaluation
Department of Environmental Protection Page 9 of 41 Bureau of Water Standards and Facility Regulation
4. Initial Observations
Plant Description CBMA’s WWTP treats domestic sewage from its collection system servicing Clymer Borough and German Township. The plant is currently rated at 0.24 MGD. The original plant construction was complete in June1979 as an activated sludge treatment facility. According to the most recent Wasteload Management Report (Chp. 94), the collection system includes no large industrial users and predominantly domestic sewage customers. The facility is currently not required by the USEPA to have an Industrial Pretreatment Program.
The Clymer WWTP is located at the south end of Clymer Borough along the south side of State Route 286. NPDES Permit No. PA0090140 establishes the operations and monitoring requirements for treated sewage at the WWTP. The CBMA WWTP discharges treated effluent to Two Lick Creek which is designated as a warm water fishery. Two Lick Creek is in the 18D- watershed- Ohio Basin, The Lower Allegheny, Conemaugh River-Blacklick Creek. The PATLC water intake is on Two Lick Creek approximately 7.5 miles below the Clymer discharge.
A wastewater treatment plant process description and treatment schematic are depicted in Attachment D.
This site was chosen for the WPPE because of its proximity to the PATLC drinking water intake which is located approximately 7.5 miles directly downstream of the CBMA outfall. CBMA’s overall operating efficiency appears to be good with few violations of its operating permit within the past two years. Following deployment of the WPPE equipment, the instrumentation was used to collect data that will supplement current operations by providing the operator with additional process data to be used when making decisions on modifying treatment plant operations with the ultimate goal of improving effluent quality.
Background samples were collected on April 13, 2010 and a summary of the results for all sampling is listed in Attachment E.
Figure 6, below plots the CBMA WWTP and outfall to Two Lick Creek along with the PATLC drinking water intake.

Clymer Borough Municipal Authority Wastewater Plant Performance Evaluation
Department of Environmental Protection Page 10 of 41 Bureau of Water Standards and Facility Regulation
Figure 6. Clymer WWTP and PATLC drinking water intake
Past Performance A review of plant records showed that there have been no permit violations from this facility in the past year and a half.
During file review, the Department reviewed the facility’s NPDES Permit, its Part II Permit, Water Quality Protection Report, monthly Discharge Monitoring Reports (DMR), Chapter 94 Report, as-built drawings, and available daily process monitoring records.
DMRs for all of 2009 through April 2010 were reviewed in order to develop an understanding of the facility’s daily operating ranges. For 2009, the annual average flow was 0.213 MGD and the peak monthly average flows of 0.274 MGD was recorded in February 2009. For 2010 (January through mid June), the average flow was 0.231 MGD and the peak monthly average flow of 0.289 MGD occurred in March 2010. These records indicate that the collection system is somewhat impacted by inflow/infiltration during wet weather events. Rainfall tends to increase flows at the plant rather quickly indicating sources of inflow within the collection system. The Wasteload Management Reports contribute the excess flows to the Green Township collection system. It would be of benefit to inquire with Green Township regarding efforts to control excess wet weather flows from entering the wastewater collection system.
The CBMA WWTP appears to consistently produce effluent of a good quality and the results of this project along with the review of DMRs for calendar years 2009 and 2010 supported this conclusion, see Tables 1 and 2 below.

Clymer Borough Municipal Authority Wastewater Plant Performance Evaluation
Department of Environmental Protection Page 11 of 41 Bureau of Water Standards and Facility Regulation
Clymer Boro STP * from Chp 94 report2009 DMR Data
Eff Eff Eff * Influent ** Influent Eff Eff Ammonia Ammonia Effluent Effluent Eff Eff Eff Dry TonsFlow Flow pH pH Fecal BOD-loadBOD-conc TSS TSS Nitrogen Nitrogen CBOD-5 CBOD-5 TRC TRC D.O. Min Biosolids Avg
Date Avg. Mon Max Daily min max Avg Mon Avg Mon Avg Mon Avg Mon Avg Wkly Avg Mon Avg Wkly Avg Mon Avg Wkly Avg Mon Inst Max Inst Min removed % solidsJan 0.228 0.502 6.9 7.2 4 321 169 20 44 1 4.9 7 7.6 0.6 2.1 5.9 0Feb 0.274 0.541 7 7.1 16 387 170 8 14 2 5.7 10 30 0.7 2.2 5.8 1.3584 12Mar 0.212 0.442 7.1 7.5 14 233 132 6 11 0.4 1.4 4 7 0.6 1.6 5.5 1.7556 12Apr 0.218 0.35 7 7.3 10 210 116 10 18 4 13.3 5 8.7 0.7 1.9 4.5 5.696 17.7May 0.197 0.295 7.1 7.4 69 283 173 10 16 6 13.3 3 4 0.5 1.8 6 3.46 17.7Jun 0.201 0.299 7 7.2 14 156 93.2 11 19 0.3 0.7 4 6 0.7 1.2 5.8 3.33 17.7Jul 0.202 0.339 7 7.3 11 443 263 12 14 1 1.1 4 4.9 1 2.6 5.8 2.999 17.7Aug 0.202 0.316 7.1 7.4 47 183 109 11 20 0.2 0.2 2 2.2 0.5 2.2 5.8 0.9682 17.7Sep 0.185 0.4 6.8 7.2 78 337 219 7 9 0.2 0.3 4 6.3 0.6 1.7 5.8 5.2374 17.7Oct 0.221 0.371 6.9 7 40 313 170 9 10 0.2 0.4 2 2.9 0.6 1.3 6 3.4922 17.7Nov 0.186 0.254 7 7.5 121 283 164 11 15 0.2 0.5 5 8 0.6 1.1 5 3.444 17.7Dec 0.234 0.391 6.9 7.1 20 257 132 14 20 1 3.6 7 10 0.7 1.6 5.5 7.1826 17.7
Table 1. Clymer WWTP 2009 DMR data summary
Clymer Boro STP2010 DMR Data
Eff Eff Eff Eff Eff Ammonia Ammonia Effluent Effluent Eff Eff EffFlow Flow pH pH Fecal TSS TSS Nitrogen Nitrogen CBOD-5 CBOD-5 TRC TRC D.O. Min Biosolids Avg
Date Avg. Mon Max Daily min max Avg Mon Avg Mon Avg Wkly Avg Mon Avg Wkly Avg Mon Avg Wkly Avg Mon Inst Max Inst Min removed % solidsJan 0.246 0.528 6.9 7 198 9 14 0.5 0.9 6 8.2 0.5 1.2 5.3 2.8768 17.7Feb 0.199 0.269 6.9 7.1 63 16 20 0.6 1 8 16.4 0.5 2 5 1.4709 17.7Mar 0.289 0.625 7 7.2 18 10 13 0.2 0.4 4 8 0.6 1.8 4.1 3.735 17.7Apr 0.191 0.361 6.9 7.3 28 8 9 0.2 0.3 3 5.2 0.6 1.8 4 3.6161 17.7MayJunJulAugSepOctNovDec
Table 2. Clymer WWTP 2010 DMR data summary
Current Performance During the period of the evaluation, the Department observed that the facility was operating satisfactorily with nitrification occurring within both aeration basins. There was ample alkalinity and pH in the plant effluent, 94.7mg/L and 7.6 s.u. respectively, indicating that a sufficient amount of alkalinity for nitrification. Targets values for alkalinity and pH are at least 50mg/L alkalinity in the effluent and a pH of 7.5 s.u. in the aeration basins.
Flow into the treatment facility averaged 0.221 MGD and BOD concentrations averaged 235 mg/L over the course of the WPPE. The calculated average BOD loading using daily BOD and daily flow was 387 lbs/day. The flows were approximately 92% of the design flow and approximately 95% of the permitted organic loadings that the plant is designed to treat. Influent sample data is included in Attachment E and is based on grab sample events.
At the start of the WPPE on April 13th the following data was collected:
Parameter South Tank North Tank Anticipated Values F/M ratio 0.10 0.07 0.05-0.15 Hydraulic Retention Time 32.8 hrs 35.5 hrs 18-24 hrs Sludge Age 18 days 23 days 15-30 days Sludge Volume Index (SVI) 237 279 50-150

Clymer Borough Municipal Authority Wastewater Plant Performance Evaluation
Department of Environmental Protection Page 12 of 41 Bureau of Water Standards and Facility Regulation
The F/M ratio appeared to be slightly on the low side in the North tank but on target in the South tank while the biomass appeared to be healthy with full nitrification occurring and approximately a 99% reduction in BOD and 97% reduction in TSS. The SVI was rather high, usually indicating bulking solids in the clarifiers. There are records of operations maintained on site.
Headworks The facility headworks are split with a portion of flow entering a manual barscreen and the remainder through a comminutor. This study did not include an assessment of the quantity or nature of solids removed at this point.
According to the facility’s most recent Chapter 94 reports, the facility is not projected to exceed its hydraulic and organic operating capacity. However, the influent loading concentrations appeared rather low prompting further evaluation of the laboratory analysis of the influent. After reviewing the influent sample data, the low BOD data suggested that the influent samples were analyzed for CBOD instead of BOD. This generally contributes to lower results and could alter the loadings calculations used for future growth. Further review of sample results confirmed the influent samples were analyzed for CBOD.
Inflow-infiltration issues do exist and are contributed to flows from the neighboring Green Township. Figure 7 depicts the monthly average hydraulic loadings from 2008 through 2010.
Clymer STPHydraulic Loadings- 2008 through 2010
Average Monthly Flow
0
0.05
0.1
0.15
0.2
0.25
0.3
0.35
Jan
Feb
Mar
Apr
May Jun
Jul
Aug
Sep
Oct
Nov
Dec
Month
Flow
, MG
D Design Flow, 0.240 MGD
2008
2009
2010
Figure 7. 2008-2010 Hydraulic Loadings
Figure 8 shows the daily flow readings over the course of the WPPE. A summary of daily flow measurements for April through June 2010 is listed in Attachment F.

Clymer Borough Municipal Authority Wastewater Plant Performance Evaluation
Department of Environmental Protection Page 13 of 41 Bureau of Water Standards and Facility Regulation
Effluent FlowsApril - June 2010
0
0.1
0.2
0.3
0.4
0.5
0.6
0.7
1 2 3 4 5 6 7 8 9 10 11 12 13 14 15 16 17 18 19 20 21 22 23 24 25 26 27 28 29 30 31Date
FLO
W, M
GD
Design Flow, 0.24 MGD April May June Figure 8. Daily flow readings over WPPE
Aeration Two secondary aeration tanks having a total capacity of 240,400 gallons provide the bulk of treatment at the facility. These tanks are configured for plug flow extended aeration. Fine bubble diffusers are used for air distribution in both units. For the WPPE, the Department installed instruments in the south aeration basin. According to the operators, flows to the south treatment train are slightly higher than those to the north train. Flow is split just prior to entering the aeration basins with a slightly higher flow, estimated at 52% of total flow, entering the south basin. Aeration within the both aeration tanks is rather consistent throughout the tank. The largest fluctuation was in the center section of the north aeration basin, north side nearest the road, and the levels were approximately 0.4 mg/L lower than the ends of the tank. This is explained further in the section on DO Profile. The WPPE confirmed that nitrification is occurring in both aeration tanks. Denitrification is not possible in the current configuration due to the lack of a dedicated anoxic zone with mixing and necessary piping/aeration modifications.
Secondary Settling Each aeration tank discharges to an attached secondary settling tank, or clarifier. Here, activated sludge solids settle by gravity and are withdrawn using air lift return sludge pumps, for reintroduction to the aeration tanks. Both settling tanks have an approximate capacity of 20,000 gallons each. The return sludge pumps can be roughly adjusted as desired to maintain optimal conditions in the settling tanks and aeration basins. The aeration tank blowers also provide the air to the return sludge pumps.
Biosolids removal The CBMA plant has a sludge holding tank for removal of solids accumulated within the treatment process. The sludge holding tank is approximately 5,555 gallons and provides about 5-6 days capacity before being pumped to the sludge drying beds. It appears to be a limiting factor as one wasting event fills the sludge holding tank which must be wasted to the dewatering beds before more solids can be removed from the system. The limited holding time does not allow for dewatering of the waste sludge or wasting on a daily basis; solids at most are wasted to the
Clymer Borough Municipal Authority Wastewater Plant Performance Evaluation
Department of Environmental Protection Page 14 of 41 Bureau of Water Standards and Facility Regulation
dewatering beds twice weekly which frees up space, again allowing the operators to waste sludge.
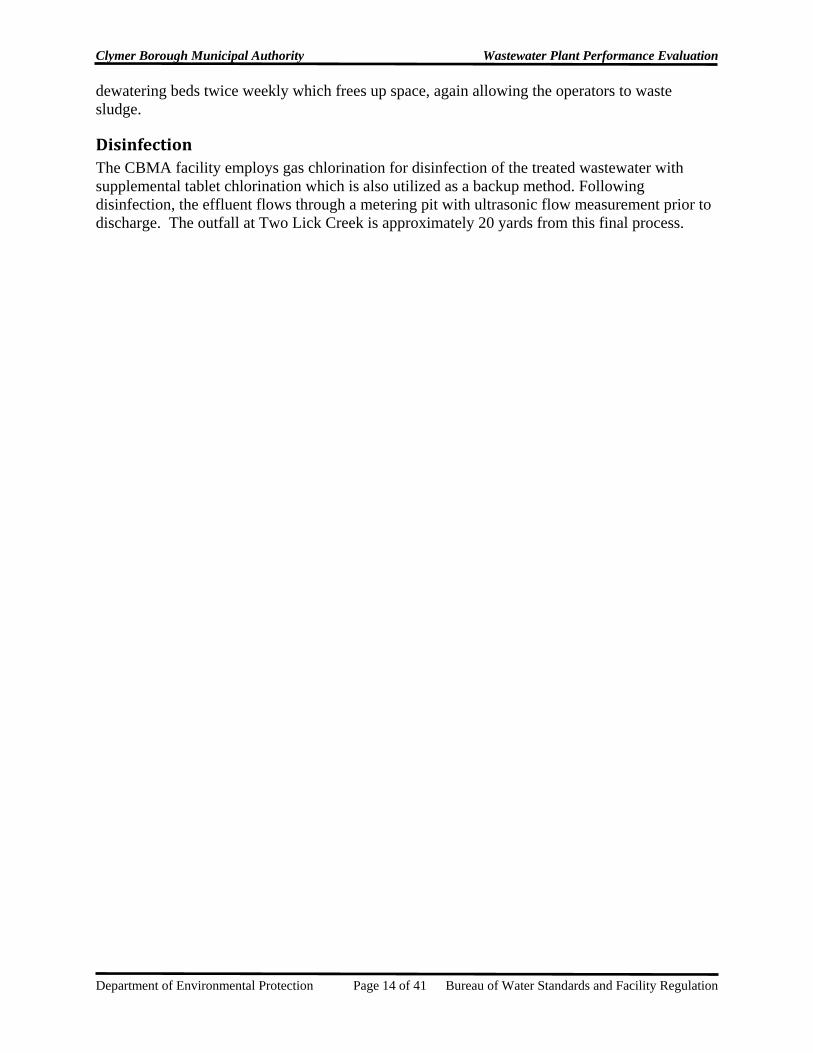
Disinfection The CBMA facility employs gas chlorination for disinfection of the treated wastewater with supplemental tablet chlorination which is also utilized as a backup method. Following disinfection, the effluent flows through a metering pit with ultrasonic flow measurement prior to discharge. The outfall at Two Lick Creek is approximately 20 yards from this final process.

Clymer Borough Municipal Authority Wastewater Plant Performance Evaluation
Department of Environmental Protection Page 15 of 41 Bureau of Water Standards and Facility Regulation
5. Equipment Installation & Calibration On April 13, 2010, DEP staff arrived at CBMA to diagram the instrument layout and install the on-line probes and associated communication lines between probes and SC1000 control unit.
The on-line monitoring equipment is described as having microprocessor technology built into each probe. Each probe has sufficient memory to retain several days’ worth of readings. The SC1000 base units are microprocessor-driven routing and transit units, working in conjunction with detachable display units. The display units are used to calibrate the attached instruments, in addition to relaying information to other microprocessors. The technology allows plant operators to observe and track operational trends that can be interpreted using readily available literature, reinforcing an operator’s process control decisions and showing him/her, in real time, the results of process changes that affect plant performance. The entire system is capable of being combined with a SCADA operation and monitoring system.
The equipment utilized in this WPPE contains a portable notebook computer for displaying the continuous signals from the digital probes. This is an enhancement, as the SC1000 units installed also support displays that provide graphical depiction of trends collated from the data recorded by the probes.
This WPPE utilized a sufficient number of probes to allow for monitoring equipment to be installed in one aeration tank. The south tank was chosen because it receives slightly more flow than the north tank.
The installations were:
• 1 Hach SC1000 base unit • DO, ORP, pH, Nitrate, and Ammonia sensors in the south aeration tank
Attachment G shows a diagram of where the continuous monitoring probes were installed.
Continuous Digital Monitoring The installation at this facility was set to log all measured parameters at 15 minute intervals. Data collected from the probes is transferred via digital signal to a SC1000 base unit which then transferred the data to a laptop computer to log the values in spreadsheet format. A summation of all logged data is provided in electronic format on a CD provided along with this report. The continuous logging function allowed the operator to view live data representing the current operating conditions of the WWTP. With this data the operators were able to review real-time data and make on the spot adjustments to the treatment process as desired. The continuous monitoring digital probes provide the plant operators with graphical output that allows them to see how the tested parameters fluctuate during a variety of conditions.
Laboratory Equipment As part of the WPPE, the use of on-line probes was supplemented with portable laboratory equipment for obtaining “snapshots” of plant conditions using relatively simple test methods. This equipment was also utilized to verify the quality of data being collected with the on-line probes.
Clymer Borough Municipal Authority Wastewater Plant Performance Evaluation
Department of Environmental Protection Page 16 of 41 Bureau of Water Standards and Facility Regulation
In addition to the digital on-line probes, the following laboratory equipment was utilized:
• Raven Products centrifuge, settleometers, and clarifier core-taker for sampling and testing according to sludge inventory methods developed by Al West and cited in Activated Sludge Manual of Practice No. OM-9
• Microscope with digital recording camera and computer interface • Portable LDO and pH/temperature instruments; • Portable spectrophotometer and packaged wastewater lab, for colorimetric analyses of
water and wastewater parameters • Chemical Oxygen Demand (COD) heater block and test kit
The purpose of this equipment is to supplement the digital recording probes with a variety of lab tests that can be performed by plant operators to track solids inventory, health and condition of the biomass, and relative strength of incoming wastewater. This equipment may be purchased through various vendors and can provide sufficient test data for an operator to make process control decisions, even in the absence of the digital, on-line continuous monitoring equipment.
The purpose of the additional testing is to provide an operator with data needed to develop Mean Cell Residence Time (MCRT), Food to Mass Ratio (F/M), or Sludge Age (AGE) methods of managing activated sludge treatment facilities.
CBMA has laboratory glassware on hand and routinely conducts settleability and total solids testing on the mixed liquor. In-house total solids tests are also performed on the treated effluent for reporting on the DMR. The operators indicate they perform all the required testing for process control and effluent testing as required.
The purpose in bringing the lab equipment to CBMA was to make it available for the operators use and to perform process control testing to include monitoring: pH, DO, NO3, NH3, Phos, and OUR tests. Some pieces of the lab equipment are current versions that are much simpler to use and provide very accurate results some of which are approved by EPA for reporting on the DMR.
There were a significant number of process control tests performed during the WPPE, some representative spreadsheets of the output data are included at Attachment H. All process control test results are included in electronic format on the included CD Rom.
Clymer Borough Municipal Authority Wastewater Plant Performance Evaluation
Department of Environmental Protection Page 17 of 41 Bureau of Water Standards and Facility Regulation
6. Process Monitoring
Interpretation of Data Beginning on April 13, 2010 and lasting until June 15, 2010 the Department continuously obtained digital data from the on-line probes installed at CBMA.
Attachments I and J include graphs of monthly and daily data, respectively, collected by the digital probes. These graphs were developed by DEP using MS Excel.
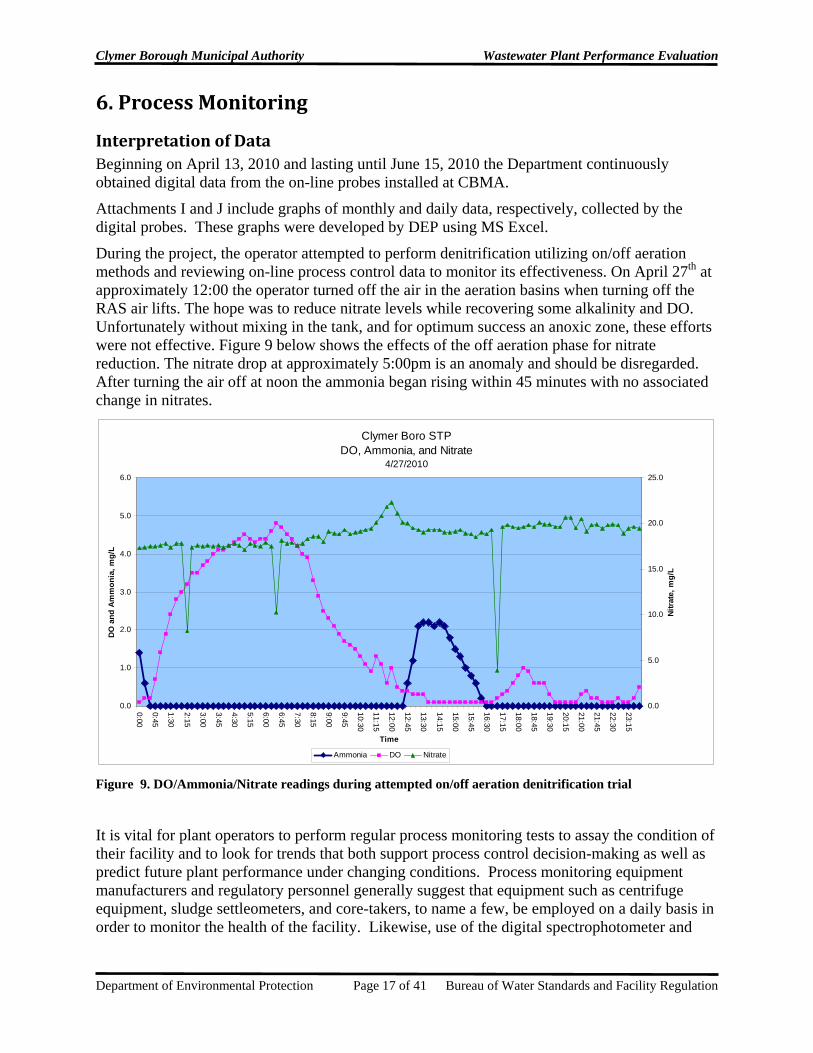
During the project, the operator attempted to perform denitrification utilizing on/off aeration methods and reviewing on-line process control data to monitor its effectiveness. On April 27th at approximately 12:00 the operator turned off the air in the aeration basins when turning off the RAS air lifts. The hope was to reduce nitrate levels while recovering some alkalinity and DO. Unfortunately without mixing in the tank, and for optimum success an anoxic zone, these efforts were not effective. Figure 9 below shows the effects of the off aeration phase for nitrate reduction. The nitrate drop at approximately 5:00pm is an anomaly and should be disregarded. After turning the air off at noon the ammonia began rising within 45 minutes with no associated change in nitrates.
Clymer Boro STPDO, Ammonia, and Nitrate
4/27/2010
0.0
1.0
2.0
3.0
4.0
5.0
6.0
0:00
0:45
1:30
2:15
3:00
3:45
4:30
5:15
6:00
6:45
7:30
8:15
9:00
9:45
10:30
11:15
12:00
12:45
13:30
14:15
15:00
15:45
16:30
17:15
18:00
18:45
19:30
20:15
21:00
21:45
22:30
23:15
Time
DO
and
Am
mon
ia, m
g/L
0.0
5.0
10.0
15.0
20.0
25.0
Nitra
te, m
g/L
Ammonia DO Nitrate
Figure 9. DO/Ammonia/Nitrate readings during attempted on/off aeration denitrification trial
It is vital for plant operators to perform regular process monitoring tests to assay the condition of their facility and to look for trends that both support process control decision-making as well as predict future plant performance under changing conditions. Process monitoring equipment manufacturers and regulatory personnel generally suggest that equipment such as centrifuge equipment, sludge settleometers, and core-takers, to name a few, be employed on a daily basis in order to monitor the health of the facility. Likewise, use of the digital spectrophotometer and
Clymer Borough Municipal Authority Wastewater Plant Performance Evaluation
Department of Environmental Protection Page 18 of 41 Bureau of Water Standards and Facility Regulation
accompanying portable wastewater lab chemical test kits will allow an operator to assay any number of chemical parameters for process monitoring and control purposes. Even those facilities who employ an independent contractor for operations and/or compliance reporting do need to regularly conduct process monitoring tests of their facility systems. Once this data is collected it should be trended to identify the optimal set points for various parameters including DO, MLSS, waste rates and pH to name a few. When future situations arise the operator can refer to the trending data to identify the conditions during a previous similar situation and see what remedial actions were taken to rectify the issue. Without having trending data, an operator is starting at square one for each occasion where the plant experiences an abnormal condition. Trending is also very important when more than one operator runs a treatment plant or even more importantly when a secondary operator only occasionally operates the plant.
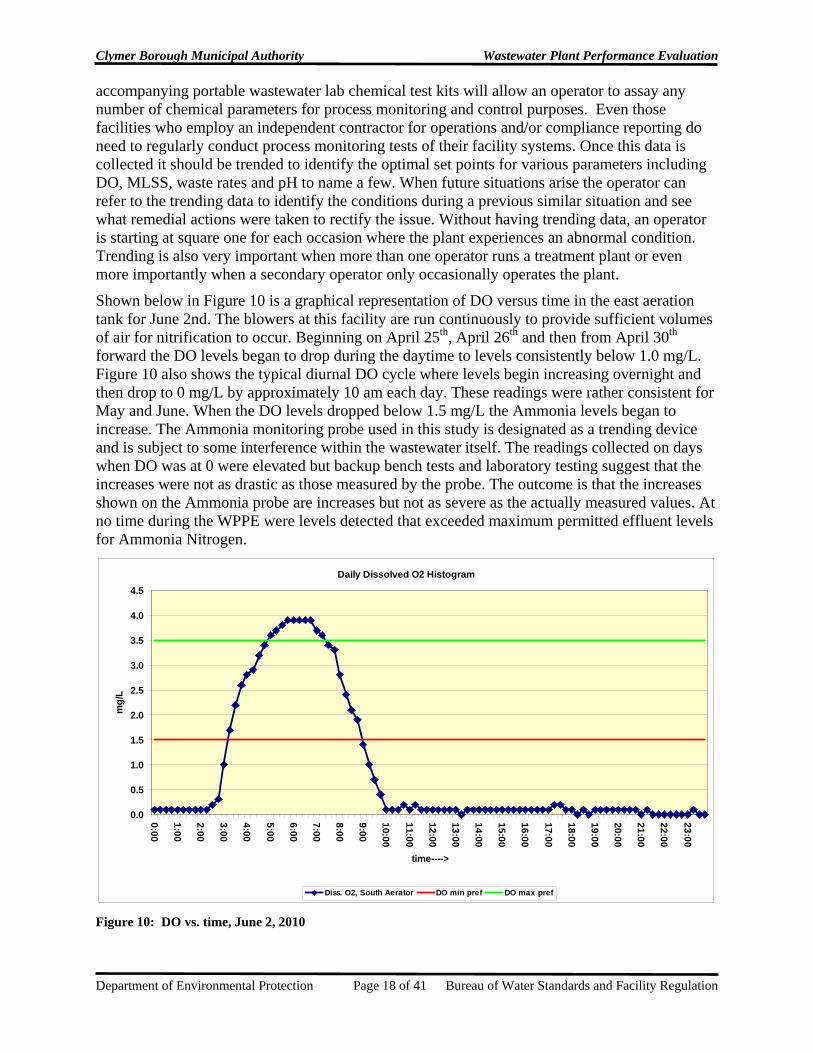
Shown below in Figure 10 is a graphical representation of DO versus time in the east aeration tank for June 2nd. The blowers at this facility are run continuously to provide sufficient volumes of air for nitrification to occur. Beginning on April 25th, April 26th and then from April 30th forward the DO levels began to drop during the daytime to levels consistently below 1.0 mg/L. Figure 10 also shows the typical diurnal DO cycle where levels begin increasing overnight and then drop to 0 mg/L by approximately 10 am each day. These readings were rather consistent for May and June. When the DO levels dropped below 1.5 mg/L the Ammonia levels began to increase. The Ammonia monitoring probe used in this study is designated as a trending device and is subject to some interference within the wastewater itself. The readings collected on days when DO was at 0 were elevated but backup bench tests and laboratory testing suggest that the increases were not as drastic as those measured by the probe. The outcome is that the increases shown on the Ammonia probe are increases but not as severe as the actually measured values. At no time during the WPPE were levels detected that exceeded maximum permitted effluent levels for Ammonia Nitrogen.
Daily Dissolved O2 Histogram
0.0
0.5
1.0
1.5
2.0
2.5
3.0
3.5
4.0
4.5
0:00
1:00
2:00
3:00
4:00
5:00
6:00
7:00
8:00
9:00
10:00
11:00
12:00
13:00
14:00
15:00
16:00
17:00
18:00
19:00
20:00
21:00
22:00
23:00
time---->
mg/
L
Diss. O2, South Aerator DO min pref DO max pref
Figure 10: DO vs. time, June 2, 2010

Clymer Borough Municipal Authority Wastewater Plant Performance Evaluation
Department of Environmental Protection Page 19 of 41 Bureau of Water Standards and Facility Regulation
On May 4, Department personnel noted a reddish tint in the mixed liquor. Discussions with the operators on May 7 also identified their concerns over the reddish tint noted in the sludge wasted to the drying beds. The wasted sludge was not working as well with the polymer resulting in the solids not drying as well as expected. A review of test parameters before and after the color change did not identify changes in the wastewater makeup nor did they identify any negative impacts to the receiving stream. While sources of the color change were discussed, industrial dischargers were ruled out since no such sources exist in the Borough. The operator planned to discuss the situation with Green Township representatives to determine if they were aware of any potential source.
On May 10, the operators replaced the filters on the blowers with hopes that it would provide increased air to the aeration tanks to no avail. Reducing solids levels in the aeration tanks appeared to have the most direct impact on increasing aeration levels. The higher levels of organic loading and reduced efficiency of the blowers with age appear to be the most direct cause of the reduced DO levels throughout the aeration tanks as the temperatures began to increase in May and June.
Daily Dissolved O2 Histogram
0
0.5
1
1.5
2
2.5
3
3.5
4
0:00
1:00
2:00
3:00
4:00
5:00
6:00
7:00
8:00
9:00
10:00
11:00
12:00
13:00
14:00
15:00
16:00
17:00
18:00
19:00
20:00
21:00
22:00
23:00
Diss. O2, South Aerator DO min pref DO max pref Figure 11: DO vs. time, June 4, 2010
There were some days during the WPPE that DO levels were near 0 mg/L; Figure 11 depicts one of those days.

Clymer Borough Municipal Authority Wastewater Plant Performance Evaluation
Department of Environmental Protection Page 20 of 41 Bureau of Water Standards and Facility Regulation
ORP, Nitrate & Ammonia Nitrogen
-100
-50
0
50
100
150
200
0:00
0:45
1:30
2:15
3:00
3:45
4:30
5:15
6:00
6:45
7:30
8:15
9:00
9:45
10:30
11:15
12:00
12:45
13:30
14:15
15:00
15:45
16:30
17:15
18:00
18:45
19:30
20:15
21:00
21:45
22:30
23:15
0
5
10
15
20
25
30
Nitr
ate
and
NH
3-N
, mg/
L
ORP NO3- NH3-N
Figure 12. ORP, Nitrate & Ammonia Nitrogen, June 4, 2010
Figure 12 shows ORP, Nitrate, and Ammonia levels on June 4th. With DO levels at approximately 0 for the entire day the ORP probe shows that when the ORP is above 160 mV then nitrification can occur but once it’s below the 130-160 mV range that is when nitrification begins to drop off and the ammonia levels begin to rise. Of course the higher mixed liquor levels aren’t as conducive to oxygen transfer and also result in lower ORP levels which directly relate to nitrification efficiency. The corresponding drop in DO levels each day appears to correlate to the morning flow surge and is consistent throughout the month. Figure 13, below shows the daily effects of DO dropping to negligible levels after the morning flow increase and the corresponding increase in Ammonia Nitrogen. While the Ammonia levels never exceeded permitted levels the DO drop caused decreased nitrification performance. Potentially, the levels of BOD loadings in the aeration basins along with the higher temperatures beginning in May and the fluctuations of mixed liquor levels also contributed to the low DO levels and corresponding increase in Ammonia levels.

Clymer Borough Municipal Authority Wastewater Plant Performance Evaluation
Department of Environmental Protection Page 21 of 41 Bureau of Water Standards and Facility Regulation
DO and Ammonia
0.0
0.5
1.0
1.5
2.0
2.5
0:00
0:45
1:30
2:15
3:00
3:45
4:30
5:15
6:00
6:45
7:30
8:15
9:00
9:45
10:30
11:15
12:00
12:45
13:30
14:15
15:00
15:45
16:30
17:15
18:00
18:45
19:30
20:15
21:00
21:45
22:30
23:15
Time
DO, m
g/L
0.0
5.0
10.0
15.0
20.0
25.0
30.0
Amm
onia
, mg/
L
DO NH3-N, South Aerator
Figure 13. DO and Ammonia, June 22, 2010
Oftentimes during the late spring when water temperature rises, the concentration of MLSS needs to be lowered from the levels that sustained the plant through cold weather. Treatment efficiency rises as a function of temperature, and fewer MLSS are needed to accomplish the same amount of waste treatment as may be necessary during winter months. Regular sludge wasting is a vital part of maintaining a healthy biomass. The operators at CBMA base their need to waste on ½ hour settleability, gravimetric tests results, and visual observations collected at the WWTP. The levels of the various tests resulting in the maximum system performance generally change with seasonal variations which reinforces the need to trend the data and keep records of the results. While these methods are effective in identifying when to adjust the levels of biomass, the solids removal operations allow for the actual changes in the MLSS levels. At this facility, the operators are limited on sludge wasting frequency due to the size of the holding tank. There are 4 sludge drying beds on site and the emptying of the sludge holding tank on any given day fills 1 sludge drying bed accordingly. In order to maintain a healthy biomass and an optimally performing treatment system, sludge wasting is usually performed daily or several times per week. If solids are wasted from the process less frequently and in large volume then large amounts of nitrifying bacteria will be removed from the process all at once. Through the use of gravimetric MLSS tests, centrifuge testing, and other laboratory test an operator can adjust the solids levels in the aeration basins to anticipate the changes in operating conditions as the weather changes from warmer to colder and vice versa. Instead of wasting solids over a few days to transition the operation from winter to spring conditions, an operator would be better to withdraw waste solids to establish a desired MCRT, gradually reaching a solids concentration where biomass growth rate is nearing the peak of log growth, where treatment efficiency is optimal, and the potential for negative indicators such as filamentous organisms are reduced.

Clymer Borough Municipal Authority Wastewater Plant Performance Evaluation
Department of Environmental Protection Page 22 of 41 Bureau of Water Standards and Facility Regulation
It is generally best to maintain a consistent solids management plan that includes wasting solids based on process control testing that includes monitoring the food to mass ratios (F/M), mean cell residence time (MCRT), sludge volume index (SVI), and mixed liquor suspended solids (MLSS). Generally, choosing a method such as a targeted F/M or MCRT and sticking with it produces the most consistent effluent quality. Figure 14, below, depicts the MLSS levels in the north aeration basin over the course of the project. The solids levels fluctuated greatly due to removing large amounts of solids at one time while filling the holding tank. While this isn’t the most desired method the operators perform the task effectively.
MLSSNorth Aeration Tank
-
500
1,000
1,500
2,000
2,500
3,000
3,500
4,000
4,500
4/21/10 4/27/10 5/4/10 5/10/10 5/19/10 5/21/10 5/25/10 5/27/10 6/8/10
Date
MLS
S, m
g/L
Figure 14. Mixed liquor suspended solids-North Aeration

Clymer Borough Municipal Authority Wastewater Plant Performance Evaluation
Department of Environmental Protection Page 23 of 41 Bureau of Water Standards and Facility Regulation
Figure 15, shows the MLSS during the same timeframe in the south tank. Through experience, the operators determined that the plant operates best around 2000 mg/L.
MLSS South Aeration Tank
-
500
1,000
1,500
2,000
2,500
3,000
3,500
4,000
4,500
4/21/10 4/27/10 5/4/10 5/10/10 5/19/10 5/21/10 5/25/10 5/27/10 6/8/10
Date
MLS
S, m
g/L
Figure 15. Mixed liquor suspended solids-South Aeration
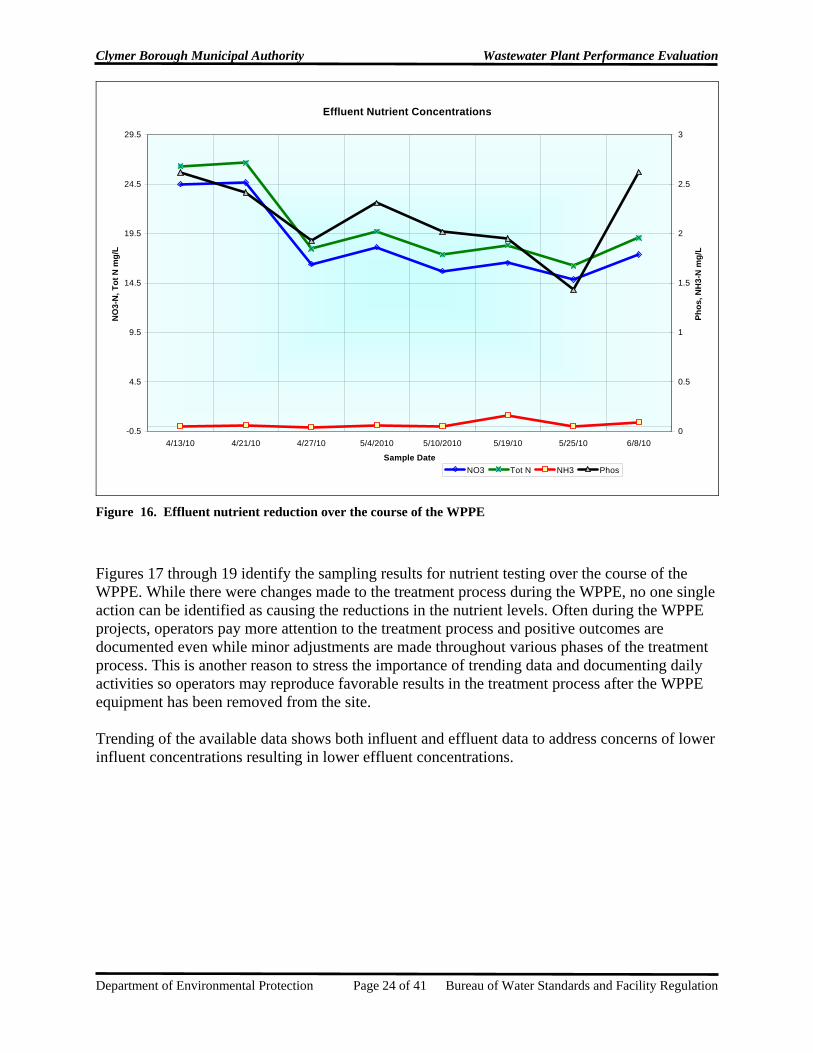
Ammonia levels over the course of the project varied due to the variations in DO levels over the course of a given 24 hour cycle. While the levels did rise, they did not rise to levels causing exceedances of permit limits. The resulting effluent samples analyzed by the Bureau of Labs confirmed the results. Reductions in effluent nutrient levels are graphically depicted on Figure 16, below. While there were some spikes in the effluent data, the overall trend was a reduction in both nitrate and phosphorus. The results on the chart are from samples collected of the plant effluent and tested at the Department’s Bureau of Laboratories.
Clymer Borough Municipal Authority Wastewater Plant Performance Evaluation
Department of Environmental Protection Page 24 of 41 Bureau of Water Standards and Facility Regulation
Effluent Nutrient Concentrations
-0.5
4.5
9.5
14.5
19.5
24.5
29.5
4/13/10 4/21/10 4/27/10 5/4/2010 5/10/2010 5/19/10 5/25/10 6/8/10
Sample Date
NO
3-N
, Tot
N m
g/L
0
0.5
1
1.5
2
2.5
3
Phos
, NH
3-N
mg/
L
NO3 Tot N NH3 Phos
Figure 16. Effluent nutrient reduction over the course of the WPPE
Figures 17 through 19 identify the sampling results for nutrient testing over the course of the WPPE. While there were changes made to the treatment process during the WPPE, no one single action can be identified as causing the reductions in the nutrient levels. Often during the WPPE projects, operators pay more attention to the treatment process and positive outcomes are documented even while minor adjustments are made throughout various phases of the treatment process. This is another reason to stress the importance of trending data and documenting daily activities so operators may reproduce favorable results in the treatment process after the WPPE equipment has been removed from the site. Trending of the available data shows both influent and effluent data to address concerns of lower influent concentrations resulting in lower effluent concentrations.

Clymer Borough Municipal Authority Wastewater Plant Performance Evaluation
Department of Environmental Protection Page 25 of 41 Bureau of Water Standards and Facility Regulation
Influent vs. Effluent Nutrient ConcentrationsTotal Nitrogen
0.0
10.0
20.0
30.0
40.0
50.0
60.0
4/13/10 4/21/10 4/27/10 5/10/10 5/19/10 5/25/10 6/8/10
Sample Date
mg/
L
Infl Tot N Effl Tot N Linear (Effl Tot N) Linear (Infl Tot N)
Figure 17. Influent vs. Effluent Total Nitrogen concentrations
Influent vs. Effluent Nutrient ConcentrationsTotal Phosphorus
0.0
1.0
2.0
3.0
4.0
5.0
6.0
7.0
4/13/10 4/21/10 4/27/10 5/10/10 5/19/10 5/25/10 6/8/10
Sample Date
mg/
L
Infl Phos Effl Phos Linear (Effl Phos) Linear (Infl Phos)
Figure 18. Influent vs. Effluent Total Phosphorus concentrations

Clymer Borough Municipal Authority Wastewater Plant Performance Evaluation
Department of Environmental Protection Page 26 of 41 Bureau of Water Standards and Facility Regulation
Influent vs. Effluent Nutrient ConcentrationsAmmonia Nitrogen
-1.0
4.0
9.0
14.0
19.0
24.0
29.0
34.0
39.0
44.0
4/13/10 4/21/10 4/27/10 5/10/10 5/19/10 5/25/10 6/8/10
Sample Date
mg/
L
Infl NH3-N Effl NH3-N Linear (Infl NH3-N)
Figure 19. Influent vs. Effluent Ammonia Nitrogen concentrations
Figure 20, below, shows the Cryptosporidium oocyst levels in nine samples taken during three sampling events over four weeks. Effluent results were consistently negligible for detection of Cryptosporidium oocyst in any of the upstream, downstream, or effluent samples.
5/10/20105/25/10
6/8/10
Upstream
STP Effluent
Downstream
00
00
00
00
00
0.1
0.2
0.3
0.4
0.5
0.6
0.7
0.8
0.9
1
Cry
ptos
porid
ium
ooc
ysts
/~10
L
Sample Date
Clymer Boro STPCryptosporidium Results
Upstream STP Effluent Downstream Figure 20. Cryptosporidium oocyst levels

Clymer Borough Municipal Authority Wastewater Plant Performance Evaluation
Department of Environmental Protection Page 27 of 41 Bureau of Water Standards and Facility Regulation
The levels of Giardia lamblia cysts found in 10L samples are shown in Figure 21. In this illustration, the treatment plant produced a higher quantity of giardia cyst than was present in the upstream and downstream samples. The high number of giardia does not indicate that the disease causing organism is endemic in the population of the service area; neither does the test indicate whether or not the organisms have been inactivated by disinfection methods.
5/10/20105/25/10
6/8/10
Upstream
STP Effluent
Downstream
10
0
1119
9
4
1 30
2
4
6
8
10
12
14
16
18
20
Gia
rdia
cys
ts/~
10 L
Sample Date
Clymer Boro STPGiardia lamblia Results
Upstream STP Effluent Downstream
Figure 21. Giardia lamblia cyst levels
Figures 22 and 23 compare effluent Giardia lamblia levels to those of effluent TSS and effluent flow. The most direct correlation is between the effluent flow and Giardia lamblia cysts in the wastewater effluent. While the TSS levels were within permitted effluent limits; an increase in effluent flow correlated to an increase in Giardia lamblia cysts levels. While there has not been a defined reduction of pathogens from the treatment plant effluent, the reduction in Giardia lamblia cyst levels coinciding with reductions in flow suggest that greater control of flow to the wastewater plant may reduce pathogen levels in the effluent. Also, the PATLC drinking water intake should maintain heightened awareness of pathogen levels during rain events which generally tend to raise flows at the WWTP.

Clymer Borough Municipal Authority Wastewater Plant Performance Evaluation
Department of Environmental Protection Page 28 of 41 Bureau of Water Standards and Facility Regulation
5/10/20105/25/10
6/8/10
TSS
Giardia
11 199
75
502468
101214161820
TSS
mg/
L, G
iard
ia
cyst
s/~1
0L
Sample Date
Clymer Boro STP EffluentTSS vs. Giardia
TSSGiardia
Figure 22. Giardia lamblia/TSS comparison
5/10/20105/25/10
6/8/10
Giardia
Flow(x100), MGD
19.721.6 18.8
1119 9
0
5
10
15
20
25
Flow
, MD
G(x
100)
, Gia
rdia
cy
sts/
~10L
Sample Date
Clymer Boro STP EffluentFlow vs. Giardia
GiardiaFlow(x100), MGD
Figure 23. Giardia lamblia/Flow comparison
In order to more effectively assess the level of pathogens, and the effect of annual weather patterns on them, an effective statistical population would necessarily include many samples per

Clymer Borough Municipal Authority Wastewater Plant Performance Evaluation
Department of Environmental Protection Page 29 of 41 Bureau of Water Standards and Facility Regulation
location, taken over the course of the entire year. The study would have to account for temperature and weather variability, wastewater plant flows, seasonal activity of host wildlife in the area, changes in stream flow and chemistry, and other factors.
Microscopy with Digital Photography A microscope is a beneficial addition to any wastewater laboratory. DEP provides temporary use of a microscope during the WPPE so that operators become familiar with the organisms of the activated sludge process, including indicator organisms that may be used to predict the relative health of the biomass and the operating condition of the facility. Following are some example photographs of the CBMA activated sludge samples taken during April and May. A microscopic evaluation of the biomass in the south aeration unit on April 23rd identified few nematodes, many stalked ciliates, and some free swimming ciliates with no rotifers observed. The contents of the north aeration unit were nearly the same with many stalked ciliates and some free swimming ciliates. The evaluation on this day indicated sludge with a high Sludge Volume Index (SVI) and low Food to Mass (F/M) ratio. Testing for these parameters confirmed the findings. Further testing conducted on May 4th showed sludge with mostly free swimming ciliates, some rotifers and stalked ciliates with very few nematodes present. This indicated sludge with a lower SVI and higher F/M ratio which is more desirable. Testing for these parameters confirmed the microscopic findings. Follow-up microscopic analysis on May 19 identified many nematodes in the south aeration unit along with some rotifers, some free swimming ciliates, and few stalked ciliates. This is indicative of an older sludge. However, the north unit contained rotifers, free swimming ciliates, some stalked ciliates, and few nematodes. The protozoa in the north unit were representative of a younger bio-mass. Figures 24 through 27, below, shows stalked ciliates, rotifers, and other protozoa in mixed liquor samples of the north and south aeration tanks. Stalked ciliates can be indicators of a good settling sludge when present with free swimming ciliates and rotifers.
Figure 24: South aeration tank-4/23/10 Figure 25: South aeration tank-4/23/10

Clymer Borough Municipal Authority Wastewater Plant Performance Evaluation
Department of Environmental Protection Page 30 of 41 Bureau of Water Standards and Facility Regulation
Figure 26: North aeration tank-5/4/10 Figure 27: North aeration tank-5/4/10
Between the north and south units, the north unit had the least biological activity. As the project went on and solids levels in the aeration tanks were reduced the biological activity did improve. Levels between the two units changed as expected based on the fluctuations in mixed liquor solids levels.
Field Sampling Initial background samples were collected on April 13, 2010:
Location Sample Number Analyses
Upstream of Outfall 001 on Two Lick Creek
0331880 Conventional Pollutants
Outfall 001 at Two Lick Creek 0331879 Conventional Pollutants
Downstream of Outfall 001 near PA American Two Lick Creek raw water intake
0331881 Conventional Pollutants
Table 3. Initial sampling locations and analyses
As indicated in Table 3 above, on several occasions, grab samples were collected for Method 1623 pathogens (Cryptosporidium and Giardia lamblia) from the WWTP effluent at the outfall, upstream on Two Lick Creek, and downstream at the drinking water intake for PATLC. At various times during the WPPE, samples were collected of the WWTP and receiving stream; these samples were submitted to the Department’s Bureau of Laboratories for analysis. The mixed liquor was sampled for suspended solids, and volatile solids. The influent, effluent, upstream, and downstream samples were checked for conventional sewage pollutants and chlorides. The effluent, upstream, and downstream were also sampled for Cryptosporidium and Giardia lamblia. A summary of these results is fully listed in Attachment E. In addition, the laboratory results for all samples collected during the WPPE have been provided separately on a CD-ROM disc that accompanies this report.

Clymer Borough Municipal Authority Wastewater Plant Performance Evaluation
Department of Environmental Protection Page 31 of 41 Bureau of Water Standards and Facility Regulation
7. Process Control
Permit Modifications Any modifications to the permitted treatment process may require an amendment to the Water Management Permit. If you are unsure whether a permit modification is necessary contact the DEP regional office that supports your wastewater facility prior to making any modifications.
General The objective of Process Monitoring and Testing is to develop regular monitoring procedures for the individual treatment facility. Typically, an operator chooses to maintain a facility according to mean cell residence time (MCRT) or food-to-mass (F/M) ratio. The objective of these broad parameters is to find a level where plant performance is optimal for the current conditions (including season, amount of precipitation, loading variations, industrial or commercial contributors) and then adjust the treatment processes in order to maintain a steady-state. For example, if an operator runs a facility according to constant Food to Mass ratio of 0.15, and plant loading (the “food” value) is either naturally constant (based on collection system) or can be sufficiently buffered (using flow equalization tanks), then their objective in maintaining constant F/M is to assure that the biomass (the “mass” value, or the amount of Mixed Liquor Volatile Suspended Solids (MLVSS) in the system) can be adjusted through wasting in order to keep the ratio at or near a constant 0.15.
Mean Cell Residence Time is a method by which the operator adjusts solids retention to achieve a steady sludge age. MCRT incorporates a regularly tested solids inventory with adjustments to the wasting rates and an accounting for the expected growth rate due to plant loading. The end result of such operation is an MCRT of X-number days, usually in the range of 10-13 days for nitrifying wastewater plants.
Guidance manuals generally suggest that an operator choose a parameter and then operate the facility accordingly. Operators have found that doing so maintains conditions in an optimized state whereby the chance of plant upsets is mitigated or controlled.
Solids Tracking At present, the Clymer facility tracks sludge solids in the two aeration tanks by performing ½ hour settleability total solids testing. Total Solids tests are performed once per week on each treatment train. Solids levels increased over the course of the WPPE and were scheduled for removal upon reaching approximately 2500 mg/L. When solids have accumulated in the chlorine contact tank/disinfection tank they will denitrify over time causing the solids to rise to the surface and be washed out with the treated effluent having negative effects on effluent quality. At CBMA, the chlorine contact tanks are drained and cleaned as necessary to prevent an accumulation of solids and the potential discharge of said solids. There was no accumulation of solids noted in the chlorine contact tank during the WPPE.
To develop and maintain a complete solids inventory, the clarifier solids needs be regularly assayed in a consistent method. During a WPPE, DEP provides, on loan, a clarifier core-taker sampler that is used to determine the level of the sludge blanket and which can be used to sample the entire clarifier for a percent solids number that, with measurements of the return and waste sludge values, may be used to determine an operational MCRT. This method only involves the

Clymer Borough Municipal Authority Wastewater Plant Performance Evaluation
Department of Environmental Protection Page 32 of 41 Bureau of Water Standards and Facility Regulation
core taker and a centrifuge to spin the solids samples. A centrifuge spin cycle that runs six samples, or three with duplicates, takes approximately 15 minutes to complete.
The MCRT method is described in earlier versions of WPCF’s Activated Sludge Manual of Practice No. OM-9 and in other sources. Calculation of a sludge inventory using undefined sludge units allows an operator to derive an MCRT value for his/her facility, and this can be done on a daily, semi-weekly, or weekly basis.
The Department utilized gravimetric solids tests, ½ hour settleability tests, and centrifuge tests to track changes in the mixed liquor suspended solids.
Solids monitoring is very important in a wastewater treatment plant. If the MLSS concentrations are too low then there won’t be enough nitrifying bacteria present for nitrification to occur and MLSS concentrations to high can cause problems with clarifier operations and suspended solids levels in the effluent. MLSS target levels are usually adjusted seasonally as the temperature plays an important part in nitrification.
DO findings The DO readings at this facility follow a typical diurnal pattern with peaks occurring in the morning hours prior to the facility receiving an increase in flows due to residents starting their day. The flows then decrease over the daytime hours and begin to creep up in the evening until starting the cycle over the next day. Optimal DO range for activated sludge plants is usually between 1.5 mg/L and 3.5 mg/L. Any DO over 3.5 mg/L usually represents wasted energy, because the biomass functions adequately within this prescribed range. It may be advantageous to purchase an updated DO meter. Some DO sensors utilize luminescent measurement of DO instead of membrane sensors which are prone to fouling when utilized in the mixed liquor. On-line DO monitors, if connected to a controller for the blower motors would further maximize treatment and minimize power consumption. Unfortunately, in this case CBMA would need to modify its air supply lines. A combination of increased air supply and reduced mixed liquor solids levels should help to correct this deficiency and maintain nitrification efficiency.
ORP ORP can be used by the operators to control periods of anoxic or aerobic treatment conditions, as described earlier, for the removal of nitrates. Generally, ORP probes are most useful in the denitrification process but are also good indicators of biological activity in the nitrification process. The following table depicts general ORP values at which denitrification occurs; the operators may wish to pursue the use of timed intervals as a method to optimize nitrate removal, even in the absence of dedicated treatment units where denitrification would occur. General values for ORP used to determine which biological condition exists within a particular treatment unit:

Clymer Borough Municipal Authority Wastewater Plant Performance Evaluation
Department of Environmental Protection Page 33 of 41 Bureau of Water Standards and Facility Regulation
ORP (mV) ProcessElectron
Acceptors Condition
> +100 1 O2 Aerobic
< +100 2 NO3 Anoxic
> -100 2 NO3 Anoxic
< -100 3 SO4 Anaerobic
1= Nitrification
2= De-Nitrification
3= Methane Formation
Table 4. ORP Chart
ORP readings are typically used in conjunction with the DO readings to identify the effectiveness of a given biological treatment process and the condition of each zone. At times during the evaluation the DO levels reached near 0 mg/L.
DO Profile A DO profile, shown in Figures 28 and 29 below, were developed in April to characterize mixing in the North and South aeration tanks. For this, a Hach 40d digital meter and LDO portable probe were used. DO was recorded at several locations in the aeration tanks, at varying depths. Recordings were made at 6 locations along the length of the tanks at approximately 1 ft from the edge of the tank at three depths: 1 ft, 7ft, and 13ft. Three locations were sampled along the ends of the tanks at the same depths.
Results of this analysis show that, for the most part, mixing within the east tank is complete and DO remains fairly consistent throughout the process.
Operators at similar facilities have found that performing a DO profile on a regular basis helps to characterize weak spots in the aeration grid and identify dead zones that may be caused by occluded diffuser outlets or by faulty baffling. Performing a DO profile every six months at this facility should be sufficient. Studying the DO profile over time also allows the operator to see the effects of loading on the tanks, and data may be used to identify the need for aeration balancing and/or the need for cleaning of diffusers.
North Aeration Tank (Direction of Flow <--------------) Return Activated Sludge
1.08 0.95 0.82 0.64 0.65 0.75 1.52 1.38 Discharge Point
Raw Influent1.14 15 ft
0.9 0.97 0.75 0.66 0.64 0.72 1.31 0.86 1.191.26
1.2 1.25 1.04 1.02 1.02 0.99 1.170.89 0.89 0.77 0.67 0.63 0.64 1.11 .70
0.95 1.12 1.251.08
1.11 .88 0.89 1.04 0.97 0.93 1.14 1.07
0.95 1.09 24 ft0.95 0.93 0.98 0.85 0.91 1.02
39 ft
Figure 28. DO Profile of the Clymer north aeration unit

Clymer Borough Municipal Authority Wastewater Plant Performance Evaluation
Department of Environmental Protection Page 34 of 41 Bureau of Water Standards and Facility Regulation
South Aeration Tank (Direction of Flow <--------------)
3.37 3.31 3.02 2.89 2.95 2.99 3.12 3.15 Discharge Point
Raw Influent3.27 15 ft
3.04 3.17 2.89 2.92 2.82 2.74 3.09 2.83 2.893.08
3.26 3.15 3.15 2.98 2.96 2.97 3.42.98 2.99 2.88 2.92 2.74 2.76 3.03 2.79
2.95 2.94 2.913.12
3.12 3.0 3.1 3.01 2.96 2.92 3.1 2.92
3.06 2.98 24 ft3.09 3.09 2.98 2.96 2.93 3.01
39 ft Return Activated Sludge
Figure 29. DO Profile of the Clymer south aeration unit
DO Grab Testing During the course of the study, DO grab samples were collected at various locations in the aeration tanks for process control purposes and to validate on-line monitoring equipment. These samples were also used to perform OUR and Specific Oxygen Uptake Rate (SOUR) testing on both basins to analyze biomass health and food supply.
After the on-line monitoring equipment has been removed the DO within the aeration tanks can be tracked and trended using this same grab sample method to ensure sufficient oxygen is available for nitrification to occur.
Nitrate and Ammonia Nitrogen Use of the nitrate and ammonium ion probes at the CBMA plant showed relatively low ammonia and high nitrate concentrations throughout the WPPE. Since nitrification and BOD removal were occurring and the facility was constructed in a manner not allowing the aeration blowers to be controlled individually, modifications to the treatment process were not possible.
With extended aeration processes, ammonia-nitrogen tends to be quickly converted to nitrite and nitrate. Nitrate is a pollutant-of-concern in wastewater effluent because nitrate acts as a fertilizer, increasing algal growth that leads to eutrophication of streams and lakes and, ultimately, the mortality of higher life forms. Nitrates have also been indicated as damaging to human health, having both immediate and long-term effects.
The study looked at process modifications to favor denitrification, without excessive capital expense. The current configuration of the raw influent entering the top of each tank and, in plug flow, discharging the opposite end does allow for nitrification to occur but cannot be easily modified to allow for denitrification. The air delivery system to the aeration tanks also provides the air for the sludge return pumps. So, shutting off air to the aeration tanks stops the sludge return which is a necessary source of nitrate in the denitrification process. Potential future modifications could include modifying one of the aeration units on a temporary basis with a curtain or baffle installed at the front end of the aeration unit with pumps to return high nitrate

Clymer Borough Municipal Authority Wastewater Plant Performance Evaluation
Department of Environmental Protection Page 35 of 41 Bureau of Water Standards and Facility Regulation
waste to the anoxic zone. The possibility to perform denitrification operations at this facility would require some capital investment and could not be guaranteed due to the current plant configuration and influent loadings.
pH, Temperature Upon completion of the WPPE, the plant’s operating pH was just below 7.0 s.u. which is slightly less than the suggested target level. Generally, the optimum pH for nitrification is in the 7.5 to 8.5 s.u. range. There is no chemical addition for pH adjustment. Alkalinity levels in the effluent averaged 94.7 mg/L over the course of the WPPE suggesting that sufficient alkalinity was present for nitrification operations to occur. The nitrification process consumes approximately 7.2 lbs of alkalinity for each pound of ammonia converted to nitrate. The operator should continue to monitor the pH in the aeration basins on a daily basis and add alkalinity supplements, such as lime or magnesium hydroxide, as necessary to maintain healthy levels. If the pH levels were to drop much below current levels, then supplemental chemical addition to boost alkalinity levels may be necessary.
Flow Measurement The CBMA totalizer readings were utilized for flow readings during the WPPE.
Laboratory Tests A significant part of the WPPE includes sampling on-site using a centrifuge, pH and DO meters, LBOD probe, and a spectrophotometer, and heater block. Also, the clarifier sludge blankets are monitored to define the blanket depth and clarity.
A centrifuge was utilized for developing quick information on solids inventory and biomass condition. This equipment includes settleometers, which mimic clarifier performance, and a core-taker that is used to determine both clarifier sludge blanket level and percent solids of a representative sample, used in determining total plant inventory. According to supplemental information provided by the core taker manufacturer, it is possible to determine a sludge age, similar to use of MCRT, for tracking overall plant performance. Doing so includes maintaining a running sludge solids inventory of all processes and tanks, including aeration, clarifiers, return and waste sludge volumes, and inflow and effluent solids. It is also recommended that the sludge solids by percent volume be calibrated to sludge solids by gravimetric analysis.
During the evaluation period, the Department also provided a hand-held DO probe and pH probe for use in field testing of the aeration tank mixed liquor. The preferred method of determining process DO is to immerse the DO probe into the aeration tank or effluent stream and to read the DO after the meter stabilizes.
To verify the accuracy of the digital probes, a field spectrophotometer kit was provided that included test materials for several water quality parameters. During the WPPE, this kit was used to determine nitrate and ammonia nitrogen levels throughout the plant and verify the on-line process monitoring equipment. The heater block was used for analysis of COD and Total Phosphorus.
Attachment H contains examples of the Process Control Testing worksheets prepared during the WPPE.

Clymer Borough Municipal Authority Wastewater Plant Performance Evaluation
Department of Environmental Protection Page 36 of 41 Bureau of Water Standards and Facility Regulation
Method 1623 Pathogen Test Results: Date Sample Location Weather Sample
Number Giardia cysts/~10 L
Crypto oocyst/~10 L
5/10/10 Upstream on Two Lick Creek
0331913 4 0
5/10/10 Effluent 0331912 11 0 5/10/10 Downstream at PA
American DW Intake 0331914 1 0
5/25/10 Upstream on Two Lick Creek
0331930 1 0
5/25/10 Effluent 0331929 19 0 5/25/10 Downstream at PA
American DW Intake 0331931 0 0
6/8/10 Upstream on Two Lick Creek
0331940 3 0
6/8/10 Effluent 0331939 9 0 6/8/10 Downstream at PA
American DW Intake 0331941 0 0
Table 5. Method 1623 test results
Table 5, above shows the pathogen test results for Giardia and Cryptosporidium. The effluent samples from the plant consistently indicate the presence of Giardia lamblia cysts and Cryptosporidium oocysts in the effluent.

Clymer Borough Municipal Authority Wastewater Plant Performance Evaluation
Department of Environmental Protection Page 37 of 41 Bureau of Water Standards and Facility Regulation
8. Conclusions
Considerations for Operational Modifications The following are possible modifications that could be made at the WWTP and are based on the data collected during this study and current operating practices commonly utilized at other WWTP’s across the Commonwealth. These modifications are presented for the operators benefit but should only be instituted while cautiously observing the effects on the overall treatment efficiency. Since the WWTP process is a biological process, changes made on a particular day may not be visible until at least 24-48 hours later, or more. The responsibility for instituting changes and their outcomes remains with the Operator in Responsible Charge at the WWTP where the changes are made.
DO control Currently, the plant has limited ability to modify DO levels in the aeration tank without manually starting and stopping blower motors controlling air flow to the aeration and settling tanks. Future modifications to the plant could include separation of air lines to make it possible to more accurately control DO levels in the aeration units while maintaining an air supply to the return sludge pumps. At CBMA, the facility could benefit from analyzing the current blower performance, along with current BOD loadings, and resulting air supply needs to determine if it’s necessary to replace the current blowers. Current DO data suggests that the blowers cannot provide enough air to the treatment process. The exact cause for this was not determined but could include increased influent loadings and/or diminished capacity of the blowers themselves. If the blowers were replaced it would be most beneficial to install units capable of being operated with Variable Frequency Drives to ensure the most efficiency. At that point if the air lines to the clarifiers were separated then the blower motors could be controlled through on-line process monitoring equipment such as a DO monitor. If the data were used to control the blower motors with combined with soft-start and variable-speed drive capability then utilizing a feedback loop between the motor starters and on-line DO probes, the operator could efficiently regulate aeration capacity to support nitrification. These efforts could save money over the long term on electric energy costs. CBMA’s engineer may be able to develop a depreciation and payback term for such equipment changes.
Optimum Levels for Nitrification Nitrifying bacteria (autotrophic aerobes) convert NH3 to NO3 consuming inorganic carbon, DO, and alkalinity. Optimal conditions for nitrification are: MCRT: 10 to 13 days Wastewater Temperature: 60 - 95°F MLSS: 2,000 to 3,500 mg/L (colder temperatures may require increased MLSS levels) DO level: > 1.5 mg/L (4.6 lbs per lb of NH3 converted to NO3) pH: 7.5 to 8.5 s.u. Sufficient Alkalinity to provide 7.2 lbs per pound of NH3 converted to NO3 Table 6. Optimum nitrification indicators

Clymer Borough Municipal Authority Wastewater Plant Performance Evaluation
Department of Environmental Protection Page 38 of 41 Bureau of Water Standards and Facility Regulation
Unfortunately, all plants have their individual characteristics based on influent flow, plant design, and operating procedures. While these levels are generally used in the nitrification process, individual plants may find necessary to deviate from these general values.
Pathogen control Disinfection for fecal coliform reduction is currently performed utilizing gas chlorination. Sodium hypochlorite tablets are used to supplement the gas system when necessary, as a backup means of chlorination and for chlorinating sludge returns to treatment for filamentous bacteria. No solids accumulation was identified in the disinfection tank during the course of the WPPE. Ultraviolet disinfection (UVD) is being considered for implementation at this facility. UVD is generally much safer for the operators and the public and can provide excellent disinfection when used in the correct applications. In addition, UVD is more effective at inactivating Giardia lamblia cysts and Cryptosporidium oocysts.
Laboratory methods Mixed liquor suspended solids tests are usually conducted once weekly. Generally this practice would be acceptable for monitoring the biomass. During spring and fall times of year when the temperatures are changing it may be beneficial to monitor the MLSS more frequently, at least twice weekly. Also, once the MLSS test is complete, volatilizing any solids remaining in the muffle furnace will provide data on MLVSS, which allows for the calculation of the mean cell residence time (MCRT). Generally, MCRTs in the 10 - 13 day range allow for optimum nitrification of the wastewater. Use of the centrifuge, settleometers, and core-taker would allow the operators to develop a sludge inventory based on sludge units (SLU), which is a product of both solids-by-volume percent and process volume or total flow. Developing such a sludge inventory also allows the operators to determine a sludge age (AGE) for the process, which on a daily basis is used similar to the MCRT as an operational guideline. In either case, whether using AGE or MCRT, it is beneficial to plant operators to find an ideal operational setpoint and then adjust the process to maintain the plant at or near that setpoint. It is somewhat like flying by instruments instead of using visual flight rules. Intuition, experience, and visual observations do help, but they only go so far.
Inflow/Infiltration As are many POTWs in the Commonwealth, the Clymer collection system is impacted by inflow and infiltration. A maximum daily flow of 0.585 MGD indicates that some I/I does exist and could adversely affect operations. The 2009 Wasteload Management Report indicates that Green Township’s collection system is the source of excess flows. CBMA should continue to evaluate its collection along with that of Green Township to identify potential sources of I/I and implant strategies to reduce excess flows.
Solids Management and Inventory Control The solids management and inventory control program is based primarily on ½ hour settleability tests and centrifuge testing performed on mixed liquor samples. Additionally, gravimetric tests

Clymer Borough Municipal Authority Wastewater Plant Performance Evaluation
Department of Environmental Protection Page 39 of 41 Bureau of Water Standards and Facility Regulation
should be performed at least once per week to correlate the settleability and centrifuge tests to actual suspended solids analysis. With these three pieces of information the operator can quickly identify the loadings on the treatment units allowing them to waste solids at the most opportune times.
The current practices include wasting solids after they are allowed to settle in the clarifiers for several hours. While the operators make this practice work for the current plant setup it would be more operator friendly and easier to operate if a larger sludge digester were present for solids disposal.
MLSS vs. Centrifuge Solids comparison charts were prepared for the operators use should they acquire a centrifuge, which is encouraged. Operators can use the attached charts to estimate MLSS levels after performing a % solids test which should give a good indication of solids levels and help with deciding when to waste solids. These charts would need to be updated regularly to ensure changes in plant conditions are considered, especially seasonal considerations.
Figures 30 and 31, below, depict the mixed liquor suspended solids (MLSS) levels at CBMA in relation to the respective centrifuge solids reading. By plotting the data and inserting a best fit line, one can use a centrifuge solids reading to effectively estimate the MLSS reading. To utilize the chart, find the % solids result along the x axis and draw a line vertically to the black line to find the approximate MLSS result.
MLSS vs. Centrifuge solidsSouth Aeration Tank
-500
1,0001,5002,0002,5003,0003,5004,0004,500
2.6 3.2 3.5 4.1 4.5 4.15 5 5 5.75
Centrifuge, % Solids
MLS
S, m
g/L
MLSS Linear (MLSS)
Figure 30. MLSS vs. Centrifuge solids comparison chart for the south aeration tank
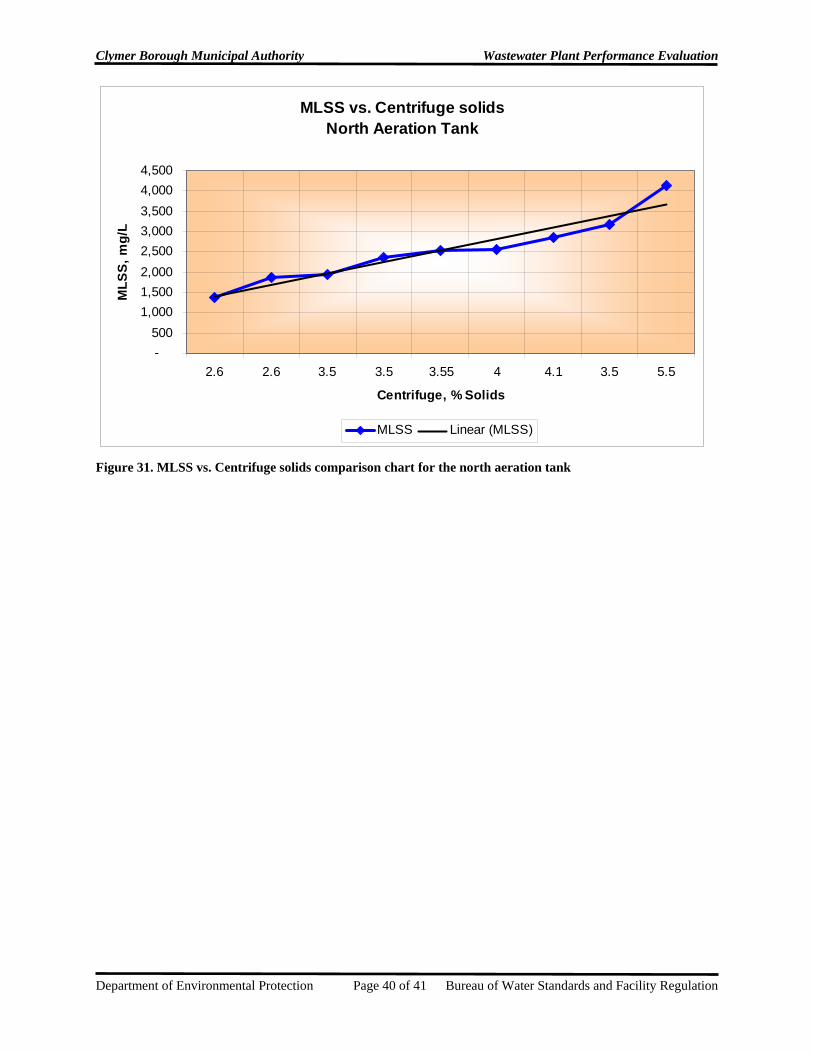
Clymer Borough Municipal Authority Wastewater Plant Performance Evaluation
Department of Environmental Protection Page 40 of 41 Bureau of Water Standards and Facility Regulation
MLSS vs. Centrifuge solidsNorth Aeration Tank
-500
1,0001,5002,0002,5003,0003,5004,0004,500
2.6 2.6 3.5 3.5 3.55 4 4.1 3.5 5.5
Centrifuge, % Solids
MLS
S, m
g/L
MLSS Linear (MLSS)
Figure 31. MLSS vs. Centrifuge solids comparison chart for the north aeration tank
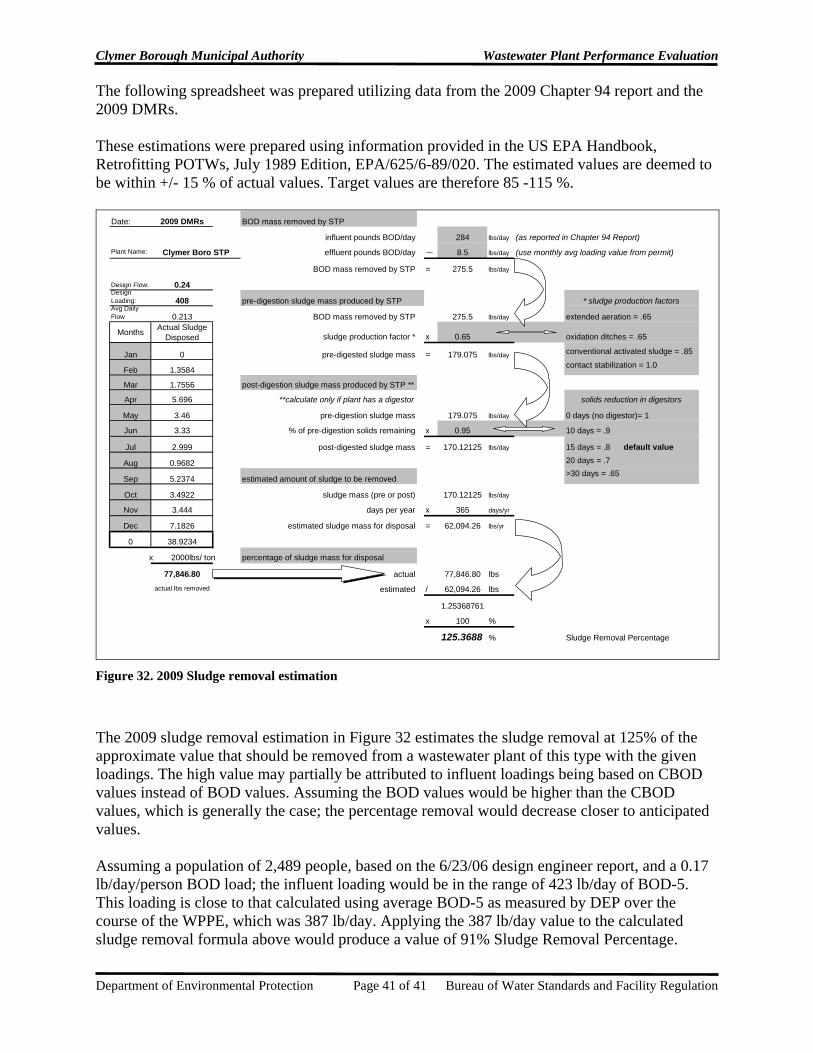
Clymer Borough Municipal Authority Wastewater Plant Performance Evaluation
Department of Environmental Protection Page 41 of 41 Bureau of Water Standards and Facility Regulation
The following spreadsheet was prepared utilizing data from the 2009 Chapter 94 report and the 2009 DMRs. These estimations were prepared using information provided in the US EPA Handbook, Retrofitting POTWs, July 1989 Edition, EPA/625/6-89/020. The estimated values are deemed to be within +/- 15 % of actual values. Target values are therefore 85 -115 %.
Date: 2009 DMRs BOD mass removed by STP
influent pounds BOD/day 284 lbs/day (as reported in Chapter 94 Report)
Plant Name: effluent pounds BOD/day 8.5 lbs/day (use monthly avg loading value from permit)
BOD mass removed by STP = 275.5 lbs/day
Design Flow: 0.24Design Loading: 408 pre-digestion sludge mass produced by STP * sludge production factorsAvg Daily Flow 0.213 BOD mass removed by STP 275.5 lbs/day extended aeration = .65
Months Actual Sludge Disposed sludge production factor * x 0.65 oxidation ditches = .65
Jan 0 pre-digested sludge mass = 179.075 lbs/day conventional activated sludge = .85
Feb 1.3584 contact stabilization = 1.0
Mar 1.7556 post-digestion sludge mass produced by STP **
Apr 5.696 **calculate only if plant has a digestor solids reduction in digestors
May 3.46 pre-digestion sludge mass 179.075 lbs/day 0 days (no digestor)= 1
Jun 3.33 % of pre-digestion solids remaining x 0.95 10 days = .9
Jul 2.999 post-digested sludge mass = 170.12125 lbs/day 15 days = .8 default value
Aug 0.9682 20 days = .7
Sep 5.2374 estimated amount of sludge to be removed>30 days = .65
Oct 3.4922 sludge mass (pre or post) 170.12125 lbs/day
Nov 3.444 days per year x 365 days/yr
Dec 7.1826 estimated sludge mass for disposal = 62,094.26 lbs/yr
0 38.9234
x 2000lbs/ ton percentage of sludge mass for disposal
77,846.80 actual 77,846.80 lbs
actual lbs removed estimated / 62,094.26 lbs
1.25368761
x 100 %
125.3688 % Sludge Removal Percentage
Clymer Boro STP
Figure 32. 2009 Sludge removal estimation
The 2009 sludge removal estimation in Figure 32 estimates the sludge removal at 125% of the approximate value that should be removed from a wastewater plant of this type with the given loadings. The high value may partially be attributed to influent loadings being based on CBOD values instead of BOD values. Assuming the BOD values would be higher than the CBOD values, which is generally the case; the percentage removal would decrease closer to anticipated values. Assuming a population of 2,489 people, based on the 6/23/06 design engineer report, and a 0.17 lb/day/person BOD load; the influent loading would be in the range of 423 lb/day of BOD-5. This loading is close to that calculated using average BOD-5 as measured by DEP over the course of the WPPE, which was 387 lb/day. Applying the 387 lb/day value to the calculated sludge removal formula above would produce a value of 91% Sludge Removal Percentage.

Clymer Borough Municipal Authority Wastewater Plant Performance Evaluation
Department of Environmental Protection A-1 Bureau of Water Standards and Facility Regulation
Attachment A— Program Description POTW Optimization Program
Description and goals As part of an EPA-sponsored grant, the DEP has created a Wastewater Optimization Program to enhance surface water quality by improving sewage treatment plant performance beyond that expected by existing limits of the plants’ National Pollutant Discharge Elimination System (NPDES) Permits. The goal of this program is to reduce pathogen, nutrient, and emerging contaminant loadings to downstream drinking water facility intakes. The initial focus will be to work with wastewater treatment facilities within five miles upstream of these filter plant intakes. DEP will conduct Wastewater Plant Performance Evaluations (WPPEs) to assist municipal wastewater systems in optimizing their wastewater treatment plant processes as part of the Wastewater Optimization Program. Each evaluation is expected to last up to 2 months. This new program is modeled after DEP’s Filter Plant Performance Evaluations (FPPEs) conducted at Drinking Water facilities. This program is not part of the Field Operations, Monitoring and Compliance Section. Sample collection methods utilized during this evaluation generally do not conform with 40 CFR Part 136, therefore the data collected will not be used, and in some cases is not permitted to be used for determining compliance with a facility’s effluent limits established in its NPDES permit.
Wastewater plant performance evaluation • Department staff will consult with the plant operators to explain the program, the
goals, the equipment used, and the expectations for participation. • Upon arrival at the wastewater plant, Department staff will set up equipment,
including meters capable of continuous, on-line monitoring for pH, Oxidation-Reduction Potential, Ammonia, Nitrates, DO, and other parameters.
• The Department will utilize the equipment to gather data on system performance, show the operator how to gather similar data, and explain the value of gathering the data. Process modification will be discussed to explain how operators could choose to modify their treatment processes based on interpretation of the data collected.
• Although the Department may show operators how to achieve effective process control by using these process monitoring tools, the operators will continue to make all process control decisions, in conformance to their licensing requirements, and retain responsibility for those changes.
• The Department will also lend the facility additional laboratory equipment which will remain on site during the WPPE to assist in data collection and interpretation.
• During this time, the operator may need to spend more time performing routine testing at the treatment plant than was done previously; this will allow correlations to be made between process modifications and the process response.

Clymer Borough Municipal Authority Wastewater Plant Performance Evaluation
Department of Environmental Protection A-2 Bureau of Water Standards and Facility Regulation
• One major goal of the program is to provide the operator with the process monitoring knowledge and experience necessary to gather useful data and utilize it to make beneficial changes in the treatment process and the receiving stream long after the Department and its equipment have been removed.
• There is no charge for the Department’s review of the treatment process, setup of all equipment, the process control monitoring that will take place, lending meters to the plant during the WPPE, data collection and explanation of potential effects that process modifications can have on the treatment process.
• The municipality will be responsible for providing laboratory bench space and 120 VAC power for the instrumentation. Any costs associated with process modifications (such as equipment upgrades, chemical purchases, etc.) that the municipality deems appropriate and beneficial as a result of the WPPE remain the responsibility of the municipality. The municipality reserves the right to cease participation in the WPPE at any time.
• Following the equipment set-up, the Department will observe the facilities and review operational practices, treatment processes, chemical treatment, operational data currently collected, and overall system performance.
• During the evaluation, the Department will review monitoring records, laboratory sheets, operations log sheets, and any drawings and specifications for the treatment facility. Also of interest is data currently collected and how it is utilized for daily process modifications. This information is usually available from existing reports.
Program evaluation team will consist of 1 to 2 people: Wastewater Optimization Program Specialists, PA licensed as a wastewater plant operators with operations and compliance assistance experience.
Potential Benefits • Use of online process control monitoring equipment during the WPPE, use of hand
held meters and portable lab equipment during the WPPE, and furthering the operators’ knowledge of process control strategies and monitoring techniques,
• Producing a cleaner effluent discharge which minimizes impacts to the environment and downstream water users, and possible identification of process modifications that could result in real cost savings.
• Where the optimization goals may be more stringent than current requirements of your NPDES permit, they are completely voluntary. The WPPE objective is to optimize wastewater treatment plant performance in order to enhance surface water quality, minimizing the effects of pathogen and nutrient loading to downstream drinking water plant intakes.
• Furthermore, pursuit of a good rating in the WPPE program may place the wastewater system in a better position to meet more stringent regulatory requirements in the future, should they occur. For example, regulatory changes over the last ten years have reduced the final effluent Total Chlorine Residual limits requiring dechlorination or optimization of treatment processes to reduce the levels of chlorine added to the process for disinfection. Facilities who have voluntarily maintained lower residuals than listed in their permit have found it easier to comply with the updated regulations.

Clymer Borough Municipal Authority Wastewater Plant Performance Evaluation
Department of Environmental Protection B-1 Bureau of Water Standards and Facility Regulation
Attachment B— WPPE Team
Clymer Borough Municipal Authority-Wastewater Treatment Plant
WPPE Team Robert DiGilarmo, Water Program Specialist DEP – Ebensburg Office 286 Industrial Park Rd Ebensubrg, PA 15931 814-472-1819 [email protected] Marc Neville, Water Program Specialist DEP- RCSOB 400 Market St Harrisburg, PA 17105 717-772-4019 [email protected]
Municipal wastewater plant representatives Jan Gallo, Manager Clymer Borough Municipal Authority 1675 Franklin St. Clymer, PA 15728 724-254-1490 Ryan Cramer, Operator Clymer Borough Municipal Authority 1675 Franklin St. Clymer, PA 15728 724-254-1490

Clymer Borough Municipal Authority Wastewater Plant Performance Evaluation
Department of Environmental Protection C-1 Bureau of Water Standards and Facility Regulation
Attachment C— Suggested Sampling Frequencies
Operator Sample collection guidelines Plant Flow: Less than 1.0 MGD
Sample Parameter Sample Location Sample Type 3/Week 1/Week 2/MonthRaw Influent *BOD5 and TSS Influent Grab xAlkalinity Influent Grab xCOD Influent Grab xNH3-N Influent Grab xpH Influent Grab xFlow As permitted Totalizer Daily* Frequency of sampling may need to be increased or decreased depending on plant size or conditions
Aeration BasinMLSS / MLVSS Aeration Tank Grab xCentrifuge Testing Aeration Tank Grab xDissolved Oxygen Aeration Tank In Situ xSettleability (SV30) Aeration Tank Grab xpH Aeration Tank Grab xMicroscopic Evaluation Aeration Tank Grab xReturn Activated Sludge, SS RAS line Grab xComputation of SVI, F/M, sludge age, - -and/or MCRT
Secondary ClarifierSludge blanket depth As appropriate In situ xWaste Activated Sludge, SS and VSS Waste Line Grab X
Final EffluentAlkalinity Effluent Grab xParameters, sample types, and frequencies required by permitModified from its original versionReference: Texas Commission on Environmental Quality, Guidance Document RG-002(Revised), October 2002
As data collected
Table 7. Suggested sampling frequencies These parameters and frequencies are the minimum for facilities with flows rated less than 1.0 MGD. Operators are encouraged to sample more frequently as necessary to gather enough data to effectively make informed process control decisions. Depending on the chemical makeup of the wastewater, additional analyses may need to be performed to provide adequate treatment. This sampling may coincide with some sampling required by the NPDES permit but does not reduce the sampling required by said permit.
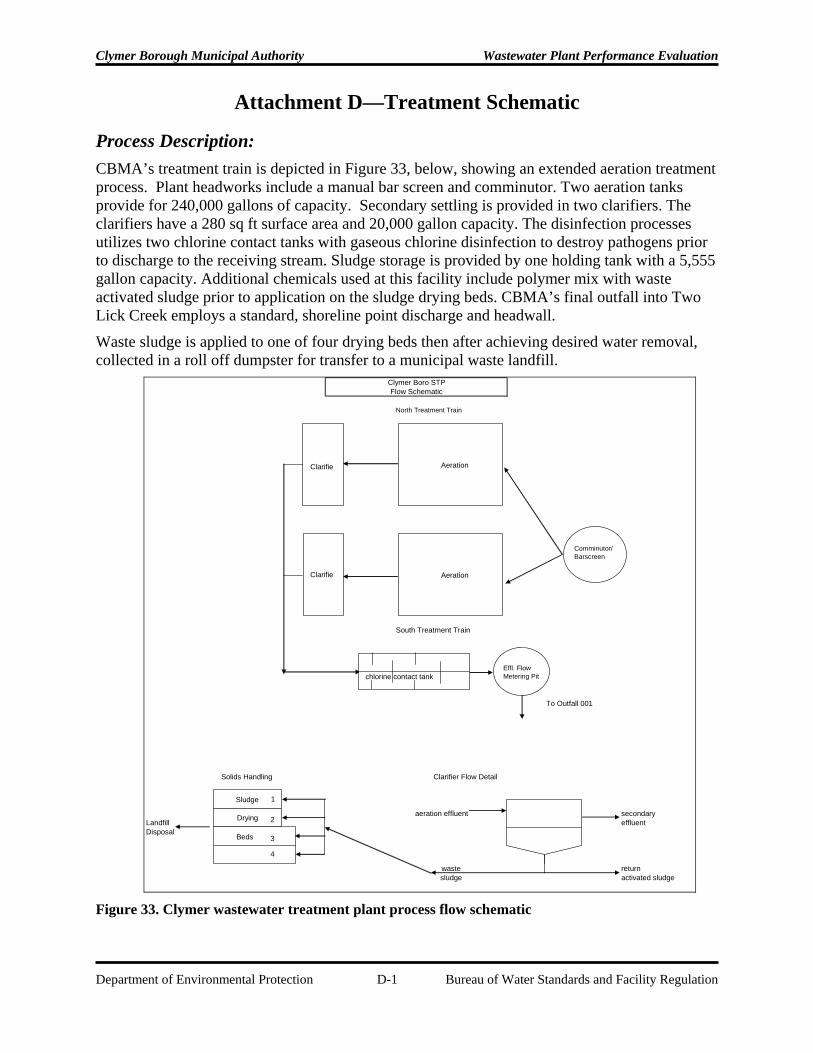
Clymer Borough Municipal Authority Wastewater Plant Performance Evaluation
Department of Environmental Protection D-1 Bureau of Water Standards and Facility Regulation
Attachment D—Treatment Schematic
Process Description: CBMA’s treatment train is depicted in Figure 33, below, showing an extended aeration treatment process. Plant headworks include a manual bar screen and comminutor. Two aeration tanks provide for 240,000 gallons of capacity. Secondary settling is provided in two clarifiers. The clarifiers have a 280 sq ft surface area and 20,000 gallon capacity. The disinfection processes utilizes two chlorine contact tanks with gaseous chlorine disinfection to destroy pathogens prior to discharge to the receiving stream. Sludge storage is provided by one holding tank with a 5,555 gallon capacity. Additional chemicals used at this facility include polymer mix with waste activated sludge prior to application on the sludge drying beds. CBMA’s final outfall into Two Lick Creek employs a standard, shoreline point discharge and headwall.
Waste sludge is applied to one of four drying beds then after achieving desired water removal, collected in a roll off dumpster for transfer to a municipal waste landfill.
North Treatment Train
South Treatment Train
To Outfall 001
Solids Handling Clarifier Flow Detail
aeration effluent secondaryLandfill effluentDisposal
waste returnsludge activated sludge
Clymer Boro STPFlow Schematic
Aeration
Effl. Flow Metering Pit
Comminutor/Barscreen
Aeration
Clarifie
Clarifie
chlorine contact tank
Sludge
Drying
Beds
1
2
3
4
Figure 33. Clymer wastewater treatment plant process flow schematic

Clymer Borough Municipal Authority Wastewater Plant Performance Evaluation
Department of Environmental Protection E-1 Bureau of Water Standards and Facility Regulation
Attachment E— Laboratory Sampling Results Municipal Authority of Clymer Laboratory Sample Results
Upstream, Downstream, Effluent, Mixed Liquor Suspended Solids The following pages represent the samples collected by Department personnel over the project period. These samples are for informational use in identifying trends and effects of process modifications where applicable. These samples were not collected with the intentions of being used for compliance purposes.

Clymer Borough Municipal Authority Wastewater Plant Performance Evaluation
Department of Environmental Protection E-2 Bureau of Water Standards and Facility Regulation
Municipal Authority of Clymer, DEP Laboratory sample results Effluent, Upstream, and Downstream
Lab Resutls-Clymer WWTP
4/13/10 4/21/10 4/27/10 5/4/2010 5/10/2010 5/19/10 5/21/10 5/25/10 5/27/10 6/8/10Effluent-Sample # 0331879 0331888 0331895 0331904 0331912 0331919 0331929 0331939CBOD 2.3 1.8 3.1 5.1 2.9 3.9 2.3 2.7TSS 5 <5 6 <5 7 6 5 5Alkalinity 105.6 96.4 70 88.4 103.8 83 103.2 107.2NO2-N 0.08 0.03 0.01 0.01 0.01 0.07 0.01 0.01NO3-N 24.5 24.67 16.42 18.11 15.7 16.52 14.84 17.38NH3-N 0.05 0.06 0.04 0.06 0.05 0.16 0.05 0.09TKN 1.74 1.95 1.52 1.61 1.64 1.75 1.38 1.67Phos 2.619 2.413 1.926 2.31 2.018 1.951 1.43 2.62TOT N(TKN+NO3+NO2) 26.32 26.65 17.95 19.73 17.35 18.34 16.23 19.06Fecal Coliform 4600 2800 750 80 270 2700 20 <20Chloride 191.9 175 137.2 153 157.4 152 163.4 169pH 8 7.8 7.4 7.6 7.5 7.5 7.5 7.4Crypto 0 0 0Giardia 11 19 9STP Flow 0.173 0.183 0.2 0.211 19.7 0.21 0.211 21.6 0.203 18.8
Upstream-Sample # 0331880 0331896 0331905 0331913 0331920 0331930 0331940BOD 0.5 171 1.3 0.8 0.5 2 1TSS 13 19 32 9 32 7 8Alkalinity 56.4 25.6 47.2 41.6 41.6 43.8 51.2NO2-N 0.01 0.01 0.01 0.01 0.01 0.01 0.01NO3-N 0.29 0.45 0.4 0.44 0.6 0.56 0.75NH3-N 0.02 0.02 0.02 0.02 0.02 0.02 0.02TKN 1 1 1 1 1 1 1Phos 0.01 0.026 0.027 0.01 0.022 0.01 0.012TOT N(TKN+NO3+NO2) 1.3 1.46 1.41 1.45 1.61 1.57 1.76Fecal Coliform 10 360 240 40 100 40 900Chloride 12.7 12.8 13.7 12.6 12.6 11.1 11.2pH 7.9 7 7.7 7.4 7.4 7.5 7.7Crypto 0 0 0Giardia 4 1 3
Downstream-Sample # 0331881 0331897 0331906 0331914 0331921 0331931 0331941BOD 0.5 1.7 1 0.7 0.4 1.3 <.2TSS <5 <5 <5 5 <5 5 5Alkalinity 23.4 18 26.4 26.2 31 31.6 31.2NO2-N 0.01 0.01 0.01 0.01 0.01 0.01 0.01NO3-N 0.81 0.79 0.75 0.7 0.69 0.63 0.55NH3-N 0.02 0.02 0.02 0.02 0.02 0.02 0.02TKN 1 1 1 1 1 1 1Phos 0.01 0.01 0.012 0.01 0.01 0.01 0.011TOT N(TKN+NO3+NO2) 1.82 1.8 1.76 1.71 1.7 1.64 1.56Fecal Coliform <20 80 20 5 30 <20 20Chloride 18 18.2 15.7 16 20.3 16.3 13.7pH 7.5 7 7.3 7.1 7.2 7.4 7.2Crypto 0 0 0Giardia 1 0 0Total Coliform <20TDS 156Volatile Solids 6 Table 8. Clymer sample data

Clymer Borough Municipal Authority Wastewater Plant Performance Evaluation
Department of Environmental Protection E-3 Bureau of Water Standards and Facility Regulation
Municipal Authority of Clymer, DEP Laboratory sample results Mixed Liquor Suspended Solids, Return Activated Sludge, and Influent
Lab Resutls-Clymer WWTP
4/13/10 4/21/10 4/27/10 5/4/10 5/10/10 5/19/10 5/21/10 5/25/10 5/27/10 6/8/10MLSS- South - Sample # 0331882 0331890 0331899 0331908 0331916 0331923 0331927 0331933 0331937 0331943MLSS 2494 1628 3070 2610 4020 3212 2746 2078 3764 2508MLVSS 1786 1732 2560 2048 2962 2392 2392 1624 2752 1852MLSS/MLVSS ratio: 71.6% 106.4% 83.4% 78.5% 73.7% 74.5% 87.1% 78.2% 73.1% 73.8%Alkalinity 227.6 250.4 204 252.2 260.4 174.4 276.4 163.2 198.6 143.6
MLSS- North - Sample # 0331883 0331889 0331898 0331907 0331915 0331922 0331926 0331932 0331936 0331942MLSS 2976 2560 2532 3162 1880 2856 1950 2360 1368 4120MLVSS 2328 2520 2128 2198 1456 2102 1780 1886 1240 3036MLSS/MLVSS ratio: 78.2% 98.4% 84.0% 69.5% 77.4% 73.6% 91.3% 79.9% 90.6% 73.7%Alkalinity 247.2 294.2 193.2 255.4 180.8 154 241.4 172.2 134.2 184.6
RAS- South- Sample # 0331884 0331892 0331910 0331925 0331935 0331945MLSS 3660 3736 4894 5064 2248 2832MLVSS 2748 2524 3472 3480 1804 2076MLSS/MLVSS ratio: 75.1% 67.6% 70.9% 68.7% 80.2% 73.3%
RAS- North- Sample # 0331885 0331891 0331909 0331924 0331934 0331944MLSS 4278 4584 3790 4488 4894 4648MLVSS 3334 3396 3160 2836 3632 3420MLSS/MLVSS ratio: 77.9% 74.1% 83.4% 63.2% 74.2% 73.6%
Influent -Sample # 0331878 0331893 0331894 0331903 0331911 0331918 0331926 0331938BOD 240 234 199 303 174 221 238 273.5COD 220.6 138.6 181.6 393.9 275.8 583.4 157.7 210.2BOD/COD ratio: 92% 59% 91% 130% 159% 264% 66% 77%TSS 190 170 152 270 288 172 186 226Alkalinity 273 273 274.6 293.6 266.4 236.6 259.2 313NO2-N 0.01 0.04 0.11 0.11 0.46 0.01 0.1 0.01NO3-N 0.04 0.04 0.16 0.19 1.48 0.04 0.04 0.04NH3-N 25.15 18.42 32.72 - 25.9 22.51 19.13 37.18TKN 34.92 28.4 41.05 - 34.04 31.69 31.53 50.76Phos 4.223 3.315 4.847 - 4.231 4.454 4.326 6.054TOT N 34.97 28.48 41.32 - 35.98 31.74 31.58 50.81Chloride 298.9 179.3 152.4 149.2 165.7 143.7 151.8 170.6pH 7.5 7.6 7.6 7.4 7.5 7.4 7.3 7.5STP Flow 0.173 0.183 0.2 0.211 0.197 0.21 0.211 0.216 0.203 0.188
TKN, Phos &NH3 canceled
Table 9. Clymer sample data

Clymer Borough Municipal Authority Wastewater Plant Performance Evaluation
Department of Environmental Protection F-1 Bureau of Water Standards and Facility Regulation
Attachment F— 2010 Flow Data, April through June
Clymer Boro STP Flow Readings
April 2010 May 2010 June 2010Day MGD Rainfall Day MGD Rainfall Day MGD Rainfall
1 0.206 0.07 1 0.210 0 1 0.195 0.072 0.206 0 2 0.204 0.28 2 0.182 0.033 0.201 0 3 0.269 0.35 3 0.169 0.074 0.189 0 4 0.211 0.01 4 0.216 0.035 0.157 0 5 0.205 0 5 0.260 0.146 0.214 0.15 6 0.163 0.15 6 0.163 0.077 0.174 0 7 0.318 0 7 0.200 0.118 0.200 0.15 8 0.294 0.82 8 0.188 09 0.188 0.01 9 0.165 0.05 9 0.585 1.4310 0.182 0 10 0.197 0 10 0.270 011 0.165 0 11 0.430 0.62 11 0.200 012 0.178 0 12 0.235 0.3 12 0.240 0.0713 0.173 0.09 13 0.220 0 13 0.200 014 0.169 0.15 14 0.234 0 14 0.188 0.0115 0.189 0 15 0.214 0 1516 0.118 0.41 16 0.186 0 1617 0.297 0.02 17 0.300 0.73 1718 0.181 0 18 0.258 0.27 1819 0.177 0 19 0.210 0 1920 0.173 0 20 0.209 0 2021 0.183 0 21 0.211 0 2122 0.162 0 22 0.365 0.69 2223 0.186 0 23 0.208 0 2324 0.180 0.01 24 0.232 0 2425 0.172 0.28 25 0.216 0 2526 0.361 1.27 26 0.187 0 2627 0.200 0.01 27 0.203 0 2728 0.174 0 28 0.149 0.25 2829 0.198 0 29 0.180 0 2930 0.181 0 30 0.174 0 30
31 0.198 0.02 31Average 0.191 0.087 Average 0.228 0.146 Average 0.233 0.145Max 0.361 1.270 Max 0.430 0.820 Max 0.585 1.430Min 0.118 0.000 Min 0.149 0.000 Min 0.163 0.000Total 2.62 Total 4.54 Total 2.03
Average flow over the project= 0.221 MGD Table 10. Clymer wastewater treatment plant flow data

Clymer Borough Municipal Authority Wastewater Plant Performance Evaluation
Department of Environmental Protection F-2 Bureau of Water Standards and Facility Regulation
Clymer Boro STP Flow DataDaily Flows
April 2010 - June 2010
0.000
0.100
0.200
0.300
0.400
0.500
1 4 7 10 13 16 19 22 25 28 31
Day
Flow
, MG
D
April
May
June
Design Flow,0.24 MGD
Figure 34. Clymer wastewater treatment plant monthly flow data

Clymer Borough Municipal Authority Wastewater Plant Performance Evaluation
Department of Environmental Protection G-1 Bureau of Water Standards and Facility Regulation
Attachment G—Equipment Deployed
Continuous monitoring
Table of equipment 1 – Laptop computer with 485 to 232 signal converter 1 – SC1000 1 – LDO probe 1 – pH probe 1 – ORP probe 1 – NH4D probe 1 – Nitratax probe
Laboratory
Table of equipment 1 – Hach HQ40d handheld pH and LDO meter
1 – LBOD probe 1 – DR2800 spectrophotometer
1 – Raven centrifuge 1 – Raven Core Taker sampler 2 – Raven settleometers 1 – COD Heater Block 1 – Microscope with photographic/video capability
.

Clymer Borough Municipal Authority Wastewater Plant Performance Evaluation
Department of Environmental Protection G-2 Bureau of Water Standards and Facility Regulation
North Treatment Train
ProbespHORPDONitrateAmmonia
South Treatment Train
To Outfall 001
Clymer Boro STP On-Line Process Monitoring Probe Placement
Aeration
Effl. Flow Metering Pit
Comminutor/ Barscreen
Aeration
Clarifier
Clarifier
chlorine contact tank
Figure 35. Locations of on-line process monitoring equipment
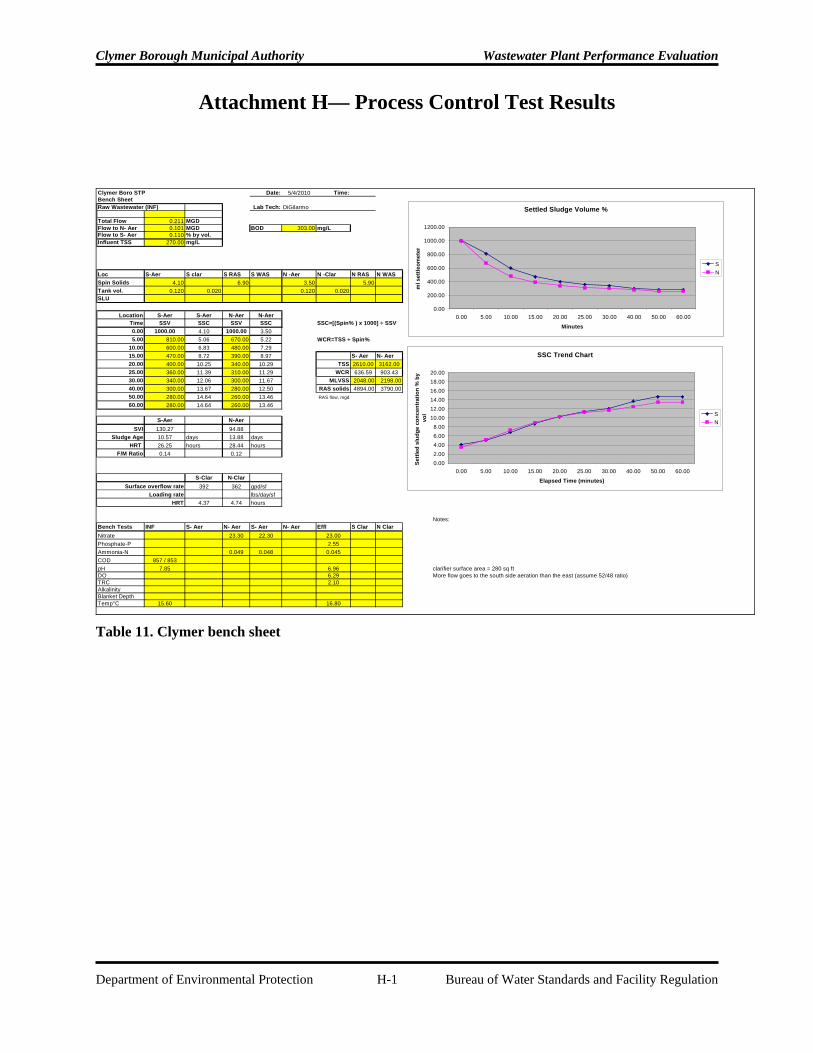
Clymer Borough Municipal Authority Wastewater Plant Performance Evaluation
Department of Environmental Protection H-1 Bureau of Water Standards and Facility Regulation
Attachment H— Process Control Test Results
Clymer Boro STP Date: 5/4/2010 Time:Bench SheetRaw Wastewater (INF) Lab Tech: DiGilarmo
Total Flow 0.211 MGDFlow to N- Aer 0.101 MGD BOD 303.00 mg/LFlow to S- Aer 0.110 % by vol.Influent TSS 270.00 mg/L
Loc S-Aer S clar S RAS S WAS N -Aer N -Clar N RAS N WASSpin Solids 4.10 6.90 3.50 5.90Tank vol. 0.120 0.020 0.120 0.020SLU
Location S-Aer S-Aer N-Aer N-AerTime SSV SSC SSV SSC SSC=[(Spin% ) x 1000] ÷ SSV0.00 1000.00 4.10 1000.00 3.505.00 810.00 5.06 670.00 5.22 WCR=TSS ÷ Spin%
10.00 600.00 6.83 480.00 7.2915.00 470.00 8.72 390.00 8.97 S- Aer N- Aer20.00 400.00 10.25 340.00 10.29 TSS 2610.00 3162.0025.00 360.00 11.39 310.00 11.29 WCR 636.59 903.4330.00 340.00 12.06 300.00 11.67 MLVSS 2048.00 2198.0040.00 300.00 13.67 280.00 12.50 RAS solids 4894.00 3790.0050.00 280.00 14.64 260.00 13.46 RAS flow, mgd
60.00 280.00 14.64 260.00 13.46
S-Aer N-AerSVI 130.27 94.88
Sludge Age 10.57 days 13.88 daysHRT 26.25 hours 28.44 hours
F/M Ratio 0.14 0.12
S-Clar N-Clar392 362 gpd/sf
lbs/day/sf4.37 4.74 hours
Notes:Bench Tests INF S- Aer N- Aer S- Aer N- Aer Effl S Clar N ClarNitrate 23.30 22.30 23.00Phosphate-P 2.55Ammonia-N 0.049 0.048 0.045COD 857 / 853pH 7.85 6.96 clarifier surface area = 280 sq ftDO 6.29 More flow goes to the south side aeration than the east (assume 52/48 ratio)TRC 2.10AlkalinityBlanket DepthTemp°C 15.60 16.80
Surface overflow rateLoading rate
HRT
Settled Sludge Volume %
0.00
200.00
400.00
600.00
800.00
1000.00
1200.00
0.00 5.00 10.00 15.00 20.00 25.00 30.00 40.00 50.00 60.00
Minutes
ml s
ettle
omet
er
SN
SSC Trend Chart
0.002.004.006.008.00
10.0012.0014.0016.0018.0020.00
0.00 5.00 10.00 15.00 20.00 25.00 30.00 40.00 50.00 60.00
Elapsed Time (minutes)
Settl
ed s
ludg
e co
ncen
trat
ion
% b
y vo
l SN
Table 11. Clymer bench sheet

Clymer Borough Municipal Authority Wastewater Plant Performance Evaluation
Department of Environmental Protection H-2 Bureau of Water Standards and Facility Regulation
Clymer Boro STP Date: 6/8/2010 Time:Bench Sheet
Lab Tech: DiGilarmoOUR Testing
Location: N- Aer Time D.O.0 8.93
OUR = slope x 60 1 8.192 7.72
slope = 4.08 3 7.310 4 6.92
5 6.56OUR = 4.08 x 60 6 6.22
10 7 5.928 5.53
OUR = 24.48 mg O2/L-h 9 5.1910 4.85
RR= (1000 x OUR) ÷ VSS= 1000 x 24.48
3036.00
RR = 8.06 mg O2/g-MLVSS-h
Location: S- Aer Time D.O.0 8.83
OUR = slope x 60 1 8.32 8.03
slope = 2.86 3 7.7710 4 7.53
5 7.27 OUR = 2.86 x 60 6 7.03
10 7 6.768 6.5
OUR = 17.16 mg O2/L-h 9 6.2210 5.97
RR= (1000 x OUR) ÷ VSS= 1000 x 17.16
1852.00
RR = 9.27 mg O2/g-MLVSS-h
OUR Test
4
5
6
7
8
9
10
0 1 2 3 4 5 6 7 8 9 10
Minutes
D.O
. (m
g/l)
N
OUR Test
2
3
4
5
6
7
8
9
10
0 1 2 3 4 5 6 7 8 9 10
Minutes
D.O
. (m
g/l)
S
Table 12. Clymer bench sheet

Clymer Borough Municipal Authority Wastewater Plant Performance Evaluation
Department of Environmental Protection I-1 Bureau of Water Standards and Facility Regulation
Attachment I—Graphs: Monthly Monitoring Examples
Dissolved Oxygen, S. Aeration
0.0
1.0
2.0
3.0
4.0
5.0
6.0
7.0
8.0
9.0
10.0
5/1
5/2
5/3
5/4
5/5
5/6
5/7
5/8
5/9
5/10
5/11
5/12
5/13
5/14
5/15
5/16
5/17
5/18
5/19
5/20
5/21
5/22
5/23
5/24
5/25
5/26
5/27
5/28
5/29
5/30
5/31
date --->
DO
, mg/
L
Diss. O2 Unit 1 Min Rec DO Max Rec DO Figure 36. DO values during the month of May 2010
Ammonia-nitrogen, S. Aeration
0.0
5.0
10.0
15.0
20.0
25.0
30.0
35.0
5/1
5/2
5/3
5/4
5/5
5/6
5/7
5/8
5/9
5/10
5/11
5/12
5/13
5/14
5/15
5/16
5/17
5/18
5/19
5/20
5/21
5/22
5/23
5/24
5/25
5/26
5/27
5/28
5/29
5/30
5/31
date --->
NH
4-N
, mg/
L
Figure 37. Ammonia Nitrogen values during the month of May 2010

Clymer Borough Municipal Authority Wastewater Plant Performance Evaluation
Department of Environmental Protection J-1 Bureau of Water Standards and Facility Regulation
Attachment J—Graphs: Daily Monitoring Examples Daily Dissolved O2 Histogram
0.0
0.5
1.0
1.5
2.0
2.5
3.0
3.5
4.0
4.5
0:00
1:00
2:00
3:00
4:00
5:00
6:00
7:00
8:00
9:00
10:0
0
11:0
0
12:0
0
13:0
0
14:0
0
15:0
0
16:0
0
17:0
0
18:0
0
19:0
0
20:0
0
21:0
0
22:0
0
23:0
0
Time
mg/
L
Diss. O2, South Aerator DO min pref DO max pref Figure 38. DO values, May 6, 2010
ORP
0
50
100
150
200
250
300
350
0:00
0:45
1:30
2:15
3:00
3:45
4:30
5:15
6:00
6:45
7:30
8:15
9:00
9:45
10:30
11:15
12:00
12:45
13:30
14:15
15:00
15:45
16:30
17:15
18:00
18:45
19:30
20:15
21:00
21:45
22:30
23:15
Figure 39. ORP values, May 6, 2010

Clymer Borough Municipal Authority Wastewater Plant Performance Evaluation
Department of Environmental Protection J-2 Bureau of Water Standards and Facility Regulation
Nitrate
0.0
5.0
10.0
15.0
20.0
25.0
30.0
35.0
0:001:00
2:003:00
4:005:00
6:007:00
8:009:00
10:0011:00
12:0013:00
14:0015:00
16:0017:00
18:0019:00
20:0021:00
22:0023:00
Figure 40. Nitrate values, May 6, 2010
Ammonia-N
0.0
0.5
1.0
1.5
2.0
2.5
0:00
0:45
1:30
2:15
3:00
3:45
4:30
5:15
6:00
6:45
7:30
8:15
9:00
9:45
10:30
11:15
12:00
12:45
13:30
14:15
15:00
15:45
16:30
17:15
18:00
18:45
19:30
20:15
21:00
21:45
22:30
23:15
Time
mg/
L
Figure 41. Ammonia Nitrogen values, May 6, 2010

Clymer Borough Municipal Authority Wastewater Plant Performance Evaluation
Department of Environmental Protection K-1 Bureau of Water Standards and Facility Regulation
Attachment K—WPPE Photographs Clymer Borough Municipal Authority STP
Figure 42. DO, ORP, and pH probes installed in south aeration tank
Figure 43. Nitrate and NH4D probes installed in south aeration tank

Clymer Borough Municipal Authority Wastewater Plant Performance Evaluation
Department of Environmental Protection K-2 Bureau of Water Standards and Facility Regulation
Figure 44. Solids drying bed number 2
Figure 45. Laboratory testing area

Clymer Borough Municipal Authority Wastewater Plant Performance Evaluation
Department of Environmental Protection K-3 Bureau of Water Standards and Facility Regulation
Figure 46. Computer setup area
Figure 47. Effluent metering pit just prior to stream discharge
![[Type the document title] - London Borough of Sutton STP...Six local authorities: Croydon, Kingston, Merton, Richmond, Sutton and Wandsworth. NHS England in their role as commissioners](https://static.fdocuments.in/doc/165x107/5f979ac6db8dc42b2679a772/type-the-document-title-london-borough-of-sutton-stp-six-local-authorities.jpg)