Clustering: Tackling Challenges with Data Recovery Approach B. Mirkin School of Computer Science...
60
Clustering: Tackling Challenges with Data Recovery Approach B. Mirkin School of Computer Science Birkbeck University of London Advert of a Special Issue: The Computer Journal, Profiling Expertise and Behaviour: Deadline 15 Nov. 2006. To submit, http:// www.dcs.bbk.ac.uk/~mark/cfp_cj_prof
-
Upload
dorcas-lamb -
Category
Documents
-
view
214 -
download
0
Transcript of Clustering: Tackling Challenges with Data Recovery Approach B. Mirkin School of Computer Science...

Clustering: Tackling Challenges with Data Recovery ApproachB. MirkinSchool of Computer ScienceBirkbeck University of London
Advert of a Special Issue: The Computer Journal, Profiling Expertise and Behaviour: Deadline 15 Nov. 2006. To submit, http:// www.dcs.bbk.ac.uk/~mark/cfp_cj_profiling.txt

WHAT IS CLUSTERING; WHAT IS DATAK-MEANS CLUSTERING: Conventional K-Means; Initialization of K-Means; Intelligent K-Means; Mixed Data; Interpretation AidsWARD HIERARCHICAL CLUSTERING: Agglomeration; Divisive Clustering with Ward Criterion; Extensions of Ward ClusteringDATA RECOVERY MODELS: Statistics Modelling as Data Recovery;
Data Recovery Model for K-Means; for Ward; Extensions to Other Data Types; One-by-One ClusteringDIFFERENT CLUSTERING APPROACHES: Extensions of K-Means; Graph-Theoretic Approaches; Conceptual Description of ClustersGENERAL ISSUES: Feature Selection and Extraction; Similarity on Subsets and Partitions; Validity and Reliability

What is clustering?
Finding homogeneous fragments, mostly sets of entities, in data for further analysis
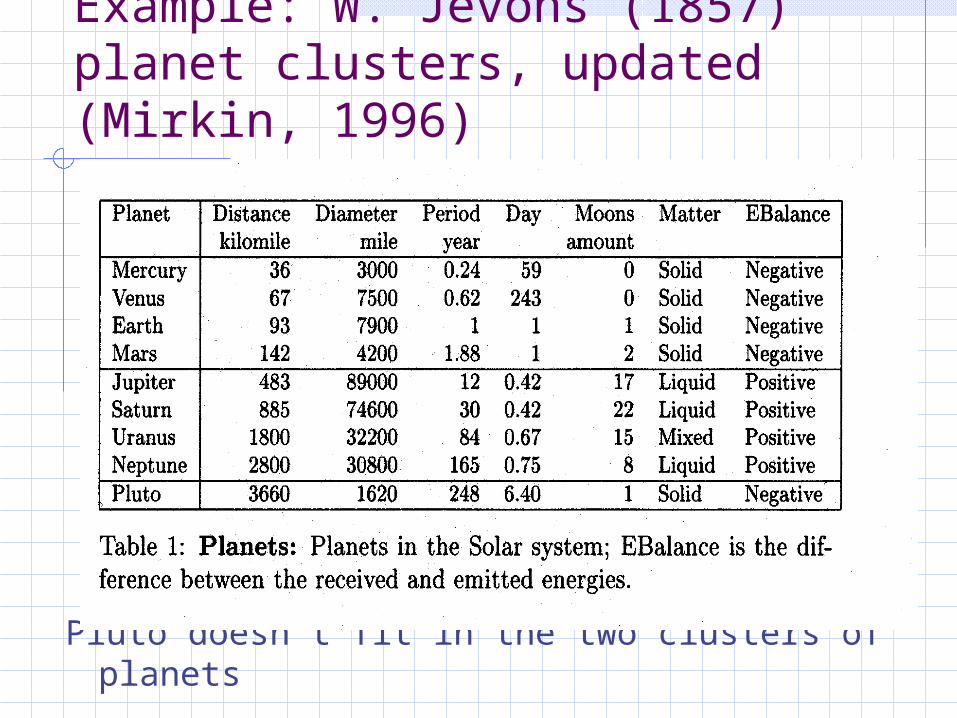
Example: W. Jevons (1857) planet clusters, updated (Mirkin, 1996)
Pluto doesn’t fit in the two clusters of planets

Example: A Few ClustersClustering interface to WEB search engines (Grouper):Query: Israel (after O. Zamir and O. Etzioni 2001)
Cluster # sites Interpretation1ViewRefine
24 Society, religion• Israel and Iudaism• Judaica collection
2ViewRefine
12 Middle East, War, History• The state of Israel• Arabs and Palestinians
3ViewRefine
31 Economy, Travel• Israel Hotel Association• Electronics in Israel
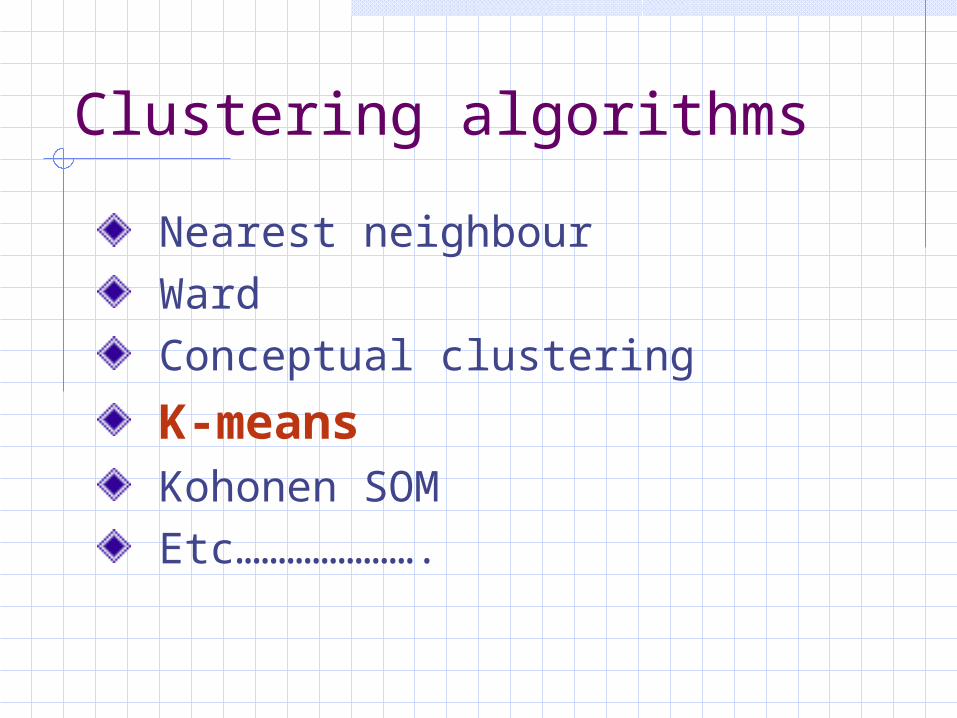
Clustering algorithms
Nearest neighbour Ward Conceptual clustering
K-means Kohonen SOM Etc………………….

K-Means: a generic clustering method
Entities are presented as multidimensional points (*) 0. Put K hypothetical centroids (seeds) 1. Assign points to the centroids according to minimum distance rule 2. Put centroids in gravity centres of thus obtained clusters 3. Iterate 1. and 2. until convergence
K= 3 hypothetical centroids (@)
* *
* * * * * * * * @ @
@** * * *

K-Means: a generic clustering method
Entities are presented as multidimensional points (*) 0. Put K hypothetical centroids
(seeds) 1. Assign points to the centroids according to Minimum distance rule 2. Put centroids in gravity centres of thus obtained clusters 3. Iterate 1. and 2. until convergence
* *
* * * * * * * * @ @
@** * * *

K-Means: a generic clustering method
Entities are presented as multidimensional points (*) 0. Put K hypothetical centroids (seeds) 1. Assign points to the centroids according to Minimum distance rule 2. Put centroids in gravity centres of thus obtained clusters 3. Iterate 1. and 2. until convergence
* *
* * * * * * * * @ @
@** * * *

K-Means: a generic clustering method
Entities are presented as multidimensional points (*) 0. Put K hypothetical centroids (seeds) 1. Assign points to the centroids according to Minimum distance rule 2. Put centroids in gravity centres of thus obtained clusters 3. Iterate 1. and 2. until convergence 4. Output final centroids and clusters
* * @ * * * @ * * * *
** * * *
@
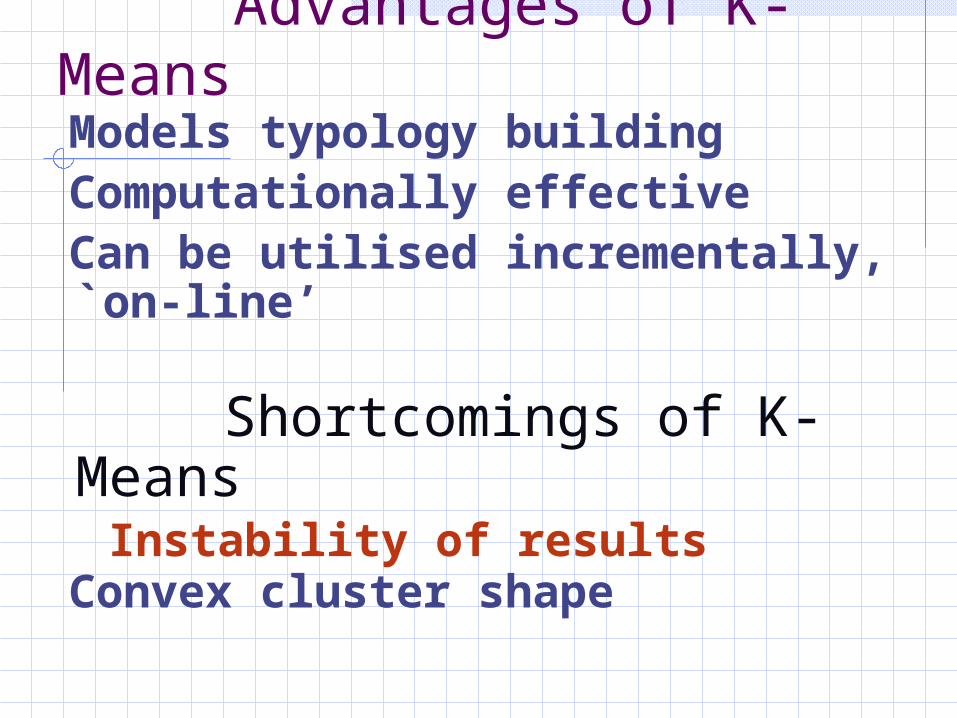
Advantages of K-Means Models typology building Computationally effective Can be utilised incrementally, `on-line’
Shortcomings of K-Means Instability of results Convex cluster shape

Initial Centroids: Correct
Two cluster case
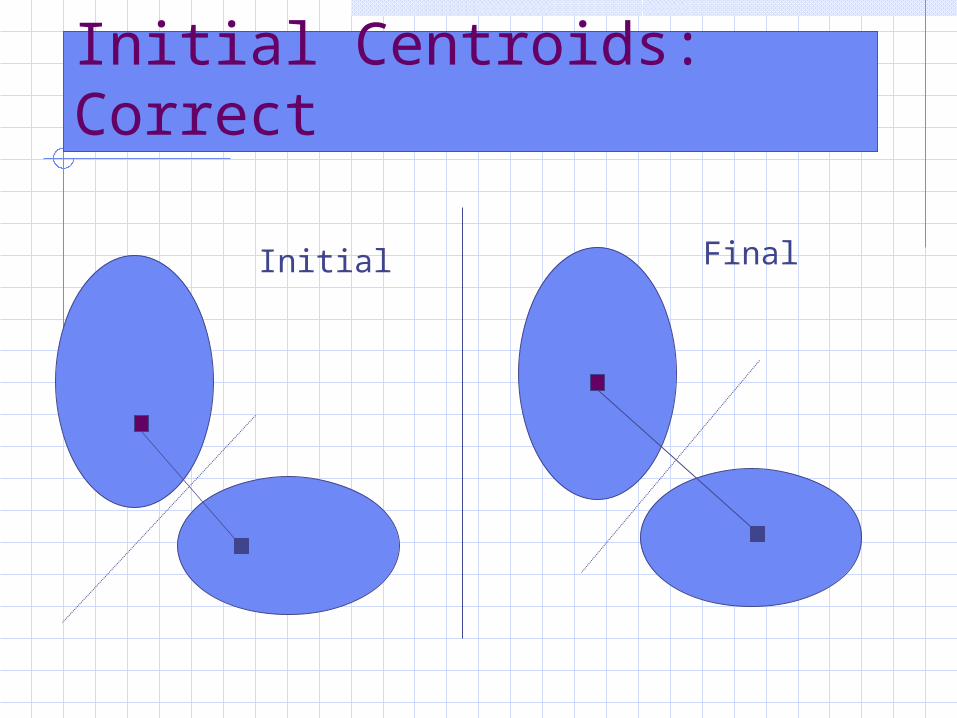
Initial Centroids: Correct
Initial Final

Different Initial Centroids

Different Initial Centroids: Wrong
Initial Final

Clustering issues:
K-Means gives no advice on:* Number of clusters* Initial setting* Data normalisation* Mixed variable scales* Multiple data sets
K-Means gives limited advice on: * Interpretation of
results
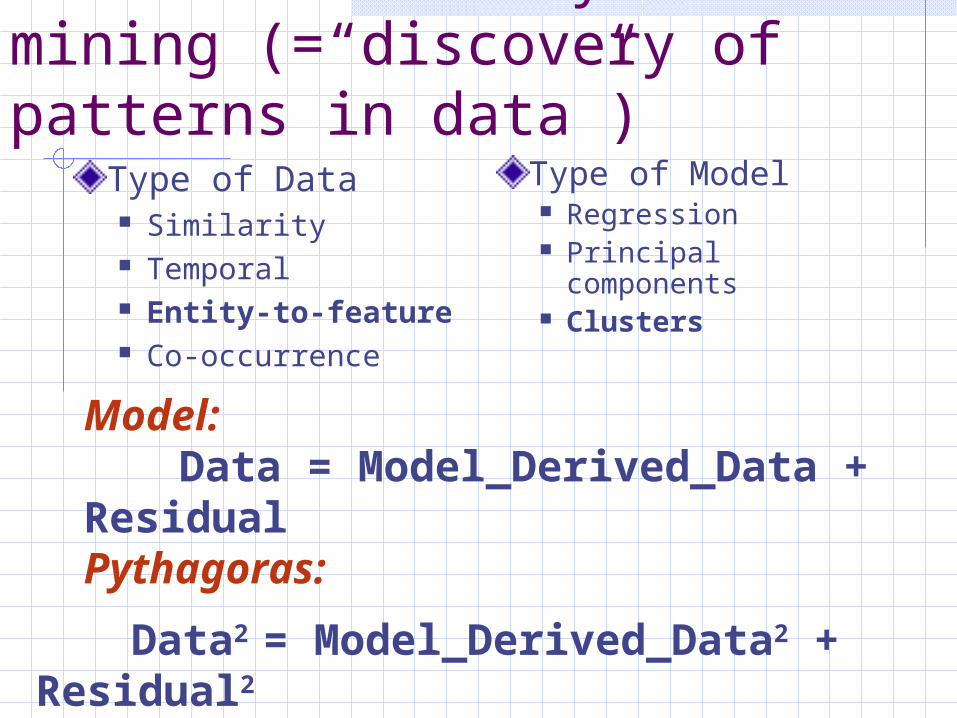
Data recovery for data mining (=“discovery of patterns in data”)
Type of Data Similarity Temporal Entity-to-feature Co-occurrence
Type of Model Regression Principal
components Clusters
Model:Data = Model_Derived_Data + Residual
Pythagoras:
Data2 = Model_Derived_Data2 + Residual2
The better fit, the better the model

Pythagorean decomposition in Data recovery approach, provides for:
Data scatter – a unique data characteristic (A perspective at data normalisation)Additive contributions of entities or features to clusters (A perspective for interpretation)Feature contributions are correlation/association measures affected by scaling (Mixed scale data treatable)Clusters can be extracted one-by-one (Data mining perspective, incomplete clustering, number of clusters) Multiple data can be approximated as well as single sourced ones (not talked of today)

Example: Mixed scale data table
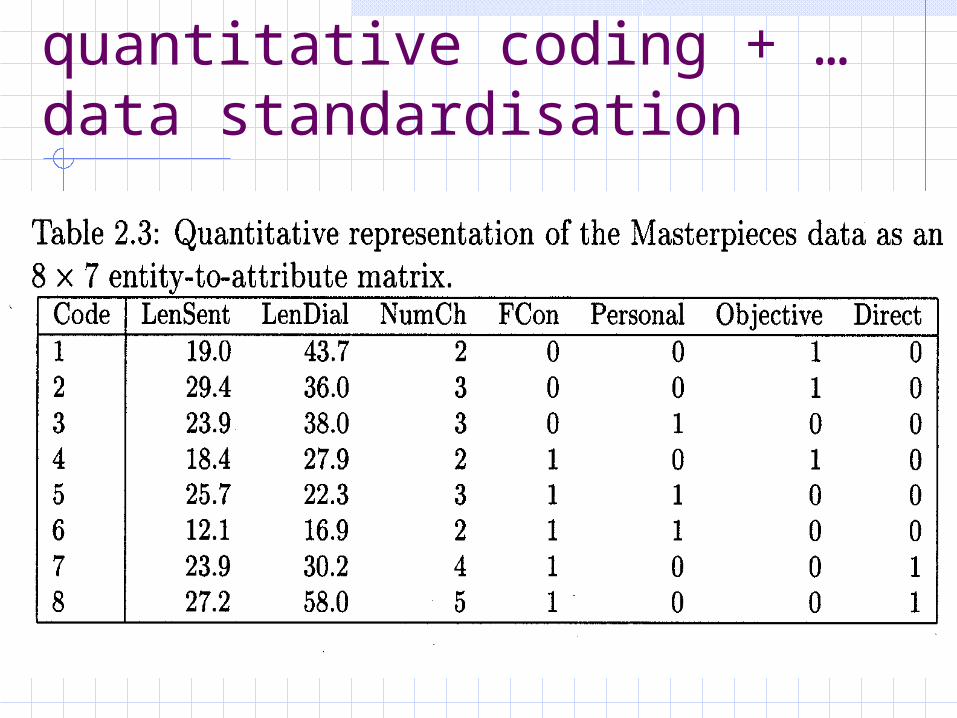
Conventional quantitative coding + … data standardisation

Standardisation of features
Yik = (Xik –Ak)/Bk
X - original data Y – standardised data i – entities k – features Ak – shift of the origin, typically, the average Bk – rescaling factor, traditionally the
standard deviation, but range may be better in clustering

No standardisation
Tom Sawyer
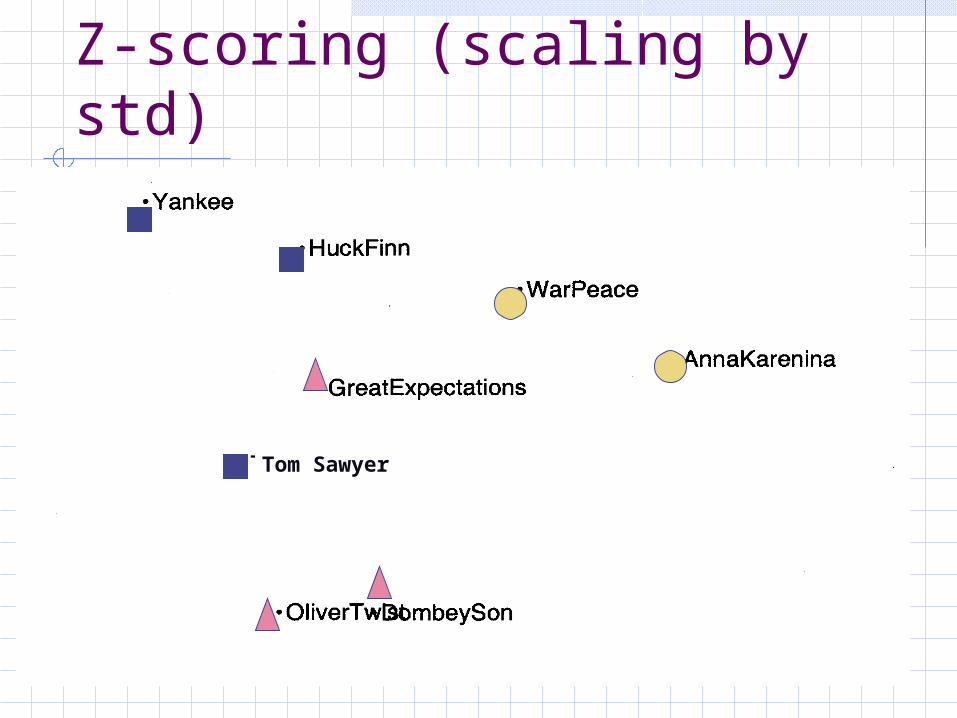
Z-scoring (scaling by std)
Tom Sawyer

Standardising by range & weight
Tom Sawyer

K-Means as a data recovery method

Representing a partitionCluster k:
Centroid
ckv (v - feature)
Binary 1/0 membership
zik (i - entity)

Basic equations (analogous to PCA, with score vectors zk constrained to be binary)
y – data entry, z – membership, not score
c - cluster centroid, N – cardinality
i - entity, v - feature /category, k - cluster
K
k Si
V
vkviv
V
vk
K
kkv
N
i
V
viv
k
cyNcy1 1
2
1 1
2
1 1
2 )(
,1
ivikz
kvc
K
kivy

Meaning of Data scatter
The sum of contributions of features – the basis for feature pre-processing (dividing by range rather than std) Proportional to the summary variance
V
v
N
iiv
N
i
V
viv yyD
1 1
2
1 1
22

Contribution of a feature F to a partition
Proportional to correlation ratio 2 if F is quantitative a contingency coefficient between cluster
partition and F, if F is nominal:Pearson chi-square (Poisson normalised)
Goodman-Kruskal tau-b (Range normalised)
Fv
k
K
kkvNc
1
2Contrib(F) =

Contribution of a quantitative feature to a partition
Proportional to correlation ratio 2 if F is quantitative
2
1
222 /)(
K
kkkpNN

Contribution of a nominal feature to a partition
Proportional to a contingency coefficient Pearson chi-square (Poisson normalised)
Goodman-Kruskal tau-b (Range normalised)
Bj=1
22
1
/)()( ji
K
kjiij BppppNFContr
jj pB

Pythagorean Decomposition of data scatter for interpretation

Contribution based description of clusters
C. Dickens: FCon = 0
M. Twain: LenD < 28
L. Tolstoy: NumCh > 3 or
Direct = 1

PCA based Anomalous Pattern Clustering
yiv =cv zi + eiv,
where zi = 1 if iS, zi = 0 if iS
With Euclidean distance squared
Si
V
vSviv
V
vSSv
N
i
V
viv cyNcy
1
2
1
2
1 1
2 )(
Si
SSS
N
i
cidNcdid ),()0,()0,(1
cS must be anomalous, that is, interesting

Initial setting with Anomalous Pattern Cluster
Tom Sawyer

Anomalous Pattern Clusters: Iterate
0
Tom Sawyer
12
3
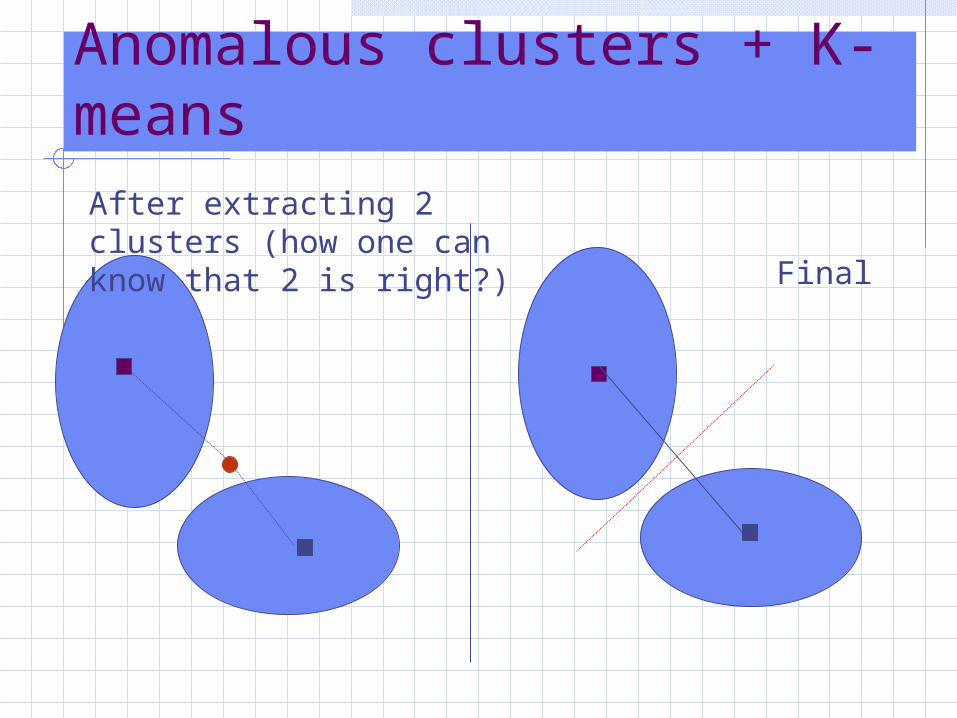
iK-Means:Anomalous clusters + K-meansAfter extracting 2 clusters (how one can know that 2 is right?)
Final

Example of iK-Means: Media Mirrored Russian Corruption (55 cases) with M. Levin and E. Bakaleinik
Features:Corrupt office (1)Client (1)Rendered service (6)Mechanism of corruption (2)Environment (1)

A schema for Bribery
Client
OfficeInteraction
Service
Environment

Data standardisation
Categories as one/zero variablesSubtracting the averageAll features: Normalising by rangeCategories, sometimes by the number of them

iK-Means:Initial Setting with Iterative Anomalous Pattern Clustering
13 clusters found with AC, of which 8 do not fit (4 singletons, 4 doublets) 5 clusters remain, to get initial seeds from Cluster elements are taken as seeds

Interpretation II: Patterning(Interpretation I: Representatives Interpretation III: Conceptual description)
Patterns in centroid values of salient features
Salience of feature v at cluster k :
~ (grand
mean - within-cluster mean)2

InterpretationII III
Cluster 1 (7 cases): Other branch (877%) Improper categorisation
(439%) Level of client (242%)
Cluster 2 (19 cases): Obstruction of justice
(467%) Law enforcement (379%) Occasional (251%)
Branch = Other
Branch = Law Enforc.&Service: No Cover-Up&Client Level Organisation

InterpretationII (pattern) III (appcod)
Cluster 3 (10 cases): Extortion (474%) Organisation(289
%) Government
(275%)
0 <= Extort - Obstruct <= 1 & 2 <= Extort + Bribe <=3 & No Inspection & No Protection
NO ERRORS

Overall Description: It is Branch that matters
Government Extortion for free services (Cluster 3) Protection (Cluster 4)
Law enforcement Obstruction of justice (Cluster 2) Cover-up (Cluster 5)
Other Category change (Cluster 1)
Is this knowledge enhancement?
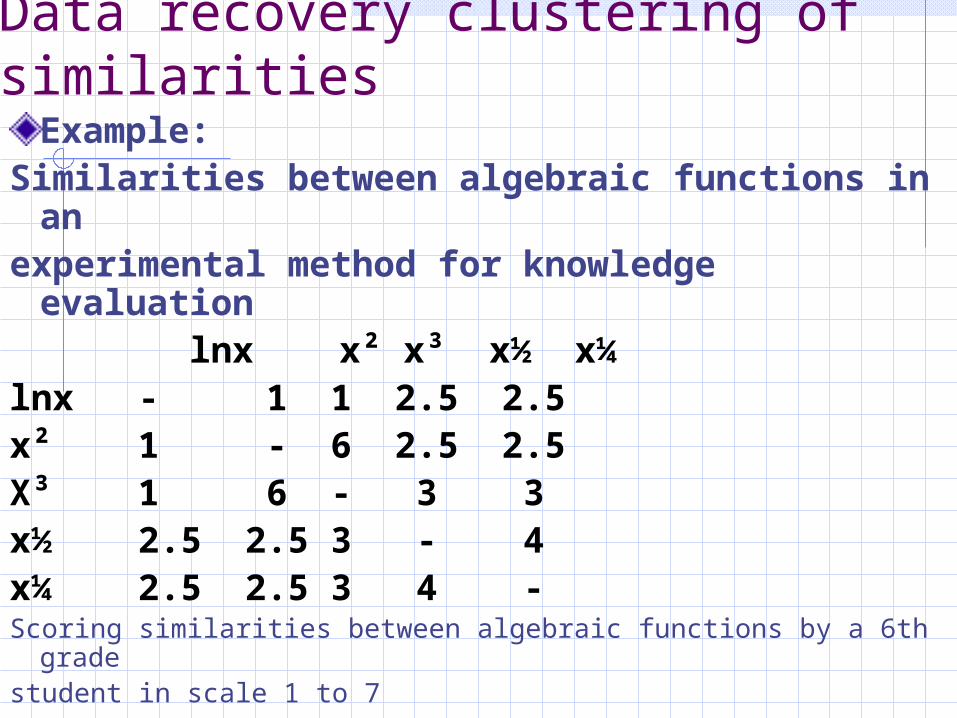
Data recovery clustering of similarities
Example:Similarities between algebraic functions in anexperimental method for knowledge evaluation
lnx x² x³ x½ x¼ lnx - 1 1 2.5 2.5x² 1 - 6 2.5 2.5X³ 1 6 - 3 3x½ 2.5 2.5 3 - 4x¼ 2.5 2.5 3 4 -Scoring similarities between algebraic functions by a 6th
gradestudent in scale 1 to 7

Additive clustering Similarities are the sum of intensities of clusters
Cl. 0: “All are funcrtions”, {lnx, x², x³, x½, x¼} Intensity 1 (upper sub-matrix)
lnx x² x³ x½ x¼ lnx - 1 1 1 1
x² 1 - 1 1 1
X³ 1 6 - 1 1
x½ 2.5 2.5 3 - 1
x¼ 2.5 2.5 3 4 -Scoring similarities between algebraic functions by a 6th gradestudent in scale 1 to 7 (lower sub-matrix)

Additive clustering Similarities are the sum of intensities of clustersCl. 1: “Power functions”, {x², x³, x½, x¼} Intensity 2 (upper sub-matrix)
lnx x² x³ x½ x¼ lnx - 0 0 0 0x² 1 - 2 2 2X³ 1 6 - 2 2x½ 2.5 2.5 3 - 2x¼ 2.5 2.5 3 4 -Scoring similarities between algebraic functions by a 6th
gradestudent in scale 1 to 7 (lower sub-matrix)

Additive clustering Similarities are the sum of intensities of clustersCl. 2: “Sub-linear functions”, {lnx, x½, x¼} Intensity 1 (upper sub-matrix)
lnx x² x³ x½ x¼ lnx - 0 0 1 1x² 1 - 0 0 0X³ 1 6 - 0 0x½ 2.5 2.5 3 - 1x¼ 2.5 2.5 3 4 -Scoring similarities between algebraic functions by a 6th
gradestudent in scale 1 to 7 (lower sub-matrix)

Additive clustering Similarities are the sum of intensities of clustersCl. 3: “Fast growing functions”, {x², x³} Intensity 3 (upper sub-matrix)
lnx x² x³ x½ x¼ lnx - 0 0 0 0x² 1 - 3 0 0X³ 1 6 - 0 0x½ 2.5 2.5 3 - 0x¼ 2.5 2.5 3 4 -Scoring similarities between algebraic functions by a 6th
gradestudent in scale 1 to 7 (lower sub-matrix)

Additive clustering Similarities are the sum of intensities of clustersResiduals – relatively small (upper sub-matrix)
lnx x² x³ x½ x¼ lnx - 0 0 .5 .5x² 1 - 0 -.5 -.5X³ 1 6 - 0 0x½ 2.5 2.5 3 - 0x¼ 2.5 2.5 3 4 -Scoring similarities between algebraic functions by a 6th
gradestudent in scale 1 to 7 (lower sub-matrix)

Data recovery Additive clustering
Observed similarity matrix B = Ag + A1 +A2 +A3 + EProblem: given B, find As to
minimize E, the differences between B and summary A
B – (Ag + A1 +A2 +A3) min A
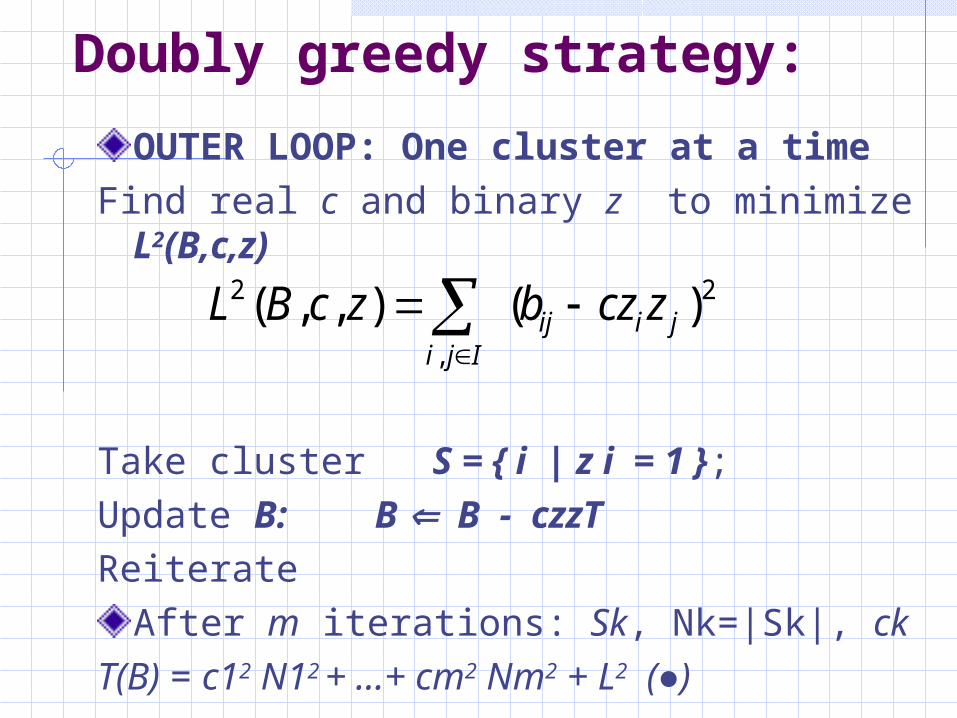
Doubly greedy strategy:
OUTER LOOP: One cluster at a time Find real c and binary z to minimize
L2(B,c,z)
Take cluster S = { i | z i = 1 }; Update B: B B - czzTReiterate
After m iterations: Sk, Nk=|Sk|, ckT(B) = c12 N12 + …+ cm2 Nm2 + L2 (●)
2
,
2 )(),,( jiijIji
zczbzcBL

Inner loop: finding a clusterMaximize: Contribution to (●), Max (cNS)2
N.Property: Average similarity b(i,S) of i to
S > c/2 if i S and < c/2 if i S Algorithm ADDI-S:
Take S={ i } for arbitrary i;Given S, find c=c(S) and b(i,S) for all i ;If b(i,S)-c/2. is >0 for i S or < 0 for i S
change the state of i. Else, stop and output S.Resulting S satisfies the property.
Holzinger (1941) B-coefficient, Arkadiev&Braverman (1964,
1967) Specter, Mirkin (1976, 1987) ADDI-…, Ben-Dor, Shamir,
Yakhini (1999) CAST

DRA on Mixed variable scales and normalisation
Feature Normalisation: any measure, clear of the distribution; e. g., range
Nominal scale:Binary categories normalised to get the total feature contribution right; e.g. by the square root of the number of categories

DRA on Interpretation
Cluster centroids are supplemented with contributions of feature/cluster pairs or entity/cluster pairsK-Means: What is Representative?
Distance Min:(conventional)
Inner product Max:(data recovery)
22 ),( kSkik
cidL
kSkik
ciB ,2

DRA on Incomplete clusteringWith the model assigning un-clustered
entities to the “norm” (e.g., gravity centre), Anomalous Pattern clustering (iterated)
DRA on Number of clustersiK-Means(under the assumption that every
cluster, insequence, contributes more than the
next one[a planetary model])
Otherwise, the issue is rather bleak
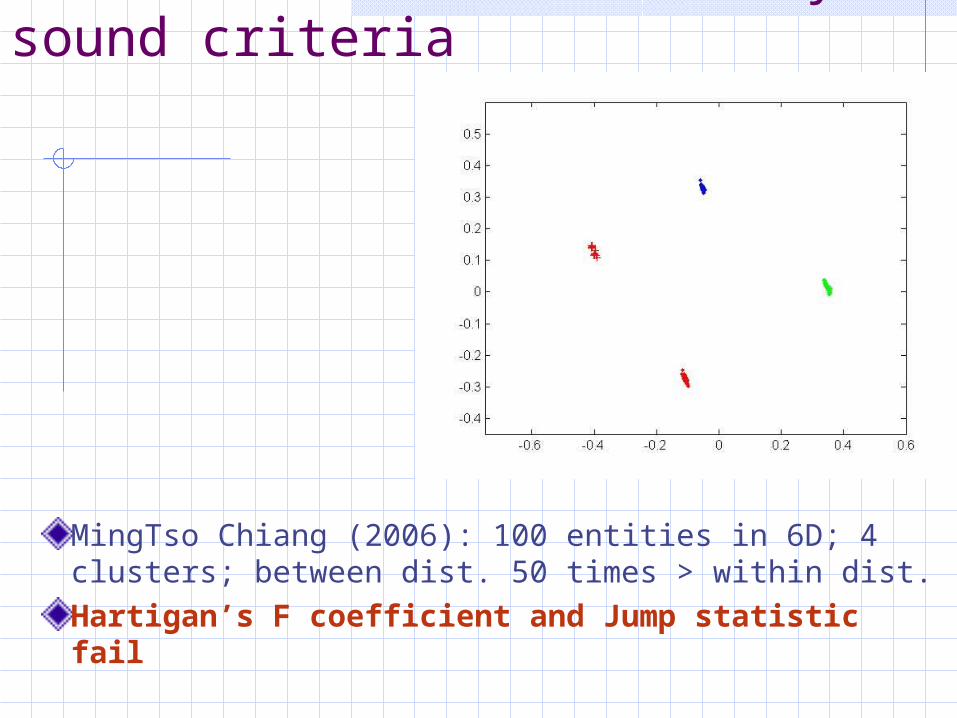
Failure of statistically sound criteria
MingTso Chiang (2006): 100 entities in 6D; 4 clusters; between dist. 50 times > within dist. Hartigan’s F coefficient and Jump statistic fail

Conclusion
Data recovery approach should be the major mathematical underpinning
for data mining as a framework for finding patterns in data