Clustering Short Text using a Centroid-Based Lexical ... · relational clustering algorithm. This...
14
Abstract—Traditional lexical clustering methods process text as a bag of words, with similarity between two text-fragments measured on the basis of word co-occurrence. While this approach is suitable for clustering large fragments of text (e.g., documents), it performs poorly when clustering smaller text fragments such as sentences (e.g., short text or quotes). This is because two sentences may be semantically similar while containing no common words. This paper proposes a new variant of the standard k-means algorithm for short text clustering that is based on the notion of synonym expansion semantic vectors. These vectors represent short text using semantic information derived from a lexical database constructed to identify the correct meaning to a word, based on the context in which it appears. Thus, whereas conventional k- means algorithm application is based on measuring the distance between patterns, the proposed approach is based on measuring semantic similarity between patterns (e, g., sentences). This enables it to utilise a higher degree of semantic information available within the clustered sentences. Empirical results show that the proposed variant method performs favorably against other clustering technique on two specially constructed datasets of famous quotations, benchmark datasets in several other domains, and that its incorporation as a short text similarity using synonym expansion leads to a significant improvement in the centroid-based clustering performance. Therefore, it is potential use in a variety of knowledge discovery processing tasks including text summarisation and text mining. Index Terms—WordNet, semantic similarity measure, short text clustering, and word sense identification I. INTRODUCTION LTHOUGH text clustering at the long-text level (e.g., document) is well-established in the natural language processing (NLP) and knowledge discovery literature, clustering at the short-text level (e.g., quotes or sentences) is challenged by the fact that word co-occurrence—possible frequent occurrence of words from text corpus—, on which most text similarity measures are based, may be rare or even absent between two semantically related text fragments. To overcome this issue, several short text similarity measures have recently been proposed [1]- [13], [39]. The methods proposed by Li et al. (2006) [1], Mihalcea et al. (2006) [2] and Wang et al. (2008) [14] have two important features in common. Firstly, rather than Manuscript received October 5, 2017. Khaled Abdalgader is with the Faculty of Computing and Information Technology, Sohar University, Sohar, Oman (corresponding author to provide phone: +968 2672010; fax: +968 26720102; e-mail: komar@ soharuni.edu.om). representing sentences in a vector space model [15] using the full set of features from some corpora, only the words appearing in the two sentences are used, thus overcoming the problem of data sparseness (i.e., high dimensionally) arising from a full bag of words representation. Secondly, they use semantic information derived from external sources to overcome the problem of lack of word co-occurrence. Short text similarity measures such as described in Abdalgader & Skabar (2011) [10] (the latter of which we use in this paper, and described later in Section II), depend in some way on a measure of semantic similarity between words. Unlike existing measures, which use the set of exact words that appear in the sentences, this method constructs an expansion word set for each sentence using synonyms of the sense-disambiguated words in that sentence. This way leads to provide a richer semantic context to measure sentence similarity through better utilising the semantic information available from lexical resources such as WordNet [16], [52]. For each of the sentences being compared, a word sense disambiguation step is first applied in order to identify the sense in which words are being used within the sentence [17]. A synonym expansion step is then applied, resulting in a richer semantic context from which to estimate semantic vectors. The similarity between semantic vectors can then be calculated using a standard vector space similarity measure such as cosine similarity. Clustering of smaller text fragments plays a significant role in many natural language processing activities (i.e. knowledge discovery). These include, for example, documents summarisation where it is help to avoid problems of content overlap, which leading to better coverage [18]- [21], [57], and text mining where the main objective might be to find out a new knowledge from a collection of texts initially retrieved in response to some query [22], [23]. By clustering the smaller text fragments such as quotes or sentences, we would naturally expect at least one of the clusters to be semantically related to the concepts described by the query terms; however, the remaining clusters still interesting in which may contain knowledge relating to the query in some way hitherto unknown to us, and in such a case we would have successfully retrieved a novel knowledge. Various clustering algorithms have been proposed in recent years [14], [24]- [32], [53]- [55] and many of them do take as input only a matrix of pairwise similarities. The simplest of these is the k-medoids algorithm [25], [26], which is a variant of k-means in which centroids are restricted to being data points. However, a problem with the k-medoid algorithm is that it is very sensitive to the initial (random) selection of centroids, and in practice it is often necessary to run the algorithm several times with different initializations. Clustering Short Text using a Centroid-Based Lexical Clustering Algorithm Khaled Abdalgader, Member, IAENG A IAENG International Journal of Computer Science, 44:4, IJCS_44_4_12 (Advance online publication: 20 November 2017) ______________________________________________________________________________________
Transcript of Clustering Short Text using a Centroid-Based Lexical ... · relational clustering algorithm. This...
Abstract—Traditional lexical clustering methods process text
as a bag of words, with similarity between two text-fragments
measured on the basis of word co-occurrence. While this
approach is suitable for clustering large fragments of text (e.g.,
documents), it performs poorly when clustering smaller text
fragments such as sentences (e.g., short text or quotes). This is
because two sentences may be semantically similar while
containing no common words. This paper proposes a new
variant of the standard k-means algorithm for short text
clustering that is based on the notion of synonym expansion
semantic vectors. These vectors represent short text using
semantic information derived from a lexical database
constructed to identify the correct meaning to a word, based on
the context in which it appears. Thus, whereas conventional k-
means algorithm application is based on measuring the
distance between patterns, the proposed approach is based on
measuring semantic similarity between patterns (e, g.,
sentences). This enables it to utilise a higher degree of semantic
information available within the clustered sentences. Empirical
results show that the proposed variant method performs
favorably against other clustering technique on two specially
constructed datasets of famous quotations, benchmark datasets
in several other domains, and that its incorporation as a short
text similarity using synonym expansion leads to a significant
improvement in the centroid-based clustering performance.
Therefore, it is potential use in a variety of knowledge
discovery processing tasks including text summarisation and
text mining.
Index Terms—WordNet, semantic similarity measure, short
text clustering, and word sense identification
I. INTRODUCTION
LTHOUGH text clustering at the long-text level (e.g.,
document) is well-established in the natural language
processing (NLP) and knowledge discovery literature,
clustering at the short-text level (e.g., quotes or sentences) is
challenged by the fact that word co-occurrence—possible
frequent occurrence of words from text corpus—, on which
most text similarity measures are based, may be rare or even
absent between two semantically related text fragments. To
overcome this issue, several short text similarity measures
have recently been proposed [1]- [13], [39].
The methods proposed by Li et al. (2006) [1], Mihalcea et
al. (2006) [2] and Wang et al. (2008) [14] have two
important features in common. Firstly, rather than
Manuscript received October 5, 2017.
Khaled Abdalgader is with the Faculty of Computing and Information
Technology, Sohar University, Sohar, Oman (corresponding author to
provide phone: +968 2672010; fax: +968 26720102; e-mail: komar@
soharuni.edu.om).
representing sentences in a vector space model [15] using
the full set of features from some corpora, only the words
appearing in the two sentences are used, thus overcoming
the problem of data sparseness (i.e., high dimensionally)
arising from a full bag of words representation. Secondly,
they use semantic information derived from external sources
to overcome the problem of lack of word co-occurrence.
Short text similarity measures such as described in
Abdalgader & Skabar (2011) [10] (the latter of which we
use in this paper, and described later in Section II), depend
in some way on a measure of semantic similarity between
words. Unlike existing measures, which use the set of exact
words that appear in the sentences, this method constructs
an expansion word set for each sentence using synonyms of
the sense-disambiguated words in that sentence. This way
leads to provide a richer semantic context to measure sentence
similarity through better utilising the semantic information
available from lexical resources such as WordNet [16], [52].
For each of the sentences being compared, a word sense
disambiguation step is first applied in order to identify the
sense in which words are being used within the sentence
[17]. A synonym expansion step is then applied, resulting in
a richer semantic context from which to estimate semantic
vectors. The similarity between semantic vectors can then
be calculated using a standard vector space similarity
measure such as cosine similarity.
Clustering of smaller text fragments plays a significant
role in many natural language processing activities (i.e.
knowledge discovery). These include, for example,
documents summarisation where it is help to avoid
problems of content overlap, which leading to better
coverage [18]- [21], [57], and text mining where the main
objective might be to find out a new knowledge from a
collection of texts initially retrieved in response to some
query [22], [23]. By clustering the smaller text fragments
such as quotes or sentences, we would naturally expect at
least one of the clusters to be semantically related to the
concepts described by the query terms; however, the
remaining clusters still interesting in which may contain
knowledge relating to the query in some way hitherto
unknown to us, and in such a case we would have
successfully retrieved a novel knowledge.
Various clustering algorithms have been proposed in
recent years [14], [24]- [32], [53]- [55] and many of them
do take as input only a matrix of pairwise similarities. The
simplest of these is the k-medoids algorithm [25], [26],
which is a variant of k-means in which centroids are
restricted to being data points. However, a problem with the
k-medoid algorithm is that it is very sensitive to the initial
(random) selection of centroids, and in practice it is often
necessary to run the algorithm several times with different
initializations.
Clustering Short Text using a Centroid-Based
Lexical Clustering Algorithm
Khaled Abdalgader, Member, IAENG
A
IAENG International Journal of Computer Science, 44:4, IJCS_44_4_12
(Advance online publication: 20 November 2017)
______________________________________________________________________________________
To overcome this problem with k-medoids, Frey & Dueck
(2007) [30] proposed Affinity Propagation, a graph-based
technique which simultaneously considers all data points as
exemplars (i.e., possible centroids). Treating each data point
as a node in a network or graph, affinity propagation
recursively transmits real-valued messages along the edges
of the graph until a good set of exemplars (and
corresponding clusters) emerges. These messages are then
updated using simple formulas that minimize an energy
function based on a probability model. Frey & Dueck
(2007) [30] have applied affinity propagation to the problem
of extracting descriptive summary from text.
Spectral clustering [14], [31], [32], [54] is another graph-
based clustering technique that based on matrix
decomposition techniques from the linear algebra theories.
Rather than clustering data points in the original vector
space, spectral clustering algorithms map data points onto
the space defined by the eigen-vectors associated with the
top eigen-values, and then perform clustering in this
transformed space, typically using a k-means algorithm. One
of the advantages of spectral clustering algorithms is that
they are able to identify non-convex clusters, which is not
possible when clustering in the original feature space (using
k-means). Since they are based on established linear algebra
techniques, the algorithms can be easily implemented in a
language such as MATLAB1 or NLTK2 under Python, and
since they require as input only a matrix containing pairwise
similarity measures or values (together with a specification
of the number of clusters to be used), it is straightforward to
apply spectral clustering to the short text clustering task.
The application of spectral clustering to short-level text
clustering was recently reported in [14], [24], and is, to our
knowledge, the first such application of spectral clustering
in this area. Note, however, that the short text representation
used by Wang et al. [14] is different to that which we have
described in Section II, and essentially is based on a vector
space model.
The idea of applying PageRank [33] as a centrality
measure has been used by both Erkan & Radev (2004) [34],
Mihalcea & Tarau (2004) [35] and Fang et al. (2017) [57] in
the context of document summarisation, in which the
objective is to rank text-fragments according to their
importance in the document or documents being
summarized (i.e., sentence scoring task). However, in each
of these cases PageRank is applied to only a single cluster;
that is, the entire collection of text-fragments being
summarized. Interestingly, Skabar & Abdalgader (2013)
[24] show how the use of PageRank as a centrality measure
can be extended to multiple clusters, and present a full fuzzy
relational clustering algorithm. This algorithm allows
sentences to belong to all clusters with different degrees of
semantic similarity. This is important in the case of text
summarisation and text mining, in which a text-fragment may
be semantically related to more than one theme or topic.
However, fuzzy clustering of short-text level is complicated
by the computational difficulties inherent in defining cluster
centroids using conventional cluster centrality measures.
The contribution of this paper is a new variant of the
standard k-means algorithm for short text clustering that is
based on the notion of synonym expansion semantic
1 http://www.mathworks.com/products/matlab
2 http://www.nltk.org
vectors. These vectors represent short text using semantic
information derived from a lexical database constructed to
identify the correct meaning to a word, based on the context
in which it appears. Thus, whereas conventional k-means
algorithm application is based on measuring the distance
between patterns (e, g., sentences), the proposed approach is
based on measuring semantic similarity between patterns.
This enables it to utilize a higher degree of semantic
information available within the clustered sentences. The
result is a centroid-based lexical clustering algorithm which
is generic in nature, and can be applied to any domain in
which the relationship between objects is expressed in terms
of pairwise semantic similarities. We apply the algorithm to
two datasets of famous quotations, benchmark datasets in
several other domains and compare its performance with
that of well-known clustering algorithms (i.e., Spectral
Clustering [31], Affinity Propagation [30], k-medoids [25],
[26], STC-LE [54] and k-means(TF-IDF) [55]). We argue
that the superior performance of our new variation of the
centroid-based lexical algorithm (variant of the standard k-
means algorithm) is due to its capacity to better utilise the
available semantic information available in used lexical
database. Therefore, it is potential use in a variety of
knowledge discovery processing tasks including text
summarisation (see Section IV.I) and text mining of more
general nature.
The remainder of the paper is structured as follows.
Section II describes a text representation scheme for
measuring short text similarity. Section III presents our new
variation of standard k-means clustering (centroid-based)
algorithm. Empirical results are presented in Section IV, and
Section V concludes the paper.
II. TEXT REPRESENTATION SCHEME FOR MEASURING
SHORT TEXT SIMILARITY
Activities typically performed in knowledge discovery
processing (e.g., text mining), as our activity focused,
include classifying a fragments of the text as belonging to
one or more pre-known classes or categories [36], and
clustering fragments of the text according to their degree of
semantic similarity [37], [20]. These activities are not
independent, for example, may involve sub-tasks involving
the measurement of semantic similarity between sentence
pairs [38], [39], [11]- [13].
One approach to text mining is to identify the main
themes or topics which characterise a text, and to then
extract useful information by appending, in a coherent
manner, a description or an abstraction of each of those
themes. Presumably, fragments of text that are similar to
each other are more likely to relate to the same theme than
fragments that are less similar. Thus, clustering, using both
an appropriate similarity measure and an appropriate text
representation scheme should provide a useful technique in
allowing us to identify those themes.
By far the most common text representation scheme that
has been used in the text processing activities is the vector
space model (VSM), in which a document (or some other
fragment of text) is represented as a point in a high-
dimensional (Ni) input space in which each dimension
corresponds to a unique word [15]. That is, a document dj is
represented as a vector xj = (w1j, w2j, w3j, ...), where wij is a
weight that represents in some way the importance of word
IAENG International Journal of Computer Science, 44:4, IJCS_44_4_12
(Advance online publication: 20 November 2017)
______________________________________________________________________________________
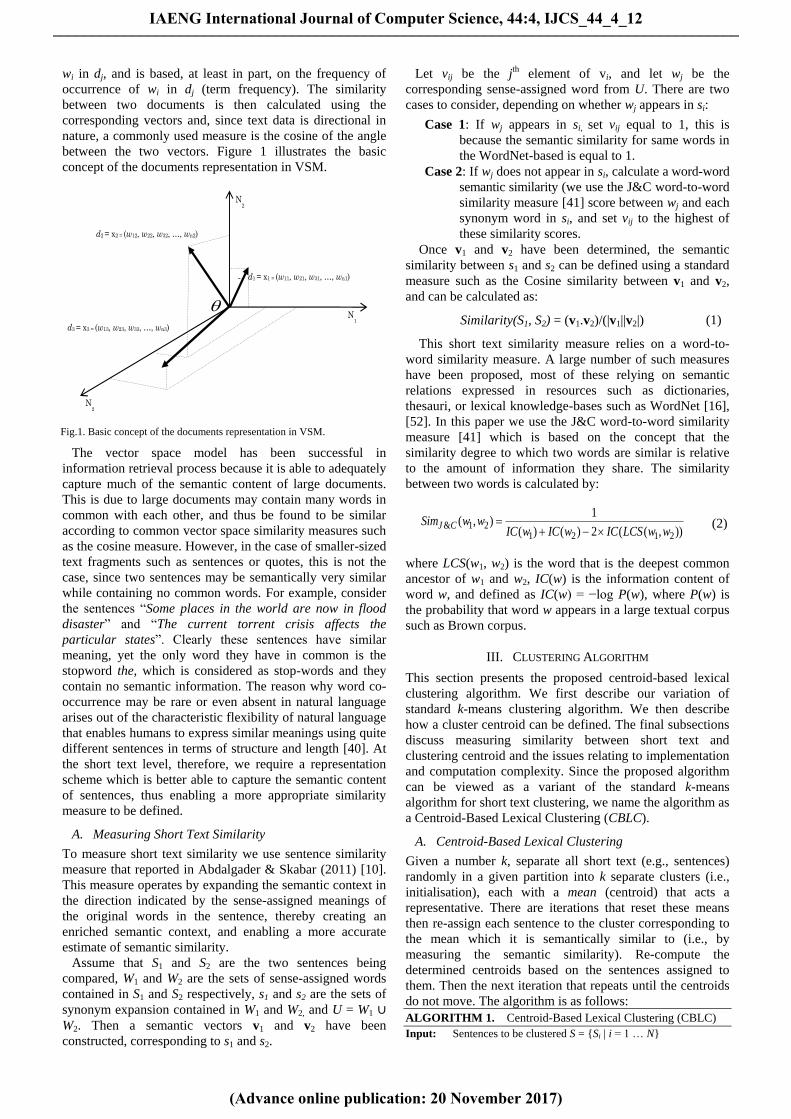
wi in dj, and is based, at least in part, on the frequency of
occurrence of wi in dj (term frequency). The similarity
between two documents is then calculated using the
corresponding vectors and, since text data is directional in
nature, a commonly used measure is the cosine of the angle
between the two vectors. Figure 1 illustrates the basic
concept of the documents representation in VSM.
The vector space model has been successful in
information retrieval process because it is able to adequately
capture much of the semantic content of large documents.
This is due to large documents may contain many words in
common with each other, and thus be found to be similar
according to common vector space similarity measures such
as the cosine measure. However, in the case of smaller-sized
text fragments such as sentences or quotes, this is not the
case, since two sentences may be semantically very similar
while containing no common words. For example, consider
the sentences “Some places in the world are now in flood
disaster” and “The current torrent crisis affects the
particular states”. Clearly these sentences have similar
meaning, yet the only word they have in common is the
stopword the, which is considered as stop-words and they
contain no semantic information. The reason why word co-
occurrence may be rare or even absent in natural language
arises out of the characteristic flexibility of natural language
that enables humans to express similar meanings using quite
different sentences in terms of structure and length [40]. At
the short text level, therefore, we require a representation
scheme which is better able to capture the semantic content
of sentences, thus enabling a more appropriate similarity
measure to be defined.
A. Measuring Short Text Similarity
To measure short text similarity we use sentence similarity
measure that reported in Abdalgader & Skabar (2011) [10].
This measure operates by expanding the semantic context in
the direction indicated by the sense-assigned meanings of
the original words in the sentence, thereby creating an
enriched semantic context, and enabling a more accurate
estimate of semantic similarity.
Assume that S1 and S2 are the two sentences being
compared, W1 and W2 are the sets of sense-assigned words
contained in S1 and S2 respectively, s1 and s2 are the sets of
synonym expansion contained in W1 and W2, and U = W1 ∪
W2. Then a semantic vectors v1 and v2 have been
constructed, corresponding to s1 and s2.
Let vij be the jth element of vi, and let wj be the
corresponding sense-assigned word from U. There are two
cases to consider, depending on whether wj appears in si:
Case 1: If wj appears in si, set vij equal to 1, this is
because the semantic similarity for same words in
the WordNet-based is equal to 1.
Case 2: If wj does not appear in si, calculate a word-word
semantic similarity (we use the J&C word-to-word
similarity measure [41] score between wj and each
synonym word in si, and set vij to the highest of
these similarity scores.
Once v1 and v2 have been determined, the semantic
similarity between s1 and s2 can be defined using a standard
measure such as the Cosine similarity between v1 and v2,
and can be calculated as:
Similarity(S1, S2) = (v1.v2)/(|v1||v2|) (1)
This short text similarity measure relies on a word-to-
word similarity measure. A large number of such measures
have been proposed, most of these relying on semantic
relations expressed in resources such as dictionaries,
thesauri, or lexical knowledge-bases such as WordNet [16],
[52]. In this paper we use the J&C word-to-word similarity
measure [41] which is based on the concept that the
similarity degree to which two words are similar is relative
to the amount of information they share. The similarity
between two words is calculated by:
& 1 21 2 1 2
1( , )
( ) ( ) 2 ( ( , ))J CSim w w
IC w IC w IC LCS w w
(2)
where LCS(w1, w2) is the word that is the deepest common
ancestor of w1 and w2, IC(w) is the information content of
word w, and defined as IC(w) = −log P(w), where P(w) is
the probability that word w appears in a large textual corpus
such as Brown corpus.
III. CLUSTERING ALGORITHM
This section presents the proposed centroid-based lexical
clustering algorithm. We first describe our variation of
standard k-means clustering algorithm. We then describe
how a cluster centroid can be defined. The final subsections
discuss measuring similarity between short text and
clustering centroid and the issues relating to implementation
and computation complexity. Since the proposed algorithm
can be viewed as a variant of the standard k-means
algorithm for short text clustering, we name the algorithm as
a Centroid-Based Lexical Clustering (CBLC).
A. Centroid-Based Lexical Clustering
Given a number k, separate all short text (e.g., sentences)
randomly in a given partition into k separate clusters (i.e.,
initialisation), each with a mean (centroid) that acts a
representative. There are iterations that reset these means
then re-assign each sentence to the cluster corresponding to
the mean which it is semantically similar to (i.e., by
measuring the semantic similarity). Re-compute the
determined centroids based on the sentences assigned to
them. Then the next iteration that repeats until the centroids
do not move. The algorithm is as follows:
ALGORITHM 1. Centroid-Based Lexical Clustering (CBLC)
Input: Sentences to be clustered S = {Si | i = 1 … N}
N2
q d1 = x1 = (w11, w21, w31, …, wn1)
N1
N2
d2 = x2 = (w12, w22, w32, …, wn2)
d3 = x3 = (w13, w23, w33, …, wn3)
Fig.1. Basic concept of the documents representation in VSM.
IAENG International Journal of Computer Science, 44:4, IJCS_44_4_12
(Advance online publication: 20 November 2017)
______________________________________________________________________________________
Number of clusters k
Output: Cluster membership values }..1,..1|{ kjNij
i where
j
i is the membership of sentences i to cluster j.
1. // Partition the sentences into k sets (clusters), randomly
(initialisation)
2. for i = 1 to N
3. if i k
4. j +=1
5. j
i = sentence(Si)
6. else
7. j=1
8. j
i = sentence(Si)
9. end
10. repeat until convergence (no further change in clusters)
11. // Find the mean (centroid) for each cluster
12. for j = 1 to k
13. Mj =union-set{all synonym words appearing in the cluster j}
14. end
15. // calculate the semantic similarity of each sentence (Si) to each of
the cluster centroid using the synonym expansion similarity
measure described in Section II.A
16. for j = 1 to k
17. similarity(Mj, Sm) // Sm is sentences belong to cluster j, {m=1..
n} where n is the number of sentences in cluster j.
18. end
19. //Re-assign each sentences to the cluster corresponding to the
cluster centroid to which it is closest (semantically similar to).
20. re-assign(Si, Mj)
21. End
We first describe how a cluster centroid may be
represented; we then describe how the similarity measure
between and each sentence and a cluster centroid may be
defined. The final subsection discusses various other
implementation issues.
B. Defining a Clustering Centroid
In the conventional vector space approach, in which a long-
text fragment (e.g., document) is represented as a vector of
real values (e.g., tf-idf scores), a cluster centroid can be
found by simply taking the vector average over all text
fragments belonging to that cluster. This is clearly not
possible using the representation scheme described in
Section II, since the semantic vector for a sentence is not
unique (i.e., short text), but relies on the context provided
by the sentence with which it is being compared. However,
just as a context may be defined by a pair of sentences, it is
straightforward to extend this idea to defining the context
over a larger collection of sentences. Since a cluster is just
such a collection, we can define the centroid of a cluster
simply as the union set of all synonyms of sense-assigned
words appearing in the sentences belonging to that cluster.
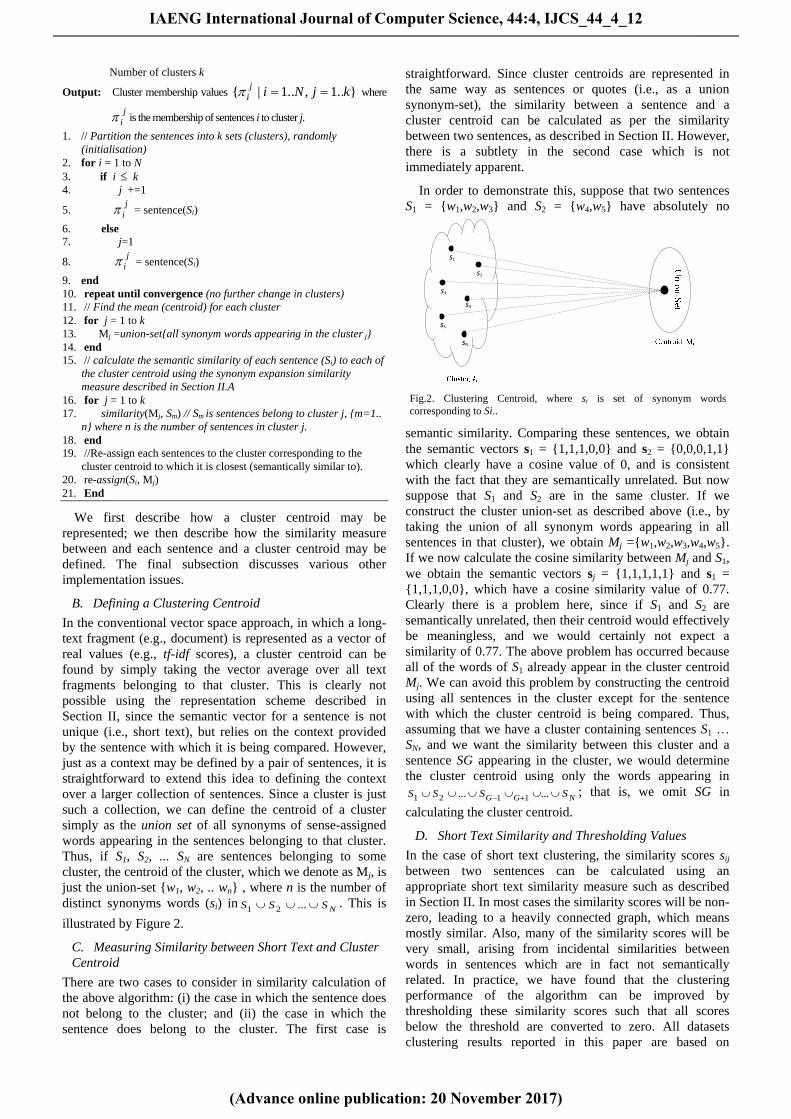
Thus, if S1, S2, ... SN are sentences belonging to some
cluster, the centroid of the cluster, which we denote as Mj, is
just the union-set {w1, w2, .. wn} , where n is the number of
distinct synonyms words (si) inNSSS ...21
. This is
illustrated by Figure 2.
C. Measuring Similarity between Short Text and Cluster
Centroid
There are two cases to consider in similarity calculation of
the above algorithm: (i) the case in which the sentence does
not belong to the cluster; and (ii) the case in which the
sentence does belong to the cluster. The first case is
straightforward. Since cluster centroids are represented in
the same way as sentences or quotes (i.e., as a union
synonym-set), the similarity between a sentence and a
cluster centroid can be calculated as per the similarity
between two sentences, as described in Section II. However,
there is a subtlety in the second case which is not
immediately apparent.
In order to demonstrate this, suppose that two sentences
S1 = {w1,w2,w3} and S2 = {w4,w5} have absolutely no
semantic similarity. Comparing these sentences, we obtain
the semantic vectors s1 = {1,1,1,0,0} and s2 = {0,0,0,1,1}
which clearly have a cosine value of 0, and is consistent
with the fact that they are semantically unrelated. But now
suppose that S1 and S2 are in the same cluster. If we
construct the cluster union-set as described above (i.e., by
taking the union of all synonym words appearing in all
sentences in that cluster), we obtain Mj ={w1,w2,w3,w4,w5}.
If we now calculate the cosine similarity between Mj and S1,
we obtain the semantic vectors sj = {1,1,1,1,1} and s1 =
{1,1,1,0,0}, which have a cosine similarity value of 0.77.
Clearly there is a problem here, since if S1 and S2 are
semantically unrelated, then their centroid would effectively
be meaningless, and we would certainly not expect a
similarity of 0.77. The above problem has occurred because
all of the words of S1 already appear in the cluster centroid
Mj. We can avoid this problem by constructing the centroid
using all sentences in the cluster except for the sentence
with which the cluster centroid is being compared. Thus,
assuming that we have a cluster containing sentences S1 …
SN, and we want the similarity between this cluster and a
sentence SG appearing in the cluster, we would determine
the cluster centroid using only the words appearing in
NGG SSSS ...... 1121; that is, we omit SG in
calculating the cluster centroid.
D. Short Text Similarity and Thresholding Values
In the case of short text clustering, the similarity scores sij
between two sentences can be calculated using an
appropriate short text similarity measure such as described
in Section II. In most cases the similarity scores will be non-
zero, leading to a heavily connected graph, which means
mostly similar. Also, many of the similarity scores will be
very small, arising from incidental similarities between
words in sentences which are in fact not semantically
related. In practice, we have found that the clustering
performance of the algorithm can be improved by
thresholding these similarity scores such that all scores
below the threshold are converted to zero. All datasets
clustering results reported in this paper are based on
s1
s2
s3
s4
s5
sN
Fig.2. Clustering Centroid, where si is set of synonym words
corresponding to Si..
IAENG International Journal of Computer Science, 44:4, IJCS_44_4_12
(Advance online publication: 20 November 2017)
______________________________________________________________________________________
thresholding similarity scores such that 50% of the scores in
the similarity matrix are zero (i.e., other threshold values
were investigated e.g., between 20% and 80%, but it was
found that performance was not highly sensitive to this).
E. Clustering Membership
Unlike soft clustering in which sentences belong to all
clusters with differing degrees of membership [24], hard
clustering algorithm allows sentences to belong to a single
cluster only. This can be trivially achieved in CBLC by
assigning a sentence to the particular cluster for which
semantic similarity value is highest.
C. Convergence and Complexity
With regard to space complexity, the CBLC algorithm is no
more expensive than either the Spectral Clustering [32],
[14] or basic k-Means [42] families of algorithms, since all
require the storage of the same, potentially large, sentence
similarity scores. However, the time complexity of CBLC
far exceeds that of both Spectral Clustering and basic k-
Means. Moreover, complexities arise in step of calculating
the semantic similarity of each sentence to each cluster
centroid, due to the particular representation and associated
similarity measure that we use (e.g., synonym expansion
similarity measure). Assume that unit operation time for
calculating semantic similarity between each sentence and
cluster centroid (i.e., cosine similarity) is S, unit operation
time for re-compute cluster centroids is M, number of
sentences in the dataset is n, number of clusters is k and
iteration count of CBLC loop is I. Therefore, essentially the
following computations are performed for each and every
CBLC iteration: (i) n.k times sentence to cluster centroid
semantic similarity calculation; (ii) k times for re-compute
cluster centroid. As a result, time complexity of CBLC can
be calculated as:
TCBLC = (S . n . k + M . k) . I (3)
Since, n>>k and S>>M, overall time complexity of
CBLC algorithm is found O(n), which means that
computational complexity is relative to number of sentences
to be clustered (i.e., size of the dataset). Note that CBLC
algorithm adds one extra step to the basic steps in basic k-
means algorithm. before the semantic similarity calculation
of each sentence to all cluster centroids, a word sense
identification step is applied.
An alternative to random initialization is to initialize
cluster membership values with values found by first
applying a computationally inexpensive hard clustering
algorithm such as Spectral Clustering or k-Medoids. This
will result in each object having an initial membership value
of either 0 or 1 to each cluster. In practice we have found
this to have a significant effect on the rate of convergence,
with convergence typically achieved in 20 to 70 cycles—
approximately 50 trial of iterations applied when using
random initialization. However, care should be taken that
the hard clustering algorithm is not itself highly sensitive to
initialization, and for this reason we prefer Spectral
Clustering and Affinity Propagation. We note, however, that
initialization does not affect the final membership values at
convergence; that is, on all datasets tested, the algorithm
converged to the same solution, irrespective of initialization.
IV. EXPERIMENTS AND RESULTS
This section reports on the application of the algorithm to
two specially constructed datasets of famous quotations and
seven benchmark datasets in several other domains. We
then initially evaluate the CBLC algorithm on end-to-end
(in vivo) tasks, involving document summarisation. The
performance of the CBLC algorithm is compared as stand-
alone (in vitro) with that of other well-known clustering
algorithms; Spectral Clustering [14], [31], Affinity
Propagation [30], k-medoids algorithm [25], [26], STC-LE
[54] and k-means(TF-IDF) [55], and performance under
synonym expansion sentence similarity measure (which we
described it in Section II) is compared against that resulting
from other modified sentence similarity measures [10]. We
first describe the famous quotation datasets and the seven
benchmark datasets. We then discuss cluster evaluation
criteria and modified short text similarity measures for
comparing performance purposes. The final subsections
present a preliminary test of the algorithm to text
summarisation task and results discussion.
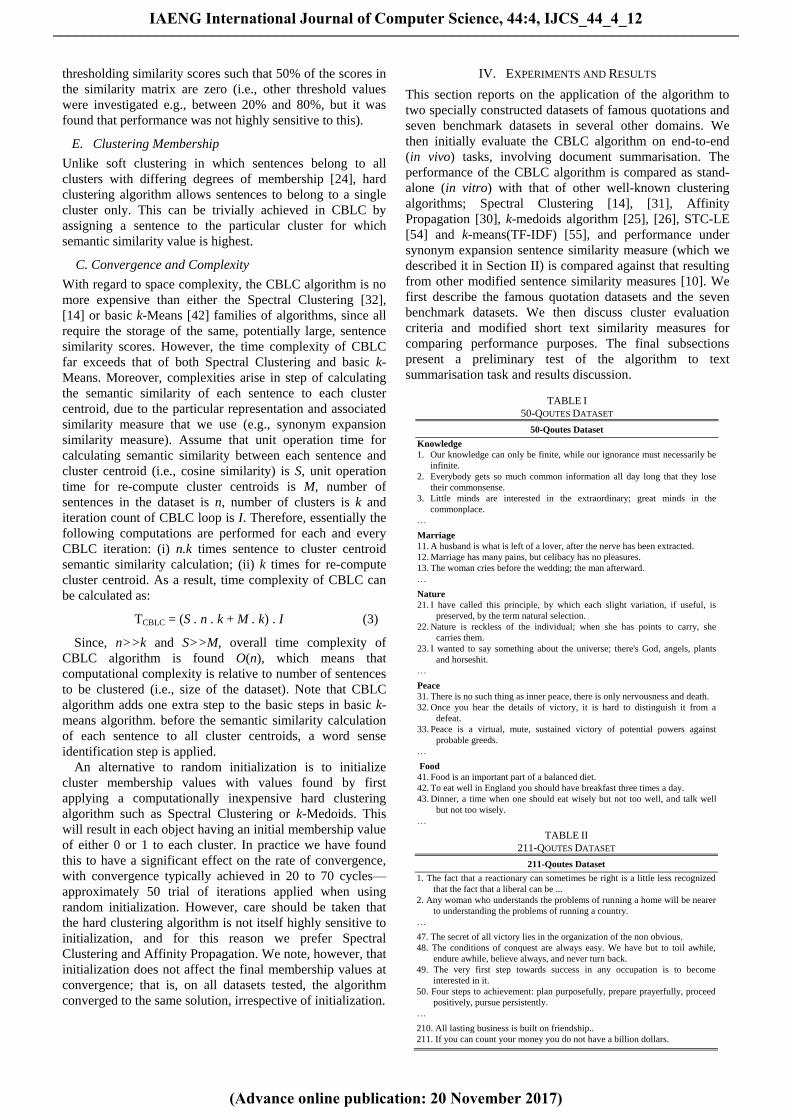
TABLE I
50-QOUTES DATASET
50-Qoutes Dataset
Knowledge
1. Our knowledge can only be finite, while our ignorance must necessarily be
infinite.
2. Everybody gets so much common information all day long that they lose
their commonsense.
3. Little minds are interested in the extraordinary; great minds in the
commonplace.
…
Marriage
11. A husband is what is left of a lover, after the nerve has been extracted.
12. Marriage has many pains, but celibacy has no pleasures.
13. The woman cries before the wedding; the man afterward.
…
Nature
21. I have called this principle, by which each slight variation, if useful, is
preserved, by the term natural selection.
22. Nature is reckless of the individual; when she has points to carry, she
carries them.
23. I wanted to say something about the universe; there's God, angels, plants
and horseshit.
…
Peace
31. There is no such thing as inner peace, there is only nervousness and death.
32. Once you hear the details of victory, it is hard to distinguish it from a
defeat.
33. Peace is a virtual, mute, sustained victory of potential powers against
probable greeds.
…
Food
41. Food is an important part of a balanced diet.
42. To eat well in England you should have breakfast three times a day.
43. Dinner, a time when one should eat wisely but not too well, and talk well
but not too wisely.
…
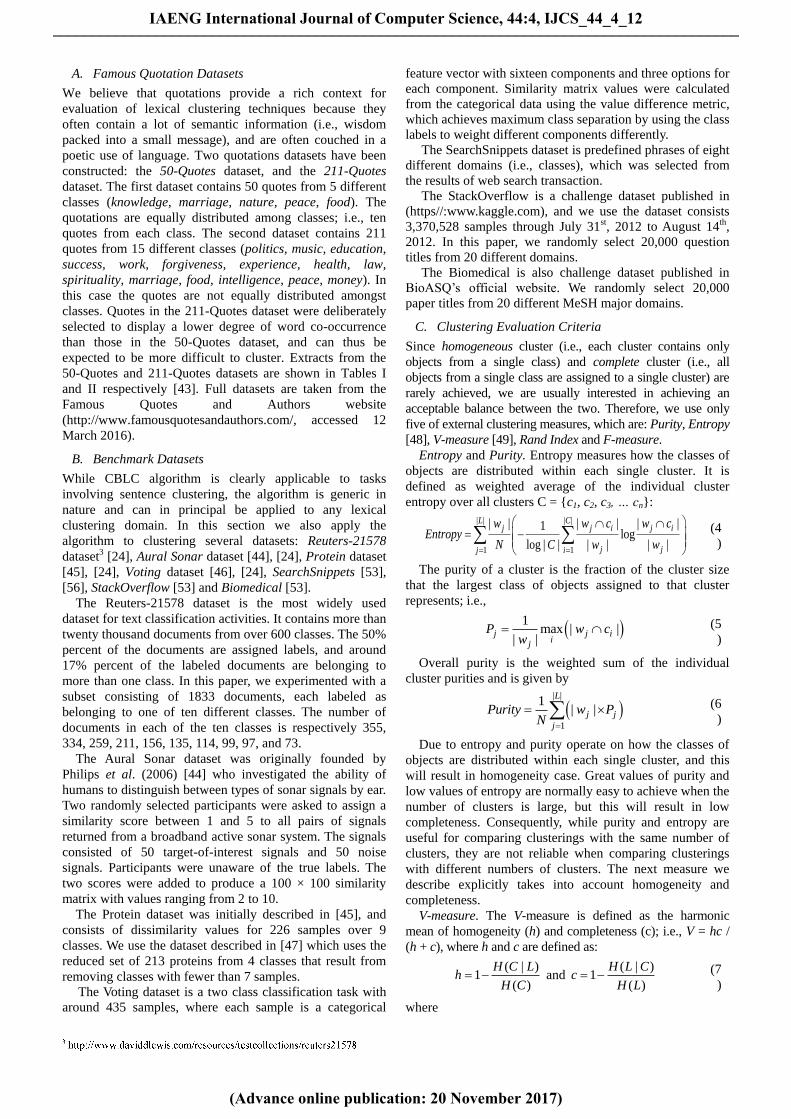
TABLE II
211-QOUTES DATASET
211-Qoutes Dataset
1. The fact that a reactionary can sometimes be right is a little less recognized
that the fact that a liberal can be ...
2. Any woman who understands the problems of running a home will be nearer
to understanding the problems of running a country.
…
47. The secret of all victory lies in the organization of the non obvious.
48. The conditions of conquest are always easy. We have but to toil awhile,
endure awhile, believe always, and never turn back.
49. The very first step towards success in any occupation is to become
interested in it.
50. Four steps to achievement: plan purposefully, prepare prayerfully, proceed
positively, pursue persistently.
…
210. All lasting business is built on friendship..
211. If you can count your money you do not have a billion dollars.
IAENG International Journal of Computer Science, 44:4, IJCS_44_4_12
(Advance online publication: 20 November 2017)
______________________________________________________________________________________
A. Famous Quotation Datasets
We believe that quotations provide a rich context for
evaluation of lexical clustering techniques because they
often contain a lot of semantic information (i.e., wisdom
packed into a small message), and are often couched in a
poetic use of language. Two quotations datasets have been
constructed: the 50-Quotes dataset, and the 211-Quotes
dataset. The first dataset contains 50 quotes from 5 different
classes (knowledge, marriage, nature, peace, food). The
quotations are equally distributed among classes; i.e., ten
quotes from each class. The second dataset contains 211
quotes from 15 different classes (politics, music, education,
success, work, forgiveness, experience, health, law,
spirituality, marriage, food, intelligence, peace, money). In
this case the quotes are not equally distributed amongst
classes. Quotes in the 211-Quotes dataset were deliberately
selected to display a lower degree of word co-occurrence
than those in the 50-Quotes dataset, and can thus be
expected to be more difficult to cluster. Extracts from the
50-Quotes and 211-Quotes datasets are shown in Tables I
and II respectively [43]. Full datasets are taken from the
Famous Quotes and Authors website
(http://www.famousquotesandauthors.com/, accessed 12
March 2016).
B. Benchmark Datasets
While CBLC algorithm is clearly applicable to tasks
involving sentence clustering, the algorithm is generic in
nature and can in principal be applied to any lexical
clustering domain. In this section we also apply the
algorithm to clustering several datasets: Reuters-21578
dataset3 [24], Aural Sonar dataset [44], [24], Protein dataset
[45], [24], Voting dataset [46], [24], SearchSnippets [53],
[56], StackOverflow [53] and Biomedical [53].
The Reuters-21578 dataset is the most widely used
dataset for text classification activities. It contains more than
twenty thousand documents from over 600 classes. The 50%
percent of the documents are assigned labels, and around
17% percent of the labeled documents are belonging to
more than one class. In this paper, we experimented with a
subset consisting of 1833 documents, each labeled as
belonging to one of ten different classes. The number of
documents in each of the ten classes is respectively 355,
334, 259, 211, 156, 135, 114, 99, 97, and 73.
The Aural Sonar dataset was originally founded by
Philips et al. (2006) [44] who investigated the ability of
humans to distinguish between types of sonar signals by ear.
Two randomly selected participants were asked to assign a
similarity score between 1 and 5 to all pairs of signals
returned from a broadband active sonar system. The signals
consisted of 50 target-of-interest signals and 50 noise
signals. Participants were unaware of the true labels. The
two scores were added to produce a 100 × 100 similarity
matrix with values ranging from 2 to 10.
The Protein dataset was initially described in [45], and
consists of dissimilarity values for 226 samples over 9
classes. We use the dataset described in [47] which uses the
reduced set of 213 proteins from 4 classes that result from
removing classes with fewer than 7 samples.
The Voting dataset is a two class classification task with
around 435 samples, where each sample is a categorical
feature vector with sixteen components and three options for
each component. Similarity matrix values were calculated
from the categorical data using the value difference metric,
which achieves maximum class separation by using the class
labels to weight different components differently.
The SearchSnippets dataset is predefined phrases of eight
different domains (i.e., classes), which was selected from
the results of web search transaction.
The StackOverflow is a challenge dataset published in
(https//:www.kaggle.com), and we use the dataset consists
3,370,528 samples through July 31st, 2012 to August 14th,
2012. In this paper, we randomly select 20,000 question
titles from 20 different domains.
The Biomedical is also challenge dataset published in
BioASQ’s official website. We randomly select 20,000
paper titles from 20 different MeSH major domains.
C. Clustering Evaluation Criteria
Since homogeneous cluster (i.e., each cluster contains only
objects from a single class) and complete cluster (i.e., all
objects from a single class are assigned to a single cluster) are
rarely achieved, we are usually interested in achieving an
acceptable balance between the two. Therefore, we use only
five of external clustering measures, which are: Purity, Entropy
[48], V-measure [49], Rand Index and F-measure.
Entropy and Purity. Entropy measures how the classes of
objects are distributed within each single cluster. It is
defined as weighted average of the individual cluster
entropy over all clusters C = {c1, c2, c3, … cn}:
| | | |
1 1
| | | | | |1log
log | | | | | |
L Cj j i j i
j jj i
w w c w cEntropy
N C w w
(4
)
The purity of a cluster is the fraction of the cluster size
that the largest class of objects assigned to that cluster
represents; i.e.,
1
max | || |
j j ii
j
P w cw
(5
)
Overall purity is the weighted sum of the individual
cluster purities and is given by
| |
1
1| |
L
j j
j
Purity w PN
(6
)
Due to entropy and purity operate on how the classes of
objects are distributed within each single cluster, and this
will result in homogeneity case. Great values of purity and
low values of entropy are normally easy to achieve when the
number of clusters is large, but this will result in low
completeness. Consequently, while purity and entropy are
useful for comparing clusterings with the same number of
clusters, they are not reliable when comparing clusterings
with different numbers of clusters. The next measure we
describe explicitly takes into account homogeneity and
completeness.
V-measure. The V-measure is defined as the harmonic
mean of homogeneity (h) and completeness (c); i.e., V = hc /
(h + c), where h and c are defined as:
( | )1
( )
H C Lh
H C and
( | )1
( )
H L Cc
H L (7
)
where
IAENG International Journal of Computer Science, 44:4, IJCS_44_4_12
(Advance online publication: 20 November 2017)
______________________________________________________________________________________
| |
1
| | | |( ) log
Ci i
i
c cH C
N N
, | |
1
| | | |( ) log
Lj j
j
w wH L
N N
,
| | | |
1 1
| | | |( | ) log
| |
L Cj i j i
jj i
w c w cH C L
N w
, and
| | | |
1 1
| | | |( | ) log
| |
C Lj i j i
ii j
w c w cH L C
N c
.
Rand Index and F-measure. Unlike purity, entropy and V-
measure, which are based on statistics, Rand Index and F-
measure are based on a combinatorial approach which
considers each possible pair of objects. Each pair can fall
into one of four groups: if both objects belong to the same
class and same cluster, then the pair is a true positive (TP);
if objects belong to the same cluster but different classes,
the pair is a false positive (FP); if objects belong to the same
class but different clusters, the pair is a false negative (FN);
otherwise the objects must belong to different classes and
different clusters, in which case the pair is a true negative
(TN). The Rand index is simply the accuracy; i.e., RI = (TP
+ FP)/(TP + FP + FN + TN). The F-measure is another
measure commonly used in the IR literature, and is defined
as the harmonic mean of precision and recall; i.e., F-
measure = 2PR/(P+R), where P = TP/(TP + FP) and R =
TP/(TP + FN).
D. Modified Short Text Similarity Measures
In order to compare the performance of synonym expansion
similarity measure, we use a modified version of measures
proposed by [1], [2], which is reported in [50], [51].
For the Li et al. (2006) [1] short-text similarity measure,
the only modification required is in determining the
components of the semantic vectors. This can be done as; if
wj appears in Si, set vij equal to i
j
S
wPR (i.e., the PageRank score
for wj in Si), otherwise set vij equal to the highest similarity
score between wj and the words in Si; i.e.,
arg max ( , ) i
j
i
S
ij j wx S
v sim w x PR
.
The short-text similarity measure proposed by Mihalcea
et al. (2006) [2] can be modified as follows:
2 1 1
21 1
1 2 2
12 2
1 2
1( , ) ,arg max ( , )
2
1,arg max ( , )
2
S S Sx w w
x Sw S w S
S S Sx w w
x Sw S w S
sim S S sim w sim w x PR PR PR
sim w sim w x PR PR PR
(8)
where SxPR is the PageRank score of word x in quote S.
Note that for more detailed, see [50].
E. Results
In this section we present the results of applying the CBLC
algorithm to 50-Quotes, 211-Quotes, Reuters-21578, Aural
Sonar, Protein, Voting, SearchSnippets, StackOverflow and
Biomedical datasets, and compare its performance with that
of Spectral Clustering, Affinity Propagation, k-medoids,
STC-LE and k-means(TF-IDF) algorithms.
F. Clustering the 50-Quotes Dataset
Tables III, and IV show the results of applying the CBLC,
Spectral Clustering, Affinity Propagation, k-medoids, STC-
LE and k-means(TF-IDF) algorithms respectively to the 50-
Quotes dataset and evaluating using the Purity, Entropy, V-
measure, Rand Index and F-measure measures. In order to
compare the effect of the short text similarity measures, the
first section of table III shows performance with the use of
the synonym expansion similarity measure (described above
in Section II, here after we will call it as synonym expansion
similarity measure), the second shows performance with the
use of modified Li et al. (2006) [1], [50] measure, and the
third shows performance with the use of modified Mihalcea
et al. (2006) [2], [50] measure. The spectral clustering,
Affinity Propagation, k-medoids, STC-LE and k-means(TF-
IDF) algorithms used are that due to [31], [30], [26], [54],
[55] respectively. Note that, the performance shown in table
IV is only with the use of the synonym expansion similarity
measure.
TABLE III
CBLC ALGORITHM PERFORMANCE ON 50-QUOTES DATASET
N_clust (k) Purity Entropy V-meas. Rand F-meas.
Synonym Expansion Similarity Measure
3 0.478 0.774 0.335 0.652 0.598
4 0.651 0.497 0.560 0.711 0.632
5 0.860 0.240 0.775 0.868 0.756
6 0.812 0.275 0.697 0.805 0.695
7 0.719 0.350 0.580 0.799 0.612
Modified Li et al. Similarity Measure
3 0.490 0.785 0.310 0.601 0.580
4 0.610 0.525 0.590 0.687 0.625
5 0.830 0.260 0.700 0.788 0.654
6 0.790 0.298 0.650 0.732 0.620
7 0.680 0.380 0.553 0.696 0.580
Modified Mihalcea et al. Similarity Measure
3 0.480 0.800 0.299 0.499 0.455
4 0.600 0.550 0.589 0.655 0.584
5 0.752 0.311 0.650 0.724 0.622
6 0.740 0.320 0.642 0.674 0.578
7 0.729 0.358 0.680 0.590 0.501
TABLE IV
SPECTRAL CLUSTERING, AFFINITY PROPAGATION AND K-MEDOIDS
ALGORITHMS PERFORMANCE ON 50-QUOTES DATASET
N_clust (k) Purity Entropy V-meas. Rand F-meas.
Spectral Clustering
3 0.740 0.394 0.616 0.735 0.495
4 0.760 0.309 0.667 0.750 0.524
5 0.810 0.291 0.698 0.808 0.585
6 0.700 0.401 0.666 0.675 0.430
7 0.620 0.540 0.563 0.603 0.392
Affinity Propagation
4 0.780 0.331 0.629 0.713 0.401
5 0.800 0.298 0.646 0.748 0.480
6 0.690 0.460 0.545 0.668 0.376
7 0.650 0.490 0.565 0.589 0.305
k-medoids
3 0.580 0.498 0.425 0.498 0.320
4 0.602 0.411 0.541 0.575 0.391
5 0.650 0.365 0.596 0.612 0.402
6 0.788 0.294 0.656 0.717 0.550
7 0.710 0.313 0.601 0.689 0.480
STC-LE
3 0.641 0.412 0.541 0.622 0.430
4 0.687 0.389 0.584 0.676 0.477
5 0.797 0.301 0.658 0.725 0.545
6 0.748 0.355 0.613 0.700 0.502
7 0.606 0.465 0.521 0.588 0.390
k-means(TF-IDF)
3 0.402 0.601 0.322 0.362 0.320
4 0.433 0.566 0.366 0.388 0.354
5 0.487 0.524 0.409 0.401 0.398
6 0.510 0.505 0.464 0.456 0.420
7 0.578 0.490 0.511 0.498 0.487
IAENG International Journal of Computer Science, 44:4, IJCS_44_4_12
(Advance online publication: 20 November 2017)
______________________________________________________________________________________
CBLC algorithm requires that an initial number of
clusters in which we specified before the algorithm start.
This number was varied from 1 to 10. Interestingly, only 5
unique clusterings were found in the case of using the
CBLC, Spectral Clustering, k-medoids, STC-LE and k-
means(TF-IDF) algorithms and only 4 unique clusterings
were found in case of using the Affinity Propagation
algorithm, each containing a different number of clusters,
which ranged from 3 to 7 and 4 to 7 respectively. Note that,
values in the tables are averaged over 100 trials.
Since the five evaluation measures performance are not
always consistent as to which algorithm achieves best
performance for a given number of clusters, we indicate in
boldface the value corresponding to the best value for that
measure; i.e., the maximum column value in the case of
Purity, V-measure, Rand Index and F-measure, the
minimum column value in the case of Entropy. In the table
III, therefore, it can clearly be seen that use of the synonym
expansion similarity measure consistently leads to better
clustering performance over that of the modified Li et al.
and Modified Mihalcea et al. similarity measures. That is,
the synonym expansion similarity measure leads to better
performance across all five algorithms.
Comparing the first section of Table III, and first and
second sections in Table IV (i.e., performance % of the five
algorithms using the synonym expansion similarity
measure) shows that the CBLC algorithm outperforms the
Spectral Clustering, Affinity Propagation, k-medoids, STC-
LE and k-means(TF-IDF) algorithms. The CBLC algorithm
also achieves superior results to that of the other algorithms
when using the modified Li et al. measure, as can be seen
by comparing the first and second sections of the table IV.
Best performance in terms of overall purity, entropy, V-
measure, Rand Index, F-measure (86.0%, 24.0%, 77.5%,
86.8% and 75.6% respectively), was achieved using CBLC
with synonym expansion similarity measure. Interestingly,
note that this best performance occurs when the number of
clusters is five, which happens to be the actual number of
clusters in the 50-quotes dataset.
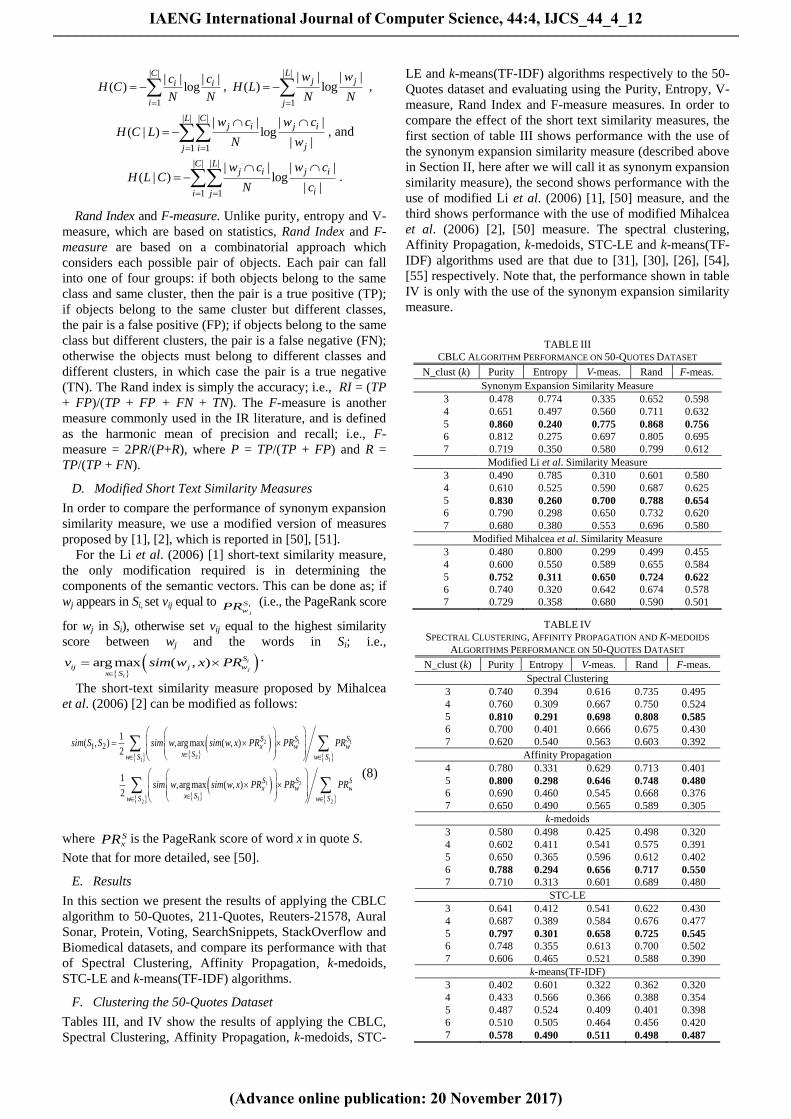
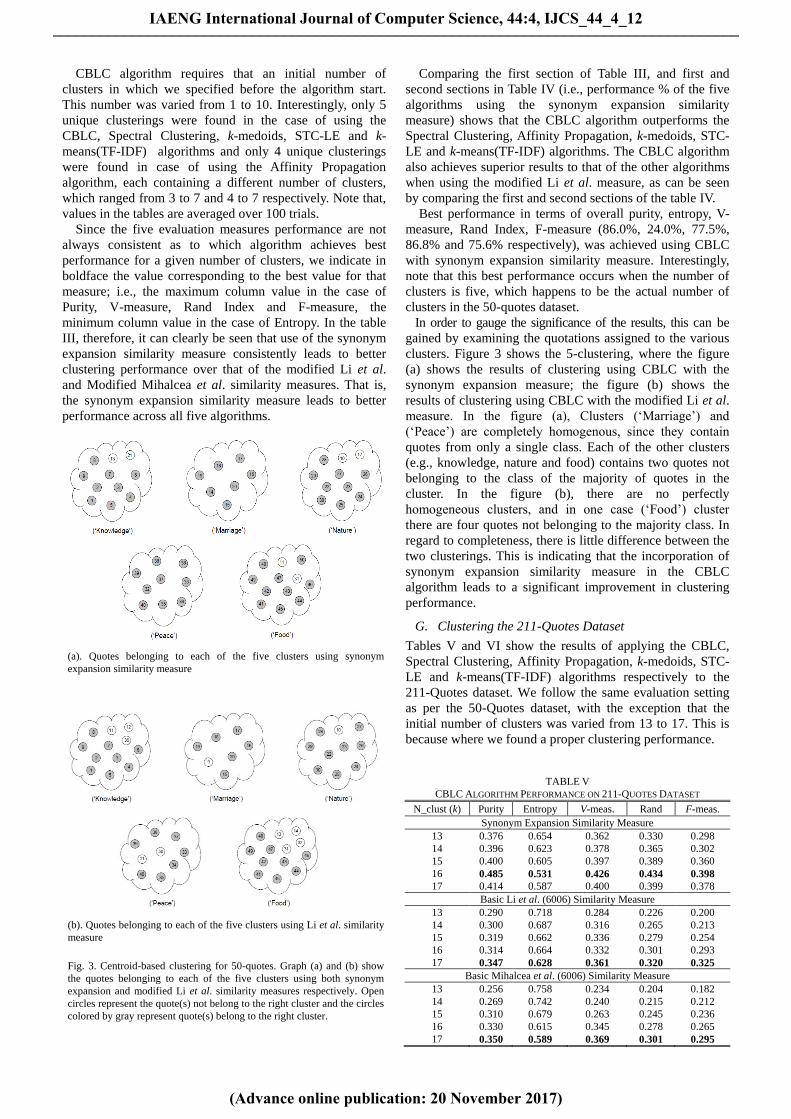
In order to gauge the significance of the results, this can be
gained by examining the quotations assigned to the various
clusters. Figure 3 shows the 5-clustering, where the figure
(a) shows the results of clustering using CBLC with the
synonym expansion measure; the figure (b) shows the
results of clustering using CBLC with the modified Li et al.
measure. In the figure (a), Clusters (‘Marriage’) and
(‘Peace’) are completely homogenous, since they contain
quotes from only a single class. Each of the other clusters
(e.g., knowledge, nature and food) contains two quotes not
belonging to the class of the majority of quotes in the
cluster. In the figure (b), there are no perfectly
homogeneous clusters, and in one case (‘Food’) cluster
there are four quotes not belonging to the majority class. In
regard to completeness, there is little difference between the
two clusterings. This is indicating that the incorporation of
synonym expansion similarity measure in the CBLC
algorithm leads to a significant improvement in clustering
performance.
G. Clustering the 211-Quotes Dataset
Tables V and VI show the results of applying the CBLC,
Spectral Clustering, Affinity Propagation, k-medoids, STC-
LE and k-means(TF-IDF) algorithms respectively to the
211-Quotes dataset. We follow the same evaluation setting
as per the 50-Quotes dataset, with the exception that the
initial number of clusters was varied from 13 to 17. This is
because where we found a proper clustering performance.
TABLE V
CBLC ALGORITHM PERFORMANCE ON 211-QUOTES DATASET
N_clust (k) Purity Entropy V-meas. Rand F-meas.
Synonym Expansion Similarity Measure
13 0.376 0.654 0.362 0.330 0.298
14 0.396 0.623 0.378 0.365 0.302
15 0.400 0.605 0.397 0.389 0.360
16 0.485 0.531 0.426 0.434 0.398
17 0.414 0.587 0.400 0.399 0.378
Basic Li et al. (6006) Similarity Measure
13 0.290 0.718 0.284 0.226 0.200
14 0.300 0.687 0.316 0.265 0.213
15 0.319 0.662 0.336 0.279 0.254
16 0.314 0.664 0.332 0.301 0.293
17 0.347 0.628 0.361 0.320 0.325
Basic Mihalcea et al. (6006) Similarity Measure
13 0.256 0.758 0.234 0.204 0.182
14 0.269 0.742 0.240 0.215 0.212
15 0.310 0.679 0.263 0.245 0.236
16 0.330 0.615 0.345 0.278 0.265
17 0.350 0.589 0.369 0.301 0.295
(a). Quotes belonging to each of the five clusters using synonym
expansion similarity measure
(b). Quotes belonging to each of the five clusters using Li et al. similarity
measure
Fig. 3. Centroid-based clustering for 50-quotes. Graph (a) and (b) show
the quotes belonging to each of the five clusters using both synonym
expansion and modified Li et al. similarity measures respectively. Open
circles represent the quote(s) not belong to the right cluster and the circles
colored by gray represent quote(s) belong to the right cluster.
IAENG International Journal of Computer Science, 44:4, IJCS_44_4_12
(Advance online publication: 20 November 2017)
______________________________________________________________________________________
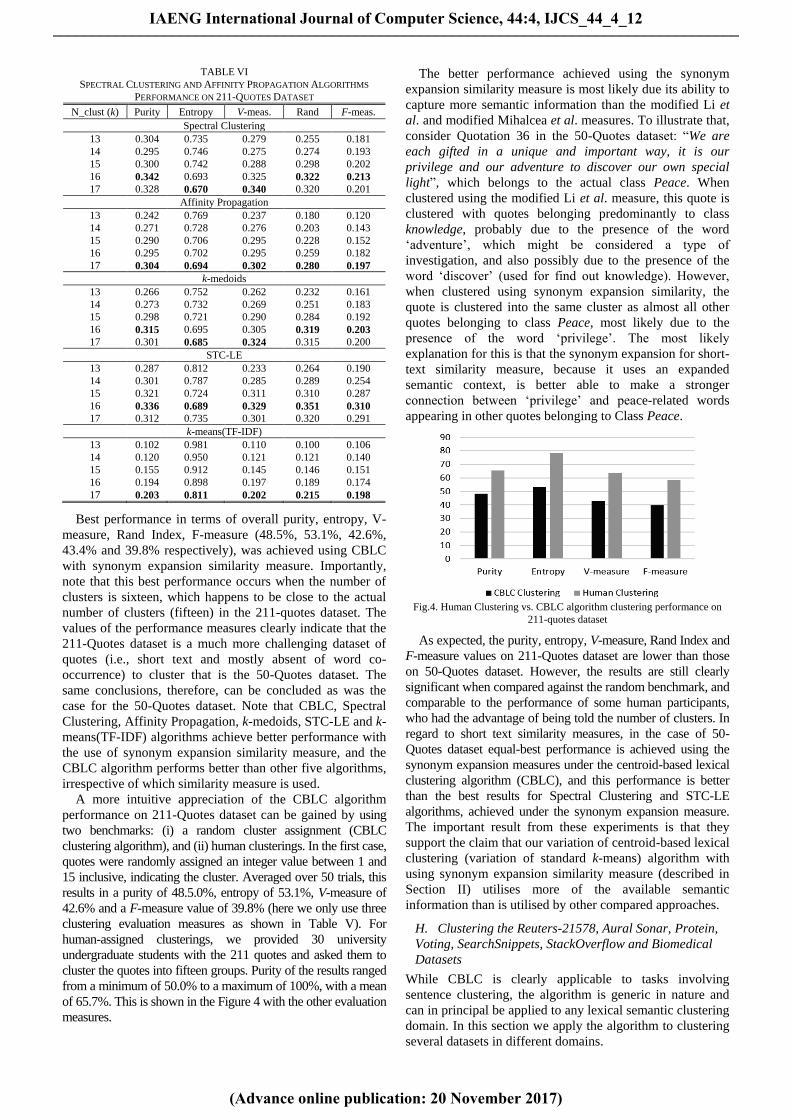
TABLE VI
SPECTRAL CLUSTERING AND AFFINITY PROPAGATION ALGORITHMS
PERFORMANCE ON 211-QUOTES DATASET
N_clust (k) Purity Entropy V-meas. Rand F-meas.
Spectral Clustering
13 0.304 0.735 0.279 0.255 0.181
14 0.295 0.746 0.275 0.274 0.193
15 0.300 0.742 0.288 0.298 0.202
16 0.342 0.693 0.325 0.322 0.213
17 0.328 0.670 0.340 0.320 0.201
Affinity Propagation
13 0.242 0.769 0.237 0.180 0.120
14 0.271 0.728 0.276 0.203 0.143
15 0.290 0.706 0.295 0.228 0.152
16 0.295 0.702 0.295 0.259 0.182
17 0.304 0.694 0.302 0.280 0.197
k-medoids
13 0.266 0.752 0.262 0.232 0.161
14 0.273 0.732 0.269 0.251 0.183
15 0.298 0.721 0.290 0.284 0.192
16 0.315 0.695 0.305 0.319 0.203
17 0.301 0.685 0.324 0.315 0.200
STC-LE
13 0.287 0.812 0.233 0.264 0.190
14 0.301 0.787 0.285 0.289 0.254
15 0.321 0.724 0.311 0.310 0.287
16 0.336 0.689 0.329 0.351 0.310
17 0.312 0.735 0.301 0.320 0.291
k-means(TF-IDF)
13 0.102 0.981 0.110 0.100 0.106
14 0.120 0.950 0.121 0.121 0.140
15 0.155 0.912 0.145 0.146 0.151
16 0.194 0.898 0.197 0.189 0.174
17 0.203 0.811 0.202 0.215 0.198
Best performance in terms of overall purity, entropy, V-
measure, Rand Index, F-measure (48.5%, 53.1%, 42.6%,
43.4% and 39.8% respectively), was achieved using CBLC
with synonym expansion similarity measure. Importantly,
note that this best performance occurs when the number of
clusters is sixteen, which happens to be close to the actual
number of clusters (fifteen) in the 211-quotes dataset. The
values of the performance measures clearly indicate that the
211-Quotes dataset is a much more challenging dataset of
quotes (i.e., short text and mostly absent of word co-
occurrence) to cluster that is the 50-Quotes dataset. The
same conclusions, therefore, can be concluded as was the
case for the 50-Quotes dataset. Note that CBLC, Spectral
Clustering, Affinity Propagation, k-medoids, STC-LE and k-
means(TF-IDF) algorithms achieve better performance with
the use of synonym expansion similarity measure, and the
CBLC algorithm performs better than other five algorithms,
irrespective of which similarity measure is used.
A more intuitive appreciation of the CBLC algorithm
performance on 211-Quotes dataset can be gained by using
two benchmarks: (i) a random cluster assignment (CBLC
clustering algorithm), and (ii) human clusterings. In the first case,
quotes were randomly assigned an integer value between 1 and
15 inclusive, indicating the cluster. Averaged over 50 trials, this
results in a purity of 48.5.0%, entropy of 53.1%, V-measure of
42.6% and a F-measure value of 39.8% (here we only use three
clustering evaluation measures as shown in Table V). For
human-assigned clusterings, we provided 30 university
undergraduate students with the 211 quotes and asked them to
cluster the quotes into fifteen groups. Purity of the results ranged
from a minimum of 50.0% to a maximum of 100%, with a mean
of 65.7%. This is shown in the Figure 4 with the other evaluation
measures.
The better performance achieved using the synonym
expansion similarity measure is most likely due its ability to
capture more semantic information than the modified Li et
al. and modified Mihalcea et al. measures. To illustrate that,
consider Quotation 36 in the 50-Quotes dataset: “We are
each gifted in a unique and important way, it is our
privilege and our adventure to discover our own special
light”, which belongs to the actual class Peace. When
clustered using the modified Li et al. measure, this quote is
clustered with quotes belonging predominantly to class
knowledge, probably due to the presence of the word
‘adventure’, which might be considered a type of
investigation, and also possibly due to the presence of the
word ‘discover’ (used for find out knowledge). However,
when clustered using synonym expansion similarity, the
quote is clustered into the same cluster as almost all other
quotes belonging to class Peace, most likely due to the
presence of the word ‘privilege’. The most likely
explanation for this is that the synonym expansion for short-
text similarity measure, because it uses an expanded
semantic context, is better able to make a stronger
connection between ‘privilege’ and peace-related words
appearing in other quotes belonging to Class Peace.
Fig.4. Human Clustering vs. CBLC algorithm clustering performance on
211-quotes dataset
As expected, the purity, entropy, V-measure, Rand Index and
F-measure values on 211-Quotes dataset are lower than those
on 50-Quotes dataset. However, the results are still clearly
significant when compared against the random benchmark, and
comparable to the performance of some human participants,
who had the advantage of being told the number of clusters. In
regard to short text similarity measures, in the case of 50-
Quotes dataset equal-best performance is achieved using the
synonym expansion measures under the centroid-based lexical
clustering algorithm (CBLC), and this performance is better
than the best results for Spectral Clustering and STC-LE
algorithms, achieved under the synonym expansion measure.
The important result from these experiments is that they
support the claim that our variation of centroid-based lexical
clustering (variation of standard k-means) algorithm with
using synonym expansion similarity measure (described in
Section II) utilises more of the available semantic
information than is utilised by other compared approaches.
H. Clustering the Reuters-21578, Aural Sonar, Protein,
Voting, SearchSnippets, StackOverflow and Biomedical
Datasets
While CBLC is clearly applicable to tasks involving
sentence clustering, the algorithm is generic in nature and
can in principal be applied to any lexical semantic clustering
domain. In this section we apply the algorithm to clustering
several datasets in different domains.
IAENG International Journal of Computer Science, 44:4, IJCS_44_4_12
(Advance online publication: 20 November 2017)
______________________________________________________________________________________
Table VII shows the results of applying the CBLC
algorithm to the Reuters-21578, Aural Sonar, Protein,
Voting, SearchSnippets, StackOverflow and Biomedical
datasets respectively. We follow the same evaluation setting
as per the 50-Quotes and 211-Quotes datasets, with the
exception that the initial number of clusters was varied from
7 to 12 for Reuters-21578, Aural Sonar, Protein, Voting and
SearchSnippets datasets, and from 17 to 23 for
StackOverflow and Biomedical datasets. This is because
where we found a proper clustering performance. Note that
the best performance according to each measure depicted in
boldface.
TABLE VII
CBLC ALGORITHM PERFORMANCE ON REUTERS-21578, AURAL SONAR,
PROTEIN AND VOTING DATASETS WITH THE USE OF THE SYNONYM
EXPANSION SENTENCE SIMILARITY MEASURE
N_clust (k) Purity Entropy V-meas. Rand F-meas.
Reuters-21578 Dataset
7 0.571 0.659 0.423 0.584 0.565
8 0.620 0.523 0.498 0.611 0.579
9 0.645 0.409 0.557 0.623 0.602
10 0.721 0.318 0.655 0.707 0.622
11 0.688 0.361 0.630 0.682 0.587
12 0.670 0.435 0.621 0.673 0.569
Aural Sonar Dataset
7 0.790 0.431 0.538 0.786 0.674
8 0.820 0.436 0.541 0.804 0.720
9 0.802 0.492 0.499 0.789 0.646
10 0.778 0.524 0.445 0.768 0.621
11 0.754 0.591 0.401 0.745 0.597
12 0.703 0.611 0.379 0.731 0.569
Protein Dataset
7 0.719 0.279 0.490 0.776 0.671
8 0.769 0.274 0.523 0.798 0.681
9 0.898 0.259 0.604 0.781 0.636
10 0.839 0.265 0.601 0.765 0.601
11 0.790 0.316 0.598 0.735 0.587
12 0.749 0.320 0.588 0.701 0.549
Voting Dataset
7 0.770 0.421 0.530 0.768 0.665
8 0.871 0.446 0.545 0.812 0.717
9 0.792 0.496 0.490 0.779 0.636
10 0.771 0.534 0.435 0.758 0.615
11 0.750 0.581 0.419 0.734 0.593
12 0.733 0.612 0.389 0.722 0.559
SearchSnippets
7 0.802 0.462 0.594 0.754 0.643
8 0.845 0.401 0.613 0.801 0.689
9 0.788 0.478 0.588 0.765 0.624
10 0.741 0.512 0.522 0.732 0.603
11 0.687 0.565 0.479 0.697 0.587
12 0.625 0.577 0.413 0.651 0.526
StackOverflow
17 0.545 0.488 0.455 0.542 0.465
18 0.599 0.456 0.487 0.596 0.501
19 0.621 0.411 0.501 0.610 0.555
20 0.681 0.354 0.520 0.623 0.597
21 0.635 0.311 0.512 0.615 0.562
22 0.603 0.401 0.474 0.597 0.510
23 0.574 0.498 0.420 0.566 0.479
Biomedical
17 0.404 0.395 0.355 0.378 0.451
18 0.436 0.374 0.395 0.410 0.465
19 0.495 0.314 0.421 0.435 0.487
20 0.521 0.254 0.461 0.489 0.501
21 0.513 0.296 0.432 0.448 0.494
22 0.479 0.333 0.413 0.406 0.456
23 0.422 0.384 0.387 0.378 0.424
Best performance in terms of overall purity, entropy, V-
measure, Rand Index, F-measure for the seven datasets, was
achieved using CBLC with synonym expansion similarity
measure. Interestingly, note that this best performance
occurs when the number of clusters is eight-to-teen, which
happens to be very close to the actual number of clusters in
the Reuters-21578, Aural Sonar, Protein, Voting and
SearchSnippets datasets, and nineteen-to-twenty-one in the
StackOverflow and Biomedical datasets. By considering all
evaluation criteria applied in all datasets, the best overall
performance of the six clustering algorithms is achieved by
CBLC in conjunction with the synonym expansion measure.
TABLE VIII
SPECTRAL CLUSTERING, AFFINITY PROPAGATION AND K-MEDOIDS
ALGORITHMS PERFORMANCE ON REUTERS-21578, AURAL SONAR, PROTEIN
AND VOTING DATASETS WITH THE USE OF THE SYNONYM EXPANSION
SIMILARITY MEASURE
Algorithm Purity Entropy V-
meas. Rand
F-
meas.
Reuters-21578 Dataset
CBLC Algorithm 0.721 0.318 0.655 0.707 0.622
Spectral Clustering 0.669 0.395 0.604 0.674 0.542
Affinity Propagation 0.611 0.465 0.525 0.668 0.537
k-medoids 0.608 0.456 0.520 0.646 0.504
STC-LE 0.650 0.403 0.587 0.687 0.551
k-means(TF-IDF) 0.492 0.741 0.365 0.411 0.374
Aural Sonar Dataset
CBLC Algorithm 0.820 0.431 0.541 0.804 0.720
Spectral Clustering 0.780 0.523 0.498 0.745 0.712
Affinity Propagation 0.740 0.535 0.451 0.717 0.695
k-medoids 0.720 0.583 0.426 0.697 0.676
STC-LE 0.801 0.491 0.515 0.764 0.704
k-means(TF-IDF) 0.502 0.789 0.288 0.464 0.422
Protein Dataset
CBLC Algorithm 0.898 0.259 0.604 0.798 0.681
Spectral Clustering 0.832 0.289 0.587 0.733 0.614
Affinity Propagation 0.709 0.314 0.531 0.691 0.604
k-medoids 0.713 0.307 0.523 0.626 0.592
STC-LE 0.849 0.261 0.600 0.745 0.622
k-means(TF-IDF) 0.601 0.436 0.466 0.512 0.497
Voting Dataset
CBLC Algorithm 0.871 0.421 0.545 0.812 0.717
Spectral Clustering 0.808 0.501 0.509 0.785 0.708
Affinity Propagation 0.780 0.545 0.478 0.715 0.690
k-medoids 0.775 0.589 0.436 0.689 0.643
STC-LE 0.820 0.495 0.519 0.801 0.710
k-means(TF-IDF) 0.490 0.764 0.344 0.394 0.481
SearchSnippets
CBLC Algorithm 0.845 0.401 0.613 0.801 0.689
Spectral Clustering 0.741 0.456 0.587 0.788 0.620
Affinity Propagation 0.723 0.479 0.564 0.736 0.601
k-medoids 0.701 0.498 0.531 0.712 0.595
STC-LE 0.780 0.420 0.601 0.798 0.654
k-means(TF-IDF) 0.350 0.786 0.255 0.314 0.264
StackOverflow
CBLC Algorithm 0.681 0.354 0.520 0.623 0.597
Spectral Clustering 0.614 0.396 0.510 0.611 0.545
Affinity Propagation 0.580 0.460 0.502 0.591 0.521
k-medoids 0.502 0.487 0.490 0.579 0.501
STC-LE 0.522 0.478 0.500 0.619 0.565
k-means(TF-IDF) 0.231 0.718 0.203 0.221 0.189
Biomedical
CBLC Algorithm 0.521 0.254 0.461 0.489 0.501
Spectral Clustering 0.462 0.269 0.443 0.451 0.488
Affinity Propagation 0.422 0.284 0.423 0.436 0.465
k-medoids 0.412 0.940 0.419 0.424 0.433
STC-LE 0.450 0.256 0.451 0.441 0.469
k-means(TF-IDF) 0.300 0.784 0.264 0.287 0.280
IAENG International Journal of Computer Science, 44:4, IJCS_44_4_12
(Advance online publication: 20 November 2017)
______________________________________________________________________________________
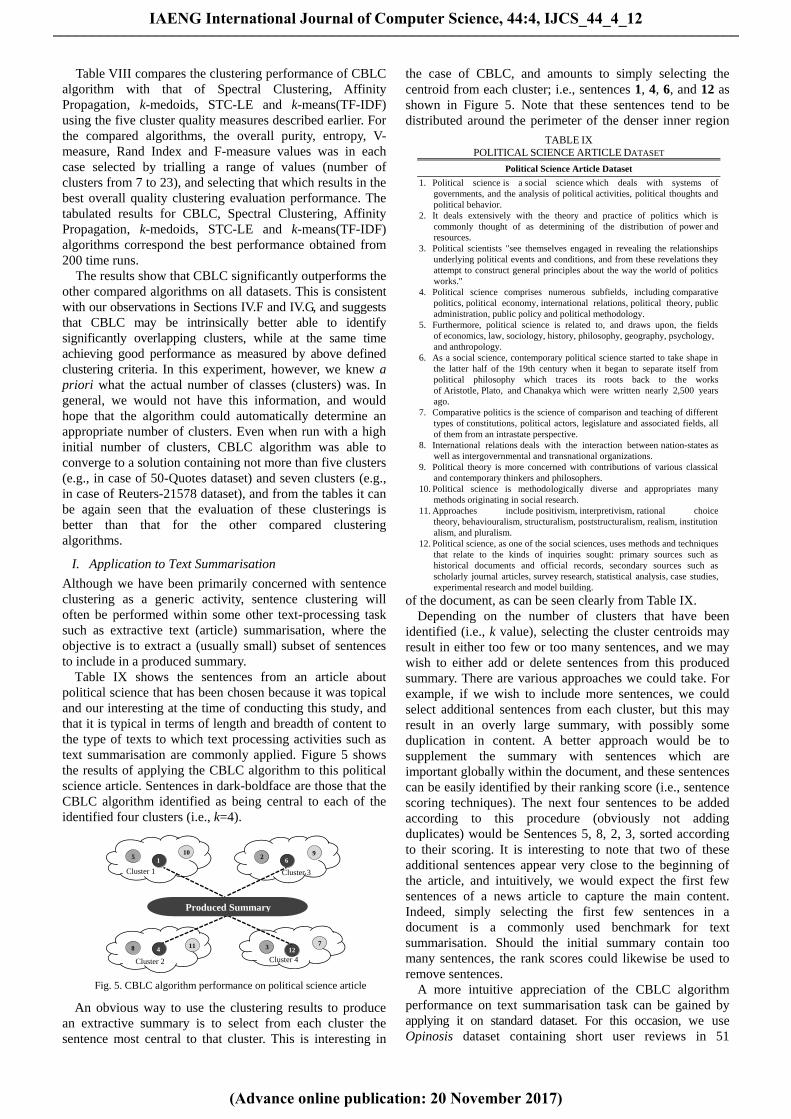
Table VIII compares the clustering performance of CBLC
algorithm with that of Spectral Clustering, Affinity
Propagation, k-medoids, STC-LE and k-means(TF-IDF)
using the five cluster quality measures described earlier. For
the compared algorithms, the overall purity, entropy, V-
measure, Rand Index and F-measure values was in each
case selected by trialling a range of values (number of
clusters from 7 to 23), and selecting that which results in the
best overall quality clustering evaluation performance. The
tabulated results for CBLC, Spectral Clustering, Affinity
Propagation, k-medoids, STC-LE and k-means(TF-IDF)
algorithms correspond the best performance obtained from
200 time runs.
The results show that CBLC significantly outperforms the
other compared algorithms on all datasets. This is consistent
with our observations in Sections IV.F and IV.G, and suggests
that CBLC may be intrinsically better able to identify
significantly overlapping clusters, while at the same time
achieving good performance as measured by above defined
clustering criteria. In this experiment, however, we knew a
priori what the actual number of classes (clusters) was. In
general, we would not have this information, and would
hope that the algorithm could automatically determine an
appropriate number of clusters. Even when run with a high
initial number of clusters, CBLC algorithm was able to
converge to a solution containing not more than five clusters
(e.g., in case of 50-Quotes dataset) and seven clusters (e.g.,
in case of Reuters-21578 dataset), and from the tables it can
be again seen that the evaluation of these clusterings is
better than that for the other compared clustering
algorithms.
I. Application to Text Summarisation
Although we have been primarily concerned with sentence
clustering as a generic activity, sentence clustering will
often be performed within some other text-processing task
such as extractive text (article) summarisation, where the
objective is to extract a (usually small) subset of sentences
to include in a produced summary.
Table IX shows the sentences from an article about
political science that has been chosen because it was topical
and our interesting at the time of conducting this study, and
that it is typical in terms of length and breadth of content to
the type of texts to which text processing activities such as
text summarisation are commonly applied. Figure 5 shows
the results of applying the CBLC algorithm to this political
science article. Sentences in dark-boldface are those that the
CBLC algorithm identified as being central to each of the
identified four clusters (i.e., k=4).
Fig. 5. CBLC algorithm performance on political science article
An obvious way to use the clustering results to produce
an extractive summary is to select from each cluster the
sentence most central to that cluster. This is interesting in
the case of CBLC, and amounts to simply selecting the
centroid from each cluster; i.e., sentences 1, 4, 6, and 12 as
shown in Figure 5. Note that these sentences tend to be
distributed around the perimeter of the denser inner region
of the document, as can be seen clearly from Table IX.
Depending on the number of clusters that have been
identified (i.e., k value), selecting the cluster centroids may
result in either too few or too many sentences, and we may
wish to either add or delete sentences from this produced
summary. There are various approaches we could take. For
example, if we wish to include more sentences, we could
select additional sentences from each cluster, but this may
result in an overly large summary, with possibly some
duplication in content. A better approach would be to
supplement the summary with sentences which are
important globally within the document, and these sentences
can be easily identified by their ranking score (i.e., sentence
scoring techniques). The next four sentences to be added
according to this procedure (obviously not adding
duplicates) would be Sentences 5, 8, 2, 3, sorted according
to their scoring. It is interesting to note that two of these
additional sentences appear very close to the beginning of
the article, and intuitively, we would expect the first few
sentences of a news article to capture the main content.
Indeed, simply selecting the first few sentences in a
document is a commonly used benchmark for text
summarisation. Should the initial summary contain too
many sentences, the rank scores could likewise be used to
remove sentences.
A more intuitive appreciation of the CBLC algorithm
performance on text summarisation task can be gained by
applying it on standard dataset. For this occasion, we use
Opinosis dataset containing short user reviews in 51
TABLE IX
POLITICAL SCIENCE ARTICLE DATASET
Political Science Article Dataset
1. Political science is a social science which deals with systems of
governments, and the analysis of political activities, political thoughts and
political behavior.
2. It deals extensively with the theory and practice of politics which is
commonly thought of as determining of the distribution of power and
resources.
3. Political scientists "see themselves engaged in revealing the relationships
underlying political events and conditions, and from these revelations they
attempt to construct general principles about the way the world of politics
works."
4. Political science comprises numerous subfields, including comparative
politics, political economy, international relations, political theory, public
administration, public policy and political methodology.
5. Furthermore, political science is related to, and draws upon, the fields
of economics, law, sociology, history, philosophy, geography, psychology,
and anthropology.
6. As a social science, contemporary political science started to take shape in
the latter half of the 19th century when it began to separate itself from
political philosophy which traces its roots back to the works
of Aristotle, Plato, and Chanakya which were written nearly 2,500 years
ago.
7. Comparative politics is the science of comparison and teaching of different
types of constitutions, political actors, legislature and associated fields, all
of them from an intrastate perspective.
8. International relations deals with the interaction between nation-states as
well as intergovernmental and transnational organizations.
9. Political theory is more concerned with contributions of various classical
and contemporary thinkers and philosophers.
10. Political science is methodologically diverse and appropriates many
methods originating in social research.
11. Approaches include positivism, interpretivism, rational choice
theory, behaviouralism, structuralism, poststructuralism, realism, institution
alism, and pluralism.
12. Political science, as one of the social sciences, uses methods and techniques
that relate to the kinds of inquiries sought: primary sources such as
historical documents and official records, secondary sources such as
scholarly journal articles, survey research, statistical analysis, case studies,
experimental research and model building.
1 5
10
8 11
6 2
9
12 3
7
Produced Summary
4
Cluster 3 Cluster 1
Cluster 2 Cluster 4
IAENG International Journal of Computer Science, 44:4, IJCS_44_4_12
(Advance online publication: 20 November 2017)
______________________________________________________________________________________
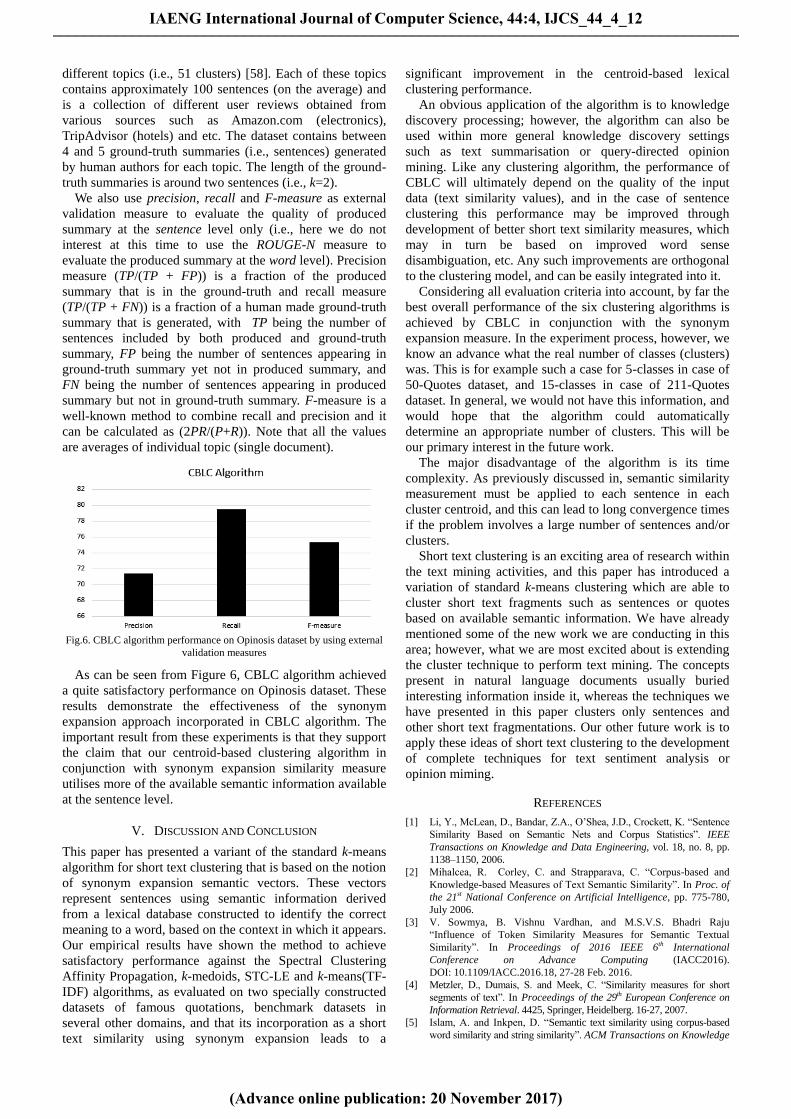
different topics (i.e., 51 clusters) [58]. Each of these topics
contains approximately 100 sentences (on the average) and
is a collection of different user reviews obtained from
various sources such as Amazon.com (electronics),
TripAdvisor (hotels) and etc. The dataset contains between
4 and 5 ground-truth summaries (i.e., sentences) generated
by human authors for each topic. The length of the ground-
truth summaries is around two sentences (i.e., k=2).
We also use precision, recall and F-measure as external
validation measure to evaluate the quality of produced
summary at the sentence level only (i.e., here we do not
interest at this time to use the ROUGE-N measure to
evaluate the produced summary at the word level). Precision
measure (TP/(TP + FP)) is a fraction of the produced
summary that is in the ground-truth and recall measure
(TP/(TP + FN)) is a fraction of a human made ground-truth
summary that is generated, with TP being the number of
sentences included by both produced and ground-truth
summary, FP being the number of sentences appearing in
ground-truth summary yet not in produced summary, and
FN being the number of sentences appearing in produced
summary but not in ground-truth summary. F-measure is a
well-known method to combine recall and precision and it
can be calculated as (2PR/(P+R)). Note that all the values
are averages of individual topic (single document).
Fig.6. CBLC algorithm performance on Opinosis dataset by using external
validation measures
As can be seen from Figure 6, CBLC algorithm achieved
a quite satisfactory performance on Opinosis dataset. These
results demonstrate the effectiveness of the synonym
expansion approach incorporated in CBLC algorithm. The
important result from these experiments is that they support
the claim that our centroid-based clustering algorithm in
conjunction with synonym expansion similarity measure
utilises more of the available semantic information available
at the sentence level.
V. DISCUSSION AND CONCLUSION
This paper has presented a variant of the standard k-means
algorithm for short text clustering that is based on the notion
of synonym expansion semantic vectors. These vectors
represent sentences using semantic information derived
from a lexical database constructed to identify the correct
meaning to a word, based on the context in which it appears.
Our empirical results have shown the method to achieve
satisfactory performance against the Spectral Clustering
Affinity Propagation, k-medoids, STC-LE and k-means(TF-
IDF) algorithms, as evaluated on two specially constructed
datasets of famous quotations, benchmark datasets in
several other domains, and that its incorporation as a short
text similarity using synonym expansion leads to a
significant improvement in the centroid-based lexical
clustering performance.
An obvious application of the algorithm is to knowledge
discovery processing; however, the algorithm can also be
used within more general knowledge discovery settings
such as text summarisation or query-directed opinion
mining. Like any clustering algorithm, the performance of
CBLC will ultimately depend on the quality of the input
data (text similarity values), and in the case of sentence
clustering this performance may be improved through
development of better short text similarity measures, which
may in turn be based on improved word sense
disambiguation, etc. Any such improvements are orthogonal
to the clustering model, and can be easily integrated into it.
Considering all evaluation criteria into account, by far the
best overall performance of the six clustering algorithms is
achieved by CBLC in conjunction with the synonym
expansion measure. In the experiment process, however, we
know an advance what the real number of classes (clusters)
was. This is for example such a case for 5-classes in case of
50-Quotes dataset, and 15-classes in case of 211-Quotes
dataset. In general, we would not have this information, and
would hope that the algorithm could automatically
determine an appropriate number of clusters. This will be
our primary interest in the future work.
The major disadvantage of the algorithm is its time
complexity. As previously discussed in, semantic similarity
measurement must be applied to each sentence in each
cluster centroid, and this can lead to long convergence times
if the problem involves a large number of sentences and/or
clusters.
Short text clustering is an exciting area of research within
the text mining activities, and this paper has introduced a
variation of standard k-means clustering which are able to
cluster short text fragments such as sentences or quotes
based on available semantic information. We have already
mentioned some of the new work we are conducting in this
area; however, what we are most excited about is extending
the cluster technique to perform text mining. The concepts
present in natural language documents usually buried
interesting information inside it, whereas the techniques we
have presented in this paper clusters only sentences and
other short text fragmentations. Our other future work is to
apply these ideas of short text clustering to the development
of complete techniques for text sentiment analysis or
opinion miming.
REFERENCES
[1] Li, Y., McLean, D., Bandar, Z.A., O’Shea, J.D., Crockett, K. “Sentence
Similarity Based on Semantic Nets and Corpus Statistics”. IEEE
Transactions on Knowledge and Data Engineering, vol. 18, no. 8, pp.
1138–1150, 2006.
[2] Mihalcea, R. Corley, C. and Strapparava, C. “Corpus-based and
Knowledge-based Measures of Text Semantic Similarity”. In Proc. of
the 21st National Conference on Artificial Intelligence, pp. 775-780,
July 2006.
[3] V. Sowmya, B. Vishnu Vardhan, and M.S.V.S. Bhadri Raju
“Influence of Token Similarity Measures for Semantic Textual
Similarity”. In Proceedings of 2016 IEEE 6th International
Conference on Advance Computing (IACC2016).
DOI: 10.1109/IACC.2016.18, 27-28 Feb. 2016.
[4] Metzler, D., Dumais, S. and Meek, C. “Similarity measures for short
segments of text”. In Proceedings of the 29th European Conference on
Information Retrieval. 4425, Springer, Heidelberg. 16-27, 2007.
[5] Islam, A. and Inkpen, D. “Semantic text similarity using corpus-based
word similarity and string similarity”. ACM Transactions on Knowledge
IAENG International Journal of Computer Science, 44:4, IJCS_44_4_12
(Advance online publication: 20 November 2017)
______________________________________________________________________________________
Discovery from Data (TKDD). vol. 2, no. 2, pp. 1-25, 2008.
[6] Feng, J., Zhou, Y.-M. and Martin, T. “Sentence similarity based on
relevance”. In Proceedings of the IPMU’08. 832-839, 2008.
[7] Ramage, D., Rafferty, A., Manning, C.” Random walks for text semantic
similarity”. In Proceedings of ACL-IJCNLP 2009. 23-31, 2009.
[8] Achananuparp, P., Hu, X., and Yang, C. “Addressing the variability
of natural language expression in sentence similarity with semantic
structure of the sentences”. In Proceedings of PAKDD 2009.
Bangkok. 548-555, 2009.
[9] Ho, C., Murad, M. A. A., Kadir, R. A., and Doraisamy, S. C. “Word
sense disambiguation-based sentence similarity”. In Proceedings of
the 23rd International Conference on Computational Linguistics:
Posters, COLING ’10, pages 418–426, Stroudsburg, PA, USA.
Association for Computational Linguistics, 2010.
[10] Abdalgader, K., and Skabar, A. “Short-Text Similarity Measurement
Using Word Sense Disambiguation and Synonym Expansion”. In
Proceedings of the 23rd Australasian Joint Conference on Artificial
Intelligence. (AI2010, Adelaide, Australia). vol. LNAI 6464, pp. 435-
444, 2011.
[11] Liu H and Wang P. “Assessing Sentence Similarity Using WordNet
based Word Similarity”. Journal of Software, Vol. 8, No. 6, June
2013.
[12] Zhu T T and Lan M. “ECNUCS: Measuring Short Text Semantic
Equivalence Using Multiple Similarity Measurements”. Second Joint
Conference on Lexical and Computational Semantics (SEM), Volume
1: Proceedings of the Main Conference and the Shared Task, pages
124–131, Atlanta, Georgia, June 13-14, 2013.
[13] Kenter T and Rijke D M. “Short text similarity with word
embeddings”. In Proceedings of the 24th ACM international
conference on information and knowledge management. In CIKM
’15. ACM, 2015.
[14] Wang, D., Li, T., Zhu, S. and Ding, C. “Multi-Document
Summarization via Sentence-Level Semantic Analysis and Symmetric
Matrix Factorization”. In Proceedings of the 31st Annual International
ACM SIGIR Conference on Research and Development in
Information Retrieval. pp. 307-314, 2008.
[15] Salton, G. Automatic text processing: The transformation, analysis, and
retrieval of information by computer. Addison-Wesley, Reading, Mass,
1989.
[16] Fellbaum, C., Ed. “WordNet: An Electronic Lexical Database”. MIT
Press, Cambridge, MA, 1998.
[17] Abdalgader, K., and Skabar, A. “Unsupervised Similarity-Based
Word Sense Disambiguation using Context Vectors and Sentential
Word Importance”. ACM Transactions on Speech and Language
Processing (TSLP). vo. 9, no 2, 2012.
[18] Chen, F., Han, K. and Chen, G. “An Approach to sentence selection
based text summarization”. In Proceedings of IEEE TENCON02. pp.
489-493, 2008.
[19] Kyoomarsi, F., Khosravi, H., Eslami, E., Dehkordy, P.K and
Tajoddin, A. “Optimizing text summarization based on fuzzy logic”.
Seventh IEEE/ACIS International Conference on Computer and
Information Science, IEEE Computer Society. pp. 347-352, 2008.
[20] Radev, D.R. Jing, H. Stys, M. Tam, D. “Centroid-Based
Summarization of Multiple Documents”. Information Processing
and Management: AN International Journal. vol. 40, pp. 919-938,
2004.
[21] Aliguyev, R.M. “A New Sentence Similarity Measure and Sentence
Based Extractive Technique for Automatic Text Summarization”. Expert
Systems with Applications. vol. 36, pp. 7764-7772, 2009.
[22] Hotho, A., Nürnberger, A. and Paaß, G. “A brief survey of text
mining”. GLDV-Journal for Computational Linguistics and
Language Technology. vol. 20, pp. 19-62, 2005.
[23] Kosala, R. Blockeel, H. “Web Mining Research: A Survey”. ACM
SIGKDD Explorations Newsletter. vol. 2, no. 1, pp. 1-15, 2000.
[24] Skabar, A. and Abdalgader, K. “Clustering sentence-level text using a
novel fuzzy relational clustering algorithm”. IEEE Transactions on
Knowledge and Data Engineering (TKDE). IEEE computer Society
Digital Library. vol. 25, no. 1, pp. 62-75, 2013.
[25] Kaufman, L. and Rousseeuw, P.J. “Clustering by means of
medoids”. Statistical Analysis based on the L1 Norm, Y. Godge, eds.,
North Holland/Elsevier. Amsterdam, pp. 405-416, 1987.
[26] Kaufman, L. and Rousseeuw, P.J. “Finding groups in data”. Wiley, 1990.
[27] Krishnapuram, R. Joshi, A. Liyu, Y. “A Fuzzy Relative of the k-
Medoids Algorithm with Application to Web Document and Snippet
Clustering”. In Proceedings of the IEEE Fuzzy Systems Conference.
pp. 1281-1286, 1999.
[28] Geweniger, T., Zühlke, D., Hammer, B. and Villmann, T. “Fuzzy
Variant of Affinity Propagation in Comparison to Median Fuzzy c-
Means”. In Proceedings of the 7th international Workshop on
Advances in Self-Organizing Maps. Springer-Verlag, Berlin,
Heidelberg. pp. 72-79, 2009.
[29] Geweniger, T. Zühlke, D., Hammer, B. and Villmann, T. “Median
Fuzzy C-Means for Clustering Dissimilarity Data”.
Neurocomputing, vol. 73, no. 7-9, pp. 1109-1116, 2010.
[30] Frey, B.J. and Dueck, D. “Clustering by Passing Messages between
Data Points”. Science, vol. 315, pp. 972-976, 2007.
[31] Ng, A.Y., Jordan, M.I. and Weiss, Y. “On Spectral Clustering:
Analysis and an Algorithm”. Advances in Neural Information
Processing Systems, pp. 849-856, 2001.
[32] Luxburg, U.V. “A Tutorial on Spectral Clustering”. Statistics and
Computing. vol.17, no. 4, pp. 395-416, 2007, 2007.
[33] Brin, S. and Page, L. “The Anatomy of a Large-Scale Hypertextual
Web Search Engine”. Computer Networks and ISDN Systems. vol. 30.
pp. 107-117, 1998.
[34] Erkan, G. and Radev, D.R. “LexRank: Graph-Based Lexical
Centrality as Salience in Text Summarization”. Journal of Art. Int.
Research. vol. 22, pp. 457-479, 2004.
[35] Mihalcea, R. and Tarau, P. “TextRank: Bringing Order into Texts”.
In Proceedings of EMNLP. pp. 404–411, 2004.
[36] Namburu, S.M., Tu, H., Luo, J., and Pattipati, K.R. “Experiments
on supervised learning algorithms for text categorization”. IEEE
Aerospace Conference. Big Sky, MT, 2005.
[37] Hatzivassiloglou, V., Klavans, J. L., Holcombe, M. L., Barzilay, R.,
Kan, M.-Y. and McKeown, K. R. “SIMFINDER: A flexible
clustering tool for summarization”. In NAACL Workshop on
Automatic Summarization. Association for Computational
Linguistics. 41-49, 2001.
[38] Vidhya, K. A. and Aghila, G. G. “Text Mining Process, Techniques
and Tools: an Overview”. International Journal of Information
Technology and Knowledge Management. vol. 2, no. 2. pp. 613-622,
2010.
[39] Abdalgader, K., ‘Text-Fragment Similarity Measurement using Word
Sense Identification.’ International Journal of Applied Engineering
Research. vol. 11, no. 24, pp. 11755-11762, 2016.
[40] Bates, M. “Subject access in online catalogue: a design model”.
Journal of the American Society for Information Science. vol.37. no.
6. pp. 357-376, 1986.
[41] Jiang, J.J. and Conrath, D.W. “Semantic Similarity Based on Corpus
Statistics and Lexical Taxonomy”. In Proceedings of the 10th
International Conference on Research in Computational Linguistics.
pp. 19-33, 1997.
[42] MacQueen, J.B. “Some Methods for Classification and Analysis of
Multivariate Observations”. In Proceedings of 5th Berkeley
Symposium on Mathematical Statistics and Probability. pp. 281-
297, 1967.
[43] Abdalgader, K. “Computational linguistic techniques for sentence-
level text processing”. PhD Dissertation, Department of Computer
Engineering and Computer Science, La Trobe University, 2011.
[44] Philips S, Pitton J and Atlas L. “Perceptual Feature Identification for
Active Sonar Echoes”. Proceedings of IEEE OCEANS Conference,
2006.
[45] Hofmann T. and Buhmann J. M. “Pairwise Data Clustering by
Deterministic Annealing”. IEEE Transactions on Pattern Analysis
and Machine Intelligence, vol. 19, no. 1, pp. 1–14, 1997.
[46] A. Asuncion and DJ. Newman, UCI machine learning repository
[http://www.ics.uci.edu/~mlearn/MLRepository.html]. Irvine, CA:
University of California, Department of Information and Computer
Science.
[47] Chen Y., Garcia E.K., Gupta M.R., Rahimi, A. and Cazzanti L.
“Similarity-based Classification: Concepts and Algorithms”. Journal
of Machine Learning Research, vol. 10, pp. 747-776, 2009.
[48] Manning, C.D., Raghavan, P. and Schütze, H. “Introduction to
Information Retrieval”. Cambridge University Press, Cambridge,
2008.
[49] Rosenberg, A., Hirschberg, J. “V-Measure: A conditional entropy-
based external cluster evaluation measure”. In Proceedings of the
EMNLP 2007. pp. 410-420, 2007.
[50] Skabar, A. and Abdalgader, K. “Improving sentence similarity
measurement by incorporating sentential word importance”. In
Proceedings of the 23rd Australasian Joint Conference on Artificial
Intelligence. (AI2010, Adelaide, Australia). vol LNAI 6464, pp. 466-
475, 2011.
[51] Abdalgader, K. “Word Sense Identification Improves the
Measurement of Short-Text Similarity”. In Proceedings of the
International Conference on Computing Technology and Information
IAENG International Journal of Computer Science, 44:4, IJCS_44_4_12
(Advance online publication: 20 November 2017)
______________________________________________________________________________________
Management (ICCTIM2014), Dubai, UAE, Digital Library of
SDIWC, ISBN: 978-0-9891305-5-4, pages 233-243, 2014.
[52] R. Navigli and S. Ponzetto. BabelNet: The Automatic Construction,
Evaluation and Application of a Wide-Coverage Multilingual
Semantic Network. Artificial Intelligence, 193, Elsevier, pp. 217-
250, 2012.
[53] Xu J, Xu B, Wang P, Zheng S, Tian G, Zhao J. “Self-taught
convolutional neural networks for short text clustering”. Neural
Netw vol. 30, no. 2. pp. 117–131, 2017.
[54] M. Belkin, P. Niyogi, “Laplacian eigenmaps and spectral
techniques for embedding and clustering”., in: Advances in Neural
Information Processing Systems, Vol. 14, pp. 585-591, 2001.
[55] K. Wagsta_, C. Cardie, S. Rogers, S. Schrodl, et al., “Constrained
k-means clustering with background knowledge”, in: ICML, Vol. 1,
pp. 577-584, 2001.
[56] X.-H. Phan, L.-M. Nguyen, S. Horiguchi, “Learning to classify
short and sparse text & web with hidden topics from large-scale
data collections”, in: Proceedings of the 17th international
conference on World Wide Web, ACM, pp. 91-100, 2008.
[57] Fang, C., Mu, D., Deng, Z., and Wu, Z., “Word-sentence co-
ranking for automatic extractive text summarization”, Expert
Systems with Applications, Vol. 72, pp. 189-195, 2017.
[58] Ganesan, K. A., C. X. Zhai, and J. Han, "Opinosis: A Graph Based
Approach to Abstractive Summarization of Highly Redundant
Opinions", Proceedings of the 23rd International Conference on
Computational Linguistics (COLING '10), 2010.
IAENG International Journal of Computer Science, 44:4, IJCS_44_4_12
(Advance online publication: 20 November 2017)
______________________________________________________________________________________