Clustering Images Using the Latent Dirichlet Allocation...
18
Clustering Images Using the Latent Dirichlet Allocation Model Pradheep K Elango and Karthik Jayaraman Computer Sciences Department University of Wisconsin, Madison Dec 2005 Abstract Clustering, in simple words, is grouping similar data items together. In the text domain, clustering is largely popular and fairly successful. In this work, we try and apply clustering methods that are used in the text domain, to the image domain. Two major challenges in this approach are image representation and vocabulary definition. We apply the bag-of-words model to images using image segments as words. We use the Latent Dirichlet Allocation (LDA) to model the relationships be- tween “words” of an image, and between images. This provides us with a highly compressed yet succinct representation of an image, which can be further used for various applications like image clustering, image retrieval and image relevance ranking. In this work, we have used the relationships obtained from LDA to cluster the images with 78% success. 1 Introduction With the advent of the World Wide Web, and proliferation of digital cameras, images have become more and more common in our world. Large image collections are com- 1
-
Upload
truonghuong -
Category
Documents
-
view
225 -
download
0
Transcript of Clustering Images Using the Latent Dirichlet Allocation...

Clustering Images Using the Latent Dirichlet
Allocation Model
Pradheep K Elango and Karthik Jayaraman
Computer Sciences Department
University of Wisconsin, Madison
Dec 2005
Abstract
Clustering, in simple words, is grouping similar data itemstogether. In the text
domain, clustering is largely popular and fairly successful. In this work, we try and
apply clustering methods that are used in the text domain, tothe image domain.
Two major challenges in this approach are image representation and vocabulary
definition. We apply the bag-of-words model to images using image segments as
words.
We use the Latent Dirichlet Allocation (LDA) to model the relationships be-
tween “words” of an image, and between images. This providesus with a highly
compressed yet succinct representation of an image, which can be further used for
various applications like image clustering, image retrieval and image relevance
ranking. In this work, we have used the relationships obtained from LDA to cluster
the images with 78% success.
1 Introduction
With the advent of the World Wide Web, and proliferation of digital cameras, images
have become more and more common in our world. Large image collections are com-
1

mon place, and the capability to automatically organize such large collections is badly
needed.
Text retrieval methods using the vector-space model have been fairly successful.
Using statistical models, typically, one can search large text collections using text
matching and relevance algorithms, cluster large collections of text, and use machine
learning and data mining techniques.
Of late, there has been a surge of interest in applying similar techniques [17, 4,
14, 9, 15, 6, 11, 16] to the computer vision field. In this project, we explore how
one can apply such methods to images, discuss important issues and present results
from our implementation of an application. Specifically, westudy how images can be
represented in the vector space model, how an underlying model can be learnt given a
large number of images and how this model can be applied to do interesting inferences.
In simple terms, clustering means to group similar items together. One can thus
use clustering to organize large collections - library collection of images, web image
search results, large photo collections or any collection.Clustering can be used to
assist browsing. Browsing tools complement search tools. Recently clustering has
been applied to identifying object categories. We want to form clusters of images that
are similar - similar in semantics as well as similar in visual appearance. Clustering
is useful to infer characteristics of a collection; traditionally, this is called exploratory
data analysis.
The major difficulty in applying such techniques lies in building appropriate repre-
sentations of images. Preparing a compact description of images by hand is laborious
especially since image collections are huge. Further, accuracy and consistency might
be offset by subjectivity. Moreover, there is the chance that descriptions may have to be
changed in order to keep up with new trends and hence the need for bulding appropriate
image representations automatically.
Determining the right representation depends on the application, and the input col-
lection. Color histograms will work well if there is a large collection of a variety of
images to be categorized. If the image collection contain faces of a single person, then
the right image representation should take care of pose, illumination, luminance, etc.
If the data collection is large, and the task is to infer general categories or topics, then
2

the vector space model might be appropriate.
In this project, we represent an image as a bag of words, whereeach word is a
segment. We have used the LDA model to learn inter-segment and inter-image rela-
tionships. We used the learned model to cluster images with 78% success.
The rest of the paper is structured as follows. Section 2 discusses issues of image
representation in great detail. This is followed by a description of popular generative
probabilistic models in Section 3. In Section 4 we explain how LDA is used as the
underlying model to cluster images and in Section 5 we present the results. Section 6
describes other works in related areas and we conclude in Section 7.
2 Image Representation
Since we are trying to apply techniques used in the text domain to images, the most
important issue that we have to address is how to define an analogue of words in the
image domain.
2.1 Defining an analogy
We need to define what words and documents are, with respect toan image. Fixing one
of them partially restricts the choice for the other. For choosing an image-word, there
are various design choices. An image word can be
• a pixel,
• a window of pixels,
• a segment of an image, or
• the image itself.
The choice for the analogue of a word, decides the vocabularyand also the analogue for
a document. For instance, if an image-word is a pixel, then the image-document could
be a segment of the image, in which case the feature vector forthe image document
would simply be the histrogram of the segment. But this wouldpreclude us from
3

Figure 1: Example #1 of a word.The leftmost part shows a sample segment. The middle partshows the position of the segment in relation to the image andremaining part show the featurevector.
defining relationships among images because images would then be at one level of
abstraction higher than the image-document and thus cannotbe modeled. Instead, if
we chose the entire image to be the document then the feature vector for the document
would be the image histogram. This does not help us capture relationships among
different parts of an image.
Keeping in mind the issues discussed above, for our purposes, we define a word to
be a segment of the image. To segment the images, we use theN -cuts algorithm. We
over-segment the image slightly so that we get segments thatare almost homogeneous
throughout.
Figures 1 and 2 show two examples of words that we use as “words”. The leftmost
part of the image shows just the segment. The center part of the image shows the
position of the segment with respect to the original image and the part of the figure on
the right shows the feature vector histogram.
2.2 Defining the vocabulary
Once we have defined what a word is, we need to define a vocabulary. With respect
to text, it is very simple to define a vocabulary. The vocabulary is simply the set of
4

Figure 2: Example #2 of a word.The leftmost part shows a sample segment. The middle partshows the position of the segment in relation to the image andremaining part show the featurevector.
all words in the language. Even with an image, if a word is defined as a pixel, the
vocabulary would be the set of all intesity values viz.,0 to 255. But when a segment
is used as a word, it is not possible to define the vocabulary asbeing the set of all
possible segments of images, because it could be intractably large. This is because,
the number of possible segments is exponentially large and further the values in the
feature vectors could be real numbers and hence infinitely many. So, to reduce the size
of the vocabulary, we cluster the entire set of image segments. Once all the segments
are clustered, then any two segments within the same clusterare considered equivalent.
Comparing with the text domain, this would be similar to grouping all the synonyms
in a language together and choosing one representative to represent the entire cluster
of synonyms.
As an example, if the words shown in figures 1 and 2 were clustered into the same
group, then these two words will be considered equivalent.
2.3 Selecting the feature set
To cluster the segments together we need to define a set of features for a segment,
so that they can be compared to one another. The importance ofchoosing the right
5
feature set cannot be over-stressed. The set of features computed for each segment is
highly significant since it defines the elements of a cluster and hence the vocabulary
and consequently influences the discovery of topics by the probabilistic model. For
each segment, we compute the following properties:
• Color histogram
• Gradient histogram
• Texture properties like energy, correlation, homogeneity, contrast, etc.
The color histogram gives a measure of different componentsof red, green and blue
in the segment. The gradient histogram gives an idea of uniformity of the segment.
Properties like energy and correlation are computed using the gray-level co-occurrence
matrix and hence give a measure of relative positions of pixels in the segment. This may
not be the best set of features, but again choosing the right features for any application
is a difficult problem.
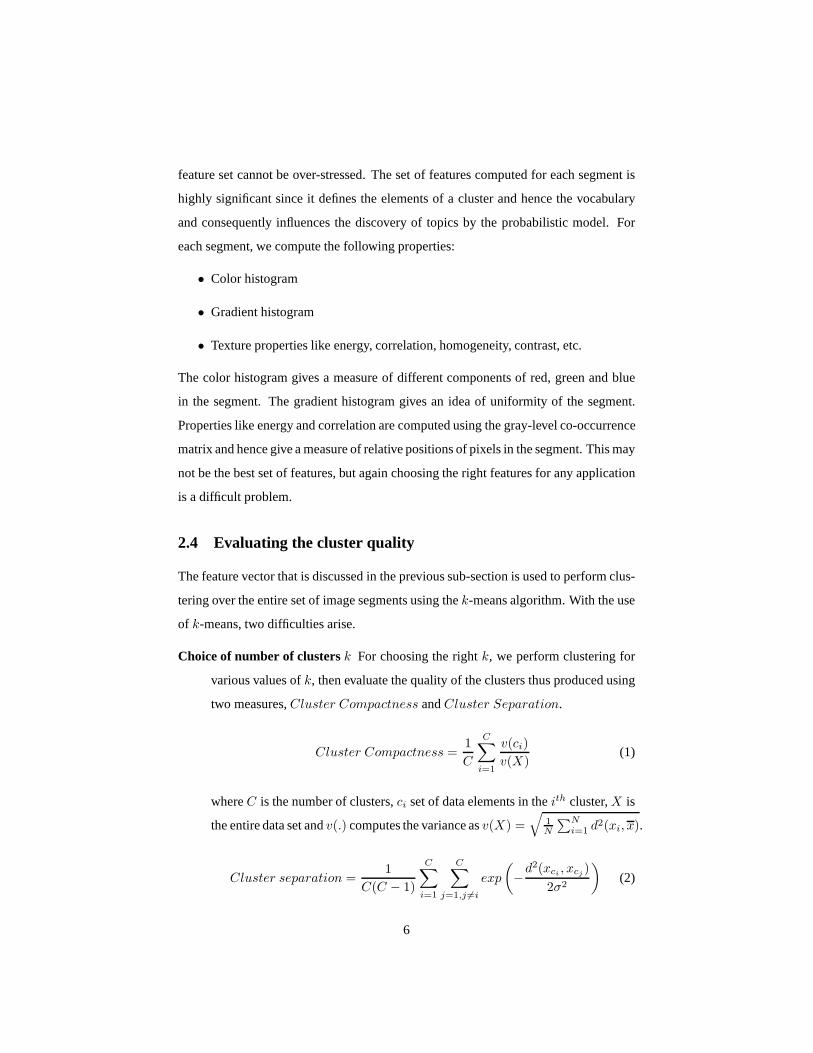
2.4 Evaluating the cluster quality
The feature vector that is discussed in the previous sub-section is used to perform clus-
tering over the entire set of image segments using thek-means algorithm. With the use
of k-means, two difficulties arise.
Choice of number of clustersk For choosing the rightk, we perform clustering for
various values ofk, then evaluate the quality of the clusters thus produced using
two measures,Cluster Compactness andCluster Separation.
Cluster Compactness =1
C
C∑
i=1
v(ci)
v(X)(1)
whereC is the number of clusters,ci set of data elements in theith cluster,X is
the entire data set andv(.) computes the variance asv(X) =√
1
N
∑N
i=1d2(xi, x).
Cluster separation =1
C(C − 1)
C∑
i=1
C∑
j=1,j 6=i
exp
(
−d2(xci
, xcj)
2σ2
)
(2)
6

wherexciis the centroid of the clusterci andd() is the distance metric used by
the clustering system. Cluster compactness gives a notion of how close to each
other the elements of a cluster are and cluster separation gives an idea of how far
to each other the cluster centers are.
After evaluating the clusters produced by different numberof clusters, we choose
ak having desired values of compactness and separation.
Choice of a distance function for comparing feature vectorsThe feature vectors can
be compared using the cosine distance measurement, manhattan distance or eu-
clidean distance.
Once the segments are clustered, then each image in the inputdata set can be rep-
resented as a vector of word frequencies, i.e. how many timesa segment belonging to
a cluster occurs in an image. This can be used as the input for the LDA system.
3 Generative Models
Once we have built appropriate representations of images, we have to build a mech-
anism to learn the underlying properties of the data and drawuseful generalizations.
Current approaches can be broadly classified as: generativeand discriminative. In
generative modeling, we learn the model of the source that generated the data. In dis-
criminative approaches, one directly optimizes the training set with the desired output.
In this project, we look at a recent generative model called Latent Dirichlet Alloca-
tion, and explore how we can apply it to to images. Generativeprobabilistic models are
random sources that can generate infinite sequences of samples according to a prob-
ability distribution. The goal is to construct a probabilistic model that can effectively
generalize.
Gaussian mixture models for representing images are a popular model. In this
model, images are considered to be generated by a mixture of topics, where each topic
is represented by a gaussian distribution with a mean and a variance. The parameters
for the distribution are estimated with an EM algorithm.
7

Language models model the words that occur in a document. We are interested
in the probability of a sequence of words. In our terminology, a word is a region with
uniform properties; for example, a word could be a 5-by-5 block with a uniform texture
and a bluish appearance.
The simplest model is the unigram model, where the probability of each of the
word is independent of the words that have already occurred in the document. This
model consists of a single probability distributionU over an entire vocabularyV . In
other words, it is a vector of probabilities,U(v) for each wordv in the vocabulary.
The basic generative process consists of randomly pulling out a word from a bag,
observing its value and putting it back into the bag. The probability of observing a
sequence,w1w2w3 . . . wn is therefore:
Puni(w1w2w3 . . . wn) =n∏
i=1
U(wi) (3)
The drawback with the unigram model is that it can model only homogeneous
collections; that is, it considers all documents to be consisting of a single topic, which
is essentially reperesented as the probability distribution,U . This is a serious problem
with images, because typically images consist of at least a foreground and background,
which would come from a markedly different set of distributions. Further, images could
have multiple objects, each of which might have a distinctive distribution.
In order to take care of heterogeneity of collections, the mixture model can be used.
In this generative process, we first pick a topic,z, according to a probability distribu-
tion, T , and once a topic is chosen, we choose words from the topic according to the
distribution corresponding to thezth topic. The probability of observing a sequence,
w1w2w3 . . . wn in this model is:
Pmix(w1w2w3 . . . wn) =
k∑
z=1
T (z)
n∏
i=1
Uz(wi) (4)
There are two problems with the mixture model: a) we should estimate the right
number of topics empirically, and b) though it models heterogeneity in collections,
it still considers each image to be homogeneous. Since this is particularly untrue of
8

images, we need a better model.
The Probabilistic Latent Semantic Indexing approach improves upon this model. In
this model, for each word that we generate we pick a topic according to a distribution,
T , that depends on the document. This distribution determines the mixture of topics
for that particular document. Each topic, in turn, has a probability distribution, based
on which the words are generated. The probability of observing a sequence,w =
w1w2w3 . . . wn in this model is:
Pplsi(w1w2w3 . . . wn) =n∏
i=1
(
k∑
z=1
Tw(z)U(wi)
)
(5)
Since the mixing ratios of the topics for each document depends on the document
itself, PLSI suffers from over-fitting as well as inappropriate generative semantics.
To improve upon this, the Latent Dirichlet Allocation modelintroduces a distri-
bution for the mixing distribution itself. That is, any mixing distribution,T (z), comes
from an underlying distribution thereby expressing uncertainty over a particularπ(.) as
pk(π(.)), wherepk is defined over allπ ∈ Pk, the set of all possible(k−1)-simplexes.
In this model, the Dirichlet distribution models the uncertainty. So, the generative
process in this model is:
1. Pick a mixing distributionπ(.) from Pk with probabilitypk(π)
2. For each word
(a) Pick a topicz with probabilityπ(z).
(b) Pick a wordwi from the topicz with probabilityTz(wi)
The probability of observing a sequence,w1w2w3 . . . wn in this model is:
Plda(w1w2w3 . . . wn) =
∫
Pk
{
n∏
i=1
k∑
z=1
π(z)Tz(wi)
}
pk(π)dπ (6)
where
pk(π) = Γ
(
k∑
z=1
αz
)
k∏
z=1
π(z)αz−1
Γ(αz)(7)
9

is the Dirichlet distribution with parametersα1 . . . αk The number of parameters
to estimate in this model isk parameters for the Dirichlet distribution and|V | − 1
parameters for each of thek topic models. The estimation of paramaters is done by
variational inference algorithms.
4 Using LDA
In the text domain, LDA needs input about the documents in theform of a word fre-
quency vector. Following our analogy, we represent each image by the vector of seg-
ment cluster frequencies. From among these images, LDA discovers topics and repre-
sents each topic as a simplex of image segment-clusters. Further, LDA also describes
each image as a simplex of these discovered topics. Thus LDA provides us with two
levels of information, we can get the relationship between the clusters of segments and
also between the images themselves. Depending on the numberof topics, this can be a
highly concise representation of an image, which can be usedfor a variety of applica-
tions like image clustering, image retrieval, relevance ranking, etc. We have used this
topic-simplex representation of the image to perform imageclustering.
4.1 Methodology
The entire process can be summarized as follows:
1. For each image, segment it into ’p’ segments.
2. For each such segment compute a set of features.
3. Once this is done for all the images, cluster the set of all segments using the
feature vector, to reduce the size of the vocabulary.
4. For each image, compute a frequecy representation of how many times a member
of a cluster of segments occurs in the image.
5. Feed this information as input to LDA.
6. Use the topic-simplex representation of the image to cluster the image data set.
10

Figure 3: A sample input data set.
5 Results
We present the results of an initial clustering experiment,in which we used only 22
images. In the N-cuts phase, we used 50 segments. Using our cluster quality anal-
ysis, we fixed the vocabulary size at 34. We used LDA with 5 topics to obtain the
topic-simplex representation for each image. We then clustered these images into 7
categories. For both the clustering phases, we used the cosine similarity measure as
our similarity metric.
Figure 3 shows a sample set of input images. The images mostlycontain pictures
of roses and ducks. Figure 4 shows the final results of our clustering. Since our fea-
tures are predominantly color-based, we see that the cluster in the top-left contains a
11

Figure 4: Clustered ouput of the sample data set.
rose along with the ducks because of similar color proportions. Similarly cluster in
the bottom right has both the roses and the ducks together because of similar texture
properties and similar color proportions. The other clusters show that the system works
well when lighting conditions are more or less similar.
We repeated our experiment with a larger data set containing434 images. The im-
ages were obtained from the CIRES image database. The imageswere spread over five
categories, viz., airplanes, bridges, coastline, ducks and roses. As before, we used 50
segments in the N-cuts phase. We fixed the vocabulary size at 60 based on our cluster
quality analysis. We used LDA with 20 topics to obtain the topic-simplex representa-
tion for each image. We clustered these images into 30 categories using the Manhattan
distance metric. Figures 5, 6 and 7 show some sample clusters.
12
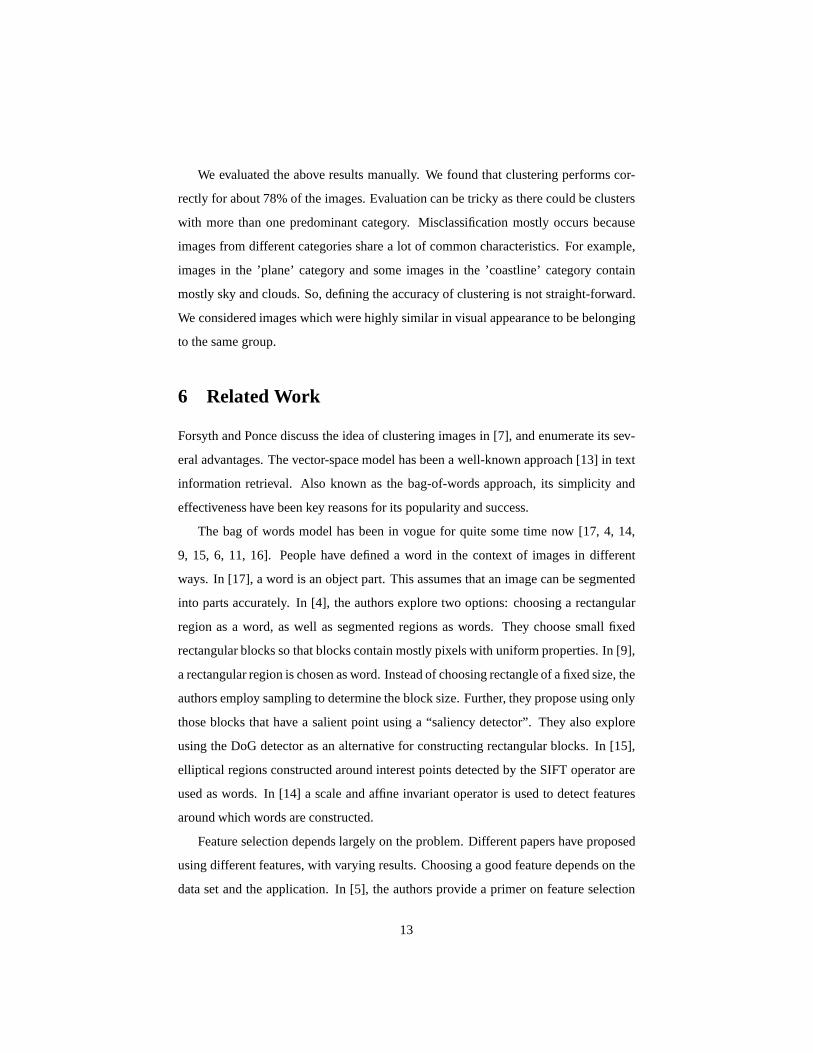
We evaluated the above results manually. We found that clustering performs cor-
rectly for about 78% of the images. Evaluation can be tricky as there could be clusters
with more than one predominant category. Misclassificationmostly occurs because
images from different categories share a lot of common characteristics. For example,
images in the ’plane’ category and some images in the ’coastline’ category contain
mostly sky and clouds. So, defining the accuracy of clustering is not straight-forward.
We considered images which were highly similar in visual appearance to be belonging
to the same group.
6 Related Work
Forsyth and Ponce discuss the idea of clustering images in [7], and enumerate its sev-
eral advantages. The vector-space model has been a well-known approach [13] in text
information retrieval. Also known as the bag-of-words approach, its simplicity and
effectiveness have been key reasons for its popularity and success.
The bag of words model has been in vogue for quite some time now[17, 4, 14,
9, 15, 6, 11, 16]. People have defined a word in the context of images in different
ways. In [17], a word is an object part. This assumes that an image can be segmented
into parts accurately. In [4], the authors explore two options: choosing a rectangular
region as a word, as well as segmented regions as words. They choose small fixed
rectangular blocks so that blocks contain mostly pixels with uniform properties. In [9],
a rectangular region is chosen as word. Instead of choosing rectangle of a fixed size, the
authors employ sampling to determine the block size. Further, they propose using only
those blocks that have a salient point using a “saliency detector”. They also explore
using the DoG detector as an alternative for constructing rectangular blocks. In [15],
elliptical regions constructed around interest points detected by the SIFT operator are
used as words. In [14] a scale and affine invariant operator isused to detect features
around which words are constructed.
Feature selection depends largely on the problem. Different papers have proposed
using different features, with varying results. Choosing agood feature depends on the
data set and the application. In [5], the authors provide a primer on feature selection
13

Figure 5: Cluster of RosesThe above figure shows a sample cluster out of 30 clusters. Aswe can see, the image of the coast appears in this cluster because it is highly similar to thebackground in the rose images.
and various features that can be computed. In [1], color histograms have been used as
the primary features, and they work very well when the task isto differentiate among a
set of indoor and outdoor images. Edge direction histogramshave been used in [12] to
14
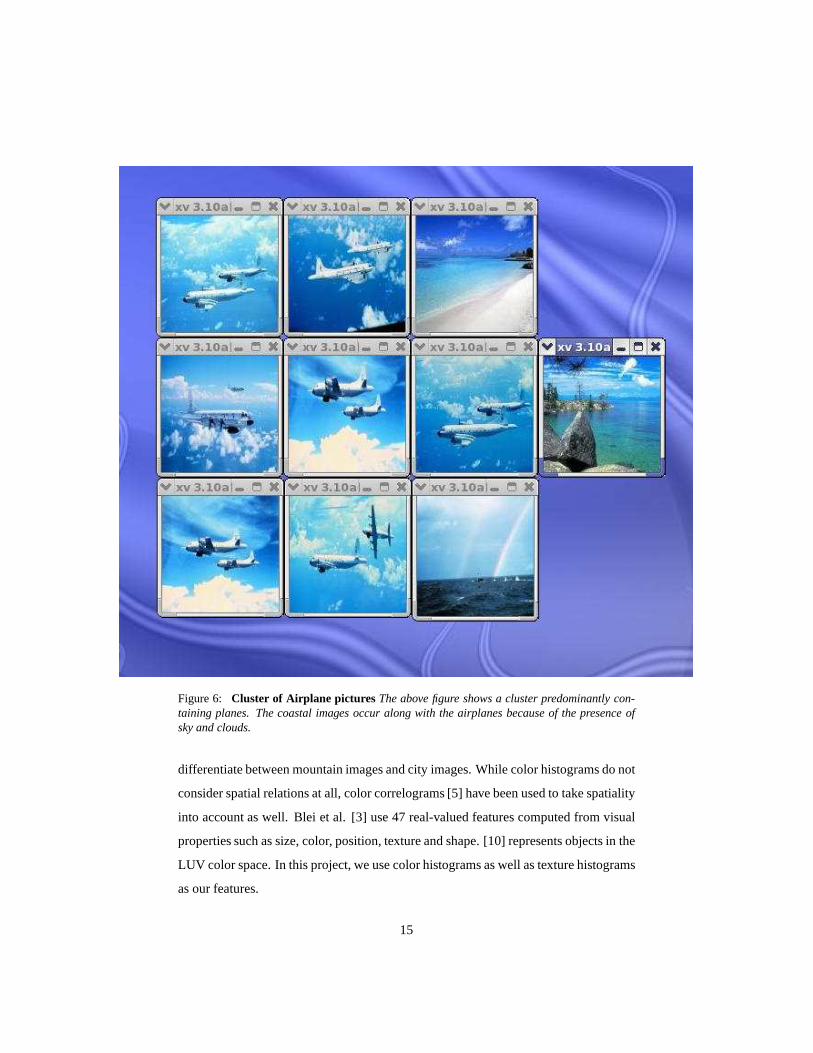
Figure 6: Cluster of Airplane pictures The above figure shows a cluster predominantly con-taining planes. The coastal images occur along with the airplanes because of the presence ofsky and clouds.
differentiate between mountain images and city images. While color histograms do not
consider spatial relations at all, color correlograms [5] have been used to take spatiality
into account as well. Blei et al. [3] use 47 real-valued features computed from visual
properties such as size, color, position, texture and shape. [10] represents objects in the
LUV color space. In this project, we use color histograms as well as texture histograms
as our features.
15

Figure 7: Cluster of Coastline picturesThe above figure shows a cluster containing coastlinepictures, which predominantly contains sky, water, trees and some land
Generative models owe their popularity to their elegance, and the generality of ap-
plications to which the learned model can be applied. [19] provides a good discussion
on how one can use generative models for images. [18] introduces different statistical
models, clearly explaining what each sophisticated model offers. Blei introduces the
Latent Dirichlet Allocation (LDA) Model in [3], and appliesthis model to matching
words and images in [2]. The LDA model has also been applied toimages in [15].
[9] extends the LDA model to support hierarchical modeling and applies it to images.
[17] uses a different generative model while [10] uses an enhanced HMM model to
16
auto-innotate images.
Clustering has been a popular choice to reduce the size of thevocabulary when
using the vector space model. [17] and [9] like several others use k-means clustering
for dimensionality reduction. [4] uses clustering as a means to segment images. In
order to determine the right number of clusters, [4] uses a stopping criterion. [8] uses
divisive clustering and uses Bayesian information criterion as a metric to determine
the right number of clusters. In this project, we used a linear combination of cluster
compactness and cluster separation as the metric to determine the right number of
clusters.
7 Conclusions
In this paper, we have applied the bag-of-words model to images. We explored dif-
ferent ways of defining the “word” in the context of an image, and used a segment as
produced by the N-cuts algorithm. We found that using smaller segments improved
results considerably, because smaller segments had more uniform properties.
We represented each segment mainly based on color histograms. To reduce the di-
mensionality of our vocabulary, we used the k-means algorithm. In order to determine
the right number of clusters, we evaluated cluster quality using cluster compactness
and cluster separation as the metrics. We experimented withthe cosine similarity mea-
sure and the Manhattan distance for clustering, and found that the Manhattan distance
yielded better results.
We used a generative probabilistic model, the Latent Dirichlet Allocation (LDA)
model to learn inter-segment relationships and inter-image relationships in anunsuper-
visedmanner. We found that the LDA model works better with larger data sizes.
We used the image representation from the LDA model to cluster a reasonably large
data set, and found that 78% of the images were clustered correctly.
17
Acknowledgements
We like to thank Prof.Charles Dyer for his encouragement andsupport throughout the
project. We also thank Prof.Jerry Zhu for introducing the LDA model to us and for the
numerous discussions.
References[1] A.Vailaya, M.A.T.Figueiredo, A.K.Jain, and H.-J.Zhang. Image classification for content-based index-
ing. In IEEE Transactions on Image Processing, volume 10, pages 117–130, 2001.[2] K. Barnard, P. Duygulu, D. Forsyth, N. de Freitas, D. M. Blei, and M. I. Jordan. Matching words and
pictures.J. Mach. Learn. Res., 3:1107–1135, 2003.[3] D. M. Blei and M. I. Jordan. Modeling annotated data. InSIGIR ’03: Proceedings of the 26th annual
international ACM SIGIR conference on Research and development in informaion retrieval, pages127–134, New York, NY, USA, 2003. ACM Press.
[4] Y. Chen and J. Z. Wang. Image categorization by learning and reasoning with regions.J. Mach. Learn.Res., 5:913–939, 2004.
[5] T. Deselaers, D. Keysers, and H. Ney. Features for image retrieval: A quantitative comparison. InLecture Notes in Computer Science, volume 3175, pages 228 – 236. Springer, Jan 2004.
[6] R. Fergus, L. Fei-Fei, P. Perona, and A. Zisserman. Learning object categories from google’s imagesearch. InICCV ’05: Proceedings of the Tenth IEEE International Conference on Computer Vision(ICCV’05) Volume 2, pages 1816–1823, Washington, DC, USA, 2005. IEEE ComputerSociety.
[7] D. A. Forsyth and J. Ponce.Computer Vision: A Modern Approach.Prentice Hall PTR, 2002.[8] G.Csurka, C.Bray, C.Dance, and L.Fan. Visual categorization with bags of keypoints. InIn Workshop
on Statistical Learning in Computer Vision, pages 1–22, 2004.[9] F.-F. Li and P. Perona. A bayesian hierarchical model forlearning natural scene categories. InCVPR
’05: Proceedings of the 2005 IEEE Computer Society Conference on Computer Vision and PatternRecognition (CVPR’05) - Volume 2, pages 524–531, Washington, DC, USA, 2005. IEEE ComputerSociety.
[10] J. Li and J. Z. Wang. Automatic linguistic indexing of pictures by a statistical modeling approach.IEEE Trans. Pattern Anal. Mach. Intell., 25(9):1075–1088, 2003.
[11] A. T. Li Fei-Fei, Rob Fergus. Recognizing and learning object categories.http://people.csail.mit.edu/fergus/iccv2005/bagwords.html.
[12] M.Szummer and R.W.Picard. Indoor-outdoor image classification. InIEEE Int’l Workshop on Content-Based Access of Image and Video Databases, pages 42–51, 1998.
[13] G. Salton and M. J. McGill.Introduction to Modern Information Retrieval. McGraw-Hill, Inc., NewYork, NY, USA, 1986.
[14] F. Schaffalitzky and A. Zisserman. Multi-view matching for unordered image sets, or “How do Iorganize my holiday snaps?”. InProceedings of the 7th European Conference on Computer Vision,Copenhagen, Denmark, volume 1, pages 414–431, 2002.
[15] J. Sivic, B. C. Russell, A. A. Efros, A. Zisserman, and W.T. Freeman.Discovering object categoriesin image collections.AIM-2005-005, Massachusetts Institute of Technology, February 2005.
[16] M. Srikanth, J. Varner, M. Bowden, and D. Moldovan. Exploiting ontologies for automatic imageannotation. InSIGIR ’05: Proceedings of the 28th annual international ACMSIGIR conference onResearch and development in information retrieval, pages 552–558, New York, NY, USA, 2005. ACMPress.
[17] E. B. Sudderth, A. Torralba, W. T. Freeman, and A. S. Willsky. Learning hierarchical models of scenes,objects, and parts. InICCV ’05: Proceedings of the Tenth IEEE International Conference on ComputerVision (ICCV’05) Volume 2, pages 1331–1338, Washington, DC, USA, 2005. IEEE ComputerSociety.
[18] V.Lavrenko.A Generative Theory of Relevance.PhD thesis, UMass, 2004.[19] T. Westerveld. Using generative probabilistic modelsfor multimedia retrieval.SIGIR Forum, 39(1):69–
69, 2005.
18