
CLUB DRUG USE AS SELF-INFLICTED TRAUMATIC BRAIN...
121
CLUB DRUG USE AS SELF-INFLICTED TRAUMATIC BRAIN INJURY By MATTHEW WESLEY WARREN A DISSERTATION PRESENTED TO THE GRADUATE SCHOOL OF THE UNIVERSITY OF FLORIDA IN PARTIAL FULFILLMENT OF THE REQUIREMENTS FOR THE DEGREE OF DOCTOR OF PHILOSOPHY UNIVERSITY OF FLORIDA 2006
Transcript of CLUB DRUG USE AS SELF-INFLICTED TRAUMATIC BRAIN...
CLUB DRUG USE AS SELF-INFLICTED TRAUMATIC BRAIN INJURY
By
MATTHEW WESLEY WARREN
A DISSERTATION PRESENTED TO THE GRADUATE SCHOOL OF THE UNIVERSITY OF FLORIDA IN PARTIAL FULFILLMENT
OF THE REQUIREMENTS FOR THE DEGREE OF DOCTOR OF PHILOSOPHY
UNIVERSITY OF FLORIDA
2006

Copyright 2006
by
Matthew Wesley Warren

To my family for affording me education and opportunity

ACKNOWLEDGMENTS
I thank the members of my graduate supervisory committee, Mark Gold, Bruce
Goldberger, Ron Hayes and Kevin Wang for their guidance and support. I appreciate the
members of the Hayes and Wang labs, notably Ming Chen Liu, Barbara O’Steen and
Wenrong Zheng for their assistance in practical laboratory education. I acknowledge
Stephen Larner and Mark Lewis for their tutorials and help in preparing this manuscript
and many other publications. I am grateful for the Departments of Psychiatry and
Neuroscience, in particular Veronica Akle, Tina Calton, Tina Hall, Candy Hill, Bonnie
McLaurin, Megan O’Donoghue, Sheri Spencer, B.J. Streetman and Geri Underhill for
their efforts in taking care of things I could only hope to accomplish. Finally, I am
gracious to the other graduate students at the University of Florida, especially Firas
Kobeissy for his unequalled assistance in lab, Kimberly Frost-Pineda for her editorial
efforts, Jennifer Jeung for her amazing endocrinology work, Shannon Janssen for her
help in establishing pilot data, and Brian Fuehrlein for critiquing my ideas and keeping
me sane.
iv
TABLE OF CONTENTS page
ACKNOWLEDGMENTS ................................................................................................. iv
LIST OF FIGURES ......................................................................................................... viii
ABSTRACT....................................................................................................................... xi
1 BACKGROUND ..........................................................................................................1
Club Drugs....................................................................................................................1 Introduction ...........................................................................................................1 Epidemiology ........................................................................................................2 Toxicity..................................................................................................................3
Neurotoxicity..................................................................................................3 Neuroendocrine toxicity .................................................................................6
Treatment...............................................................................................................8 Traumatic Brain Injury .................................................................................................9
Introduction ...........................................................................................................9 Epidemiology ........................................................................................................9 Toxicity..................................................................................................................9
Neurotoxicity................................................................................................10 Neuroendocrine toxicity ...............................................................................10
Treatment.............................................................................................................10 Proteomics ..................................................................................................................12
Necrosis versus Apoptosis...................................................................................12 Calpains ...............................................................................................................13 Caspases ..............................................................................................................14 Degradation of Structural Proteins ......................................................................16
αII-Spectrin ..................................................................................................16 Tau................................................................................................................17
Use of Proteomics in Traumatic Brain Injury .....................................................19 Potential Use of Proteomics in Drug Abuse........................................................20
Neurotoxicity biomarkers.............................................................................20 Neuroendocrine biomarkers .........................................................................21
2 METHODS.................................................................................................................24
Animal Treatment.......................................................................................................24 Administration of Traumatic Brain Injury ..........................................................24
v
Drug Administration............................................................................................25 Cortical Culture Preparations .....................................................................................25
Primary Cerebrocortical Culture .........................................................................25 Neurotoxin Challenges and Pharmacologic Intervention....................................26 Quantification of Cell Injury or Death ................................................................26 Cell Lysate Collection and Preparation...............................................................26
Western Blot ...............................................................................................................27 Tissue Collection .................................................................................................27 Gel Electrophoresis and Electrotransfer ..............................................................27 Immunoblot Analyses of Samples.......................................................................28
Immunohistochemistry ...............................................................................................29 Radioimmunoassays ...................................................................................................30 Statistical Tests ...........................................................................................................30
Western Blot Analyses ........................................................................................30 Radioimmunoassays ............................................................................................31
3 In Vivo NEUROTOXICITY.......................................................................................32
Introduction.................................................................................................................32 Results.........................................................................................................................33
Western Blot Proteomics.....................................................................................33 Methamphetamine........................................................................................33 Ecstasy..........................................................................................................42
Immunohistochemistry Proteomics .....................................................................45 Methamphetamine........................................................................................45 Ecstasy..........................................................................................................48 Neurofilament-200 .......................................................................................52
Discussion...................................................................................................................53
4 In Vitro NEUROTOXICITY ......................................................................................59
Introduction.................................................................................................................59 Results.........................................................................................................................60
Cell Toxicity........................................................................................................60 Phase contrast microscopy ...........................................................................60 LDH release..................................................................................................61
Cortical Cultures with Club Drugs ......................................................................62 Cortical Cultures with Club Drugs and Protease Inhibitors ................................65
Discussion...................................................................................................................70
5 NEURONDOCRINE TOXICITY..............................................................................73
Introduction.................................................................................................................73 Results.........................................................................................................................73
Methamphetamine ...............................................................................................73 Weight ..........................................................................................................73 Leptin ...........................................................................................................74
vi

Ghrelin..........................................................................................................75 Growth hormone ..........................................................................................76 Neuropeptide-Y............................................................................................77
Ecstasy.................................................................................................................78 Weight ..........................................................................................................78 Leptin ...........................................................................................................79 Ghrelin..........................................................................................................79 Growth hormone ..........................................................................................80 Neuropeptide-Y............................................................................................81
Comparison to Traumatic Brain Injury ...............................................................81 Discussion...................................................................................................................83
6 CONCLUSIONS ........................................................................................................88
Summary and Application of Findings.......................................................................88 Future Directions ........................................................................................................90
APPENDIX HEPATOTOXICITY ................................................................................91
LIST OF REFERENCES...................................................................................................93
BIOGRAPHICAL SKETCH ...........................................................................................109
vii
LIST OF FIGURES
Figure page 1-1 Chemical structure of club drugs. ..............................................................................1
1-2 Three caspase-associated pathways leading to apoptosis.........................................15
1-3 Proteolytic caspase and calpain activation following insult and inhibition. ............18
1-4 Interaction of satiety hormones with appetite. .........................................................22
3-1 Proof of concept that spectrin and tau breakdown products are found in rat cortex 24 h after club drug use. ................................................................................32
3-2 αII-Spectrin proteolysis in rat brain 24 h following Meth administration...............34
3-3 Accumulation of αII-spectrin breakdown products at 150 kDa from calpain activation in rat brain 24 h following Meth administration. ....................................35
3-4 Accumulation of αII-spectrin breakdown products at 145 kDa from calpain activation in rat brain 24 h following Meth administration. ....................................36
3-5 Accumulation of αII-spectrin breakdown products at 120 kDa from caspase activation 24 h following Meth administration. .......................................................37
3-6 Tau proteolysis in rat brain 24 h following Meth administration.............................38
3-7 Calpain-induced tau proteolysis in rat cortical neuron cultures. ..............................38
3-8 Accumulation of tau breakdown products in rat cortex 24 h following Meth administration...........................................................................................................39
3-9 Accumulation of tau breakdown products in rat hippocampus increased 24 h following Meth administration.................................................................................40
3-10 Proteolysis of αII-spectrin and tau proteins 72 h after Meth exposure. ...................41
3-11 Accumulation of αII-spectrin and tau breakdown products in rat brain 72 h following Meth administration.................................................................................41
3-12 Proteolysis of αII-spectrin and tau proteins 24 h after MDMA exposure................42
viii
3-13 Accumulation of αII-spectrin and tau breakdown products in rat brain 24 h following MDMA administration. ...........................................................................43
3-14 Proteolysis of αII-spectrin and tau breakdown products in rat brain 72 h following MDMA administration. ...........................................................................44
3-15 Accumulation of αII-spectrin and tau breakdown products in rat brain 72 h following MDMA administration. ...........................................................................44
3-16 Activation of calpain-1 in neurons in the cortex 48 h after 40 mg/kg Meth exposure. ..................................................................................................................45
3-17 Activation of SBDP145 in neurons in the cortex 48 h after 40 mg/kg Meth exposure. ..................................................................................................................46
3-18 Activation of caspase-3 in neurons in the cortex 48 h after 40 mg/kg Meth exposure. ..................................................................................................................47
3-19 Activation of SBDP120 in neurons in the cortex 48 h after 40 mg/kg Meth exposure. ..................................................................................................................48
3-20 Activation of calpain-1 in neurons in the cortex 24 h after 40 mg/kg MDMA exposure.. .................................................................................................................49
3-21 Activation of SBDP145 in neurons in the cortex 24 h after 40 mg/kg MDMA exposure. ..................................................................................................................50
3-22 Activation of caspase-3 in neurons in the cortex 24 h after 40 mg/kg MDMA exposure. ..................................................................................................................51
3-23 Activation of SBDP120 in neurons in the cortex 24 h after 40 mg/kg MDMA exposure. ..................................................................................................................52
3-24 Club drug induced colocalization of SBDP145 with NF-200 in the cortex.............53
4-1 Cerebrocortical neurons after 48 h of drug incubation or saline treated control......60
4-2 Lactate dehydrogenase (LDH) released into cell-conditioned media following insult. ........................................................................................................................62
4-3 Proteolysis of αII-spectrin and tau in rat cortical neuron cell cultures following club drug treatment...................................................................................................63
4-4 Accumulation of αII-spectrin and tau breakdown products in rat cortical neuron cell cultures following club drug treatment..............................................................64
4-5 Proteolysis of αII-Spectrin and tau in rat cortical neuron cell cultures following preincubation with inhibitors prior to drug treatment (2 mM, 48 h)........................66
ix
4-6 Accumulation of αII-Spectrin and tau breakdown products in rat cortical neuron cell cultures following preincubation with inhibitors prior to drug treatment. ........67
5-1 Changes in rat weight after Meth administration. ....................................................74
5-2 Changes in serum leptin following Meth administration. ........................................75
5-3 Changes in serum ghrelin following Meth administration.......................................76
5-4 Changes in serum growth hormone following Meth administration........................76
5-5 Changes in serum neuropeptide-Y following Meth administration. ........................77
5-6 Changes in rat weight after MDMA administration.................................................78
5-7 Changes in serum leptin following MDMA administration.....................................79
5-8 Changes in serum ghrelin following MDMA administration. .................................80
5-9 Changes in serum growth hormone following MDMA administration. ..................81
5-10 Changes in serum neuropeptide-Y following MDMA administration.....................82
5-11 Changes in serum hormones after TBI versus naive................................................82
A-1 αII-Spectrin proteolysis and accumulation in rat liver 72 h after MDMA or Meth exposure.. .................................................................................................................91
x
Abstract of Dissertation Presented to the Graduate School of the University of Florida in Partial Fulfillment of the Requirements for the Degree of Doctor of Philosophy
CLUB DRUG USE AS SELF-INFLICTED TRAUMATIC BRAIN INJURY
By
Matthew Wesley Warren
August 2006
Chair: Mark S. Gold Major Department: Neuroscience
Club drug abuse, such as with methamphetamine (Meth) or 3,4-
methylenedioxymethamphetamine (MDMA), is a pervasive and dangerous problem in
the United States. Neurological and endocrine toxicity have been reported but would be
better understood and treated with the use of simple proteomic biomarkers of pathology.
There has already, however, been some success in this in the field of traumatic brain
injury (TBI) studies. In brief, TBI has been shown to activate the pro-necrotic calpain
and the pro-apoptotic caspase proteases which act to degrade the neural structural
proteins αII-spectrin and tau, creating useful markers of disease.
Here, Western blot, immunocytochemistry and immunohistochemistry tools were
employed in animal and cell culture models treated with club drugs to search for those
same markers in an effort to study the extent of toxicity. Protease inhibitors were also
used to help determine mechanism of action. Finally, endocrine hormones were studied
for changes in blood concentration using radioimmunoassays.
xi
In brief, Meth and, to a lesser extent, MDMA are found to be neurotoxic,
comparable to TBI. In the cortex, co localization with cell death biomarkers is
established and is more prominent in the neurons than glia, with particular upregulation
in axonal compartments. Cortical cell culture studies showed that club drugs stimulate
dual action mechanisms of both calpain and caspase in origin. Furthermore, when either
one is suppressed, the other appears to be upregulated. Neuroendocrine studies showed
that changes in leptin, ghrelin and neuropeptide-Y may be related to other toxic effects of
the drugs.
These studies marked the first to identify biomarkers in the brain following club
drug use. The tools may be used to further study club drugs or serve as a model for the
study of other drugs of abuse. Chronic administration paradigms should be compared to
the acute models studied here and human studies need to be conducted to test the
application of this work.
xii
CHAPTER 1 BACKGROUND
Club Drugs
Introduction
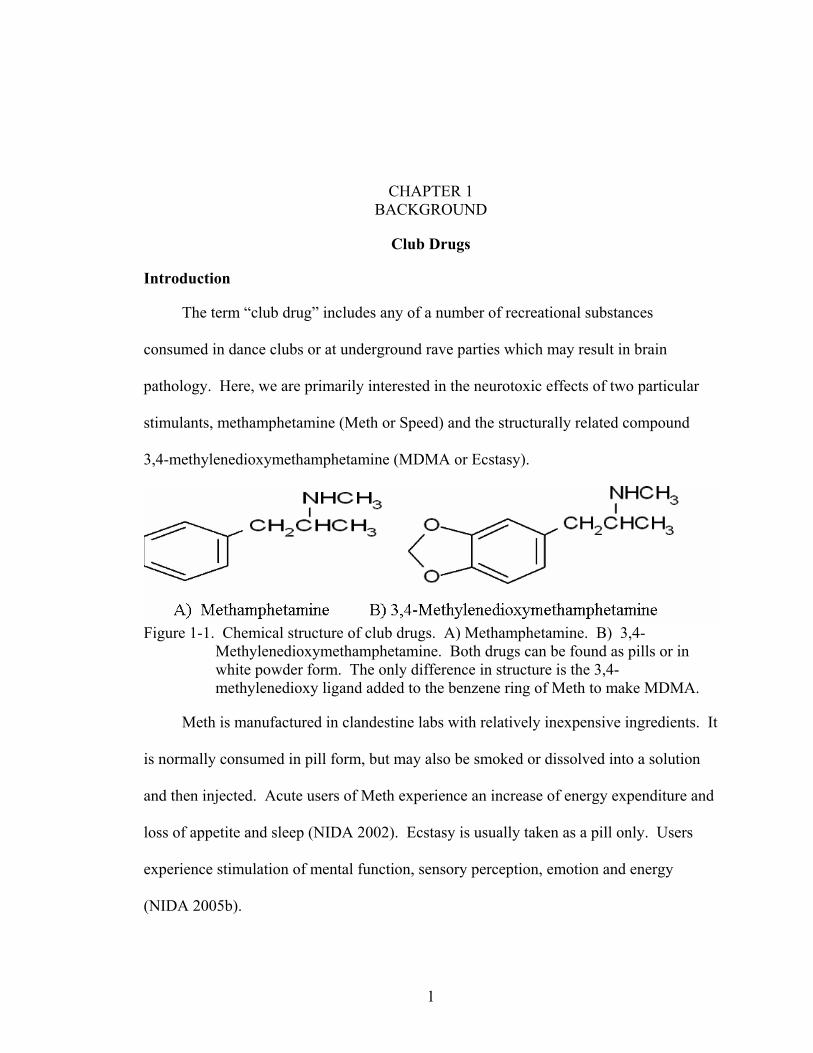
The term “club drug” includes any of a number of recreational substances
consumed in dance clubs or at underground rave parties which may result in brain
pathology. Here, we are primarily interested in the neurotoxic effects of two particular
stimulants, methamphetamine (Meth or Speed) and the structurally related compound
3,4-methylenedioxymethamphetamine (MDMA or Ecstasy).
Figure 1-1. Chemical structure of club drugs. A) Methamphetamine. B) 3,4-
Methylenedioxymethamphetamine. Both drugs can be found as pills or in white powder form. The only difference in structure is the 3,4-methylenedioxy ligand added to the benzene ring of Meth to make MDMA.
Meth is manufactured in clandestine labs with relatively inexpensive ingredients. It
is normally consumed in pill form, but may also be smoked or dissolved into a solution
and then injected. Acute users of Meth experience an increase of energy expenditure and
loss of appetite and sleep (NIDA 2002). Ecstasy is usually taken as a pill only. Users
experience stimulation of mental function, sensory perception, emotion and energy
(NIDA 2005b).
1
2
These drugs have specific effects on the serotonergic, domapinergic and, at least
with MDMA, norepinephrine neurotransmitter systems. Serotonin is located in virtually
all areas of the brain except the cerebellum and is involved in regulating mood, memory,
cognition, sleep, aggression, appetite, thirst, sexual function, body temperature and sleep.
Dopamine, normally produced by the hypothalamus, plays a role in body movement,
cognition, hormone regulation, motivation and pleasure. Norepinephrine is a hormone
released by the adrenal glands that functions in attention, impulsivity and activates the
sympathetic nervous system.
Epidemiology
Meth was first developed in Japan in 1919 to treat depression and enhance weight
loss. It was made a Schedule II controlled substance in 1979, meaning it has a high
potential for abuse, but is still available by prescription in low-dose form to treat some
conditions such as Attention Deficit Disorder (ADD), narcolepsy or obesity. Recently,
police officers ranked Meth as the biggest drug problem they are facing today (NACO
2005). Additionally, what was first seen as a West Coast problem has now moved more
towards central and Midwestern states, with dance clubs in the northeast also reporting
increased use (NIDA 2006). In 2003, 12.3 million Americans had reported trying Meth
at least once, representing 5.2% of the population (SAMHSA, 2004). However, use may
be stabilizing among youths. In 2004, 6.2% of high school seniors had reported ever
trying Meth in their lifetime, a number that has not changed in a year, while middle
school students reported a decrease in use (NIDA 2005a).
Ecstasy was developed in 1912 by the German pharmaceutical company Merck as a
parent chemical compound. During the 1970s some psychotherapists began using the
drug during sessions, despite the fact it had never been approved by the U.S. Food and
3
Drug Administration (FDA). It was made a Schedule I controlled substance in 1985 and
thus banned from use. Ecstasy, once seen almost exclusively in the club scene, has
recently been reported to have increasing use in minority population social settings
(NIDA 2006). In 2003, 11 million Americans had reported using MDMA in their
lifetime, almost 5% of the population (SAMHSA 2004). However, American youths
have recently reported a slight decrease in use and an increase in hazard awareness
(NIDA 2005a). This is in contrast to escalating use in Europe (Schifano et al. 2006).
Toxicity
Particularly elevated levels of club drugs can enter the blood stream due to the
“binge and crash” pattern of use by addicts trying to eschew tolerance to its effects. The
lipophilic nature of the compounds allows them to cross the blood brain barrier and
manifest effects on the brain (Nordahl et al. 2003).
Neurotoxicity
The high associated with Meth stems from its effect of causing release of elevated
levels of dopamine in the brain (Robbins and Everitt 1999) and its effect on neocortical
neurons (Schroder et al. 2003). Meth binds to dopamine transporters (DAT) and blocks
the re-uptake of dopamine, overloading the synapse (Baucaum et al. 2004). This activity
desensitizes those cells, as well as others containing serotonin, potentially disrupting
motivation, pleasure sensation and motor function (Gonzalez et al. 2004). Meth has been
shown to cause dopaminergic and, to a lesser extent, serotonergic neurite and nerve
terminal degeneration of neurons in the striatum and hippocampus (Larsen et al. 2002).
Findings in rat and non-human primates show that Meth depletes dopamine and decreases
the activity of tyrosine hydroxylase and 5HT systems (Seiden et al. 1976; Koda and Gibb
1973). Meth has been suggested to reduce the levels of enzymes that synthesize
4
dopamine and 5HT, leading to toxicity (Ricaurte et al. 1980; Bakhit et al. 1981).
Oxidative stress may also help explain the mechanism for toxicity. For example, Meth
enhances the creation of an endogenous dopamine toxic metabolite, 6-hydroxydopamine
(6-OHDA) (Wagner et al. 1983). Similar findings have been reported related to the
generation of 5,6-dihydroxytryptamine (5,6-DHT), a neurotoxin to the serotonergic
system (Commins et al. 1987). It has been proposed that Meth-induced redistribution of
dopamine from synaptic vesicles to cytoplasmic compartments, where dopamine is
oxidized to produce quinones and additional reactive oxygen species, may account for
this selective neurotoxicity (De Vito and Wagner 1989; Gluck et al. 2001). Furthermore,
it has been reported that Meth exposure, by producing reactive oxygen species, can
activate pro-apoptotic genes such as c-Jun, c-myc and L-myc and thus induces neuronal
apoptosis directly (Stumm et al. 1999; Deng et al. 2002a; Thiriet et al. 2001). In support
of these findings, Meth was found to induce apoptosis in both the CNS-derived
catecholaminergic cell line CSM14.1 (Cadet et al. 1997; Choi et al. 2002) and the
immortalized rat striatal cell line M213 (Deng et al. 2002b). Studies with N-methyl-d-
aspartate (NMDA) receptor antagonists also suggest that glutamate release may be an
important factoring mediating toxicity when triggered by Meth (Sonsalla et al. 1989).
Over time, a down regulation of dopamine receptors develops in Meth users,
resulting in a Parkinson-like syndrome. Other long-term effects have been reported, such
as paranoia, hallucinations, mood disturbances, repetitive motor activity and impotence
(NIDA 2006). Neurotoxicity from Meth is exacerbated by hyperthermia and damage to
blood vessels in the brain from increased heart rate and blood pressure.
5
High concentrations of MDMA from an “overdose” scenario can also be found
among its abusers. It is not uncommon for MDMA users to take multiple tablets to
combat tolerance and to compensate for perceived impurity in drug content (Baggott et
al. 2000). Furthermore, MDMA inhibits its own metabolism, resulting in an effective
drug level that may become neurotoxic. Ecstasy binds to transporters for serotonin,
dopamine and norepinephrine, inhibiting their reuptake and increasing their concentration
in the synapse. This rapid release of serotonin is followed by a significant depletion and
associated deficits (Yamamoto 2001). Additionally, MDMA has been shown to destroy
tryptophan hydroxylase, an important enzyme in serotonin function, in multiple areas of
the brain including the cortex and striatum (Ricaurte et al. 1985). Other suggestions for
mechanisms of MDMA toxicity, without regard to hyperthermia or metabolite effect,
include release of 5-HT and its derivatives (Schmidt and Taylor 1987), release of
dopamine (Nash and Nichols 1991), increased intracellular glutamate concentrations
(White et al. 1994) and possibly free radical damage via nitric oxide (Simantov and
Tauber 1997).
Reductions in the numbers of neurons containing serotonin have been reported after
MDMA use in rodents and non-human primates (Schmidt and Taylor 1987; Ricaurte
1989; Taffe et al. 2001; Hatzidimitriou et al. 1999; Larsen et al. 2003). Autopsy reports
have suggested that these effects also occur in humans (McCann et al. 1998; Kish et al.
2000). The effects on serotonergic and, to a lesser extent, dopaminergic neurons in the
brain play a role in disturbing mood, sleep and pain (Reneman et al. 2000). For example,
studies have shown MDMA users perform poorly on cognitive and memory tasks
(Verkes et al. 2001). Also, due to the additional release of norepinephrine, neurotoxicity
6
is exacerbated by hyperthermia and cardiovascular injury from increased sympathetic
tone (Dafters and Lynch 1998). Interestingly, the neurotoxicity to norepinephrinergic
systems seen with MDMA is not seen with Meth (Seiden and Ricaurte 1987). Similar to
Meth, however, is the involvement of oxidative stress as a possible mediator of
neurotoxicity. Ecstasy disturbs the function of certain antioxidant enzymes, such as
superoxide dismutase catalase (Cadet and Thiriet 2001). It has also been associated with
increases in the production of hydroxyl radicals, although this effect takes much longer to
occur than with Meth (Shankaran et al. 1999). Furthermore, decreases in overall
metabolic activity in the brain, particularly the striatum, have been observed in rats after
MDMA administration via studies of cytochrome oxidase activity and glycogen
breakdown (Yamamoto et al. 1995; Darvesh et al. 2001).
Long term users, subjected to deficits in serotonin function, experience depression,
insomnia, paranoia and bipolar symptoms along with a host of others (NIDA 2006). Self-
reports indicate that MDMA users score higher than non-users in tests for social anxiety
and phobia, although which is the cause and which is the effect has not been established
(Parrott 2001). In agreement with acute intoxication studies, long time MDMA users
have shown decreased performance on memory tests (Morgan 1999).
Neuroendocrine toxicity
The monoamines released in the brain following club drug use are normally
involved in temperature regulation, motor control, and appetite regulation. Therefore,
increased concentrations of these monoamines caused by drug use may result in the
observed negative effects on these systems (Jaehne et al. 2005; Malpass et al. 1999). An
important negative consequence of drug abuse is the development of pharmacologically-
induced anorexia. Research has shown that administration of drugs, such as
7
amphetamines, heroin or cocaine, leads to appetite suppression and development of
anorexia (Jonas and Gold 1986; Hseigh et al. 2005). These anorexic effects can be seen
with both acute and chronic administration in humans and animals. Acute and chronic
use of psychostimulants (such as Meth or MDMA) has been shown to result in decreased
appetite, reduced feeding behavior, and drug-induced anorexia (Cho et al. 2001; Ginawi
et al. 2005). It has also been shown that rats orally administered MDMA acutely
(ranging from 20 mg/ kg to 80 mg/kg) had significantly reduced body weight and food
intake compared to control groups (De Souza et al. 1996). Rats that were given Meth (2
mg/kg) by intraperitoneal injection also exhibited significant reduction in food intake
(Ginawi et al. 2005).
The mechanism for the drug-induced anorexia caused by these substances is
mediated by the action of monoamines in the control of food intake. Specific receptor
sites in the hypothalamus that control the anorexic action of amphetamine and similar
drugs have been discovered (Paul et al. 1982). The biogenic amines released by drug use
are believed to act on the paraventricular (PVN), ventromedial, and suprachiasmatic
nuclei, which are responsible for energy balance and daily patterns of eating (Ginawi et
al. 2005). Excess 5-HT released by psychostimulant administration acts on these nuclei
to produce hypophagic effects by decreasing carbohydrate intake in naturally feeding
animals thereby disrupting satiety mechanisms (Curzon et al. 1997). Specifically,
amphetamine and other drugs were shown to decrease neuropeptide-Y (NPY) levels in
the PVN, which resulted in decreased appetite stimulation with corresponding
hypophagia (Hseigh et al. 2005; Curzon et al. 1997). Therefore, a proposed mechanism
8
of drug-induced anorexia is that excess 5-HT released due to drug use decreases
production of NPY, inhibiting its normal orexigenic effects.
A significant problem associated with drug abuse is the ‘wasting effect’ that is seen
from drug-induced anorexia in users. About two-thirds of the drug addicts in one study,
including heroin, cannabis and ephedrine users, had significantly lowered body mass
index compared to the normal population (Islam et al. 2002). Drug users in another study
had reported weight loss and anorexia, which the researchers also associated with
decreased serum leptin levels (Santolaria et al. 2002). Drug administration causes
changes in feeding behavior and body mass through physiological mechanisms, however,
more investigation needs to be performed to learn about the relationship between drugs of
abuse and their direct effects on metabolic hormones involved in the regulation of
feeding behaviors and energy balance (Halford and Blundell 2000; Crowley et al. 2005).
Treatment
Meth users are identified by signs of agitation and increased physical activity.
Users also may display pupil dilation, violent behavior and a tendency to clean, sort or
disassemble objects. Treatment of Meth is concerned with both addressing both the acute
intoxication symptoms and the chronic addiction. Acute overdose of Meth is treated with
ice bath and anticonvulsants to combat hyperthermia and seizures. A quiet atmosphere is
recommended, with the use of benzodiazepines sometimes used to calm a psychotic
patient. Long term Meth addicts are treated with therapy and cognitive behavioral
intervention which seek to give the patient skills in coping with life stressors. There are
no pharmacological treatments for treating dependence or reversing intoxication.
Antidepressants, however, may be useful in combating relapse in abstinent patients.
9
Ecstasy users may be identified by high blood pressure, faintness, panic attacks or
seizures. Acute intoxiciation is treated with rehydration and balancing of electrolytes.
Special care is taken to avoid water intoxication. Similar to Meth, cognitive therapy
remains the only treatment for MDMA addiction, since no pharmacological treatments
exist.
Traumatic Brain Injury
Introduction
Traumatic brain injury (TBI) is another type of brain pathology and is defined as
any sudden trauma which causes damage to the brain. This can be the result of an object
piercing the skull to the point that it contacts brain tissue or when the head violently hits
an object.
Epidemiology
Every year in the United States, approximately 1.5 million people sustain a TBI
(CDC 2001). Of these, 50,000 die and 90,000 can experience an associated lifetime
disability. Around 2% of the current US population is living with a TBI-related injury,
caused chiefly from vehicle accidents, firearm use, falls and sports (Thurman et al. 1999).
The cost to the U.S. healthcare system is estimated at $56 billion each year (Thurman
2001).
Toxicity
Traumatic brain injury results in overt brain tissue death and the release of a
number of amino acids, ions, proteins and enzymes into the blood and cerebrospinal fluid
(CSF) (Goodman and Simpson 1996; Graham 2000).
10
Neurotoxicity
Primary injury is composed of mechanical tearing of neural tissue, either from
contusive or counter-coupe injury (Graham et al. 2000). Blunt injury allows for
unregulated chemical cascades and inflammatory responses to follow (Gennarelli 1993).
Traumatic brain injury changes calcium homeostasis (Graham et al. 1995), which acts to
deregulate certain proteolytic enzymes, as well as increase excitotoxicity (Choi and
Rothman 1990) and free radical production (Kontos 1989).
Acute symptoms of a TBI include headache, confusion, dizziness with blurred
vision, tinnitus, lethargy, changes in sleep patterns or mood and trouble with memory,
attention or thinking. More serious TBI can result in nausea and vomiting, seizures, and
loss of sensation or balance. Additionally, repeated mild TBIs occurring over time may
result in cumulative deficits (CDC 1997).
Neuroendocrine toxicity
Rapid weight loss is also seen in human patients experiencing TBI, exacerbated by
the inflammatory response and sympathetic stimulation (Mansoor et al. 1996; Herndon et
al. 2001). Altered glucocorticoid production and increasing levels of interleukins have
been reported in TBI patients (Mansoor et al. 1996). The catecholamine-mediated
hypermetabolic response to some severe injuries causes increased expenditure and
muscle-protein catabolism (Herndon et al. 2001).
Treatment
Diagnosis of a TBI includes observation of disorientation, amnesia, extended loss
of consciousness, or neurological problems. Because repairing injury is seldom possible,
treatment focuses mainly on preventing further injury and learning to cope. This includes
radiography and attention to oxygenation and blood flow to the brain as well as sedation,
11
anti-convulsives and sometimes neuromuscular blockade (Bullock et al. 1995).
Hyperventilation and mannitol diuretic treatments have been used to prevent increases in
intracranial pressure (Bullock et al. 1995). Guidelines have also been suggested for
monitoring nutrition of trauma patients to prevent nitrogen loss and wasting (Bullock et
al. 1995). Once the patient is stabilized, enrollment in physical, occupational, or speech
therapy may be necessary to treat neurological consequences of brain damage.
Prognostic indicators, or lack thereof, are important for the consideration of clinical
management of TBI patients. The most widely available measure of severity of injury in
the clinic, currently, is the Glasgow Coma Scale score (GCS) which objectively measures
consciousness (Teasdale and Jennett 1973). However, current guidelines in emergency
treatments before arriving at the hospital make the GCS untestable in 44% of patients
(Bullock et al. 1995). Another test involves papillary light reflex which may indicate
damage to structures in the temporal lobe essential for cognitive function (Sakas et al.
1995). However, direct oculomotor trauma may confound these results (Bullock et al.
1995). Computer tomography (CT) scanning is performed on patients with TBI for the
purpose of intracranial pressure monitoring and prognostic significance. Basal cistern
injury, hemorrhage, midline shifts, and intracranial lesions can easily be identified by CT
scan. However, the cost, speed and availability of the scan are limiting factors in their
prognostic value (Levi et al. 1990; Kesler et al. 2000). In fact, despite the prediction of a
“good recovery” that may be predicted by some of these tests, many TBI patients
continue to display long-term impairment (Marion 1996). As a result, there has been
interest in developing biochemical markers for the rapid and accurate assessment or
12
injury severity, prognosis and evaluation. This may be possible with the use of
proteomics.
Proteomics
Proteomics can be defined as the study of global protein expression, structure and
function. It is a direct extension of genomics, which is the study of genes, and sheds light
on the biochemical interaction of cells with their environment. Of particular interest in
proteomics is determining levels of protein expression, how they differ from one
organism to the next under different conditions or within the same organism in different
body regions or over time. Protein separation and quantification are used to identify
specific players during pathological processes.
One goal of proteomics is to identify “biomarkers”, or substances in an organism
that may be used to identify some function of health or disease much like how the
presence of certain pancreatic islet antibodies help to diagnose the presence of type I
diabetes. The most preferable way to detect biomarkers would be via a rapid and simple
blood test, although spinal taps and tissue biopsies may be needed for more accurate
identification. Additionally, using proteomics to understand the mechanism behind
physiologic interactions will help scientists to develop therapies to target or mimic them,
thereby treating the disease.
With respect to neurotoxicity, necrosis and apoptosis have been identified to be
important cell death process. Using proteomics to understand their causes and
monitoring their presence are important for identifying and treating disease of the brain.
Necrosis versus Apoptosis
Necrosis is a form of accidental or pathological cell death in which the cell plays a
less central role on the continuum of cell death. It is most likely to occur when cells
13
incur conditions such as hyperthermia, toxins, or direct trauma (Willie et al. 1980). Cells
are characterized by irreversible swelling of the cytoplasm, massive ion influx and
distortion of mitochondria and other organelles. Typically they lyse, releasing their
cellular contents and invoking an inflammatory response (Lockshin and Zakeri, 2001).
Apoptosis, first studied in C. Elegans, is a form of programmed cell death. It has
been conserved evolutionarily to dispose of excess or harmful cells, regulate
development, initiate immune responses and maintain homeostasis (Kerr et al. 1972;
Ameisen 2002). An example of this is the deletion of cells in the hand stump of a
developing fetus for the purpose of producing five distinguishable fingers instead of one
(Jacobson et al. 1997). The program has been remarkably conserved from nematodes to
humans, suggesting the existence of “core death machinery” in most, if not all, cells
(Metzstein et al. 1998). Once apoptosis is initiated, chromosomes condense and move to
the periphery. Then, cells shrink in size as the plasma membrane begins to bleb. These
contents are then engulfed and digested by neighboring phagocytes or cells (Jacobson et
al. 1997). Many biological pathologies can be tied to errors in apoptosis, for instance an
absent signal in which cells accumulate or an over expressed signal in which cells are
eradicated or division impaired. The calpain and caspase families of proteases act to up
regulate necrosis and apoptosis, respectively (Wang 2000; Launay et al. 2005).
Calpains
Calpains are ubiquitous calcium activated cytosolic cysteine proteases with
complicated mechanisms regulating their powerful necrotic actions (Banik et al. 1997).
Over 14 calpains have been discovered since 1960 (Guroff 1964). Two isoforms, the
calpain-1 and calpain-2, are activated by micromolar and millimolar calcium
concentrations respectively and are normally involved in membrane fusion, long term
14
potentiation, platelet activation and cell cycle progression (Carafoli and Molinari 1998;
Azam 2001). Activated calpains autolyse and move from the cytosol across the cell
membrane (Suzuki et al. 2004). Calpains then have the ability to digest many
cytoskeletal substrates (Croall and DeMartino 1991), but are normally inhibited by
endogenous calpastatins in the absence of calcium ion influx following injury. A smaller
role in apoptosis has also been implicated due to membrane rupture and cathepsin
leakage, activating pro-apoptotic caspases (Nath et al. 1996; Yamahsima 2000;
Nakagawa and Yuan 2000).
In the general course of protease studies, several inhibitors have been developed to
suppress the effects of these enzymes. These tend to react with the cysteine in the
catalytic triad in a nonspecific manner (Yuen and Wang 1998) or inhibit by interacting
with the calmodulin domain (Shiraha et al. 2002). For example, N-(4-
fluorophenylsulfonyl)-L valyl-L-leucinal (SJA6017 or SJA) has been found to act as a
general calpain inhibitor in cell culture and in vivo by reversibly binding to the active site
of calpain-1 (Fukiage et al. 1997; Kupina et al. 2001).
Caspases
Unlike calpains, the pro-apoptotic intracellular cysteine protease caspases are not
calcium activated. Normally, caspases reside as inactive zymogens within the cells,
requiring pro-domain cleavage to become activated (Springer et al. 1999). Once active,
caspase-3, the most abundant member of the caspase family, appears to play the main
role in apoptosis in the brain (Chan and Mattson 1999; Slee et al. 2001). Other roles,
among over 250 cellular substrates identified to date, include cytokine processing and
inflammation (Fischer et al. 2003; Thornberry and Lazebnik 1998). Targets of active
caspase-3 enzymes include structural proteins (discussed later), mitochondria, signal
15
transduction and stress response proteins (Cohen 1997; Chan and Mattson 1999;
Earnshaw et al. 1999). Furthermore, digestion of DNA repair proteins prevents recovery
and promotes further DNA condensation and fragmentation, driving apoptosis to
completion (Woo et al. 1998).
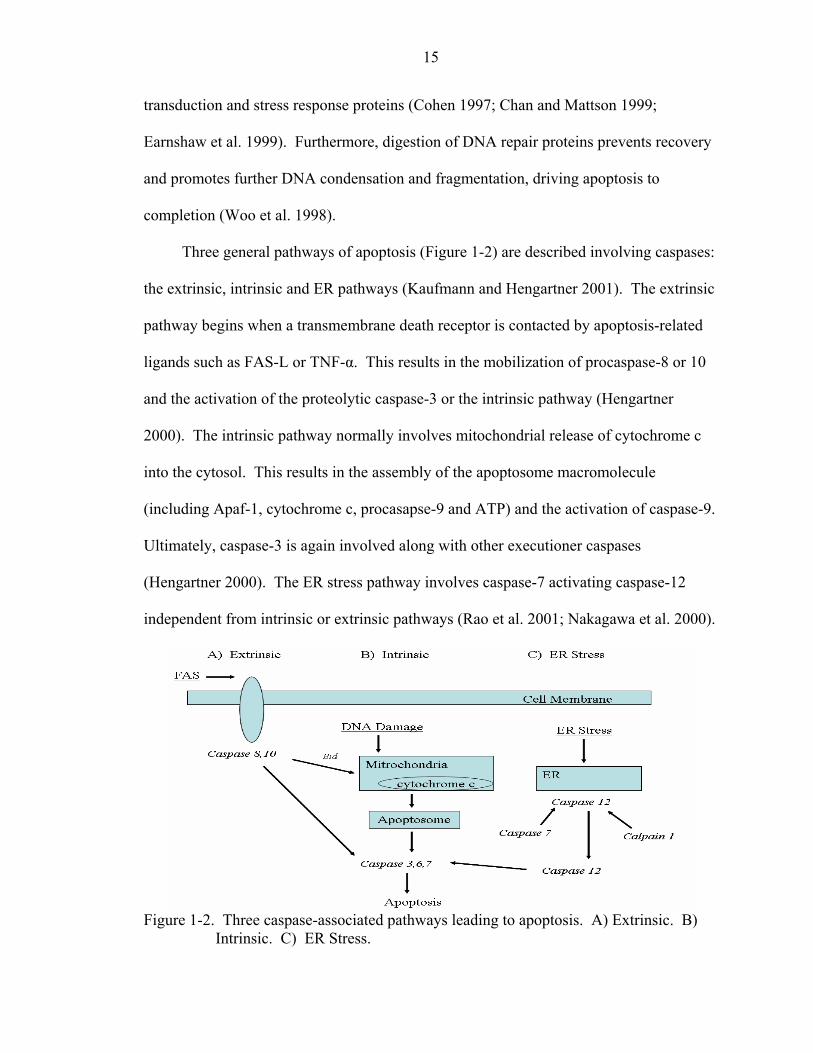
Three general pathways of apoptosis (Figure 1-2) are described involving caspases:
the extrinsic, intrinsic and ER pathways (Kaufmann and Hengartner 2001). The extrinsic
pathway begins when a transmembrane death receptor is contacted by apoptosis-related
ligands such as FAS-L or TNF-α. This results in the mobilization of procaspase-8 or 10
and the activation of the proteolytic caspase-3 or the intrinsic pathway (Hengartner
2000). The intrinsic pathway normally involves mitochondrial release of cytochrome c
into the cytosol. This results in the assembly of the apoptosome macromolecule
(including Apaf-1, cytochrome c, procasapse-9 and ATP) and the activation of caspase-9.
Ultimately, caspase-3 is again involved along with other executioner caspases
(Hengartner 2000). The ER stress pathway involves caspase-7 activating caspase-12
independent from intrinsic or extrinsic pathways (Rao et al. 2001; Nakagawa et al. 2000).
Figure 1-2. Three caspase-associated pathways leading to apoptosis. A) Extrinsic. B)
Intrinsic. C) ER Stress.
16
The interaction between calpains and caspases is complex. Interestingly, active
calpains have been shown to inactivate caspase-3 and encourage necrosis at the core of
injured sites (Chua 2000). However, they have also been shown to active caspase-12
directly in the ER pathway (Nakagawa and Yuan, 2000).
Similar to calpains, caspase inhibitors have been used to understand injury
cascades. For example, benzyloxycarbonyl-valinyl-alaninyl-aspartyl fluoromethylketone
(z-VAD-FMK or ZVAD) and carbobenzoxy-Asp-CH2-OC (O)-2,6-dichlorobenzene (Z-
D-DCB or ZD) have been shown to act as general caspase inhibitors (Komoriya et al.
2000; Mashima et al. 1995). The pan-caspase inhibitor ZVAD has been shown to
increase the survival of marrow cells after middle cerebral artery occlusion, decreasing
apoptosis (Chen et al. 2002). The caspase-3 inhibitor ZD has been shown to reduce TBI
related DNA fragmentation (Yakovlev et al. 1997).
Degradation of Structural Proteins
More specifically, increases in calpains and caspases have been shown to be
involved with the degradation of two important structural proteins, the cytoskeletal αII-
spectrin and the microtubule associate tau (Wang 2000), producing potential biomarkers
of toxicity.
αII-Spectrin
Spectrin, also known as fodrin, is an essential component of the cell membrane and
cytosolic skeleton. It was first discovered in human erythrocytes in 1968 and was
confirmed in nonerythroid cells a decade later (Marchesi and Steers 1968; Goodman et al.
1981). Spectrin is actually an antiparallel heterodimer, however it exists as a tetramer
formed by two head-to-head interactions in vivo (Shotton et al. 1979). Two genes have
been discovered to encode the alpha subunits of spectrin, notably alpha-II which is
17
known as “brain spectrin” and located mainly in axonal membranes, playing a crucial
role in synaptic transmission (Sikorski et al. 1991).
Calpain activation and the presence of calpain-produced αII-spectrin breakdown
products (SBDPs) at 150 kDa and 145 kDa are associated with oncotic/necrotic neuronal
cell damage and to a lesser extent apoptosis (Siman et al. 1984; Nath et al. 1996; Wang
1998; Wang 2000). Specifically, spectrin is cleaved between the Tyr 1176 and Gly 1177
peptides on the eleventh alpha spectrin repeat near the calmodulin-binding domain,
producing two fragments nearly identical in size around 150 kDa. This fragment is then
cleaved again by calpain, producing a 145 kDa BDP (Harris et al. 1989). Recently, we
have produced antibodies specific to the 150 and 145 kDa calpain-cleaved αII-spectrin
protein which can aid in understanding their relative contributions to proteolytic patterns
of injury (Roberts-Lewis et al. 1994; Barh et al. 1995; Dutta et al. 2002). Alternatively,
caspase-3 overactivation and the presence of caspase-3 products at 149 kDa (sometimes
called 150i) and 120 kDa are exclusively associated with apoptotic neuronal death (Nath
et al. 1996; Wang 2000). We have also produced antibodies specific to the 120 kDa
caspase-cleaved αII-spectrin protein (Nath et al. 2000).
Tau
Tau is a major microtubule-binding protein which is highly enriched in the dendrite
portions of neurons. It interacts with tubulin to stabilize and promote microtubule
assembly. Phosphorylation of tau results in a disruption of microtubule organization
(Taniguchi et al. 2001). Hyperphosphorylation, however, is involved with self-assembly
into plaques and associated with tauopathies and Alzheimer’s disease (Alonso et al.
2001).
18
Like αII-spectrin, tau is also vulnerable to cleavage by both calpains and caspase-3
and results in the production of breakdown products (TBDPs) (Wallace et al. 2003). Tau
digestion with calpain yields multiple fragments of about 30-40 kDa in an
indistinguishable wide band and a number of more specific smaller fragments (Yang and
Ksiezak-Reding 1995; Yen et al. 1999). For example, breakdown products have been
seen at 17 kDa after beta-amyloid peptide treatment (Park and Ferreira 2005).
Alternatively, tau cleavage by caspase-3 has also been identified in neuronal cells
undergoing apoptosis in cerebellar granule neurons (Canu et al. 1998) in culture and in
Alzheimer’s diseased brains (Rohn et al. 2002). These produce a fragment around 45
kDa (Chung et al. 2001).
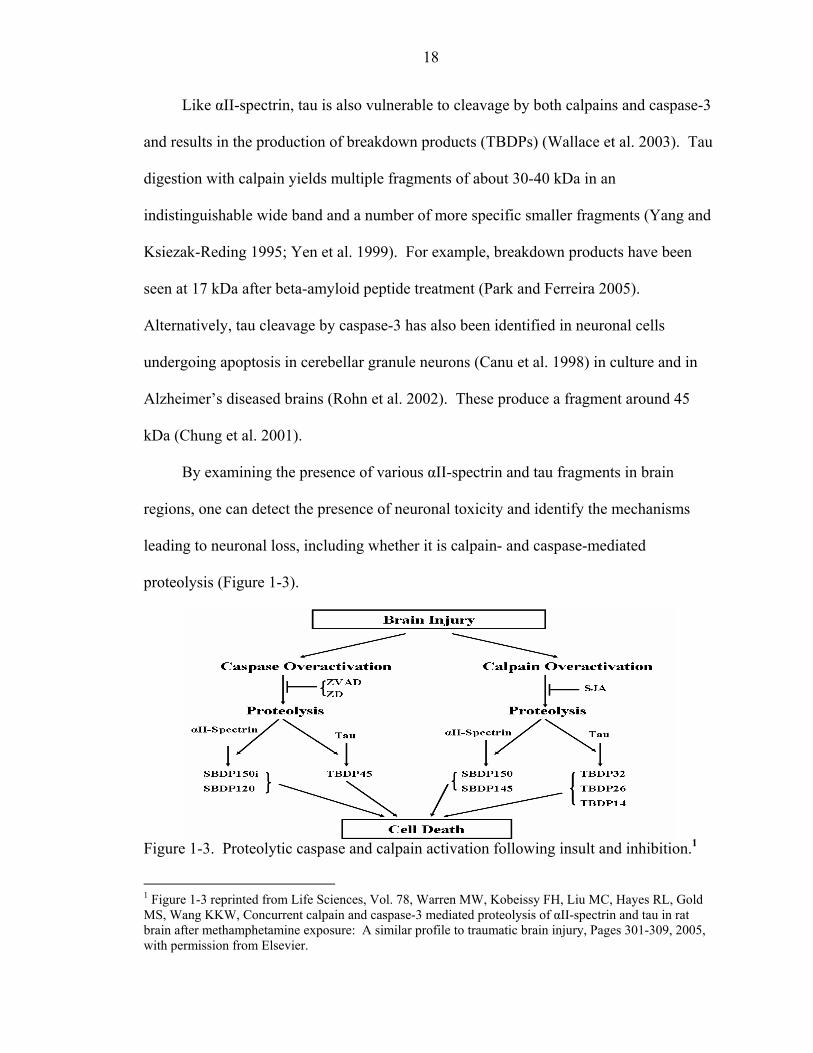
By examining the presence of various αII-spectrin and tau fragments in brain
regions, one can detect the presence of neuronal toxicity and identify the mechanisms
leading to neuronal loss, including whether it is calpain- and caspase-mediated
proteolysis (Figure 1-3).
Figure 1-3. Proteolytic caspase and calpain activation following insult and inhibition.1
1 Figure 1-3 reprinted from Life Sciences, Vol. 78, Warren MW, Kobeissy FH, Liu MC, Hayes RL, Gold MS, Wang KKW, Concurrent calpain and caspase-3 mediated proteolysis of αII-spectrin and tau in rat brain after methamphetamine exposure: A similar profile to traumatic brain injury, Pages 301-309, 2005, with permission from Elsevier.
19
Use of Proteomics in Traumatic Brain Injury
The presence of rapid, definitive biomarker tests to help identify and quantify the
extent of neurological pathology would be of great help in the diagnosing and treating
TBI. These biomarkers should be readily accessible in biological tissue and CSF or
blood, released in a time-locked sequence and have high sensitivity and specificity
(Pineda et al. 2004). Accurate information from the biomarkers would help health care
professionals determine patient management decisions by assisting conventional brain
radiography. The same markers would also provide assistance for major research
projects studying mechanism of action or pharmacological treatment. Finally, they could
be used as outcome measures in clinical trials.
Because TBI triggers both the necrotic and apoptotic processes (Conti et al. 1998;
Clark et al. 2000; Yakovlev and Faden 2001), there has been increasing research into
developing calpain and caspase related proteomic biomarkers and treatments for TBI
(Pineda et al. 2004). Shortly after a TBI, directly damaged cells begin showing evidence
of necrosis including swelling, organelle breakdown and ruptured plasma membranes
(Sutton et al. 1993; Dietrich 1994; Denecker et al. 2001). Later, neurons surrounding the
immediate injury site begin to also show signs of apoptosis including cell shrinkage,
nuclear condensation and blebbing (Conti et al. 1998; Newcomb et al. 1999). In brief,
TBI results in the increased activation of the two protease systems: the pro-necrotic
calpains and the pro-apoptotic caspase (Yuen and Wang 1998; Nicholson and Thornberry
1997; Wang 2000). Necrosis- or oncosis-linked, calpain-generated SBDP150 and
SBDP145 appear to be predominantly observed in brain tissues after early TBI in rats and
in humans (Pike et al. 1998; Pike et al. 2001). Smaller amounts of apoptosis-linked,
caspase-generated SBDP120 have been reported in certain brain regions (e.g. thalamus)
20
after TBI (Raghupathi et al. 2000). The same has been seen following ischemic brain
injury (Pettigrew et al. 1996) and in PC-12 cells challenged by ceramide (Xie and
Johnson 1997). However, both calpain and caspase inhibitors have been shown to
decrease neurotoxicity levels following TBI (Kupina et al. 2001; Buki et al. 2003;
Knoblach et al. 2004).
Thus, calpain and caspase cleaved spectrin and tau biomarkers are proving useful in
the study and management of TBI and its patient population. The same concepts may be
applicable to other injuries involving the same proteolytic systems in the brain.
Potential Use of Proteomics in Drug Abuse
Neurotoxicity biomarkers
Currently, no diagnostic or pharmacological therapy exists to diagnose or treat
acute Meth or MDMA neurotoxicity (Huber et al. 1997; Martin et al. 2003). The brain
derived neurochemical bioamines, dopamine, serotonin and their metabolites (DOPAC
and 5-HIAA) are used as blood biomarkers for MDMA neurotoxicity. However, such an
approach is nonspecific and does not correlate well with the severity of the brain
neurotoxicity (Ali et al. 1991). Similarly, in the case of Meth abuse, blood derived
myoglobin is used as a biomarker, also a nonspecific indicator of toxicity, but is more
indicative of Meth induced renal failure (Ishigami et al. 2003). Employing traditional
biochemical and immunological methods to identify specific biomarkers represents a
major challenge due to cost and the need for prior knowledge of the insult mechanisms
involved.
Our work aims to characterize neurotoxicity of club drug use by showing that the
same proteolytic markers in used TBI studies are present in the rat cortex and
hippocampus following acute overdose of Meth or MDMA. The dosages of club drugs
21
used here are known to be neurotoxic in animals and are squarely in the range of dosages
typically used by recreational Meth users after taking into consideration interspecies
scaling (Deng et al. 2002b). Although research literature thus far has strongly supported
an apoptosis-like cell injury mechanism with Meth neurotoxicity (Deng et al. 2002b), this
is in contrast to the mode of cell death in TBI, which has a mixture of oncosis and
apoptosis (Pike et al. 1998; Raghupathi et al. 2000), with the former being the
predominant mode of cell death. We hypothesize that in the case of Meth or MDMA
exposure, brain tissue such as cortex or hippocampus will have detectable levels of
SBDPs and TBDPs comparable to that of TBI and that the form(s) of cell death can be
examined using the previously mentioned cell death specific biomarkers. This will allow
us to characterize the induced cell toxicity as calpain- or caspase-induced and make a
direct comparison to that of brain trauma.
Neuroendocrine biomarkers
To study the neuroendocrine toxicity of club drugs and their wasting effect, a
number of important hormones have been identified that may prove useful as indeces.
For example, the physiological interactions between the metabolic hormones leptin and
ghrelin have been shown to affect food intake and energy regulation. Leptin is produced
mainly by adipose tissue in quantities that are proportional to the amount of adipose
tissue in the body. Leptin acts to decrease appetite and increase metabolism by the
following mechanisms: (1) stimulating proopiomelanocortin (POMC)/cocaine and (2)
amphetamine-regulated transcript (CART) neurons, which suppress food intake, and (3)
inhibiting NPY/ Agouti gene-related protein (AgRP) neurons, which stimulate food
intake (Kalra and Kalra 2004; Noguerias et al. 2004; Hosada et al. 2002). Ghrelin, which
is principally secreted by the stomach, increases appetite and decreases metabolism.
22
Ghrelin acts by activating NPY/AgRP neurons, stimulating the release of growth
hormone, which stimulates feeding and weight gain (Nogueiras et al. 2004). Research
has shown that both leptin and ghrelin hormones interact to mediate appetite (Nogueiras
et al. 2004; Hosada et al. 2002). Growth hormone (GH) increases feeding behavior by
interactions with hypothalamic pathways that are involved in appetite regulation and
energy balance (Egecioglu et al. 2005). Research has demonstrated that GH may mediate
its orexigenic effects by interacting with GH receptors on NPY neurons in the arcuate
nucleus. This interaction results in a subsequent increase in the production of NPY,
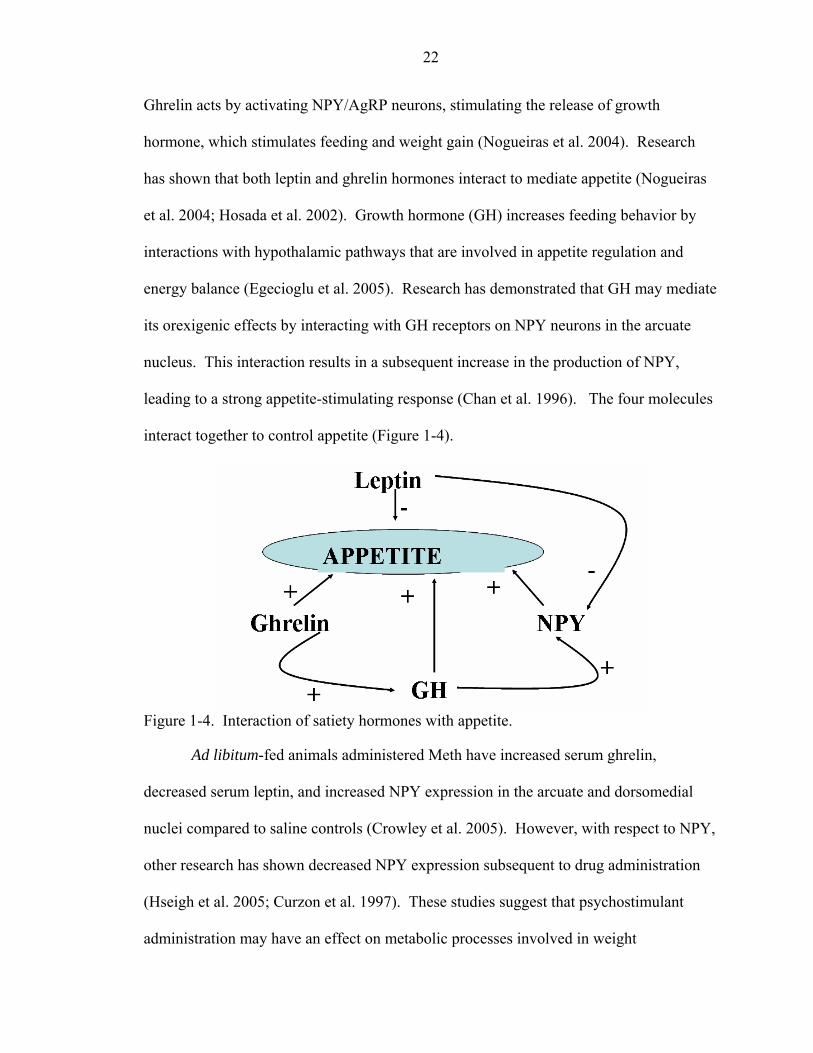
leading to a strong appetite-stimulating response (Chan et al. 1996). The four molecules
interact together to control appetite (Figure 1-4).
Figure 1-4. Interaction of satiety hormones with appetite.
Ad libitum-fed animals administered Meth have increased serum ghrelin,
decreased serum leptin, and increased NPY expression in the arcuate and dorsomedial
nuclei compared to saline controls (Crowley et al. 2005). However, with respect to NPY,
other research has shown decreased NPY expression subsequent to drug administration
(Hseigh et al. 2005; Curzon et al. 1997). These studies suggest that psychostimulant
administration may have an effect on metabolic processes involved in weight
23
maintenance by altering the concentrations of hormones involved in appetite regulation.
Thus, our work also examines of the effects of acute MDMA and Meth administration on
the serum concentrations of leptin, ghrelin, growth hormone and NPY to determine if
changes in these hormones occur and correlate with weight loss. This has the potential to
explain, predict or monitor anorexia resulting from drug use.
CHAPTER 2 METHODS
Animal Treatment
All experiments were performed using male Sprague-Dawley rats (Harlan,
Indianapolis, IN, USA) that were aged 60 days and weighed between 240 to 270 g.
Animals were housed in groups of two per cage and maintained on a 12 h light/dark cycle
(lights on 7 AM - 7 PM). Food and water were available ad libitum. Appropriate pre-
and post-injury management guidelines were maintained and these measures complied
with all guidelines set forth by the University of Florida (UF) Institutional Animal Care
and Use Committee (IACUC) and the National Institutes of Health (NIH) guidelines
detailed in the Guide for the Care and Use of Laboratory Animals.
Administration of Traumatic Brain Injury
A cortical impact injury device was used to produce traumatic brain injury (TBI) in
adult rats (Dixon et al. 1991; Pike et al. 1998). Cortical impact TBI results in cortical
deformation within the vicinity of the impactor tip associated with contusion and
neuronal and axonal damage largely confined to the hemisphere ipsilateral to the site of
injury. Rats were anesthetized with 4% isoflurane (Halocarbon Laboratories) in a carrier
gas of 1:1 O2:N2O (4 min) followed by maintenance anesthesia of 2.5% isoflurane in the
same carrier gas. Animals were mounted in a stereotactic frame in a prone position and
secured by ear and incisor bars. A midline cranial incision was made, the soft tissues
reflected and a unilateral (ipsilateral to the side of impact) craniotomy (7 mm diameter)
was performed adjacent to the central suture, midway between the bregma and lambda.
24
25
The dura mater was kept intact over the cortex. Brain trauma was produced by impacting
the right cortex (ipsilateral cortex) with a 5-mm diameter aluminum impactor tip (housed
in a pneumatic cylinder) at a velocity of 3.5 m/s with a 1.6 mm compression and 150 ms
dwell time pressure (compressed N2) supplied to the pneumatic cylinder, and dwell time
were measured by a linear velocity displacement transducer (model 500 HR; Lucas
ShaevitzTM) that produces an analog signal recorded by a storage-trace oscilloscope
(model 2522B; BK Precision). Sham-injured (craniotomy-injured) animals underwent
identical surgical procedures but did not receive the impact injury. Naïve animals
received no surgery or injury.
Drug Administration
Pharmacologic agents (±)-3,4-Methylenedioxymethamphetamine hydrochloride
(MDMA) and (+)-Methamphetamine hydrochloride (Meth) were obtained (Sigma). The
drugs were dissolved in 0.9% saline and injected intraperitoneally (IP) at dosage of 5, 10,
20, or 40 mg/kg. For the 20 and 40 mg/kg dosages, 10 mg/kg of drug was administered
at once and repeated each hour to achieve the desired dose over time to prevent lethal
hyperthermia. Saline was injected at a bolus of 0.3 cc. Animal weight was recorded at 3,
6, 12, 24, and 48 h post final injection.
Cortical Culture Preparations
Primary Cerebrocortical Culture
All cultures were prepared with four replicated wells for each condition.
Cerebrocortical cells harvested from a homogenized pool of ten 1-day old Sprague-
Dawley rat brains were plated on poly-L-lysine coated 6-well culture plates (Erie
Scientific) as previously described (Nath et al. 1998) at a density of 3 × 10⁶ cells/mL.
Cultures were maintained in Dulbecco’s modified Eagle’s medium (DMEM) with 10%
26
horse serum in a humidified incubator in an atmosphere of 10% CO2 at 37°C. After 3
days, the DMEM solution was replaced with DMEM / 10% horse serum containing 1%
cytosine arabinoside (ARC). Two days later, the solution was replaced with DMEM/10%
horse serum. The cells were cultured an additional 10 days before use.
Neurotoxin Challenges and Pharmacologic Intervention
In addition to untreated controls, the following conditions were used: N-methyl-D-
aspartic acid (NMDA) as a positive control for excitotoxicity (300 µM; Sigma), MDMA
(1 mM and 2 mM; Sigma), and Meth (1 mM and 2 mM; Sigma) for 24 or 48 h. For
pharmacologic intervention, additional cultures were pretreated 1 hour before MDMA or
Meth (2 mM) challenge with 30 µM of the calpain inhibitor SJA6017 (Calbiochem) or
caspase inhibitors z-VAD-fmk (Bachem) or Z-D-DCB (Bachem) and collected after 48 h.
Additional cultures were prepared combining SJA with either z-VAD-fmk or Z-D-DCB.
Quantification of Cell Injury or Death
Lactate dehydrogenase (LDH) release was measured using the commercial kit
CytoToxicity 96 (Promega). The kit measures the reduction of nicotinamide adenine
dinucleotide (NAD), indicating that primary necrosis and/or secondary necrosis following
apoptosis has occurred (Nath et al. 1996; Posmantur et al. 1998).
Cell Lysate Collection and Preparation
The primary neuronal cell culture cells were collected and lysed during a 90 min
incubation at 4oC in lysis buffer consisting of 50 mM Tris (pH 7.4), 5 mM
ethylenediaminetetraacetic acid (EDTA), 1% (v/v) Triton X-100, 1 mM dithiothreitol
(DTT), and 1x protease inhibitor cocktail (Roche Biochemicals). The cell lysates were
then centrifuged at 8000 g for 5 min at 4oC to clear and remove insoluble debris. The
supernatant was snap-frozen and stored at -80oC until use.
27
Western Blot
Tissue Collection
After the appropriate time point, animals were briefly anaesthetized and
immediately killed by decapitation. Brains and livers were immediately removed, rinsed
with ice cold PBS and entire brain regions (cerebral cortex and hippocampus) were
rapidly dissected, snap-frozen in liquid nitrogen, and frozen at –80oC until used. For
Western blot analysis, the brain samples were pulverized with a small mortar-pastel set
over dry ice to a fine powder. The pulverized brain tissue powder was then lysed for 90
min at 4oC with 50 mM Tris (pH 7.4), 5 mM EDTA, 1% (v/v) Triton X-100, 1 mM DTT,
1x protease inhibitor cocktail. The brain lysates were then centrifuged at 8000 g for 5
min at 4oC to clear and remove insoluble debris, snap-frozen and stored at –80oC until
used. Cell culture positive controls were also used including cortical and hippocampal
neurons treated with necrosis-inducing maitotoxin (MTX) (Wang et al. 1996) or
apoptosis-inducing staurosporine (STS) (Nath et al. 1996).
Gel Electrophoresis and Electrotransfer
Protein concentrations of tissue lysates were determined by bicinchoninic acid
microprotein assays (Pierce Inc.) with albumin standards. Protein balanced samples were
prepared for sodium dodecyl sulfate-polyacrylamide gel electrophoresis (SDS-PAGE) in
two-fold loading buffer containing 0.25 M Tris (pH 6.8), 0.1 mM DTT, 8% SDS, 0.02%
bromophenol blue, and 20% glycerol in distilled H2O. Samples were heated for 10 min
at 100oC and centrifuged for 2 min at 8000 rpm in a microcentrifuge at ambient
temperatures. Twenty micrograms of protein per lane were routinely resolved by SDS-
PAGE on Tris/glycine gels (6.5% for spectrin, 10-20% for tau) for 2 h at 200 V.
Following electrophoresis, separated proteins were laterally transferred to polyvinylidene
28
fluoride (PVDF) membranes in a transfer buffer containing 0.192 M glycine and 0.025 M
Tris (pH 8.3) 10% methanol at a constant voltage of 100 V for 1 h at 4oC. Blots were
blocked for 1 h at ambient temperature in 5% non-fat milk in TBS and 0.05% Tween-20.
Gels were stained with Ponceau Red (Sigma) to confirm successful transfer of protein
and to insure that an equal amount of protein was loaded in each lane.
Immunoblot Analyses of Samples
Blotting membranes containing tissue protein were probed with a primary antibody
(mouse monoclonal or rabbit polyclonal) as needed by incubating blots overnight at 4°C
in tris-buffered saline with Tween (TBST) (20 mM Tris-HCl, pH 7.4, 150 mM NaCl +
0.05 % Tween 20) with 5% non-fat milk. Primary antibodies included monoclonal anti-
αII-spectrin (SBDPs) (Amersham), polyclonal anti-SBDP150 for calpain, polyclonal anti-
SBDP145 for calpain, polyclonal anti-SBDP120 for caspase, monoclonal anti-tau
(TBDPs) (Cedarlane), polyclonal anti-TBDP45, or monoclonal anti-NF-200. After
extensive washing with TBST, the blots were probed with secondary antibody
(horseradish peroxidase-conjugated goat anti-mouse IgG or goat anti-rabbit IgG (1:5000
dilution)). Following three washes with TBST and 2 h incubation at room temperature
with a biotinylated secondary antibody (Amersham), the membrane was incubated for 1 h
with Streptavidin-conjugated alkaline phosphatase. Finally, colorimetric development
was performed with the one-step BCIP-reagent (KPL). The molecular weights of the
intact proteins and their potential breakdown products were measured using rainbow
colored molecular weight standards (Amersham). Semi-quantitative evaluation of protein
levels was performed via computer-assisted densitometric scanning (NIH ImageJ
software). β-actin was displayed to show loading equivalence.
29
Immunohistochemistry
At the appropriate time point, the animals were anesthetized using 4% isoflurane in
a carrier gas of 1:1 O2/N2O (4 min), subsequently perfused with 0.9% saline (pH 7.4)
followed by 400 mL 4% paraformaldehyde in 0.1 M phosphate buffer (pH 7.4) (fix) and
then killed by decapitation and brains were removed. A total of 2 h in fix was followed
by storage in cryoprotection buffer. Vibratome-cut 40 µM sections were fluorescently
immunolabeled with cell type-specific monoclonal antibodies, proteolytic specific
polyclonal antibodies and a nuclear counterstain. Briefly, tissue sections were rinsed in
phosphate buffered saline (PBS) then incubated for 1 h at room temperature in 2% goat
serum/2% horse serume/0.2% Triton-X 100 in Tris-buffered saline (TBS; block) to
decrease non-specific labeling. The sections were incubated with two primary
antibodies: one of the cell-type specific mouse anti-neuron specific nuclear protein
antibody (neuronal nuclei-anti-NeuN) at a concentration of 1:100 (Chemicon), the mouse
anti-glial acidic fibrillary protein antibody for astrocytes (anti-GFAP) at a concentration
of 1:1000 (Sternberger Monoclonals), the mouse anti-myelin basic protein antibody for
oligodendrocytes (anti-MBP) at a concentration of 1:1000 (Chemicon), the mouse anti-
microglia-specific antibody for resting/activated microglia (anti-OX42) at a concentration
of 1:1000 (Serotec, Inc.) or the mouse anti-neurofilament-200-specific protein antibody
(anti-NF200) at a concentration of 1:1000 (Chemicon) and one of either the rabbit anti-
calpain-1 at a concentration of 1:500, rabbit anti-SBDP145 at a concentration of 1:500,
rabbit anti-caspase-3 at a concentration of 1:1000, or rabbit anti-SBDP120 at a
concentration of 1:1000 for 4 days in block at 4oC. After being rinsed in PBS, the tissue
sections were incubated with species-specific Alexa Fluor (Molecular Probes, Inc.)
secondary antibodies, either Alexa Fluor 485 or 594, at a concentration of 1:3000 in
30
block for 1 h at room termperature. The sections were then washed in PBS, cover-
slipped in Vectashield with 4’-6-diamidino-2-phenylindole (DAPI) (Vector
Laboratories), viewed and digitally-captured with a Zeiss Axiovert 200 microscope
equipped with a Spot Real Time (RT) Slider high resolution color digital camera
(Diagnostic Instruments, Inc.). Sections without secondary antibodies were similarly
processed to control for binding of the primary antibodies, as were sections without
primary antibodies and also sections with neither primary nor secondary antibodies. On
control sections, no specific immunoreactivity was detected.
Radioimmunoassays
After the desired time periods, rats were sacrificed by decapitation and trunk blood
was collected. Serum was isolated from collected blood samples by centrifugation (4,000
x g) and stored at -80°C until use. Concentrations of serum leptin, total ghrelin, growth
hormone, and neuropeptide-Y (NPY) levels were determined in duplicate with
radioimmunoassay (RIA) kits following the manufacturer’s protocols: Leptin (RL-83K),
Ghrelin (total, GHRT-89HK), and Growth Hormone (RGH-45HK) from Linco and
Neuropeptide-Y (RK-049-03) from Phoenix Pharmaceuticals.
Statistical Tests
Western Blot Analyses
Quantitative evaluation of protein levels on immunoblots was performed via
computer-assisted 1-dimensional densitometric scanning (Hewlett Packard Scan-Jet
6300) coupled with ImageJ software (NIH). Data were acquired in arbitrary
densitometric units and transformed to percentages of the densitometric levels obtained
from scans of control samples visualized on the same blots. This procedure was
corrected for between-gel differences in film exposure and will allow for comparison of
31
density values between gels. Changes in any outcome parameter were compared to the
appropriate control group. Thus, magnitude of change from control in one model system
could be directly compared to magnitude of change from any other model system. Data
was acquired as integrated densitometric values and transformed to percentages of the
densitometric levels obtained on scans from saline administered animals visualized in the
same blot. All values are given as mean +/- standard error of measurement (SEM).
Differences among means of treatment groups were compared using a one-way analysis
of variance (ANOVA) test at an alpha level of 0.05. Bonferroni or Dunnett post-hoc
pairwise comparison tests were used to test for differences between specific treatment
groups at an alpha level of 0.05. Student’s T-tests were used to compare timepoints.
Radioimmunoassays
All data presented are expressed as mean ± SEM. Experimental data were analyzed
using one-way ANOVA followed by Bonferroni post hoc pairwise comparison tests.
Differences were compared among treatment groups at each time point. An alpha level
of 0.05 was used to determine statistical significance.
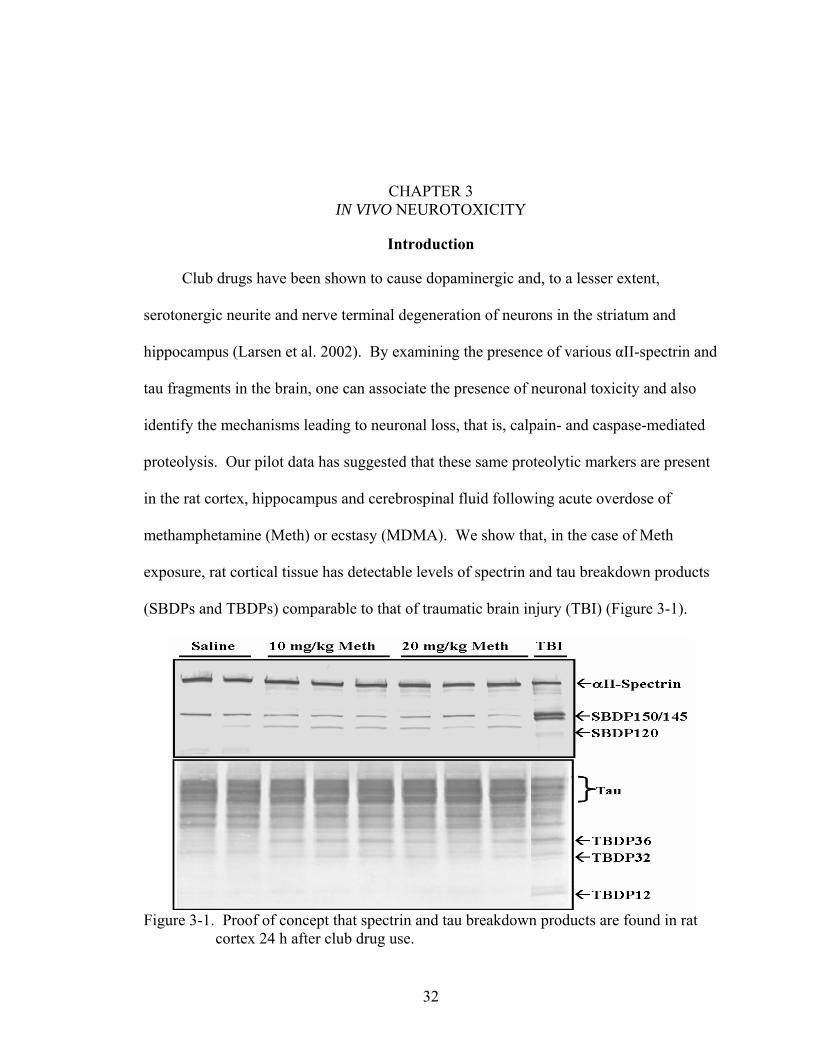
CHAPTER 3 IN VIVO NEUROTOXICITY
Introduction
Club drugs have been shown to cause dopaminergic and, to a lesser extent,
serotonergic neurite and nerve terminal degeneration of neurons in the striatum and
hippocampus (Larsen et al. 2002). By examining the presence of various αII-spectrin and
tau fragments in the brain, one can associate the presence of neuronal toxicity and also
identify the mechanisms leading to neuronal loss, that is, calpain- and caspase-mediated
proteolysis. Our pilot data has suggested that these same proteolytic markers are present
in the rat cortex, hippocampus and cerebrospinal fluid following acute overdose of
methamphetamine (Meth) or ecstasy (MDMA). We show that, in the case of Meth
exposure, rat cortical tissue has detectable levels of spectrin and tau breakdown products
(SBDPs and TBDPs) comparable to that of traumatic brain injury (TBI) (Figure 3-1).
Figure 3-1. Proof of concept that spectrin and tau breakdown products are found in rat
cortex 24 h after club drug use.
32
33
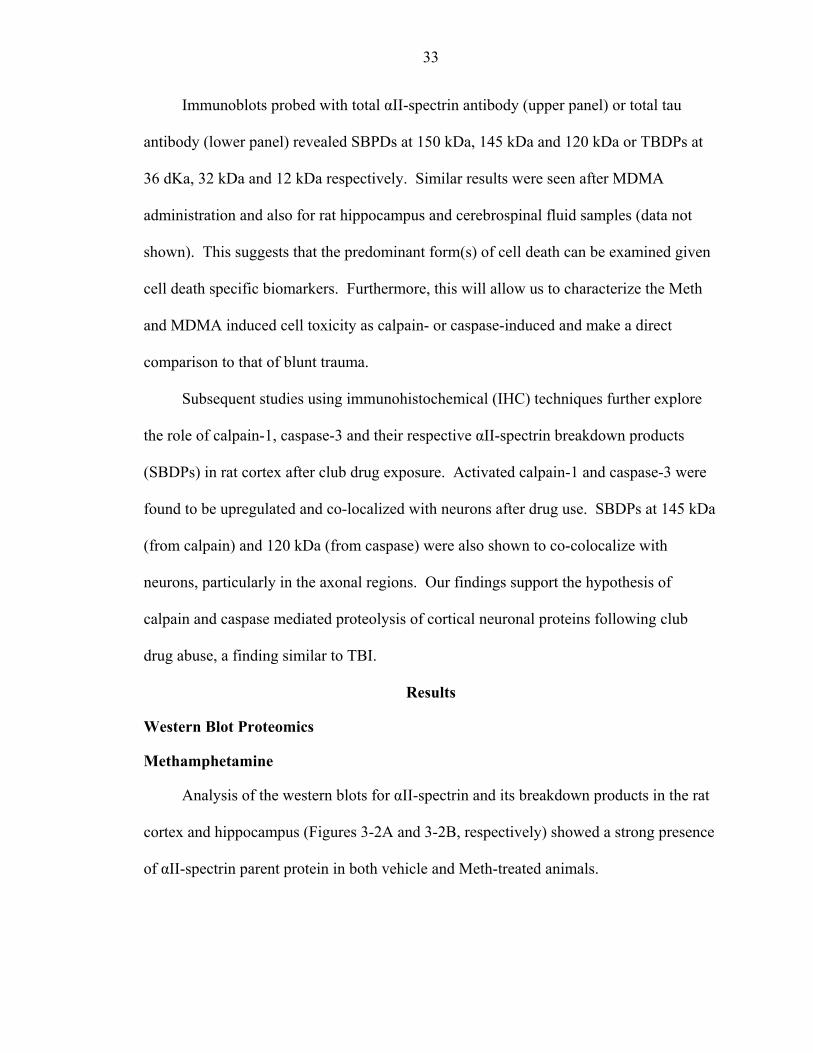
Immunoblots probed with total αII-spectrin antibody (upper panel) or total tau
antibody (lower panel) revealed SBPDs at 150 kDa, 145 kDa and 120 kDa or TBDPs at
36 dKa, 32 kDa and 12 kDa respectively. Similar results were seen after MDMA
administration and also for rat hippocampus and cerebrospinal fluid samples (data not
shown). This suggests that the predominant form(s) of cell death can be examined given
cell death specific biomarkers. Furthermore, this will allow us to characterize the Meth
and MDMA induced cell toxicity as calpain- or caspase-induced and make a direct
comparison to that of blunt trauma.
Subsequent studies using immunohistochemical (IHC) techniques further explore
the role of calpain-1, caspase-3 and their respective αII-spectrin breakdown products
(SBDPs) in rat cortex after club drug exposure. Activated calpain-1 and caspase-3 were
found to be upregulated and co-localized with neurons after drug use. SBDPs at 145 kDa
(from calpain) and 120 kDa (from caspase) were also shown to co-colocalize with
neurons, particularly in the axonal regions. Our findings support the hypothesis of
calpain and caspase mediated proteolysis of cortical neuronal proteins following club
drug abuse, a finding similar to TBI.
Results
Western Blot Proteomics
Methamphetamine
Analysis of the western blots for αII-spectrin and its breakdown products in the rat
cortex and hippocampus (Figures 3-2A and 3-2B, respectively) showed a strong presence
of αII-spectrin parent protein in both vehicle and Meth-treated animals.
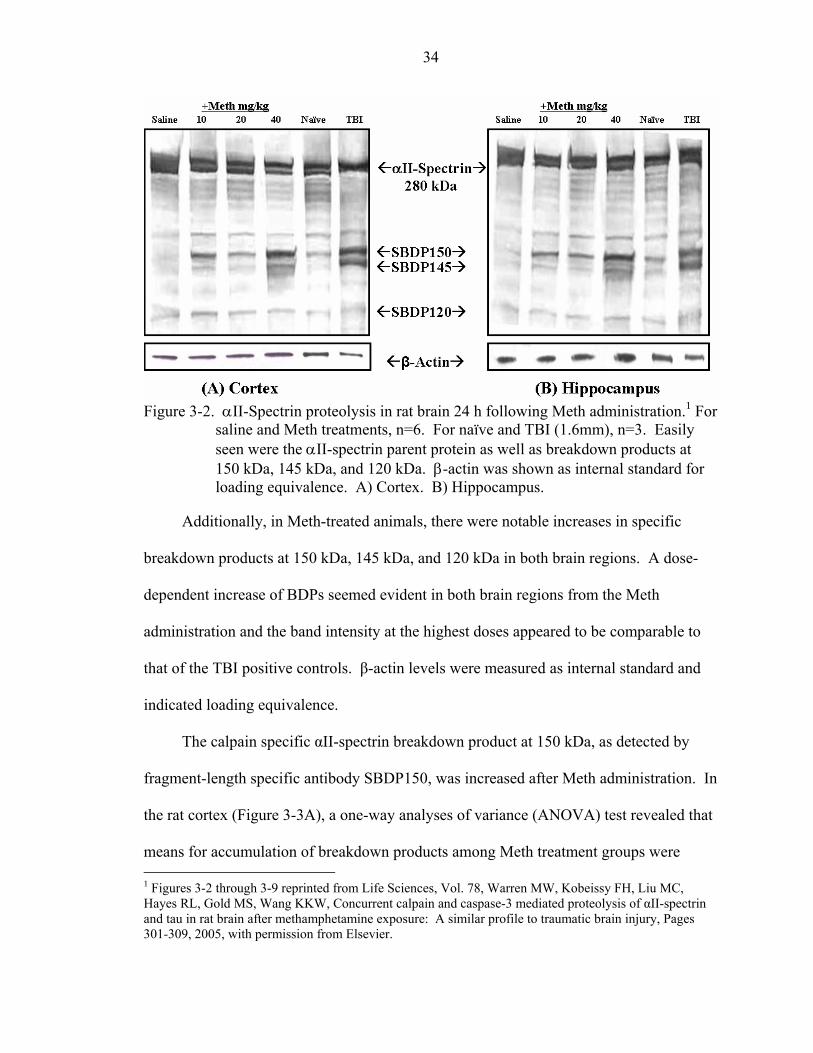
34
Figure 3-2. αII-Spectrin proteolysis in rat brain 24 h following Meth administration.1 For
saline and Meth treatments, n=6. For naïve and TBI (1.6mm), n=3. Easily seen were the αII-spectrin parent protein as well as breakdown products at 150 kDa, 145 kDa, and 120 kDa. β-actin was shown as internal standard for loading equivalence. A) Cortex. B) Hippocampus.
Additionally, in Meth-treated animals, there were notable increases in specific
breakdown products at 150 kDa, 145 kDa, and 120 kDa in both brain regions. A dose-
dependent increase of BDPs seemed evident in both brain regions from the Meth
administration and the band intensity at the highest doses appeared to be comparable to
that of the TBI positive controls. β-actin levels were measured as internal standard and
indicated loading equivalence.
The calpain specific αII-spectrin breakdown product at 150 kDa, as detected by
fragment-length specific antibody SBDP150, was increased after Meth administration. In
the rat cortex (Figure 3-3A), a one-way analyses of variance (ANOVA) test revealed that
means for accumulation of breakdown products among Meth treatment groups were 1 Figures 3-2 through 3-9 reprinted from Life Sciences, Vol. 78, Warren MW, Kobeissy FH, Liu MC, Hayes RL, Gold MS, Wang KKW, Concurrent calpain and caspase-3 mediated proteolysis of αII-spectrin and tau in rat brain after methamphetamine exposure: A similar profile to traumatic brain injury, Pages 301-309, 2005, with permission from Elsevier.
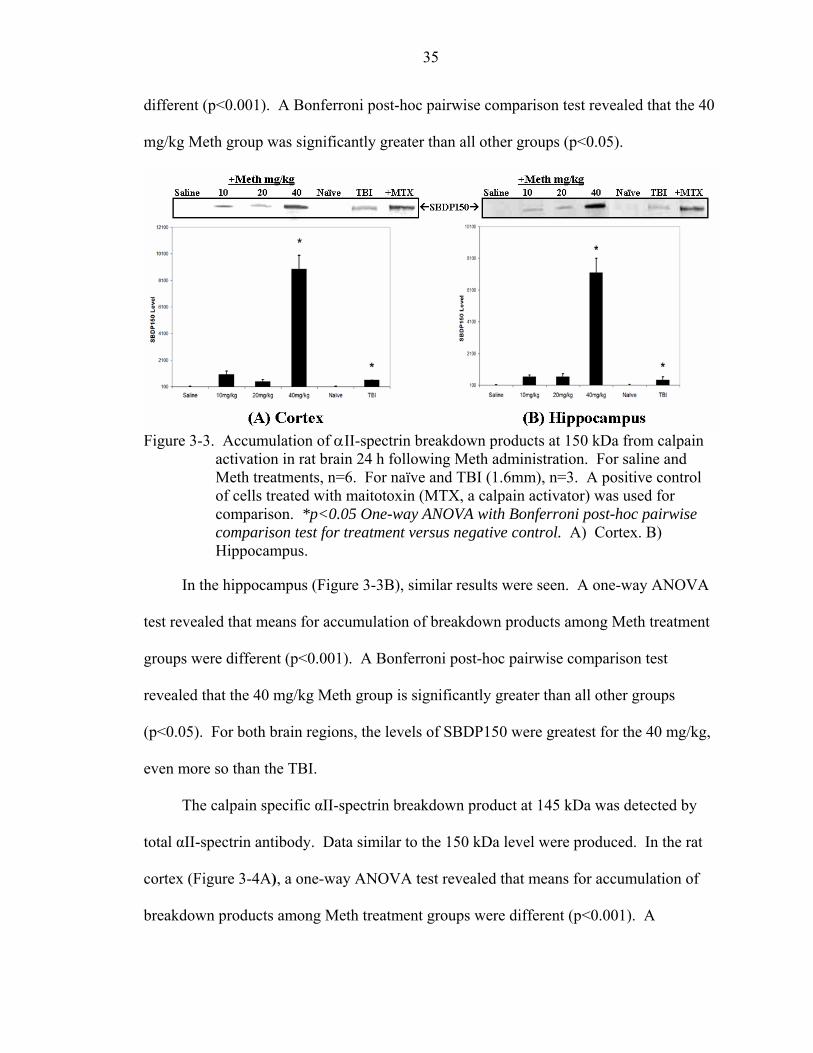
35
different (p<0.001). A Bonferroni post-hoc pairwise comparison test revealed that the 40
mg/kg Meth group was significantly greater than all other groups (p<0.05).
Figure 3-3. Accumulation of αII-spectrin breakdown products at 150 kDa from calpain
activation in rat brain 24 h following Meth administration. For saline and Meth treatments, n=6. For naïve and TBI (1.6mm), n=3. A positive control of cells treated with maitotoxin (MTX, a calpain activator) was used for comparison. *p<0.05 One-way ANOVA with Bonferroni post-hoc pairwise comparison test for treatment versus negative control. A) Cortex. B) Hippocampus.
In the hippocampus (Figure 3-3B), similar results were seen. A one-way ANOVA
test revealed that means for accumulation of breakdown products among Meth treatment
groups were different (p<0.001). A Bonferroni post-hoc pairwise comparison test
revealed that the 40 mg/kg Meth group is significantly greater than all other groups
(p<0.05). For both brain regions, the levels of SBDP150 were greatest for the 40 mg/kg,
even more so than the TBI.
The calpain specific αII-spectrin breakdown product at 145 kDa was detected by
total αII-spectrin antibody. Data similar to the 150 kDa level were produced. In the rat
cortex (Figure 3-4A), a one-way ANOVA test revealed that means for accumulation of
breakdown products among Meth treatment groups were different (p<0.001). A
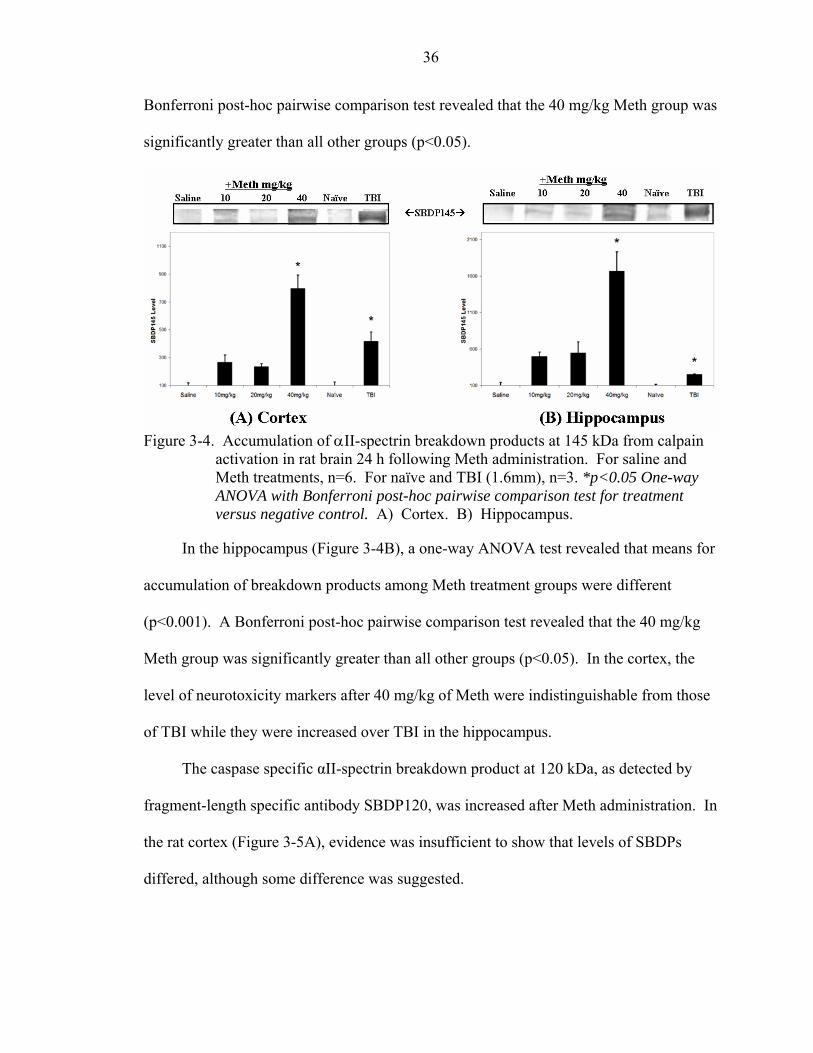
36
Bonferroni post-hoc pairwise comparison test revealed that the 40 mg/kg Meth group was
significantly greater than all other groups (p<0.05).
Figure 3-4. Accumulation of αII-spectrin breakdown products at 145 kDa from calpain
activation in rat brain 24 h following Meth administration. For saline and Meth treatments, n=6. For naïve and TBI (1.6mm), n=3. *p<0.05 One-way ANOVA with Bonferroni post-hoc pairwise comparison test for treatment versus negative control. A) Cortex. B) Hippocampus.
In the hippocampus (Figure 3-4B), a one-way ANOVA test revealed that means for
accumulation of breakdown products among Meth treatment groups were different
(p<0.001). A Bonferroni post-hoc pairwise comparison test revealed that the 40 mg/kg
Meth group was significantly greater than all other groups (p<0.05). In the cortex, the
level of neurotoxicity markers after 40 mg/kg of Meth were indistinguishable from those
of TBI while they were increased over TBI in the hippocampus.
The caspase specific αII-spectrin breakdown product at 120 kDa, as detected by
fragment-length specific antibody SBDP120, was increased after Meth administration. In
the rat cortex (Figure 3-5A), evidence was insufficient to show that levels of SBDPs
differed, although some difference was suggested.
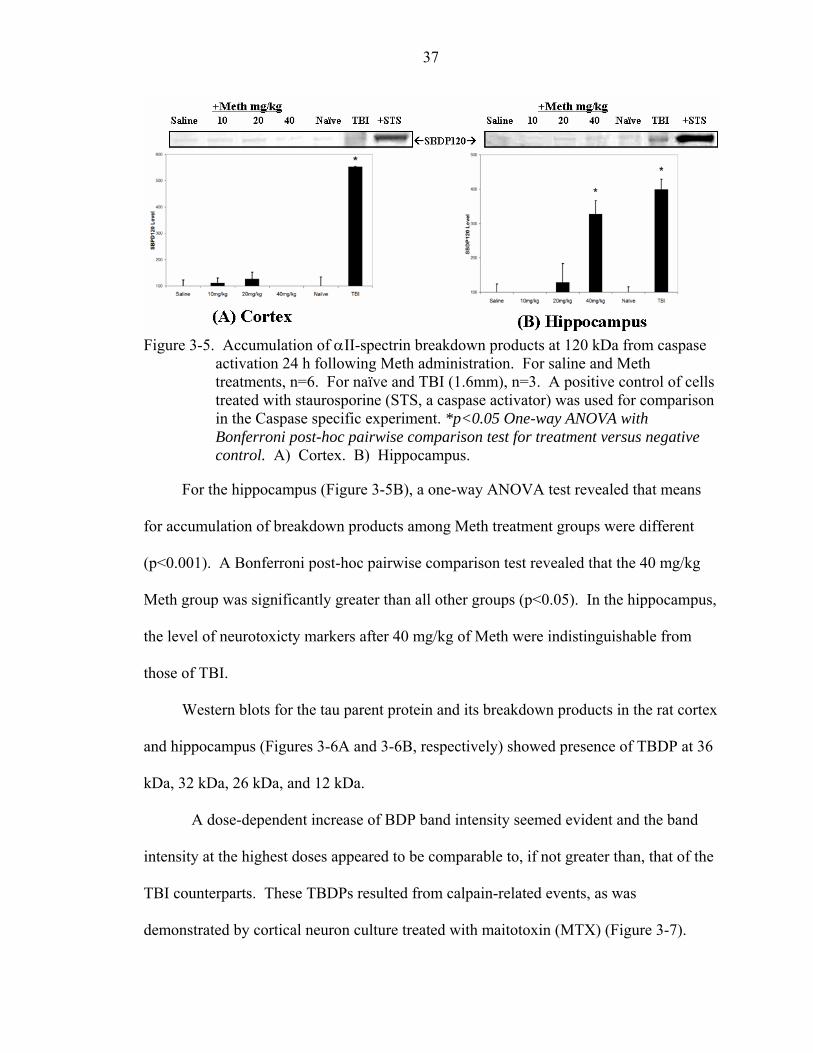
37
Figure 3-5. Accumulation of αII-spectrin breakdown products at 120 kDa from caspase
activation 24 h following Meth administration. For saline and Meth treatments, n=6. For naïve and TBI (1.6mm), n=3. A positive control of cells treated with staurosporine (STS, a caspase activator) was used for comparison in the Caspase specific experiment. *p<0.05 One-way ANOVA with Bonferroni post-hoc pairwise comparison test for treatment versus negative control. A) Cortex. B) Hippocampus.
For the hippocampus (Figure 3-5B), a one-way ANOVA test revealed that means
for accumulation of breakdown products among Meth treatment groups were different
(p<0.001). A Bonferroni post-hoc pairwise comparison test revealed that the 40 mg/kg
Meth group was significantly greater than all other groups (p<0.05). In the hippocampus,
the level of neurotoxicty markers after 40 mg/kg of Meth were indistinguishable from
those of TBI.
Western blots for the tau parent protein and its breakdown products in the rat cortex
and hippocampus (Figures 3-6A and 3-6B, respectively) showed presence of TBDP at 36
kDa, 32 kDa, 26 kDa, and 12 kDa.
A dose-dependent increase of BDP band intensity seemed evident and the band
intensity at the highest doses appeared to be comparable to, if not greater than, that of the
TBI counterparts. These TBDPs resulted from calpain-related events, as was
demonstrated by cortical neuron culture treated with maitotoxin (MTX) (Figure 3-7).
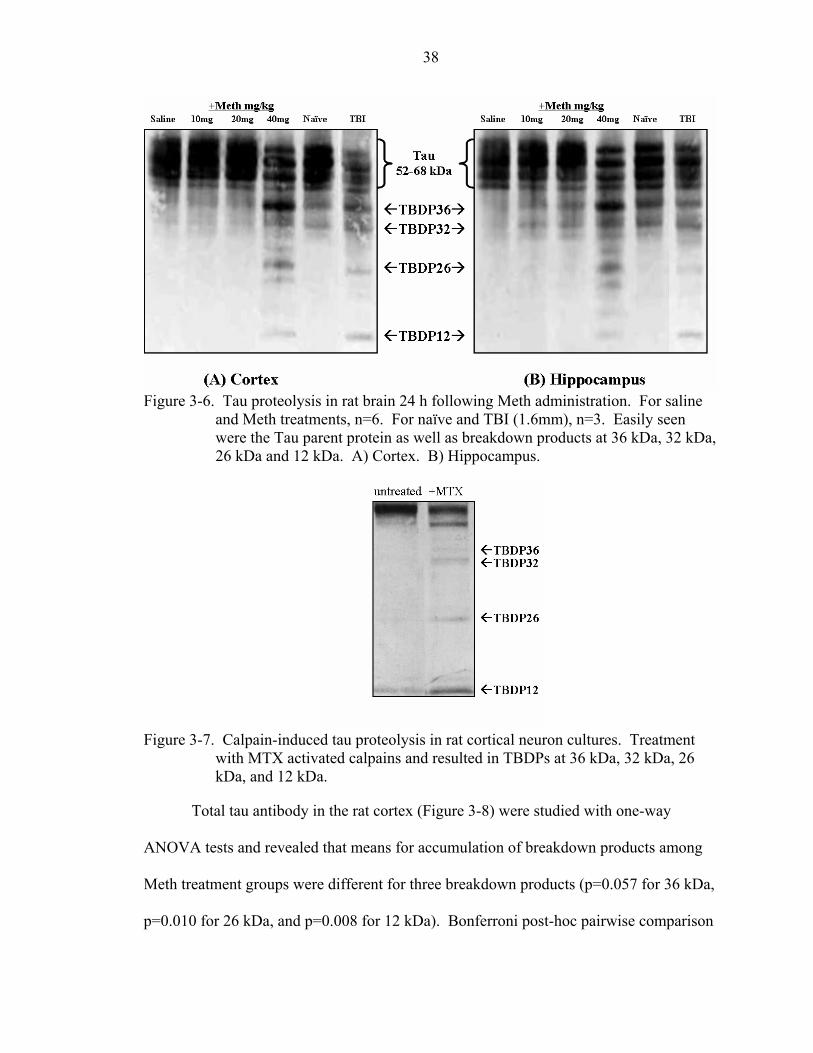
38
Figure 3-6. Tau proteolysis in rat brain 24 h following Meth administration. For saline
and Meth treatments, n=6. For naïve and TBI (1.6mm), n=3. Easily seen were the Tau parent protein as well as breakdown products at 36 kDa, 32 kDa, 26 kDa and 12 kDa. A) Cortex. B) Hippocampus.
Figure 3-7. Calpain-induced tau proteolysis in rat cortical neuron cultures. Treatment
with MTX activated calpains and resulted in TBDPs at 36 kDa, 32 kDa, 26 kDa, and 12 kDa.
Total tau antibody in the rat cortex (Figure 3-8) were studied with one-way
ANOVA tests and revealed that means for accumulation of breakdown products among
Meth treatment groups were different for three breakdown products (p=0.057 for 36 kDa,
p=0.010 for 26 kDa, and p=0.008 for 12 kDa). Bonferroni post-hoc pairwise comparison
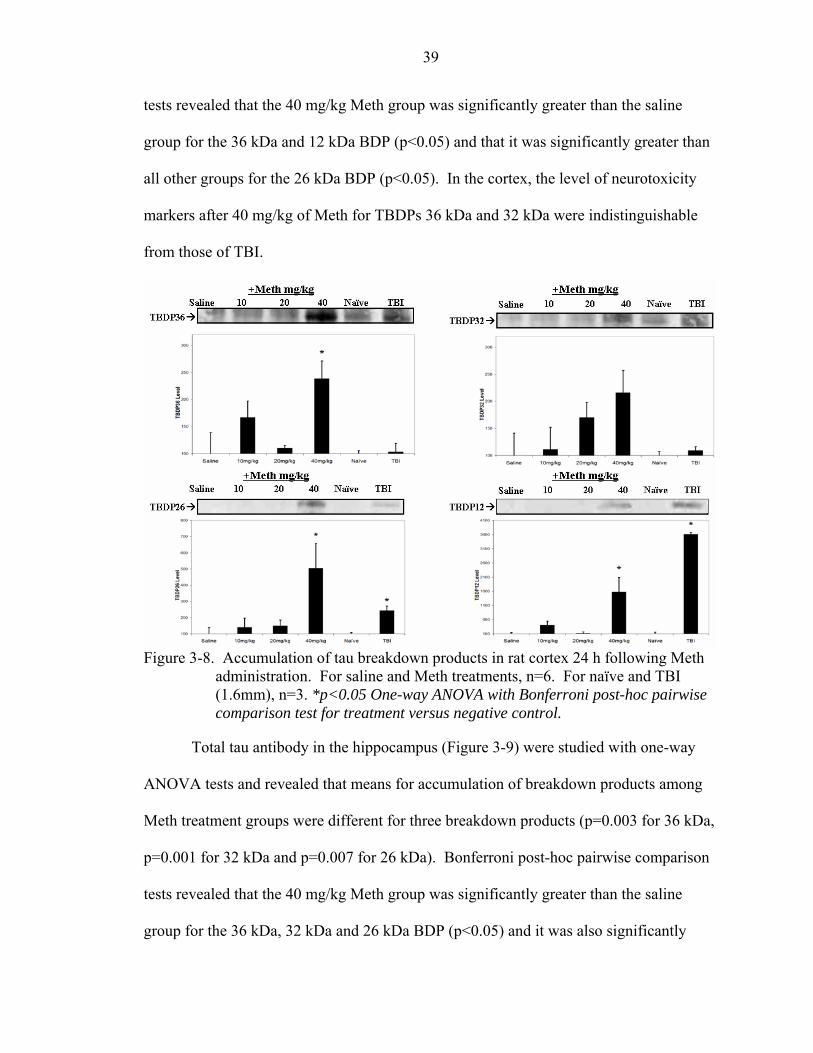
39
tests revealed that the 40 mg/kg Meth group was significantly greater than the saline
group for the 36 kDa and 12 kDa BDP (p<0.05) and that it was significantly greater than
all other groups for the 26 kDa BDP (p<0.05). In the cortex, the level of neurotoxicity
markers after 40 mg/kg of Meth for TBDPs 36 kDa and 32 kDa were indistinguishable
from those of TBI.
Figure 3-8. Accumulation of tau breakdown products in rat cortex 24 h following Meth
administration. For saline and Meth treatments, n=6. For naïve and TBI (1.6mm), n=3. *p<0.05 One-way ANOVA with Bonferroni post-hoc pairwise comparison test for treatment versus negative control.
Total tau antibody in the hippocampus (Figure 3-9) were studied with one-way
ANOVA tests and revealed that means for accumulation of breakdown products among
Meth treatment groups were different for three breakdown products (p=0.003 for 36 kDa,
p=0.001 for 32 kDa and p=0.007 for 26 kDa). Bonferroni post-hoc pairwise comparison
tests revealed that the 40 mg/kg Meth group was significantly greater than the saline
group for the 36 kDa, 32 kDa and 26 kDa BDP (p<0.05) and it was also significantly
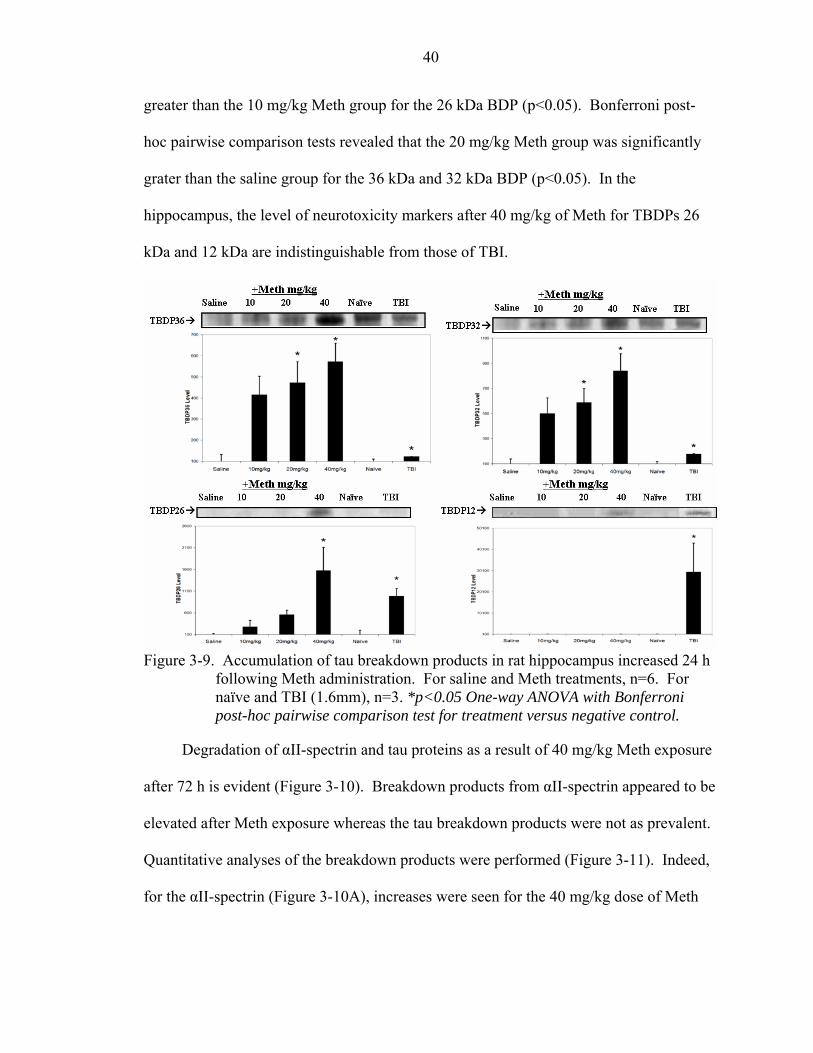
40
greater than the 10 mg/kg Meth group for the 26 kDa BDP (p<0.05). Bonferroni post-
hoc pairwise comparison tests revealed that the 20 mg/kg Meth group was significantly
grater than the saline group for the 36 kDa and 32 kDa BDP (p<0.05). In the
hippocampus, the level of neurotoxicity markers after 40 mg/kg of Meth for TBDPs 26
kDa and 12 kDa are indistinguishable from those of TBI.
Figure 3-9. Accumulation of tau breakdown products in rat hippocampus increased 24 h
following Meth administration. For saline and Meth treatments, n=6. For naïve and TBI (1.6mm), n=3. *p<0.05 One-way ANOVA with Bonferroni post-hoc pairwise comparison test for treatment versus negative control.
Degradation of αII-spectrin and tau proteins as a result of 40 mg/kg Meth exposure
after 72 h is evident (Figure 3-10). Breakdown products from αII-spectrin appeared to be
elevated after Meth exposure whereas the tau breakdown products were not as prevalent.
Quantitative analyses of the breakdown products were performed (Figure 3-11). Indeed,
for the αII-spectrin (Figure 3-10A), increases were seen for the 40 mg/kg dose of Meth
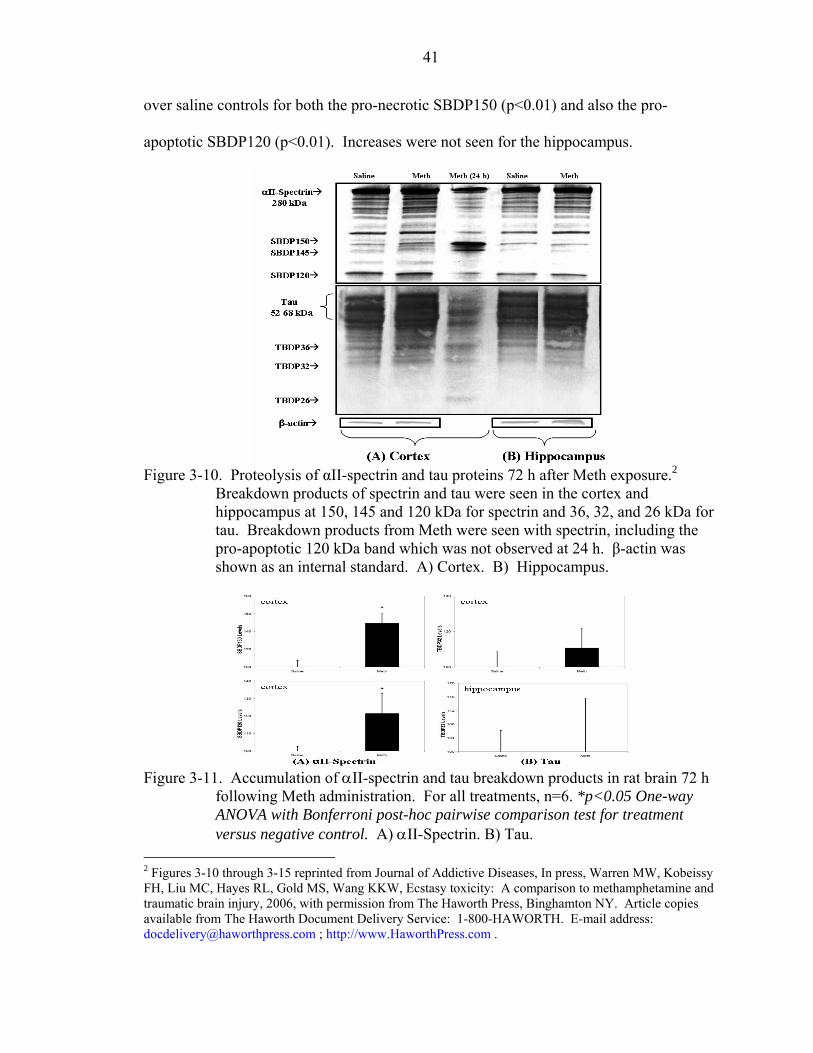
41
over saline controls for both the pro-necrotic SBDP150 (p<0.01) and also the pro-
apoptotic SBDP120 (p<0.01). Increases were not seen for the hippocampus.
Figure 3-10. Proteolysis of αII-spectrin and tau proteins 72 h after Meth exposure.2
Breakdown products of spectrin and tau were seen in the cortex and hippocampus at 150, 145 and 120 kDa for spectrin and 36, 32, and 26 kDa for tau. Breakdown products from Meth were seen with spectrin, including the pro-apoptotic 120 kDa band which was not observed at 24 h. β-actin was shown as an internal standard. A) Cortex. B) Hippocampus.
Figure 3-11. Accumulation of αII-spectrin and tau breakdown products in rat brain 72 h
following Meth administration. For all treatments, n=6. *p<0.05 One-way ANOVA with Bonferroni post-hoc pairwise comparison test for treatment versus negative control. A) αII-Spectrin. B) Tau.
2 Figures 3-10 through 3-15 reprinted from Journal of Addictive Diseases, In press, Warren MW, Kobeissy FH, Liu MC, Hayes RL, Gold MS, Wang KKW, Ecstasy toxicity: A comparison to methamphetamine and traumatic brain injury, 2006, with permission from The Haworth Press, Binghamton NY. Article copies available from The Haworth Document Delivery Service: 1-800-HAWORTH. E-mail address: [email protected] ; http://www.HaworthPress.com .
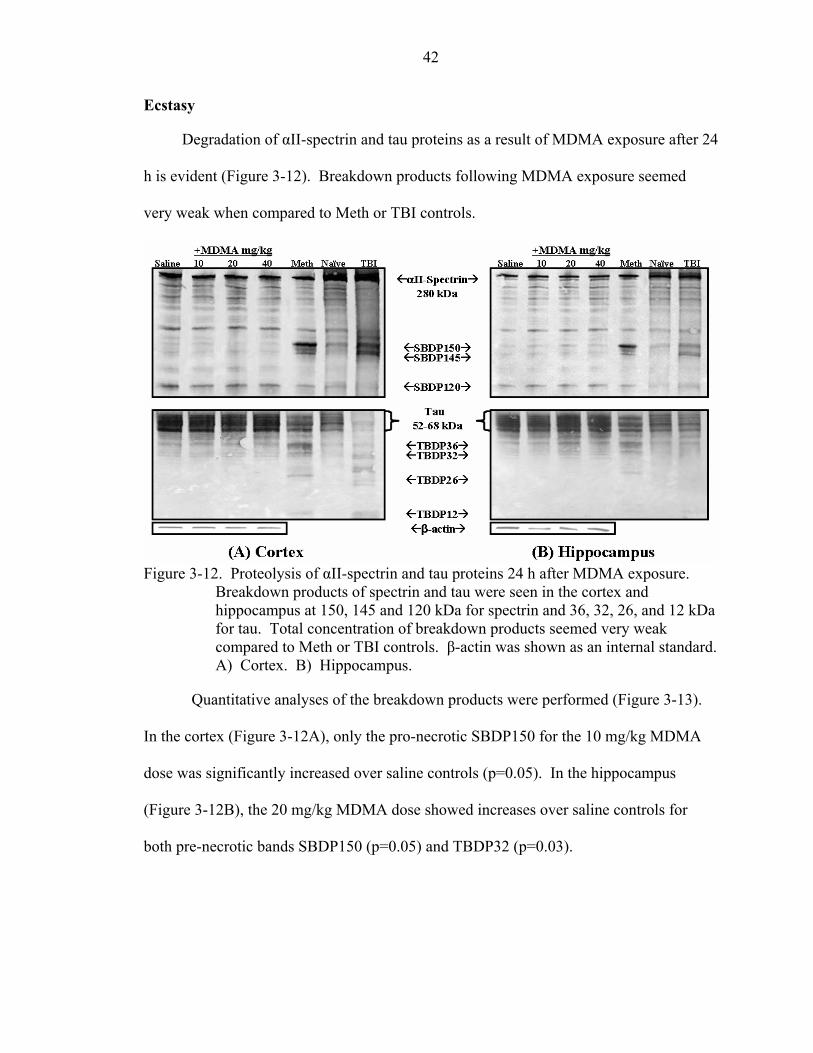
42
Ecstasy
Degradation of αII-spectrin and tau proteins as a result of MDMA exposure after 24
h is evident (Figure 3-12). Breakdown products following MDMA exposure seemed
very weak when compared to Meth or TBI controls.
Figure 3-12. Proteolysis of αII-spectrin and tau proteins 24 h after MDMA exposure.
Breakdown products of spectrin and tau were seen in the cortex and hippocampus at 150, 145 and 120 kDa for spectrin and 36, 32, 26, and 12 kDa for tau. Total concentration of breakdown products seemed very weak compared to Meth or TBI controls. β-actin was shown as an internal standard. A) Cortex. B) Hippocampus.
Quantitative analyses of the breakdown products were performed (Figure 3-13).
In the cortex (Figure 3-12A), only the pro-necrotic SBDP150 for the 10 mg/kg MDMA
dose was significantly increased over saline controls (p=0.05). In the hippocampus
(Figure 3-12B), the 20 mg/kg MDMA dose showed increases over saline controls for
both pre-necrotic bands SBDP150 (p=0.05) and TBDP32 (p=0.03).
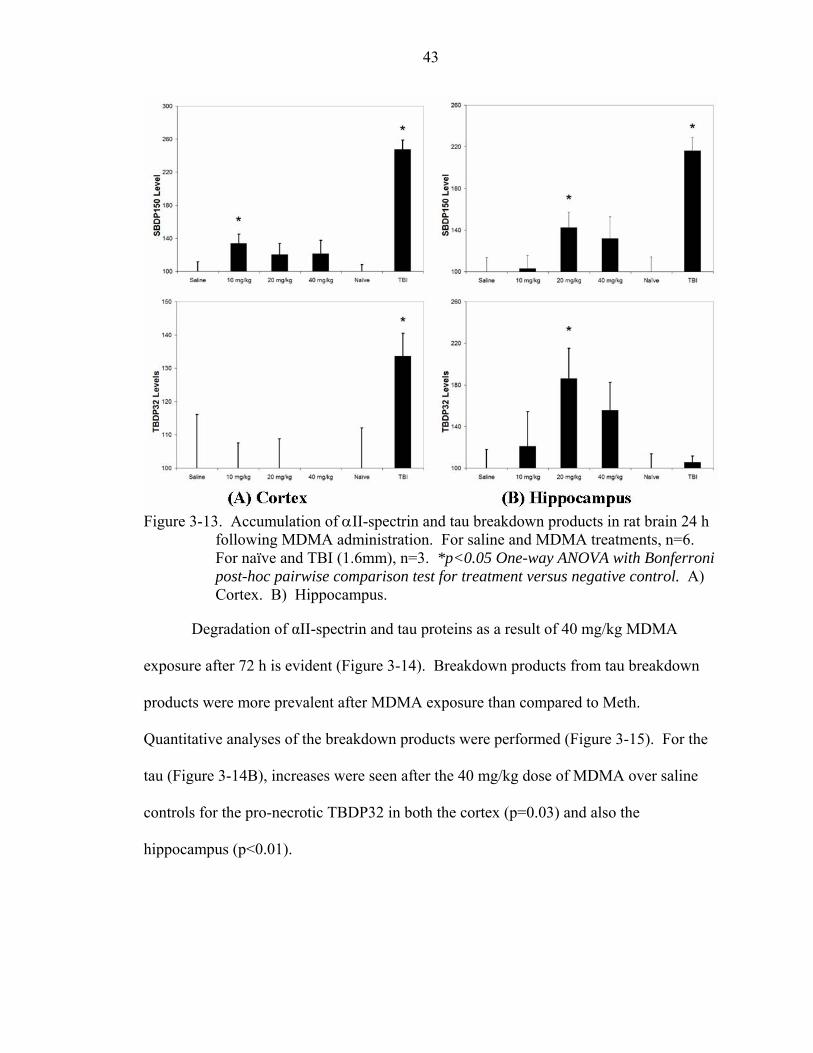
43
Figure 3-13. Accumulation of αII-spectrin and tau breakdown products in rat brain 24 h
following MDMA administration. For saline and MDMA treatments, n=6. For naïve and TBI (1.6mm), n=3. *p<0.05 One-way ANOVA with Bonferroni post-hoc pairwise comparison test for treatment versus negative control. A) Cortex. B) Hippocampus.
Degradation of αII-spectrin and tau proteins as a result of 40 mg/kg MDMA
exposure after 72 h is evident (Figure 3-14). Breakdown products from tau breakdown
products were more prevalent after MDMA exposure than compared to Meth.
Quantitative analyses of the breakdown products were performed (Figure 3-15). For the
tau (Figure 3-14B), increases were seen after the 40 mg/kg dose of MDMA over saline
controls for the pro-necrotic TBDP32 in both the cortex (p=0.03) and also the
hippocampus (p<0.01).
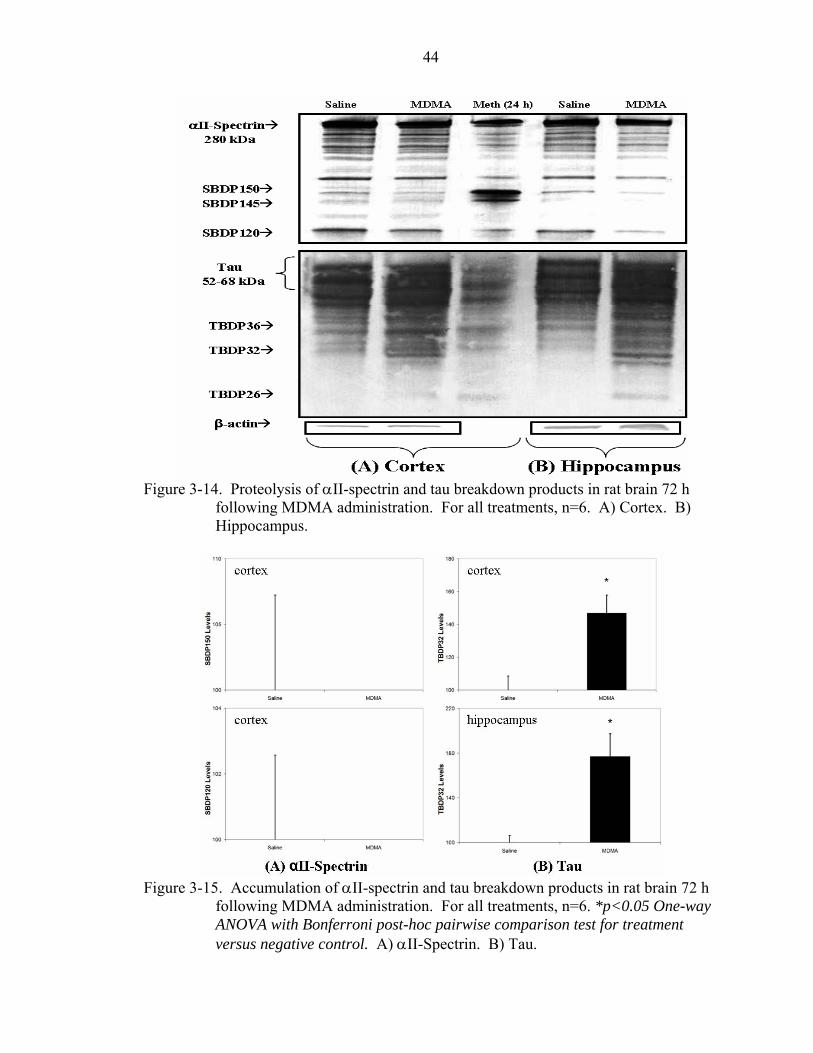
44
Figure 3-14. Proteolysis of αII-spectrin and tau breakdown products in rat brain 72 h
following MDMA administration. For all treatments, n=6. A) Cortex. B) Hippocampus.
Figure 3-15. Accumulation of αII-spectrin and tau breakdown products in rat brain 72 h
following MDMA administration. For all treatments, n=6. *p<0.05 One-way ANOVA with Bonferroni post-hoc pairwise comparison test for treatment versus negative control. A) αII-Spectrin. B) Tau.
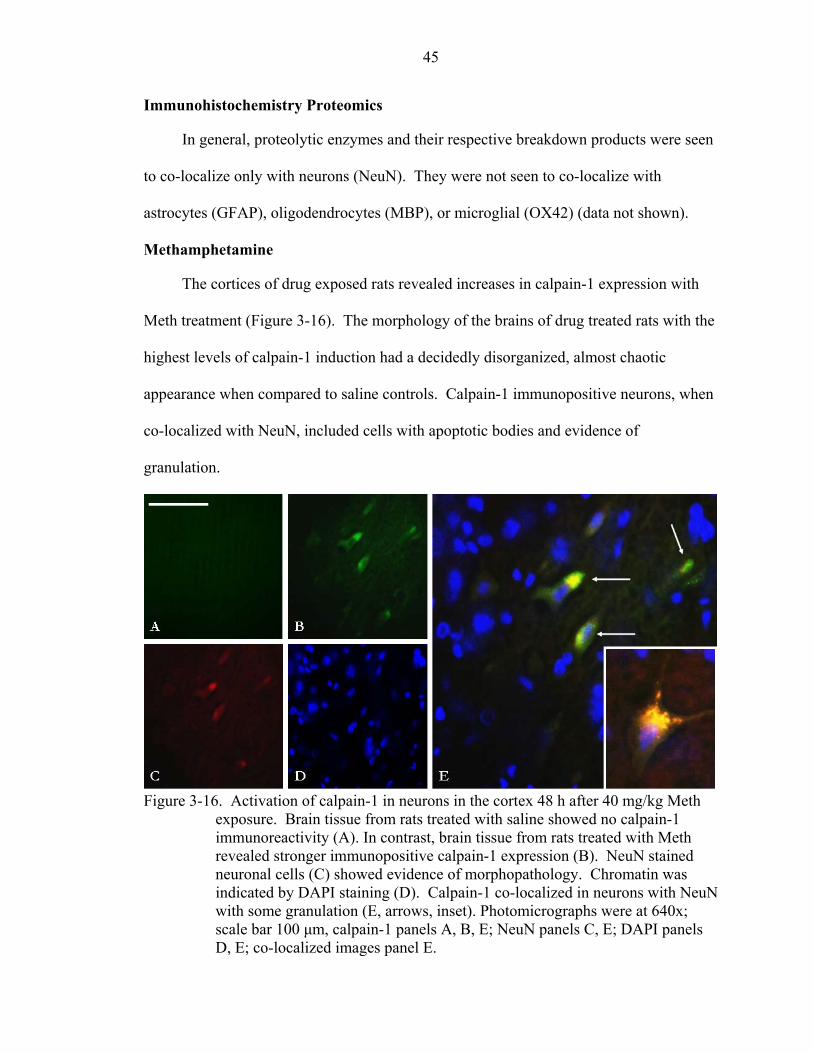
45
Immunohistochemistry Proteomics
In general, proteolytic enzymes and their respective breakdown products were seen
to co-localize only with neurons (NeuN). They were not seen to co-localize with
astrocytes (GFAP), oligodendrocytes (MBP), or microglial (OX42) (data not shown).
Methamphetamine
The cortices of drug exposed rats revealed increases in calpain-1 expression with
Meth treatment (Figure 3-16). The morphology of the brains of drug treated rats with the
highest levels of calpain-1 induction had a decidedly disorganized, almost chaotic
appearance when compared to saline controls. Calpain-1 immunopositive neurons, when
co-localized with NeuN, included cells with apoptotic bodies and evidence of
granulation.
Figure 3-16. Activation of calpain-1 in neurons in the cortex 48 h after 40 mg/kg Meth
exposure. Brain tissue from rats treated with saline showed no calpain-1 immunoreactivity (A). In contrast, brain tissue from rats treated with Meth revealed stronger immunopositive calpain-1 expression (B). NeuN stained neuronal cells (C) showed evidence of morphopathology. Chromatin was indicated by DAPI staining (D). Calpain-1 co-localized in neurons with NeuN with some granulation (E, arrows, inset). Photomicrographs were at 640x; scale bar 100 µm, calpain-1 panels A, B, E; NeuN panels C, E; DAPI panels D, E; co-localized images panel E.
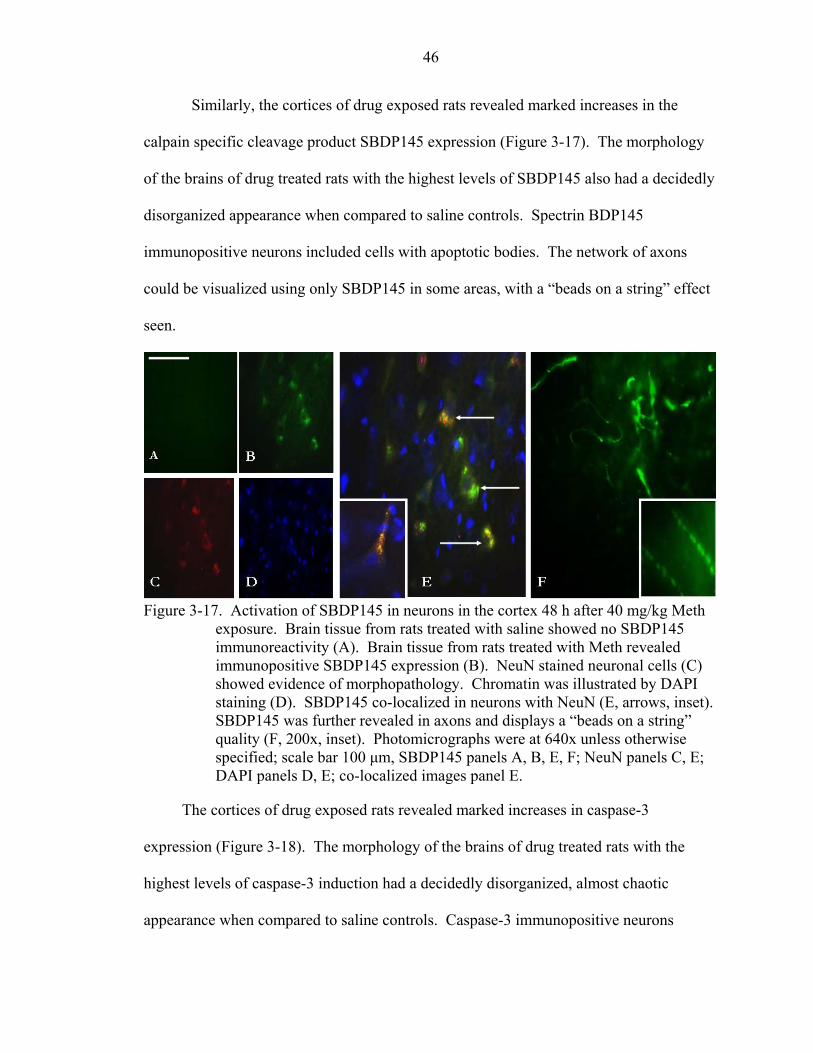
46
Similarly, the cortices of drug exposed rats revealed marked increases in the
calpain specific cleavage product SBDP145 expression (Figure 3-17). The morphology
of the brains of drug treated rats with the highest levels of SBDP145 also had a decidedly
disorganized appearance when compared to saline controls. Spectrin BDP145
immunopositive neurons included cells with apoptotic bodies. The network of axons
could be visualized using only SBDP145 in some areas, with a “beads on a string” effect
seen.
Figure 3-17. Activation of SBDP145 in neurons in the cortex 48 h after 40 mg/kg Meth
exposure. Brain tissue from rats treated with saline showed no SBDP145 immunoreactivity (A). Brain tissue from rats treated with Meth revealed immunopositive SBDP145 expression (B). NeuN stained neuronal cells (C) showed evidence of morphopathology. Chromatin was illustrated by DAPI staining (D). SBDP145 co-localized in neurons with NeuN (E, arrows, inset). SBDP145 was further revealed in axons and displays a “beads on a string” quality (F, 200x, inset). Photomicrographs were at 640x unless otherwise specified; scale bar 100 µm, SBDP145 panels A, B, E, F; NeuN panels C, E; DAPI panels D, E; co-localized images panel E.
The cortices of drug exposed rats revealed marked increases in caspase-3
expression (Figure 3-18). The morphology of the brains of drug treated rats with the
highest levels of caspase-3 induction had a decidedly disorganized, almost chaotic
appearance when compared to saline controls. Caspase-3 immunopositive neurons
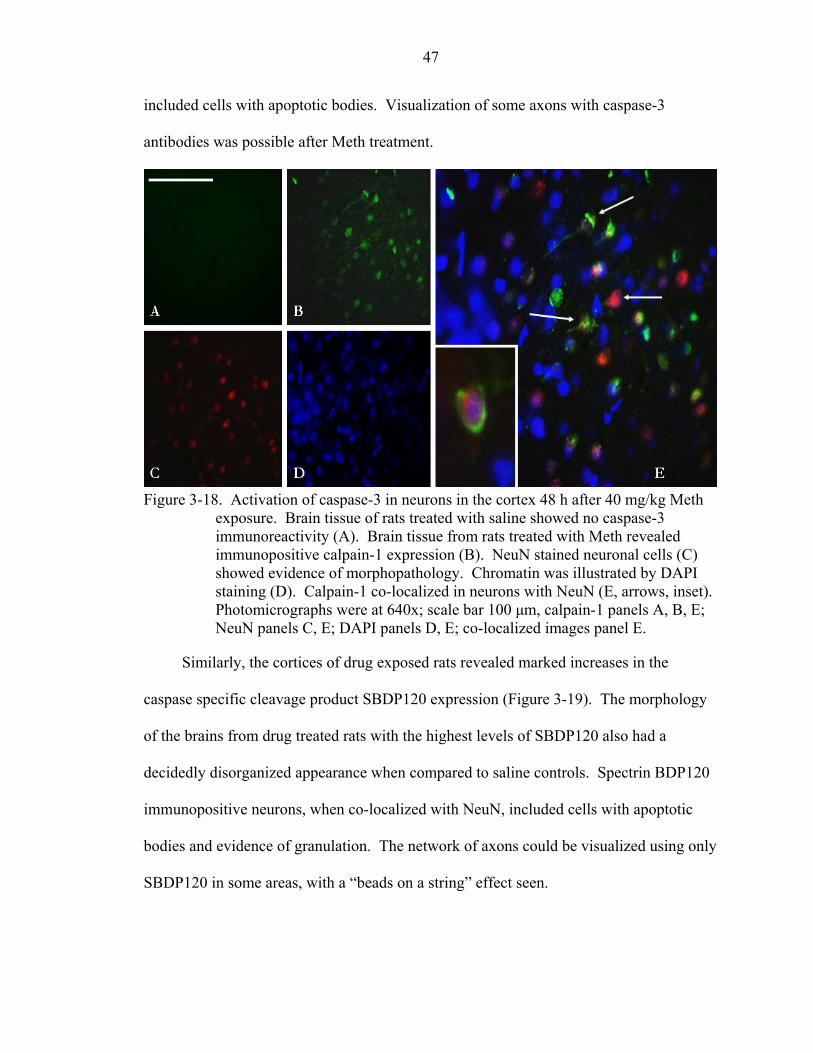
47
included cells with apoptotic bodies. Visualization of some axons with caspase-3
antibodies was possible after Meth treatment.
Figure 3-18. Activation of caspase-3 in neurons in the cortex 48 h after 40 mg/kg Meth
exposure. Brain tissue of rats treated with saline showed no caspase-3 immunoreactivity (A). Brain tissue from rats treated with Meth revealed immunopositive calpain-1 expression (B). NeuN stained neuronal cells (C) showed evidence of morphopathology. Chromatin was illustrated by DAPI staining (D). Calpain-1 co-localized in neurons with NeuN (E, arrows, inset). Photomicrographs were at 640x; scale bar 100 µm, calpain-1 panels A, B, E; NeuN panels C, E; DAPI panels D, E; co-localized images panel E.
Similarly, the cortices of drug exposed rats revealed marked increases in the
caspase specific cleavage product SBDP120 expression (Figure 3-19). The morphology
of the brains from drug treated rats with the highest levels of SBDP120 also had a
decidedly disorganized appearance when compared to saline controls. Spectrin BDP120
immunopositive neurons, when co-localized with NeuN, included cells with apoptotic
bodies and evidence of granulation. The network of axons could be visualized using only
SBDP120 in some areas, with a “beads on a string” effect seen.
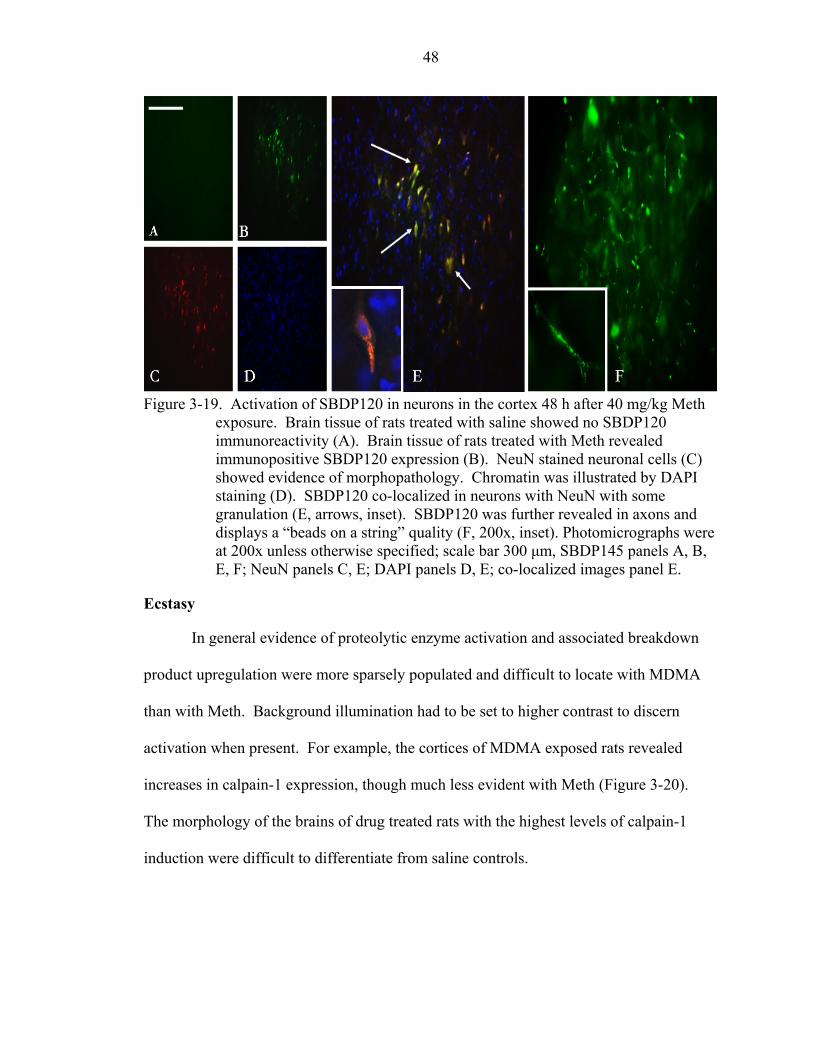
48
Figure 3-19. Activation of SBDP120 in neurons in the cortex 48 h after 40 mg/kg Meth
exposure. Brain tissue of rats treated with saline showed no SBDP120 immunoreactivity (A). Brain tissue of rats treated with Meth revealed immunopositive SBDP120 expression (B). NeuN stained neuronal cells (C) showed evidence of morphopathology. Chromatin was illustrated by DAPI staining (D). SBDP120 co-localized in neurons with NeuN with some granulation (E, arrows, inset). SBDP120 was further revealed in axons and displays a “beads on a string” quality (F, 200x, inset). Photomicrographs were at 200x unless otherwise specified; scale bar 300 µm, SBDP145 panels A, B, E, F; NeuN panels C, E; DAPI panels D, E; co-localized images panel E.
Ecstasy
In general evidence of proteolytic enzyme activation and associated breakdown
product upregulation were more sparsely populated and difficult to locate with MDMA
than with Meth. Background illumination had to be set to higher contrast to discern
activation when present. For example, the cortices of MDMA exposed rats revealed
increases in calpain-1 expression, though much less evident with Meth (Figure 3-20).
The morphology of the brains of drug treated rats with the highest levels of calpain-1
induction were difficult to differentiate from saline controls.
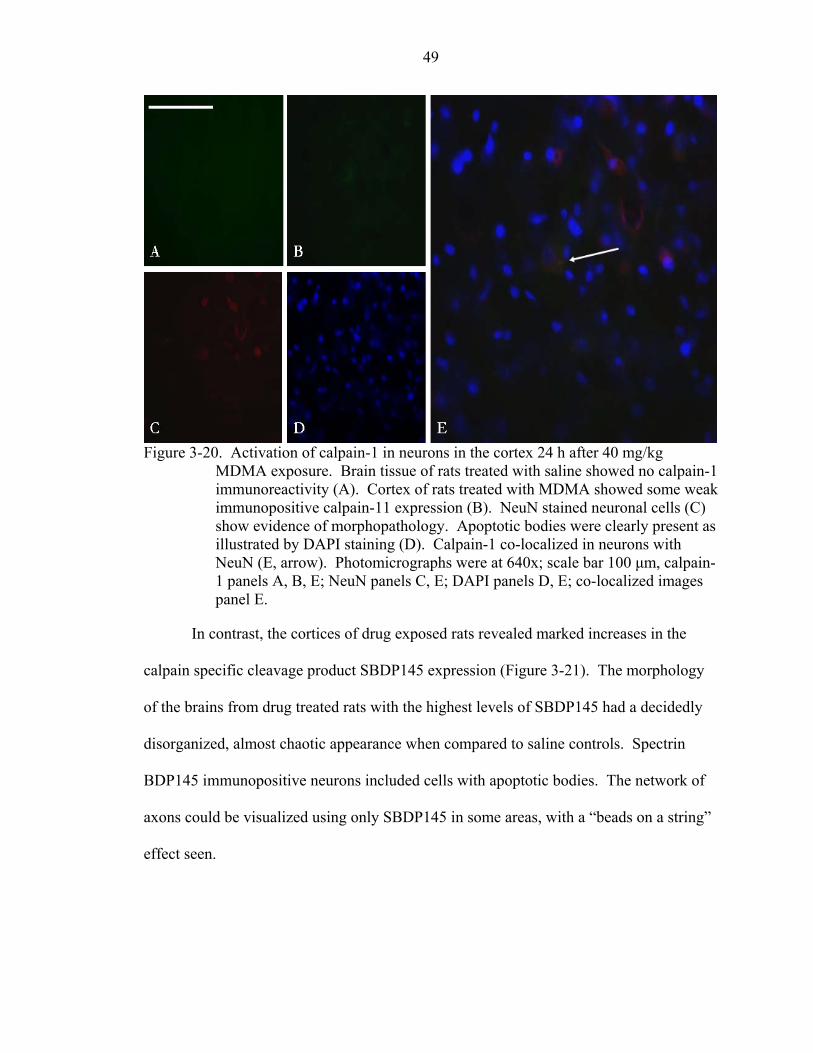
49
Figure 3-20. Activation of calpain-1 in neurons in the cortex 24 h after 40 mg/kg
MDMA exposure. Brain tissue of rats treated with saline showed no calpain-1 immunoreactivity (A). Cortex of rats treated with MDMA showed some weak immunopositive calpain-11 expression (B). NeuN stained neuronal cells (C) show evidence of morphopathology. Apoptotic bodies were clearly present as illustrated by DAPI staining (D). Calpain-1 co-localized in neurons with NeuN (E, arrow). Photomicrographs were at 640x; scale bar 100 µm, calpain-1 panels A, B, E; NeuN panels C, E; DAPI panels D, E; co-localized images panel E.
In contrast, the cortices of drug exposed rats revealed marked increases in the
calpain specific cleavage product SBDP145 expression (Figure 3-21). The morphology
of the brains from drug treated rats with the highest levels of SBDP145 had a decidedly
disorganized, almost chaotic appearance when compared to saline controls. Spectrin
BDP145 immunopositive neurons included cells with apoptotic bodies. The network of
axons could be visualized using only SBDP145 in some areas, with a “beads on a string”
effect seen.
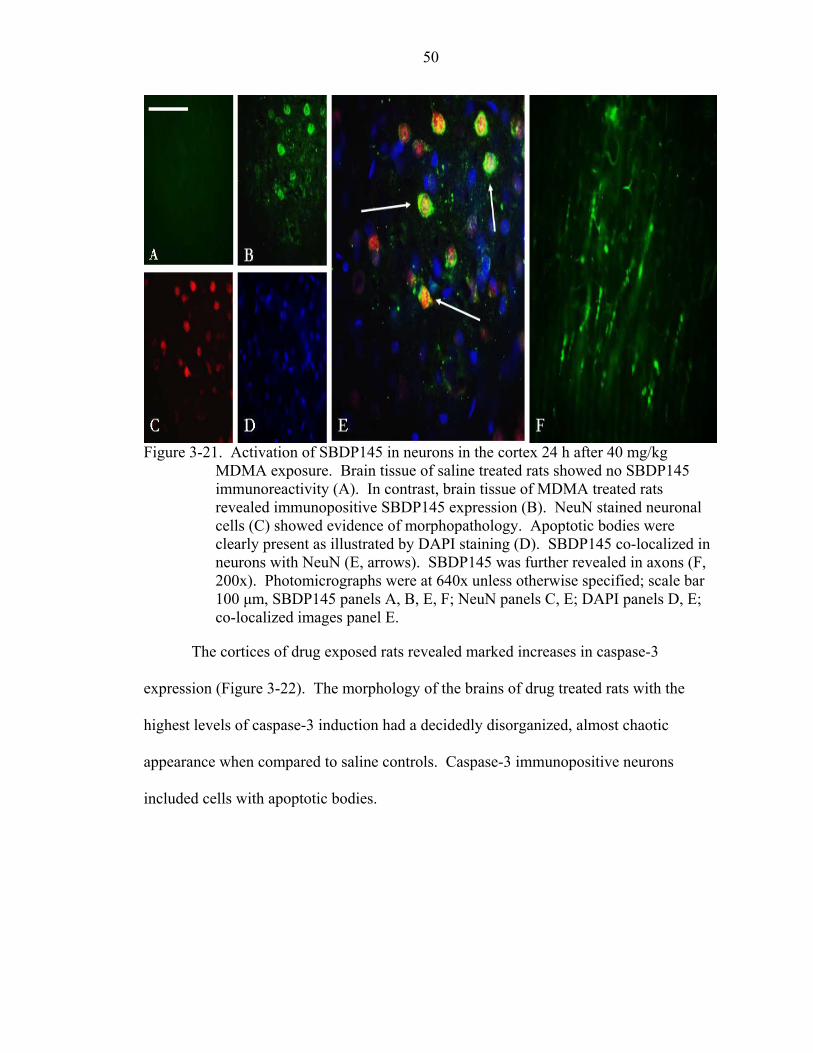
50
Figure 3-21. Activation of SBDP145 in neurons in the cortex 24 h after 40 mg/kg
MDMA exposure. Brain tissue of saline treated rats showed no SBDP145 immunoreactivity (A). In contrast, brain tissue of MDMA treated rats revealed immunopositive SBDP145 expression (B). NeuN stained neuronal cells (C) showed evidence of morphopathology. Apoptotic bodies were clearly present as illustrated by DAPI staining (D). SBDP145 co-localized in neurons with NeuN (E, arrows). SBDP145 was further revealed in axons (F, 200x). Photomicrographs were at 640x unless otherwise specified; scale bar 100 µm, SBDP145 panels A, B, E, F; NeuN panels C, E; DAPI panels D, E; co-localized images panel E.
The cortices of drug exposed rats revealed marked increases in caspase-3
expression (Figure 3-22). The morphology of the brains of drug treated rats with the
highest levels of caspase-3 induction had a decidedly disorganized, almost chaotic
appearance when compared to saline controls. Caspase-3 immunopositive neurons
included cells with apoptotic bodies.
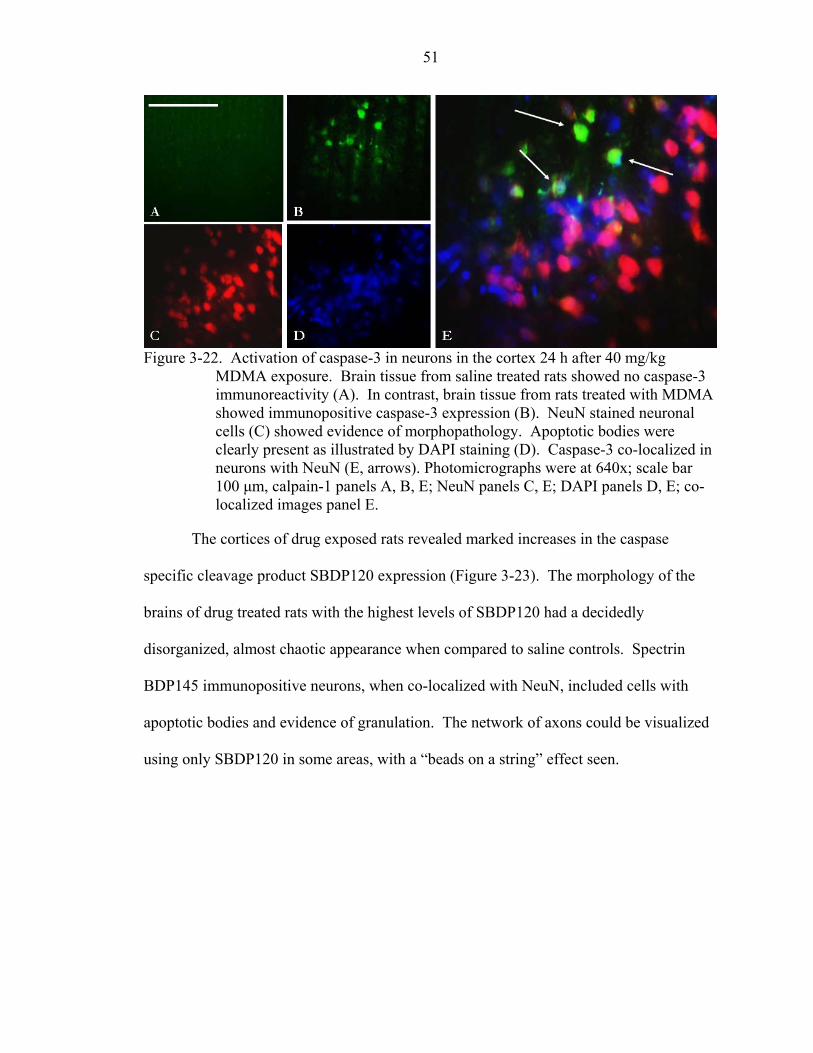
51
Figure 3-22. Activation of caspase-3 in neurons in the cortex 24 h after 40 mg/kg
MDMA exposure. Brain tissue from saline treated rats showed no caspase-3 immunoreactivity (A). In contrast, brain tissue from rats treated with MDMA showed immunopositive caspase-3 expression (B). NeuN stained neuronal cells (C) showed evidence of morphopathology. Apoptotic bodies were clearly present as illustrated by DAPI staining (D). Caspase-3 co-localized in neurons with NeuN (E, arrows). Photomicrographs were at 640x; scale bar 100 µm, calpain-1 panels A, B, E; NeuN panels C, E; DAPI panels D, E; co-localized images panel E.
The cortices of drug exposed rats revealed marked increases in the caspase
specific cleavage product SBDP120 expression (Figure 3-23). The morphology of the
brains of drug treated rats with the highest levels of SBDP120 had a decidedly
disorganized, almost chaotic appearance when compared to saline controls. Spectrin
BDP145 immunopositive neurons, when co-localized with NeuN, included cells with
apoptotic bodies and evidence of granulation. The network of axons could be visualized
using only SBDP120 in some areas, with a “beads on a string” effect seen.
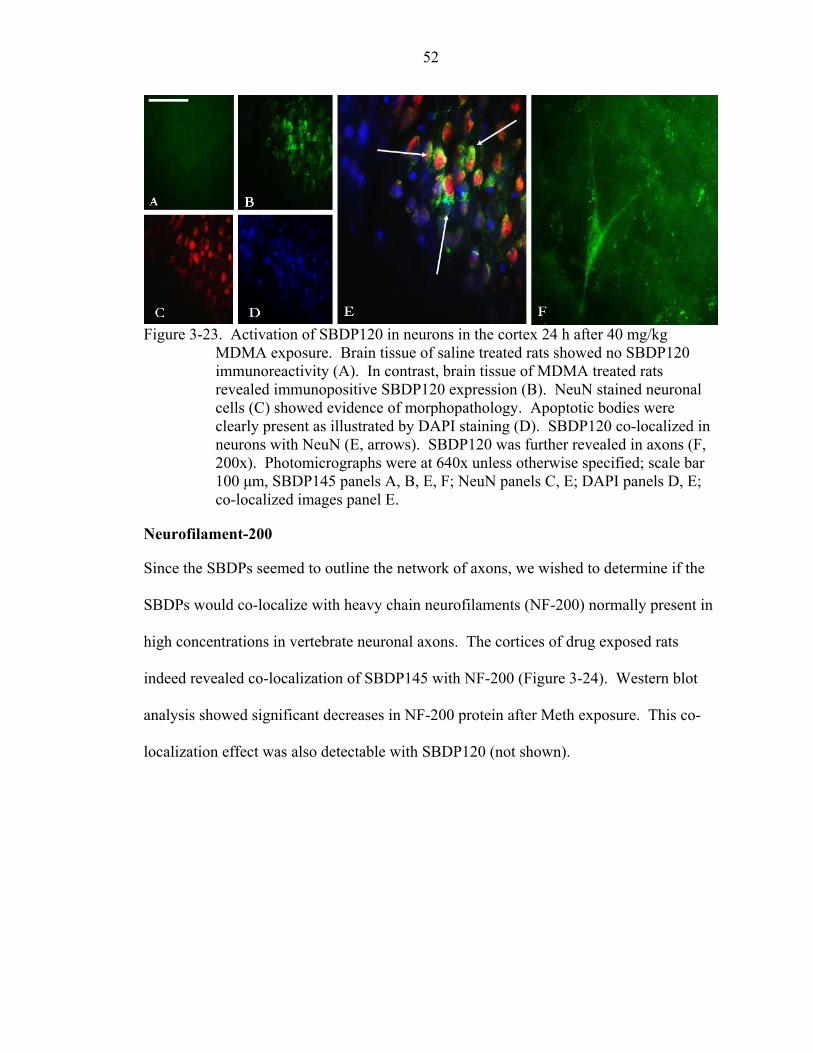
52
Figure 3-23. Activation of SBDP120 in neurons in the cortex 24 h after 40 mg/kg
MDMA exposure. Brain tissue of saline treated rats showed no SBDP120 immunoreactivity (A). In contrast, brain tissue of MDMA treated rats revealed immunopositive SBDP120 expression (B). NeuN stained neuronal cells (C) showed evidence of morphopathology. Apoptotic bodies were clearly present as illustrated by DAPI staining (D). SBDP120 co-localized in neurons with NeuN (E, arrows). SBDP120 was further revealed in axons (F, 200x). Photomicrographs were at 640x unless otherwise specified; scale bar 100 µm, SBDP145 panels A, B, E, F; NeuN panels C, E; DAPI panels D, E; co-localized images panel E.
Neurofilament-200
Since the SBDPs seemed to outline the network of axons, we wished to determine if the
SBDPs would co-localize with heavy chain neurofilaments (NF-200) normally present in
high concentrations in vertebrate neuronal axons. The cortices of drug exposed rats
indeed revealed co-localization of SBDP145 with NF-200 (Figure 3-24). Western blot
analysis showed significant decreases in NF-200 protein after Meth exposure. This co-
localization effect was also detectable with SBDP120 (not shown).
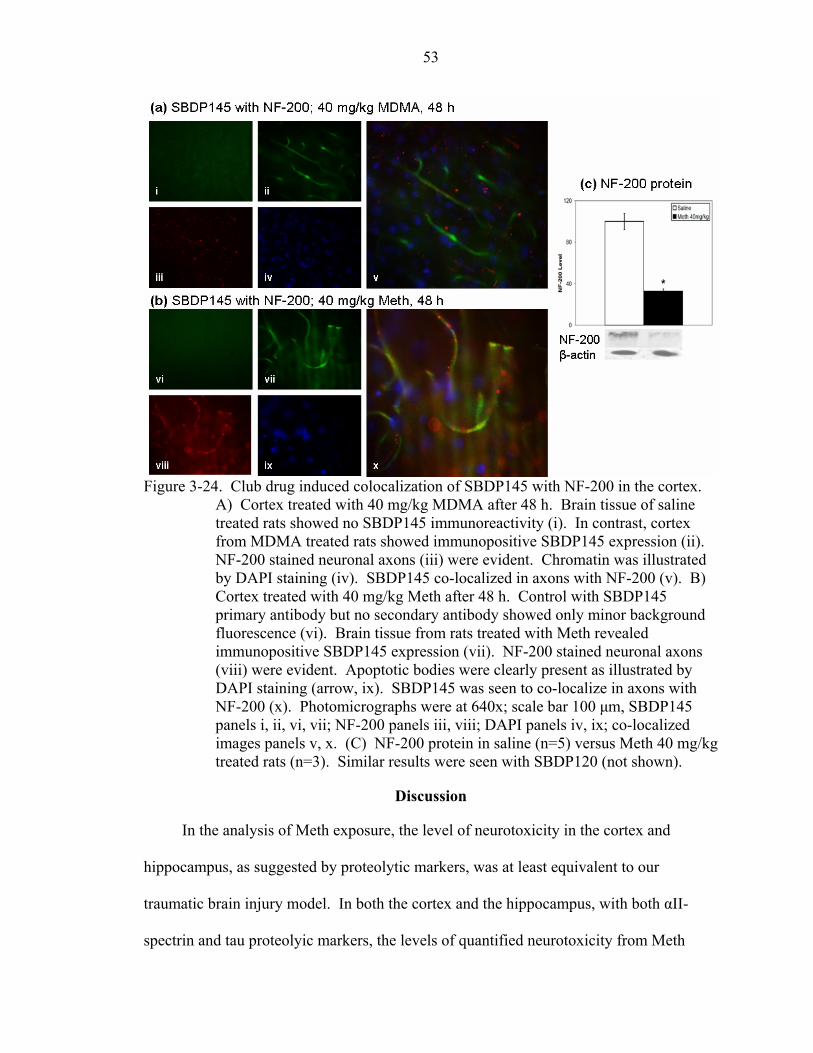
53
Figure 3-24. Club drug induced colocalization of SBDP145 with NF-200 in the cortex.
A) Cortex treated with 40 mg/kg MDMA after 48 h. Brain tissue of saline treated rats showed no SBDP145 immunoreactivity (i). In contrast, cortex from MDMA treated rats showed immunopositive SBDP145 expression (ii). NF-200 stained neuronal axons (iii) were evident. Chromatin was illustrated by DAPI staining (iv). SBDP145 co-localized in axons with NF-200 (v). B) Cortex treated with 40 mg/kg Meth after 48 h. Control with SBDP145 primary antibody but no secondary antibody showed only minor background fluorescence (vi). Brain tissue from rats treated with Meth revealed immunopositive SBDP145 expression (vii). NF-200 stained neuronal axons (viii) were evident. Apoptotic bodies were clearly present as illustrated by DAPI staining (arrow, ix). SBDP145 was seen to co-localize in axons with NF-200 (x). Photomicrographs were at 640x; scale bar 100 µm, SBDP145 panels i, ii, vi, vii; NF-200 panels iii, viii; DAPI panels iv, ix; co-localized images panels v, x. (C) NF-200 protein in saline (n=5) versus Meth 40 mg/kg treated rats (n=3). Similar results were seen with SBDP120 (not shown).
Discussion
In the analysis of Meth exposure, the level of neurotoxicity in the cortex and
hippocampus, as suggested by proteolytic markers, was at least equivalent to our
traumatic brain injury model. In both the cortex and the hippocampus, with both αII-
spectrin and tau proteolyic markers, the levels of quantified neurotoxicity from Meth
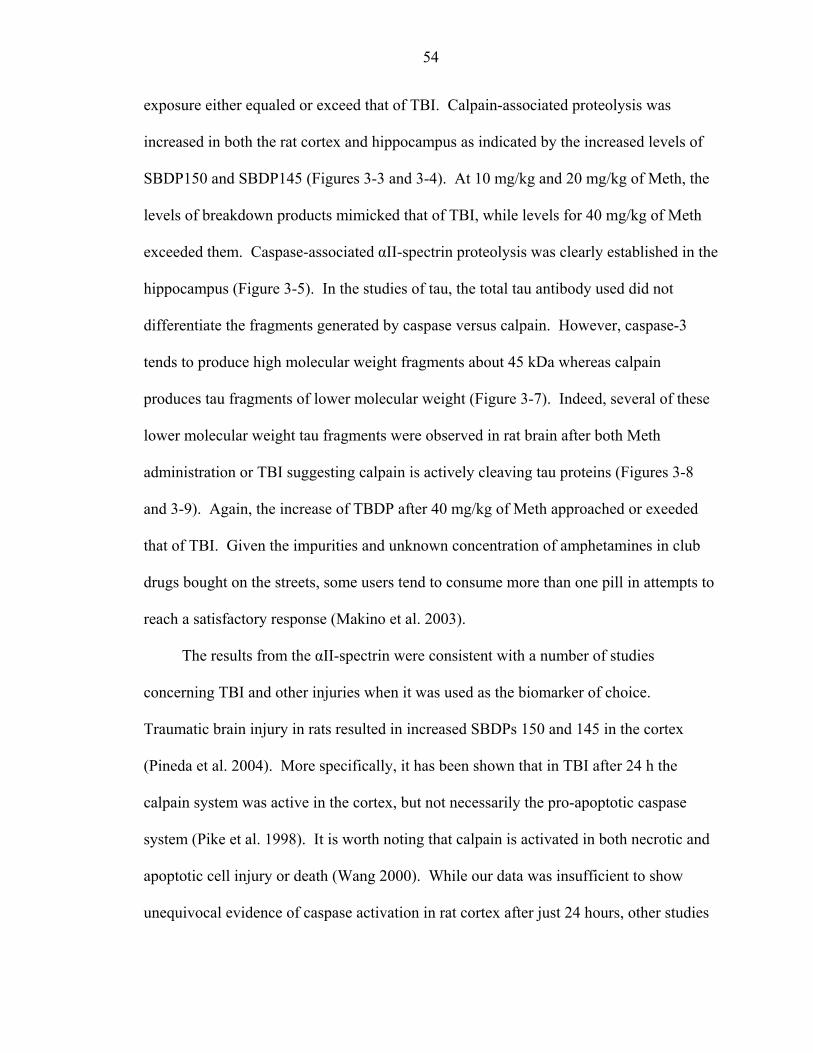
54
exposure either equaled or exceed that of TBI. Calpain-associated proteolysis was
increased in both the rat cortex and hippocampus as indicated by the increased levels of
SBDP150 and SBDP145 (Figures 3-3 and 3-4). At 10 mg/kg and 20 mg/kg of Meth, the
levels of breakdown products mimicked that of TBI, while levels for 40 mg/kg of Meth
exceeded them. Caspase-associated αII-spectrin proteolysis was clearly established in the
hippocampus (Figure 3-5). In the studies of tau, the total tau antibody used did not
differentiate the fragments generated by caspase versus calpain. However, caspase-3
tends to produce high molecular weight fragments about 45 kDa whereas calpain
produces tau fragments of lower molecular weight (Figure 3-7). Indeed, several of these
lower molecular weight tau fragments were observed in rat brain after both Meth
administration or TBI suggesting calpain is actively cleaving tau proteins (Figures 3-8
and 3-9). Again, the increase of TBDP after 40 mg/kg of Meth approached or exeeded
that of TBI. Given the impurities and unknown concentration of amphetamines in club
drugs bought on the streets, some users tend to consume more than one pill in attempts to
reach a satisfactory response (Makino et al. 2003).
The results from the αII-spectrin were consistent with a number of studies
concerning TBI and other injuries when it was used as the biomarker of choice.
Traumatic brain injury in rats resulted in increased SBDPs 150 and 145 in the cortex
(Pineda et al. 2004). More specifically, it has been shown that in TBI after 24 h the
calpain system was active in the cortex, but not necessarily the pro-apoptotic caspase
system (Pike et al. 1998). It is worth noting that calpain is activated in both necrotic and
apoptotic cell injury or death (Wang 2000). While our data was insufficient to show
unequivocal evidence of caspase activation in rat cortex after just 24 hours, other studies
55
have suggested evidence of apoptosis in cortex and neocortical neurons following Meth
exposure (Deng et al. 2002b; Stumm et al. 1999). There has been, however, evidence of
pro-apototic caspase activity in the rat hippocampus, thalamus, and striatum following
TBI (Pike et al. 2001). Studies on age related cell death in rats also suggests calpain
activity in the cortex without concurrent caspase activity (Bernath et al. 2004).
Following middle cerebral artery occlusion (MCAO) in rats, both calpain and caspase
were evident after 24 h (Pike et al. 2003). Similar club drug use studies have been
conducted using methamphetamines and the tau biomarker in which TBDPs were
observed after three days in the cortex, hippocampus, and striatum (Wallace et al. 2003).
The implication of this is to suggest that a single use of methamphetamine can be as
neurotoxic in the cortex and hippocampus as traumatic brain injury. Given the effects of
the drug on the cortex and hippocampus, cortical- and memory-related clinical outcomes
should be considered when treating a patient with methamphetamine toxicity.
Evidence for neurotoxicity 24 h after MDMA use was much more difficult to
elucidate than with our previous work with Meth. Some evidence of necrosis, however,
was seen in both the cortex and was slightly more robust in the hippocampus. This is in
agreement with previous work (Wallace et al. 2003). The evidence of neurotoxicity
being greater for Meth than for MDMA is not surprising, as it correlates with clinical
data. Two interesting effects are seen when the club drug treated animals are examined
72 h after exposure. For the Meth, while TBDPs are no longer as robust as they were
after 24 h, SBDP levels continue to be strong. Additionally, the pro-apoptotic SBDP120
ceased to be visible after 24 h. Taken with our previous results, this suggests that Meth
increases apoptosis within 24 h in the hippocampus while taking as long as 72 h in the
56
cortex. This is in agreement with current literature which notes that Meth can upregulate
pro-apoptotic genes such as c-Jun, c-myc, and L-myc due to its production of reactive
oxygen species (Deng et al. 2002a; Stumm et al. 1999; Thiriet et al. 2001). Second,
MDMA effects also showed time dependence. Spectrin BPDs seen after 24 h were no
longer evident whereas significant tau breakdown products continue to be evident after
72 h.
The results of the IHC studies demonstrate co-localization of both the upregulated
calpain-1 and caspase-3 in rat cortical neurons after drug use. Specific spectrin
breakdown products at 145 kDa and 120 kDa, respectively, are also found to be increased
and this was particularly noticeable in the axons. To our knowledge, this is the first study
to show the co-localization of these proteolytic markers and their specific breakdown
products in specific neurons of the rat cortex following drug use. However, similar co-
localization results were not seen in glial cells such as astrocytes, oligodendrocytes or
microglia which support neurons and outnumber them 10 to 1. This is similar to the
results found in the upregulation of the lysosomal protease cathepsin-B following spinal
cord injury in which it was found to co-localize only with neurons and not glial cells
(Ellis et al. 2005). These findings could suggest that the club drugs target only the
neurons and not the supportive cells, in agreement with current findings of club drug
induced serotonergic and dopaminergic nerve terminal degeneration (Larsen et al. 2002).
Additionally, the time point at which the upregulated proteases and the increase in
their cleavage product was most clearly evident was after 24 h of treatment for MDMA
and 48 h for Meth. Necrosis is suggested when αII-spectrin is cleaved by calpains to
produce a breakdown product at 145 kDa (Harris et al. 1989). Here, calpain-1 was seen
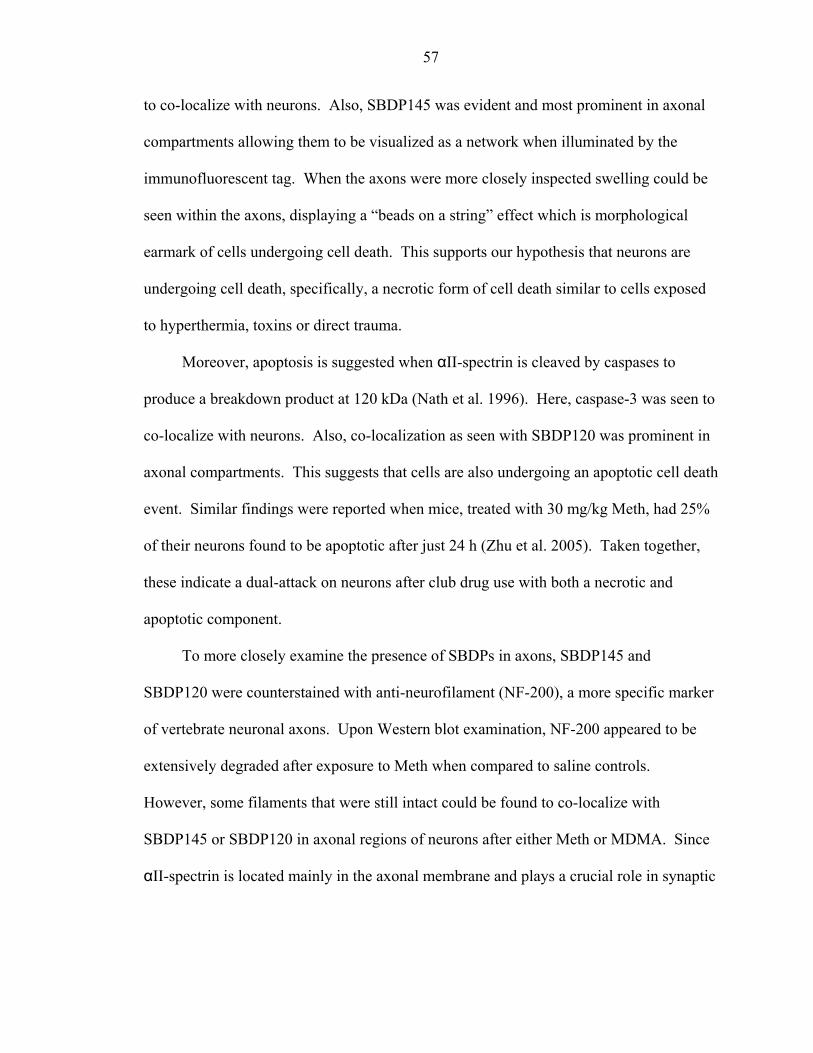
57
to co-localize with neurons. Also, SBDP145 was evident and most prominent in axonal
compartments allowing them to be visualized as a network when illuminated by the
immunofluorescent tag. When the axons were more closely inspected swelling could be
seen within the axons, displaying a “beads on a string” effect which is morphological
earmark of cells undergoing cell death. This supports our hypothesis that neurons are
undergoing cell death, specifically, a necrotic form of cell death similar to cells exposed
to hyperthermia, toxins or direct trauma.
Moreover, apoptosis is suggested when αII-spectrin is cleaved by caspases to
produce a breakdown product at 120 kDa (Nath et al. 1996). Here, caspase-3 was seen to
co-localize with neurons. Also, co-localization as seen with SBDP120 was prominent in
axonal compartments. This suggests that cells are also undergoing an apoptotic cell death
event. Similar findings were reported when mice, treated with 30 mg/kg Meth, had 25%
of their neurons found to be apoptotic after just 24 h (Zhu et al. 2005). Taken together,
these indicate a dual-attack on neurons after club drug use with both a necrotic and
apoptotic component.
To more closely examine the presence of SBDPs in axons, SBDP145 and
SBDP120 were counterstained with anti-neurofilament (NF-200), a more specific marker
of vertebrate neuronal axons. Upon Western blot examination, NF-200 appeared to be
extensively degraded after exposure to Meth when compared to saline controls.
However, some filaments that were still intact could be found to co-localize with
SBDP145 or SBDP120 in axonal regions of neurons after either Meth or MDMA. Since
αII-spectrin is located mainly in the axonal membrane and plays a crucial role in synaptic
58
transmission, this localization of compartmental damage may help to explain the nerve
terminal damage seen with club drug use (Sikorski et al. 1991).
In summary, pro-necrotic calpain-1 and pro-apoptotic caspase-3 were found to be
activated and upregulated in rat cortical neurons upon exposure to Meth and MDMA but
not astrocytes, oligodendrocytes or microglia. Furthermore, SBDPs at 145 kDa and 120
kDa were found in neurons, particularly in the axonal segment and were further identified
via co-localization with neurofilament. These results suggest that the drugs may be
selectively targeting neurons and invoking a dual-proteolytic attack via necrosis and
apoptosis, particularly in the axonal regions.
CHAPTER 4 IN VITRO NEUROTOXICITY
Introduction
We hypothesize that a dual proteolytic, activity upregulation exists in
methamphetamine (Meth) or ecstasy (MDMA) treated cultured neurons suggesting that
the cell culture system would provide an excellent model for pharmacological
intervention to understand the relative contribution of calpain versus caspase in club drug
neurotoxicity. In this study, cultured rat cerebrocortical neurons were challenged with
two doses of MDMA or Meth, with and without the presence of protease inhibitors. The
results showed increases in the αII-spectrin and tau breakdown products confirming the
neurotoxicity of the drugs. Their breakdown profile helps explain the proteolytic activity
mechanisms that contribute to the neurotoxicity. We were able to characterize
Meth/MDMA induced spectrin breakdown products (SBDPs) and, to the best of our
knowledge, are the first to demonstrate the drug induced fragmentation pattern of tau
protein (TBDPs) upon treatment by both MDMA and Meth. Furthermore, our work
utilizing calpain and caspase inhibitors to attenuate the fragmentation profile observed
highlights the major role the cysteine proteases play in the course of Meth and MDMA
neurotoxicity and represents a possible therapeutic venue in measuring drug
neurotoxicity.
59
60
Results
Cell Toxicity
Phase contrast microscopy
Primary cerebrocortical neurons were cultured from rat brain and challenged for 48
h with MDMA and Meth (Figure 4-1).
Figure 4-1. Cerebrocortical neurons after 48 h of drug incubation or saline treated
control. Over 80% of cells in the cultures were neurons. Control neurons (A) had healthy cell bodies and a well-defined neurite network (arrow). In contrast, after MDMA (2mM) (C) or Meth (2mM) (D) drug treatment, significant axonal degeneration was observed (arrows). Positive control, NMDA 300 µM showed similar axonal degeneration (arrow) as the drug treated cultures (B). Similar results were seen after 24 h and also for the 1 mM concentrations of MDMA and Meth (data not shown). Scale bar 200 µm.
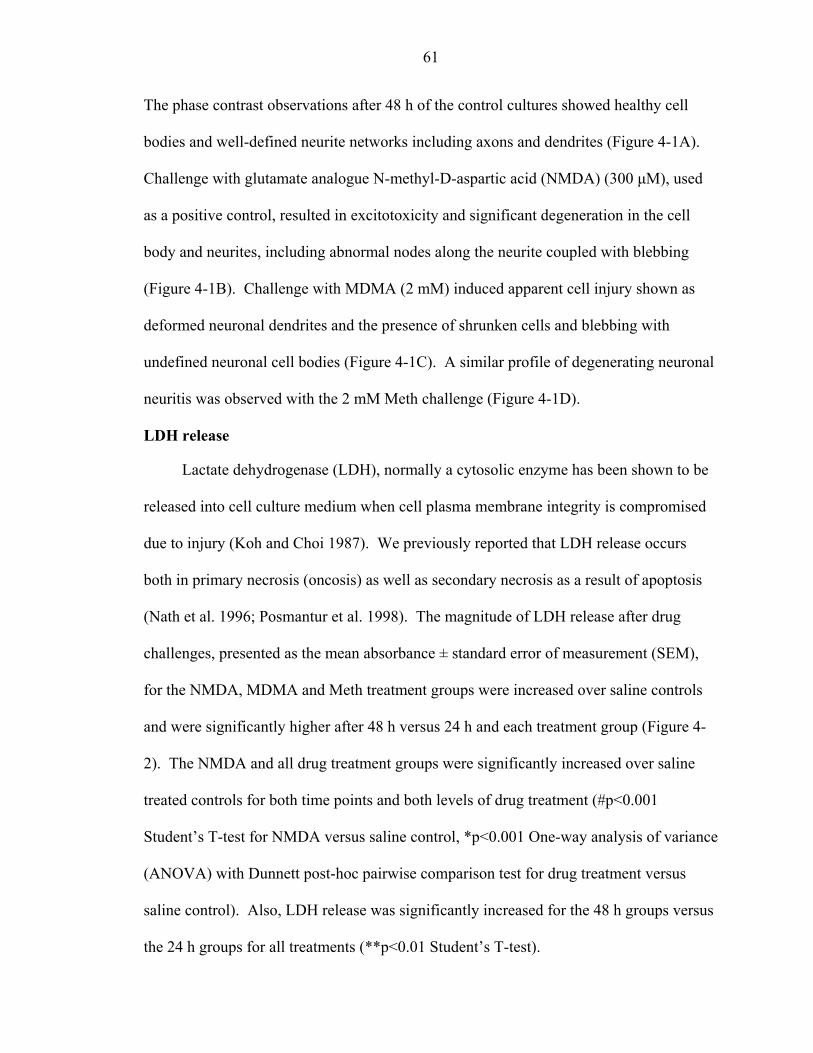
61
The phase contrast observations after 48 h of the control cultures showed healthy cell
bodies and well-defined neurite networks including axons and dendrites (Figure 4-1A).
Challenge with glutamate analogue N-methyl-D-aspartic acid (NMDA) (300 µM), used
as a positive control, resulted in excitotoxicity and significant degeneration in the cell
body and neurites, including abnormal nodes along the neurite coupled with blebbing
(Figure 4-1B). Challenge with MDMA (2 mM) induced apparent cell injury shown as
deformed neuronal dendrites and the presence of shrunken cells and blebbing with
undefined neuronal cell bodies (Figure 4-1C). A similar profile of degenerating neuronal
neuritis was observed with the 2 mM Meth challenge (Figure 4-1D).
LDH release
Lactate dehydrogenase (LDH), normally a cytosolic enzyme has been shown to be
released into cell culture medium when cell plasma membrane integrity is compromised
due to injury (Koh and Choi 1987). We previously reported that LDH release occurs
both in primary necrosis (oncosis) as well as secondary necrosis as a result of apoptosis
(Nath et al. 1996; Posmantur et al. 1998). The magnitude of LDH release after drug
challenges, presented as the mean absorbance ± standard error of measurement (SEM),
for the NMDA, MDMA and Meth treatment groups were increased over saline controls
and were significantly higher after 48 h versus 24 h and each treatment group (Figure 4-
2). The NMDA and all drug treatment groups were significantly increased over saline
treated controls for both time points and both levels of drug treatment (#p<0.001
Student’s T-test for NMDA versus saline control, *p<0.001 One-way analysis of variance
(ANOVA) with Dunnett post-hoc pairwise comparison test for drug treatment versus
saline control). Also, LDH release was significantly increased for the 48 h groups versus
the 24 h groups for all treatments (**p<0.01 Student’s T-test).
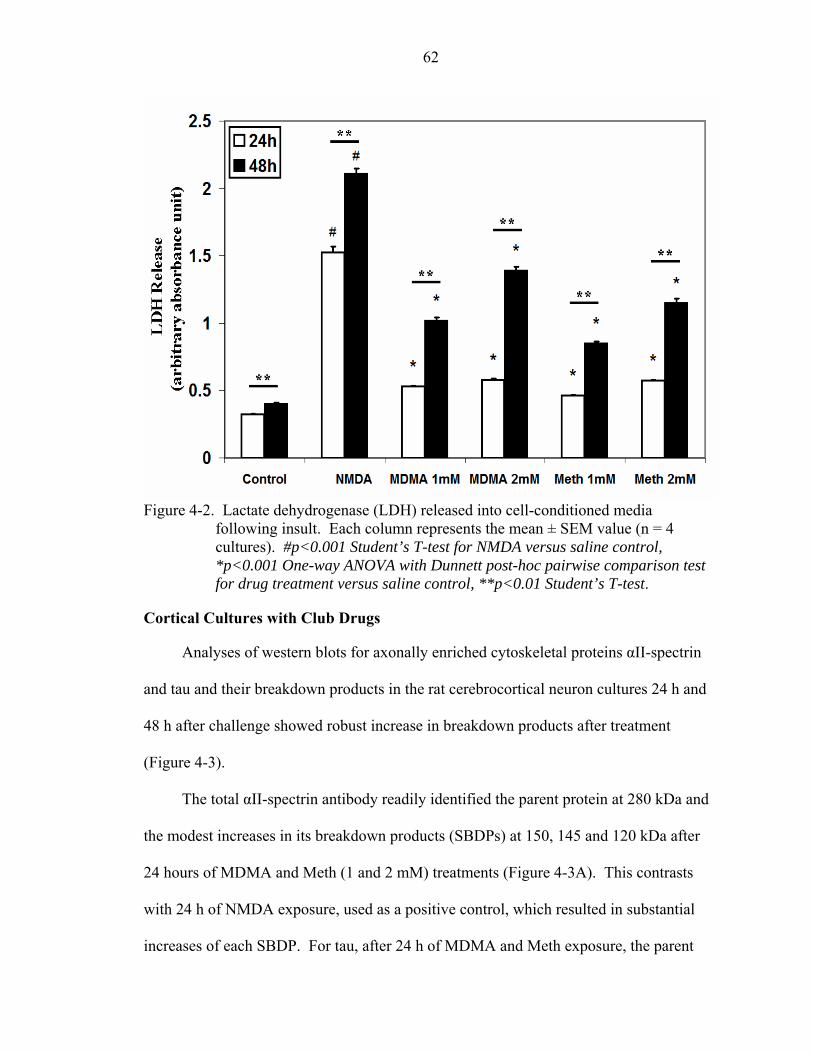
62
Figure 4-2. Lactate dehydrogenase (LDH) released into cell-conditioned media
following insult. Each column represents the mean ± SEM value (n = 4 cultures). #p<0.001 Student’s T-test for NMDA versus saline control, *p<0.001 One-way ANOVA with Dunnett post-hoc pairwise comparison test for drug treatment versus saline control, **p<0.01 Student’s T-test.
Cortical Cultures with Club Drugs
Analyses of western blots for axonally enriched cytoskeletal proteins αII-spectrin
and tau and their breakdown products in the rat cerebrocortical neuron cultures 24 h and
48 h after challenge showed robust increase in breakdown products after treatment
(Figure 4-3).
The total αII-spectrin antibody readily identified the parent protein at 280 kDa and
the modest increases in its breakdown products (SBDPs) at 150, 145 and 120 kDa after
24 hours of MDMA and Meth (1 and 2 mM) treatments (Figure 4-3A). This contrasts
with 24 h of NMDA exposure, used as a positive control, which resulted in substantial
increases of each SBDP. For tau, after 24 h of MDMA and Meth exposure, the parent
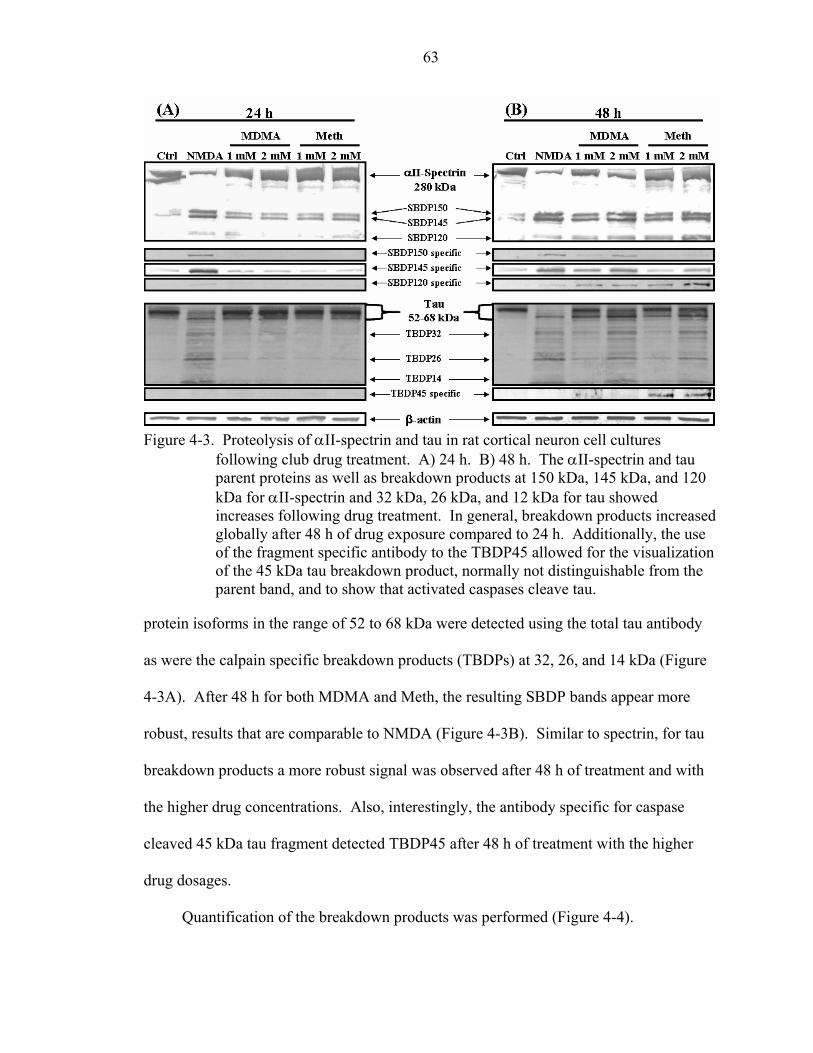
63
Figure 4-3. Proteolysis of αII-spectrin and tau in rat cortical neuron cell cultures
following club drug treatment. A) 24 h. B) 48 h. The αII-spectrin and tau parent proteins as well as breakdown products at 150 kDa, 145 kDa, and 120 kDa for αII-spectrin and 32 kDa, 26 kDa, and 12 kDa for tau showed increases following drug treatment. In general, breakdown products increased globally after 48 h of drug exposure compared to 24 h. Additionally, the use of the fragment specific antibody to the TBDP45 allowed for the visualization of the 45 kDa tau breakdown product, normally not distinguishable from the parent band, and to show that activated caspases cleave tau.
protein isoforms in the range of 52 to 68 kDa were detected using the total tau antibody
as were the calpain specific breakdown products (TBDPs) at 32, 26, and 14 kDa (Figure
4-3A). After 48 h for both MDMA and Meth, the resulting SBDP bands appear more
robust, results that are comparable to NMDA (Figure 4-3B). Similar to spectrin, for tau
breakdown products a more robust signal was observed after 48 h of treatment and with
the higher drug concentrations. Also, interestingly, the antibody specific for caspase
cleaved 45 kDa tau fragment detected TBDP45 after 48 h of treatment with the higher
drug dosages.
Quantification of the breakdown products was performed (Figure 4-4).
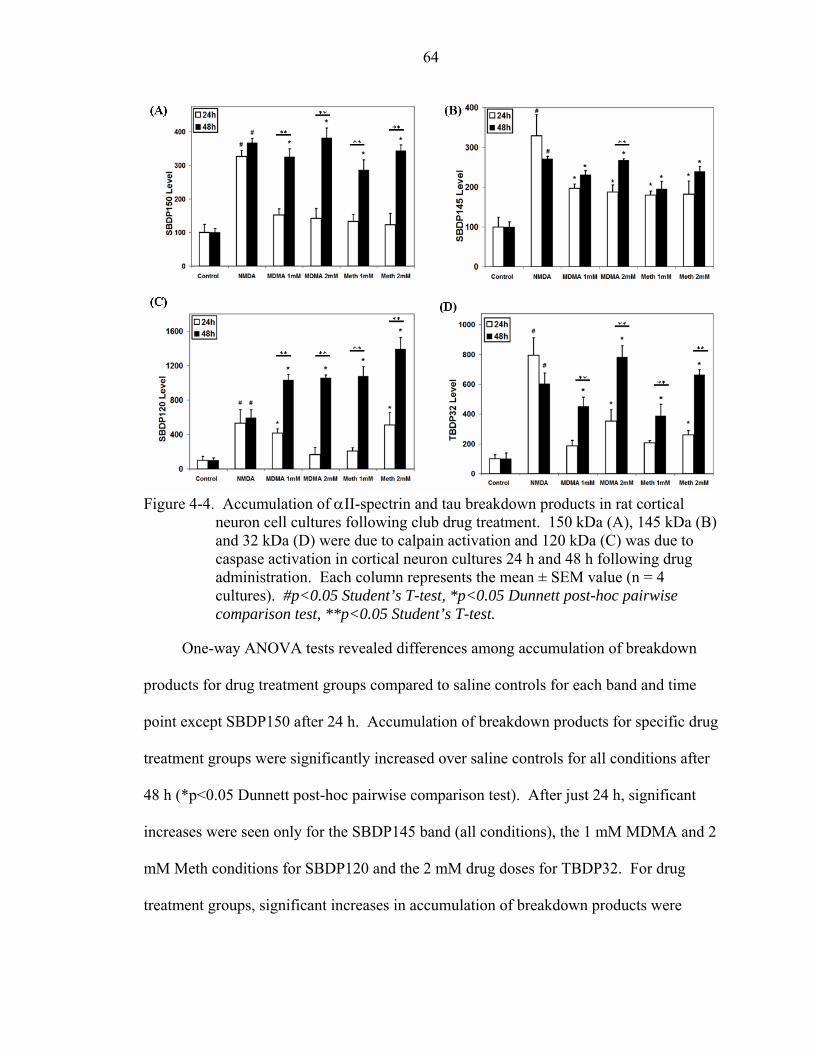
64
Figure 4-4. Accumulation of αII-spectrin and tau breakdown products in rat cortical
neuron cell cultures following club drug treatment. 150 kDa (A), 145 kDa (B) and 32 kDa (D) were due to calpain activation and 120 kDa (C) was due to caspase activation in cortical neuron cultures 24 h and 48 h following drug administration. Each column represents the mean ± SEM value (n = 4 cultures). #p<0.05 Student’s T-test, *p<0.05 Dunnett post-hoc pairwise comparison test, **p<0.05 Student’s T-test.
One-way ANOVA tests revealed differences among accumulation of breakdown
products for drug treatment groups compared to saline controls for each band and time
point except SBDP150 after 24 h. Accumulation of breakdown products for specific drug
treatment groups were significantly increased over saline controls for all conditions after
48 h (*p<0.05 Dunnett post-hoc pairwise comparison test). After just 24 h, significant
increases were seen only for the SBDP145 band (all conditions), the 1 mM MDMA and 2
mM Meth conditions for SBDP120 and the 2 mM drug doses for TBDP32. For drug
treatment groups, significant increases in accumulation of breakdown products were
65
detected after 48 h compared to 24 h for all conditions other than SBDP145 (**p<0.05
Student’s T-test). Similar results were seen for TBDP26 and TBDP14 (data not shown).
Calpain specific breakdown products showed significant increases over saline
controls following drug challenges by both MDMA and Meth and for both dosage levels.
The only statistically significant differences were seen after 48 h (Figure 4-4A) as
determined by the breakdown product antibody specific for calpain SBDP150. In
contrast, specific antibodies for the calpain SBDP145 (Wang, 2000) showed an increase
in SBDP145 over saline controls for both drugs at both time points (Figure 4-4B). The
antibody for the caspase SBDP120 (Wang, 2000) was only able to discern a statistically
significant increase in SBDP120 after 24 h for the 1 mM MDMA and 2 mM Meth doses,
but was able to discern a significant increases for both drugs after 48 h, with the more
robust signal seen for Meth (Figure 4-4C). Furthermore, these data suggest that MDMA
and Meth challenges after 48 h induced more caspase-mediated apoptosis than the
positive control excitotoxic NMDA challenge.
Tau proteolysis can be quantified by measuring the calpain mediated TBDP32
(Figure 4-4D). Breakdown products of TBD32 appeared to increase over saline controls
following MDMA and Meth challenges (1-2 mM) after both 24 and 48 h although they
were not statistically significant for the 1 mM drug doses after 24 h. Similar results were
seen for TBDP26 and TBDP14, both the result of calpain mediated proteolysis (data not
shown).
Cortical Cultures with Club Drugs and Protease Inhibitors
Western blots analyses for αII-spectrin and tau and their breakdown products were
also performed on cell lysate from rat cerebrocortical neuron cultures 48 h after a 1 h
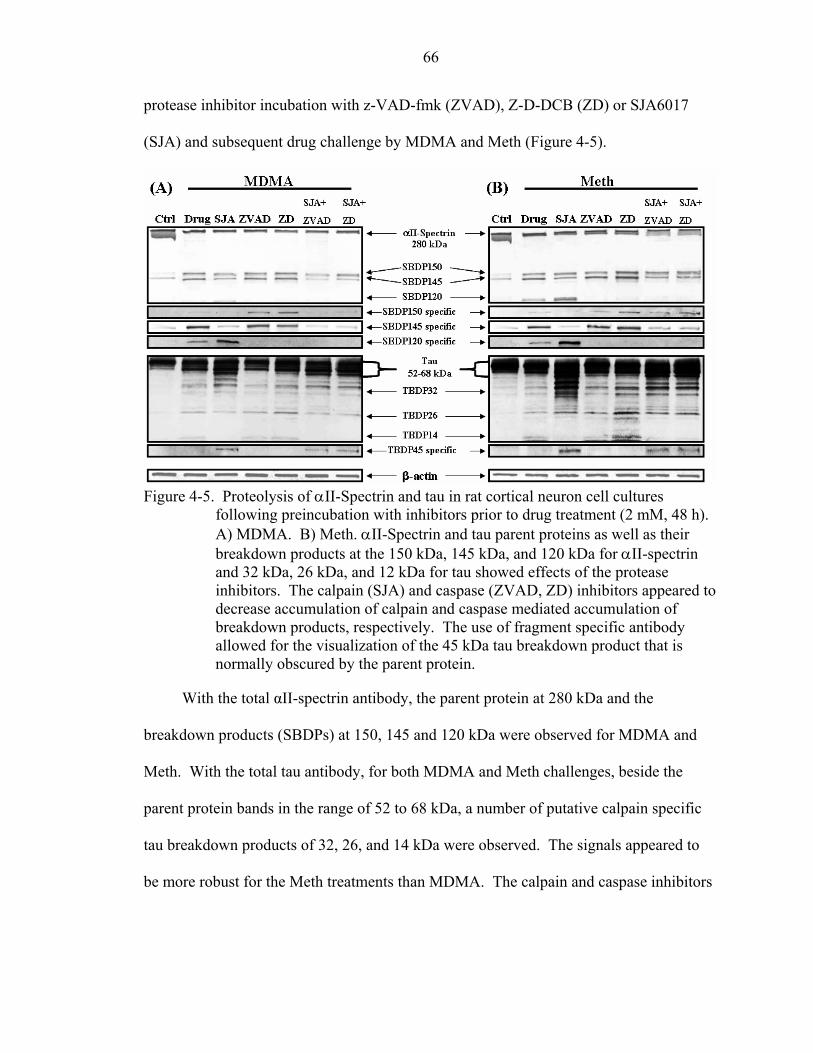
66
protease inhibitor incubation with z-VAD-fmk (ZVAD), Z-D-DCB (ZD) or SJA6017
(SJA) and subsequent drug challenge by MDMA and Meth (Figure 4-5).
Figure 4-5. Proteolysis of αII-Spectrin and tau in rat cortical neuron cell cultures
following preincubation with inhibitors prior to drug treatment (2 mM, 48 h). A) MDMA. B) Meth. αII-Spectrin and tau parent proteins as well as their breakdown products at the 150 kDa, 145 kDa, and 120 kDa for αII-spectrin and 32 kDa, 26 kDa, and 12 kDa for tau showed effects of the protease inhibitors. The calpain (SJA) and caspase (ZVAD, ZD) inhibitors appeared to decrease accumulation of calpain and caspase mediated accumulation of breakdown products, respectively. The use of fragment specific antibody allowed for the visualization of the 45 kDa tau breakdown product that is normally obscured by the parent protein.
With the total αII-spectrin antibody, the parent protein at 280 kDa and the
breakdown products (SBDPs) at 150, 145 and 120 kDa were observed for MDMA and
Meth. With the total tau antibody, for both MDMA and Meth challenges, beside the
parent protein bands in the range of 52 to 68 kDa, a number of putative calpain specific
tau breakdown products of 32, 26, and 14 kDa were observed. The signals appeared to
be more robust for the Meth treatments than MDMA. The calpain and caspase inhibitors
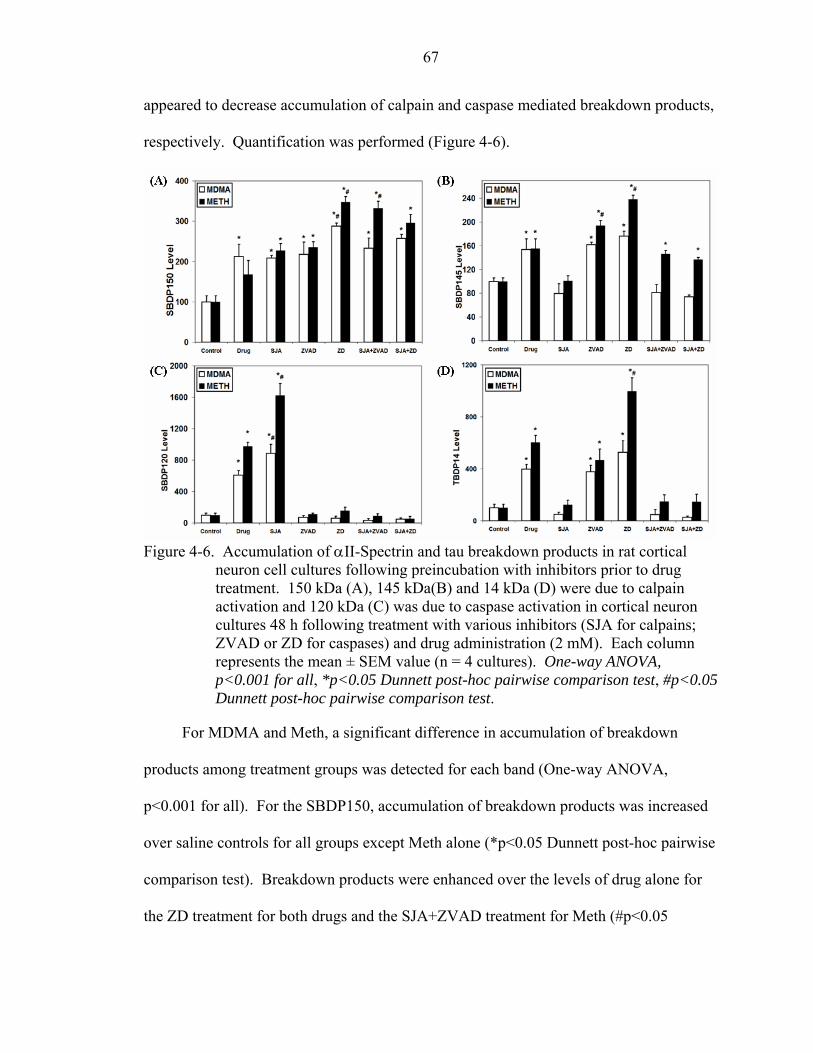
67
appeared to decrease accumulation of calpain and caspase mediated breakdown products,
respectively. Quantification was performed (Figure 4-6).
Figure 4-6. Accumulation of αII-Spectrin and tau breakdown products in rat cortical
neuron cell cultures following preincubation with inhibitors prior to drug treatment. 150 kDa (A), 145 kDa(B) and 14 kDa (D) were due to calpain activation and 120 kDa (C) was due to caspase activation in cortical neuron cultures 48 h following treatment with various inhibitors (SJA for calpains; ZVAD or ZD for caspases) and drug administration (2 mM). Each column represents the mean ± SEM value (n = 4 cultures). One-way ANOVA, p<0.001 for all, *p<0.05 Dunnett post-hoc pairwise comparison test, #p<0.05 Dunnett post-hoc pairwise comparison test.
For MDMA and Meth, a significant difference in accumulation of breakdown
products among treatment groups was detected for each band (One-way ANOVA,
p<0.001 for all). For the SBDP150, accumulation of breakdown products was increased
over saline controls for all groups except Meth alone (*p<0.05 Dunnett post-hoc pairwise
comparison test). Breakdown products were enhanced over the levels of drug alone for
the ZD treatment for both drugs and the SJA+ZVAD treatment for Meth (#p<0.05
68
Dunnett post-hoc pairwise comparison test). For the SBDP145, SJA had the effect of
significantly decreasing accumulation of breakdown products to the level of saline
controls. The same was true for the mixtures of SJA with either ZVAD or ZD for the
MDMA treatment group. Breakdown products were enhanced over the levels of drug
alone for Meth cultures treated with either ZVAD or ZD. For the SBDP120, any drug
group treated with ZVAD or ZD alone or in mixture with SJA had its accumulation of
breakdown products reduced to that of saline controls. Breakdown products were
enhanced over the levels of drug alone for the SJA treatments in either drug. For
TBDP14, each drug group treated with SJA alone or in combination with ZVAD or ZD
had the breakdown product accumulation reduced to that of saline controls. Breakdown
products were enhanced over the levels of drug alone for the Meth cultures treated with
ZD. Similar results were seen for TBDP32 and TBDP26 (data not shown).
For both drug treatments, prior to pretreatment with the protease inhibitors, the
SBDP150/SBDP145 doublet was visible, although the calpain specific SBDP150 was not
detectable (Figures 4-5A, 4-5B). Our results demonstrated that the calpain specific
antibody to SBDP150 was enhanced in the presence of the caspase inhibitors (ZVAD or
ZD). Quantification of data based on the SBDP150, including both calpain-mediated
SBDP150 and caspase-mediated SBDP150i (Wang 2000), from the non-specific total αII-
spectrin antibody did not show an overall decrease in breakdown products after inhibitor
treatment suggesting a mixture of caspase and calpain activity (Figure 4-6A). In fact,
breakdown products appeared to have increased after treatment with the caspase
inhibitors. Although some calpain-specific SBDP145 background signal was detected in
control cells, there were significant increases in the SBDP145 signals for MDMA and
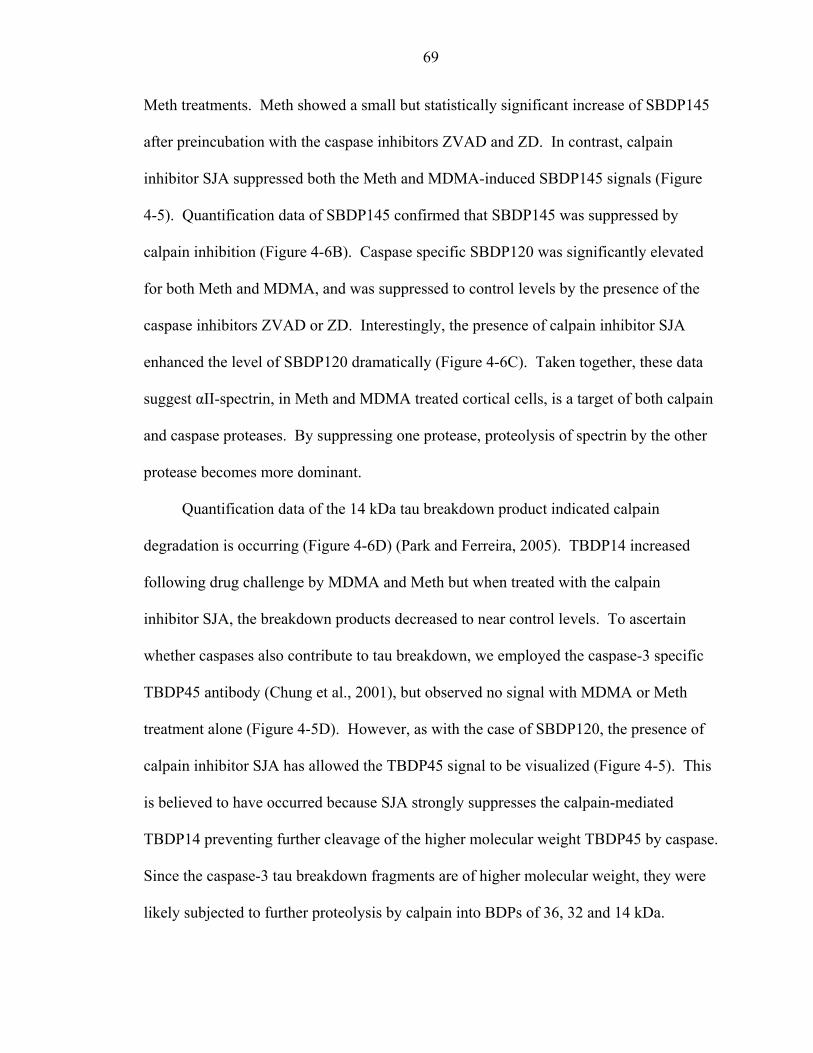
69
Meth treatments. Meth showed a small but statistically significant increase of SBDP145
after preincubation with the caspase inhibitors ZVAD and ZD. In contrast, calpain
inhibitor SJA suppressed both the Meth and MDMA-induced SBDP145 signals (Figure
4-5). Quantification data of SBDP145 confirmed that SBDP145 was suppressed by
calpain inhibition (Figure 4-6B). Caspase specific SBDP120 was significantly elevated
for both Meth and MDMA, and was suppressed to control levels by the presence of the
caspase inhibitors ZVAD or ZD. Interestingly, the presence of calpain inhibitor SJA
enhanced the level of SBDP120 dramatically (Figure 4-6C). Taken together, these data
suggest αII-spectrin, in Meth and MDMA treated cortical cells, is a target of both calpain
and caspase proteases. By suppressing one protease, proteolysis of spectrin by the other
protease becomes more dominant.
Quantification data of the 14 kDa tau breakdown product indicated calpain
degradation is occurring (Figure 4-6D) (Park and Ferreira, 2005). TBDP14 increased
following drug challenge by MDMA and Meth but when treated with the calpain
inhibitor SJA, the breakdown products decreased to near control levels. To ascertain
whether caspases also contribute to tau breakdown, we employed the caspase-3 specific
TBDP45 antibody (Chung et al., 2001), but observed no signal with MDMA or Meth
treatment alone (Figure 4-5D). However, as with the case of SBDP120, the presence of
calpain inhibitor SJA has allowed the TBDP45 signal to be visualized (Figure 4-5). This
is believed to have occurred because SJA strongly suppresses the calpain-mediated
TBDP14 preventing further cleavage of the higher molecular weight TBDP45 by caspase.
Since the caspase-3 tau breakdown fragments are of higher molecular weight, they were
likely subjected to further proteolysis by calpain into BDPs of 36, 32 and 14 kDa.
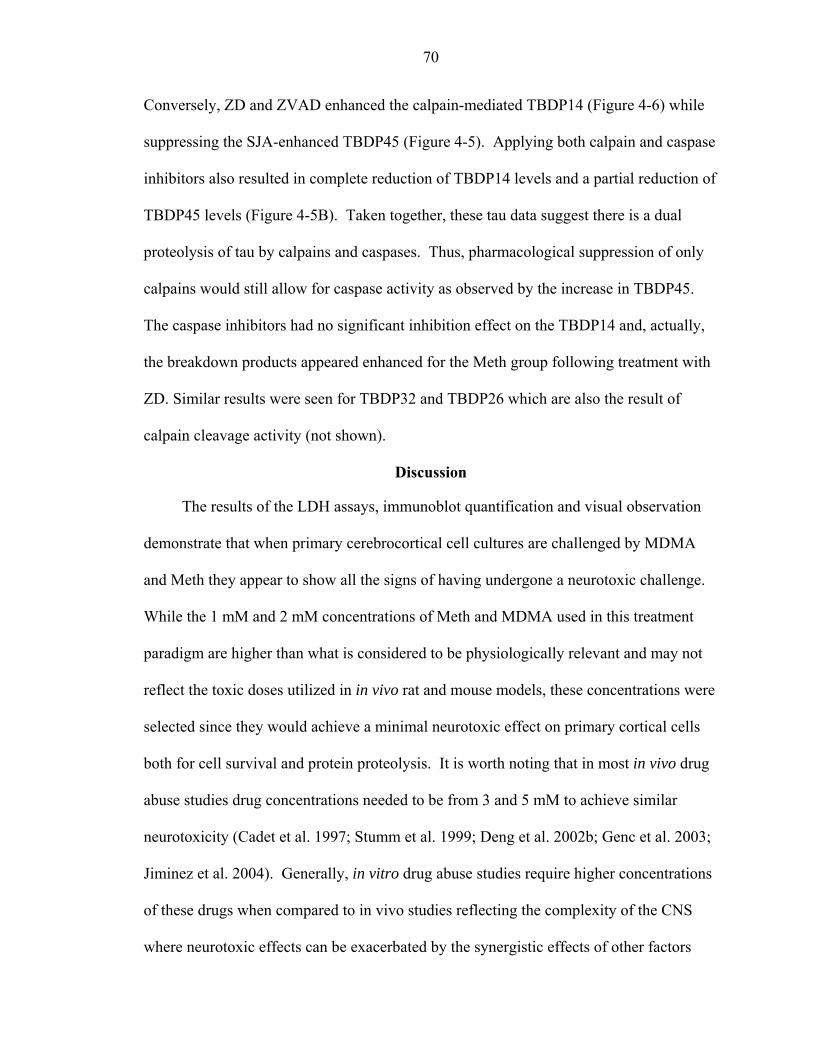
70
Conversely, ZD and ZVAD enhanced the calpain-mediated TBDP14 (Figure 4-6) while
suppressing the SJA-enhanced TBDP45 (Figure 4-5). Applying both calpain and caspase
inhibitors also resulted in complete reduction of TBDP14 levels and a partial reduction of
TBDP45 levels (Figure 4-5B). Taken together, these tau data suggest there is a dual
proteolysis of tau by calpains and caspases. Thus, pharmacological suppression of only
calpains would still allow for caspase activity as observed by the increase in TBDP45.
The caspase inhibitors had no significant inhibition effect on the TBDP14 and, actually,
the breakdown products appeared enhanced for the Meth group following treatment with
ZD. Similar results were seen for TBDP32 and TBDP26 which are also the result of
calpain cleavage activity (not shown).
Discussion
The results of the LDH assays, immunoblot quantification and visual observation
demonstrate that when primary cerebrocortical cell cultures are challenged by MDMA
and Meth they appear to show all the signs of having undergone a neurotoxic challenge.
While the 1 mM and 2 mM concentrations of Meth and MDMA used in this treatment
paradigm are higher than what is considered to be physiologically relevant and may not
reflect the toxic doses utilized in in vivo rat and mouse models, these concentrations were
selected since they would achieve a minimal neurotoxic effect on primary cortical cells
both for cell survival and protein proteolysis. It is worth noting that in most in vivo drug
abuse studies drug concentrations needed to be from 3 and 5 mM to achieve similar
neurotoxicity (Cadet et al. 1997; Stumm et al. 1999; Deng et al. 2002b; Genc et al. 2003;
Jiminez et al. 2004). Generally, in vitro drug abuse studies require higher concentrations
of these drugs when compared to in vivo studies reflecting the complexity of the CNS
where neurotoxic effects can be exacerbated by the synergistic effects of other factors
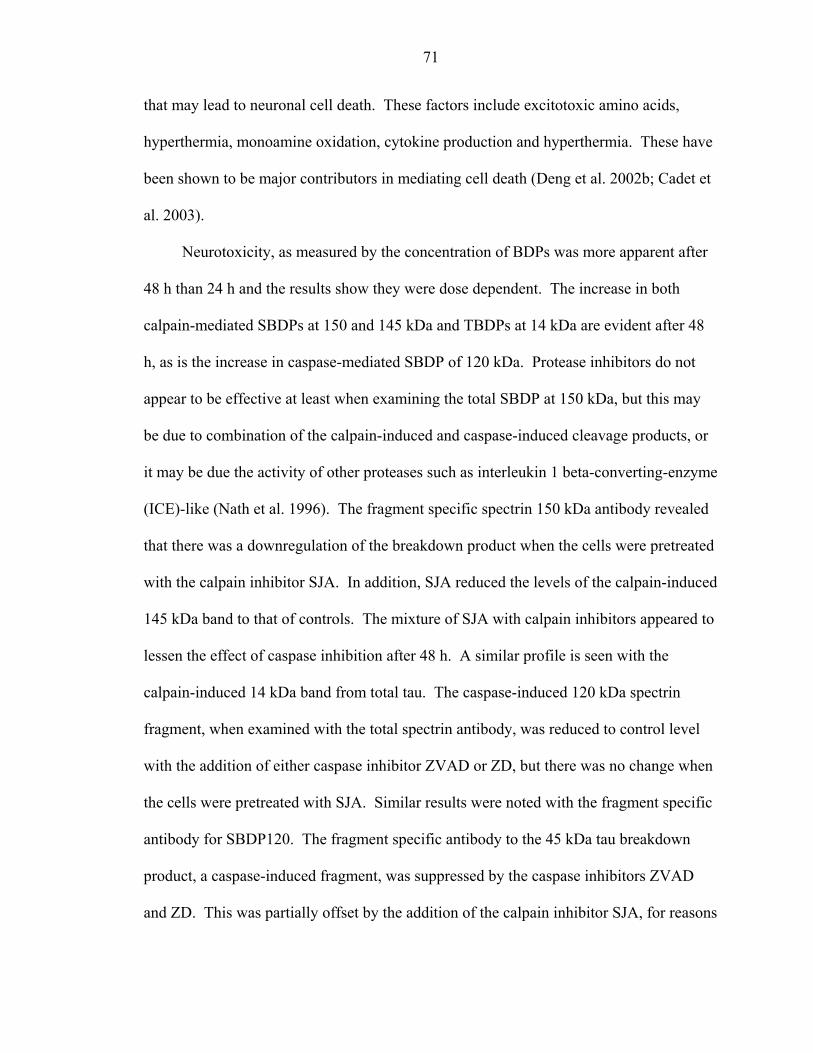
71
that may lead to neuronal cell death. These factors include excitotoxic amino acids,
hyperthermia, monoamine oxidation, cytokine production and hyperthermia. These have
been shown to be major contributors in mediating cell death (Deng et al. 2002b; Cadet et
al. 2003).
Neurotoxicity, as measured by the concentration of BDPs was more apparent after
48 h than 24 h and the results show they were dose dependent. The increase in both
calpain-mediated SBDPs at 150 and 145 kDa and TBDPs at 14 kDa are evident after 48
h, as is the increase in caspase-mediated SBDP of 120 kDa. Protease inhibitors do not
appear to be effective at least when examining the total SBDP at 150 kDa, but this may
be due to combination of the calpain-induced and caspase-induced cleavage products, or
it may be due the activity of other proteases such as interleukin 1 beta-converting-enzyme
(ICE)-like (Nath et al. 1996). The fragment specific spectrin 150 kDa antibody revealed
that there was a downregulation of the breakdown product when the cells were pretreated
with the calpain inhibitor SJA. In addition, SJA reduced the levels of the calpain-induced
145 kDa band to that of controls. The mixture of SJA with calpain inhibitors appeared to
lessen the effect of caspase inhibition after 48 h. A similar profile is seen with the
calpain-induced 14 kDa band from total tau. The caspase-induced 120 kDa spectrin
fragment, when examined with the total spectrin antibody, was reduced to control level
with the addition of either caspase inhibitor ZVAD or ZD, but there was no change when
the cells were pretreated with SJA. Similar results were noted with the fragment specific
antibody for SBDP120. The fragment specific antibody to the 45 kDa tau breakdown
product, a caspase-induced fragment, was suppressed by the caspase inhibitors ZVAD
and ZD. This was partially offset by the addition of the calpain inhibitor SJA, for reasons
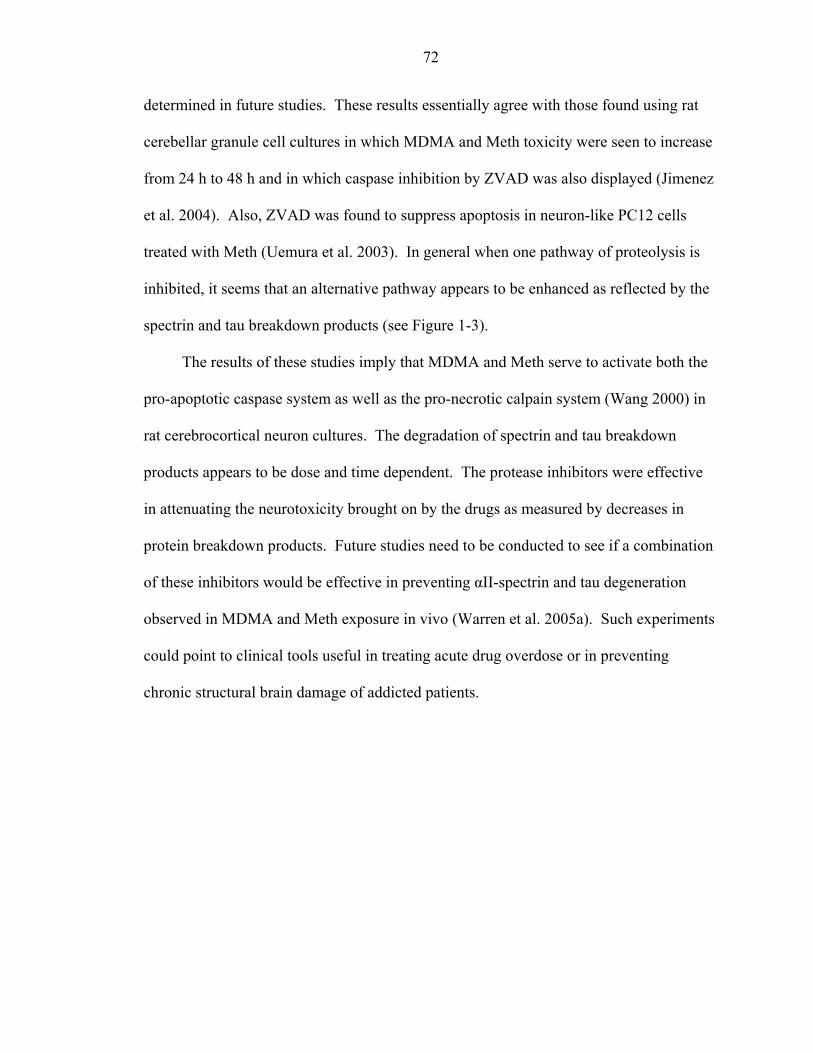
72
determined in future studies. These results essentially agree with those found using rat
cerebellar granule cell cultures in which MDMA and Meth toxicity were seen to increase
from 24 h to 48 h and in which caspase inhibition by ZVAD was also displayed (Jimenez
et al. 2004). Also, ZVAD was found to suppress apoptosis in neuron-like PC12 cells
treated with Meth (Uemura et al. 2003). In general when one pathway of proteolysis is
inhibited, it seems that an alternative pathway appears to be enhanced as reflected by the
spectrin and tau breakdown products (see Figure 1-3).
The results of these studies imply that MDMA and Meth serve to activate both the
pro-apoptotic caspase system as well as the pro-necrotic calpain system (Wang 2000) in
rat cerebrocortical neuron cultures. The degradation of spectrin and tau breakdown
products appears to be dose and time dependent. The protease inhibitors were effective
in attenuating the neurotoxicity brought on by the drugs as measured by decreases in
protein breakdown products. Future studies need to be conducted to see if a combination
of these inhibitors would be effective in preventing αII-spectrin and tau degeneration
observed in MDMA and Meth exposure in vivo (Warren et al. 2005a). Such experiments
could point to clinical tools useful in treating acute drug overdose or in preventing
chronic structural brain damage of addicted patients.
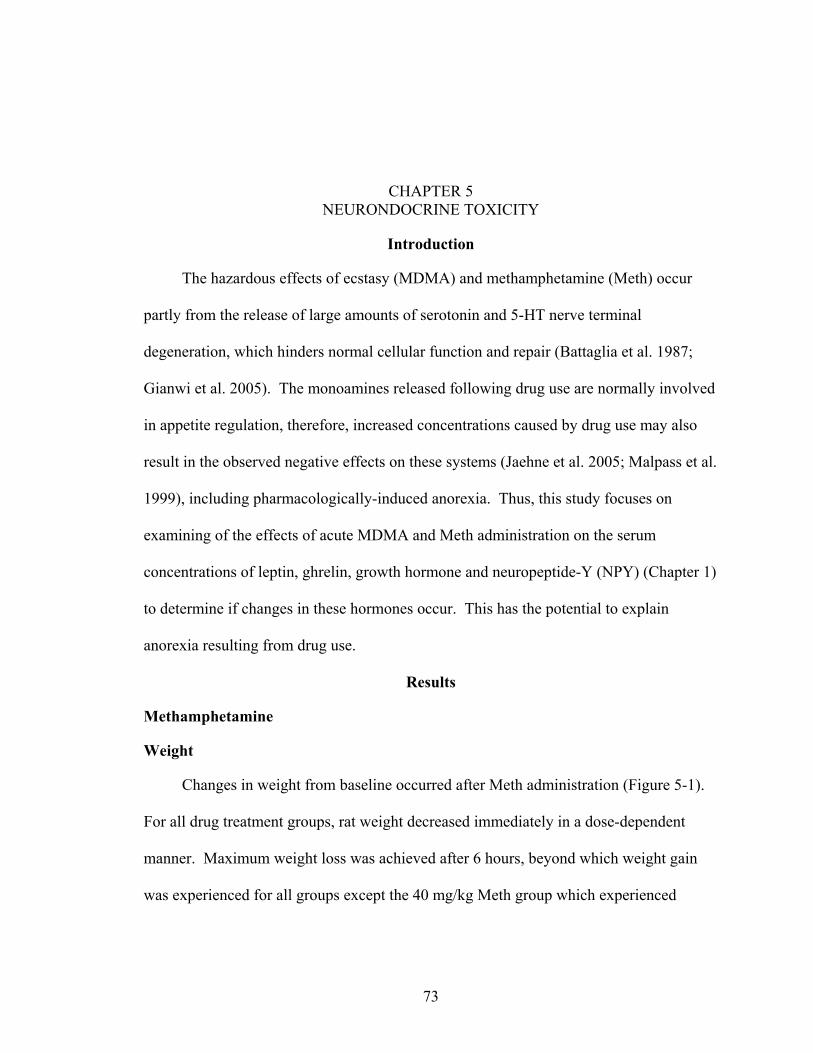
CHAPTER 5 NEURONDOCRINE TOXICITY
Introduction
The hazardous effects of ecstasy (MDMA) and methamphetamine (Meth) occur
partly from the release of large amounts of serotonin and 5-HT nerve terminal
degeneration, which hinders normal cellular function and repair (Battaglia et al. 1987;
Gianwi et al. 2005). The monoamines released following drug use are normally involved
in appetite regulation, therefore, increased concentrations caused by drug use may also
result in the observed negative effects on these systems (Jaehne et al. 2005; Malpass et al.
1999), including pharmacologically-induced anorexia. Thus, this study focuses on
examining of the effects of acute MDMA and Meth administration on the serum
concentrations of leptin, ghrelin, growth hormone and neuropeptide-Y (NPY) (Chapter 1)
to determine if changes in these hormones occur. This has the potential to explain
anorexia resulting from drug use.
Results
Methamphetamine
Weight
Changes in weight from baseline occurred after Meth administration (Figure 5-1).
For all drug treatment groups, rat weight decreased immediately in a dose-dependent
manner. Maximum weight loss was achieved after 6 hours, beyond which weight gain
was experienced for all groups except the 40 mg/kg Meth group which experienced
73
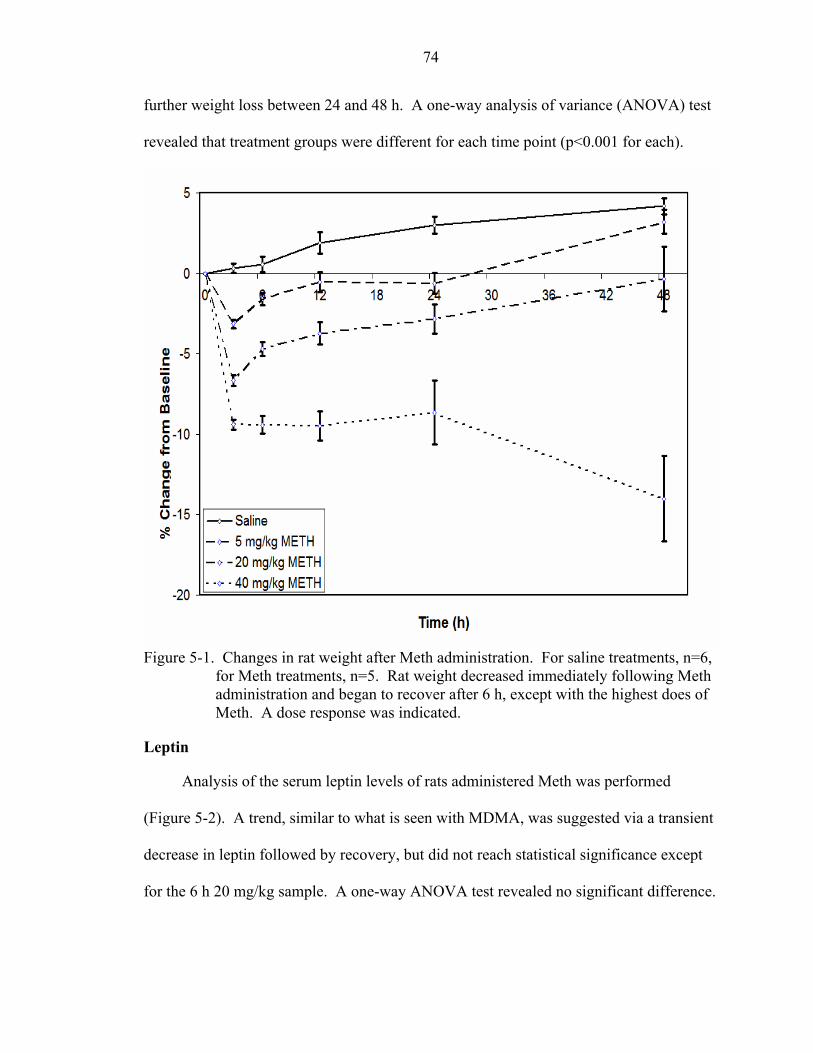
74
further weight loss between 24 and 48 h. A one-way analysis of variance (ANOVA) test
revealed that treatment groups were different for each time point (p<0.001 for each).
Figure 5-1. Changes in rat weight after Meth administration. For saline treatments, n=6,
for Meth treatments, n=5. Rat weight decreased immediately following Meth administration and began to recover after 6 h, except with the highest does of Meth. A dose response was indicated.
Leptin
Analysis of the serum leptin levels of rats administered Meth was performed
(Figure 5-2). A trend, similar to what is seen with MDMA, was suggested via a transient
decrease in leptin followed by recovery, but did not reach statistical significance except
for the 6 h 20 mg/kg sample. A one-way ANOVA test revealed no significant difference.
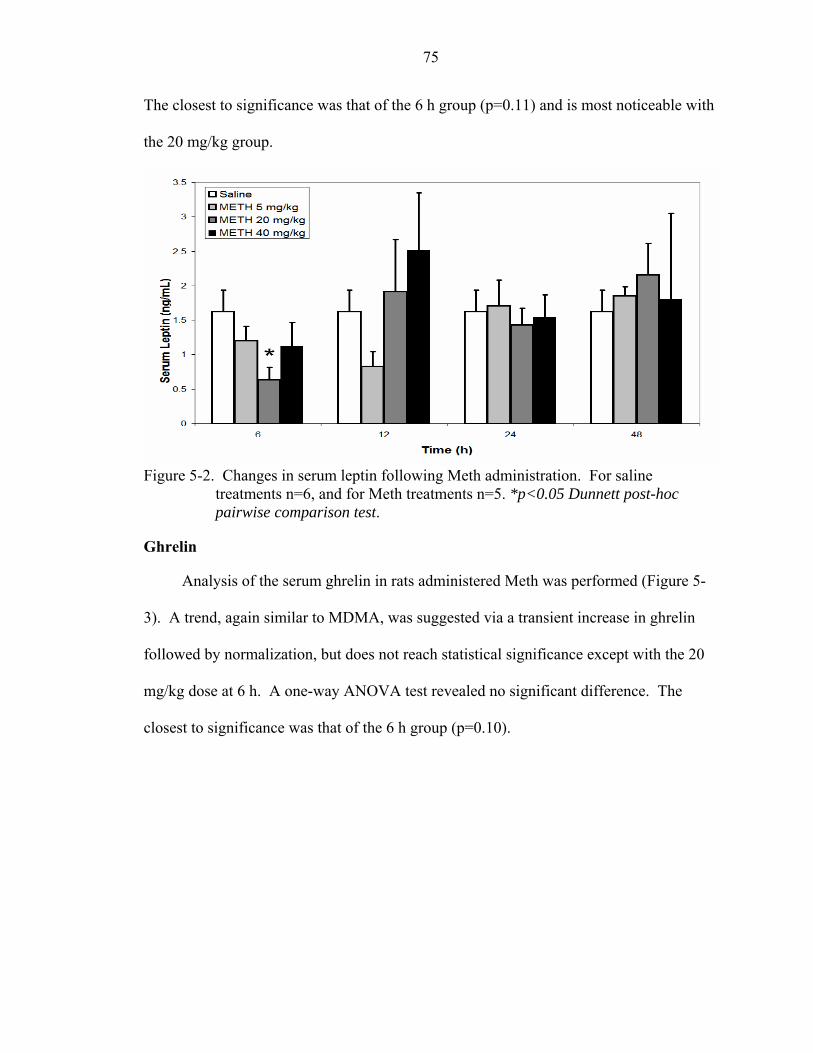
75
The closest to significance was that of the 6 h group (p=0.11) and is most noticeable with
the 20 mg/kg group.
Figure 5-2. Changes in serum leptin following Meth administration. For saline
treatments n=6, and for Meth treatments n=5. *p<0.05 Dunnett post-hoc pairwise comparison test.
Ghrelin
Analysis of the serum ghrelin in rats administered Meth was performed (Figure 5-
3). A trend, again similar to MDMA, was suggested via a transient increase in ghrelin
followed by normalization, but does not reach statistical significance except with the 20
mg/kg dose at 6 h. A one-way ANOVA test revealed no significant difference. The
closest to significance was that of the 6 h group (p=0.10).
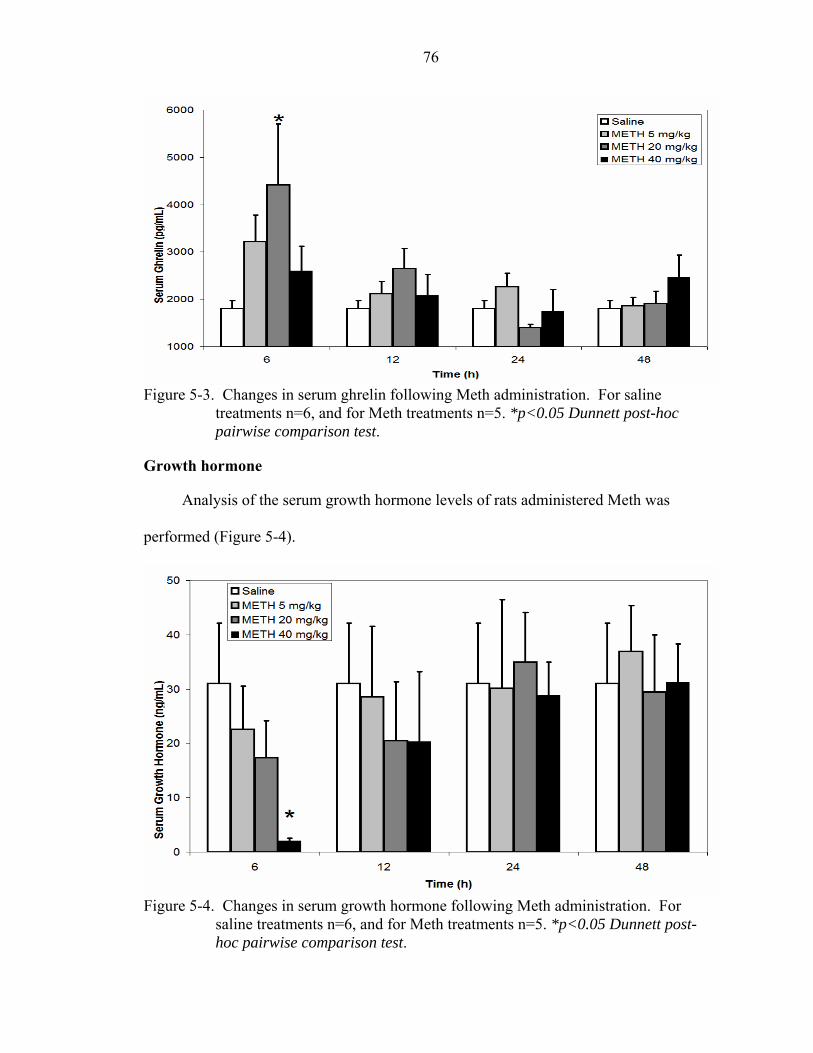
76
Figure 5-3. Changes in serum ghrelin following Meth administration. For saline
treatments n=6, and for Meth treatments n=5. *p<0.05 Dunnett post-hoc pairwise comparison test.
Growth hormone
Analysis of the serum growth hormone levels of rats administered Meth was
performed (Figure 5-4).
Figure 5-4. Changes in serum growth hormone following Meth administration. For
saline treatments n=6, and for Meth treatments n=5. *p<0.05 Dunnett post-hoc pairwise comparison test.
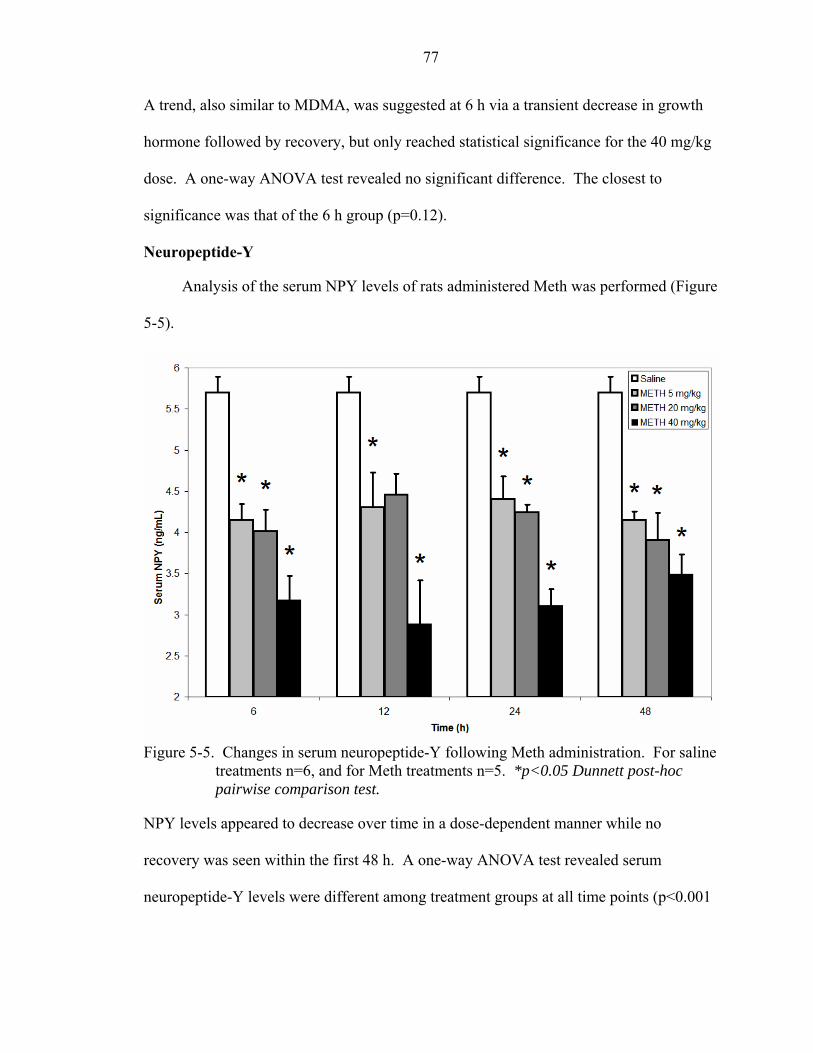
77
A trend, also similar to MDMA, was suggested at 6 h via a transient decrease in growth
hormone followed by recovery, but only reached statistical significance for the 40 mg/kg
dose. A one-way ANOVA test revealed no significant difference. The closest to
significance was that of the 6 h group (p=0.12).
Neuropeptide-Y
Analysis of the serum NPY levels of rats administered Meth was performed (Figure
5-5).
Figure 5-5. Changes in serum neuropeptide-Y following Meth administration. For saline
treatments n=6, and for Meth treatments n=5. *p<0.05 Dunnett post-hoc pairwise comparison test.
NPY levels appeared to decrease over time in a dose-dependent manner while no
recovery was seen within the first 48 h. A one-way ANOVA test revealed serum
neuropeptide-Y levels were different among treatment groups at all time points (p<0.001
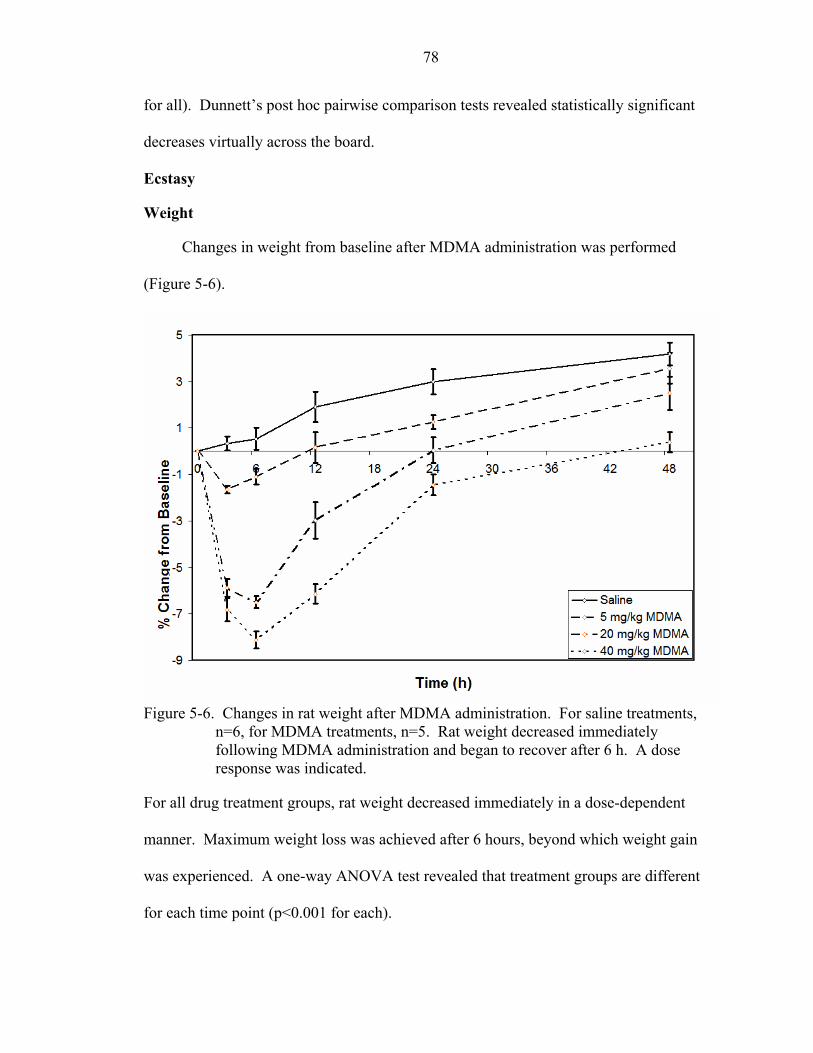
78
for all). Dunnett’s post hoc pairwise comparison tests revealed statistically significant
decreases virtually across the board.
Ecstasy
Weight
Changes in weight from baseline after MDMA administration was performed
(Figure 5-6).
Figure 5-6. Changes in rat weight after MDMA administration. For saline treatments,
n=6, for MDMA treatments, n=5. Rat weight decreased immediately following MDMA administration and began to recover after 6 h. A dose response was indicated.
For all drug treatment groups, rat weight decreased immediately in a dose-dependent
manner. Maximum weight loss was achieved after 6 hours, beyond which weight gain
was experienced. A one-way ANOVA test revealed that treatment groups are different
for each time point (p<0.001 for each).
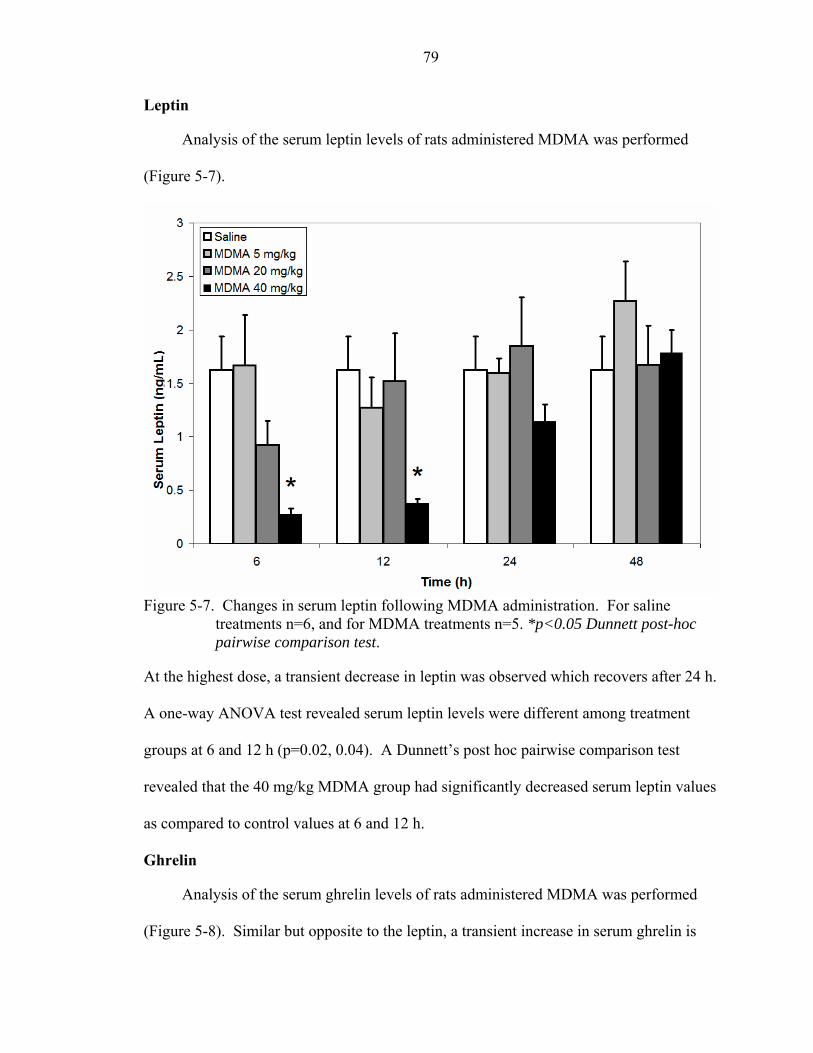
79
Leptin
Analysis of the serum leptin levels of rats administered MDMA was performed
(Figure 5-7).
Figure 5-7. Changes in serum leptin following MDMA administration. For saline
treatments n=6, and for MDMA treatments n=5. *p<0.05 Dunnett post-hoc pairwise comparison test.
At the highest dose, a transient decrease in leptin was observed which recovers after 24 h.
A one-way ANOVA test revealed serum leptin levels were different among treatment
groups at 6 and 12 h (p=0.02, 0.04). A Dunnett’s post hoc pairwise comparison test
revealed that the 40 mg/kg MDMA group had significantly decreased serum leptin values
as compared to control values at 6 and 12 h.
Ghrelin
Analysis of the serum ghrelin levels of rats administered MDMA was performed
(Figure 5-8). Similar but opposite to the leptin, a transient increase in serum ghrelin is
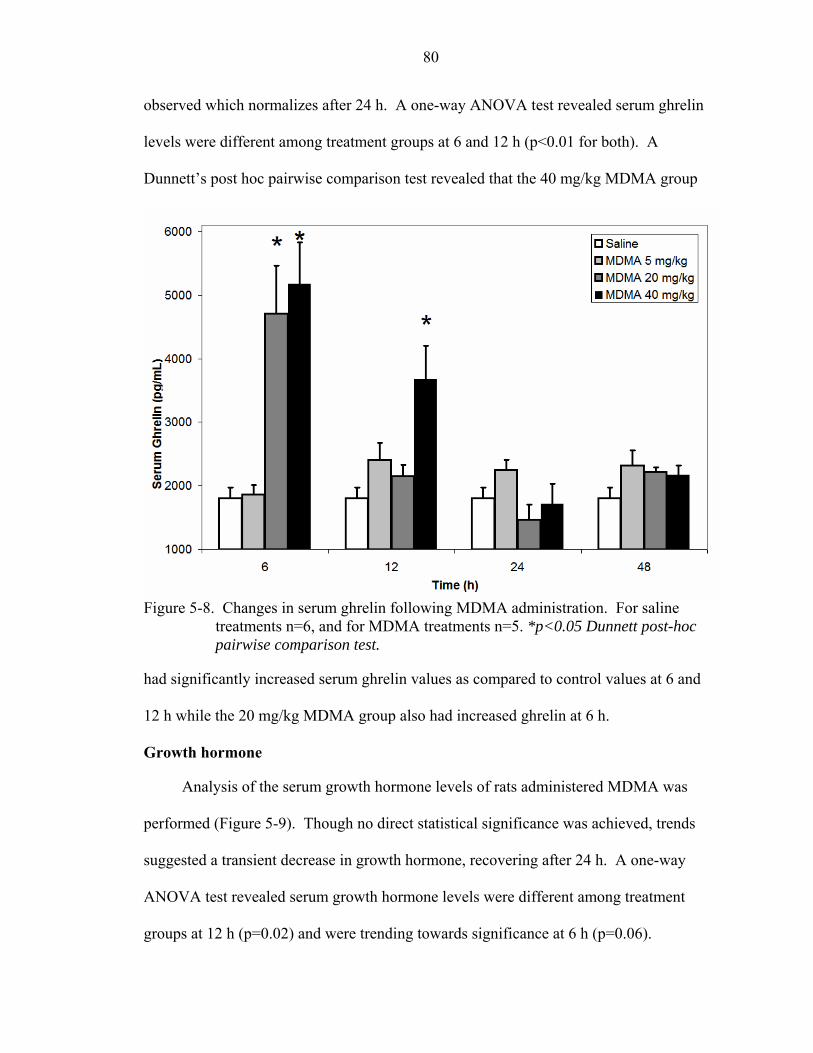
80
observed which normalizes after 24 h. A one-way ANOVA test revealed serum ghrelin
levels were different among treatment groups at 6 and 12 h (p<0.01 for both). A
Dunnett’s post hoc pairwise comparison test revealed that the 40 mg/kg MDMA group
Figure 5-8. Changes in serum ghrelin following MDMA administration. For saline
treatments n=6, and for MDMA treatments n=5. *p<0.05 Dunnett post-hoc pairwise comparison test.
had significantly increased serum ghrelin values as compared to control values at 6 and
12 h while the 20 mg/kg MDMA group also had increased ghrelin at 6 h.
Growth hormone
Analysis of the serum growth hormone levels of rats administered MDMA was
performed (Figure 5-9). Though no direct statistical significance was achieved, trends
suggested a transient decrease in growth hormone, recovering after 24 h. A one-way
ANOVA test revealed serum growth hormone levels were different among treatment
groups at 12 h (p=0.02) and were trending towards significance at 6 h (p=0.06).
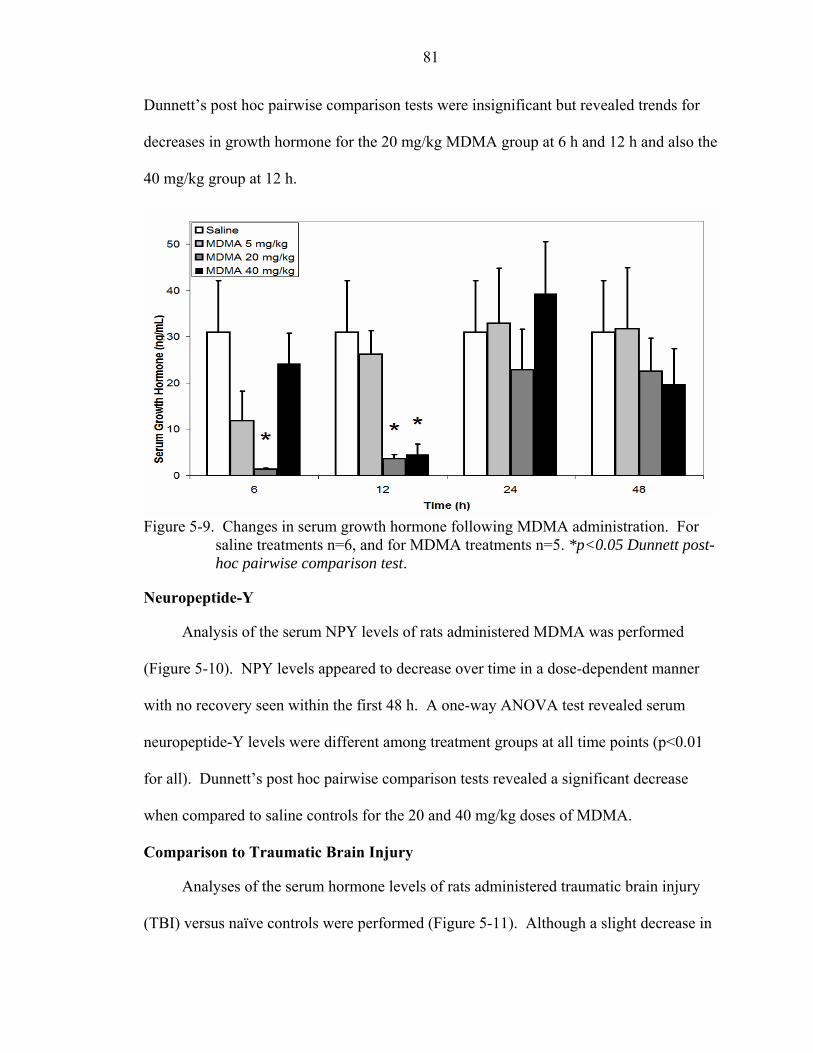
81
Dunnett’s post hoc pairwise comparison tests were insignificant but revealed trends for
decreases in growth hormone for the 20 mg/kg MDMA group at 6 h and 12 h and also the
40 mg/kg group at 12 h.
Figure 5-9. Changes in serum growth hormone following MDMA administration. For
saline treatments n=6, and for MDMA treatments n=5. *p<0.05 Dunnett post-hoc pairwise comparison test.
Neuropeptide-Y
Analysis of the serum NPY levels of rats administered MDMA was performed
(Figure 5-10). NPY levels appeared to decrease over time in a dose-dependent manner
with no recovery seen within the first 48 h. A one-way ANOVA test revealed serum
neuropeptide-Y levels were different among treatment groups at all time points (p<0.01
for all). Dunnett’s post hoc pairwise comparison tests revealed a significant decrease
when compared to saline controls for the 20 and 40 mg/kg doses of MDMA.
Comparison to Traumatic Brain Injury
Analyses of the serum hormone levels of rats administered traumatic brain injury
(TBI) versus naïve controls were performed (Figure 5-11). Although a slight decrease in
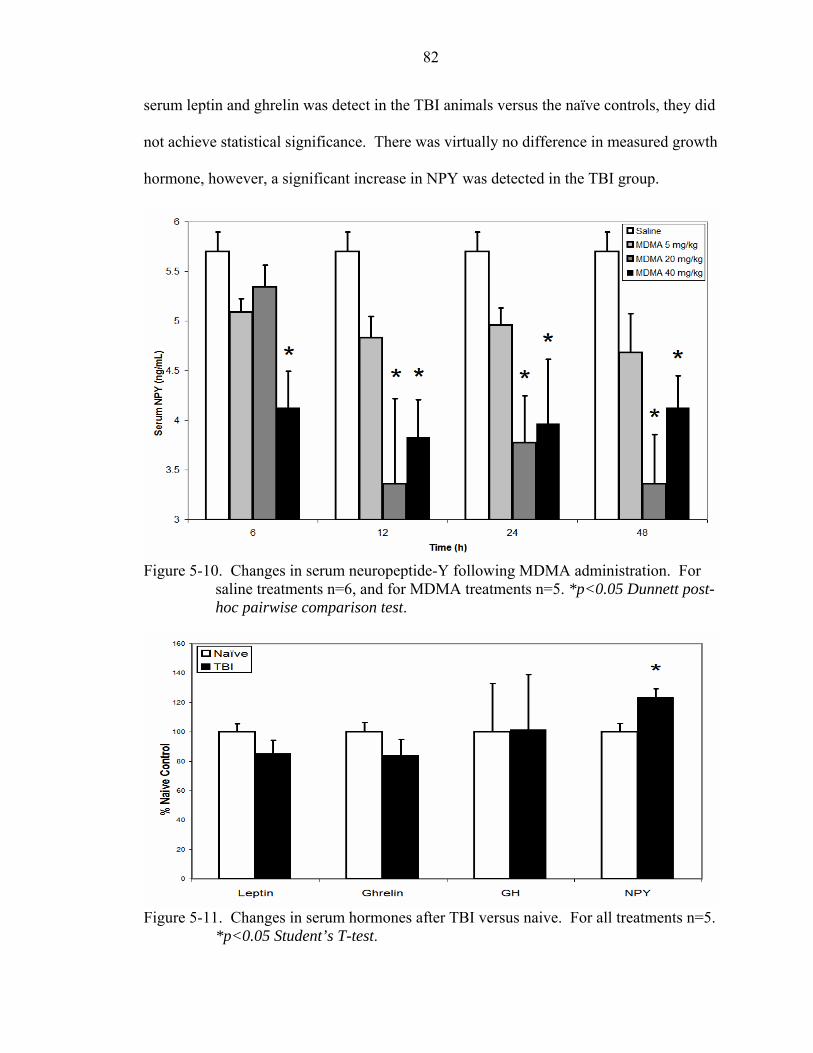
82
serum leptin and ghrelin was detect in the TBI animals versus the naïve controls, they did
not achieve statistical significance. There was virtually no difference in measured growth
hormone, however, a significant increase in NPY was detected in the TBI group.
Figure 5-10. Changes in serum neuropeptide-Y following MDMA administration. For
saline treatments n=6, and for MDMA treatments n=5. *p<0.05 Dunnett post-hoc pairwise comparison test.
Figure 5-11. Changes in serum hormones after TBI versus naive. For all treatments n=5.
*p<0.05 Student’s T-test.
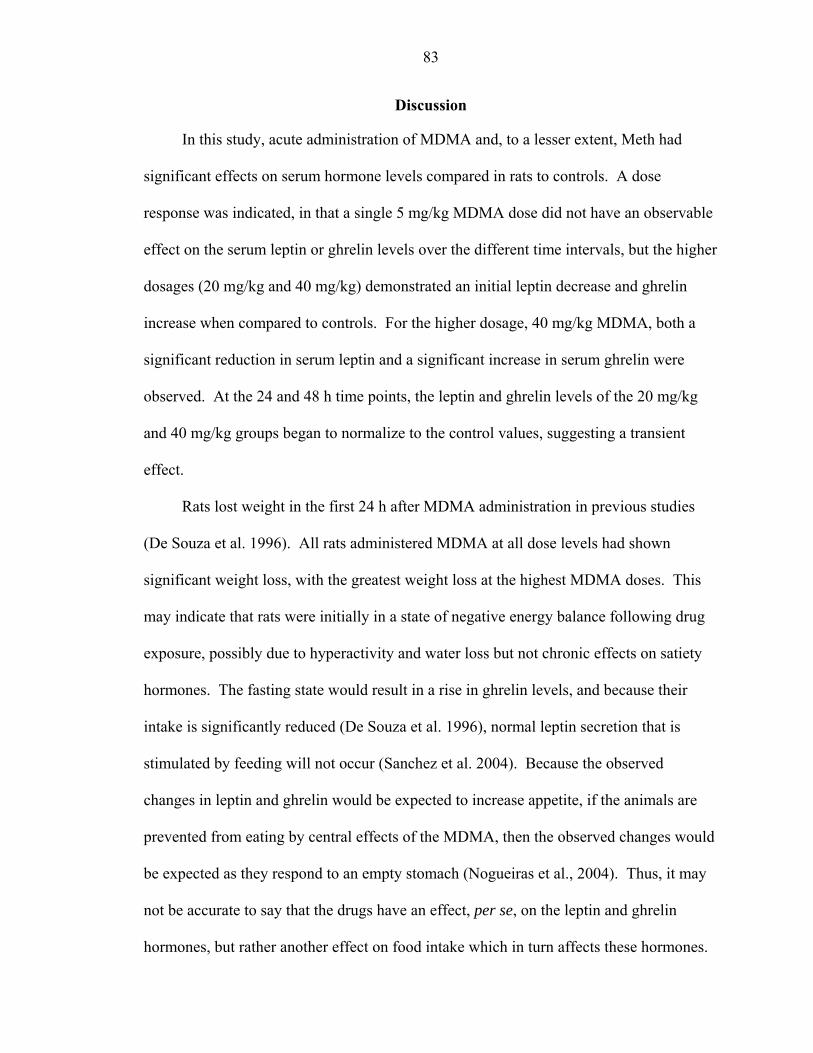
83
Discussion
In this study, acute administration of MDMA and, to a lesser extent, Meth had
significant effects on serum hormone levels compared in rats to controls. A dose
response was indicated, in that a single 5 mg/kg MDMA dose did not have an observable
effect on the serum leptin or ghrelin levels over the different time intervals, but the higher
dosages (20 mg/kg and 40 mg/kg) demonstrated an initial leptin decrease and ghrelin
increase when compared to controls. For the higher dosage, 40 mg/kg MDMA, both a
significant reduction in serum leptin and a significant increase in serum ghrelin were
observed. At the 24 and 48 h time points, the leptin and ghrelin levels of the 20 mg/kg
and 40 mg/kg groups began to normalize to the control values, suggesting a transient
effect.
Rats lost weight in the first 24 h after MDMA administration in previous studies
(De Souza et al. 1996). All rats administered MDMA at all dose levels had shown
significant weight loss, with the greatest weight loss at the highest MDMA doses. This
may indicate that rats were initially in a state of negative energy balance following drug
exposure, possibly due to hyperactivity and water loss but not chronic effects on satiety
hormones. The fasting state would result in a rise in ghrelin levels, and because their
intake is significantly reduced (De Souza et al. 1996), normal leptin secretion that is
stimulated by feeding will not occur (Sanchez et al. 2004). Because the observed
changes in leptin and ghrelin would be expected to increase appetite, if the animals are
prevented from eating by central effects of the MDMA, then the observed changes would
be expected as they respond to an empty stomach (Nogueiras et al., 2004). Thus, it may
not be accurate to say that the drugs have an effect, per se, on the leptin and ghrelin
hormones, but rather another effect on food intake which in turn affects these hormones.
84
A transient decrease in growth hormone was suggested by the data, but did not
reach statistical significance. NPY was significantly decreased, with the 20 mg/kg and
40 mg/kg groups having the most significant reductions, but did not recover within the 48
h window of the study. These results are similar to the results found in experiments
where animals given Meth and fed ad libitum had reduced serum leptin and increased
serum ghrelin concentrations (Crowley et al. 2005). However, in that study, it was
observed that the NPY expression was increased in ad libitum-fed animals, but inhibited
in schedule-fed animals. In another study, NPY expression has been shown to be
significantly decreased 24 h following amphetamine administration (Hseigh et al. 2005).
NPY is a strong appetite stimulator (Kalra and Kalra 2004), and a decrease in its
expression has been suggested as an underlying mechanism for psychostimulant-induced
anorexia (Crowley et al. 2005). In this study, it was observed that leptin and NPY serum
levels were both decreased. Leptin inhibits NPY and ghrelin stimulates NPY production;
therefore, it would seem that NPY levels should be increased due to ghrelin stimulation.
However, it could be possible that the increase of 5-HT released due to drug
administration (Battaglia et al. 1987) may have a stronger effect on inhibiting NPY
expression than ghrelin has on stimulating NPY production. Ecstasy could also be
affecting the hormones individually and disrupting the feedback mechanisms that they
have on one another, so that NPY and growth hormone could not be responding to
ghrelin or leptin influence.
The serum hormone levels for the experimental groups administered Meth followed
the same trend as the values for the groups administered MDMA, however, all the
experimental values were not yet considered significant except the values for serum NPY
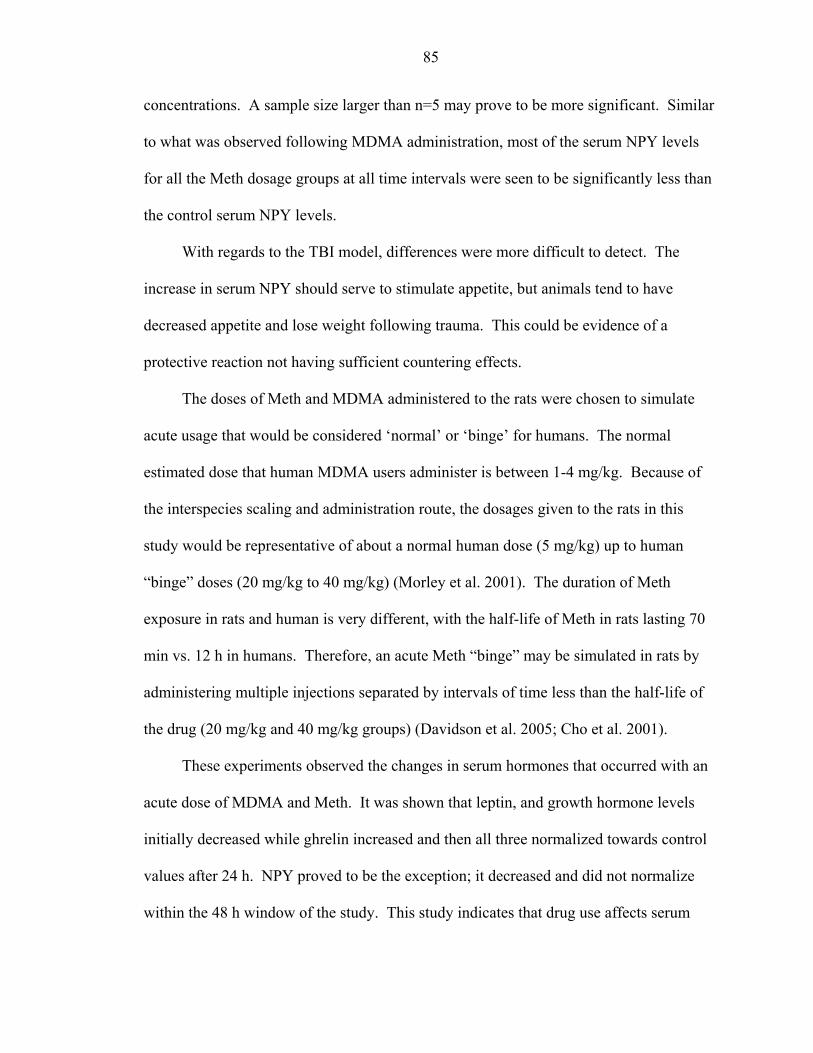
85
concentrations. A sample size larger than n=5 may prove to be more significant. Similar
to what was observed following MDMA administration, most of the serum NPY levels
for all the Meth dosage groups at all time intervals were seen to be significantly less than
the control serum NPY levels.
With regards to the TBI model, differences were more difficult to detect. The
increase in serum NPY should serve to stimulate appetite, but animals tend to have
decreased appetite and lose weight following trauma. This could be evidence of a
protective reaction not having sufficient countering effects.
The doses of Meth and MDMA administered to the rats were chosen to simulate
acute usage that would be considered ‘normal’ or ‘binge’ for humans. The normal
estimated dose that human MDMA users administer is between 1-4 mg/kg. Because of
the interspecies scaling and administration route, the dosages given to the rats in this
study would be representative of about a normal human dose (5 mg/kg) up to human
“binge” doses (20 mg/kg to 40 mg/kg) (Morley et al. 2001). The duration of Meth
exposure in rats and human is very different, with the half-life of Meth in rats lasting 70
min vs. 12 h in humans. Therefore, an acute Meth “binge” may be simulated in rats by
administering multiple injections separated by intervals of time less than the half-life of
the drug (20 mg/kg and 40 mg/kg groups) (Davidson et al. 2005; Cho et al. 2001).
These experiments observed the changes in serum hormones that occurred with an
acute dose of MDMA and Meth. It was shown that leptin, and growth hormone levels
initially decreased while ghrelin increased and then all three normalized towards control
values after 24 h. NPY proved to be the exception; it decreased and did not normalize
within the 48 h window of the study. This study indicates that drug use affects serum
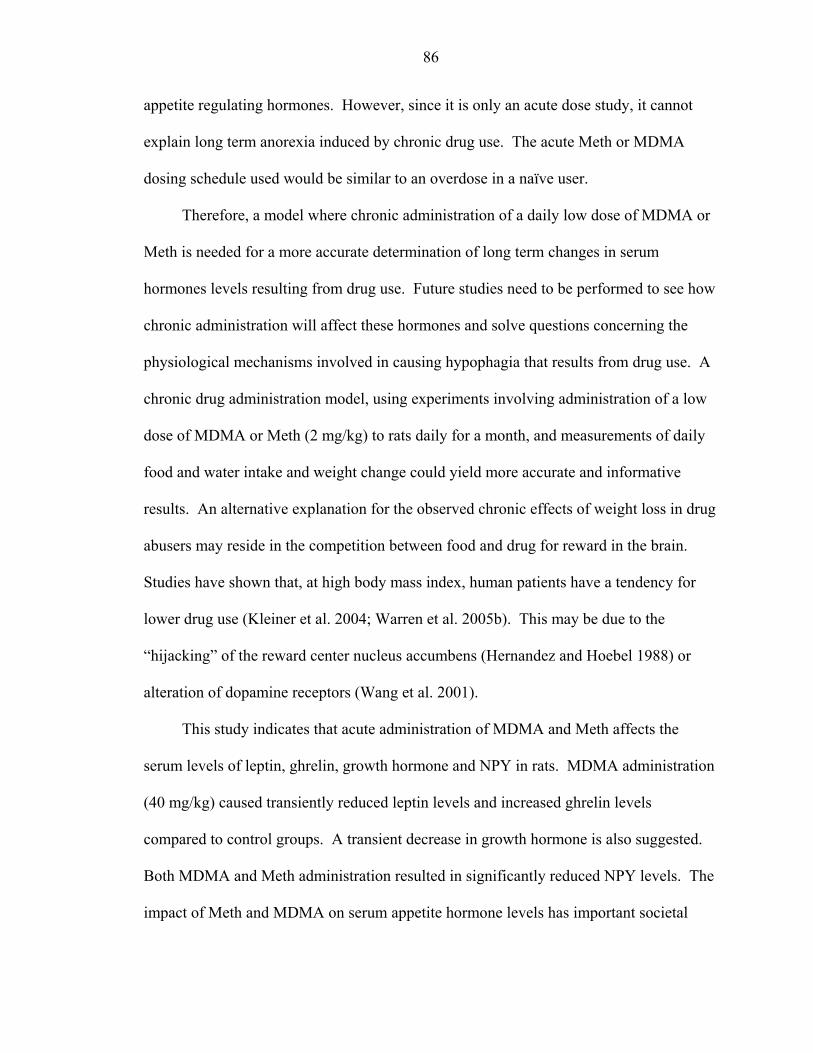
86
appetite regulating hormones. However, since it is only an acute dose study, it cannot
explain long term anorexia induced by chronic drug use. The acute Meth or MDMA
dosing schedule used would be similar to an overdose in a naïve user.
Therefore, a model where chronic administration of a daily low dose of MDMA or
Meth is needed for a more accurate determination of long term changes in serum
hormones levels resulting from drug use. Future studies need to be performed to see how
chronic administration will affect these hormones and solve questions concerning the
physiological mechanisms involved in causing hypophagia that results from drug use. A
chronic drug administration model, using experiments involving administration of a low
dose of MDMA or Meth (2 mg/kg) to rats daily for a month, and measurements of daily
food and water intake and weight change could yield more accurate and informative
results. An alternative explanation for the observed chronic effects of weight loss in drug
abusers may reside in the competition between food and drug for reward in the brain.
Studies have shown that, at high body mass index, human patients have a tendency for
lower drug use (Kleiner et al. 2004; Warren et al. 2005b). This may be due to the
“hijacking” of the reward center nucleus accumbens (Hernandez and Hoebel 1988) or
alteration of dopamine receptors (Wang et al. 2001).
This study indicates that acute administration of MDMA and Meth affects the
serum levels of leptin, ghrelin, growth hormone and NPY in rats. MDMA administration
(40 mg/kg) caused transiently reduced leptin levels and increased ghrelin levels
compared to control groups. A transient decrease in growth hormone is also suggested.
Both MDMA and Meth administration resulted in significantly reduced NPY levels. The
impact of Meth and MDMA on serum appetite hormone levels has important societal

87
implications for studying the mechanisms of drug-induced anorexia. Further studies need
to be performed to examine the effects of chronic drug administration on appetite
regulation to potentially understand why hypophagia results from drug use.
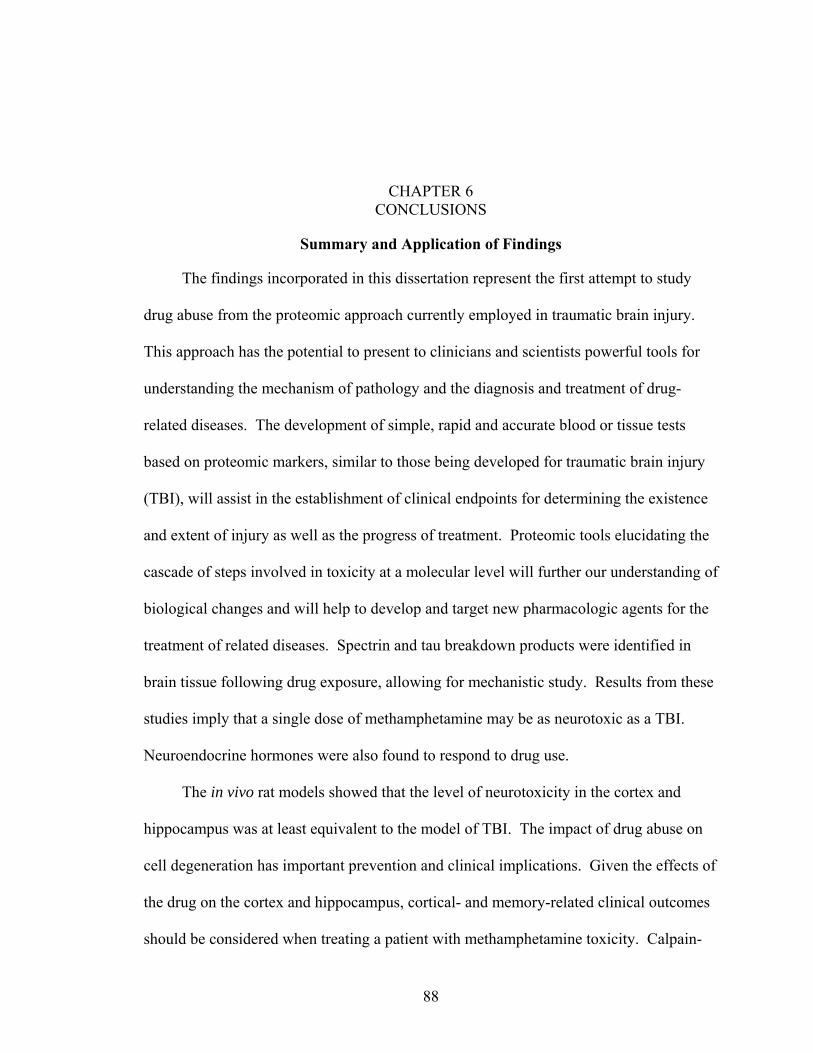
CHAPTER 6 CONCLUSIONS
Summary and Application of Findings
The findings incorporated in this dissertation represent the first attempt to study
drug abuse from the proteomic approach currently employed in traumatic brain injury.
This approach has the potential to present to clinicians and scientists powerful tools for
understanding the mechanism of pathology and the diagnosis and treatment of drug-
related diseases. The development of simple, rapid and accurate blood or tissue tests
based on proteomic markers, similar to those being developed for traumatic brain injury
(TBI), will assist in the establishment of clinical endpoints for determining the existence
and extent of injury as well as the progress of treatment. Proteomic tools elucidating the
cascade of steps involved in toxicity at a molecular level will further our understanding of
biological changes and will help to develop and target new pharmacologic agents for the
treatment of related diseases. Spectrin and tau breakdown products were identified in
brain tissue following drug exposure, allowing for mechanistic study. Results from these
studies imply that a single dose of methamphetamine may be as neurotoxic as a TBI.
Neuroendocrine hormones were also found to respond to drug use.
The in vivo rat models showed that the level of neurotoxicity in the cortex and
hippocampus was at least equivalent to the model of TBI. The impact of drug abuse on
cell degeneration has important prevention and clinical implications. Given the effects of
the drug on the cortex and hippocampus, cortical- and memory-related clinical outcomes
should be considered when treating a patient with methamphetamine toxicity. Calpain-
88
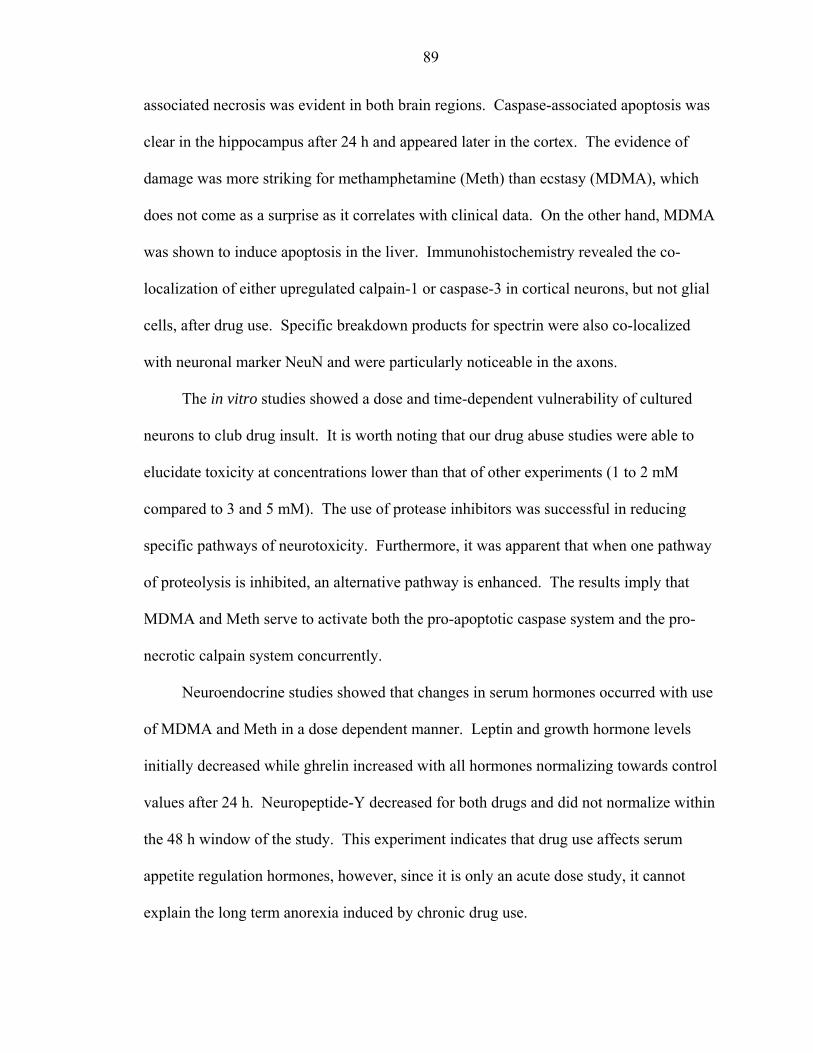
89
associated necrosis was evident in both brain regions. Caspase-associated apoptosis was
clear in the hippocampus after 24 h and appeared later in the cortex. The evidence of
damage was more striking for methamphetamine (Meth) than ecstasy (MDMA), which
does not come as a surprise as it correlates with clinical data. On the other hand, MDMA
was shown to induce apoptosis in the liver. Immunohistochemistry revealed the co-
localization of either upregulated calpain-1 or caspase-3 in cortical neurons, but not glial
cells, after drug use. Specific breakdown products for spectrin were also co-localized
with neuronal marker NeuN and were particularly noticeable in the axons.
The in vitro studies showed a dose and time-dependent vulnerability of cultured
neurons to club drug insult. It is worth noting that our drug abuse studies were able to
elucidate toxicity at concentrations lower than that of other experiments (1 to 2 mM
compared to 3 and 5 mM). The use of protease inhibitors was successful in reducing
specific pathways of neurotoxicity. Furthermore, it was apparent that when one pathway
of proteolysis is inhibited, an alternative pathway is enhanced. The results imply that
MDMA and Meth serve to activate both the pro-apoptotic caspase system and the pro-
necrotic calpain system concurrently.
Neuroendocrine studies showed that changes in serum hormones occurred with use
of MDMA and Meth in a dose dependent manner. Leptin and growth hormone levels
initially decreased while ghrelin increased with all hormones normalizing towards control
values after 24 h. Neuropeptide-Y decreased for both drugs and did not normalize within
the 48 h window of the study. This experiment indicates that drug use affects serum
appetite regulation hormones, however, since it is only an acute dose study, it cannot
explain the long term anorexia induced by chronic drug use.
90
Future Directions
This work serves a dual function. First, it lays the foundation a method of drug
toxicity investigation from the perspective of traumatic brain injury, a technique never
before used. Second, it calls for further studies which need to be conducted to complete
our understanding of the effects that club drugs have physiologically. For example,
other brain regions such as the cerebellum, striatum and thalamus need to be examined.
A low-dose, multiple administration chronic model examination to discover if similar
neurotoxicity is seen when compared to this acute, single-use model needs to be
performed. The combination of club drug usage with TBI, as opposed to in comparison,
would provide a model for the clinical scenario of a motor vehicle accident while under
the influence of drugs. In addition to rat studies, post-mortem studies could be performed
in human brain tissues following deaths involving club drugs after they have been
identified in the blood. Of particular interest would be to study the use of the calpain and
caspase inhibitors in clinical trials to treat drug induced proteolysis. Similar work has
already begun with some success in TBI models (Buki et al. 2003; Knoblach et al. 2004).
Finally, the basic principles applied here could be used to study other drugs of abuse such
as stimulants or hallucinogens.
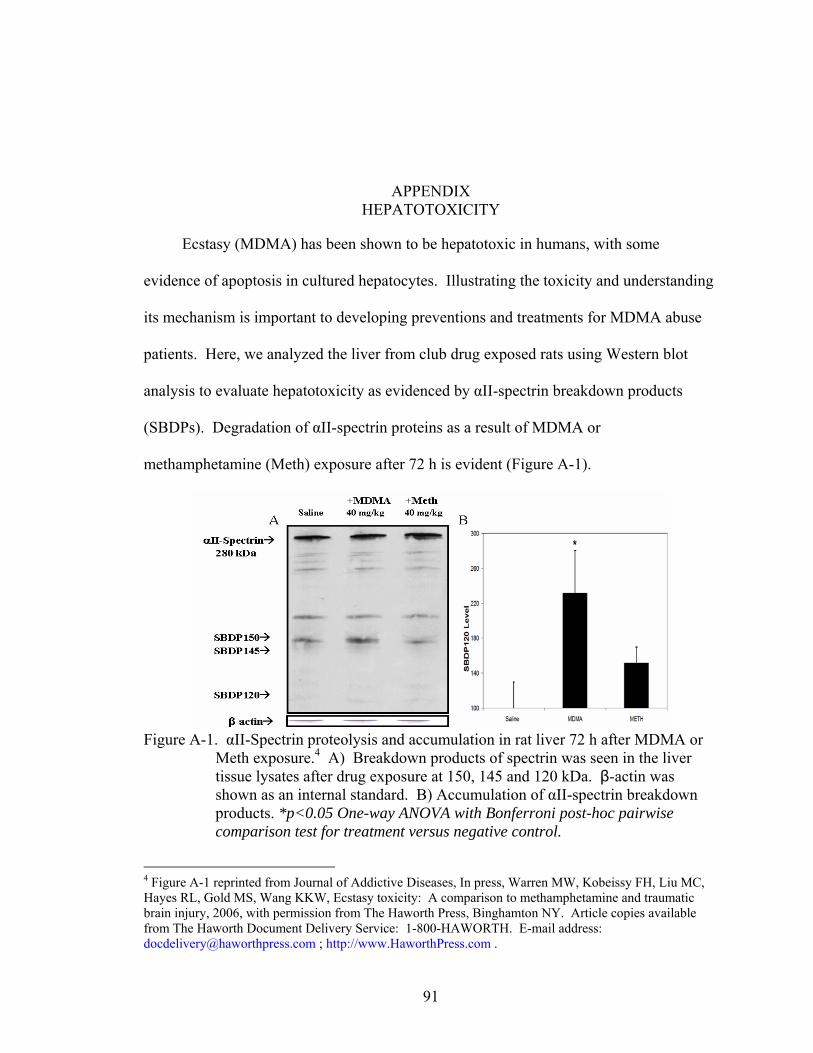
APPENDIX HEPATOTOXICITY
Ecstasy (MDMA) has been shown to be hepatotoxic in humans, with some
evidence of apoptosis in cultured hepatocytes. Illustrating the toxicity and understanding
its mechanism is important to developing preventions and treatments for MDMA abuse
patients. Here, we analyzed the liver from club drug exposed rats using Western blot
analysis to evaluate hepatotoxicity as evidenced by αII-spectrin breakdown products
(SBDPs). Degradation of αII-spectrin proteins as a result of MDMA or
methamphetamine (Meth) exposure after 72 h is evident (Figure A-1).
Figure A-1. αII-Spectrin proteolysis and accumulation in rat liver 72 h after MDMA or
Meth exposure.4 A) Breakdown products of spectrin was seen in the liver tissue lysates after drug exposure at 150, 145 and 120 kDa. β-actin was shown as an internal standard. B) Accumulation of αII-spectrin breakdown products. *p<0.05 One-way ANOVA with Bonferroni post-hoc pairwise comparison test for treatment versus negative control.
4 Figure A-1 reprinted from Journal of Addictive Diseases, In press, Warren MW, Kobeissy FH, Liu MC, Hayes RL, Gold MS, Wang KKW, Ecstasy toxicity: A comparison to methamphetamine and traumatic brain injury, 2006, with permission from The Haworth Press, Binghamton NY. Article copies available from The Haworth Document Delivery Service: 1-800-HAWORTH. E-mail address: [email protected] ; http://www.HaworthPress.com .
91
92
Breakdown product signal is weaker for the liver than for previous cortex studies,
but appear to be increased over saline treated liver controls (Fig. A-1A). Quantitative
analysis of the pro-apoptotic SBPD120 (Fig. A-1B) suggests that the 40 mg/kg dose of
MDMA produces a significant increase over saline controls after 72 h (p=0.05). The
evidence of liver apoptosis after MDMA exposure, which was not seen with Meth
exposure, is concerning. Post-mortem studies should be performed in human liver tissues
following deaths involving MDMA presence to see if the same biomarkers are found.
LIST OF REFERENCES
Ali S, Chang L, Slikker W. (1991) Biogenic amines as biomarkers for neurotoxicity. Biomedical Environmental Science 4(1-2):207–216.
Alonso A, Del C, Zaidi T, Novak M, Grundke-Iqbal I, Iqbal K. (2001) Hyperphosphorylation induces self-assembly of tau into tangles of paired helical filaments/straight filaments. Proceedings of the National Academy of Sciences 98:6923–6928.
Ameisen J. C. (2002) On the origin, evolution and nature of programmed cell death: a timeline of four billion years. Cell Death and Differentiation 9:367–393.
Azam M. (2001) Disruption of the mouse mu-calpain gene reveals an essential role in platelet function. Molecular and Cellular Biology 21:2213–2220.
Baggott M, Heifets B, Jones RT, Mendelson J, Sferios E, Zehnder BS. (2000) Chemical Analysis of Ecstasy Pills. Journal of the American Medical Association. 284:2190.
Bahr B A, Tiriveedhi S, Park GY, Lynch G. (1995) Induction of calpain-mediated spectrin fragments by pathogenic treatments in long-term hippocampal slices. Journal of Pharmacology and Experimental Therapeutics 273:902–908.
Bakhit C, Morgan MA, Peat MA, Gibb JW. (1981) Long-term effects of methamphetamine on the synthesis and metabolism of 5-hydroxytryptamine in various regions of the rat brain. Neuropharmacology 20:1135–1140.
Banik NL, Matzelle DC, Gantt-Wilford G, Osborne, Hogan EL. (1997) Increased calpain content and progressive degradation of neurofilament protein in spinal cord injury. Brain Research 752:301–306.
Battaglia G, Yeh S, O’Hearn E, Molliver M, Kuhar M, De Souza E. (1987) 3,4 Methylenedioxymethamphetamine and 3,4 methylenedioxyamphetamine destroy serotonin terminals in rat brain: Quantification of neurodegeneration by measurement of [3H] paroxetine-labeled serotonin uptake sites. Journal of Pharmacology and Experimental Therapeutics 242(3):911–91.
Baucum AJ, Rau KS, Riddle EL, Hanson GR, Fleckenstein AE. (2004) Methamphetamine increases dopamine transporter higher molecular weight complex formation via a dopamine- and hyperthermia-associated mechanism. Journal of Neuroscience 24:3436–3443.
93
94
Bernath E, Kupina N, Liu MC, Hayes RL, Meegan C, Wang KKW. (2006) Elevation of cytoskeletal protein breakdown in aged Wistar rat brain. Neurobiology of Aging 27(4):624–632.
Buki A, Farkas O, Doczi T, Povlishock J. (2003) Preinjury administration of calpain inhibitor MDL-28170 attenuates traumatically induced axonal injury. Journal of Neurotrauma 20(3):261–268.
Bullock R, Chestnut R, Clifton G. (1995) Guidelines for the management of severe brain injury. New York: Brain Trauma Foundation/American Association of Neurological Surgeons.
Cadet JL, Ordonez SV, Ordonez JV. (1997) Methamphetamine induces apoptosis in immortalized neural cells: Protection by the proto-oncogene, bcl-2. Synapse 25:176–184.
Cadet JL, Thiriet N. (2001) Acute transcriptional effects of MDMA on the rat cortex: Evidence from cDNA analysis. Poster presented at MDMA/Ecstasy Research: Advances, Challenges and Future Directions, Bethesda, MD.
Cadet JL, Javanthi S, Deng X. (2003) Speed kills: Cellular and molecular basis of methamphetamine-induced nerve terminal degeneration and neuronal apoptosis. Federation of American Societies for Experimental Biology Journal 13:1775–1788.
Canu N, Dus L, Barbato C, Ciotti M, Brancolini C, Rinaldi A, Novak M, Cattaneo A, Bradbury A, Calissano P. (1998) Tau cleavage and dephosphorylation in cerebellar granule neurons undergoing apoptosis. Journal of Neuroscience 18(18):7061–7074.
Carafoli E, Molinari M. (1998) Calpain: a protease in search of a function? Biochemistry and Biophysics Research Communications 247:193–203.
Centers for Disease Control. (1997) Sports-related recurrent brain injuries – United States. MMWR 46(10):224–227.
Centers for Disease Control. (2001) Annual data submission standards: Guidelines for surveillance of central nervous system injury. Atlanta, GA.
Centers for Disease Control. (2006) Methamphetamine use and HIV risk behaviors among heterosexual men—preliminary results from five northern California counties, December 2001-November 2004. Morbidity and Mortality Weekly Report 55(10):273–277.
Chan Y, Steiner R, Clifton D. (1996) Regulation of hypothalamic neuropeptide-Y neurons by growth hormone in the rat. Endocrinology 137(4):1319–1325.
Chan SL, Mattson MP. (1999) Caspase and calpain substrates: roles in synaptic plasticity and cell death. Journal of Neuroscience Research 58:167–190.
95
Chen J, Li Y, Wang L, Lu M, Chopp M. (2002) Caspase inhibition by z-VAD increases the survival of grafted bone marrow cells and improves functional outcome after MCAo in rats. Journal of the Neurological Sciences 199:17–24.
Cho A, Melega W, Kuczenski R, Segal D. (2001) Relevance of pharmacokinetic parameters in animal models of methamphetamine abuse. Synapse 39:161–166.
Choi DW, Rothman SM. (1990) The role of glutamate neurotoxicity in hypoxic-ischemic neuronal death. Annual Review of Neuroscience 13:171–182.
Choi H, Yoo T, Chung S, Yang J, Kim J, Ha E, Hwang O. (2002) Methamphetamine-induced apoptosis in a CNS-derived catecholaminergic cell line. Molecules and Cells 13(2):221–227.
Chua BT. (2000) Direct cleavage by the calcium-activated protease calpain can lead to inactivation of caspases. Journal of Biological Chemistry 275:5131–5135.
Chung CW, Song YH, Kim IK, Yoon WJ, Ryu BR, Jo DG, Woo HN, Kwon YK, Kim HH, Gwag BJ, Jung IHM, Jung YK. (2001) Proapoptotic effects of tau cleavage product generate by caspase-3. Neurobiology of Disease 8:162–172.
Clark RS, Kochanek PM, Watkins SC, Chen M, Dixon CE, Seidberg NA, Melick J, Loeffert JE, Nathaniel PD, Jin KL, Graham SH. (2000) Caspase-3 mediated neuronal death after traumatic brain injury in rats. Journal of Neurochemistry 74:740–753.
Commins DL, Axt KJ, Vosmer G, Seiden LS. (1987) 5,6-Dihydroxytryptamine, a serotonerglc neurotoxln is formed endogenously in the rat brain. Brain Research 403:7–14.
Cohen GM. (1997) Caspases: the executioners of apoptosis. Biochemical Journal 326:1–16.
Conti AC, Raghupathi R, Trojanowski JQ, McIntosh TK. (1998) Experimental brain injury induces regionally distinct apoptosis during the acute and delayed posttraumatic period. Journal of Neuroscience 18:5663–5672.
Croall DE, DeMartino GN. (1991) Calcium-activated neutral protease (calpain) system: structure, function, and regulation. Physiological Reviews 81:813–847.
Crowley W, Ramoz G, Keefe K, Torto R, Kalra S, Hanson G. (2005) Differential effects of methamphetamine on expression of neuropeptide Y mRNA in hypothalamus and on serum leptin and ghrelin concentrations in ad libitum-fed and schedule-fed rats. Neuroscience 132:167–173.
Curzon G, Gibson E, Oluyomi A. (1997) Appetite suppression by commonly used drugs depends on 5-HT receptors but not on 5-HT availability. Trends in Pharmacological Sciences 18(1):21–25.
96
Dafters RI, Lynch E. (1998) Persistent lost of thermoregulation in the rate induced by 3,4-methylenedioxymethamphetamine (MDMA or “Ecstasy”) but not by fenfluramine. Psychopharmacology 138:207–212.
Darvesh AS, Shankaran M, Gudelsky GA. (2001) MDMA produces glycogenolysis and increases the extracellular concentration of glucose in the rat brain. Poster presented at MDMA/Ecstasy Research: Advances, Challenges and Future Directions, Bethesda, MD.
Davidson C, Lee T, Ellinwood E. (2005) Acute and chronic continuous methamphetamine have different long-term behavioral and neurochemical consequences. Neurochemistry International 46:189–203.
Drug Abuse Warning Network. (2003) Series D-24, DHHS Publication No. (SMA) 03-3780, Rockville, MD. Published August, 2003.
Denecker G, Vercammen D, Steemans M, Vanden Berghe T, Brouckaert G, Van Loo G, Zhivotovsky B, Fiers W, Grooten J, Declercq W, Vandenabeele P. (2001) Death receptor-induced apoptotic and necrotic cell death: differential role of caspases and mitochondria. Cell Death and Differemtiation 8:829–840.
Deng X, Jayanthi S, Ladenheim B, Krasnova I, Cadet JL. (2002a) Mice with partial deficiency of c-Jun show attenuation of methamphetamine-induced neuronal apoptosis. Molecular Pharmacology 62(5):993–1000.
Deng X, Cai N, McCoy M, Chen W, Trush M, Cadet JL. (2002b) Methamphetamine induces apoptosis in an immortalized rat striatal cell line by activating the mitochondrial cell death pathway. Neuropharmacology 42(6):837–845.
De Souza I, Kelly J, Harkin A, Leonard B. (1996) An appraisal of the pharmacological and toxicological effects of a single oral administration of 3,4-methylenedioxymethamphetamine (MDMA) in the rat. Pharmacological and Toxicology 80:207–210.
De Vito M, Wagner G. (1989) Methamphetamine-induced neuronal damage: a possible role for free radicals. Neuropharmacology 28(10):1145–1150.
Dietrich WD. (1994) Morphological manifestations of reperfusion injury in brain. Annals of the New York Academy of Sciemces 723:15–24.
Dixon CE, Clifton GL, Lighthall JW, Yahhmai AA, Hayes RL. (1991) A controlled cortical impact model of traumatic brain injury in the rat. Journal of Neuroscience Methods 39:253–262.
Dutta S, Chiu Y, Probert A, Wang, KKW. (2002) Selective release of calpain produced alphaII-spectrin (alpha-fodrin) breakdown products from acute neuronal cell death. Biological Chemistry 383(5):785–791.
97
Earnshaw WC, Martins LM, Kaufmann SH. (1999) Mammalian caspases: structure, activation, substrates, and functions during apoptosis. Annual Review of Biochemistry 68:383–424.
Egecioglu E, Bjursell M, Ljungberg A, Dickson S, Kopchick J, Bergstrom G, Svensson L, Oscarsson J, Tornell J, Bohlooly M. (2005) Growth hormone receptor deficiency results in blunted ghrelin feeding response, obesity, and hypolipidemia in mice. American Journal of Physiology – Endocrinology and Metabolism. 290(2):317–325.
Ellis RC, O’Steen WA, Hayes RL, Nick HS, Wang KKW, Anderson DK. (2005) Cellular localization and enzymatic activity of cathepsin B after spinal cord injury in the rat. Expreimental Neurology 193(1):19–28.
Fischer U, Janicke RU, Schulze-Osthoff K. (2003) Many cuts to ruin: a comprehensive update of caspase substrates. Cell Death and Differentiation 10:76–100.
Fukiage C, Azuma M, Nakamura Y, Tamada Y, Makamura M, Shearer TR. (1997) SJA6017, a newly synthesized peptide aldehyde inhibitor of calpain: Amelioration of cataract in cultured rat lenses. Biochimica et Biophsica Acta 1361:304–312.
Genc K, Genc S, Kizildag S, Sonmez U, Yilmaz O, Tugyan K, Ergur B, Sonmez A, Buldan Z. (2003) Methamphetamine induces oligodendroglial cell death in vitro. Brain Research 982(1):125–130.
Gennarelli TA. (1993) Mechanisms of brain injury. Journal of Emergency Medicine 11 Suppl 1:5–11.
Ginawi O, Al-Majed A, Al-Suwilem A. (2005) Ondansetron, a selective 5-HT3 antogonist, antagonizes methamphetamine-induced anorexia in mice. Pharmacological Research 51:255–259.
Gluck M, Moy L, Jayatilleke E, Hogan K, Manzino L, Sonsalla P. (2001) Parallel increases in lipid and protein oxidative markers in several mouse brain regions after methamphetamine treatment. Journal of Neurochemistry 79(1):152–160.
Gonzalez R, Rippeth JD, Carey CL, Heaton RK, Moore DJ, Schweinsburg B. (2004) Neurocognitive performance of methamphetamine users discordant for history of marijuana exposure. Drug and Alcohol Dependence 72(2):181–190.
Goodman JC, Simpson RK. (1996) Biochemical monitoring in head injury. In: R. K. Narayan, J. E. Wilberger and J. T. Povlishock, eds. Neurotrauma, pp. 577–591. McGraw-Hill, New York.
Goodman SR, Zagon IS, Kulikowski RR. (1981) Identification of a spectrin-like protein in nonerythroid cells. Proceedings of the National Academy of Science 78:7570–7574.
98
Graham DI, Adams JH, Nicoll JA, Maxwell WL, Gennarelli TA. (1995) The nature, distribution and causes of traumatic brain injury. Brain Pathology 5:397–406.
Graham DI, McIntosh TK, Maxwell WL, Nicoll JA. (2000) Recent advances in neurotrauma. Journal of Neuropathology and Experimental Neurology 59:641–651.
Guroff G. (1964) A neutral calcium-activated proteinase from the soluble fraction of rat brain. Journal of Biological Chemistry 239:149–155.
Halford J, Blundell J. (2000) Pharmacology of appetite suppression. Progress in Drug Research 54:25–58.
Harris AS, Croall DE, Morrow JS. (1989) The calmodulin-binding site in a-fodrin is near the calcium dependant protease-I cleavage site. Journal of Biological Chemistry 263:15754–15761.
Hatzidimitriou G, McCann UD, Ricaurte GA. (1999) Altered serotonin innervation patterns in the forebrain of monkeys treated with (+/-) 3,4 methylenedioxymethamphetamine seven years previously: factors influencing abnormal recovery. Journal of Neuroscience 19:5096–5107.
Hengartner MO. (2000) The biochemistry of apoptosis. Nature 407:770–776.
Herndon DN, Hart DW, Wolf SE, Chinkes DL, Wolfe RR. (2001) Reversal of catabolism by beta-blockade after severe burns. New England Journal of Medicine 345:1223–1229.
Hosoda H, Kojima M, Kangawa K. (2002) Ghrelin and the regulation of food intake and energy balance. Molecular Interventions 2:494–503.
Hsieh Y, Yang S, Chiou H, Kuo D. (2005) Activations of c-fos/c-jun signaling are involved in the modulation of hypothalamic superoxide dismutase (SOD) and neuropeptide-Y (NPY) gene expression in amphetamine-mediated appetite suppression. Toxicology and Applied Pharmacology. August 3 [Epub ahead of print].
Huber A, Ling W, Shoptaw W, Gulati V, Brethen P. (1997) Integrating treatments for methamphetamine abuse: A psychosocial perspective. Journal of Addictive Disease 16(4):41–50.
Ishigami A, Tokunaga I, Gotohda T, Kubo S. (2003) Immunohistochemical study of myoglobin and oxidative injury-related markers in the kidney of methamphetamine abusers. Legal Medicine (Tokyo) 5(1):42–48.
Islam S, Hossain K, Ahmed A, Ahsan M. (2002) Nutritional status of drug addicts undergoing detoxification: prevalence of malnutrition and influence of illicit drugs and lifestyle. British Journal of Nutrition 88(5):507–513.
99
Jaehne E, Salem A, Irvine R. (2005) Effects of 3,4-methylenedioxymethamphetamine and related amphetamines on autonomic and behavioral thermoregulation. Pharmacology Biochemistry and Behavior 81:485–496.
Jiminez A, Jorda EG, Verdaguer E, Pubill D, Sureda FX, Canudas AM, Escubedo E, Camarasa J, Camins A, Pallas M. (2004) Neurotoxicity of amphetamine derivatives is mediated by caspase pathway activation in rat cerebellar granule cells. Toxicology and Applied Pharmacology 196(2):223–234.
Lockshin RA, Zakeri, Z. (2001) Programmed cell death and apoptosis: origins of the theory. Nature Reviews - Molecular Cell Biology 2:545–550.
Jacobson MD, Weil M, Raff MC. (1997) Programmed cell death in animal development. Cell 88: 347–354.
Jonas J, Gold MS. (1986) Cocaine abuse and eating disorders. Lancet 1:390–391.
Kalra S, Kalra P. (2004) Overlapping and interactive pathways regulation appetite and craving. Journal of Addictive Diseases 23(3):5–21.
Kaufmann SH, Hengartner MO. (2001) Programmed cell death: alive and well in the new millennium. Trends in Cell Biology 11:526–534.
Kerr JF, Wyllie AH, Currie AR. (1972) Apoptosis: a basic biological phenomenon with wide-ranging implications in tissue kinetics. British Journal of Cancer 26:239–257.
Kesler SR, Adams HF, Bigler ED. (2000) SPECT, MR and quantitative MR imaging: correlates with neuropsychological and psychological outcome in traumatic brain injury. Brain Injury 14:851–857.
Kish SJ, Furukawa Y, Ang L, Vorce SP, Kalasinsky KS. (2000) Striatal serotonin is depleted in brain of a human MDMA (Ecstasy) user. Neurology 55: 294–296.
Kleiner K, Gold MS, Frost-Pineda K, Lenz-Brunsman B, Perri. (2004) Body Mass Index and Alcohol Use. Journal of Addictive Disease 23(3):105–118.
Komoriya A, Packard BZ, Brown MJ, Wu ML, Henkart PA. (2000) Assessment of caspase activities in intact apoptotic thymocytes using cell-permeated fluorogenic caspase substrates. The Journal of Experimental Medicine 191(11):1819–1828.
Kontos HA. (1989) Oxygen radicals in CNS damage. Chemico-Biological Interactions 72:229–255.
Knoblach S, Alroy D, Nikolaeva M, Cernak I, Stoica B, Faden A. (2004) Caspase inhibitor z-DEVD-fmk attenuates calpain and necrotic cell death in vitro and after traumatic brain injury. Journal of Cerebral Blood Flow and Metabolism 24(10):1119–1132.
100
Koda LY, Gibb JW. (1973) Adrenal and striatal tyroslne hydroxylase activity after methamphetamine. Journal of Pharmacology and Experimental Therapeutics 185:42-48.
Koh JY, Choi DW. (1987) Quantitative determination of glutamate mediated cortical neuronal injury in cell culture by lactate dehydrogenase efflux essay. Journal of Neuroscience Methods 20(1):83–90.
Kupina NC, Nath R, Bernath EE, Inoue J, Misuyoshi A, Yuen PW, Wang KKW, Hall ED. (2001) The novel calpain inhibitor SJA6017 improves functional outcome after delayed administration in a mouse model of diffuse brain injury. Journal of Neurotrauma 18(11):1229–1240.
Larner SF, Hayes RL, McKinsey DM, Pike BR, Wang KKW. (2004) Increased expression and processing of caspase-12 after traumatic brain injury in rats. Journal of Neurochemistry 88(1):78–90.
Larner SF, McKinsey DM, Hayes RL, Wang KKW. (2005) Caspase 7: Increased expression and activation after traumatic brain injury in rats. Journal of Neurochemistry 94(1):97–108.
Larsen K, Fon E, Hastings T, Edwards R, Sulzer D. (2002) Methamphetamine-induced degeneration of dopaminergic neurons involves autophagy and upregulation of dopamine synthesis. Journal of Neuroscience 22(20):8951–8960.
Launay S, Hermine O, Fontenay M, Kroemer G, Solary E, Garrido C. (2005) Vital functions for lethal caspases. Oncogene 24:5137–5148.
Levi L, Guilburd JN, Lemberger A, Soustiel JF, Feinsod M. (1990) Diffuse axonal injury: analysis of 100 patients with radiological signs. Neurosurgery 27:429–432.
Makino Y, Tanaka S, Kurobane S, Nakauchi M, Terasaki T, Ohta S. (2003) Profiling of illegal amphetamine type stimulant tablets in Japan. Journal of Health Science 49:129–137.
Malpass A, White J, Irvine R, Somogyi A, Bochner F. (1999) Acute toxicity of 3,4-methylenedioxymethamphetamine (MDMA) in Sprague-dawley and Dark Agouti rats. Pharmacology, Biochemistry and Behavior 64(1):29–34.
Mansoor O, Beaufrere B, Boirie Y, Ralliere C, Taillandier D, Aurousseau E, Schoeffler P, Arnal M, Attaix D. (1996) Increased mRNA levels for components of the lysosomal, Ca2+-activated, and ATP-ubiquitin-dependent proteolytic pathways in skeletal muscle from head trauma patients. Proceedings of the National Academy of Sciences 93:2714–2718.
Marchesi VT. Steers E. (1968) Selective solubilization of a protein component of the red cell membrane. Science 159:203–204.
101
Marion DW. (1996) Outcome from severe head injury. In: R. K. Narayan, J. E. Wilberger and J. T. Povlishock, eds. Neurotrauma, pp. 767–777. McGraw-Hill, New York.
Martin C, Warren MW, Gold MS. (2003) Methamphetamine. Law Enforcement Executive Forum 3(5):159–170.
Mashima T, Naito M, Kataoka S, Kawai H, Tsuruo T. (1995) Aspartate-based inhibitor of interleukin-1 beta-converting enzyme prevents antitumor agent-induced apoptosis in human myeloid leukemia U937 cells. Biochemical and Biophysical Research Communications 209:907–915.
McCann UD, Szabo Z, Scheffel U, Dannals RF, Ricaurte GA. (1998) Positron emission tomographic evidence of toxic effect of MDMA (‘Ecstasy’) on brain serotonin neurons in human beings. Lancet 352:1433–1437.
Metzstein MM, Stanfield GM, Horvitz HR. (1998) Genetics of programmed cell death in C. elegans: past, present and future. Trends in Genetics 14:410–416.
Meyer JS, Grande M, Johnson K, Ali SF. (2004) Neurotoxic effects of MDMA (“ecstasy”) administration to neonatal rats. International Journal of Developmental Neuroscience 22(5-6):261–271.
Montiel-Duarte C, Varela-Rey M, Oses-Prieto JA, Lopez-Zabalza MJ, Beitia G, Cenarruzabeitia E, Iraburu MJ. (2002) 3,4-Methylenedioxymethamphetamine (“Ecstasy”) induces apoptosis of cultured rat liver cells. Biochimica et Biophysica Acta 1588(1):26–32.
Morgan MJ. (1999) Memory deficits associated with recreational use of “ecstasy” (MDMA). Psychopharmacology 141: 30–36.
Morley K, Gallate J, Hunt G, Mallet R, McGregor I. (2001) Increased anxiety and impaired memory in rats 3 months after administration of 3,4-Methylenedioxymethamphetamine (“Ecstasy”). European Journal of Pharmacology 433:91–99.
Nakagawa T, Yuan J. (2000) Cross-talk between two cysteine protease families. Activation of caspase-12 by calpain in apoptosis. Journal of Cellular Biology 150:887–894.
Nash JF, Nichols DE. (1991) Microdialysis studies of 3,4-methylenedioxymethamphetamine and structurally related analogues. European Journal of Pharmacology 200:53–58.
Nath R, Raser K, McGinnis K, Madimpalli R, Stafford D, Wang KKW. (1996) Effects of calpain and ICE-like protease inhibitors on neuronal apoptosis. Neuroreport 8:249–256.
102
Nath R, Probert A, McGinnis KM, Wang KKW. (1998) Evidence for activation of caspase-3-like protease in excitotoxin- and hypoxia/hypoglycemia-injured neurons. Journal of Neurochemistry 71(1):186–195.
Nath R, Huggins M, McGinnis K, Nadimpalli D, Wang KKW. (2000) Development and characterization of antibodies specific to caspase-3-produced alpha II-spectrin 120 kDa breakDaown product: Marker for neuronal apoptosis. Neurochemistry International 36:351–361.
National Association of Counties. (2005) The meth epidemic in America. National Association of Counties, July 5, 2005.
National Institute on Drug Abuse. (1997) Methamphetamine Abuse (NIDA Capsules).
National Institute on Drug Abuse. (2002) NIDA research report – Methamphetamine abuse and addiction. NIH Publication No. 02-4210.
National Institute on Drug Abuse. (2005a) National Survey Results on Drug Use from Monitoring the Future Study, 1975–2004.
National Institute on Drug Abuse. (2005b) NIDA research report – MDMA abuse (Ecstasy). NIH Publication No. 05-4728.
Nicholson W, Thornberry N. (1997) Caspases, killer proteases. Trends in Biochemical Sciences 22:299–306.
National Institute on Drug Abuse. (2006) Community epidemiology work group: A retrospective analysis of drug abuse data/information reported by the CEWG.
Newcomb JK, Zhao X, Pike BR, Hayes RL. (1999) Temporal profile of apoptotic-like changes in neurons and astrocytes following controlled cortical impact injury in the rat. Experimental Neurology 158:76–88.
Nogueiras R, Tovar S, Mitchell S, Rayner D, Archer Z, Dieguez C, Williams L. (2004) Regulation of growth hormone secretagogue receptor gene expression in the arcuate nuclei of the rat by leptin and ghrelin. Diabetes 53:2552–2558.
Nordahl TE, Salo R, Leamon M. (2003) Neuropsychological effects of chronic methamphetamine use on neurotransmitters and cognition: A review. Journal of Neuropsychiatry and Clinical Neuroscience 15(3):317–325.
Park SY, Ferreira A. (2005) The generation of a 17 kDa neurotoxic fragment: An alternative mechanism by which tau mediates β-amyloid-induced neurodegeneration. The Journal of Neuroscience 25(22):5365–5375.
Parrott AC. (2001) Neuropsychopathology associated with recreational Ecstasy/MDMA. Presented at MDMA/Ecstasy Research: Advances, Challenges and Future Directions, Bethesda, MD.
103
Paul S, Hulihan-Giblin B, Skolnick P. (1982) (+/-)Amphetamine binding to rat hypothalamus: Relation to anorexic potency for phenylethylamines. Science 218(4571):487–490.
Pettigrew L, Holtz M, Craddock S, Minger S, Hall N, Geddes J. (1996) Microtubular proteolysis in focal cerebral ischemia. Journal of Cerebral Blood Flow and Metabolism 16(6):1189–1202.
Pike BR, Zhao X, Newcomb JK, Posmantur RM, Wang KKW, Hayes RL. (1998) Regional calpain and caspase-3 proteolysis of alpha-spectrin after traumatic brain injury. Neuroreport 9:2437–2442.
Pike B, Flint J, Dutta S, Johnson E, Wang KKW, Hayes RL. (2001) Accumulation of non-erythroid αII-spectrin and calpain-cleaved αII-spectrin breakdown products in cerebrospinal fluid after traumatic brain injury in rats. Journal of Neurobiochemistry 78:1297–1306.
Pike B, Flint J, Jitendra D, Lu X, Wang KKW, Tortella F, Hayes RL. (2003) Accumulation of calpain and caspase-3 proteolytic fragments of brain-derived αII-spectrin in cerebral spinal fluid after middle cerebral artery occlusion in rats, Journal of Cerebral Blood Flow and Metabolism 24:98–106.
Pineda J, Wang KKW, Hayes RL. (2004) Biomarkers of proteolytic damage following traumatic brain injury. Brain Pathology 14(2):202–209.
Postmantur R, Wang KKW, Gilbersten RB. (1998) Caspase-3-like activity is necessary for IL-2 release in activated Jurkat T-cells. Experimental Cell Research 244(1):302–309.
Raghupathi R, Graham D, McIntosh T. (2000) Apoptosis after traumatic brain injury. Journal of Neurotrauma 17(10):927–938.
Rao RV, Hermel E, Castro-Obregon S, del Rio G, Ellerby LM, Ellerby HM, Bredesen DE. (2001) Coupling endoplasmic reticulum stress to the cell death program. Mechanism of caspase activation. Journal of Biological Chemistry 276:33869–33874.
Reneman L, Booij J, Schmand B, Vandenbrink W, Gunning B. (2000) Memory disturbances in "Ecstasy" users are correlated with an altered brain serotonin neurotransmission. Psychopharmacology 148:322–324.
Ricaurte GA, Guillery RW, Seiden LS, Schuster CR. (1980) Selective neurodegenerative changes in the somatosensory cortex following treatment with methylamphetamine, p-chloroamphetamine but not 6-HDA. Society of Neuroscience 6(259.7):764.
104
Ricaurte GA, Bryan G, Strauss L, Seiden L, and Schuster C. (1985) Hallucinogenic amphetamine selectively destroys brain serotonin nerve terminals. Science 229:986–988.
Ricaurte, GA. (1989) Studies of MDMA-induced neurotoxicity in nonhuman primates: a basis for evalutating long-term effects in humans. NIDA Research Monogram 94:306–322.
Ricaurte GA, Yuan J, Hatzidimitriou G, Cord BJ, McCann UD. (2003) Retraction of “Severe dopaminergic neurotoxicity in primates after a common recreational dose regimen of MDMA (“ecstasy”)“. Science 301(5639):1479.
Robbins TW, Everitt BJ. (1999) Drug addiction: Bad habits add up. Nature 398(6728):567–570.
Roberts-Lewis JM, Savage MJ, Marcy VR, Pinsker LR, Siman R. (1994) Immunolocalization of calpain I-mediated spectrin degradation to vulnerable neurons in the ischemic gerbil brain. Journal of Neuroscience 14:3934–3944.
Rohn T, Rissman R, Davis M, Kim Y, Cotman C, Head E. (2002) Caspase-9 activation and caspase cleavage of tau in the Alzheimer's disease brain. Neurobiology of Disease 11(2):341–354.
Sakas DE, Bullock R, Teasdale G. (1995) One-year outcome following craniotomy for traumatic brain hematoma in patients with fixed dilated pupils. Journal of Neurosurgery 82:961–965.
Sanchez J, Oliver P, Pico C, Palou A. (2004) Diurnal rhythms of leptina nd ghrelin in the systemic circulation and in the gastric mucosa are related to food intake in rats. European Journal of Physiology 448:500–506.
Santolaria F, Perez-Cejas A, Aleman M, Gonzalez-Reimers E, Milena A, Jose De la Vega M, Gomez-Rodriguez M. (2003) Low Serum leptin levels and malnutrition in chronic alcohol misusers hospitalized by somatic complications. Alcohol and Alcoholism 38(1):60–66.
Schifano F, Corkery J, Deluca P, Oyefeso A, Ghodse AH. (2006) Ecstasy (MDMA, MDA, MDEA, MBDB) consumption, seizures, related offences, prices, dosage levels and deaths in the UK (1994-2003). Journal of Psychopharmacology 20(3):456–463.
Schmidt CJ, Taylor VL. (1987) Depression of rat brain tryptophan hydroxylase activity following the acute administration of methylenedioxymethamphetamine. Biochemical Pharmacology 36:4095–4102.
Schroder N, O’Dell SJ, Marhsall JF. (2003) Neurotoxic methamphetamine regimen severely impairs recognition memory in rats. Synapse 49(2):89–96.
105
Seiden LS, Fischman MW, Schuster CR. (1976) Long-term methamphetamine-induced changes in brain catecholamines in tolerant rhesus monkeys. Drug and Alcohol Dependence 3:215–219.
Seiden LS, Ricaurte GA. (1987) Neurotoxicity of methamphetamine and related drugs. In: Meltzer, H., ed. Psychopharmacology: The Third Generation of Progress. New York: Raven Press. pp. 359–366.
Shankaran M, Yamamoto BK, Gudelsky, GA. (1999) Involvement of the serotonin transporter in the formation of hydroxyl radicals induced by 3,4- methylenedioxymethamphetamine. European Journal of Pharmacology 385:103– 110.
Shiraha H, Glading A, Chou J, Jia Z, Wells A. (2002) Activation of m-calpain (calpain II) by epidermal growth factor is limited by protein kinase A phosphorylation of m-calpain. Molecular and Cell Biology 22:2716–2727.
Shotton D, Burke BE, Branton D. (1979) The molecular structure of human erythrocyte spectrin. Biophysical and electron microscopic studies. Journal of Molecular Biology 131:303–329.
Sikorski AF, Terlecki G, Zagon IS, Goodman SR. (1991) Synapsin I-mediated interaction of brain spectrin with synaptic vesicles. Journal of Cell Biology 114:313–318.
Siman R, Baudry M, Lynch G. (1984) Brain fodrin: Substrate for calpain I, an endogenous calcium-activated protease. Proceedings of the National Academy of Science 81:3572–3576.
Simantov R, Tauber M. (1997) The abused drug MDMA (Ecstasy) induces programmed death of human serotonergic cells. Federation of American Societies for Experimental Biology Journal 11:141–146.
Slee EA, Adrain C, Martin SJ. (2001) Executioner caspase-3, -6, and -7 perform distinct, non-redundant roles during the demolition phase of apoptosis. Journal of Biological Chemistry 276:7320–7326.
Sonsalla PK, Nicklas WJ, Heikkila RA. (1989) Role for excitatory amino acids in methamphetamine-induced nigrostiagal dopaminergic toxicity. Science 243:398–400.
Springer JE, Azbill RD, Knapp PE. (1999) Activation of the caspase-3 apoptotic cascade in traumatic spinal cord injury. Nature Medicine 5:943–946.
Stumm G, Schlegel J, Schafer T, Wurz C, Mennel H, Krieg J, Vedder H. (1999) Amphetamines induce apoptosis and regulation of bcl-x splice variants in neocortical neurons. Federation of American Societies for Experimental Biology Journal 13(9):1065–1072.
106
Substance Abuse and Mental Health Services Administration. (2004) Overview of Findings from the 2003 National Survery on Drug Use and Health (Office of Applied Students, NSDUH Series H-24, DHHS: Publication No. SMA 04-3963.
Sutton RL, Lescaudron L, Stein DG. (1993) Unilateral cortical contusion injury in the rat: vascular disruption and temporal development of cortical necrosis. Journal of Neurotrauma 10:135–149.
Suzuki K, Hata S, Kawabata Y, Sorimachi H. (2004) Structure, activation, and biology of calpain. Diabetes 53:12–18.
Taffe MA, Davis S, Yuan J, Schroeder R, Hatzidimitriou G, Parsons LH, Ricaurte GA, Gold LH. (2001) Behavioral Sensitivity to Serotonergic Challenge in MDMATreated Rhesus Monkeys. Poster presented at MDMA/Ecstasy Research: Advances, Challenges and Future Directions, Bethesda, MD.
Taniguchi T, Kawamata T, Mukai H, Hasegawa H, Isagawa T, Yasuda M, Hashimoto T, Terashima A, Nakai M, Mori H, Ono Y, Tanaka C. (2001) Phosphorylation of tau is regulated by PKN. Journal of Biological Chemistry 276:10025–10031.
Teasdale G, Jennett B. (1974) Assessment of coma and impaired consciousness, a practical scale. Lancet 2:81–84.
Thiriet N, Jayanthi S, McCoy M, Ladenheim B, Cadet JL. (2001). Methamphetamine increases expression of the apoptotic c-myc and L-myc genes in the mouse brain. Brain Research 90(2):202–204.
Thomas DM, Dowgiert J, Geddes TJ, Francescutti-Berbeem D, Liu X, Kuhn DM. (2004) Microglial activation is a pharmacologically specific marker for the neurotoxic amphetamines. Neuroscience Letters 367:349–354.
Thornberry NA, Lazebnik Y. (1998) Caspases: enemies within. Science 281:1312–1316.
Thurman D, Alverson C, Dunn K, Guerrero J, Sniezek J. (1999) Traumatic brain injury in the United States: A public health perspective. Journal of Head Trauma and Rehabilitation 14(6):602–615.
Thurman D. (2001) The epidemiology and economics of head trauma. In: Miller L, Hayes R, editors. Head Trauma: Basic, Preclinical, and Clinical Directions. New York (NY): Wiley and Sons.
Uemura K, Aki T, Yamaguchi K, Yoshida K. (2003) Protein kinase C-epsilon protects PC12 cells against methamphetamine-induced death: possible involvement of suppression of glutamate receptor. Life Sciences 72(14):1595–1607.
Verkes RJ, Gijsman HJ, Pieters MSM. (2001) Cognitive performance and serotonergic function in users of ecstasy. Psychopharmacology 153:196–202.
107
Wagner GC, Lucot JB, Schuster CR, Seiden LS. (1983) Alphamethyltyrosine attenuates and reserpine increases methamphetamineinduced neuronal changes. Brain Research 270:285–288.
Wallace T, Vorhees C, Zemlan F, Gudelsky G. (2003) Methamphetamine enhances the cleavage of the cytoskeletal protein tau in the rat brain. Neuroscience 116:1063–1068.
Wang GJ, Volkow ND, Logan J. (2001) Brain dopamine and obesity. Lancet 357:354–357.
Wang KKW, Nath R, Raser K, Hajimohammadreza I. (1996) Maitotoxin induces calpain activation in SH-SY5Y neuroblastoma cells and cerebrocortical cultures. Archives of Biochemistry and Biophysics 331(2):208–214.
Wang KKW. (1998) Simultaneous degradation of alpha-II and beta-II sprectin by caspase 3 (CPP32) in apoptotic cells. Journal of Biological Chemistry 273:22490–22497.
Wang KKW. (2000) Calpain and caspase: Can you tell the difference? Trends in Neuroscience 23(1):20–26.
Warren MW, Kobeissy FH, Liu MC, Hayes RL, Gold MS, Wang KKW. (2005a) Concurrent calpain and caspase-3 mediated proteolysis of αII-spectrin and tau in the rat brain after methamphetamine exposure: A similar profile to traumatic brain injury. Life Sciences 78:301–309.
Warren MW, Frost-Pineda K, Gold MS. (2005b) Body mass index and marijuana use. Journal of Addictive Disease 24(3):95–100.
Warren MW, Kobeissy FH, Liu MC, Hayes RL, Gold MS, Wang KKW. (2006) Ecstasy toxicity: A comparison to methamphetamine and traumatic brain injury. Journal of Addictive Disease (accepted for publication).
White SR, Duffy P, Kalivas PW. (1994) Methylenedioxymethamphetamine depresses glutamate-evoked neuronal firigin and increases extracellular levels of dopamine and serotonin in the nucleus accumbens in vivo. Neuroscience 62:41–50.
Woo M, Hakem R, Soengas MS, Duncan GS, Shahinian A, Kagi D, Hakem A, McCurrach M, Khoo W, Kaufman SA, Senaldi G, Howard T, Lowe SW, Mak TW. (1998) Essential contribution of caspase 3/CPP32 to apoptosis and its associated nuclear changes. Genes and Development 12:806–819.
Wyllie AH, Kerr JF, Currie AR. (1980) Cell death: The significance of apoptosis. International Review of Cytology 68:251–306.
108
Xie H, Johnson G. (1997) Ceramide selectively decreases tau levels in differentiated PC12 cells through modulation of calpain I. Journal Neurochemistry 69(3):1020–1030.
Xu W, Zhu JPQ, Angulo JA. (2005) Induction of striatal and pre- and postsynaptic damage by methamphetamine requires the dopamine receptors. Synapse 58:110–121.
Yakovlev AG, Knoblach SM, Fan L, Fox GB, Goodnight R, Faden AI. (1997) Activation of CPP32-like caspases contributes to neuronal apoptosis and neurological dysfunction after traumatic brain injury. The Journal of Neuroscience: the Official Journal of the Society for Neuroscience 17:7415–7424.
Yakovlev AG, Faden AI. (2001) Caspase-dependent apoptotic pathways in CNS injury. Molecular Neurobiology 24:131–144.
Yamamoto BK, Nash JF, Gudelsky GA. (1995) Modulation of methlyenedioxymethamphetamine-induced striatal dopamine release by the interaction between serotonin and gamma-aminobutyric acid in the substantia nigra. Journal of Pharmacology and Experimental Therapeutics. 273:1063–1070.
Yamamoto BK. (2001) Neurochemical mediators and neurophysiological consequences of acute MDMA exposure in rats. Presented at MDMA/Ecstasy Research: Advances, Challenges and Future Directions, Bethesda, MD.
Yamashima R. (2000) Implication of cysteine proteases calpain, cathepsin and caspase in ischemic neuronal death of primates. Progress in Neurobiology 62:273–295.
Yang L, Ksiezak-Reding H. (1995) Calpain-induced proteolysis of normal human tau and tau associated with paired helical filaments. European Journal of Biochemistry 233(1):9–17.
Yen S, Easson C, Nacharaju P, Hutton M, Yen S. (1999) FTDP-17 tau mutations decrease the susceptibility of tau to calpain I digestion. Federation of European Biochemical Societies 461(1-2):91–95.
Yuen PW, Wang KKW. (1998) Calpain inhibitors, novel neuroprotectants and potential anticataractic agents. Drugs Future 23:741–749.
Zhu JPQ, Xu W, Angulo JA. (2005) Disparity in the temporal appearance of methamphetamine-induced apoptosis and depletion of dopamine terminal markers in the striatum of mice. Brain Research 1049:171–181.
BIOGRAPHICAL SKETCH
Matthew Wesley Warren was born in 1978 and originally hails from Raleigh, NC.
He graduated from the University of North Carolina at Chapel Hill in 2001 with Highest
Honors in Research and Highest Distinction, earning a Bachelor of Science degree in
chemistry (biochemistry track) with a minor in mathematical science (statistics option).
During his undergraduate studies Matthew was inducted into Phi Beta Kappa and earned
research awards from the Emmitt-Rand and National Starch and Chemical Company
scholarship funds. Matthew then began the combined MD/PhD program at the
University of Florida (Gainesville, FL) College of Medicine, was named a University
Alumni Fellow and completed two years of medical school, passing Step 1 of the United
States Medical Licensing Exam. In 2006, he earned a Doctor of Philosophy in medical
sciences (neuroscience concentration) while studying under the guidance of Mark S. Gold
and Kevin K.W. Wang in the Departments of Psychiatry and Neuroscience. During his
graduate work, Matthew earned research honors including the Washington University
Guze Award, the American Society of Addiction Medicine Young Investigator Award
and the American Academy of Addiction Psychiatry Medical Student Award. Matthew
was also given recognition as an Outstanding Graduate Student Teacher. Upon
completion of this dissertation, he returns to medical school to complete the final two
years of his Doctor of Medicine degree.
109