
CLS HOLDINGS PLC (CLS, THE COMPANY OR THE GROUP) …
57
Release date: 4 March 2014 Embargoed until: 07:00 CLS HOLDINGS PLC ("CLS", THE "COMPANY" OR THE "GROUP") ANNOUNCES ITS FULL YEAR FINANCIAL REPORT FOR THE 12 MONTHS TO 31 DECEMBER 2013 A year of further significant progress across the Group CLS is a property investment company with a diverse portfolio of £1,133 million modern, well-let properties in the UK, France, Germany and Sweden. CLS’s properties have been selected for their potential to add value and to generate high returns on capital investment through active asset management. FINANCIAL HIGHLIGHTS Another strong year of growth from cash generation EPRA net assets per share up 9.9% to 1,268.4 pence (2012: 1,154.4 pence) Net assets per share up 13.6% to 1,094.1 pence (2012: 963.1 pence) Profit before tax up 27.3% to £71.4 million (2012: £56.1 million) Profit after tax up 35.3% to £63.2 million (2012: £46.7 million) EPRA earnings per share up to 66.2 pence (2012: 65.3 pence) Basic earnings per share up 38.6% to 146.9 pence (2012: 106.0 pence) Portfolio up 21.2% at £1,132.9 million (2012: £934.5 million), up 0.9% like-for-like, or 1.6% before purchaser’s costs on acquisitions in the year Contracted annual rental income up 25.3% to £85.6 million (2012: £68.3 million) Robust interest cover of 3.2 times (2012: 3.5 times) Weighted average cost of debt down to 3.64% (2012: 3.67%) – one of the lowest in the property sector £199.2 million of liquid resources available for new investments Distributions to shareholders up 13.5% in the year, like-for-like, with a proposed £10.0 million by way of tender offer buy-back: 1 in 66 at 1,495 pence, equivalent to 22.65 pence per share Total shareholder return of 80.3% for the year, and the highest total shareholder return performance by a UK listed property company over 6 years with 324.3% OPERATIONAL HIGHLIGHTS Significant progress across investment property portfolio, developments and financing Investment Property Portfolio: Acquired 42 properties for £165.3 million providing a blended net initial yield of 11.6%, including the Neo portfolio of 34 properties for £123.7 million at a net initial yield of 12.23%
Transcript of CLS HOLDINGS PLC (CLS, THE COMPANY OR THE GROUP) …
Release date: 4 March 2014 Embargoed until: 07:00
CLS HOLDINGS PLC ("CLS", THE "COMPANY" OR THE "GROUP")
ANNOUNCES ITS FULL YEAR FINANCIAL REPORT FOR THE 12 MONTHS TO 31 DECEMBER 2013
A year of further significant progress across the Group
CLS is a property investment company with a diverse portfolio of £1,133 million modern, well-let properties in the UK, France, Germany and Sweden. CLS’s properties have been selected for their potential to add value and to generate high returns on capital investment through active asset management.
FINANCIAL HIGHLIGHTS Another strong year of growth from cash generation
EPRA net assets per share up 9.9% to 1,268.4 pence (2012: 1,154.4 pence)
Net assets per share up 13.6% to 1,094.1 pence (2012: 963.1 pence)
Profit before tax up 27.3% to £71.4 million (2012: £56.1 million)
Profit after tax up 35.3% to £63.2 million (2012: £46.7 million)
EPRA earnings per share up to 66.2 pence (2012: 65.3 pence)
Basic earnings per share up 38.6% to 146.9 pence (2012: 106.0 pence)
Portfolio up 21.2% at £1,132.9 million (2012: £934.5 million), up 0.9% like-for-like, or 1.6% before purchaser’s costs on acquisitions in the year
Contracted annual rental income up 25.3% to £85.6 million (2012: £68.3 million)
Robust interest cover of 3.2 times (2012: 3.5 times)
Weighted average cost of debt down to 3.64% (2012: 3.67%) – one of the lowest in the property sector
£199.2 million of liquid resources available for new investments
Distributions to shareholders up 13.5% in the year, like-for-like, with a proposed £10.0 million by way of tender offer buy-back: 1 in 66 at 1,495 pence, equivalent to 22.65 pence per share
Total shareholder return of 80.3% for the year, and the highest total shareholder return performance by a UK listed property company over 6 years with 324.3%
OPERATIONAL HIGHLIGHTS Significant progress across investment property portfolio, developments and financing Investment Property Portfolio:
Acquired 42 properties for £165.3 million providing a blended net initial yield of 11.6%, including the Neo portfolio of 34 properties for £123.7 million at a net initial yield of 12.23%
Sold two properties for £26.9 million, 60% above their 2012 external valuations, at a blended net initial yield of 3.3%
Vacancy rate of 4.4% (2012: 3.8%), less than half the benchmark average of 9.7% for our type of portfolio
EPRA net initial yield of 7.0%, 336 basis points above cost of debt, one of the highest differentials in the listed property sector
The quality of rental income improved still further, with 50.2% now derived from governments and 21.1% from major corporations, and with 60.4% subject to indexation
Developments:
Conditional agreement signed for a long lease to a student housing operator to build and manage the 359 student room building adjacent to Vauxhall Square, SW8
Section 106 agreement signed on Vauxhall Square, SW8 setting our obligations towards the local community and public realm
Heads of Terms agreed to let the entire 3,423 sqm of office space at Clifford’s Inn, Fetter Lane, EC4 prior to completion of the redevelopment (due in Q3 2014)
Heads of Terms agreed to let 210 student rooms for 10 years to a university at Spring Mews, SE11
Franchise agreement signed with Intercontinental Hotel Group for a 93 room suite hotel at Spring Mews, SE11
Financing:
£19 million share placing to support growth ambitions
£80 million 4.17% secured notes issued to finance the Neo portfolio Sten Mortstedt, Executive Chairman of CLS, commented: “This has been a very important year of substantial further progress for the Group: we have acquired £165 million of property at attractive yields, progressed our development opportunities, raised innovative finance and equity, increased profits and delivered significant returns for shareholders.” “The Group is well positioned to continue to deliver for shareholders. Interest rates are likely to stay very low for an extended period, and now is a good time to buy property, with a selective investment approach. The Group has substantial resources to respond to any attractive opportunities which may emerge, and our highly cash-generative operation and opportunistic investment strategy enable us to face the future with confidence.”
-ENDS-
For further information please contact: CLS Holdings plc +44 (0)20 7582 7766 www.clsholdings.com Sten Mortstedt, Executive Chairman Henry Klotz, Executive Vice Chairman and Acting Chief Executive Officer
John Whiteley, Chief Financial Officer Kinmont Limited +44 (0)20 7087 9100 Jonathan Gray
Smithfield Consultants Limited +44 (0)20 7360 4900 Alex Simmons Liberum Capital Limited +44 (0)20 3100 2222 Tom Fyson Charles Stanley Securities +44 (0)20 7149 6000
Mark Taylor Hugh Rich
CLS will be presenting to analysts at 8.30am on Tuesday, 4 March 2014, at Smithfield Consultants, 10 Aldersgate Street, London, EC1A 4HJ. Conference call dial in numbers as follows: Conference call access numbers: Participant telephone number: +44(0)20 3427 1910 (UK Toll) Confirmation code: 5729133 Participants will have to quote the above code when dialing into the conference line.
CHAIRMAN’S STATEMENT OVERVIEW This has been an important year of substantial further progress for the Group across a number of areas: we have acquired over £165 million of property at an attractive blended net initial yield of 11.6%, progressed the development opportunities, raised innovative finance and equity, increased profits and delivered significant total returns for shareholders. The total shareholder return for the year was 80.3% and the return since 2008 has been 27.2% per annum compound, meaning that CLS has been the top performing listed real estate share over this period. The profit before tax was £71.4 million, an increase of 27.3% (2012: £56.1 million) and EPRA net assets per share increased by 9.9% to 1,268.4 pence per share (2012: 1,154.4 pence). EPRA earnings per share were 66.2 pence per share (2012: 65.3 pence). These results have been achieved against a variable economic backdrop across Western Europe. The UK economy is accelerating at a pace which has surprised many commentators, a positive trend which we acted on during 2013. The Eurozone is seeing only modest growth overall, with some economies clearly performing much better than others. The acquisitions during the year have significantly strengthened the core fundamentals of the Group: they have materially increased annual cash generation, and increased to 50% the rental income derived from governments. We now have over 460 customers across four countries, and enjoy a broad range of financing sources from over 20 banks and institutions, as well as the capital markets. The balance sheet is strong, with high levels of cash and liquid resources. INVESTMENT PROPERTY PORTFOLIO According to external valuations, the value of the investment property portfolio has grown to £1,132.9 million (2012: £934.5 million), in part due to the £157.4 million spent during the year on income-producing acquisitions, £24.4 million on development expenditure and £10.4 million of refurbishment expenditure on sustainability, efficiency and upgrading the quality of our buildings. These figures are net of £7.9 million of purchase costs on the acquisitions, which are not reflected in the year end value. Disposals of two properties for £26.9 million were made during the year, at an uplift to book value of £6.3 million. The significant level of acquisitions reflects our strategy of buying into the economic upturn and we continue to seek more purchases. In total 42 properties were acquired for £165.3 million at a blended net initial yield of 11.6%. The Neo portfolio, comprising 34 properties and 99% occupied by government bodies, was acquired as a receivership sale. There are many encouraging asset management opportunities emerging both from this acquisition, and from the others made in the year. The overall rental yield on the Group’s core investment portfolio is 7.0%, whereas the cost of debt remains very low at 3.64%. This spread of 336 basis points is amongst the highest in the listed property sector and remains a key component of the cash generative nature of the Group’s profits.
Rental income fell by 1.1% in the year on a like-for-like basis as space was taken back for refurbishment pending re-letting. Following the acquisitions, however, the contracted rent roll at the year end had grown by 25.3% to £85.6 million (2012: £68.3 million). Of this income, 72% comes from governments and major corporations and 60% is index-linked. On a like-for-like basis, the value of the UK portfolio showed growth of 1.9%, including further uplift on the development properties. While Germany was broadly unchanged in local currency terms, values in France and Sweden reduced by 3.6% and 2.3% respectively, resulting in an unchanged valuation overall. In-house property management is a key strength of the Group across all our regions, enabling us to respond faster and more proactively to the needs of our customers. The new acquisitions have been quickly and seamlessly integrated into this structure, with relatively few additional personnel required to be recruited. The benefits of this structure were evident during the Neo acquisition, as we experienced very positive customer references from an existing government occupier to a prospective one about the Group as a property owner. The vacancy rate across the Group remains low at 4.4%, less than half the benchmark across European cities for our type of property. The weighted average lease length for the investment portfolio is 7.0 years, and 5.8 years to first break. Letting markets are good in the UK, where vacancy is just 2.4% and where there are clear signs of rental growth now emerging in suburban London; there are also interesting opportunities to convert offices to residential which we are actively exploring. Letting conditions are also healthy in Germany, where business confidence appears robust and occupiers are investing and expanding. This is evidenced by the vacancy rate in our German portfolio, which has reduced significantly from 7.4% to 3.5% in twelve months. There are also signs of rental growth in buoyant markets, such as Berlin, and we would like to acquire more buildings in Germany, which currently represents 18% of our property portfolio. Whilst the German economy continues to improve with record high employment, solid export demand and signs of improving domestic consumption levels, the French economy is clearly struggling. As France represents 21% of our total portfolio, this has adversely affected the vacancy levels and the valuations of our portfolio. Letting activity in France has fallen by 25% compared to 2012, and new construction starts have slowed as immediate supply has increased by 9% in the Paris region. With political leadership and courage, we believe France will recover and our refurbished offices will be well placed to re-let into the upturn. In Sweden, the economy is expected to accelerate in 2014 driven by improving exports, further reduced interest rates and the strong position of banks for new lending. All this bodes well for commercial property in Sweden. The development programme in London has made good progress in the year. The 3,423 sqm office redevelopment (and eight new residential apartments) at Clifford’s Inn, Fetter Lane, EC4 is on course for completion in Q3 2014 and terms have already been agreed for a pre-let of the entire office space. The anticipated rent roll for the offices and residential is £1.4 million. At Spring Mews, SE11, the student and hotel scheme is also moving rapidly to a completion in Q3 2014; terms have been agreed with a London university to let 210 of the 378 student rooms for a 10 year period at a rent in line with our forecasts. In addition, Intercontinental Hotel Group has signed a franchise agreement for a Staybridge branded suite hotel of 93 rooms, to be run by specialist franchise operator, Cycas Hospitality. These agreements enable the Group to benefit from the continued growth that is anticipated in the Vauxhall area, rather than lock into long-term fixed rental income.
Good progress is being made with the Vauxhall Square, SW8, development where we have signed the Section 106 planning agreement and have full planning consent for a 143,000 sqm mixed-use scheme centred on 410 residential apartments, with offices, two hotels, a cinema, retail, restaurants, and student housing. The Vauxhall Nine Elms regeneration area goes from strength to strength, with construction well under way on the various residential sites and on the new US Embassy. The Dutch Embassy is coming to the area and the Chinese group, Wanda, acquired the One Nine Elms site, adjacent to Vauxhall Square, for a 200m tall scheme of apartments with a five-star hotel. All this activity is very supportive for the values in the area and our site is at the heart of the tall building zone. The first construction on the development is expected to begin in 2015 on the student site as we have recently signed an agreement with a student housing operator, which will build and manage the 359 student room building, meaning there will be no Group cash required for this building. The terms of this agreement are confidential and it is conditional on certain technical matters being discharged, which we expect to happen over the next 12 months. This transaction highlights that individual elements of the scheme can be organised and financed in a variety of ways. There is considerable interest from hoteliers for the two four-star hotels and vacant possession for the main site is due at the end of 2016. In Sweden, Catena AB, in which the Group owned a 29.9% stake, made a significant portfolio acquisition of 43 properties valued at SEK 3.85 billion (£360 million) by issuing new shares with a value of SEK1.15 billion (£112 million) and taking on the related debt. This was a very positive transaction for Catena, materially strengthening the earnings profile. As a consequence, the Catena share price rose 14% immediately after the acquisition, and gradually improved a further 3% by the end of the year. The transaction diluted the Group’s shareholding to 13.8%, meaning it is now accounted for at the market value of Catena’s shares as an available-for-sale asset, and no longer as an associate. RESULTS Profit after tax grew by 35.3% to £63.2 million (2012: £46.7 million) and shareholders’ funds rose by 15% to £480.9 million, after distributions to shareholders of £13.6 million and £19.0 million net proceeds of a share placing. EPRA net assets per share have risen by 9.9% to 1,268.4 pence (2012: 1,154.4 pence), and net assets per share by 13.6% to 1,094.1 pence (2012: 963.1 pence). The balance sheet is strong, with cash and liquid resources of £199.2 million, and we have substantial undrawn credit facilities. Recurring interest cover is high at 3.2 times, as the Group continues to enjoy a very low weighted average cost of debt of just 3.64% (2012: 3.67%), one of the lowest in the listed property sector. Net debt as a percentage of property loan to value was 56.3% (2012: 58.8%). FINANCING The Group continues its clear strategy of having a wide variety of financing from banks and other debt providers, and of ring-fencing debt against individual properties where appropriate. We are pleased to have secured loans from two new lenders in 2013, a German Sparkasse bank and a UK insurance company. Diversity of financing is important to reduce risk and we enjoy active lending relationships with 26 debt sources. We also signed a £45 million revolving credit facility with a UK clearing bank in November, and there are positive signs of such banks more actively lending again. Interest rates have remained very low, with further reductions in the Eurozone. We expect this will remain the case for an extended period, and, as a consequence, 71% of our debt is at floating rates, with 41% being protected against rising interest rates through interest rate caps.
The Group’s corporate bond portfolio has continued to be a valuable part of the cash flow and liquid resources strategy. The portfolio performed well during the year, delivering a total return of £9.3 million, or 10.8% on capital. To fund the Neo acquisition, the portfolio was sold almost in its entirety in August over a few working days, which proved the high level of liquidity in the bonds held. At the year end the portfolio had been replenished from cash balances; it consisted of 21 bonds valued at £69.4 million with a running yield of 7.8% on market value, and a weighted average duration of 10.6 years. The portfolio size has thereafter been further increased, currently representing a market value of £98.3 million. On 8 November 2013, the Group successfully placed 1.6 million treasury shares with institutional investors at £12.15 per share, raising net proceeds of £19.0 million. This placing was substantially oversubscribed and executed at an insignificant discount to the prevailing share price – credible signs of confidence in the Group. The placing further strengthens the balance sheet and supports our continued growth ambitions. PROPERTY VALUATIONS According to external valuations, the value of the Group’s investment property portfolio was £1,132.9 million at the year end. During the year the Group disposed of two properties for £26.9 million, a price which exceeded their 2012 external valuations by 60%. Such recurrent and material differences between external property valuations and actual transaction prices lead me to question whether our external valuations are currently consistently underestimating the actual values of our UK properties. BOARD CHANGES On 14 February 2014, Richard Tice stepped down as Chief Executive Officer at his request after almost four years with CLS, but he remains as a non-executive director. The Board is grateful for the valuable contribution that Richard has made to the Group’s continuing success and the strong management team that he has built. Henry Klotz, Executive Vice Chairman, who has been with the Group since 1999 and was Chief Executive Officer from 2008 to 2010, became Acting Chief Executive Officer pending a new permanent appointment being made; the search for a replacement is well under way. John Whiteley, Chief Financial Officer, assumes responsibility for investor relations. The Group’s Executive Management Committee now comprises the three executive directors together with Simon Wigzell, who has been promoted to Head of Group Property. SUSTAINABILITY During the year we continued to implement important energy saving initiatives which are benefiting our customers and reducing overall energy consumption. We are aiming to achieve an SKA gold sustainability rating for the refurbishment works at our Hounslow building, installed a photovoltaic array on another building in London, and installed two 165 metre deep bore holes into the aquifer as part of the ground source based energy system at Spring Mews. More details of these activities will be given in the Corporate Social Responsibility section of the Annual Report. It is clear that occupiers welcome these value adding initiatives and we remain focused on this important area, led by our full-time Sustainability Manager. DISTRIBUTIONS TO SHAREHOLDERS In 2013, the Group distributed through tender offer buy-backs £8.6 million in April, equivalent to 19.80 pence per share, and £5.0 million in September, or 11.72 pence per share. Similarly, the Board proposes a tender offer buy-back of 1 in 66 shares at 1,495 pence per share in April 2014, to distribute £10.0 million to shareholders, equivalent to 22.65 pence per share, an increase of 14.4% over that of a year ago. This will bring total distributions for the year to £15.0 million, an annual like-for-like increase of 13.5%. A circular setting out the details will be sent to shareholders with the Annual Report and Accounts. OUTLOOK The economic situation appears to be gradually improving, particularly in the UK, where rental growth is returning. Even though the Eurozone is still showing only modest growth
and business confidence levels remain variable, it is fair to say that the outlook for the rest of Europe has also improved. Against this background, the Group is well positioned to continue to deliver for shareholders. Interest rates are likely to stay very low for an extended period, and now is a good time to buy property, with a selective investment approach. The Group has substantial resources to respond to any attractive opportunities which may emerge, and our highly cash-generative operation and opportunistic investment strategy enable us to face the future with confidence. Sten Mortstedt Executive Chairman 4 March 2014
STRATEGIC REVIEW The main activity of the Group is investment in commercial real estate across four European regions: the United Kingdom, France, Germany and Sweden. There is a particular focus on providing well-managed, cost-effective offices and property for cost-conscious occupiers in key European countries. The Group’s total property interests have increased to £1,169.3 million at 31 December 2013, comprising the wholly-owned investment portfolio valued at £1,132.9 million, a 13.8% interest in Swedish listed property company Catena AB valued at £32.6 million, and a £3.8 million interest in 44.2% of Cood Investments AB. PROPERTIES OVERVIEW At 31 December 2013, the directly held property portfolio was independently valued at £1,132.9 million (31 December 2012: £934.5 million). This increase of £198.4 million primarily comprised £200.1 million of new acquisitions and development expenditure, and a £9.3 million uplift from exchange rate variances, less disposals of £11.3 million. In local currencies, overall the portfolio did not change in value on a like-for-like basis. Purchase costs in the year totalling £7.9 million were not reflected in the subsequent valuation. On a like-for-like basis and in local currencies, the UK portfolio increased in value by 1.9%, Germany was broadly unchanged, and France and Sweden fell by 3.6% and 2.3%, respectively. The £165.3 million of acquisitions (93% in the UK) over the year represented a clear strategy, expressed in the Half-Yearly Financial Report, that the Group was buying into the upturn. Subsequent economic data in the UK has appeared to support this view. 69% of the acquisitions in the UK were outside the M25, which reflected a forward-looking view that regional pricing was very attractive for the type of property and occupier that the Group knows so well. Whilst the contracted rent fell over the year by 1.1% on a like-for-like basis, the annualised rent rose in the year by 25.3% following the high yielding acquisitions in the year. The weighted average yield of 11.6% after costs reflected the fact that almost all of the purchases were from vendors with a need to sell. The overall yield on the investment property portfolio (excluding developments) at 31 December 2013 was 7.0% on value, with a low average rent of £165 per sqm. The average capital value was also low at just £2,072 per sqm, which was very close to replacement cost; this means that the land element of our investments in key European cities was minimal and highlights how successful the Group can be in attracting occupiers with cost-effective rents. The quality of the Group’s rental income is strong, with 50% being paid by government occupiers and 22% from major corporations, and 60% of our rents are subject to indexation. The weighted average lease length at 31 December 2013 was 7.0 years, or 5.8 years to first break. Over the next three years, just 28% of the current rental income expires and the current open market rental values are broadly in line with those expiring rental levels. The overall vacancy rate remains very low at just 4.4%; this is testament to the benefit of very active in-house asset and property management, and to maintaining strong links with our occupiers to ensure we understand and respond to their needs. The benefits of the Group’s geographical diversification are reinforced as different economies move at different speeds. There are real signs of open market rental growth emerging in the London suburban markets for the first time in over six years; this supports our consistently held view of the beneficial impact to the Group of the lack of new supply in most of our markets.
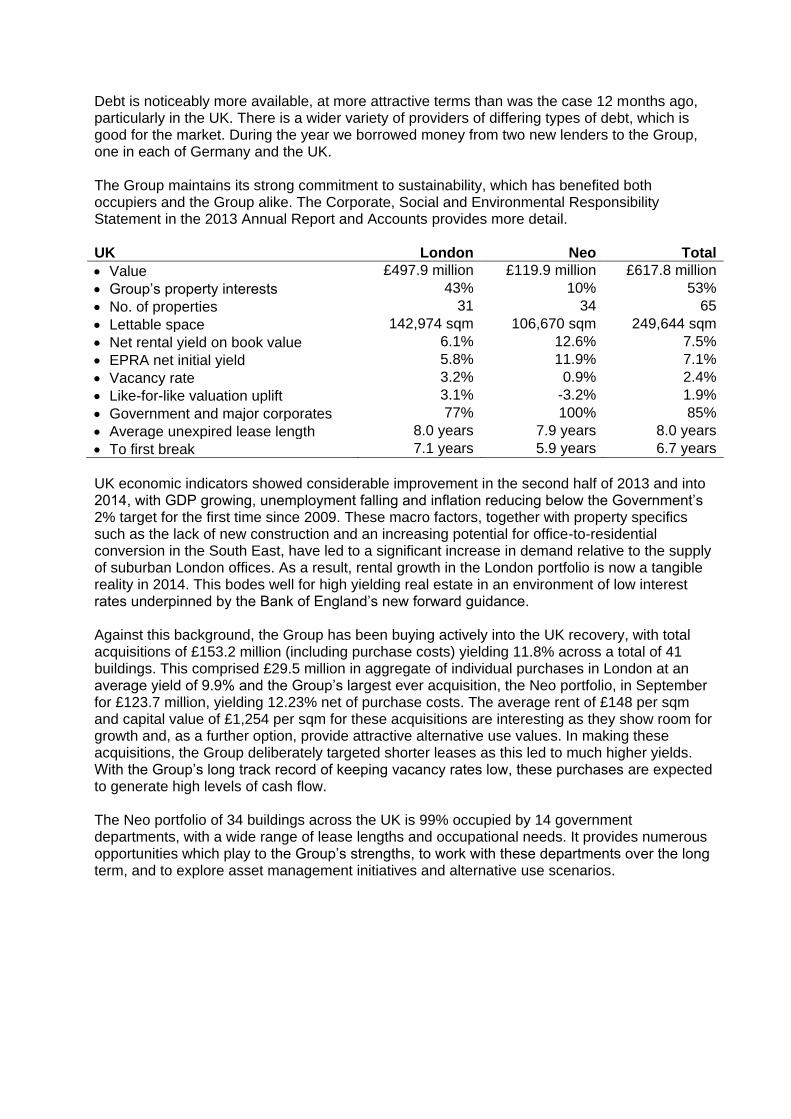
Debt is noticeably more available, at more attractive terms than was the case 12 months ago, particularly in the UK. There is a wider variety of providers of differing types of debt, which is good for the market. During the year we borrowed money from two new lenders to the Group, one in each of Germany and the UK. The Group maintains its strong commitment to sustainability, which has benefited both occupiers and the Group alike. The Corporate, Social and Environmental Responsibility Statement in the 2013 Annual Report and Accounts provides more detail. UK London Neo Total
Value £497.9 million £119.9 million £617.8 million
Group’s property interests 43% 10% 53%
No. of properties 31 34 65
Lettable space 142,974 sqm 106,670 sqm 249,644 sqm
Net rental yield on book value 6.1% 12.6% 7.5%
EPRA net initial yield 5.8% 11.9% 7.1%
Vacancy rate 3.2% 0.9% 2.4%
Like-for-like valuation uplift 3.1% -3.2% 1.9%
Government and major corporates 77% 100% 85%
Average unexpired lease length 8.0 years 7.9 years 8.0 years
To first break 7.1 years 5.9 years 6.7 years
UK economic indicators showed considerable improvement in the second half of 2013 and into 2014, with GDP growing, unemployment falling and inflation reducing below the Government’s 2% target for the first time since 2009. These macro factors, together with property specifics such as the lack of new construction and an increasing potential for office-to-residential conversion in the South East, have led to a significant increase in demand relative to the supply of suburban London offices. As a result, rental growth in the London portfolio is now a tangible reality in 2014. This bodes well for high yielding real estate in an environment of low interest rates underpinned by the Bank of England’s new forward guidance. Against this background, the Group has been buying actively into the UK recovery, with total acquisitions of £153.2 million (including purchase costs) yielding 11.8% across a total of 41 buildings. This comprised £29.5 million in aggregate of individual purchases in London at an average yield of 9.9% and the Group’s largest ever acquisition, the Neo portfolio, in September for £123.7 million, yielding 12.23% net of purchase costs. The average rent of £148 per sqm and capital value of £1,254 per sqm for these acquisitions are interesting as they show room for growth and, as a further option, provide attractive alternative use values. In making these acquisitions, the Group deliberately targeted shorter leases as this led to much higher yields. With the Group’s long track record of keeping vacancy rates low, these purchases are expected to generate high levels of cash flow. The Neo portfolio of 34 buildings across the UK is 99% occupied by 14 government departments, with a wide range of lease lengths and occupational needs. It provides numerous opportunities which play to the Group’s strengths, to work with these departments over the long term, and to explore asset management initiatives and alternative use scenarios.
The vacancy rate for the UK remains very low at just 2.4% (excluding development stock). During 2013, 8,822 sqm became vacant and we let or renewed leases on 8,257 sqm. We have demonstrated single digit rental growth over the second half of the year at buildings such as Great West House, Brentford and Cambridge House, Hammersmith and we expect this to continue; it is over six years since this level of growth was evident in suburban London.
The appetite from new investors to London for certain types of buildings and locations seems insatiable, and in December the Group took the opportunity to sell Ingram House, John Adam Street, WC2, a 1,308 sqm office and residential building, for £13.2 million, equating to a capital value before refurbishment costs of over £10,000 per sqm, and some 54% above last year’s valuation. This freed up capital for redeployment in refurbishment opportunities elsewhere in the portfolio, such as a number of potential office-to-residential conversion schemes currently under consideration, the application for the first of which under the new Permitted Development rules is under way for one of the properties we acquired in 2013. This new government legislation is to be welcomed as a real potential contributor to reducing the housing shortage in the South East, and we would support the extension of this scheme beyond the May 2016 expiry. Also during the year we sold our one-third interest in Fielden House, adjacent to the Shard, for a price 66% above its value at 31 December 2012, producing a gain on disposal of £1.8 million. The development programme in London has continued to make strong progress over the year:
Spring Mews, Vauxhall SE11, a 20,800 sqm mixed-use scheme comprising a 378 bed student accommodation building, and a 93 bedroom suite hotel, together with retail and office space. Construction is well advanced, with topping out due later this month and completion set for Q3 2014. Terms have been agreed with a university for 210 of the student rooms under a ten-year nominations agreement with minimum rental uplifts linked to inflation. The other 168 rooms will be let direct by our specialist student marketing and operating manager, Fresh Student Living. Construction of the balance of 22 student rooms within the original 400 consented will be built in a later phase. For the hotel, a franchise agreement has been signed with Intercontinental Hotel Group (IHG) for a Staybridge branded suite hotel, to be run by specialist franchise operator Cycas Hospitality. This is a very exciting new hotel concept which is proving very successful in Stratford, East London, and the Group will benefit from the considerable expertise of the franchise team. The 245 sqm of retail and 1,000 sqm of offices within the scheme will be let upon completion. The estimated rental value per annum of the whole development when complete and running is over £5.5 million per annum.
Clifford’s Inn, EC4, a 3,423 sqm office redevelopment with eight new residential apartments. This is progressing towards a Q3 2014 completion, and terms have been agreed for a pre-let of the entire office space to a strong professional services firm. The apartments will be let or sold upon completion, the construction cost is some £10 million and the anticipated rent roll is over £1.4 million per annum.
Vauxhall Square, SW8, a 143,000 sqm mixed-use development scheme including 410 private apartments in two 50 storey towers, 110 affordable homes, 22,732 sqm of offices, 3,119 sqm of shops and restaurants, a 278 room hotel and a 123 bedroom suite hotel, 359 student rooms, a 50 room hostel for the homeless and a multi-screen cinema. Activity continues to grow in Vauxhall/Nine Elms, a regeneration area now characterized by the proliferation of cranes on the sites under construction, including the new US Embassy. During the year the Dutch Embassy committed to the area and a Chinese investor, Wanda, acquired One Nine Elms, adjacent to Vauxhall Square and is shortly to begin demolition of the Market Towers building. All this activity bodes well for Vauxhall Square. Following the signing of the s.106 planning agreement in July, progress has been made in shortlisting the right potential 4-star hoteliers for the 2 hotels on the scheme and design work is under way to address their needs. Following considerable interest from student housing operators, an agreement has been signed with one such specialist to build and manage the 359 student room building adjacent to the main Vauxhall Square site. Whilst the commercial terms of this agreement are confidential, it is conditional on a number of technical matters, which we expect to discharge within the next twelve months to enable construction of this first phase of Vauxhall Square to start in 2015, without the need for any Group cash to be invested.
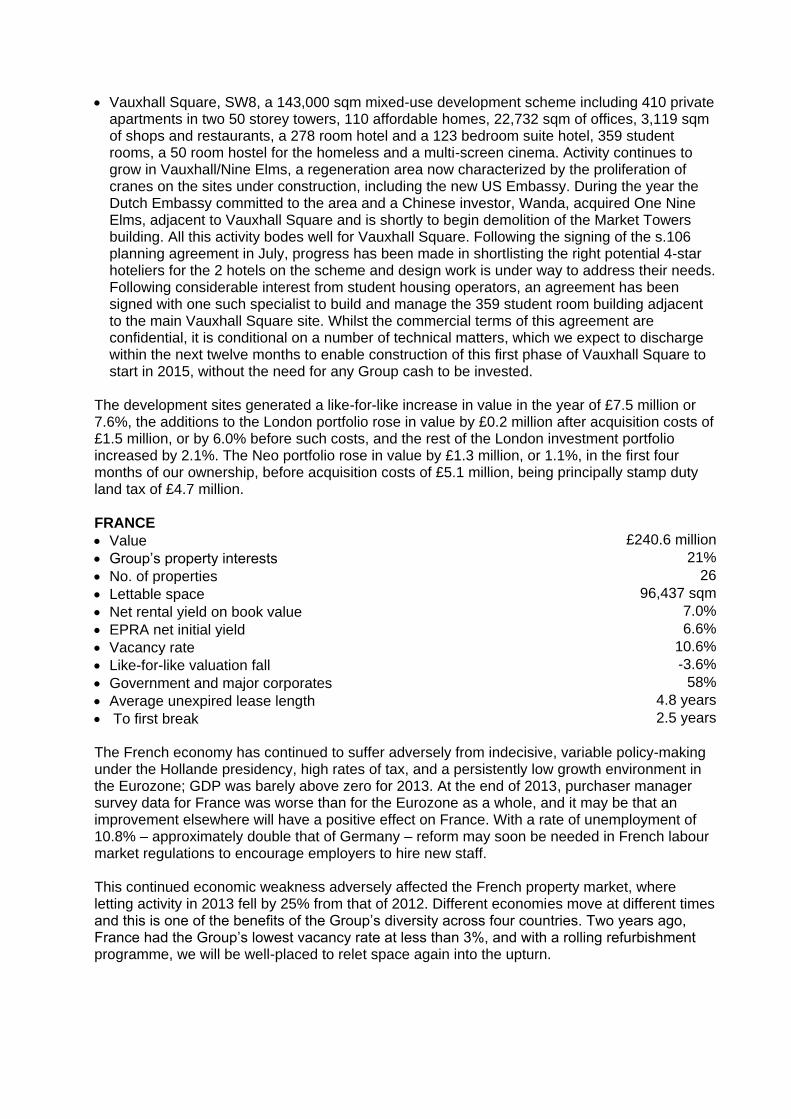
The development sites generated a like-for-like increase in value in the year of £7.5 million or 7.6%, the additions to the London portfolio rose in value by £0.2 million after acquisition costs of £1.5 million, or by 6.0% before such costs, and the rest of the London investment portfolio increased by 2.1%. The Neo portfolio rose in value by £1.3 million, or 1.1%, in the first four months of our ownership, before acquisition costs of £5.1 million, being principally stamp duty land tax of £4.7 million. FRANCE
Value £240.6 million
Group’s property interests 21%
No. of properties 26
Lettable space 96,437 sqm
Net rental yield on book value 7.0%
EPRA net initial yield 6.6%
Vacancy rate 10.6%
Like-for-like valuation fall -3.6%
Government and major corporates 58%
Average unexpired lease length 4.8 years
To first break 2.5 years
The French economy has continued to suffer adversely from indecisive, variable policy-making under the Hollande presidency, high rates of tax, and a persistently low growth environment in the Eurozone; GDP was barely above zero for 2013. At the end of 2013, purchaser manager survey data for France was worse than for the Eurozone as a whole, and it may be that an improvement elsewhere will have a positive effect on France. With a rate of unemployment of 10.8% – approximately double that of Germany – reform may soon be needed in French labour market regulations to encourage employers to hire new staff. This continued economic weakness adversely affected the French property market, where letting activity in 2013 fell by 25% from that of 2012. Different economies move at different times and this is one of the benefits of the Group’s diversity across four countries. Two years ago, France had the Group’s lowest vacancy rate at less than 3%, and with a rolling refurbishment programme, we will be well-placed to relet space again into the upturn.
The French portfolio valuation has fallen by 3.6% in the year in local currency, or by 1.5% in sterling. The underlying portfolio of 24 properties fell in value by 0.8%, but, as presaged earlier in the year, the vacancy rate has risen to 10.6% which reflects a couple of large expiries from space for which the refurbishment work is almost complete, and reflects the broader economic climate. During the year, occupiers vacated from 17,047 sqm, and we let or renewed 11,471 sqm. On the completion of the refurbishment of the Inside building at Reuil Malmaison, over 2,800 sqm will be available to let in this one building in 2014. Whilst the quantity of space on which planning permission has been granted in central Paris has peaked at 1,835,000 sqm, less than 20% of these schemes are expected to be launched. The Group’s most central office property in Paris, 1,800 sqm directly opposite the Banque de France, will be available for a refurbishment in late 2014 and this presents an opportunity to explore the potential to change the use to a boutique hotel, to ensure we maximise the value. The volume of investment market transactions in Ile de France reduced by 9% in the year, but there is still strong demand from domestic investors for prime property. GERMANY
Value £214.4 million
Group’s property interests 18%
No. of properties 17
Lettable space 152,315 sqm
Net rental yield on book value 7.3%
EPRA net initial yield 6.9%
Vacancy rate 3.5%
Like-for-like valuation fall -0.2%
Government and major corporates 45%
Average unexpired lease length 8.3 years
To first break 8.2 years
The German economy remains stable; whilst producing GDP growth of just 0.4% in 2013, this probably masks an underlying strength, with over 2% growth forecast for 2014. The low interest rate environment, and some economic recovery in other Eurozone states, should boost exports for Germany. In December 2013, business and consumer sentiment rose to highs not seen for many years, domestic demand has remained strong from the traditionally thrifty local consumer and employment levels continue to be at record highs of over 41 million. Property investment volumes have risen by over 5% in the year. Lettings in the big six cities have fallen by 6% but in our portfolio we have experienced considerable success, reducing the vacancy rate in the year from 7.4% to 3.5%. Lettings and renewals have totalled 6,772 sqm whilst only 829 sqm was vacated by occupiers. In particular we have let 2,065 sqm at the Maximillian Forum building in Munich and 510 sqm at Bismarckstrasse, Berlin. There is an encouraging trend of enquiries and expansion plans from existing and potential occupiers.
In June the Group completed the purchase for €13.1 million of a 7,135 sqm fully let office building located in the heart of Freiburg in south west Germany consisting of 5,127 sqm of offices, 1,247 sqm of retail, archives and 112 car spaces. The net initial yield of 8.75% after costs was derived from rent of €1.23 million from occupiers such as KPMG, Commerzbank and a local government department. Debt was secured from a regional Sparkasse bank. It is clear that amongst our markets debt is most available and competitively priced in Germany, and the Group would very much like to acquire more property in this region.
SWEDEN Directly Owned
Value £60.1 million
Group’s property interests 5%
No. of properties 1
Lettable space 45,354 sqm
Net rental yield on book value 8.9%
EPRA net initial yield 8.4%
Vacancy rate 1.7%
Like-for-like valuation fall -2.3%
Government and major corporates 97%
Average unexpired lease length 3.4 years
To first break 3.4 years
Indirectly Owned
Value in Catena £32.6 million
Group’s property interests 2%
Interest in Catena 13.8%
Value in Cood Investments £3.8 million
Group’s property interests 1%
Interest in Cood Investments 44.2%
The Group’s interests in Sweden consist of two operating segments: Investment Properties and Other Investments. The Other Investments are equity stakes in a financial investment and an associate which invest in Swedish real estate, and as they operate against the same economic backdrop, are considered together with the directly–held Swedish investment property in this Strategic Review. Whilst the Swedish economy has seen modest growth in 2013 of 1.5%, partially due to the slowdown in exports to other EU countries, consensus forecasts are for growth in 2014 to accelerate to 2.4%, assisted by the reduction in the bank rate in December 2013 to 0.75%. Inflation is below 1% and unemployment steady at 7.9%. The banks are in a strong position to lend to the corporate and consumer sectors. At the 45,354 sqm office complex, Vänerparken, near Gothenburg, negotiations have progressed according to plan with the main local government occupiers on lease renewals in 2015. The financing of the property was renewed for a further 2-year term at a competitive interest rate margin. During the second half of the year, an associate, Catena AB, financed a significant corporate acquisition of a large portfolio of 43 properties, valued at SEK 3.845 billion, by issuing new shares in Catena with a value of SEK 1.145 billion (£112 million) and taking on the related debt secured on the portfolio. This resulted in a dilution of the CLS stake from 29.9% to 13.8%. In accordance with IFRS, Catena then ceased to be an associate of CLS and is now accounted for as an available-for-sale investment. The fair value gain on reclassification as an investment was £14.9 million, or 23.6 pence per share in EPRA net asset value. In 2013, the Group paid £0.3 million to increase its shareholding in its associate, Cood Investments AB, to 44.2%, and £2.3 million to acquire 23,200 8% Convertible Loan Notes issued by Cood. The Notes are convertible at the option of the noteholder between 1 January 2014 and 31 May 2015, into 23,200 preference shares and, if exercised, would give the Group a majority of the equity voting rights of Cood Investments.
RESULTS FOR THE YEAR HEADLINES Profit after tax of £63.2 million (2012: £46.7 million) generated EPRA earnings per share of 66.2 pence (2012: 65.3 pence), and basic earnings per share of 146.9 pence (2012: 106.0 pence). Gross property assets at 31 December 2013 were £1,132.9 million (2012: £934.5 million), EPRA net assets per share were 9.9% higher at 1,268.4 pence (2012: 1,154.4 pence), and basic net assets per share rose by 13.6% to 1,094.1 pence (2012: 963.1 pence). Approximately 50% of the Group’s business is conducted in the reporting currency of sterling, around 45% in euros, and the balance is in Swedish kronor. Compared to last year, profits benefited as the euro was 4.7% stronger and the krona 5.3% stronger against sterling than in 2012. Likewise, at 31 December 2013 the euro was 2.3% stronger against sterling than twelve months previously, increasing the sterling equivalent value of net assets. Exchange rates to the £ EUR SEK
At 31 December 2011 1.1987 10.7088 2012 average rate 1.2332 10.7326 At 31 December 2012 1.2317 10.5677 2013 average rate 1.1779 10.1926 At 31 December 2013 1.2041 10.6562
STATEMENT OF COMPREHENSIVE INCOME At £76.0 million, rental income in 2013 was £9.9 million higher than in 2012, largely through the impact of acquisitions, which added £7.5 million, the strength of the euro and krona, which increased rent by £1.9 million, and indexation which contributed £1.2 million; the net effect of expiries exceeding lettings reduced rental income by £0.6 million, and disposals reduced it by £0.1 million. As other property-related income and net service charge expenses were in line with last year, net rental income of £73.1 million was 16.2% higher than last year (2012: £62.9 million). We monitor the administration expenses incurred in running the property portfolio by reference to the income derived from it, which we call the administration cost ratio, and this is a key performance indicator of the Group. In 2013, retaining key staff into the economic upturn whilst expanding staff levels for the development programme and property purchases, drove the increase in administration expenses of the property segment of the Group to £11.9 million (2012: £10.0 million). As a proportion of net rental income, the administration cost ratio increased to 16.3% (2012: 15.9%), but with contracted rental income at 31 December 2013 of £85.6 million being £9.6 million higher than rental income in 2013, the administration cost ratio is expected to fall below our KPI target of 15.0% in 2014. The disposal of Ingram House, WC2 realised a gain of £4.5 million after costs over its valuation at 31 December 2012 of £8.6 million, and the disposal of a one-third share in a joint venture which owned Fielden House, SE1 generated a gain of £1.8 million. The corporate bond portfolio was sold in August to raise cash with which to acquire the Neo portfolio in early September. The historical cost profit recognised on the disposal of the bonds was £12.1 million and comprised the majority of the £14.1 million gain on sale of corporate bonds and other financial investments in 2013. The process of selling the corporate bonds proved their liquidity, as it took place over a few days in August without moving prices. The net deficit on revaluation of investment properties in the year was £0.2 million in local currencies (2012: surplus of £16.2 million), but in sterling was a surplus of £9.1 million (2012: £5.1 million), after writing off £7.9 million (2012: £0.7 million) of acquisition costs, predominantly on the Neo portfolio.
The reclassification of the investment in Catena AB to an available-for-sale financial investment generated a fair value gain of £14.9 million, as its share price was at a significant premium to the book value at which it had previously been recorded as an associate. Finance income of £7.6 million (2012: £10.6 million) comprised predominantly interest income of £6.3 million (2012: £9.1 million) from corporate bonds, and fell in the year following the temporary sale of the portfolio. After the Neo portfolio was refinanced with an £80 million medium-term loan in December, the corporate bond portfolio began to be restored. At 31 December 2013, it had a value of £69.4 million, and remained an important cash management tool of the Group, earning a return on capital of 10.8% in the year. Finance costs of £23.7 million (2012: £25.6 million) were lower than last year due to non-cash items: favourable movements in the fair value of derivatives of £3.3 million (2012: adverse £1.5 million) reduced finance costs by £4.8 million, although this was mitigated by £1.8 million of foreign exchange variances reflecting sterling’s relative weakness to the euro and krona. The underlying interest cost, excluding these valuation movements, rose to £26.1 million (2012: £24.2 million). A full year of interest on the £65 million retail bond issued in September 2012 added £2.3 million to gross interest costs in 2013, and the secured notes issued in December 2013 added £0.3 million. These loans also contributed to the increase of £0.8 million in loan issue costs amortised in the year. However, 71% of our debt is at floating rates to take advantage of the low interest rate environment, and the falls in Libor and its European equivalents were the major contributors to the reduction in the cost of bank loans by £1.5 million compared to 2012. The majority of the share of loss of associates of £4.8 million (2012: profit of £5.8 million) was a provision of £4.0 million for the impairment of the carrying value of Bulgarian Land Development Plc, reflecting the difficult conditions likely to prevail in the Bulgarian residential holiday market. Once again this year the tax charge of 11.5% was significantly below the weighted average rate of the countries in which we do business (23.1%), primarily due to indexation allowances available on United Kingdom properties. DISTRIBUTIONS TO SHAREHOLDERS In April 2013, £8.6 million was distributed to shareholders by means of a tender offer buy-back of 1 in 49 shares at 970 pence per share. In September, a further £5.0 million was distributed by means of a tender offer buy-back of 1 in 116 shares at 1,360 pence per share, and a proposed tender offer buy-back of 1 in 66 shares at 1,495 pence per share to return £10.0 million will be put to shareholders at the Annual General Meeting in April 2014. This represents a 14.4% uplift in distribution per share over the equivalent distribution last year. EPRA NET ASSET VALUE At 31 December 2013, EPRA net assets per share (a diluted measure which highlights the fair value of the business on a long-term basis) were 1,268.4 pence (2012: 1,154.4 pence), a rise of 9.9%, or 113.7 pence per share. The main reason for the increase was profit after tax which added 80.1 pence. The reclassification of Catena AB added 26.3 pence, gains on the disposal of financial assets such as corporate bonds a further 6.6 pence, and exchange rate variances provided 10.4 pence per share. The fair value movement on investment properties added a further 17.3 pence, which was more than cancelled by investment property acquisition costs of 17.9 pence per share, and the write down of the carrying value of BLD reduced EPRA net assets per share by 9.1 pence.
CASH FLOW, NET DEBT AND GEARING At 31 December 2013, the Group’s cash balances of £129.8 million were £32.2 million higher than twelve months previously. Cash from operations and interest receivable added £47.0 million, of which £13.7 million was distributed to shareholders. Net new loans of £102.1 million were taken out to finance in part the £165.3 million of property acquisitions, at around 60% loan-to-value. Share issues raised £20.4 million and proceeds from property disposals a further £17.6 million, whilst capital expenditure on developments and refurbishments absorbed £34.6 million. The net sale of corporate bonds added £62.3 million, and sundry other income absorbed cash of £3.2 million. Gross debt rose by £110.1 million to £800.3 million largely through the £80.0 million secured notes issued to finance Neo, and the net increase in short-term borrowings. New bank loans of £24.1 million were taken out for the other acquisitions, whilst loans of £26.8 million were repaid, mainly on disposals. Bank loans of £59.9 million were refinanced at their approximate repayment values and £14.6 million of amortisation was paid on borrowings in the year. At 31 December 2013 the weighted average unexpired term of the Group’s debt was 4.2 years. Balance sheet loan to value (net debt to gross assets less cash) remained stable at 52.8% (2012: 52.5%), and the weighted average loan-to-value on borrowings against properties was a comfortable 56.3% (2012: 58.8%). Adjusted solidity was 39.9% (2012: 41.1%). The weighted average cost of debt at 31 December 2013 was 3.64%, marginally lower than 3.67% twelve months earlier and it remains one of the lowest in the property sector. The fall was primarily caused by the effect of a fall in short-term interest rates more than compensating for the £80 million loan taken out at 4.17% to finance the Neo portfolio. The cost of new bank financing has fallen in the past few months, particularly in the UK, but remains more expensive than when existing loans were taken out, so refinancing them as they fall due will probably gradually increase the average cost of debt of the Group. In 2013, our low cost of debt led to recurring interest cover of a comfortable 3.2 times (2012: 3.5 times). FINANCING STRATEGY The Group’s strategy is to hold its investment properties predominantly in single-purpose vehicles financed primarily by non-recourse bank debt in the currency used to purchase the asset. In this way credit and liquidity risk can most easily be managed, around 75% of the Group’s exposure to foreign currency is naturally hedged, and the most efficient use can be made of the Group’s assets. Bank debt ordinarily attracts covenants on loan-to-value and on interest and debt service cover. None of the Group’s debt was in breach of covenants at 31 December 2013. The Group had 59 loans across the portfolio from 22 banks, plus a debenture, a zero-coupon loan, secured notes and two unsecured bonds. None of the loans at 31 December 2013 had been securitised by any lender, and the Group had no exposure to the CMBS market.
To the extent that Group borrowings are not at fixed rates, the Group’s exposure to interest rate risk is mitigated by the use of financial derivatives, particularly interest rate caps and swaps. The Board believes that interest rates are likely to remain low longer than the forward interest curve would imply, and, therefore, its policy is to allow a majority of debt to remain subject to floating rates. To mitigate the risk of interest rates increasing more sharply than the Board expects, the Group enters into interest rate caps. At 31 December 2013, 29% of the Group’s borrowings were at fixed rates or subject to interest rate swaps, 41% were subject to caps and 30% of debt costs were unhedged.
The Group’s financial derivatives – predominantly interest rate caps and interest rate swaps – are marked to market at each balance sheet date. At 31 December 2013 they were a net liability of £5.2 million (2012: £8.4 million). SHARE CAPITAL At 1 January 2013, there were 48,108,979 shares in issue, of which 4,803,103 were held as treasury shares. Shares were cancelled during the year under the distribution policy of tender offer buy-backs: in April, 883,793 shares were cancelled in exchange for £8.6 million distributed to shareholders, and in September, 368,293 shares were cancelled in exchange for a distribution of £5.0 million. In May 2013, 300,000 shares were issued from treasury shares on the exercise of share options, which raised £1.4 million, and, in November, 1,600,000 shares were issued from treasury shares, raising £19.0 million net of costs. Consequently, at 31 December 2013, 43,953,790 shares were listed on the London Stock Exchange, and 2,903,103 shares remained held in Treasury. In April 2014, the Directors intend to put to the Annual General Meeting of the Company a proposal to issue a tender offer to buy-back 1 in 66 shares at 1,495 pence per share. If approved by shareholders this could lead to the purchase and cancellation of 665,966 shares, and a distribution to shareholders of £10.0 million. TOTAL RETURNS TO SHAREHOLDERS In addition to the distributions and share cancellations associated with the tender offer buy-backs, shareholders benefited from a rise in the share price in the year from 765 pence on 31 December 2012 to 1,379 pence at 31 December 2013. Accordingly, the total shareholder return in 2013 was 80.3%. In the six years to 31 December 2013, our total shareholder return of 324.3%, which represented a compound annual return of 27.2%, was the best performance in the listed real estate sector. Since the Company listed on the London Stock Exchange, it has outperformed the FTSE Real Estate and FTSE All Share indices, as set out in the graph opposite. The graph includes dividend payments made by other companies; since 1998, CLS had not made dividend payments to shareholders, but instead has made capital distributions through tender offer buy-backs, none of which has been accounted for in the graph.
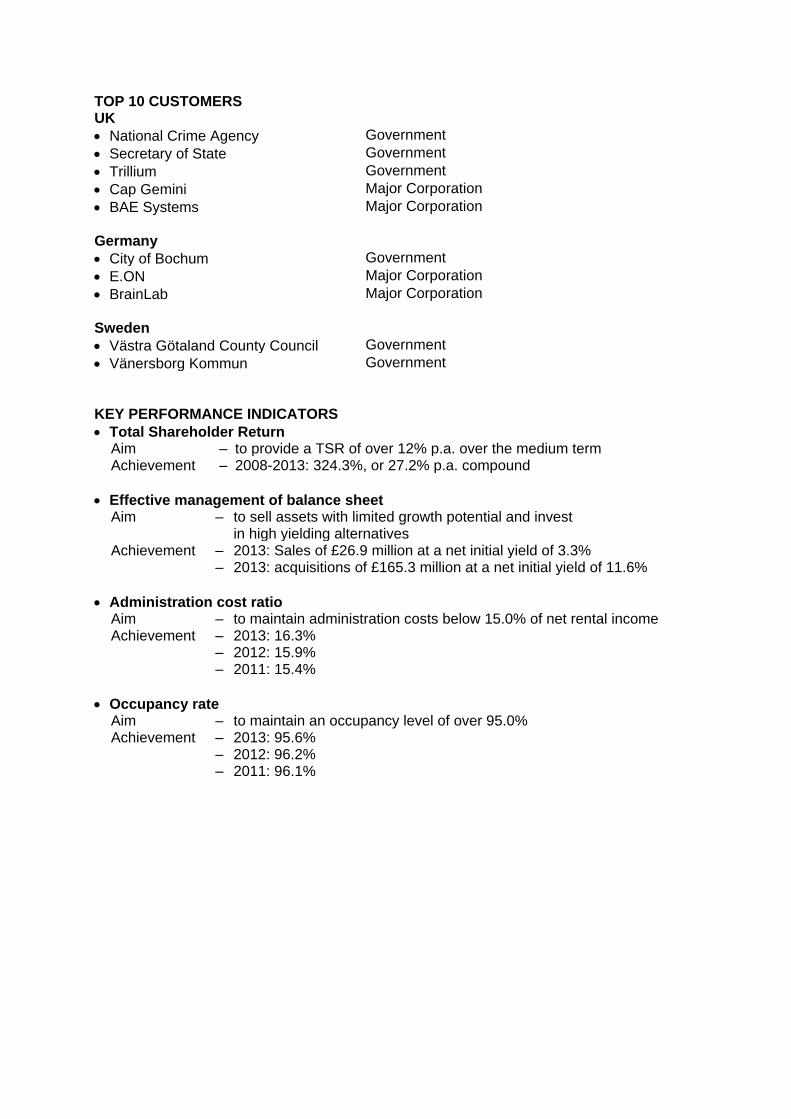
TOP 10 CUSTOMERS UK
National Crime Agency Government
Secretary of State Government
Trillium Government
Cap Gemini Major Corporation
BAE Systems Major Corporation
Germany
City of Bochum Government
E.ON Major Corporation
BrainLab Major Corporation
Sweden
Västra Götaland County Council Government
Vänersborg Kommun Government
KEY PERFORMANCE INDICATORS
Total Shareholder Return Aim – to provide a TSR of over 12% p.a. over the medium term Achievement – 2008-2013: 324.3%, or 27.2% p.a. compound
Effective management of balance sheet Aim – to sell assets with limited growth potential and invest
in high yielding alternatives Achievement – 2013: Sales of £26.9 million at a net initial yield of 3.3% – 2013: acquisitions of £165.3 million at a net initial yield of 11.6%
Administration cost ratio Aim – to maintain administration costs below 15.0% of net rental income Achievement – 2013: 16.3% – 2012: 15.9% – 2011: 15.4%
Occupancy rate Aim – to maintain an occupancy level of over 95.0% Achievement – 2013: 95.6% – 2012: 96.2% – 2011: 96.1%
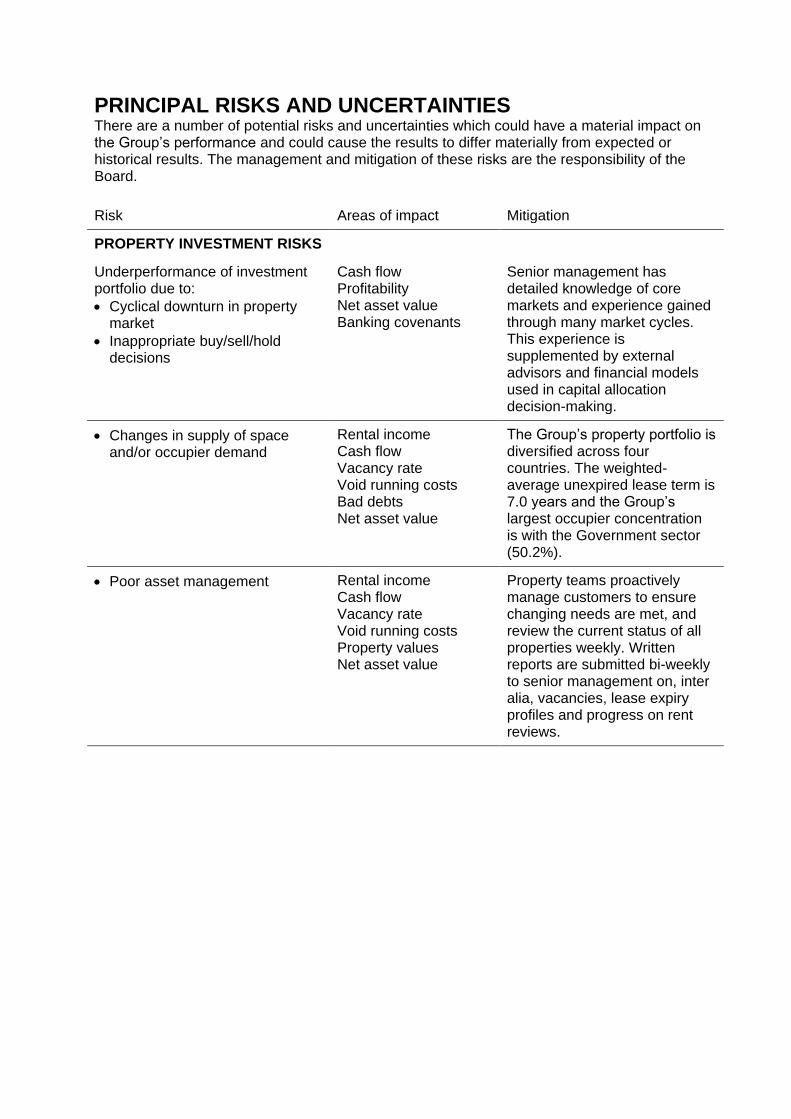
PRINCIPAL RISKS AND UNCERTAINTIES There are a number of potential risks and uncertainties which could have a material impact on the Group’s performance and could cause the results to differ materially from expected or historical results. The management and mitigation of these risks are the responsibility of the Board.
Risk Areas of impact Mitigation
PROPERTY INVESTMENT RISKS
Underperformance of investment portfolio due to:
Cyclical downturn in property market
Inappropriate buy/sell/hold decisions
Cash flow Profitability Net asset value Banking covenants
Senior management has detailed knowledge of core markets and experience gained through many market cycles. This experience is supplemented by external advisors and financial models used in capital allocation decision-making.
Changes in supply of space and/or occupier demand
Rental income Cash flow Vacancy rate Void running costs Bad debts Net asset value
The Group’s property portfolio is diversified across four countries. The weighted-average unexpired lease term is 7.0 years and the Group’s largest occupier concentration is with the Government sector (50.2%).
Poor asset management Rental income Cash flow Vacancy rate Void running costs Property values Net asset value
Property teams proactively manage customers to ensure changing needs are met, and review the current status of all properties weekly. Written reports are submitted bi-weekly to senior management on, inter alia, vacancies, lease expiry profiles and progress on rent reviews.
Risk Areas of impact Mitigation
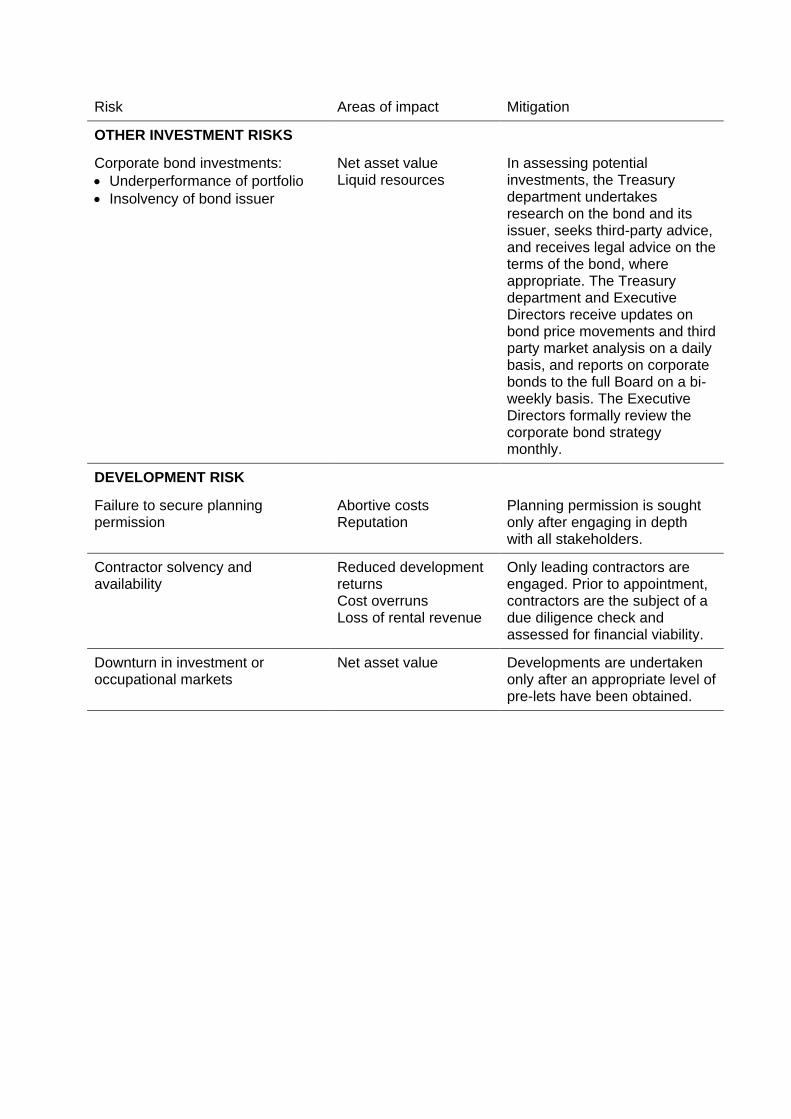
OTHER INVESTMENT RISKS
Corporate bond investments:
Underperformance of portfolio
Insolvency of bond issuer
Net asset value Liquid resources
In assessing potential investments, the Treasury department undertakes research on the bond and its issuer, seeks third-party advice, and receives legal advice on the terms of the bond, where appropriate. The Treasury department and Executive Directors receive updates on bond price movements and third party market analysis on a daily basis, and reports on corporate bonds to the full Board on a bi-weekly basis. The Executive Directors formally review the corporate bond strategy monthly.
DEVELOPMENT RISK
Failure to secure planning permission
Abortive costs Reputation
Planning permission is sought only after engaging in depth with all stakeholders.
Contractor solvency and availability
Reduced development returns Cost overruns Loss of rental revenue
Only leading contractors are engaged. Prior to appointment, contractors are the subject of a due diligence check and assessed for financial viability.
Downturn in investment or occupational markets
Net asset value Developments are undertaken only after an appropriate level of pre-lets have been obtained.
Risk Areas of impact Mitigation
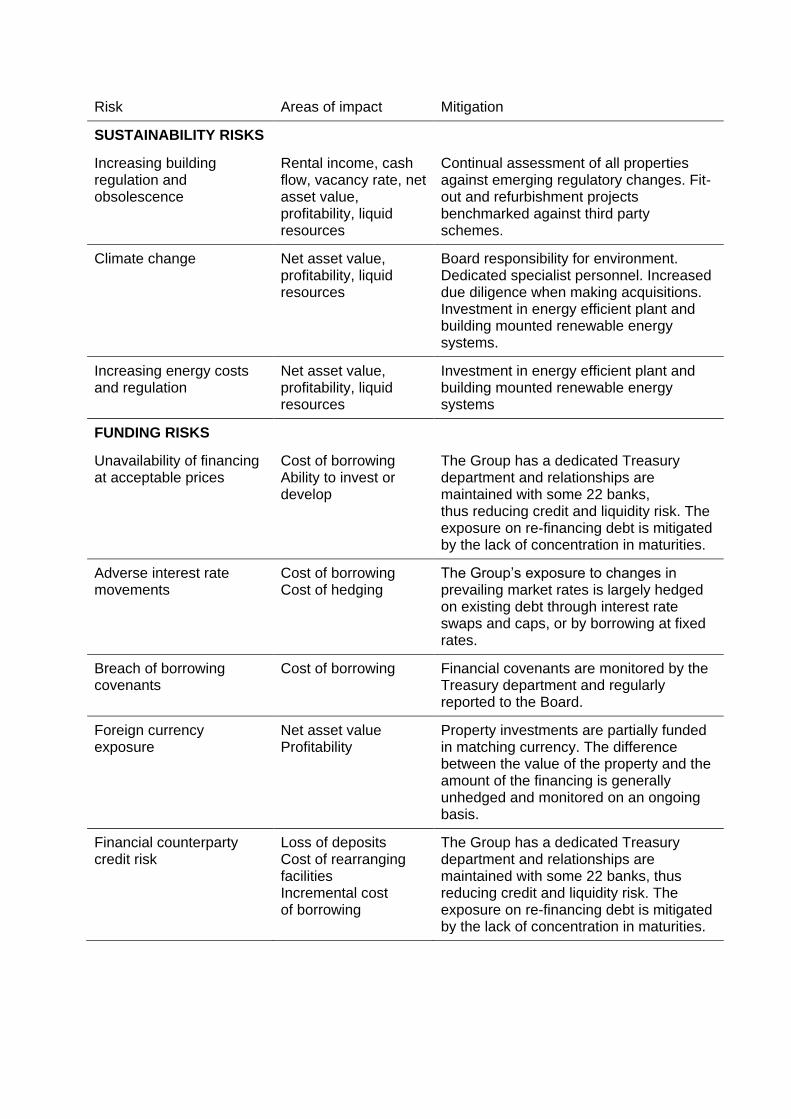
SUSTAINABILITY RISKS
Increasing building regulation and obsolescence
Rental income, cash flow, vacancy rate, net asset value, profitability, liquid resources
Continual assessment of all properties against emerging regulatory changes. Fit-out and refurbishment projects benchmarked against third party schemes.
Climate change Net asset value, profitability, liquid resources
Board responsibility for environment. Dedicated specialist personnel. Increased due diligence when making acquisitions. Investment in energy efficient plant and building mounted renewable energy systems.
Increasing energy costs and regulation
Net asset value, profitability, liquid resources
Investment in energy efficient plant and building mounted renewable energy systems
FUNDING RISKS
Unavailability of financing at acceptable prices
Cost of borrowing Ability to invest or develop
The Group has a dedicated Treasury department and relationships are maintained with some 22 banks, thus reducing credit and liquidity risk. The exposure on re-financing debt is mitigated by the lack of concentration in maturities.
Adverse interest rate movements
Cost of borrowing Cost of hedging
The Group’s exposure to changes in prevailing market rates is largely hedged on existing debt through interest rate swaps and caps, or by borrowing at fixed rates.
Breach of borrowing covenants
Cost of borrowing Financial covenants are monitored by the Treasury department and regularly reported to the Board.
Foreign currency exposure
Net asset value Profitability
Property investments are partially funded in matching currency. The difference between the value of the property and the amount of the financing is generally unhedged and monitored on an ongoing basis.
Financial counterparty credit risk
Loss of deposits Cost of rearranging facilities Incremental cost of borrowing
The Group has a dedicated Treasury department and relationships are maintained with some 22 banks, thus reducing credit and liquidity risk. The exposure on re-financing debt is mitigated by the lack of concentration in maturities.
Risk Areas of impact Mitigation
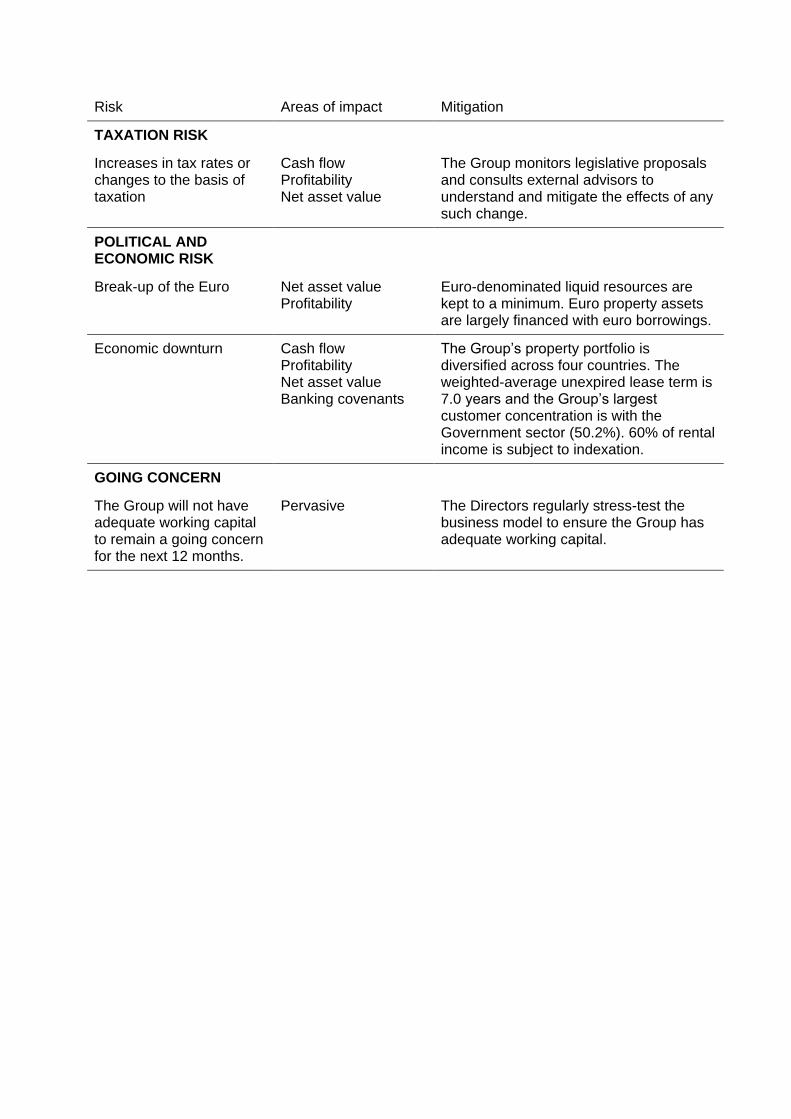
TAXATION RISK
Increases in tax rates or changes to the basis of taxation
Cash flow Profitability Net asset value
The Group monitors legislative proposals and consults external advisors to understand and mitigate the effects of any such change.
POLITICAL AND ECONOMIC RISK
Break-up of the Euro Net asset value Profitability
Euro-denominated liquid resources are kept to a minimum. Euro property assets are largely financed with euro borrowings.
Economic downturn Cash flow Profitability Net asset value Banking covenants
The Group’s property portfolio is diversified across four countries. The weighted-average unexpired lease term is 7.0 years and the Group’s largest customer concentration is with the Government sector (50.2%). 60% of rental income is subject to indexation.
GOING CONCERN
The Group will not have adequate working capital to remain a going concern for the next 12 months.
Pervasive The Directors regularly stress-test the business model to ensure the Group has adequate working capital.

PROPERTY PORTFOLIO RENTAL DATA Gross
rental income for the
year £m
Net rental income for the
year £m
Lettable space sq m
Contracted rent at
year end £m
ERV at year end £m
Contracted rent subject
to indexation £m
Vacancy rate at
year end %
United Kingdom 34.7 33.9 249,644 45.1 40.7 11.8 2.4% France 19.2 19.3 96,437 18.0 18.3 17.9 10.6% Germany 15.5 15.3 152,315 16.2 16.0 15.6 3.5% Sweden 6.6 4.6 45,354 6.3 5.6 6.3 1.7%
Total Portfolio 76.0 73.1 543,750 85.6 80.6 51.6 4.4%
Note: a further £3.8 million of United Kingdom contracted rent will be subject to annual indexation from June 2015. VALUATION DATA Valuation movement
in the year
Market
value of
property £m
Underlying £m
Foreign exchange
£m
EPRA net
initial yield
(1)
%
EPRA topped up net initial
yield(2)
%
Reversion %
Over-rented
%
True equivalent
yield %
United Kingdom
617.8 11.5 – 7.1% 7.2% 6.8% 19.1% 7.2%
France 240.6 (9.2) 5.5 6.6% 6.8% 1.2% 11.1% 7.0% Germany 214.4 (0.5) 4.3 6.9% 7.0% 1.9% 6.7% 6.1% Sweden 60.1 (1.5) (0.5) 8.4% 8.4% 2.5% 15.2% 7.3%
Total Portfolio
1,132.9 0.3 9.3 7.0% 7.2% 4.4% 14.8%
(1) Based on rent passing less non-recoverable service charges and after adding purchasers’
costs to investment property values; if based on investment property values before adding purchaser’s costs, net initial yield would be 7.4%
(2) Based on contracted rent less non-recoverable service charges and after adding purchasers’ costs to investment property values
LEASE DATA Average lease
length Passing rent of leases expiring in: ERV of leases expiring in: To
break years
To expiry years
Year 1 £m
Year 2 £m
Year 3 to 5
£m
After year 5
£m Year 1
£m Year 2
£m
Year 3 to 5
£m
After year 5
£m
United Kingdom
6.7 8.0 2.2 2.4 9.1 31.3 2.1 1.8 11.2 25.6
France 2.5 4.8 2.1 1.5 7.6 6.8 1.7 1.3 8.8 6.5 Germany 8.2 8.3 0.9 1.1 5.4 8.8 0.8 1.2 5.7 8.3 Sweden 3.4 3.4 – 4.6 0.4 1.4 – 3.8 0.4 1.4
Total Portfolio
5.8 7.0 5.2 9.6 22.5 48.3 4.6 8.1 26.1 41.8

STATEMENT OF DIRECTORS’ RESPONSIBILITIES The Responsibility Statement has been prepared in connection with the Company's full Annual Report for the year ended 31 December 2013. Certain parts of the Annual Report are not included in this announcement. We confirm to the best of our knowledge that:
the financial statements, prepared in accordance with the relevant financial reporting framework, give a true and fair view of the assets, liabilities, financial position and profit of the Company and the undertakings included in the consolidation as a whole;
the Strategic Review, which is incorporated into the Directors’ Report, includes a fair review of the development and performance of the business and the position of the Company and the undertakings included in the consolidation taken as a whole, together with a description of the principal risks and uncertainties they face; and
the Annual Report and financial statements, taken as a whole, are fair, balanced and understandable and provide the information necessary for shareholders to assess the Company's performance, business model and strategy.
This statement of responsibilities was approved by the Board on 4 March 2014. By order of the Board David Fuller BA FCIS Company Secretary 4 March 2014
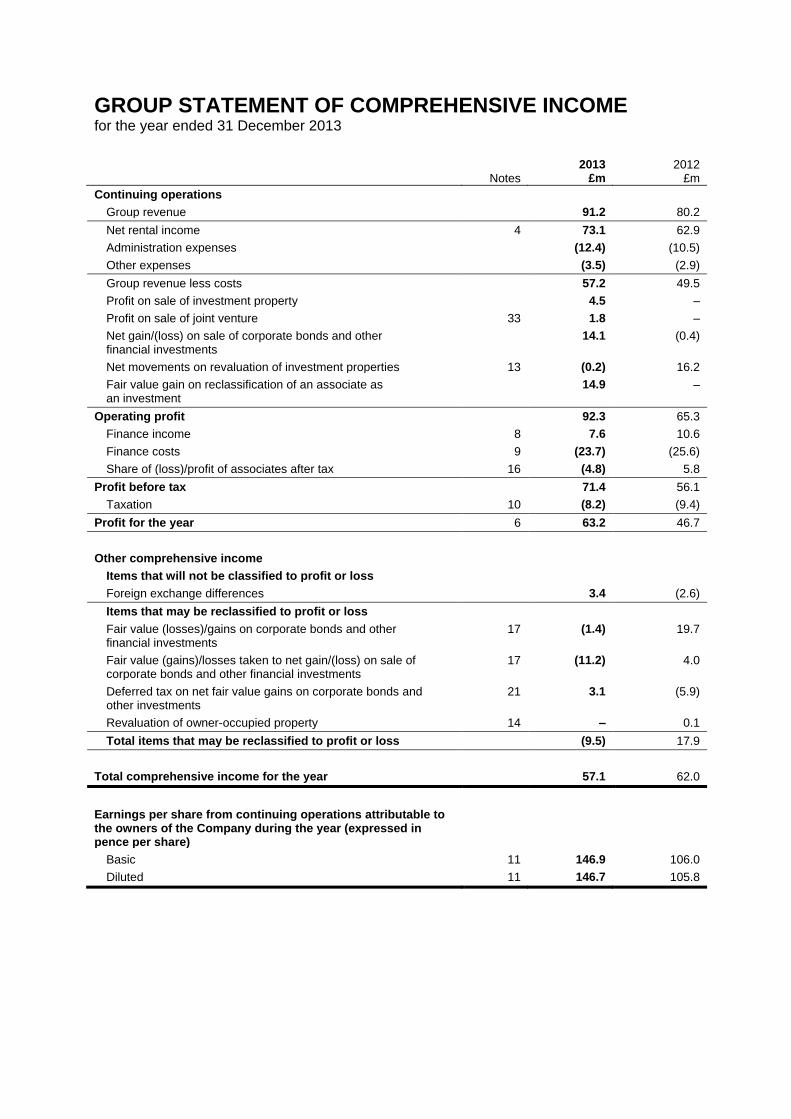
GROUP STATEMENT OF COMPREHENSIVE INCOME for the year ended 31 December 2013
Notes 2013
£m 2012
£m
Continuing operations
Group revenue 91.2 80.2
Net rental income 4 73.1 62.9
Administration expenses (12.4) (10.5)
Other expenses (3.5) (2.9)
Group revenue less costs 57.2 49.5
Profit on sale of investment property 4.5 –
Profit on sale of joint venture 33 1.8 –
Net gain/(loss) on sale of corporate bonds and other financial investments
14.1 (0.4)
Net movements on revaluation of investment properties 13 (0.2) 16.2
Fair value gain on reclassification of an associate as an investment
14.9 –
Operating profit 92.3 65.3
Finance income 8 7.6 10.6
Finance costs 9 (23.7) (25.6)
Share of (loss)/profit of associates after tax 16 (4.8) 5.8
Profit before tax 71.4 56.1
Taxation 10 (8.2) (9.4)
Profit for the year 6 63.2 46.7
Other comprehensive income
Items that will not be classified to profit or loss
Foreign exchange differences 3.4 (2.6)
Items that may be reclassified to profit or loss
Fair value (losses)/gains on corporate bonds and other financial investments
17 (1.4) 19.7
Fair value (gains)/losses taken to net gain/(loss) on sale of corporate bonds and other financial investments
17 (11.2) 4.0
Deferred tax on net fair value gains on corporate bonds and other investments
21 3.1 (5.9)
Revaluation of owner-occupied property 14 – 0.1
Total items that may be reclassified to profit or loss (9.5) 17.9
Total comprehensive income for the year 57.1 62.0
Earnings per share from continuing operations attributable to the owners of the Company during the year (expressed in pence per share)
Basic 11 146.9 106.0
Diluted 11 146.7 105.8
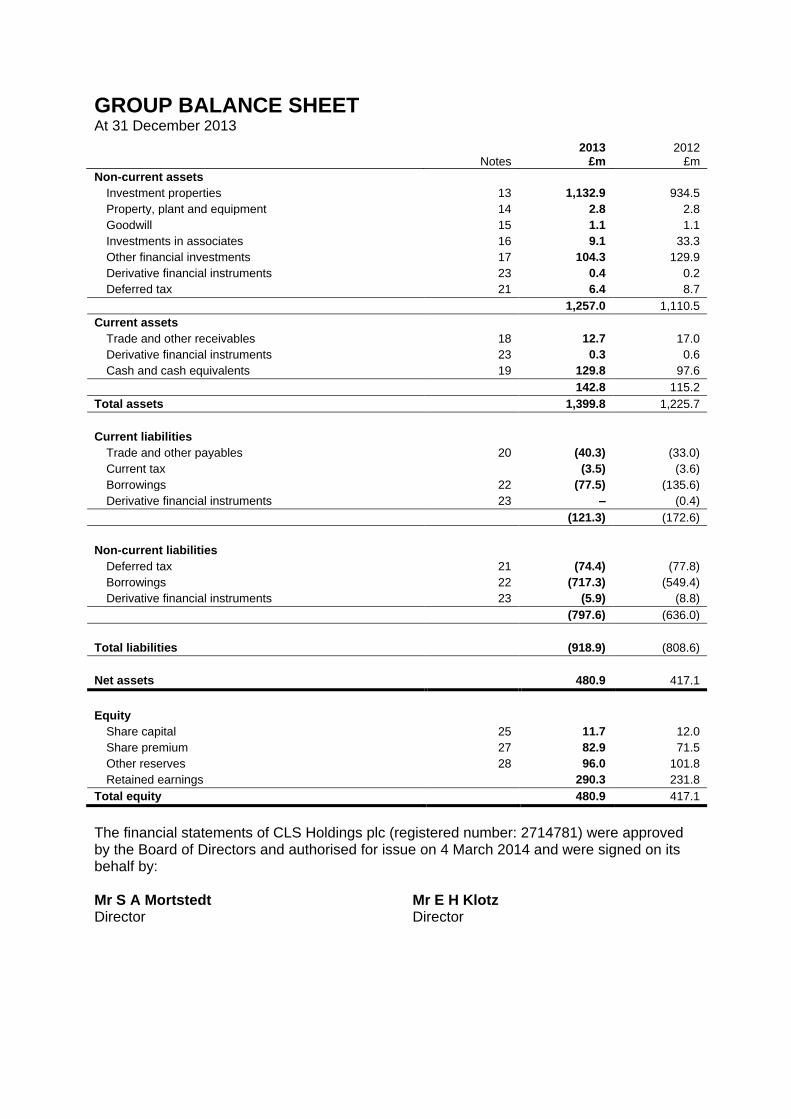
GROUP BALANCE SHEET At 31 December 2013
Notes 2013 £m
2012 £m
Non-current assets
Investment properties 13 1,132.9 934.5
Property, plant and equipment 14 2.8 2.8
Goodwill 15 1.1 1.1
Investments in associates 16 9.1 33.3
Other financial investments 17 104.3 129.9
Derivative financial instruments 23 0.4 0.2
Deferred tax 21 6.4 8.7
1,257.0 1,110.5
Current assets
Trade and other receivables 18 12.7 17.0
Derivative financial instruments 23 0.3 0.6
Cash and cash equivalents 19 129.8 97.6
142.8 115.2
Total assets 1,399.8 1,225.7
Current liabilities
Trade and other payables 20 (40.3) (33.0)
Current tax (3.5) (3.6)
Borrowings 22 (77.5) (135.6)
Derivative financial instruments 23 – (0.4)
(121.3) (172.6)
Non-current liabilities
Deferred tax 21 (74.4) (77.8)
Borrowings 22 (717.3) (549.4)
Derivative financial instruments 23 (5.9) (8.8)
(797.6) (636.0)
Total liabilities (918.9) (808.6)
Net assets 480.9 417.1
Equity
Share capital 25 11.7 12.0
Share premium 27 82.9 71.5
Other reserves 28 96.0 101.8
Retained earnings 290.3 231.8
Total equity 480.9 417.1
The financial statements of CLS Holdings plc (registered number: 2714781) were approved by the Board of Directors and authorised for issue on 4 March 2014 and were signed on its behalf by: Mr S A Mortstedt Director
Mr E H Klotz Director
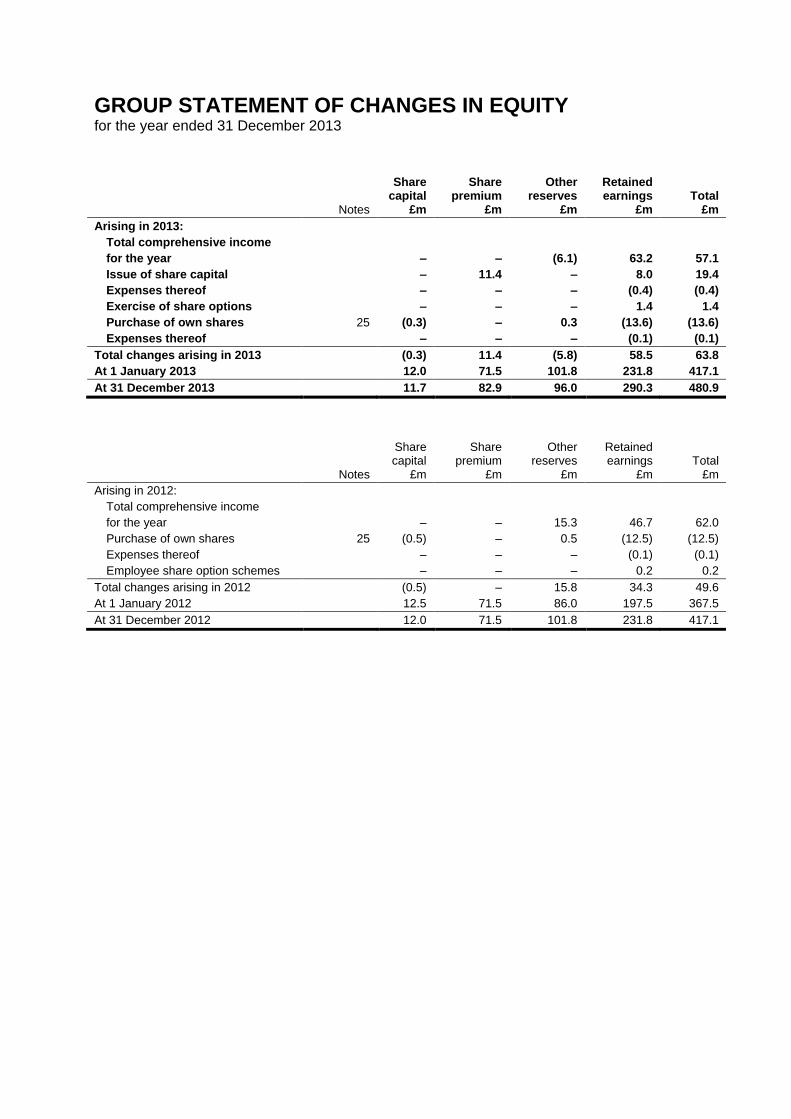
GROUP STATEMENT OF CHANGES IN EQUITY for the year ended 31 December 2013
Notes
Share capital
£m
Share premium
£m
Other reserves
£m
Retained earnings
£m Total
£m
Arising in 2013:
Total comprehensive income
for the year – – (6.1) 63.2 57.1
Issue of share capital – 11.4 – 8.0 19.4
Expenses thereof – – – (0.4) (0.4)
Exercise of share options – – – 1.4 1.4
Purchase of own shares 25 (0.3) – 0.3 (13.6) (13.6)
Expenses thereof – – – (0.1) (0.1)
Total changes arising in 2013 (0.3) 11.4 (5.8) 58.5 63.8
At 1 January 2013 12.0 71.5 101.8 231.8 417.1
At 31 December 2013 11.7 82.9 96.0 290.3 480.9
Notes
Share capital
£m
Share premium
£m
Other reserves
£m
Retained earnings
£m Total
£m
Arising in 2012:
Total comprehensive income
for the year – – 15.3 46.7 62.0
Purchase of own shares 25 (0.5) – 0.5 (12.5) (12.5)
Expenses thereof – – – (0.1) (0.1)
Employee share option schemes – – – 0.2 0.2
Total changes arising in 2012 (0.5) – 15.8 34.3 49.6
At 1 January 2012 12.5 71.5 86.0 197.5 367.5
At 31 December 2012 12.0 71.5 101.8 231.8 417.1
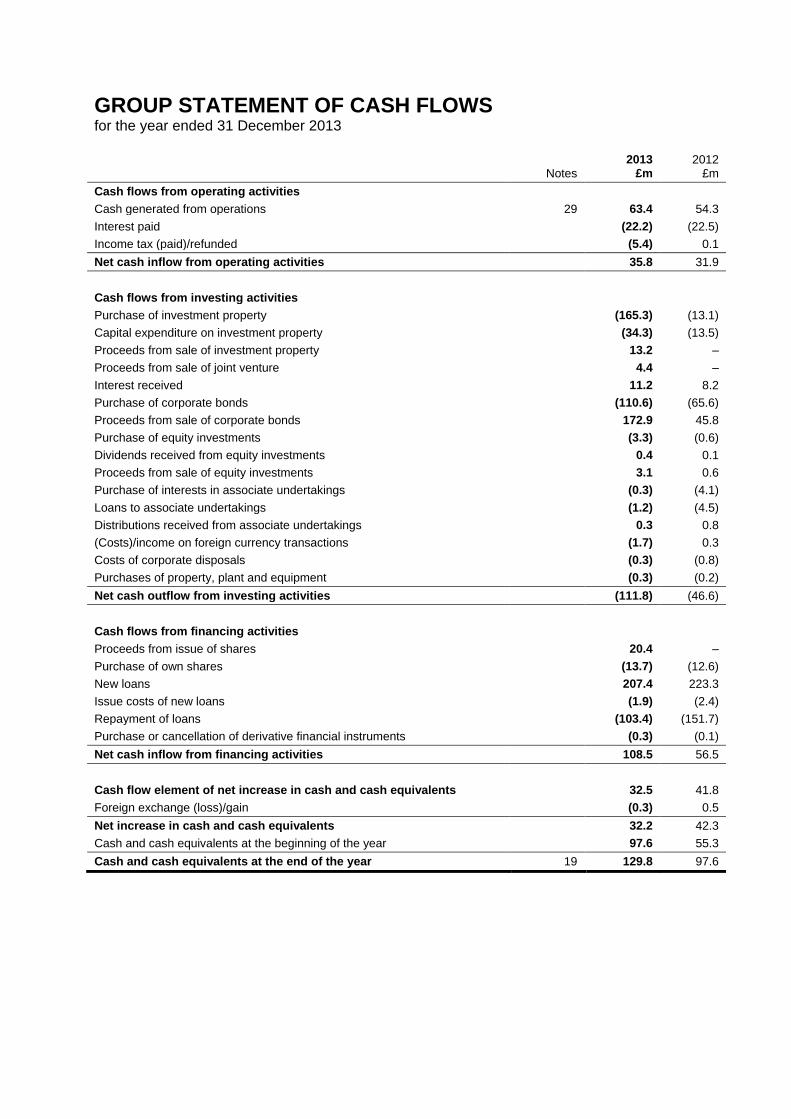
GROUP STATEMENT OF CASH FLOWS for the year ended 31 December 2013
Notes 2013
£m 2012
£m
Cash flows from operating activities
Cash generated from operations 29 63.4 54.3
Interest paid (22.2) (22.5)
Income tax (paid)/refunded (5.4) 0.1
Net cash inflow from operating activities 35.8 31.9
Cash flows from investing activities
Purchase of investment property (165.3) (13.1)
Capital expenditure on investment property (34.3) (13.5)
Proceeds from sale of investment property 13.2 –
Proceeds from sale of joint venture 4.4 –
Interest received 11.2 8.2
Purchase of corporate bonds (110.6) (65.6)
Proceeds from sale of corporate bonds 172.9 45.8
Purchase of equity investments (3.3) (0.6)
Dividends received from equity investments 0.4 0.1
Proceeds from sale of equity investments 3.1 0.6
Purchase of interests in associate undertakings (0.3) (4.1)
Loans to associate undertakings (1.2) (4.5)
Distributions received from associate undertakings 0.3 0.8
(Costs)/income on foreign currency transactions (1.7) 0.3
Costs of corporate disposals (0.3) (0.8)
Purchases of property, plant and equipment (0.3) (0.2)
Net cash outflow from investing activities (111.8) (46.6)
Cash flows from financing activities
Proceeds from issue of shares 20.4 –
Purchase of own shares (13.7) (12.6)
New loans 207.4 223.3
Issue costs of new loans (1.9) (2.4)
Repayment of loans (103.4) (151.7)
Purchase or cancellation of derivative financial instruments (0.3) (0.1)
Net cash inflow from financing activities 108.5 56.5
Cash flow element of net increase in cash and cash equivalents 32.5 41.8
Foreign exchange (loss)/gain (0.3) 0.5
Net increase in cash and cash equivalents 32.2 42.3
Cash and cash equivalents at the beginning of the year 97.6 55.3
Cash and cash equivalents at the end of the year 19 129.8 97.6
NOTES TO THE GROUP FINANCIAL STATEMENTS 31 December 2013 1 GENERAL INFORMATION
CLS Holdings plc (the “Company”) and its subsidiaries (together “CLS Holdings” or the “Group”) is an investment property group which is principally involved in the investment, management and development of commercial properties, and in other investments. The Group’s principal operations are carried out in London, France, Germany and Sweden. The Company is registered in the UK, registration number 2714781, with its registered address at 86 Bondway, London, SW8 1SF. The Company is listed on the London Stock Exchange. The annual financial report (produced in accordance with the Disclosure and Transparency Rules) can be found on the Company’s website www.clsholdings.com. The 2013 Annual Report and Accounts will be posted to shareholders on 14 March 2014 and will also be available on the Company’s website. The financial information contained in this announcement has been prepared on the basis of the accounting policies set out in the statutory accounts for the year ended 31 December 2013. Whilst the financial information included in this announcement has been computed in accordance with International Financial Reporting Standards (IFRS), as adopted by the European Union, this announcement does not itself contain sufficient information to comply with IFRS. The financial information does not constitute the Company's statutory accounts for the years ended 31 December 2013 or 2012, but is derived from those accounts. Those accounts give a balanced, true and fair view of the assets, liabilities, financial position and profit and loss of the Company and the undertakings included in the consolidation taken as a whole. Statutory accounts for 2012 have been delivered to the Registrar of Companies and those for 2013 will be delivered following the Company's Annual General Meeting. The auditors have reported on those accounts and the auditors' reports on both the 2012 and 2013 accounts were unqualified; did not draw attention to any matters by way of emphasis; and did not contain statements under s498(2) or (3) Companies Act 2006 or preceding legislation. Going Concern The Group’s business activities, and the factors likely to affect its future development and performance, are set out in the Strategic Review. The financial position of the Group, its liquidity position and borrowing facilities are described in the Strategic Review. The Directors regularly stress-test the business model to ensure that the Group has adequate working capital and have reviewed the current and projected financial positions of the Group, taking into account the repayment profile of the Group’s loan portfolio, and making reasonable assumptions about future trading performance. The Directors have a reasonable expectation that the Company and the Group have adequate resources to continue in operational existence for the foreseeable future and, therefore, they continue to adopt the going concern basis in preparing the annual report and accounts.
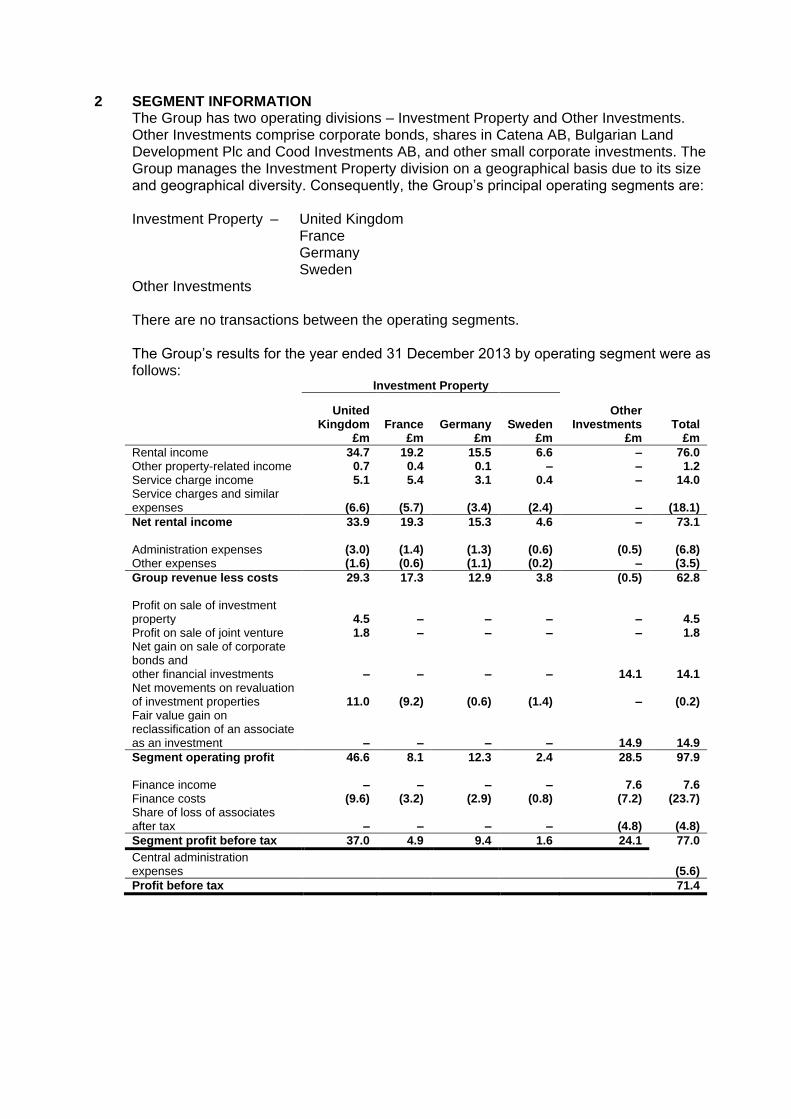
2 SEGMENT INFORMATION The Group has two operating divisions – Investment Property and Other Investments. Other Investments comprise corporate bonds, shares in Catena AB, Bulgarian Land Development Plc and Cood Investments AB, and other small corporate investments. The Group manages the Investment Property division on a geographical basis due to its size and geographical diversity. Consequently, the Group’s principal operating segments are: Investment Property – United Kingdom France Germany Sweden Other Investments There are no transactions between the operating segments. The Group’s results for the year ended 31 December 2013 by operating segment were as follows: Investment Property
United
Kingdom £m
France £m
Germany £m
Sweden £m
Other Investments
£m Total
£m
Rental income 34.7 19.2 15.5 6.6 – 76.0 Other property-related income 0.7 0.4 0.1 – – 1.2 Service charge income 5.1 5.4 3.1 0.4 – 14.0 Service charges and similar expenses (6.6) (5.7) (3.4) (2.4) – (18.1)
Net rental income 33.9 19.3 15.3 4.6 – 73.1 Administration expenses (3.0) (1.4) (1.3) (0.6) (0.5) (6.8) Other expenses (1.6) (0.6) (1.1) (0.2) – (3.5)
Group revenue less costs 29.3 17.3 12.9 3.8 (0.5) 62.8 Profit on sale of investment property 4.5 – – – – 4.5 Profit on sale of joint venture 1.8 – – – – 1.8 Net gain on sale of corporate bonds and other financial investments – – – – 14.1 14.1 Net movements on revaluation of investment properties 11.0 (9.2) (0.6) (1.4) – (0.2) Fair value gain on reclassification of an associate as an investment – – – – 14.9 14.9
Segment operating profit 46.6 8.1 12.3 2.4 28.5 97.9 Finance income – – – – 7.6 7.6 Finance costs (9.6) (3.2) (2.9) (0.8) (7.2) (23.7) Share of loss of associates after tax – – – – (4.8) (4.8)
Segment profit before tax 37.0 4.9 9.4 1.6 24.1 77.0
Central administration expenses (5.6)
Profit before tax 71.4
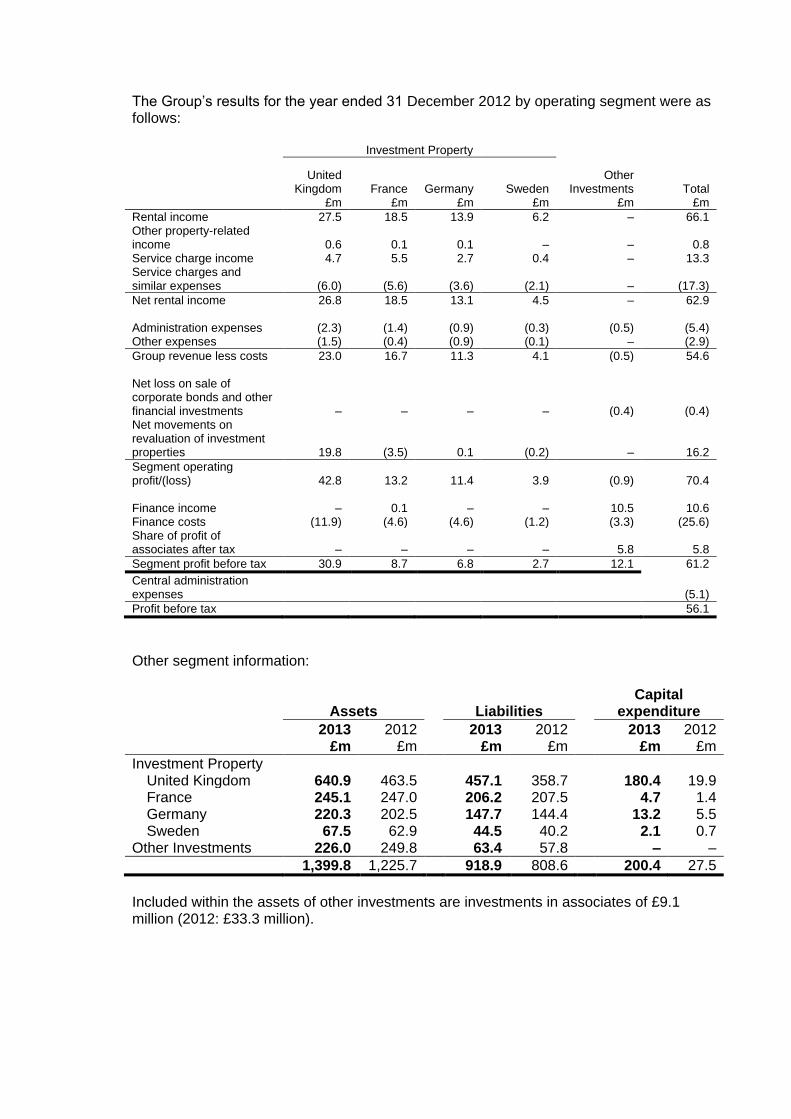
The Group’s results for the year ended 31 December 2012 by operating segment were as follows:
Investment Property
United
Kingdom £m
France £m
Germany £m
Sweden £m
Other Investments
£m Total
£m
Rental income 27.5 18.5 13.9 6.2 – 66.1 Other property-related income 0.6 0.1 0.1 – – 0.8 Service charge income 4.7 5.5 2.7 0.4 – 13.3 Service charges and similar expenses (6.0) (5.6) (3.6) (2.1) – (17.3)
Net rental income 26.8 18.5 13.1 4.5 – 62.9 Administration expenses (2.3) (1.4) (0.9) (0.3) (0.5) (5.4) Other expenses (1.5) (0.4) (0.9) (0.1) – (2.9)
Group revenue less costs 23.0 16.7 11.3 4.1 (0.5) 54.6 Net loss on sale of corporate bonds and other financial investments – – – – (0.4) (0.4) Net movements on revaluation of investment properties 19.8 (3.5) 0.1 (0.2) – 16.2
Segment operating profit/(loss) 42.8 13.2 11.4 3.9 (0.9) 70.4 Finance income – 0.1 – – 10.5 10.6 Finance costs (11.9) (4.6) (4.6) (1.2) (3.3) (25.6) Share of profit of associates after tax – – – – 5.8 5.8
Segment profit before tax 30.9 8.7 6.8 2.7 12.1 61.2
Central administration expenses (5.1)
Profit before tax 56.1
Other segment information:
Assets
Liabilities
Capital expenditure
2013 £m
2012 £m
2013 £m
2012 £m
2013 £m
2012 £m
Investment Property United Kingdom 640.9 463.5 457.1 358.7 180.4 19.9 France 245.1 247.0 206.2 207.5 4.7 1.4 Germany 220.3 202.5 147.7 144.4 13.2 5.5 Sweden 67.5 62.9 44.5 40.2 2.1 0.7 Other Investments 226.0 249.8 63.4 57.8 – –
1,399.8 1,225.7 918.9 808.6 200.4 27.5
Included within the assets of other investments are investments in associates of £9.1 million (2012: £33.3 million).
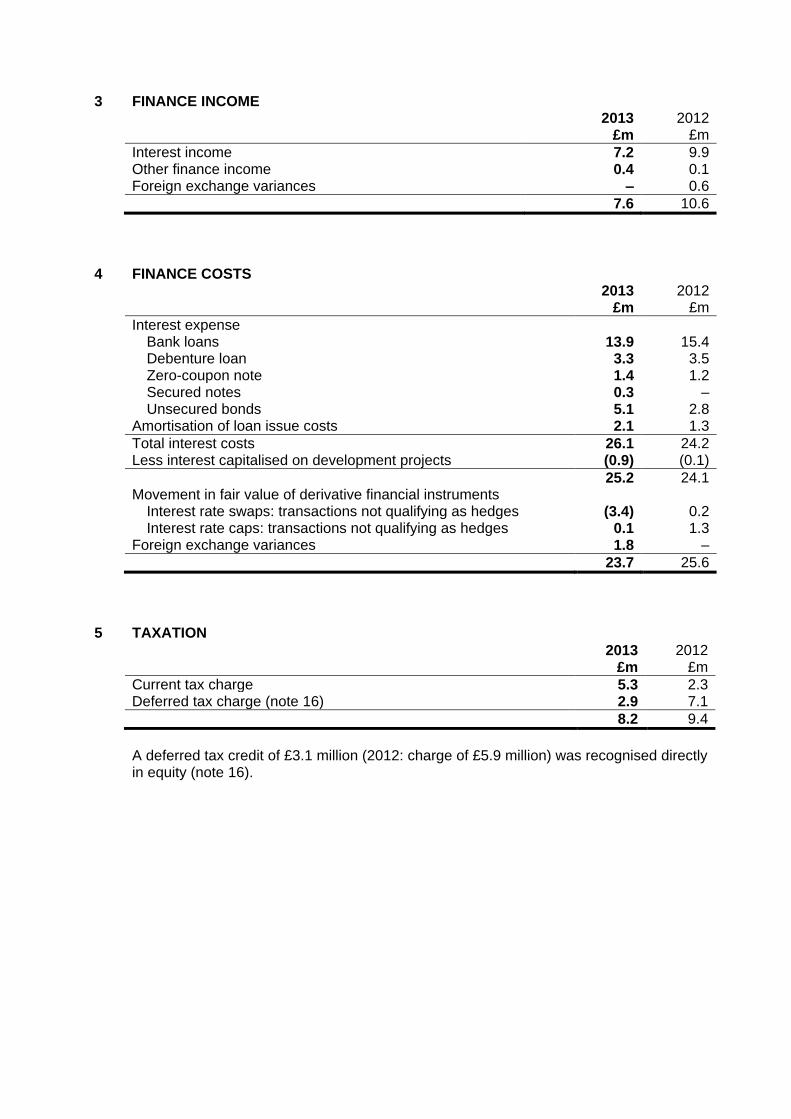
3 FINANCE INCOME 2013
£m 2012
£m
Interest income 7.2 9.9 Other finance income 0.4 0.1 Foreign exchange variances – 0.6
7.6 10.6
4 FINANCE COSTS 2013
£m 2012
£m
Interest expense Bank loans 13.9 15.4 Debenture loan 3.3 3.5 Zero-coupon note 1.4 1.2 Secured notes 0.3 – Unsecured bonds 5.1 2.8 Amortisation of loan issue costs 2.1 1.3
Total interest costs 26.1 24.2 Less interest capitalised on development projects (0.9) (0.1)
25.2 24.1 Movement in fair value of derivative financial instruments Interest rate swaps: transactions not qualifying as hedges (3.4) 0.2 Interest rate caps: transactions not qualifying as hedges 0.1 1.3 Foreign exchange variances 1.8 –
23.7 25.6
5 TAXATION 2013
£m 2012
£m
Current tax charge 5.3 2.3 Deferred tax charge (note 16) 2.9 7.1
8.2 9.4
A deferred tax credit of £3.1 million (2012: charge of £5.9 million) was recognised directly in equity (note 16).
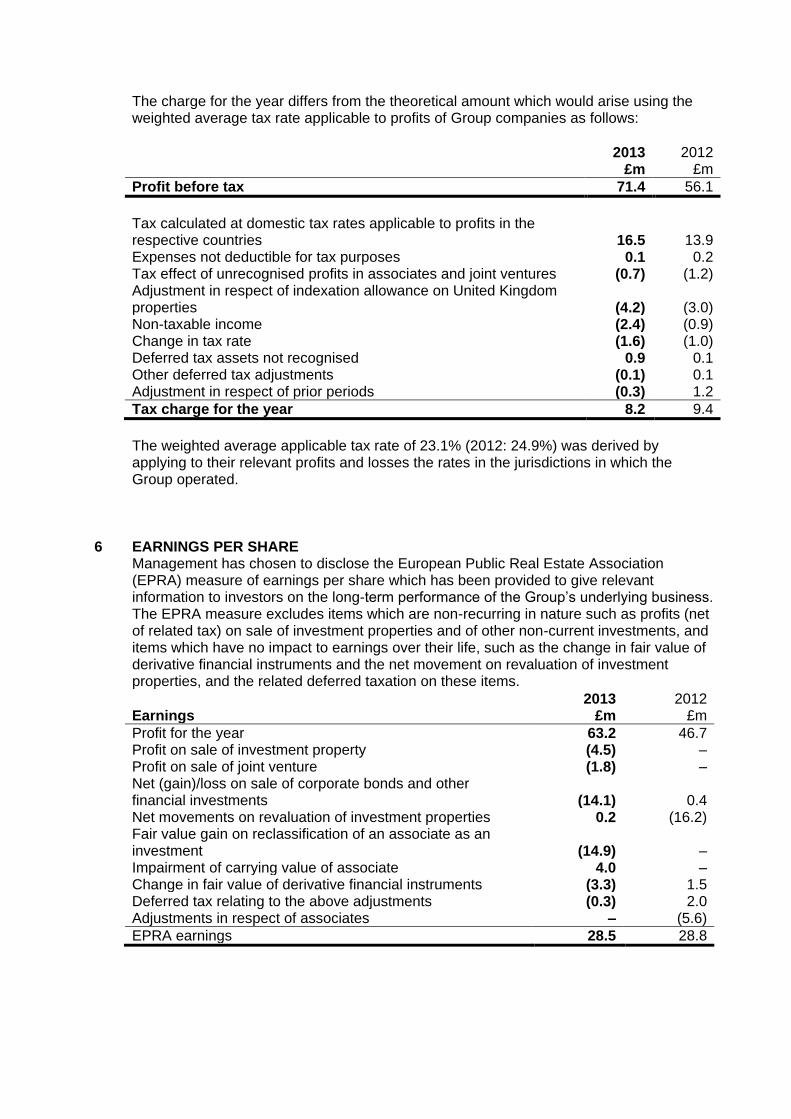
The charge for the year differs from the theoretical amount which would arise using the weighted average tax rate applicable to profits of Group companies as follows:
2013
£m 2012
£m
Profit before tax 71.4 56.1
Tax calculated at domestic tax rates applicable to profits in the respective countries 16.5 13.9 Expenses not deductible for tax purposes 0.1 0.2 Tax effect of unrecognised profits in associates and joint ventures (0.7) (1.2) Adjustment in respect of indexation allowance on United Kingdom properties (4.2) (3.0) Non-taxable income (2.4) (0.9) Change in tax rate (1.6) (1.0) Deferred tax assets not recognised 0.9 0.1 Other deferred tax adjustments (0.1) 0.1 Adjustment in respect of prior periods (0.3) 1.2
Tax charge for the year 8.2 9.4
The weighted average applicable tax rate of 23.1% (2012: 24.9%) was derived by applying to their relevant profits and losses the rates in the jurisdictions in which the Group operated.
6 EARNINGS PER SHARE Management has chosen to disclose the European Public Real Estate Association (EPRA) measure of earnings per share which has been provided to give relevant information to investors on the long-term performance of the Group’s underlying business. The EPRA measure excludes items which are non-recurring in nature such as profits (net of related tax) on sale of investment properties and of other non-current investments, and items which have no impact to earnings over their life, such as the change in fair value of derivative financial instruments and the net movement on revaluation of investment properties, and the related deferred taxation on these items.
Earnings 2013
£m 2012
£m
Profit for the year 63.2 46.7 Profit on sale of investment property (4.5) – Profit on sale of joint venture (1.8) – Net (gain)/loss on sale of corporate bonds and other financial investments (14.1) 0.4 Net movements on revaluation of investment properties 0.2 (16.2) Fair value gain on reclassification of an associate as an investment (14.9) – Impairment of carrying value of associate 4.0 – Change in fair value of derivative financial instruments (3.3) 1.5 Deferred tax relating to the above adjustments (0.3) 2.0 Adjustments in respect of associates – (5.6)
EPRA earnings 28.5 28.8
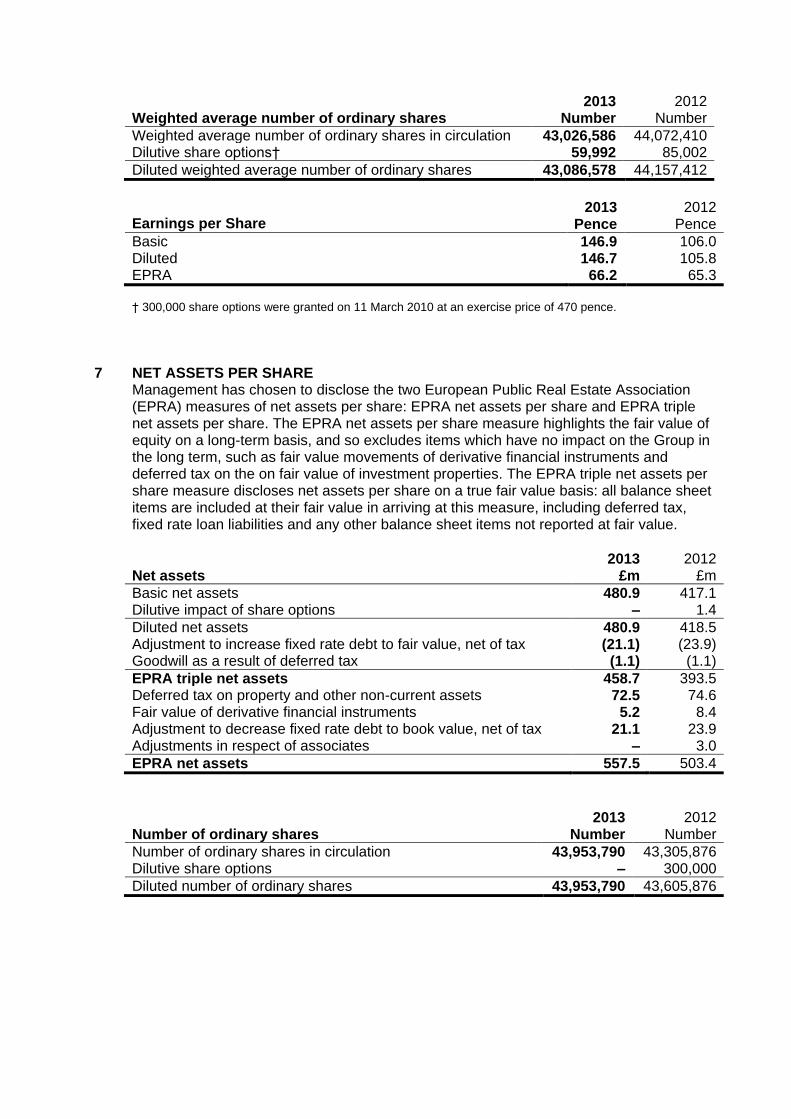
2013 Number
2012 Number Weighted average number of ordinary shares
Weighted average number of ordinary shares in circulation 43,026,586 44,072,410 Dilutive share options† 59,992 85,002
Diluted weighted average number of ordinary shares 43,086,578 44,157,412
Earnings per Share
2013 Pence
2012 Pence
Basic 146.9 106.0 Diluted 146.7 105.8 EPRA 66.2 65.3
† 300,000 share options were granted on 11 March 2010 at an exercise price of 470 pence.
7 NET ASSETS PER SHARE Management has chosen to disclose the two European Public Real Estate Association (EPRA) measures of net assets per share: EPRA net assets per share and EPRA triple net assets per share. The EPRA net assets per share measure highlights the fair value of equity on a long-term basis, and so excludes items which have no impact on the Group in the long term, such as fair value movements of derivative financial instruments and deferred tax on the on fair value of investment properties. The EPRA triple net assets per share measure discloses net assets per share on a true fair value basis: all balance sheet items are included at their fair value in arriving at this measure, including deferred tax, fixed rate loan liabilities and any other balance sheet items not reported at fair value.
Net assets 2013
£m 2012
£m
Basic net assets 480.9 417.1 Dilutive impact of share options – 1.4
Diluted net assets 480.9 418.5 Adjustment to increase fixed rate debt to fair value, net of tax (21.1) (23.9) Goodwill as a result of deferred tax (1.1) (1.1)
EPRA triple net assets 458.7 393.5 Deferred tax on property and other non-current assets 72.5 74.6 Fair value of derivative financial instruments 5.2 8.4 Adjustment to decrease fixed rate debt to book value, net of tax 21.1 23.9 Adjustments in respect of associates – 3.0
EPRA net assets 557.5 503.4
Number of ordinary shares 2013
Number 2012
Number
Number of ordinary shares in circulation 43,953,790 43,305,876 Dilutive share options – 300,000
Diluted number of ordinary shares 43,953,790 43,605,876
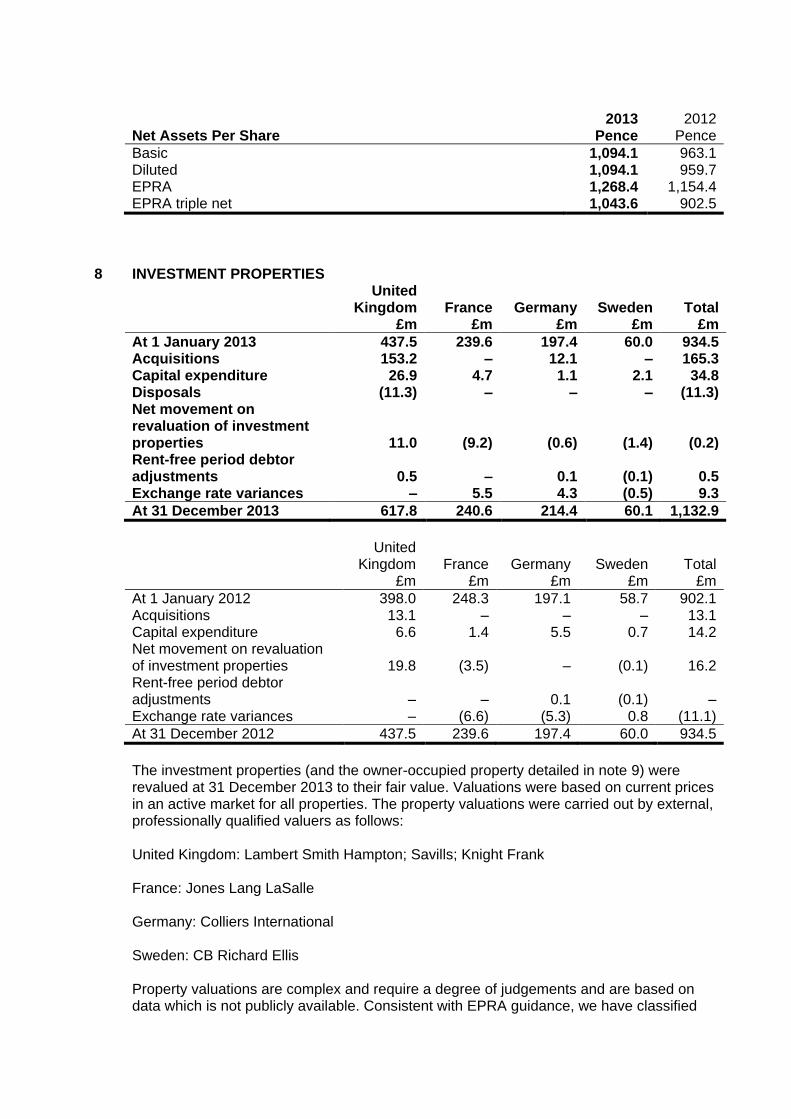
Net Assets Per Share 2013
Pence 2012
Pence
Basic 1,094.1 963.1 Diluted 1,094.1 959.7 EPRA 1,268.4 1,154.4 EPRA triple net 1,043.6 902.5
8 INVESTMENT PROPERTIES United
Kingdom £m
France £m
Germany £m
Sweden £m
Total £m
At 1 January 2013 437.5 239.6 197.4 60.0 934.5 Acquisitions 153.2 – 12.1 – 165.3 Capital expenditure 26.9 4.7 1.1 2.1 34.8 Disposals (11.3) – – – (11.3) Net movement on revaluation of investment properties 11.0 (9.2) (0.6) (1.4) (0.2) Rent-free period debtor adjustments 0.5 – 0.1 (0.1) 0.5 Exchange rate variances – 5.5 4.3 (0.5) 9.3
At 31 December 2013 617.8 240.6 214.4 60.1 1,132.9
United
Kingdom £m
France £m
Germany £m
Sweden £m
Total £m
At 1 January 2012 398.0 248.3 197.1 58.7 902.1 Acquisitions 13.1 – – – 13.1 Capital expenditure 6.6 1.4 5.5 0.7 14.2 Net movement on revaluation of investment properties 19.8 (3.5) – (0.1) 16.2 Rent-free period debtor adjustments – – 0.1 (0.1) – Exchange rate variances – (6.6) (5.3) 0.8 (11.1)
At 31 December 2012 437.5 239.6 197.4 60.0 934.5
The investment properties (and the owner-occupied property detailed in note 9) were revalued at 31 December 2013 to their fair value. Valuations were based on current prices in an active market for all properties. The property valuations were carried out by external, professionally qualified valuers as follows: United Kingdom: Lambert Smith Hampton; Savills; Knight Frank France: Jones Lang LaSalle Germany: Colliers International Sweden: CB Richard Ellis Property valuations are complex and require a degree of judgements and are based on data which is not publicly available. Consistent with EPRA guidance, we have classified
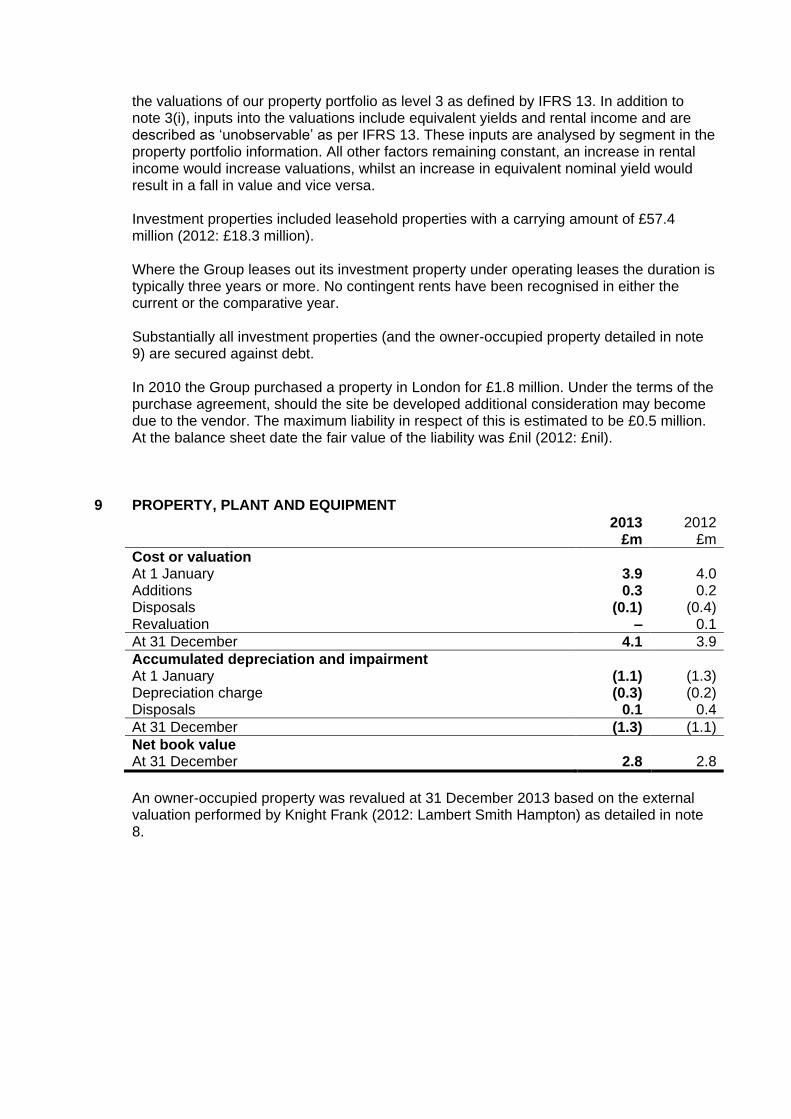
the valuations of our property portfolio as level 3 as defined by IFRS 13. In addition to note 3(i), inputs into the valuations include equivalent yields and rental income and are described as ‘unobservable’ as per IFRS 13. These inputs are analysed by segment in the property portfolio information. All other factors remaining constant, an increase in rental income would increase valuations, whilst an increase in equivalent nominal yield would result in a fall in value and vice versa. Investment properties included leasehold properties with a carrying amount of £57.4 million (2012: £18.3 million). Where the Group leases out its investment property under operating leases the duration is typically three years or more. No contingent rents have been recognised in either the current or the comparative year. Substantially all investment properties (and the owner-occupied property detailed in note 9) are secured against debt. In 2010 the Group purchased a property in London for £1.8 million. Under the terms of the purchase agreement, should the site be developed additional consideration may become due to the vendor. The maximum liability in respect of this is estimated to be £0.5 million. At the balance sheet date the fair value of the liability was £nil (2012: £nil).
9 PROPERTY, PLANT AND EQUIPMENT 2013
£m 2012
£m
Cost or valuation At 1 January 3.9 4.0 Additions 0.3 0.2 Disposals (0.1) (0.4) Revaluation – 0.1
At 31 December 4.1 3.9
Accumulated depreciation and impairment At 1 January (1.1) (1.3) Depreciation charge (0.3) (0.2) Disposals 0.1 0.4
At 31 December (1.3) (1.1)
Net book value At 31 December 2.8 2.8
An owner-occupied property was revalued at 31 December 2013 based on the external valuation performed by Knight Frank (2012: Lambert Smith Hampton) as detailed in note 8.
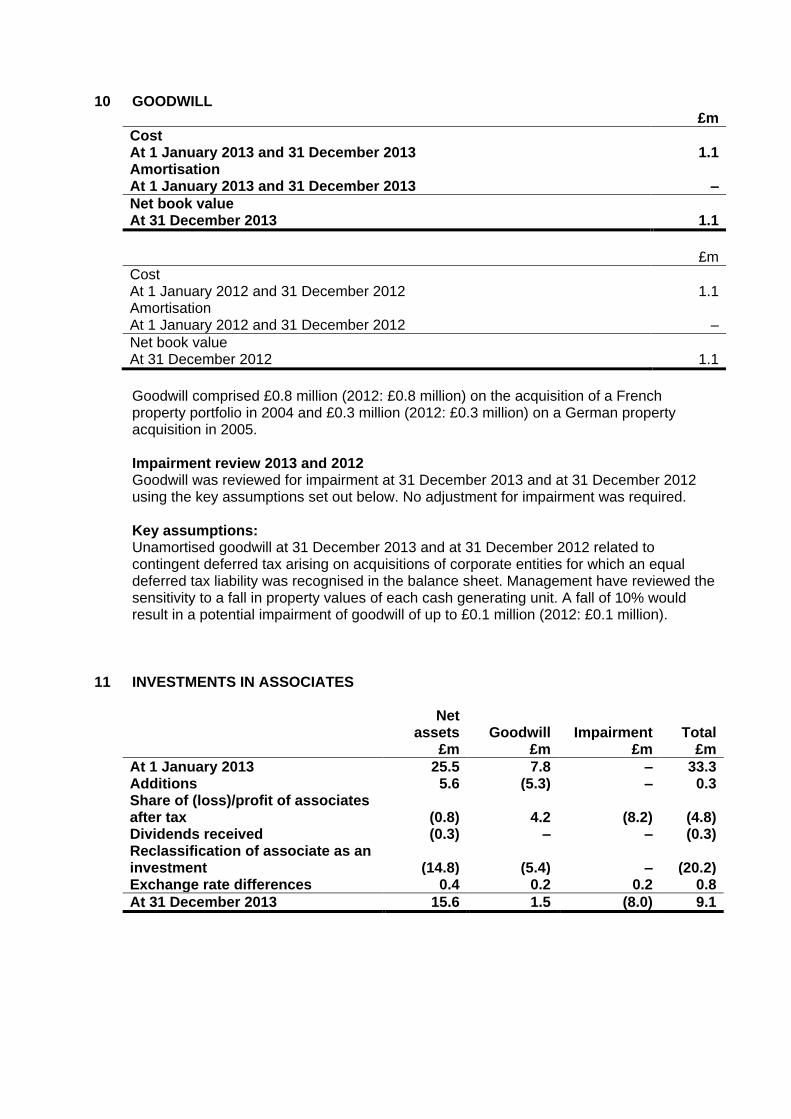
10 GOODWILL £m
Cost At 1 January 2013 and 31 December 2013 1.1 Amortisation At 1 January 2013 and 31 December 2013 –
Net book value At 31 December 2013 1.1
£m
Cost At 1 January 2012 and 31 December 2012 1.1 Amortisation At 1 January 2012 and 31 December 2012 –
Net book value At 31 December 2012 1.1
Goodwill comprised £0.8 million (2012: £0.8 million) on the acquisition of a French property portfolio in 2004 and £0.3 million (2012: £0.3 million) on a German property acquisition in 2005. Impairment review 2013 and 2012 Goodwill was reviewed for impairment at 31 December 2013 and at 31 December 2012 using the key assumptions set out below. No adjustment for impairment was required. Key assumptions: Unamortised goodwill at 31 December 2013 and at 31 December 2012 related to contingent deferred tax arising on acquisitions of corporate entities for which an equal deferred tax liability was recognised in the balance sheet. Management have reviewed the sensitivity to a fall in property values of each cash generating unit. A fall of 10% would result in a potential impairment of goodwill of up to £0.1 million (2012: £0.1 million).
11 INVESTMENTS IN ASSOCIATES Net
assets Goodwill Impairment Total £m £m £m £m
At 1 January 2013 25.5 7.8 – 33.3 Additions 5.6 (5.3) – 0.3 Share of (loss)/profit of associates after tax (0.8) 4.2 (8.2) (4.8) Dividends received (0.3) – – (0.3) Reclassification of associate as an investment (14.8) (5.4) – (20.2) Exchange rate differences 0.4 0.2 0.2 0.8
At 31 December 2013 15.6 1.5 (8.0) 9.1
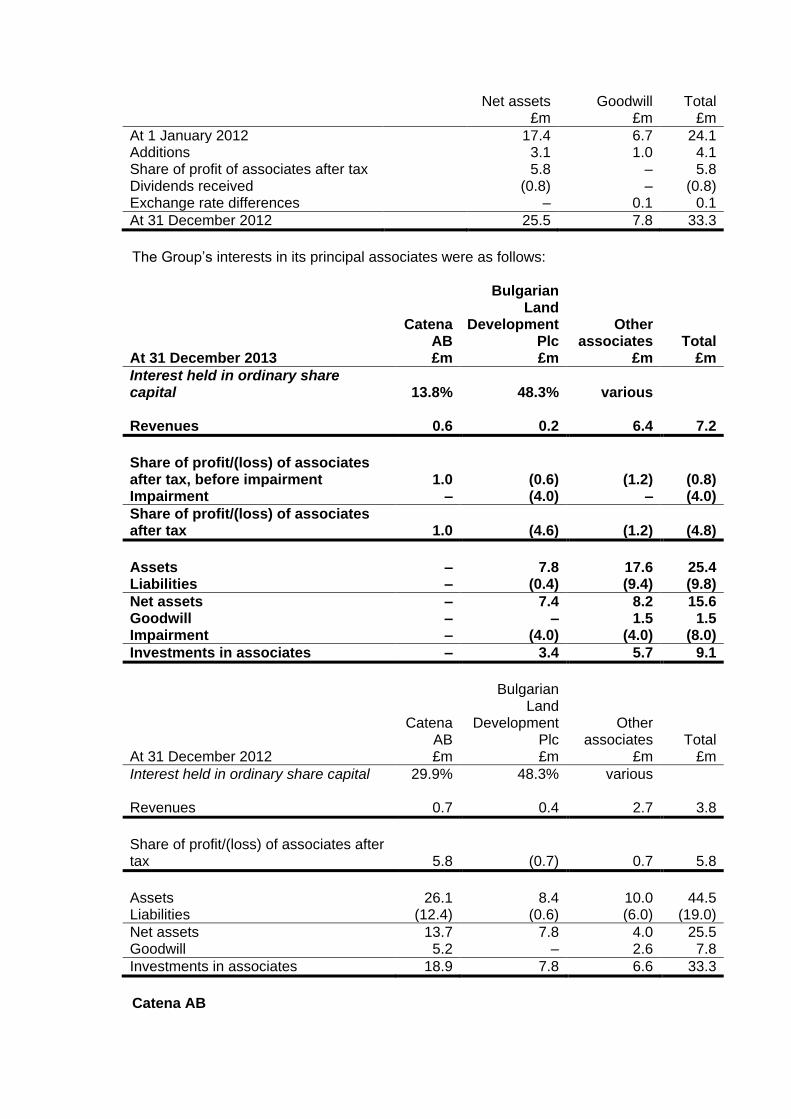
Net assets Goodwill Total £m £m £m
At 1 January 2012 17.4 6.7 24.1 Additions 3.1 1.0 4.1 Share of profit of associates after tax 5.8 – 5.8 Dividends received (0.8) – (0.8) Exchange rate differences – 0.1 0.1
At 31 December 2012 25.5 7.8 33.3
The Group’s interests in its principal associates were as follows:
Catena AB
Bulgarian Land
Development Plc
Other associates Total
At 31 December 2013 £m £m £m £m
Interest held in ordinary share capital 13.8% 48.3% various Revenues 0.6 0.2 6.4 7.2
Share of profit/(loss) of associates after tax, before impairment 1.0 (0.6) (1.2) (0.8) Impairment – (4.0) – (4.0)
Share of profit/(loss) of associates after tax 1.0 (4.6) (1.2) (4.8)
Assets – 7.8 17.6 25.4 Liabilities – (0.4) (9.4) (9.8)
Net assets – 7.4 8.2 15.6 Goodwill – – 1.5 1.5 Impairment – (4.0) (4.0) (8.0)
Investments in associates – 3.4 5.7 9.1
Catena AB
Bulgarian Land
Development Plc
Other associates Total
At 31 December 2012 £m £m £m £m
Interest held in ordinary share capital 29.9% 48.3% various Revenues 0.7 0.4 2.7 3.8
Share of profit/(loss) of associates after tax 5.8 (0.7) 0.7 5.8
Assets 26.1 8.4 10.0 44.5 Liabilities (12.4) (0.6) (6.0) (19.0)
Net assets 13.7 7.8 4.0 25.5 Goodwill 5.2 – 2.6 7.8
Investments in associates 18.9 7.8 6.6 33.3
Catena AB
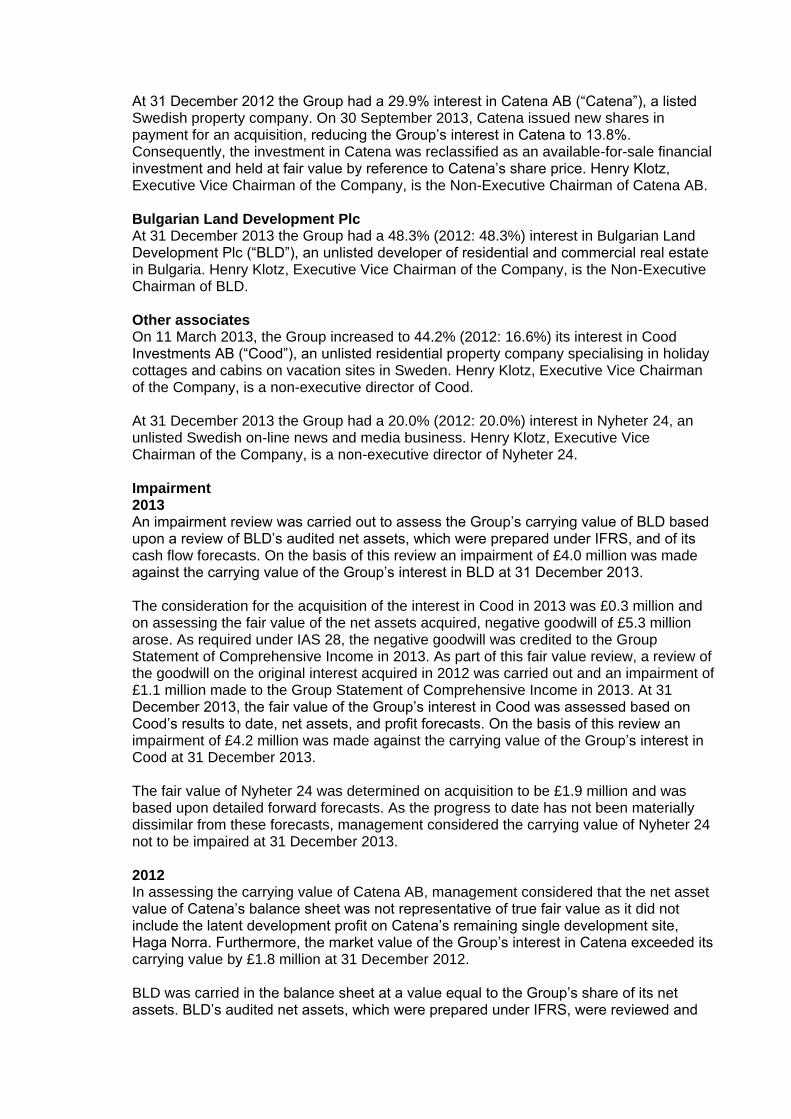
At 31 December 2012 the Group had a 29.9% interest in Catena AB (“Catena”), a listed Swedish property company. On 30 September 2013, Catena issued new shares in payment for an acquisition, reducing the Group’s interest in Catena to 13.8%. Consequently, the investment in Catena was reclassified as an available-for-sale financial investment and held at fair value by reference to Catena’s share price. Henry Klotz, Executive Vice Chairman of the Company, is the Non-Executive Chairman of Catena AB. Bulgarian Land Development Plc At 31 December 2013 the Group had a 48.3% (2012: 48.3%) interest in Bulgarian Land Development Plc (“BLD”), an unlisted developer of residential and commercial real estate in Bulgaria. Henry Klotz, Executive Vice Chairman of the Company, is the Non-Executive Chairman of BLD. Other associates On 11 March 2013, the Group increased to 44.2% (2012: 16.6%) its interest in Cood Investments AB (“Cood”), an unlisted residential property company specialising in holiday cottages and cabins on vacation sites in Sweden. Henry Klotz, Executive Vice Chairman of the Company, is a non-executive director of Cood. At 31 December 2013 the Group had a 20.0% (2012: 20.0%) interest in Nyheter 24, an unlisted Swedish on-line news and media business. Henry Klotz, Executive Vice Chairman of the Company, is a non-executive director of Nyheter 24. Impairment 2013 An impairment review was carried out to assess the Group’s carrying value of BLD based upon a review of BLD’s audited net assets, which were prepared under IFRS, and of its cash flow forecasts. On the basis of this review an impairment of £4.0 million was made against the carrying value of the Group’s interest in BLD at 31 December 2013. The consideration for the acquisition of the interest in Cood in 2013 was £0.3 million and on assessing the fair value of the net assets acquired, negative goodwill of £5.3 million arose. As required under IAS 28, the negative goodwill was credited to the Group Statement of Comprehensive Income in 2013. As part of this fair value review, a review of the goodwill on the original interest acquired in 2012 was carried out and an impairment of £1.1 million made to the Group Statement of Comprehensive Income in 2013. At 31 December 2013, the fair value of the Group’s interest in Cood was assessed based on Cood’s results to date, net assets, and profit forecasts. On the basis of this review an impairment of £4.2 million was made against the carrying value of the Group’s interest in Cood at 31 December 2013. The fair value of Nyheter 24 was determined on acquisition to be £1.9 million and was based upon detailed forward forecasts. As the progress to date has not been materially dissimilar from these forecasts, management considered the carrying value of Nyheter 24 not to be impaired at 31 December 2013. 2012 In assessing the carrying value of Catena AB, management considered that the net asset value of Catena’s balance sheet was not representative of true fair value as it did not include the latent development profit on Catena’s remaining single development site, Haga Norra. Furthermore, the market value of the Group’s interest in Catena exceeded its carrying value by £1.8 million at 31 December 2012. BLD was carried in the balance sheet at a value equal to the Group’s share of its net assets. BLD’s audited net assets, which were prepared under IFRS, were reviewed and
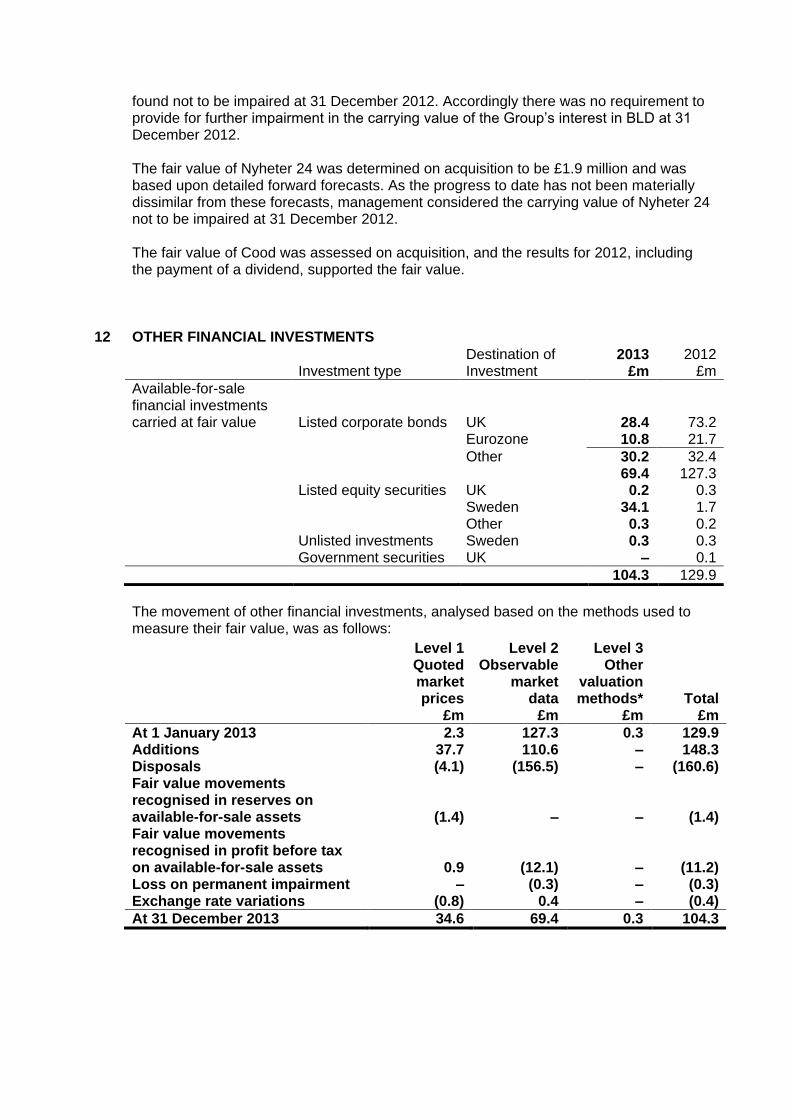
found not to be impaired at 31 December 2012. Accordingly there was no requirement to provide for further impairment in the carrying value of the Group’s interest in BLD at 31 December 2012. The fair value of Nyheter 24 was determined on acquisition to be £1.9 million and was based upon detailed forward forecasts. As the progress to date has not been materially dissimilar from these forecasts, management considered the carrying value of Nyheter 24 not to be impaired at 31 December 2012. The fair value of Cood was assessed on acquisition, and the results for 2012, including the payment of a dividend, supported the fair value.
12 OTHER FINANCIAL INVESTMENTS
Investment type Destination of Investment
2013 £m
2012 £m
Available-for-sale financial investments
carried at fair value Listed corporate bonds UK 28.4 73.2 Eurozone 10.8 21.7
Other 30.2 32.4 69.4 127.3 Listed equity securities UK 0.2 0.3 Sweden 34.1 1.7 Other 0.3 0.2 Unlisted investments Sweden 0.3 0.3 Government securities UK – 0.1
104.3 129.9
The movement of other financial investments, analysed based on the methods used to measure their fair value, was as follows: Level 1
Quoted market prices
£m
Level 2 Observable
market data
£m
Level 3 Other
valuation methods*
£m Total
£m
At 1 January 2013 2.3 127.3 0.3 129.9 Additions 37.7 110.6 – 148.3 Disposals (4.1) (156.5) – (160.6) Fair value movements recognised in reserves on available-for-sale assets (1.4) – – (1.4) Fair value movements recognised in profit before tax on available-for-sale assets 0.9 (12.1) – (11.2) Loss on permanent impairment – (0.3) – (0.3) Exchange rate variations (0.8) 0.4 – (0.4)
At 31 December 2013 34.6 69.4 0.3 104.3
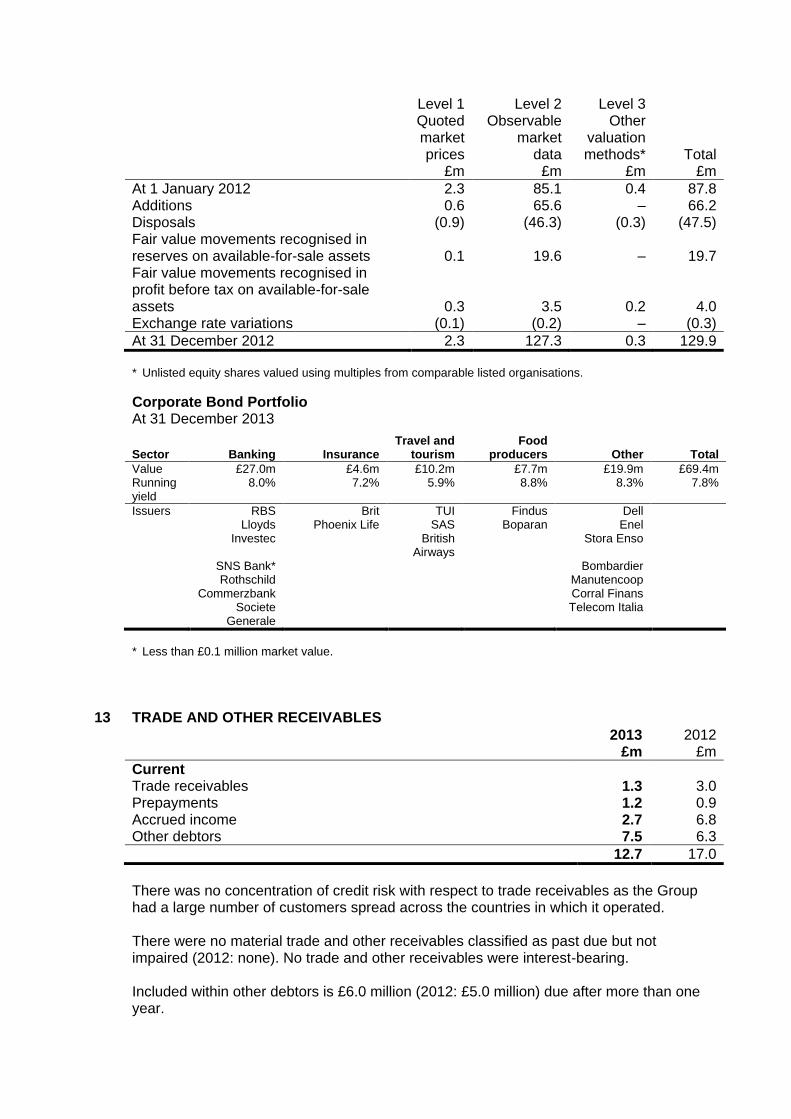
Level 1 Quoted market prices
£m
Level 2 Observable
market data
£m
Level 3 Other
valuation methods*
£m Total
£m
At 1 January 2012 2.3 85.1 0.4 87.8 Additions 0.6 65.6 – 66.2 Disposals (0.9) (46.3) (0.3) (47.5) Fair value movements recognised in reserves on available-for-sale assets 0.1 19.6 – 19.7 Fair value movements recognised in profit before tax on available-for-sale assets 0.3 3.5 0.2 4.0 Exchange rate variations (0.1) (0.2) – (0.3)
At 31 December 2012 2.3 127.3 0.3 129.9
* Unlisted equity shares valued using multiples from comparable listed organisations.
Corporate Bond Portfolio At 31 December 2013
Sector Banking Insurance Travel and
tourism Food
producers Other Total
Value £27.0m £4.6m £10.2m £7.7m £19.9m £69.4m Running yield
8.0% 7.2% 5.9% 8.8% 8.3% 7.8%
Issuers RBS Brit TUI Findus Dell Lloyds Phoenix Life SAS Boparan Enel Investec British
Airways Stora Enso
SNS Bank* Bombardier Rothschild Manutencoop Commerzbank Corral Finans Societe
Generale Telecom Italia
* Less than £0.1 million market value.
13 TRADE AND OTHER RECEIVABLES 2013
£m 2012
£m
Current Trade receivables 1.3 3.0 Prepayments 1.2 0.9 Accrued income 2.7 6.8 Other debtors 7.5 6.3
12.7 17.0
There was no concentration of credit risk with respect to trade receivables as the Group had a large number of customers spread across the countries in which it operated. There were no material trade and other receivables classified as past due but not impaired (2012: none). No trade and other receivables were interest-bearing. Included within other debtors is £6.0 million (2012: £5.0 million) due after more than one year.
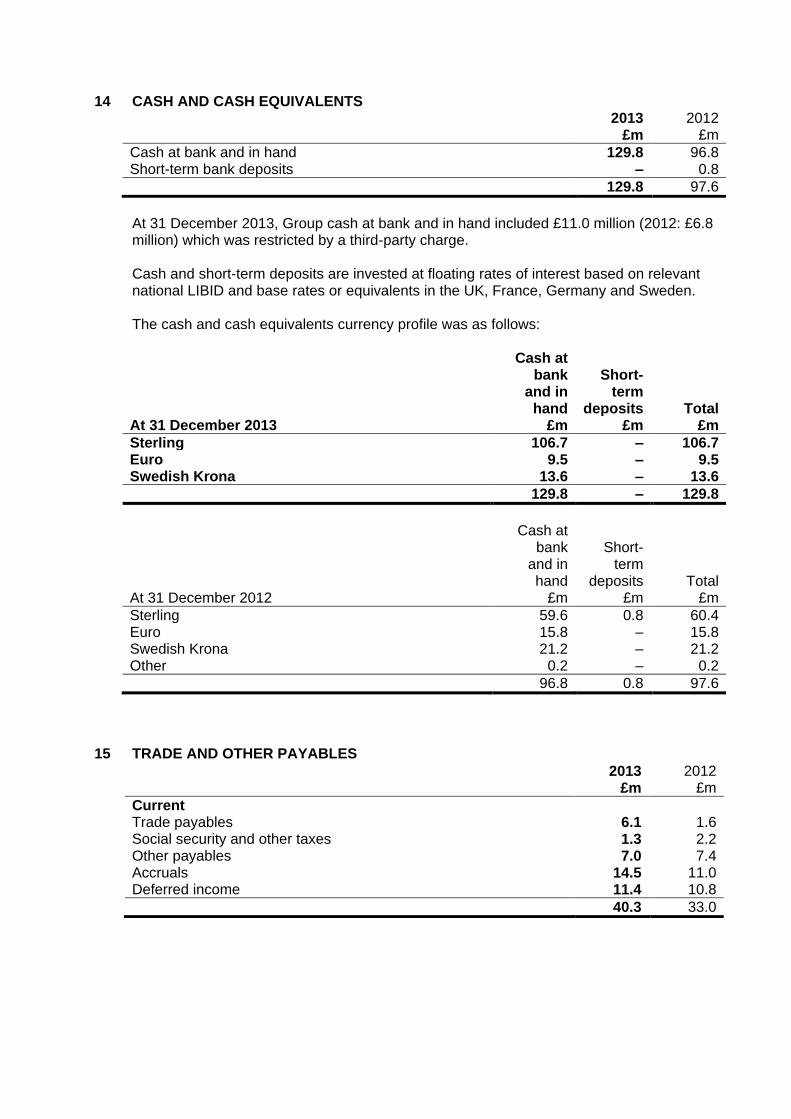
14 CASH AND CASH EQUIVALENTS 2013 2012 £m £m
Cash at bank and in hand 129.8 96.8 Short-term bank deposits – 0.8
129.8 97.6
At 31 December 2013, Group cash at bank and in hand included £11.0 million (2012: £6.8 million) which was restricted by a third-party charge. Cash and short-term deposits are invested at floating rates of interest based on relevant national LIBID and base rates or equivalents in the UK, France, Germany and Sweden. The cash and cash equivalents currency profile was as follows:
Cash at bank
and in hand
Short-term
deposits Total At 31 December 2013 £m £m £m
Sterling 106.7 – 106.7 Euro 9.5 – 9.5 Swedish Krona 13.6 – 13.6
129.8 – 129.8
Cash at bank
and in hand
Short-term
deposits Total At 31 December 2012 £m £m £m
Sterling 59.6 0.8 60.4 Euro 15.8 – 15.8 Swedish Krona 21.2 – 21.2 Other 0.2 – 0.2
96.8 0.8 97.6
15 TRADE AND OTHER PAYABLES 2013
£m 2012
£m
Current Trade payables 6.1 1.6 Social security and other taxes 1.3 2.2 Other payables 7.0 7.4 Accruals 14.5 11.0 Deferred income 11.4 10.8
40.3 33.0
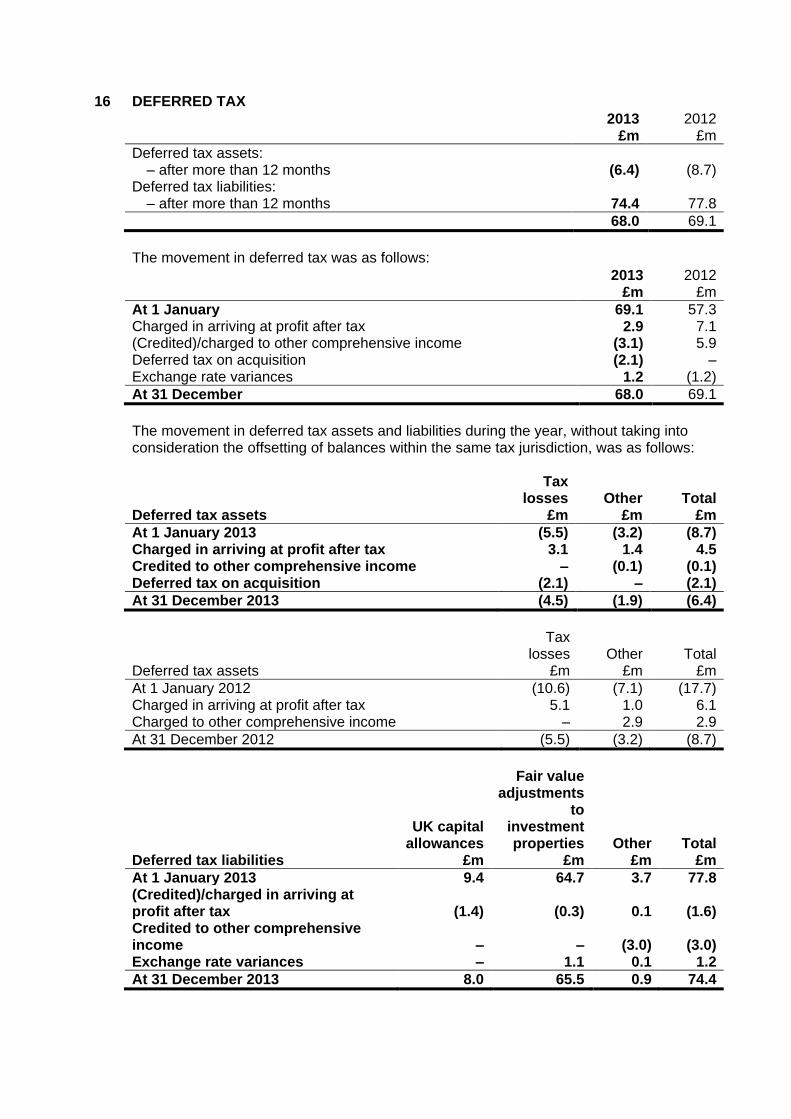
16 DEFERRED TAX 2013
£m 2012
£m
Deferred tax assets: – after more than 12 months (6.4) (8.7) Deferred tax liabilities: – after more than 12 months 74.4 77.8
68.0 69.1
The movement in deferred tax was as follows: 2013
£m 2012
£m
At 1 January 69.1 57.3 Charged in arriving at profit after tax 2.9 7.1 (Credited)/charged to other comprehensive income (3.1) 5.9 Deferred tax on acquisition (2.1) – Exchange rate variances 1.2 (1.2)
At 31 December 68.0 69.1
The movement in deferred tax assets and liabilities during the year, without taking into consideration the offsetting of balances within the same tax jurisdiction, was as follows:
Deferred tax assets
Tax losses
£m Other
£m Total
£m
At 1 January 2013 (5.5) (3.2) (8.7) Charged in arriving at profit after tax 3.1 1.4 4.5 Credited to other comprehensive income – (0.1) (0.1) Deferred tax on acquisition (2.1) – (2.1)
At 31 December 2013 (4.5) (1.9) (6.4)
Tax
losses £m
Other £m
Total £m Deferred tax assets
At 1 January 2012 (10.6) (7.1) (17.7) Charged in arriving at profit after tax 5.1 1.0 6.1 Charged to other comprehensive income – 2.9 2.9
At 31 December 2012 (5.5) (3.2) (8.7)
Deferred tax liabilities
UK capital allowances
£m
Fair value adjustments
to investment properties
£m Other
£m Total
£m
At 1 January 2013 9.4 64.7 3.7 77.8 (Credited)/charged in arriving at profit after tax (1.4) (0.3) 0.1 (1.6) Credited to other comprehensive income – – (3.0) (3.0) Exchange rate variances – 1.1 0.1 1.2
At 31 December 2013 8.0 65.5 0.9 74.4
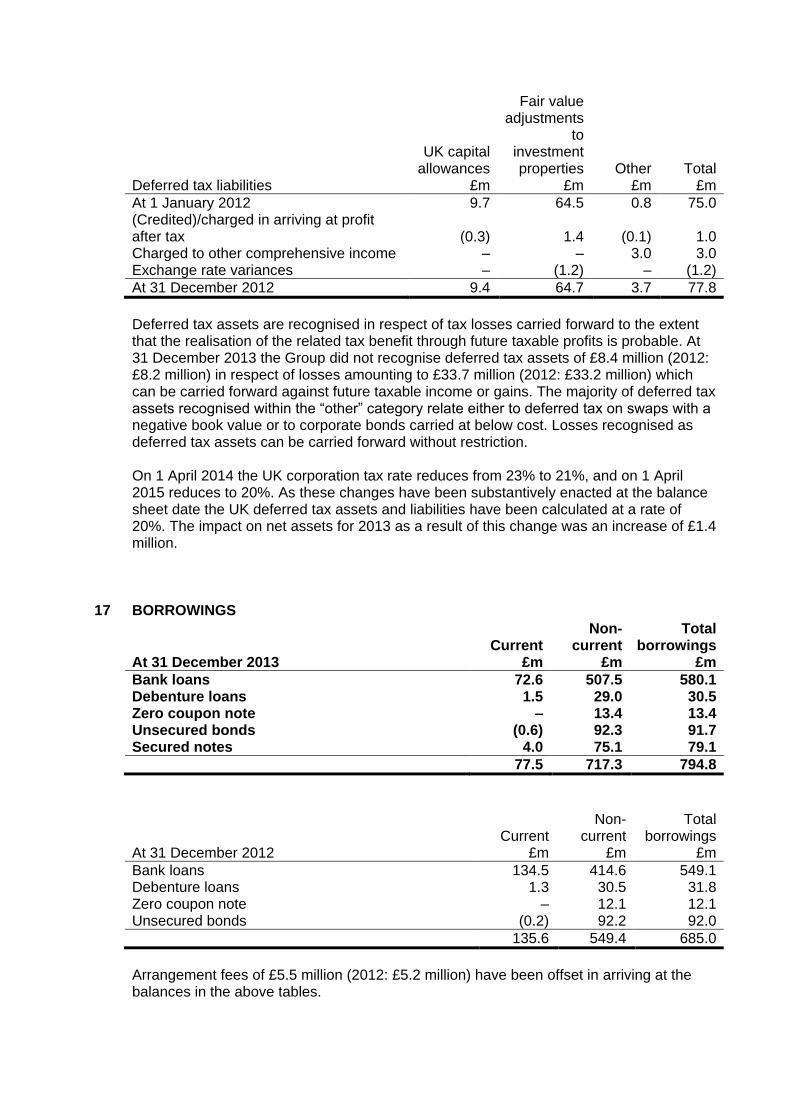
Deferred tax liabilities
UK capital allowances
£m
Fair value adjustments
to investment properties
£m Other
£m Total
£m
At 1 January 2012 9.7 64.5 0.8 75.0 (Credited)/charged in arriving at profit after tax (0.3) 1.4 (0.1) 1.0 Charged to other comprehensive income – – 3.0 3.0 Exchange rate variances – (1.2) – (1.2)
At 31 December 2012 9.4 64.7 3.7 77.8
Deferred tax assets are recognised in respect of tax losses carried forward to the extent that the realisation of the related tax benefit through future taxable profits is probable. At 31 December 2013 the Group did not recognise deferred tax assets of £8.4 million (2012: £8.2 million) in respect of losses amounting to £33.7 million (2012: £33.2 million) which can be carried forward against future taxable income or gains. The majority of deferred tax assets recognised within the “other” category relate either to deferred tax on swaps with a negative book value or to corporate bonds carried at below cost. Losses recognised as deferred tax assets can be carried forward without restriction. On 1 April 2014 the UK corporation tax rate reduces from 23% to 21%, and on 1 April 2015 reduces to 20%. As these changes have been substantively enacted at the balance sheet date the UK deferred tax assets and liabilities have been calculated at a rate of 20%. The impact on net assets for 2013 as a result of this change was an increase of £1.4 million.
17 BORROWINGS
At 31 December 2013 Current
£m
Non-current
£m
Total borrowings
£m
Bank loans 72.6 507.5 580.1 Debenture loans 1.5 29.0 30.5 Zero coupon note – 13.4 13.4 Unsecured bonds (0.6) 92.3 91.7 Secured notes 4.0 75.1 79.1
77.5 717.3 794.8
At 31 December 2012 Current
£m
Non-current
£m
Total borrowings
£m
Bank loans 134.5 414.6 549.1 Debenture loans 1.3 30.5 31.8 Zero coupon note – 12.1 12.1 Unsecured bonds (0.2) 92.2 92.0
135.6 549.4 685.0
Arrangement fees of £5.5 million (2012: £5.2 million) have been offset in arriving at the balances in the above tables.
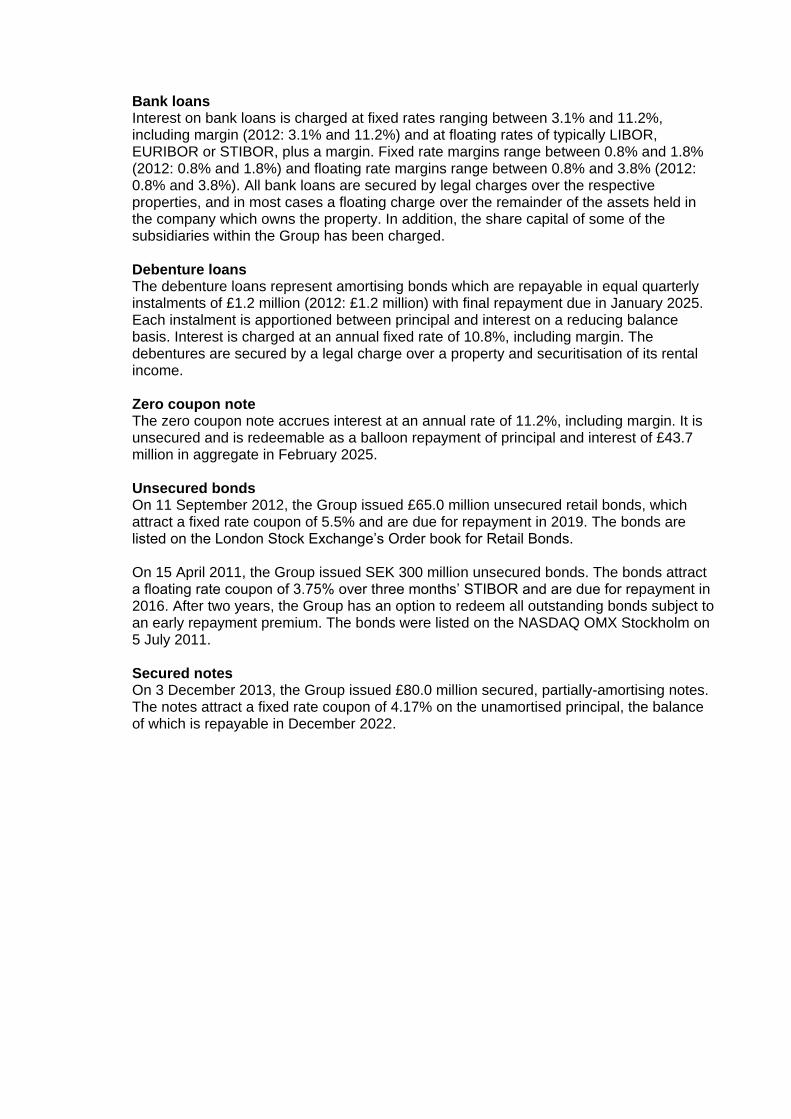
Bank loans Interest on bank loans is charged at fixed rates ranging between 3.1% and 11.2%, including margin (2012: 3.1% and 11.2%) and at floating rates of typically LIBOR, EURIBOR or STIBOR, plus a margin. Fixed rate margins range between 0.8% and 1.8% (2012: 0.8% and 1.8%) and floating rate margins range between 0.8% and 3.8% (2012: 0.8% and 3.8%). All bank loans are secured by legal charges over the respective properties, and in most cases a floating charge over the remainder of the assets held in the company which owns the property. In addition, the share capital of some of the subsidiaries within the Group has been charged. Debenture loans The debenture loans represent amortising bonds which are repayable in equal quarterly instalments of £1.2 million (2012: £1.2 million) with final repayment due in January 2025. Each instalment is apportioned between principal and interest on a reducing balance basis. Interest is charged at an annual fixed rate of 10.8%, including margin. The debentures are secured by a legal charge over a property and securitisation of its rental income. Zero coupon note The zero coupon note accrues interest at an annual rate of 11.2%, including margin. It is unsecured and is redeemable as a balloon repayment of principal and interest of £43.7 million in aggregate in February 2025. Unsecured bonds On 11 September 2012, the Group issued £65.0 million unsecured retail bonds, which attract a fixed rate coupon of 5.5% and are due for repayment in 2019. The bonds are listed on the London Stock Exchange’s Order book for Retail Bonds. On 15 April 2011, the Group issued SEK 300 million unsecured bonds. The bonds attract a floating rate coupon of 3.75% over three months’ STIBOR and are due for repayment in 2016. After two years, the Group has an option to redeem all outstanding bonds subject to an early repayment premium. The bonds were listed on the NASDAQ OMX Stockholm on 5 July 2011. Secured notes On 3 December 2013, the Group issued £80.0 million secured, partially-amortising notes. The notes attract a fixed rate coupon of 4.17% on the unamortised principal, the balance of which is repayable in December 2022.
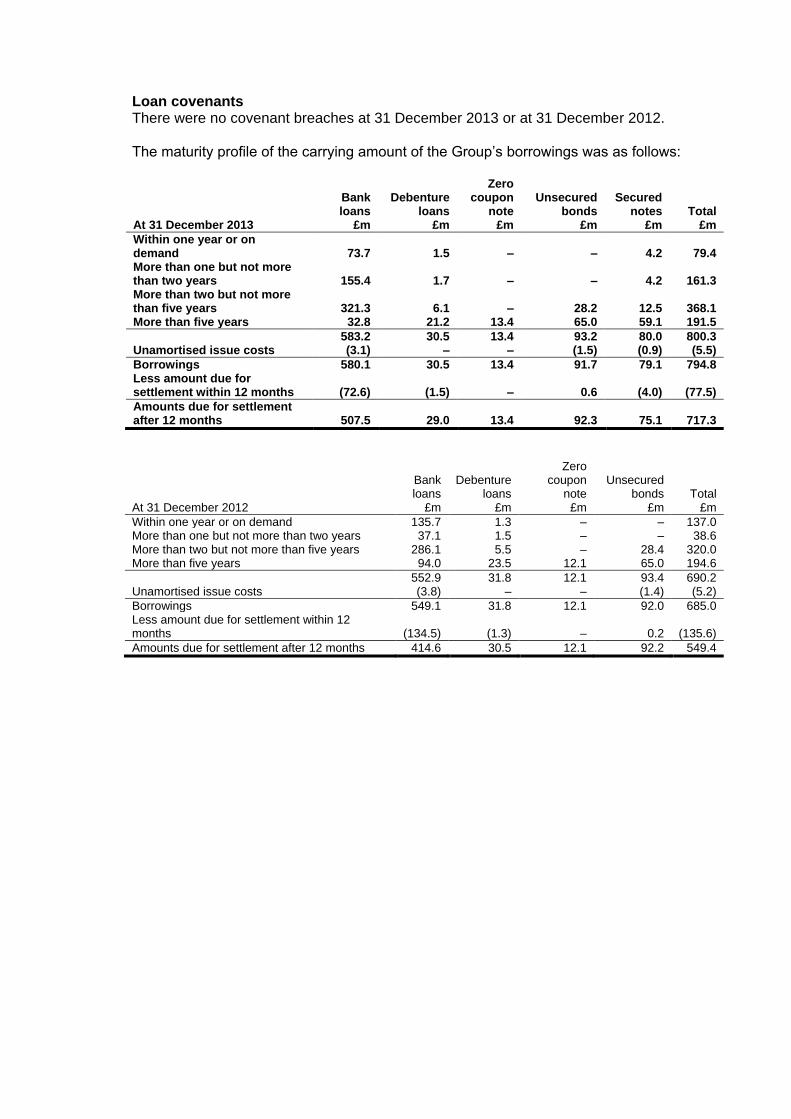
Loan covenants There were no covenant breaches at 31 December 2013 or at 31 December 2012. The maturity profile of the carrying amount of the Group’s borrowings was as follows:
Bank loans
Debenture loans
Zero coupon
note Unsecured
bonds Secured
notes Total At 31 December 2013 £m £m £m £m £m £m
Within one year or on demand 73.7 1.5 – – 4.2 79.4 More than one but not more than two years 155.4 1.7 – – 4.2 161.3 More than two but not more than five years 321.3 6.1 – 28.2 12.5 368.1 More than five years 32.8 21.2 13.4 65.0 59.1 191.5
583.2 30.5 13.4 93.2 80.0 800.3 Unamortised issue costs (3.1) – – (1.5) (0.9) (5.5)
Borrowings 580.1 30.5 13.4 91.7 79.1 794.8 Less amount due for settlement within 12 months (72.6) (1.5) – 0.6 (4.0) (77.5)
Amounts due for settlement after 12 months 507.5 29.0 13.4 92.3 75.1 717.3
At 31 December 2012
Bank loans
£m
Debenture loans
£m
Zero coupon
note £m
Unsecured bonds
£m Total
£m
Within one year or on demand 135.7 1.3 – – 137.0 More than one but not more than two years 37.1 1.5 – – 38.6 More than two but not more than five years 286.1 5.5 – 28.4 320.0 More than five years 94.0 23.5 12.1 65.0 194.6
552.9 31.8 12.1 93.4 690.2 Unamortised issue costs (3.8) – – (1.4) (5.2)
Borrowings 549.1 31.8 12.1 92.0 685.0 Less amount due for settlement within 12 months (134.5) (1.3) – 0.2 (135.6)
Amounts due for settlement after 12 months 414.6 30.5 12.1 92.2 549.4
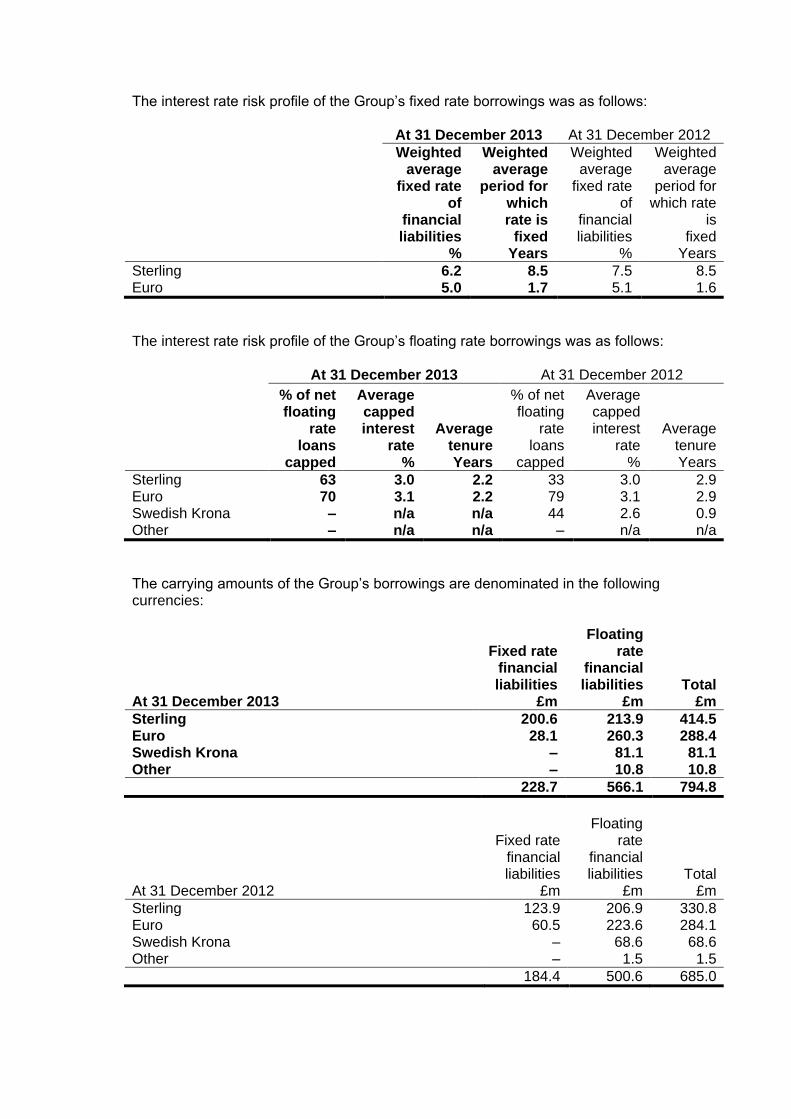
The interest rate risk profile of the Group’s fixed rate borrowings was as follows: At 31 December 2013 At 31 December 2012
Weighted average
fixed rate of
financial liabilities
%
Weighted average
period for which rate is
fixed Years
Weighted average
fixed rate of
financial liabilities
%
Weighted average
period for which rate
is fixed
Years
Sterling 6.2 8.5 7.5 8.5 Euro 5.0 1.7 5.1 1.6
The interest rate risk profile of the Group’s floating rate borrowings was as follows:
At 31 December 2013 At 31 December 2012
% of net floating
rate loans
capped
Average capped interest
rate %
Average tenure Years
% of net floating
rate loans
capped
Average capped interest
rate %
Average tenure Years
Sterling 63 3.0 2.2 33 3.0 2.9 Euro 70 3.1 2.2 79 3.1 2.9 Swedish Krona – n/a n/a 44 2.6 0.9 Other – n/a n/a – n/a n/a
The carrying amounts of the Group’s borrowings are denominated in the following currencies:
At 31 December 2013
Fixed rate financial liabilities
£m
Floating rate
financial liabilities
£m Total
£m
Sterling 200.6 213.9 414.5 Euro 28.1 260.3 288.4 Swedish Krona – 81.1 81.1 Other – 10.8 10.8
228.7 566.1 794.8
At 31 December 2012
Fixed rate financial liabilities
£m
Floating rate
financial liabilities
£m Total
£m
Sterling 123.9 206.9 330.8 Euro 60.5 223.6 284.1 Swedish Krona – 68.6 68.6 Other – 1.5 1.5
184.4 500.6 685.0
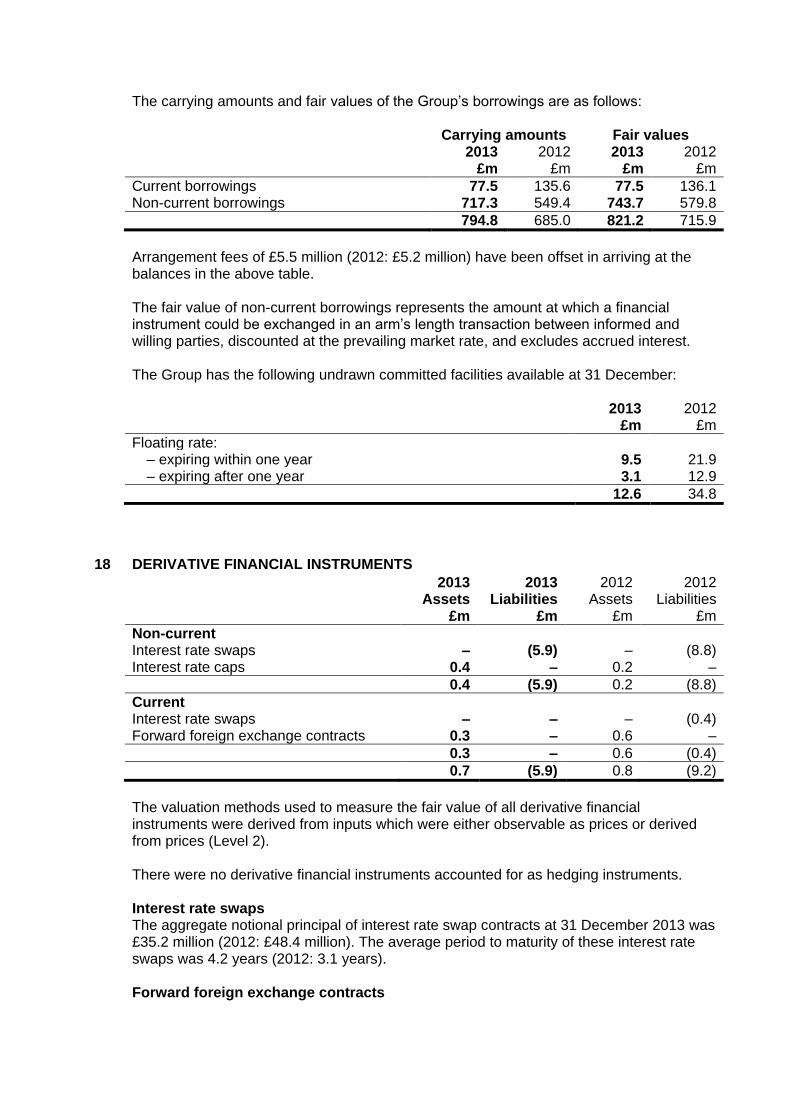
The carrying amounts and fair values of the Group’s borrowings are as follows:
Carrying amounts Fair values 2013
£m 2012
£m 2013
£m 2012
£m
Current borrowings 77.5 135.6 77.5 136.1 Non-current borrowings 717.3 549.4 743.7 579.8
794.8 685.0 821.2 715.9
Arrangement fees of £5.5 million (2012: £5.2 million) have been offset in arriving at the balances in the above table. The fair value of non-current borrowings represents the amount at which a financial instrument could be exchanged in an arm’s length transaction between informed and willing parties, discounted at the prevailing market rate, and excludes accrued interest. The Group has the following undrawn committed facilities available at 31 December: 2013
£m 2012
£m
Floating rate: – expiring within one year 9.5 21.9 – expiring after one year 3.1 12.9
12.6 34.8
18 DERIVATIVE FINANCIAL INSTRUMENTS 2013
Assets £m
2013 Liabilities
£m
2012 Assets
£m
2012 Liabilities
£m
Non-current Interest rate swaps – (5.9) – (8.8) Interest rate caps 0.4 – 0.2 –
0.4 (5.9) 0.2 (8.8)
Current Interest rate swaps – – – (0.4) Forward foreign exchange contracts 0.3 – 0.6 –
0.3 – 0.6 (0.4)
0.7 (5.9) 0.8 (9.2)
The valuation methods used to measure the fair value of all derivative financial instruments were derived from inputs which were either observable as prices or derived from prices (Level 2). There were no derivative financial instruments accounted for as hedging instruments. Interest rate swaps The aggregate notional principal of interest rate swap contracts at 31 December 2013 was £35.2 million (2012: £48.4 million). The average period to maturity of these interest rate swaps was 4.2 years (2012: 3.1 years). Forward foreign exchange contracts
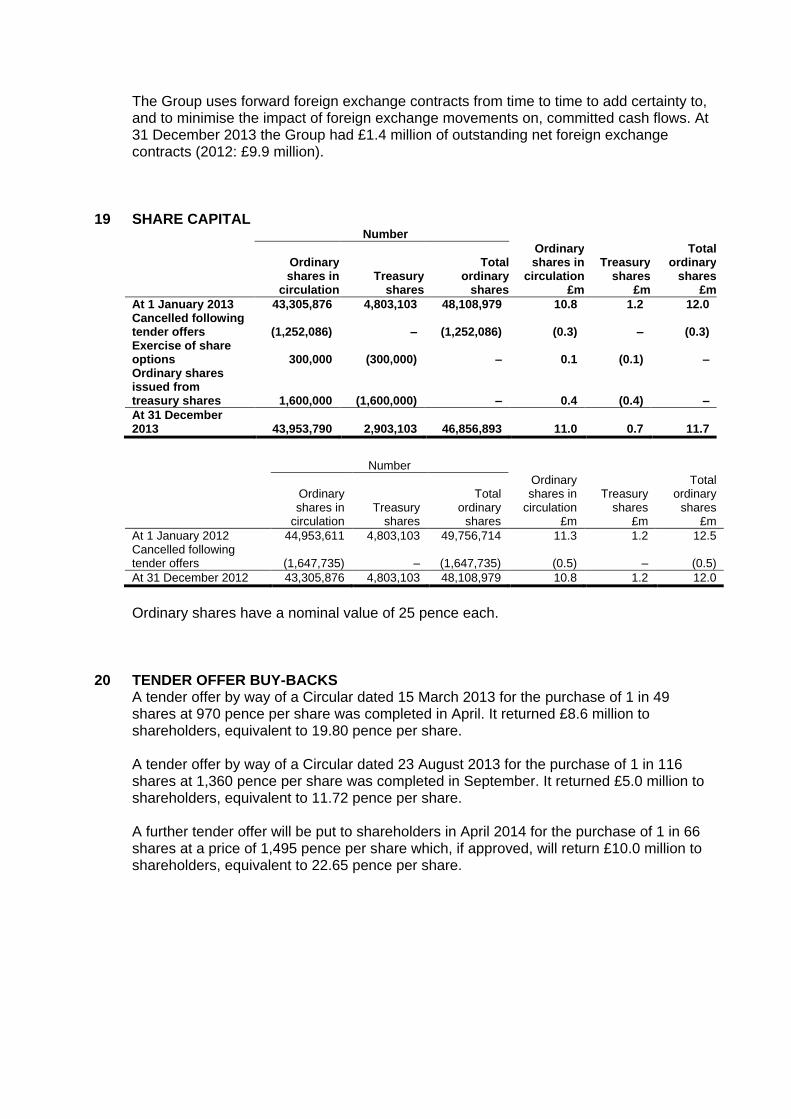
The Group uses forward foreign exchange contracts from time to time to add certainty to, and to minimise the impact of foreign exchange movements on, committed cash flows. At 31 December 2013 the Group had £1.4 million of outstanding net foreign exchange contracts (2012: £9.9 million).
19 SHARE CAPITAL Number
Ordinary shares in
circulation Treasury
shares
Total ordinary
shares
Ordinary shares in
circulation £m
Treasury shares
£m
Total ordinary
shares £m
At 1 January 2013 43,305,876 4,803,103 48,108,979 10.8 1.2 12.0 Cancelled following tender offers (1,252,086) – (1,252,086) (0.3) – (0.3) Exercise of share options 300,000 (300,000) – 0.1 (0.1) – Ordinary shares issued from treasury shares 1,600,000 (1,600,000) – 0.4 (0.4) –
At 31 December 2013 43,953,790 2,903,103 46,856,893 11.0 0.7 11.7
Number
Ordinary shares in
circulation Treasury
shares
Total ordinary
shares
Ordinary shares in
circulation £m
Treasury shares
£m
Total ordinary
shares £m
At 1 January 2012 44,953,611 4,803,103 49,756,714 11.3 1.2 12.5 Cancelled following tender offers (1,647,735) – (1,647,735) (0.5) – (0.5)
At 31 December 2012 43,305,876 4,803,103 48,108,979 10.8 1.2 12.0
Ordinary shares have a nominal value of 25 pence each.
20 TENDER OFFER BUY-BACKS A tender offer by way of a Circular dated 15 March 2013 for the purchase of 1 in 49 shares at 970 pence per share was completed in April. It returned £8.6 million to shareholders, equivalent to 19.80 pence per share. A tender offer by way of a Circular dated 23 August 2013 for the purchase of 1 in 116 shares at 1,360 pence per share was completed in September. It returned £5.0 million to shareholders, equivalent to 11.72 pence per share. A further tender offer will be put to shareholders in April 2014 for the purchase of 1 in 66 shares at a price of 1,495 pence per share which, if approved, will return £10.0 million to shareholders, equivalent to 22.65 pence per share.
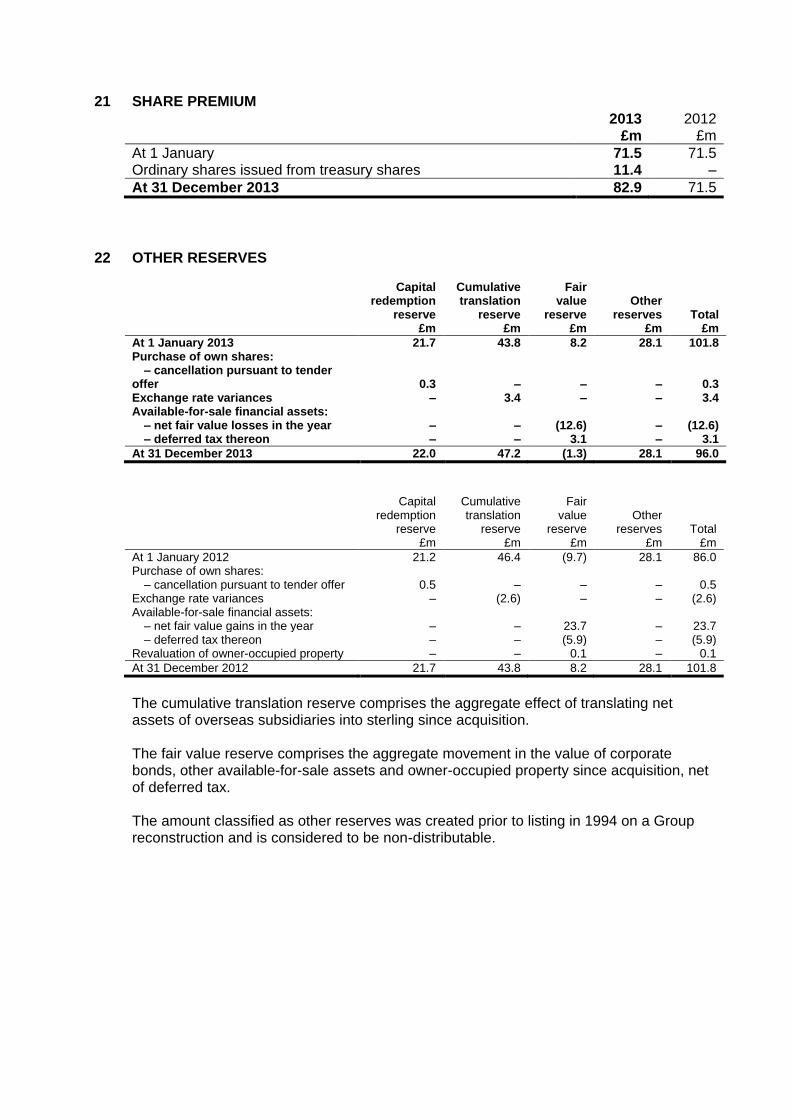
21 SHARE PREMIUM 2013
£m 2012
£m
At 1 January 71.5 71.5 Ordinary shares issued from treasury shares 11.4 –
At 31 December 2013 82.9 71.5
22 OTHER RESERVES
Capital redemption
reserve £m
Cumulative translation
reserve £m
Fair value
reserve £m
Other reserves
£m Total
£m
At 1 January 2013 21.7 43.8 8.2 28.1 101.8 Purchase of own shares: – cancellation pursuant to tender offer 0.3 – – – 0.3 Exchange rate variances – 3.4 – – 3.4 Available-for-sale financial assets: – net fair value losses in the year – – (12.6) – (12.6) – deferred tax thereon – – 3.1 – 3.1
At 31 December 2013 22.0 47.2 (1.3) 28.1 96.0
Capital redemption
reserve £m
Cumulative translation
reserve £m
Fair value
reserve £m
Other reserves
£m Total
£m
At 1 January 2012 21.2 46.4 (9.7) 28.1 86.0 Purchase of own shares: – cancellation pursuant to tender offer 0.5 – – – 0.5 Exchange rate variances – (2.6) – – (2.6) Available-for-sale financial assets: – net fair value gains in the year – – 23.7 – 23.7 – deferred tax thereon – – (5.9) – (5.9) Revaluation of owner-occupied property – – 0.1 – 0.1
At 31 December 2012 21.7 43.8 8.2 28.1 101.8
The cumulative translation reserve comprises the aggregate effect of translating net assets of overseas subsidiaries into sterling since acquisition. The fair value reserve comprises the aggregate movement in the value of corporate bonds, other available-for-sale assets and owner-occupied property since acquisition, net of deferred tax. The amount classified as other reserves was created prior to listing in 1994 on a Group reconstruction and is considered to be non-distributable.
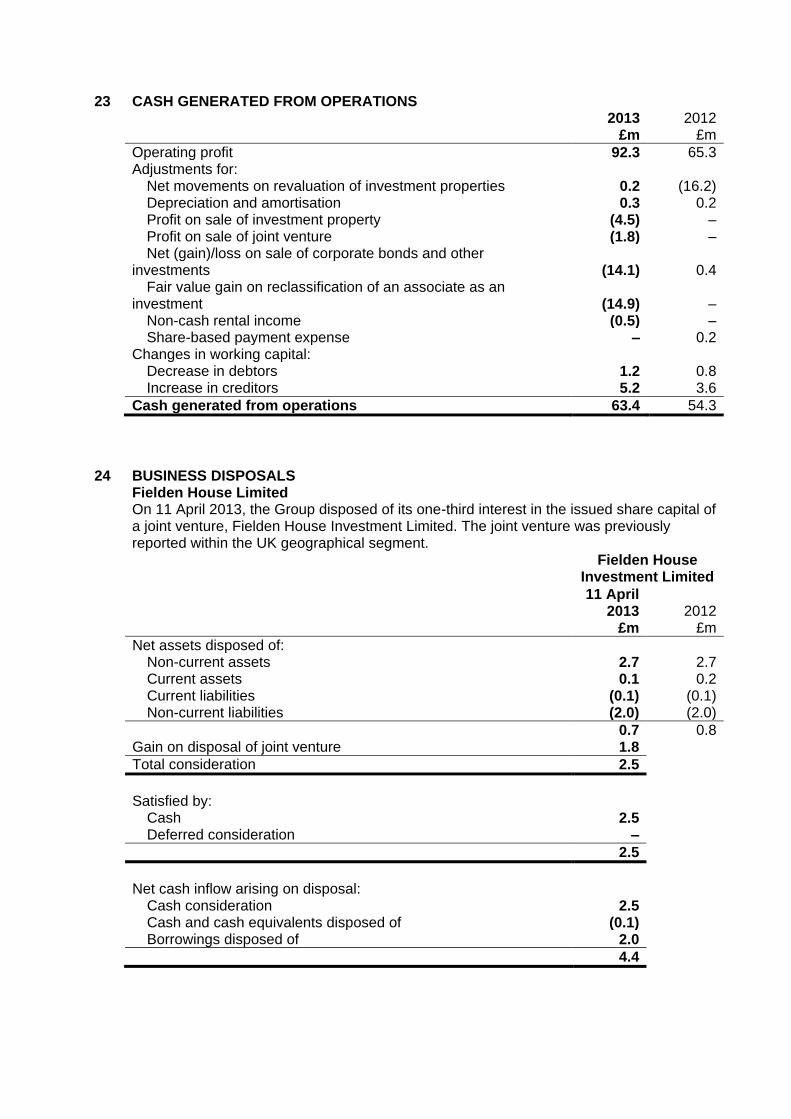
23 CASH GENERATED FROM OPERATIONS 2013
£m 2012
£m
Operating profit 92.3 65.3 Adjustments for: Net movements on revaluation of investment properties 0.2 (16.2) Depreciation and amortisation 0.3 0.2 Profit on sale of investment property (4.5) – Profit on sale of joint venture (1.8) – Net (gain)/loss on sale of corporate bonds and other investments (14.1) 0.4 Fair value gain on reclassification of an associate as an investment (14.9) – Non-cash rental income (0.5) – Share-based payment expense – 0.2 Changes in working capital: Decrease in debtors 1.2 0.8 Increase in creditors 5.2 3.6
Cash generated from operations 63.4 54.3
24 BUSINESS DISPOSALS Fielden House Limited On 11 April 2013, the Group disposed of its one-third interest in the issued share capital of a joint venture, Fielden House Investment Limited. The joint venture was previously reported within the UK geographical segment. Fielden House
Investment Limited
11 April 2013
£m 2012
£m
Net assets disposed of: Non-current assets 2.7 2.7 Current assets 0.1 0.2 Current liabilities (0.1) (0.1) Non-current liabilities (2.0) (2.0)
0.7 0.8 Gain on disposal of joint venture 1.8
Total consideration 2.5
Satisfied by: Cash 2.5 Deferred consideration –
2.5
Net cash inflow arising on disposal: Cash consideration 2.5 Cash and cash equivalents disposed of (0.1) Borrowings disposed of 2.0
4.4
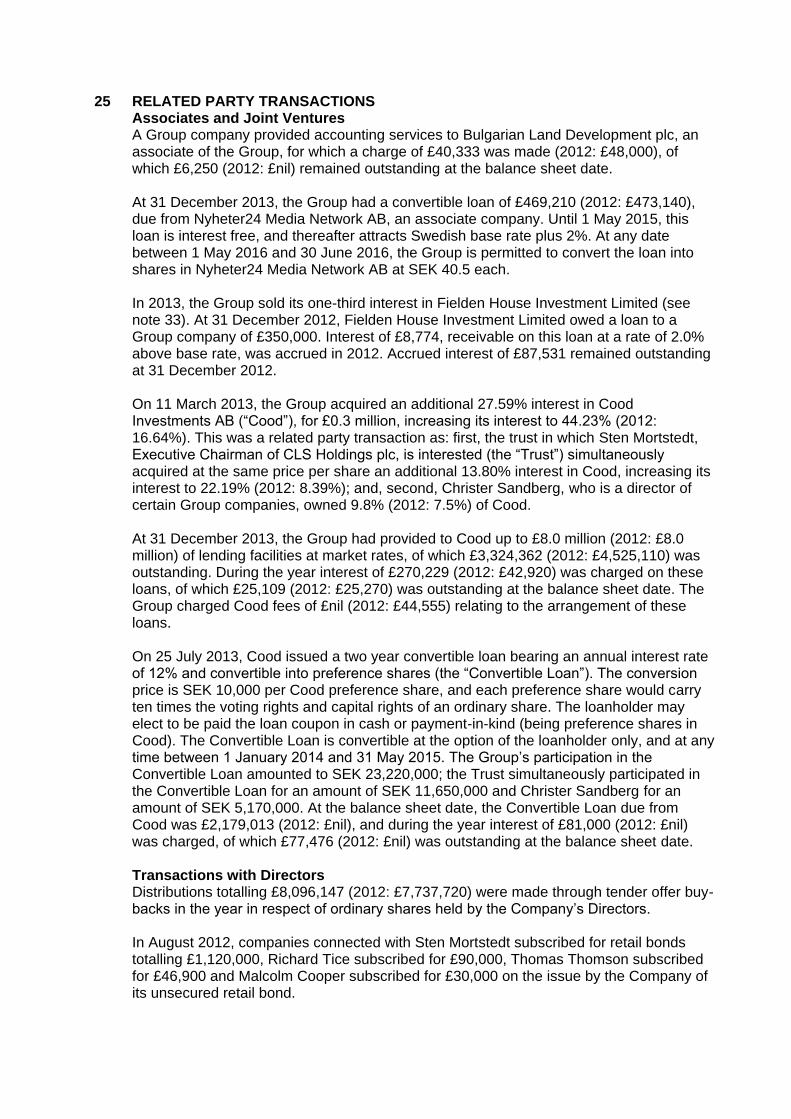
25 RELATED PARTY TRANSACTIONS Associates and Joint Ventures A Group company provided accounting services to Bulgarian Land Development plc, an associate of the Group, for which a charge of £40,333 was made (2012: £48,000), of which £6,250 (2012: £nil) remained outstanding at the balance sheet date. At 31 December 2013, the Group had a convertible loan of £469,210 (2012: £473,140), due from Nyheter24 Media Network AB, an associate company. Until 1 May 2015, this loan is interest free, and thereafter attracts Swedish base rate plus 2%. At any date between 1 May 2016 and 30 June 2016, the Group is permitted to convert the loan into shares in Nyheter24 Media Network AB at SEK 40.5 each. In 2013, the Group sold its one-third interest in Fielden House Investment Limited (see note 33). At 31 December 2012, Fielden House Investment Limited owed a loan to a Group company of £350,000. Interest of £8,774, receivable on this loan at a rate of 2.0% above base rate, was accrued in 2012. Accrued interest of £87,531 remained outstanding at 31 December 2012. On 11 March 2013, the Group acquired an additional 27.59% interest in Cood Investments AB (“Cood”), for £0.3 million, increasing its interest to 44.23% (2012: 16.64%). This was a related party transaction as: first, the trust in which Sten Mortstedt, Executive Chairman of CLS Holdings plc, is interested (the “Trust”) simultaneously acquired at the same price per share an additional 13.80% interest in Cood, increasing its interest to 22.19% (2012: 8.39%); and, second, Christer Sandberg, who is a director of certain Group companies, owned 9.8% (2012: 7.5%) of Cood. At 31 December 2013, the Group had provided to Cood up to £8.0 million (2012: £8.0 million) of lending facilities at market rates, of which £3,324,362 (2012: £4,525,110) was outstanding. During the year interest of £270,229 (2012: £42,920) was charged on these loans, of which £25,109 (2012: £25,270) was outstanding at the balance sheet date. The Group charged Cood fees of £nil (2012: £44,555) relating to the arrangement of these loans. On 25 July 2013, Cood issued a two year convertible loan bearing an annual interest rate of 12% and convertible into preference shares (the “Convertible Loan”). The conversion price is SEK 10,000 per Cood preference share, and each preference share would carry ten times the voting rights and capital rights of an ordinary share. The loanholder may elect to be paid the loan coupon in cash or payment-in-kind (being preference shares in Cood). The Convertible Loan is convertible at the option of the loanholder only, and at any time between 1 January 2014 and 31 May 2015. The Group’s participation in the Convertible Loan amounted to SEK 23,220,000; the Trust simultaneously participated in the Convertible Loan for an amount of SEK 11,650,000 and Christer Sandberg for an amount of SEK 5,170,000. At the balance sheet date, the Convertible Loan due from Cood was £2,179,013 (2012: £nil), and during the year interest of £81,000 (2012: £nil) was charged, of which £77,476 (2012: £nil) was outstanding at the balance sheet date. Transactions with Directors Distributions totalling £8,096,147 (2012: £7,737,720) were made through tender offer buy-backs in the year in respect of ordinary shares held by the Company’s Directors. In August 2012, companies connected with Sten Mortstedt subscribed for retail bonds totalling £1,120,000, Richard Tice subscribed for £90,000, Thomas Thomson subscribed for £46,900 and Malcolm Cooper subscribed for £30,000 on the issue by the Company of its unsecured retail bond.
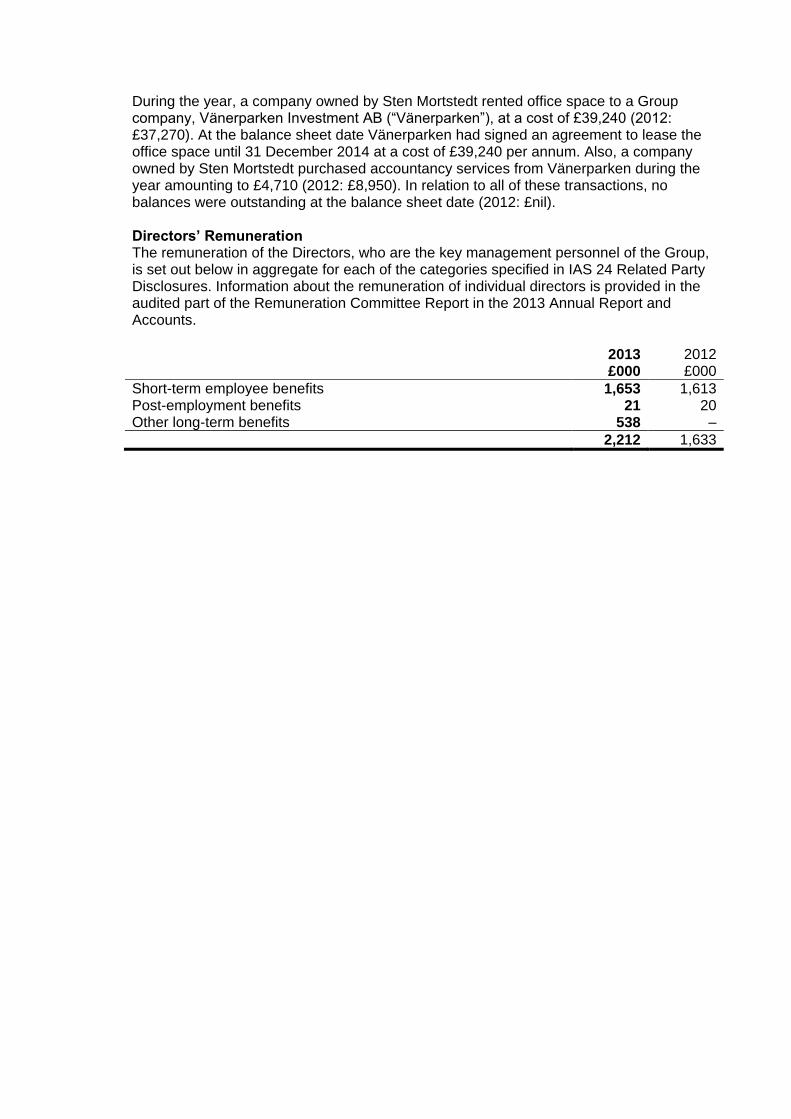
During the year, a company owned by Sten Mortstedt rented office space to a Group company, Vänerparken Investment AB (“Vänerparken”), at a cost of £39,240 (2012: £37,270). At the balance sheet date Vänerparken had signed an agreement to lease the office space until 31 December 2014 at a cost of £39,240 per annum. Also, a company owned by Sten Mortstedt purchased accountancy services from Vänerparken during the year amounting to £4,710 (2012: £8,950). In relation to all of these transactions, no balances were outstanding at the balance sheet date (2012: £nil). Directors’ Remuneration The remuneration of the Directors, who are the key management personnel of the Group, is set out below in aggregate for each of the categories specified in IAS 24 Related Party Disclosures. Information about the remuneration of individual directors is provided in the audited part of the Remuneration Committee Report in the 2013 Annual Report and Accounts. 2013
£000 2012 £000
Short-term employee benefits 1,653 1,613 Post-employment benefits 21 20 Other long-term benefits 538 –
2,212 1,633
GLOSSARY OF TERMS ADJUSTED NET ASSETS OR ADJUSTED SHAREHOLDERS’ FUNDS Net assets excluding the fair value of financial derivatives, deferred tax on revaluations, and goodwill arising as a result of deferred tax ADJUSTED NET GEARING Net debt expressed as a percentage of adjusted net assets ADJUSTED SOLIDITY Adjusted net assets expressed as a percentage of adjusted total assets ADJUSTED TOTAL ASSETS Total assets excluding deferred tax assets ADMINISTRATION COST RATIO Recurring administration expenses of the Investment Property operating segment expressed as a percentage of net rental income BALANCE SHEET LOAN TO VALUE Net debt expressed as a percentage of total assets less cash and short-term deposits CONTRACTED RENT Annual contracted rental income after any rent-free periods have expired CORE PROFIT Profit before tax and before net movements on revaluation of investment properties, profit on sale of investment properties, subsidiaries and corporate bonds, impairment of intangible assets and goodwill, non-recurring costs, change in fair value of derivatives and foreign exchange variances DILUTED EARNINGS PER SHARE Profit after tax divided by the diluted weighted average number of ordinary shares DILUTED NET ASSETS Equity shareholders’ funds increased by the potential proceeds from issuing those shares issuable under employee share schemes DILUTED NET ASSETS PER SHARE OR DILUTED NET ASSET VALUE Diluted net assets divided by the diluted number of ordinary shares DILUTED NUMBER OF ORDINARY SHARES Number of ordinary shares in circulation at the balance sheet date adjusted to include the effect of potential dilutive shares issuable under employee share schemes DILUTED WEIGHTED AVERAGE NUMBER OF ORDINARY SHARES Weighted average number of ordinary shares in issue during the period adjusted to include the effect of potential weighted average dilutive shares issuable under employee share schemes EARNINGS PER SHARE Profit after tax divided by the weighted average number of ordinary shares in issue in the period EPRA European Public Real Estate Association

EPRA EARNINGS PER SHARE Profit after tax, but excluding net gains or losses from fair value adjustments on investment properties, profits or losses on disposal of investment properties and other non-current investment interests, impairment of goodwill and intangible assets, movements in fair value of derivative financial instruments and their related current and deferred tax EPRA NET ASSETS Diluted net assets excluding the fair value of financial derivatives, deferred tax on revaluations, and goodwill arising as a result of deferred tax EPRA NET ASSETS PER SHARE EPRA net assets divided by the diluted number of ordinary shares EPRA NET INITIAL YIELD Annual passing rent less net service charge costs on investment properties expressed as a percentage of the investment property valuation after adding purchasers’ costs EPRA TOPPED UP NET INITIAL YIELD Annual net rents on investment properties expressed as a percentage of the investment property valuation after adding purchasers’ costs EPRA TRIPLE NET ASSETS EPRA net assets adjusted to reflect the fair value of debt and derivatives and to include the fair value of deferred tax on property revaluations EPRA TRIPLE NET ASSETS PER SHARE EPRA triple net assets divided by the diluted number of ordinary shares ESTIMATED RENTAL VALUE (ERV) The market rental value of lettable space as estimated by the Group’s valuers INTEREST COVER The aggregate of group revenue less costs, divided by the aggregate of interest expense and amortisation of loan issue costs, less interest income LIQUID RESOURCES Cash and short-term deposits and listed corporate bonds NET ASSETS PER SHARE OR NET ASSET VALUE (NAV) Equity shareholders’ funds divided by the number of ordinary shares in circulation at the balance sheet date NET DEBT Total borrowings less liquid resources NET GEARING Net debt expressed as a percentage of net assets NET INITIAL YIELD Annual net rents on investment properties expressed as a percentage of the investment property valuation NET RENT Contracted rent less net service charge costs
OCCUPANCY RATE Contracted rent expressed as a percentage of the aggregate of contracted rent and the ERV of vacant space OVER-RENTED The amount by which ERV falls short of the aggregate of passing rent and the ERV of vacant space PASSING RENT Contracted rent before any rent-free periods have expired PROPERTY LOAN TO VALUE Property borrowings expressed as a percentage of the market value of the property portfolio RENT ROLL Contracted rent SOLIDITY Equity shareholders’ funds expressed as a percentage of total assets TOTAL SHAREHOLDER RETURN For a given number of shares, the aggregate of the proceeds from tender offer buy-backs and change in the market value of the shares during the year adjusted for cancellations occasioned by such buy-backs, as a percentage of the market value of the shares at the beginning of the year TRUE EQUIVALENT YIELD The capitalisation rate applied to future cash flows to calculate the gross property value, as determined by the Group’s external valuers