
CLRA MSSS 2015 Walker Winnipeg
23
Tony Walker, EP, PhD Devin MacAskill PEng, MAS Environmental Effects Monitoring in Sydney Harbour During Remediation of One of Canada’s Most Polluted Sites: A Review and Lessons Learned
-
Upload
tony-r-walker-bsc-mphil-phd-ep -
Category
Documents
-
view
106 -
download
2
Transcript of CLRA MSSS 2015 Walker Winnipeg

Tony Walker, EP, PhDDevin MacAskill PEng, MAS
Environmental Effects Monitoring in
Sydney Harbour During Remediation of
One of Canada’s Most Polluted Sites:
A Review and Lessons Learned

Environmental Impact Statement (EIS) & Joint Review Panel (JRP) concluded
“Remediation unlikely to cause significant negative environmental impacts with implementation of appropriate mitigation”
EEM designed to
Determine effectiveness of mitigation
Verify effects predictions made in EIS
Designed to assess positive / negative changes potentially attributed to remediation
EEM reviewed by federal & provincial departments
GW monitoring
SW monitoring
Marine EEM Program (MEEMP)
Continuous improvements made to MEEMP
Lessons learned
Monitoring Effects of Remediation

Marine EEM Program
Water Quality (WQ) 24h auto sampler
Water grabs (surface & near bottom)
Mussel Tissue
Sediment Quality Sediment Chemistry (grabs & traps)
Crab Hepatopancreas Tissue
Benthic Community Inter-tidal (5 transects using quadrats)
Sub-tidal (sieve analysis for benthic invertebrates)
Detection of changes
Short term
Long term

Marine EEM Sampling
Spatial & temporal sampling
Stations - 9 Area 1 – Near-field
Area 2 – Mid-field
Area 3 – Far-field/reference
Area 4 – Sydney River Estuary
Sampling 2009 baseline
2010 1st yr remediation
2011 2nd yr remediation
2012 3rd yr remediation
Changes to MEEMP Added 2 more stations

Monthly 24h auto-seawater composites
Monthly water grabs (surface & near bottom) at all harbour stations
Parameters Total Suspended Solids (TSS)
Total Organic Carbon (TOC)
General chemistry
PAHs & PCBs
Metals
USEPA 95% upper confidence limits (UCL95) calculated for site specific baseline WQ data
Marine EEM: WQ

Highest [TSS] observed during baseline
Peaks correlated to rainfall events NOT remediation
Overall [TSS] low close to reportable detection limits, RDLs (2 mg/L)
WQ: TSS 24H Auto

Non Detect Problems: WQSample
LocationSample Date
TSS NH3 TOC Cd Cu Pb Hg Pyrene Phenanthrene Fluoranthene
mg/L mg/L mg/L µg/L µg/L µg/L µg/L µg/L µg/L µg/L
RDL 2 0.05 0.5 0.017 2 1 0.013 0.01 0.01 0.01
MarWat-1-1
Deep
04/21/09 6 <0.05 <0.5 0.085 <10 <5 <0.013 <0.01 0.02 <0.01
04/21/09D 8 <0.05 <0.5 0.085 <10 5.9 0.016 <0.01 <0.01 <0.01
05/21/09 5 <0.05 <0.5 0.13 <10 <5 <0.013 <0.01 <0.01 <0.01
05/21/09D 6 <0.05 <0.5 0.088 <10 <5 <0.013 <0.01 <0.01 <0.01
06/16/09 <2 <0.05 <0.5 0.085 77 <5 0.021 <0.01 <0.01 <0.01
07/17/09 49 <0.05 <0.5 0.052 <4 <2 0.019 <0.01 <0.01 <0.01
07/17/09D 2 <0.05 <0.5 0.042 <2 <1 0.017 <0.01 <0.01 <0.01
11/08/09D 6 0.06 <0.5 0.046 <2 <1 0.03 0.02 0.01 0.02
11/08/09 3 0.07 <0.5 0.93 <10 <5 0.031 0.02 0.01 0.02
12/10/09D 4 0.14 <0.5 0.085 <10 <5 <0.013 0.01 0.01 0.02
12/10/09 9 <0.05 <0.5 0.19 <10 <5 0.018 <0.01 <0.01 <0.01
04/28/10D 5 <0.05 <0.5 0.056 <2 <1 <0.013 <0.01 <0.01 <0.01
04/28/10 7 <0.05 <0.5 0.048 <2 <1 <0.013 0.01 0.02 0.02
06/02/10D 4 <0.05 <0.5 0.1 <2 <1 <0.013 <0.01 0.02 0.02
06/02/10 <2 <0.05 <0.5 0.038 <2 <1 <0.013 <0.01 0.02 0.01
06/29/10D 5 <0.05 <0.5 0.18 <20 <10 <0.013 0.01 0.01 0.01
06/29/10 3 <0.05 <0.5 <0.017 <20 <10 <0.013 0.05 0.05 0.06
07/29/10 5 0.11 <0.5 0.05 <2 <1 <0.013 <0.01 <0.01 <0.01
08/26/10 5 <0.05 <0.5 0.2 <20 <10 <0.013 <0.01 <0.01 <0.01
09/30/10 4 <0.05 <0.5 0.097 <2 <1 <0.013 <0.01 0.01 <0.01
10/28/10 6 <0.05 <0.5 <0.017 <20 <10 <0.013 0.02 0.02 0.01
11/17/10 4 <0.05 <0.5 <0.17 <20 <10 0.014 <0.01 <0.01 <0.01
04/20/11 <2 <0.05 <0.5 0.24 <20 <10 <0.013 <0.01 0.01 <0.01
05/19/11 6 0.05 <5 <0.17 <20 <10 <0.013 <0.01 0.01 0.01
06/28/11 4 0.08 0.6 <0.17 <20 <10 0.013 <0.01 <0.01 <0.01
07/18/11 4 0.06 <5 <0.17 <20 <10 <0.013 <0.01 <0.01 <0.01
08/31/11 5 <0.05 <5 <0.17 <20 <10 <0.013 <0.01 <0.01 <0.01
09/29/11 3 0.05 <5 <0.17 <20 <10 <0.013 <0.01 0.01 <0.01
10/25/11 6 0.06 <5 <0.17 <20 <10 <0.02 <0.01 <0.01 <0.01
12/09/11 6 <0.05 0.7 0.26 <20 <10 <0.013 <0.01 <0.01 <0.01
04/27/12 2.5 <0.05 <5 <0.17 <20 <10 0.017 <0.01 <0.01 <0.01
05/31/12 3.5 <0.05 <5 <0.17 <20 <10 <0.013 <0.01 0.02 <0.01
06/12/12 2 <0.05 <5 <0.17 <20 <10 <0.013 <0.01 0.03 <0.01
07/23/12 5 <0.05 <5 <0.17 <20 <10 <0.013 <0.01 <0.01 <0.01
08/14/12 2 <0.05 <5 <0.17 <20 <10 0.016 <0.01 <0.01 <0.01

Non detects
Many WQ parameters <RDLs
<RDLs make determination of positive or negative temporal changes difficult
Some metals had increased RDL values up to 10x
Cu = 2, 4, 10, 20 µg/L
Different approaches for using non detect data
Common approach uses ½RDL value as substitution
Replace <RDL value with zero - biased low
Replace <RDL value actual RDL - biased high
US EPA UCL95 includes WQ data with <RDLs
Changes to MEEMP
Used actual RDL value to be overly conservative
Argued for continuance of WQ monitoring to detect potential contaminant releases
Non Detect Problems: WQ

Sediment Quality: PAHs
Significant increase in PAHs in Yr 1 Some agencies called for termination of
remediation after 1st year (Premature?)
Subsequent monitoring showed a continued decrease in PAHs Not significantly different from baseline
Within predicted ranges reported by Smith et al. (2009)
EIS prediction of no significant environmental impacts in SH confirmed?

Sediment Quality: PAHs

Sediment Quality: Metals
Little apparent temporal variation Some metals may show subtle decreases (eg. Hg, Pb & Zn)? EIS prediction of no significant environmental impacts in SH confirmed?
Monitoring Year
Baseline Yr 1 Yr 2 Yr 3
As
co
nc
en
tra
tio
ns
in
su
rfa
ce
se
dim
en
t (µ
g g
-1)
0
15
30
45
Monitoring Year
Baseline Yr 1 Yr 2 Yr 3
Cd
co
nc
en
tra
tio
ns
in
su
rfac
e s
ed
imen
t (µ
g g
-1)
0
1
2
3
4
5
Monitoring Year
Baseline Yr 1 Yr 2 Yr 3
Cu
co
ncen
trati
on
s i
n s
urf
ace s
ed
imen
t (µ
g g
-1)
0
50
100
150
Monitoring Year
Baseline Yr 1 Yr 2 Yr 3
Hg
co
nc
en
tra
tio
ns
in
su
rfa
ce
se
dim
en
t (µ
g g
-1)
0.00
0.25
0.50
0.75
Monitoring Year
Baseline Yr 1 Yr 2 Yr 3
Pb
co
nc
en
tra
tio
ns
in
su
rfa
ce
se
dim
en
t (µ
g g
-1)
0
40
80
120
160
200
Monitoring Year
Baseline Yr 1 Yr 2 Yr 3
Zn
co
ncen
trati
on
s i
n s
urf
ace s
ed
imen
t (µ
g g
-1)
0
50
100
150
200
250
300
350
As Cd Cu
Hg Pb Zn

Heavy Metal(s) Lives On!

Sediment Quality: Sediment Traps
Low sedimentation rates 0.4 – 0.8 cm/yr
Limited material for Sediment chemical analysis
Amphipod toxicity testing
Changes to MEEMP Sediment traps discontinued
Some triplicate sampling to assess intra-station variation
Grabs and DFO gravity SLO-CORER compared
Sampling stations
3-1 3-2 4-1 1-3 1-2 1-1 2-3 2-2 2-1
Se
dim
en
t d
ep
os
itio
n r
ate
(c
m y
r-1)
0.0
0.2
0.4
0.6
0.8

Commercial blue mussels deployed & analyzed for
PAHs, PCBs, As, Cd, Cu, Hg, Pb, Zn & Lipids
Condition Index
Most PAHs <RDLs
Except fluoranthene & pyrene
[PCB] <RDLs in baseline, yrs 1 & 3
Some detections in yr 2
[Metals] showed little spatial variation
EIS prediction of no significant environmental impacts in SH confirmed?
In situ Mussels

In situ Mussels: Challenges
Invasive tunicates covered frames
Missing frames Suspect stealing of buoys & shackles
Massive dredging project Between Oct 2011-Jan 2012 ~4.2 million m3 of
dredged sediment used for infilling in a confined disposal facility (CDF) for proposed container terminal
Changes to MEEMP Chemistry measured prior to deployment
Condition Index discontinued – inconclusive
Mussel monitoring temporarily suspended during dredging
Station 2-2 permanently lost

Crab Tissue
Adult male rock crabs collected each July (102-130 mm)
DFO scientific crab licenses obtained prior to collection
Triplicate crab traps, baited with mackerel, deployed at each station & retrieved 2d later
Crabs (6-13) from triplicate traps pooled to obtain min. wt required for composite hepatopancreas tissue analysis
Hepatopancreas tissue from live crabs analyzed for
PAHs, PCBs, As, Cd, Cu, Hg, Pb & Zn

Crab Tissue: PCBs, PAHs & Metals
Monitoring year
Baseline Yr 1 Yr 2 Yr 3
0
1
2
3
4CFIA Limit
DL
A
A
A
AS
TP
Rem
edia
tion B
egan
[PC
B]
in c
rab
tis
su
e (
µg
g-1
)
Hepatopancreas
Rock crab
PCB, PAH and metal analysis
4 years monitoring
PAHs undetected
PCBs decreasing
Metals stable

Crab Tissue: Challenges
Occasional by-catch Invasive green crabs
American lobster
Sometimes no crabs caught
Massive dredging project Infill for CDF for new container
terminal (2011-2012)
Other traps lost or stolen
Changes to MEEMP Station 2-2 permanently lost

Benthic Community Assessment
Composition & distribution
Yr 1 & 2 similar to baseline & earlier study by Stewart et al. (2002)
Total animal abundance
Significantly higher since baseline
Positive changes since baseline
Community differences
Driven more by organic enrichment rather than contaminant concentrations
Changes to MEEMP
Discontinued after 3 seasons - inconclusive
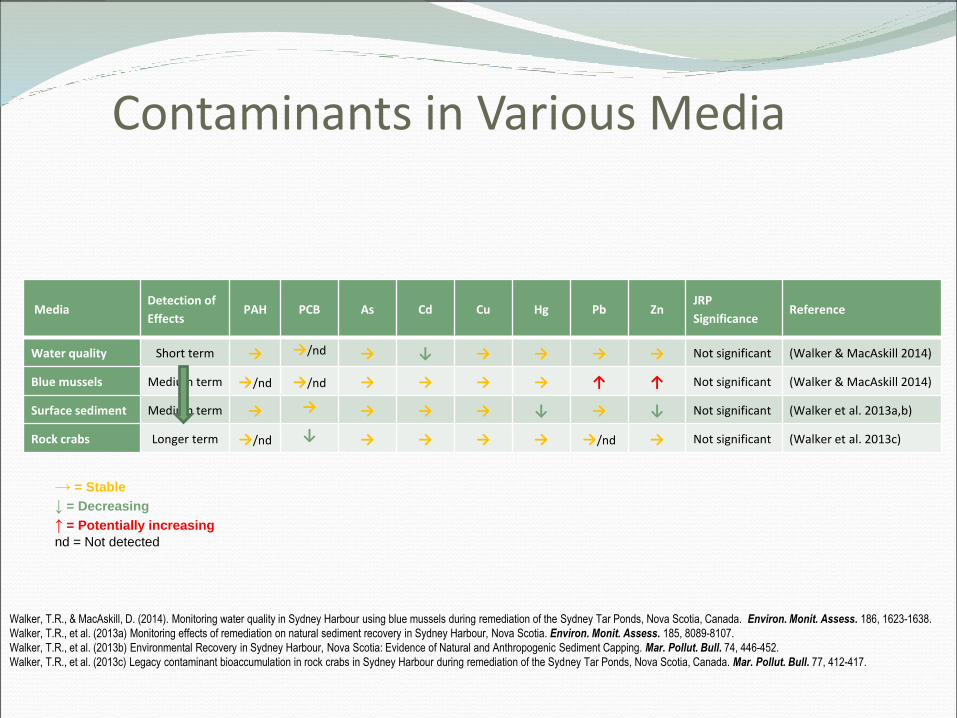
Contaminants in Various Media
Walker, T.R., & MacAskill, D. (2014). Monitoring water quality in Sydney Harbour using blue mussels during remediation of the Sydney Tar Ponds, Nova Scotia, Canada. Environ. Monit. Assess. 186, 1623-1638.
Walker, T.R., et al. (2013a) Monitoring effects of remediation on natural sediment recovery in Sydney Harbour, Nova Scotia. Environ. Monit. Assess. 185, 8089-8107.
Walker, T.R., et al. (2013b) Environmental Recovery in Sydney Harbour, Nova Scotia: Evidence of Natural and Anthropogenic Sediment Capping. Mar. Pollut. Bull. 74, 446-452.
Walker, T.R., et al. (2013c) Legacy contaminant bioaccumulation in rock crabs in Sydney Harbour during remediation of the Sydney Tar Ponds, Nova Scotia, Canada. Mar. Pollut. Bull. 77, 412-417.
MediaDetection of
EffectsPAH PCB As Cd Cu Hg Pb Zn
JRP
SignificanceReference
Water quality Short term → →/nd → ↓ → → → → Not significant (Walker & MacAskill 2014)
Blue mussels Medium term →/nd →/nd → → → → ↑ ↑ Not significant (Walker & MacAskill 2014)
Surface sediment Medium term → → → → → ↓ → ↓ Not significant (Walker et al. 2013a,b)
Rock crabs Longer term →/nd ↓ → → → → →/nd → Not significant (Walker et al. 2013c)
→ = Stable
↓ = Decreasing
↑ = Potentially increasing
nd = Not detected

Summary
EEM in SH did not detect substantial contaminant releases
Many parameters decreased despite ongoing remediation
[PAHs] in sediments increased during yr 1, but now decreasing
Results within predicted ‘natural recovery’ ranges reported by Smith et al. (2009)
Dredging may have had positive environmental effect on Sydney Harbour
Detection of these changes attests to effectiveness of EEM programs
EIS prediction of no significant environmental impacts in SH confirmed?

Lessons Learned
Calls for termination of remediation by regulators after 1 yr was premature
Several years of baseline data required to properly understand range of natural inter-annual variation
Some EEM components removed only after several years of inconclusive data
Cumulative impacts from other industrial activities / weather events should be considered during large-scale remediation projects
Some agencies requested reduction in MEEMP to reduce costs, but collecting a range of multimedia helps build stronger evidence of potential effects
Longer term monitoring of fewer multimedia to assess long-term performance of S/S remediation over decadal timeframes
EEM programs can also become important research studies

Thank You
Dr Tony R. WalkerSchool for Resource and Environmental StudiesDalhousie UniversityEmail: [email protected]