
Cloud Monitoring with Prometheus
20
Prometheus Cloud Monitoring with Prometheus Julius Volz, August 2016
-
Upload
qaware-gmbh -
Category
Data & Analytics
-
view
406 -
download
0
Transcript of Cloud Monitoring with Prometheus
Prometheus
Cloud Monitoring with Prometheus
Julius Volz, August 2016
Prometheus
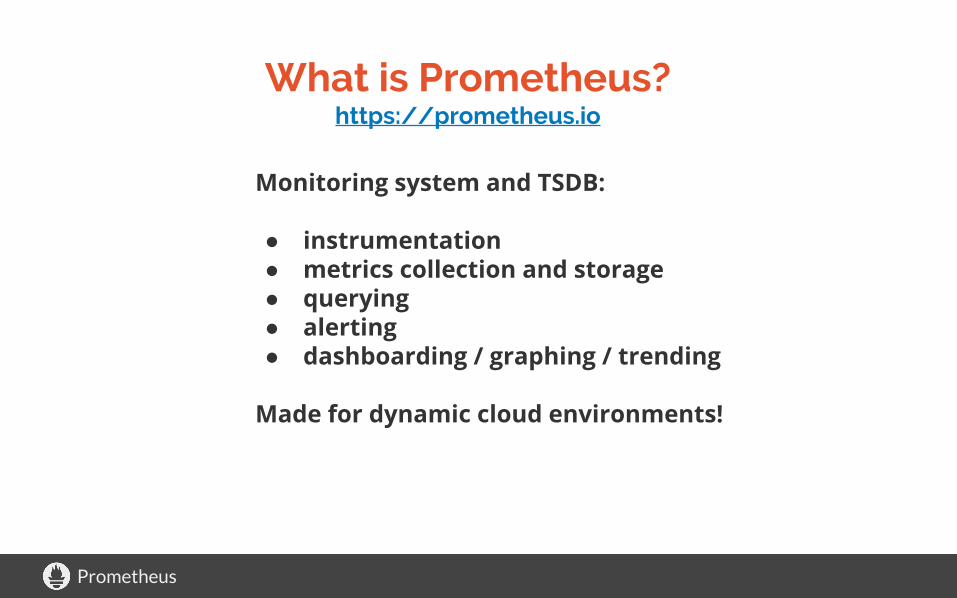
Monitoring system and TSDB:
● instrumentation● metrics collection and storage● querying● alerting● dashboarding / graphing / trending
Made for dynamic cloud environments!
What is Prometheus?https://prometheus.io

Prometheus
● raw log / event collection● request tracing● “magic” anomaly detection● durable long-term storage● automatic horizontal scaling● user / auth management
What does Prometheus NOT do?

Prometheus
● Started in 2012 at SoundCloud by Matt and Julius● Inspired by Google’s monitoring tools● Motivation
○ needed to monitor dynamic cloud environment○ unsatisfying data models, querying, and efficiency in
existing approaches
Origin

Prometheus
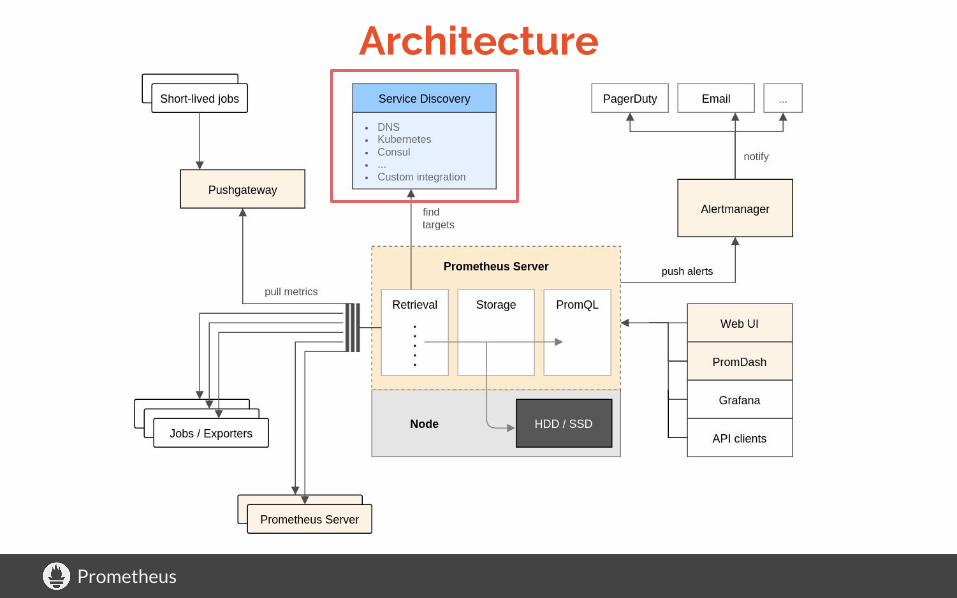
Architecture

Prometheus
Four main improvements
1. Multi-dimensional data model (like OpenTSDB).2. Powerful query language (the same for exploring, graphing, alerting).3. Efficient data collection (yes, it's pull, not push).4. Operational simplicity (unlike OpenTSDB).

Prometheus
Multi-dimensional data model
api_http_requests_total{method="GET", endpoint="/api/tracks", status="200"} 2034834

Prometheus
Powerful query language
topk(3, sum(rate(bazooka_instance_cpu_time_seconds_total[5m])) by (app, proc))
sort_desc(sum(bazooka_instance_memory_limit_bytes - bazooka_instance_memory_usage_bytes) by (app, proc))

Prometheus
Efficient data collection
1000s of targets.800,000 samples per second.
Millions of time series.On a single monitoring server.
Running many servers is easy, too…Pull, not push.

Prometheus
Operational simplicity
● written in Go● static binary● not clustered

Prometheus
Expression browser

Prometheus
Built-in graphing

Prometheus
Grafana Support
Prometheus
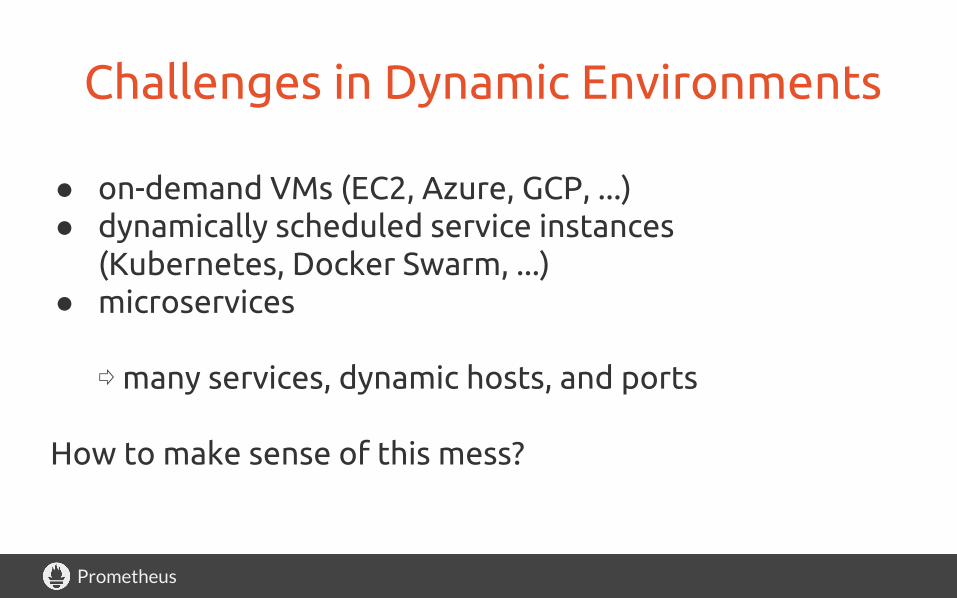
Challenges in Dynamic Environments
● on-demand VMs (EC2, Azure, GCP, ...)● dynamically scheduled service instances
(Kubernetes, Docker Swarm, ...)● microservices
⇨ many services, dynamic hosts, and ports
How to make sense of this mess?

Prometheus
Monitoring Dynamic Environments
● Use service discovery○ ...to know what should be there○ ...to pull metrics○ ...to add metadata to metrics
● Focus on services, not machines
Prometheus
Architecture
Prometheus
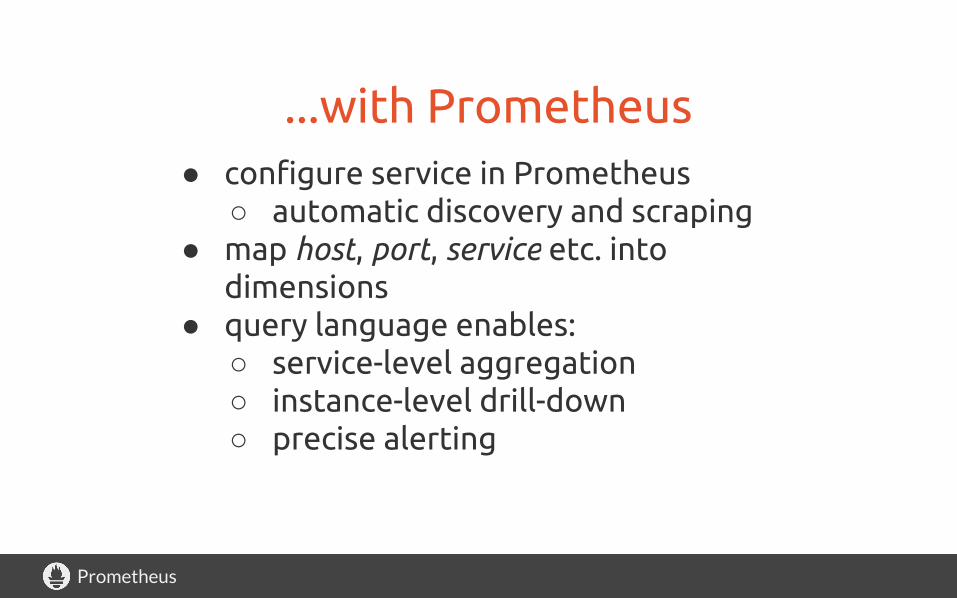
...with Prometheus● configure service in Prometheus
○ automatic discovery and scraping● map host, port, service etc. into
dimensions● query language enables:
○ service-level aggregation○ instance-level drill-down○ precise alerting

Prometheus
Prometheus <3 Kubernetes
● Borg -> Kubernetes● Borgmon -> Prometheus● both use labels● Prometheus supports Kubernetes SD● Kubernetes has Prometheus metrics

Prometheus
Demo?

Prometheus
Thanks!
Q&A


![Description Templates and Orchestration Framework using … · (container orchestrator), Occopus [4] (cloud orchestrator) and Prometheus [5] (monitoring), and some additional custom](https://static.fdocuments.in/doc/165x107/5f05f7557e708231d4159e34/description-templates-and-orchestration-framework-using-container-orchestrator.jpg)