
Cloud and mobile Web-based graphics and … and mobile Web-based graphics and visualization ... will...
15
Cloud and mobile Web-based graphics and visualization Haim Levkowitz Computer Science Department University of Massachusetts Lowell Lowell, MA, USA [email protected] Curran Kelleher Computer Science Department University of Massachusetts Lowell Lowell, MA, USA [email protected] Abstract—Cloud computing is rapidly becoming one of the most prevailing computing platforms. At the same time, the Web browser has become an application platform. Mobile+Cloud, the combination of mobile devices and cloud-based computing is changing how users produce, consume, and use computing resources. With the introduction and penetration of HTML5, and, in particular, its visual capabilities in the form of the Can- vas element, the implementation of high-quality browser-based graphics has become a reality. Indeed, WebGL offers capabilities comparable to the traditional (desktop) OpenGL utilizing in- browser computing resources. It is now feasible to have high- performance graphics and visualization “in your palm,” utilizing a mobile device’s browser as the graphics platform as well as the front end interface and the display. In the near future, graphics’ “heavy lifting” on a cloud-based platform, coupled with a mobile client will afford high-performance graphics for most users most of the time. We argue that this will become the most common platform for computer graphics and visualization in the not- too-distant future. We further argue that such platforms will democratize the use of advanced graphics and visualization and will revolutionize analysis and display of the growing amount of data we all face every day. The goals of this survey are to make the reader familiar with the underlying technologies that make this possible, including (but not limited to) cloud-based computing, mobile computing, their combination, HTML5 and the Canvas element, the WebGL and other graphics libraries, and general Web-based graphics and visualization. Keywords-cloud computing; computer graphics; visual analyt- ics; visual data mining; visualization; Web-based graphics; Web- based visualization; I. I NTRODUCTION We all know the history of computing: very large (but not very capable) computers were located in special rooms to which access was limited. Punched paper tapes gave way to punched cards, then “dumb” terminals led the way to time- sharing. The personal computer started a long “democratiza- tion” process by providing almost anybody some compute power on their desks, and then on their laps, or in their briefcase. The Internet provided connectivity, and the World- Wide Web, easy access to information any time any place, as long as Internet connectivity is available. Recent penetration of “smart” mobile devices have extended that reach to a person’s pocket or purse. “Visual computing” 1 has been following a somewhat par- allel path. However, due to visual computing’s heavy perfor- mance requirements, that reach has had its limitations. Even though graphics hardware — like all other computing equip- ment — have become more powerful, less costly, and more portable, limitations have kept the need for special-purpose hardware to handle more than trivially-sized applications. For example, “big data” is now everywhere, but it has so far not been easy to handle such large amounts of data on general purpose, consumer-grade equipment using consumer-oriented software. With the advent of recent new technologies, such as HTML5 and its Canvas element, WebGL, and cloud-computing, a compute environment has emerged, in which users can get “closer” to their visual computing needs, and can utilize their general purpose equipment, including their mobile devices, to view and interact with large amounts of data in visual form. We observe that traditional, paper-based publications are rapidly giving way to electronic formats. We predict that within a relatively short period of time, most paper-based newspapers will disappear, to be replaced by electronic pub- lications. Electronic books have been the strongest growth segment in the book publishing industry. These new platforms offer far reaching capabilities. For example, if you compare the paper version and the tablet version of any modern magazine offering both (e.g., Wired, Popular Mechanics, or your favorite choice), you will find a much richer experience on the tablet version. Unlike the static nature of paper, the electronic medium allows for a dynamic interactive presentation. Imagine a data-driven story: A very contentious topic in the USA and Europe has been the economy. Some opine that austerity is the only way out of a recession; other advocate more government stimulus spending. Each side offers conjectures and projections. The reader is asked to take their figures and projected outcomes at face value. But the current electronic media provide us with the capabilities to offer a reader an interactive “what if?” scenario, in which she can manipulate projected values (e.g., debt/GDP ratio, inflation rates, interest rates) and observe expected outcomes for growth, debt, deficit, 1 We use the general term “visual computing” to refer to the aggregate of computer graphics, vision, imaging, and visualization.
Transcript of Cloud and mobile Web-based graphics and … and mobile Web-based graphics and visualization ... will...

Cloud and mobile Web-based graphics andvisualization
Haim LevkowitzComputer Science Department
University of Massachusetts LowellLowell, MA, [email protected]
Curran KelleherComputer Science Department
University of Massachusetts LowellLowell, MA, USA
Abstract—Cloud computing is rapidly becoming one of themost prevailing computing platforms. At the same time, theWeb browser has become an application platform. Mobile+Cloud,the combination of mobile devices and cloud-based computingis changing how users produce, consume, and use computingresources. With the introduction and penetration of HTML5,and, in particular, its visual capabilities in the form of the Can-vas element, the implementation of high-quality browser-basedgraphics has become a reality. Indeed, WebGL offers capabilitiescomparable to the traditional (desktop) OpenGL utilizing in-browser computing resources. It is now feasible to have high-performance graphics and visualization “in your palm,” utilizinga mobile device’s browser as the graphics platform as well as thefront end interface and the display. In the near future, graphics’“heavy lifting” on a cloud-based platform, coupled with a mobileclient will afford high-performance graphics for most users mostof the time. We argue that this will become the most commonplatform for computer graphics and visualization in the not-too-distant future. We further argue that such platforms willdemocratize the use of advanced graphics and visualization andwill revolutionize analysis and display of the growing amount ofdata we all face every day.
The goals of this survey are to make the reader familiar withthe underlying technologies that make this possible, including(but not limited to) cloud-based computing, mobile computing,their combination, HTML5 and the Canvas element, the WebGLand other graphics libraries, and general Web-based graphicsand visualization.
Keywords-cloud computing; computer graphics; visual analyt-ics; visual data mining; visualization; Web-based graphics; Web-based visualization;
I. INTRODUCTION
We all know the history of computing: very large (but notvery capable) computers were located in special rooms towhich access was limited. Punched paper tapes gave way topunched cards, then “dumb” terminals led the way to time-sharing. The personal computer started a long “democratiza-tion” process by providing almost anybody some computepower on their desks, and then on their laps, or in theirbriefcase. The Internet provided connectivity, and the World-Wide Web, easy access to information any time any place, aslong as Internet connectivity is available. Recent penetration of“smart” mobile devices have extended that reach to a person’spocket or purse.
“Visual computing” 1 has been following a somewhat par-allel path. However, due to visual computing’s heavy perfor-mance requirements, that reach has had its limitations. Eventhough graphics hardware — like all other computing equip-ment — have become more powerful, less costly, and moreportable, limitations have kept the need for special-purposehardware to handle more than trivially-sized applications. Forexample, “big data” is now everywhere, but it has so far notbeen easy to handle such large amounts of data on generalpurpose, consumer-grade equipment using consumer-orientedsoftware.
With the advent of recent new technologies, such as HTML5and its Canvas element, WebGL, and cloud-computing, acompute environment has emerged, in which users can get“closer” to their visual computing needs, and can utilize theirgeneral purpose equipment, including their mobile devices, toview and interact with large amounts of data in visual form.
We observe that traditional, paper-based publications arerapidly giving way to electronic formats. We predict thatwithin a relatively short period of time, most paper-basednewspapers will disappear, to be replaced by electronic pub-lications. Electronic books have been the strongest growthsegment in the book publishing industry. These new platformsoffer far reaching capabilities. For example, if you compare thepaper version and the tablet version of any modern magazineoffering both (e.g., Wired, Popular Mechanics, or your favoritechoice), you will find a much richer experience on the tabletversion. Unlike the static nature of paper, the electronicmedium allows for a dynamic interactive presentation. Imaginea data-driven story: A very contentious topic in the USAand Europe has been the economy. Some opine that austerityis the only way out of a recession; other advocate moregovernment stimulus spending. Each side offers conjecturesand projections. The reader is asked to take their figures andprojected outcomes at face value. But the current electronicmedia provide us with the capabilities to offer a reader aninteractive “what if?” scenario, in which she can manipulateprojected values (e.g., debt/GDP ratio, inflation rates, interestrates) and observe expected outcomes for growth, debt, deficit,
1We use the general term “visual computing” to refer to the aggregate ofcomputer graphics, vision, imaging, and visualization.

and unemployment figures, all from the comfort of her easychair, nursing a tablet.
Clearly, this requires access to true and current data, and thecomputational abilities to process, analyze, and present them,and to do so in response to the users interactive manipulation.
Does this sound futuristic, utopian? It is not! As wedemonstrate later, more and more of that necessary data isbecoming available for the general public’s consumption. And,as we further show, hardware and software are rapidly moving“towards us,” making these goals more realistic and attainable.This paper surveys the technologies and tools that exist todaythat make this scenario possible. The technologies we surveyhere offer a substantial amount of in-browser processing andinteraction capabilities. Cloud-computing can offer additional“horsepower” where the in-browser, client-side processingcapacity is not sufficient.
We survey the following technologies and their applications:• HTML5, the cross-platform application stack of the fu-
ture;• Canvas, the visual workhorse of HTML5;• WebGL, the technology bringing 3D graphics to the Web;• various 2D- and 3D-graphics libraries;• the fundamentals of cloud computing;• the fundamentals of mobile applications development;• Mobile+Cloud computing in general, and their particular
applications to visual computing;• the Semantic Web and its role in the democratization of
data;• several examples of the penetration of Mobile+Cloud
applications in support of democratized data visualizationand analysis.
II. A BRIEF HISTORY OF COMPUTER GRAPHICS AND THEWORLD-WIDE WEB
The reader is probably well-versed in the history and fun-damentals of computer graphics, the Internet, and the World-Wide Web. We provide this brief (and incomplete) history asa refresher for context purposes. For more details, the readeris referred to the references provided and, e.g., [1], [2], [3].
The early days of computing were limited to alpha-numerictext (initially in upper-case only). In 1963, Ivan Sutherlandliterally gave birth to the field of interactive computer graphicswith the publication of his MIT Ph.D. dissertation, Sketchpad,an interactive system on a vector graphics display, utilizing alight-pen as its input device [4]. Further development duringthe 1960s included Bresenham’s raster algorithms for drawingline segments, circles, ellipses, and other conic sections [5],[6]; Coons’s and Bezier’s parametric surfaces and computer-aided geometric design [1], [7], [8], [9], [10], [11], [12], [13];Appel’s hidden surface removal [14] and Appel’s and Crow’sshadow algorithms [15], [16]; Doug Engelbart’s invention ofthe mouse at Xerox PARC (where several other revolutionaryinventions were made); and the founding of Evans & Suther-land Corp., which built flight simulators on raster graphics.
During the 1970s Gouraud [17], [18] and Phong [19]developed rendering and a reflection model. Xerox PARC
developed a paint program. Catmull developed parametricpatch rendering, the depth-buffer (better known as the z-buffer) algorithm and texture mapping [20]. Whitted developedrecursive ray-tracing, which became a standard for photoreal-ism [21]. Apple’s first computers launched commercially thepersonal computing. Arcade games Pong and Pac Man becamepopular. In 1974, the first SIGGRAPH conference on computergraphics opened, becoming the main event for presenting inno-vations in interactive computer graphics, computer animations,as well as other early visual computing innovations.
In the early 1980s Fournier, Fussell, and Carpenter startedexploring fractals in computer graphics [22]. Adobe Systemswas founded, and introduced to the market the page-layoutlanguage Postscript and the image editing software Photoshop.Animators started aiming at character animation, and videoarcade games became very popular.
In 1980 Disney’s TRON was the first live-action movie thatincluded more than 20 minutes of computer animation. In 1981IBM introduced the first IBM PC, (utilizing the 16 bit Intel8088 CPU chip). Around the same time, the movie Raidersof the Lost Ark won an Academy Award (“Oscar”) for visualeffects.
In 1982 The Genesis Effect, created by Industrial Lightand Magic (ILM) for the Startrek II movie was the first all-computer-animated visual effects sequence shot for a film.
In 1984 Pixar was founded, originally as a developer andmanufacturer of special-purpose, high-performance graphicshardware (often referred to as “the box”). Pixar abandonedhardware in favor of software, introduced RenderMan, a soft-ware package and an API for network-distributed rendering ofcomplex three dimensional views. RenderMan was designed toutilize a “render farm” of many client computers. Those clientsdo not require 3D graphics cards, but may take advantageof available cards [23], [24]. Pixar would later become muchmore well-known for its blockbuster, fully-computer-animatedmovies.
In 1985 the movie The Last Starfighter was the first live-action feature film that had realistic computer animation ofhighly-detailed models.
In 1989 the movie The Abyss was the first movie thatincluded 3D character animation that could be described as“convincing.”
At the end of the 1980s the World-Wide Web was inventedby Tim Berners-Lee, who developed the Hypertext TransferProtocol (HTTP), the Hypertext Markup Language (HTML),the first Web server, and the first Web browser.
During the 1990s Shaded raster graphics began to befeatured in films. Computers started to include 24-bit rasterdisplay and hardware support for more functions that werepreviously only supported in software, such as Gouraud shad-ing. The first graphical Web browser, Mosaic (later becomingNetscape) launched the popular revolution of the World-WideWeb. In 1995 Pixar released Toy Story, the first feature-length,entirely computer-generated film.
During the 2000s graphic software became more capableand much more accessible to a more general class of users.

PC display capabilities continued to advance, including thesupport of real-time texture mapping. Graphics input andoutput devices, such as scanners, printers, and cameras becameaffordable and penetrated the consumer market. 3D modelingadvanced to be able to capture human faces and their expres-sions, hair, water, and other aspects that had previously beendifficult to render.
During the last two decades, the World-Wide Web has pro-gressively transformed from not-much-more than an electronicbulletin board to a full-fledged application development anddeployment environment.
Around 1981-82 Silicon Graphics, Inc. (SGI) was foundedby Jim Clark and several former Stanford students of his.SGI’s initial market was 3D graphics display terminals. Theirfirst systems were based on the Geometry Engine that Clarkand Marc Hannah had developed at Stanford University. TheGeometry Engine was the first hardware (VLSI) implemen-tation of a graphics geometry pipeline, specialized hardwarethat accelerated the geometric computations needed to displayimages of three-dimensional scenes. Access to SGI’s highperformance 3D graphics subsystems was originally donethrough a proprietary API, the IRIS Graphics Language (IRISGL). In 1992, SGI revamped its proprietary GL and createdthe OpenGL API and licensed it to competitors at a low price.Subsequently, SGI created the OpenGL Architecture ReviewBoard, an industry-wide consortium to maintain the OpenGLstandard. This led to the ability to write cross-platform graph-ics programs. OpenGL has since been the primary real-time3D graphics standard that is portable across several operatingsystems and platforms. OpenGL-ES (“Embedded Systems”)runs on many types of mobile devices and embedded systems.WebGL, one of the primary technologies surveyed in thispaper, is a derivative of OpenGL-ES to a Web-based graphicsenvironment.
III. HTML5
“Developers of software for the World-Wide Web say thenew HTML5 standard is revolutionizing the way the Webevolves, works, and is used. It is simplifying the work ofprogrammers, harmonizing access to diverse devices and appli-cations, and giving users amazing new capabilities, they say.”[25]
HTML5 is to Mobile+Cloud as Java is to desktop comput-ing: a cross-platform application-building technology.
While HTML5 sounds like just a new version of the HTMLmarkup language itself, several standards are wrapped into it:DOM, the Document Object Model for accessing and manip-ulating HTML documents; CSS or Cascading Style Sheets,to define the presentation and appearance of a document; andJavaScript, which is rapidly becoming one of the most usedscripting languages. But even more so, the term HTML5 isoften used as an inclusive collection of specific APIs, whichenable the utilization of client-side resources, such as location-based services, client-side graphics, client local storage, andaudiovisual capabilities, including sound-, camera-, photo- andvideo handling and presentation.
The World-Wide Web Consortium (W3C) oversees thedevelopment of HTML5, which is a central piece of its OpenWeb Platform, the combination of the markup language itselfand the technologies that are associated with it, including itsgraphics capabilities (which are the focus of this survey). TheW3C governs the HTML5 standards, but vendors implementthe standards independently. Vendors have the freedom toinnovate, and these innovations often become W3C standards.For example, Apple unilaterally introduced the Canvas elementin 2004, way before it found its way into the latest HTMLstandard definitions. Because of this dynamic “push and pull”between vendors and standards, implementations of the stan-dards are continually increasing in quality and the evolutionof the technology is not the responsibility of any single entity.Building applications with HTML5 avoids vendor lock-in,and affords compatibility across most desktop browsers andmobile devices (when developers observe certain rules andconstraints). [26], [27], [28]
IV. WEB-BASED VISUAL COMPUTING
The primary W3C graphics technologies today are HTML5Canvas, WebGL, and Scalable Vector Graphics (SVG). Graph-ics and visualization libraries have been built upon thesestandards, providing developers higher levels of abstractionfor working with interactive graphics.
HTML5 Canvas is an immediate-mode graphics API for theWeb [29]. The concepts behind Canvas are not fundamentallynew; rather, they represent the introduction of well-known 2Dgraphics techniques into the world of HTML and JavaScript.Many similar APIs have come before Canvas, such as Cairo,Java2D, graphics libraries of the .NET platform, QT, and GTK.Because these types of frameworks give developers full accessto the graphical display, they allow developers to build entireapplications from the ground up with custom designed looks-and-feels and graphical behavior. Now this capability has cometo the Web, and to the mobile devices that are increasinglybeing used to access it and view its contents. For this reason,some have said that the Canvas is the single most powerfulHTML5 element [30].
WebGL is a JavaScript API for rendering 2D and 3D graph-ics within supporting Web browsers without the need for anyexternal assistive technologies, such as plug-ins. It is based onOpenGL ES 2.0, a simplified version of the standard graphicslibrary OpenGL that provides immediate-mode 3D graphicscapability. No concept of WebGL is fundamentally new, butrather it represents the introduction of hardware-accelerated3D graphics into the world of HTML and JavaScript. WebGLbrings known graphics capabilities to the Web, includingrendering 3D scenes, lighting, textures, and definition ofshaders. Scene graph libraries, such as Three.js [31], provideimplementations of retained-mode 3D graphics [32]. Physicslibraries like Box2D.js provide physics simulation [33].
Scalable Vector Graphics (SVG) is a DOM-based W3Cstandard for retained-mode vector graphics [34]. When usingSVG, developers specify a 2D scene graph by manipulatingthe DOM, and the SVG implementation is responsible for

rendering the scene to a bitmap for display whenever updatesoccur. Data Driven Documents (D3.js, [35]) is a notablelibrary based on the use of SVG for developing interactivevisualizations.
V. HTML5 CANVAS
Fig. 1. Example code that draws colored rectangles using HTML5 Canvasand the resulting graphic.
The HTML5 Canvas API allows developers to insert arectangular bitmap as an element in an HTML page andaccess it through a JavaScript API. The Canvas bitmap isessentially an array of colored pixels, and the API providesfunctions for manipulating the bitmap using well-known 2Dgraphics concepts and techniques. Figure 1 shows an examplecode that draws colored rectangles using HTML5 Canvas andthe resulting graphic. The Canvas API was originally definedand implemented by Apple in 2004, and was subsequentlyproposed as a standard. Today Canvas is implemented in allmajor browsers, and polyfills, such as ExplorerCanvas andGoogle Chrome Frame, support backward compatibility witholder browsers. In this section we outline the capabilities ofCanvas in detail.
Like many other 2D graphics frameworks, Canvas usesa stateful context for determining properties of graphicalelements drawn. The Canvas 2D context includes the followingvariables [30]:
• canvas — a reference to the containing Canvas element;• fillStyle — the color, gradient, or repeated image
pattern used for filling shapes;• strokeStyle — the color, gradient, or repeated image
pattern used for stroking (tracing the outline of) shapes;• font — the font used by fillText andstrokeText;
• globalAlpha — a global alpha value between 0 (trans-parent) and 1 (opaque) applied to all drawing operations;
• globalCompositeOperation — the operation usedwhen compositing graphical layers;
• lineCap — the form used for line endings. Valid valuesare:
– butt — draws the ending as square and exactlymatched to the end point;
– round — draws a rounded ending, as a circlecentered on the end point;
– square — draws the ending as a square whosecenter is the end point;
• lineWidth — the width (in pixels) of lines drawn;• lineJoin — the way line joins are drawn. Valid values
are:– bevel — a flat connecting face is drawn;– round — the join is rounded;– miter — the lines extend to meet at a point;
• miterLimit — the maximum extent that lines willextend to meet one another when lineJoin is set tomiter;
• shadowBlur — the amount shadows are blurred;• shadowColor — the color of shadows;• shadowOffsetX, shadowOffsetY — the vector (in
pixels) by which shadows are shifted;• textAlign — the horizontal alignment of text. Valid
values are “start,” “end,” “left,” “right,” or “center”;• textBaseline — the vertical alignment of text.
Valid values are “top,” “hanging,” “middle,” “alphabetic,”“ideographic,” or “bottom” [36].
Once the context variables are set, paths that use their valuescan be drawn to the canvas. Functions are provided for pushingthese context variables onto a stack (context.save) andpopping them off the stack (context.restore). The Can-vas element provides functions for drawing lines, polygons,arcs, and text. Paths can be filled with solid colors, gradients(both linear and radial), or repeated image patterns. Beziercurves are also supported. Styles can be set for line caps andjoins. A comprehensive text drawing API is provided.
The Canvas API exposes the pixels of the bitmap directly,allowing the construction of filters, such as blur, invert, andemboss. This functionality also enables implementation ofcomputer vision algorithms. Image data can be exportedand potentially uploaded to a server. A compositing APIthat supports composition of multiple bitmaps using varioustechniques is also provided. Shadows are supported, but carrya severe performance penalty when used. External image dataand frames from an HTML5 Video element can be loaded anddrawn on the Canvas.
The Canvas API alone is not enough to build interactivegraphics applications. Mouse and keyboard events (and multi-touch events from mobile devices) must be accessed throughJavaScript and used to drive graphical manipulations. A spe-cial function, called requestAnimationFrame, has beenintroduced for implementing smooth animations. This is abetter alternative to using setInterval for an animationloop because it provides timing of animation frames that aresynchronized with the refresh rate of the graphics hardware,and implementations can provide additional optimizations(e.g., not executing animations when the page is not visible).As JavaScript is single threaded, intensive computations thatwould slow the animation loop (such as physics or imageprocessing) can be offloaded to other threads using Web

Workers [37], [38]. Using WebSockets [39], a W3C standardfor bidirectional communication between servers and clients,real-time multi-user scenarios can be brought into Canvas-based applications. When used in conjunction with thesefeatures, Canvas provides a basis for constructing full-featuredinteractive graphics applications.
HTML5 is rapidly being deployed now but is not a finishedstandard. Adoption levels vary. For example, there is currentlyno single HTML5 standard for video compression (codec),streaming protocols, or digital rights management (DRM).Until recently it was almost taken for granted that Adobe’sFlash would define de-facto video standards. However, Apple’srejection of Flash for iOS has completely changed the map.Apple has vigorously implemented and promoted the use ofHTML5 as an in-browser video standard. This has fracturedFlash’s status, especially after Adobe announced it would notdeliver a mobile-capable version. In addition, at this time bothMicrosoft and Google have taken slightly different approachestoward video delivery. More generally, browsers coverage andsupport of HTML5 varies. (Users can test their browser’sHTML5 support at [40].) “But the individual specificationsare at different maturity levels and will become standards atdifferent times.” [25]
VI. 2D GRAPHICS
Two-dimensional graphics on a Web browser can be sup-ported by a number of libraries and tools.
A. 2D Graphics Libraries
Processing.js is a library for immediate-mode graphics thatuses HTML5 Canvas [41], based on the original Java-basedProcessing project [42]. The Processing language parser andthe Processing graphics API implementation are the two majorcomponents of Processing.js. The Processing language parsertransforms source code written in the Java-like Processinglanguage into JavaScript. This enables developers to executeProcessing programs in an HTML5 environment with little orno code modification. Processing.js implements the originalProcessing graphics API using HTML5 Canvas for 2D featuresand WebGL for 3D features. In practice, many developersprefer to use the Processing API from JavaScript rather thanwrite their software in the Processing language. This is becausethe introduction of another language into a project introducescomplexity, and because Processing programs are difficult todebug.
Paper.js is a scene graph library for 2D graphics that usesHTML5 Canvas [43]. Paper.js provides a vector graphics scenegraph similar to that of Adobe Illustrator. The Paper.js APIis inspired by, and mostly compatible with Adobe Scriptog-rapher, a JavaScript scripting plugin for Adobe Illustrator,created by the developers of Paper.js. Paper.js provides supportfor common graphics primitives, groups, layers, paths (Beziercurves) with outline drawing, mouse and keyboard interaction,working with raster images, and vector geometry operations.The main contribution of Paper.js is that it brings the vec-tor graphics model of Adobe Illustrator to the Web, giving
developers a straightforward cross-browser retained-mode 2Dgraphics API.
Data Driven Documents (D3) is a JavaScript library writtenby Mike Bostock for 2D Web-based interactive data visual-ization [35]. D3 solves the problem of performing DocumentObject Model (DOM) manipulation based on data. D3 usesa declarative approach leveraging functional programmingtechniques, so developers can write concise statements tomanipulate the DOM based on data rather than writing verboseand convoluted data transformation code using the raw DOMAPI. D3 does not introduce its own graphics API or scenegraph model, but rather provides developers a powerful toolfor leveraging Web standards such as SVG and CSS. D3 isthe successor to ProtoVis [44], a visualization library thatdid introduce its own graphics vocabulary. Figure 2 shows anexample applications of the Data Driven Documents (D3.js)library demonstrating the capabilities of SVG (Scalable VectorGraphics).
VII. 3D GRAPHICS
Three-dimensional graphics on a Web browser can besupported by a number of libraries and tools.
A. WebGL
As mentioned above, WebGL (Web Graphics Library), isa JavaScript API for rendering 2D and 3D graphics withinsupporting Web browsers without the need for any externalassistive technologies, such as plug-ins. It is based on OpenGLES 2.0, a simplified version of the standard graphics libraryOpenGL that provides immediate-mode 3D graphics capabil-ity.
OpenGL was devised for desktop graphics. OpenGL ES2.0 is an OpenGL subset, designed for embedded systems,including mobile devices. WebGL is based on, but not identicalto OpenGL ES 2.0. The differences between WebGL andOpenGL ES 2.0 have been documented in [45].
WebGL brings known graphics capabilities to the Web. We-bGL has been integrated into Web browser standard elements,providing graphics processing unit (GPU) acceleration of alltypical graphics functionality, but carried out via the Web-page’s Canvas.
WebGL elements are introduced into a Web page just likeany other HTML elements and can be mixed with them.
To write a WebGL program, a developer needs to writeJavaScript control code as well as rendering (also referred toas shader) code to be executed on the GPU.
The WebGL Working Group was initiated in 2009 byKhronos Group, a non-profit technology consortium. Apple,Google, Mozilla, Opera, and others were among the first toparticipate [46], [47], [48], [49].
Several libraries have been introduced for WebGL devel-opment. Among them are WebGLU (the first WebGL librarymade publicly available), GLGE, C3DL, CopperLicht, GLOW,SpiderGL, PhiloGL, gwt-g3d, SceneJS, X3DOM, Oak3D,Processing.js, Three.js, KickJS, OSGJS, XB PointStream,CubicVR.js, A3 (Aerotwist), Jax, ANGLE, XTK — The X

Fig. 2. Example applications of the Data Driven Documents (D3.js) library [35] demonstrating the capabilities of SVG (Scalable Vector Graphics).
Toolkit (WebGL for Scientific Visualization), EZvideo-Web,and Zlatnaspirala.
We refrain from describing all these various libraries. In-stead, we discuss just a few, and refer the reader to theliterature for details on the other ones.
B. 3D Graphics Libraries
We have described Processing.js in Section VI-A.Three.js is a JavaScript library for 3D graphics that abstracts
the rendering layer, allowing developers to write the samecode for rendering 3D graphics using either WebGL, HTML5Canvas, or SVG [31]. Three.js introduces standard 3D graphicsabstractions, such as a scene graph, cameras, meshes, mate-rials, textures, lighting models, common objects (e.g., cubesand spheres), support for loading 3D models in the Colladafile format, and more. A wealth of examples using Three.js arepublished on the Web. A physics engine has been created forThree.js called Physijs [50], built on Ammo.js (a direct port ofthe Bullet physics engine to JavaScript) [51]. Figure 3 showsan example applications of the Three.js library demonstratingthe capabilities of WebGL.
VIII. MOBILE APP DEVELOPMENT AND DEPLOYMENT
An integral part of the Mobile+Cloud vision, includesmobile applications (“mobile apps” in the current lingo).While mobile apps provide general functionality on mobiledevices, such as smart phones and tablets, they stand to playan increasing role in what is the focus of this survey: visualcomputing that is executed on Web browsers, in collaborationwith cloud-based data repositories and servers. For this reason,we find it important to understand the basics of mobile appsdevelopment and deployment.
A. Developing apps
HTML5 is increasingly serving as a common “write once,run anywhere” platform for developing mobile applications.
Rather than write an Android native application using Java,then port the application to iOS using Objective-C, then portit again to Windows Mobile using Microsoft’s tools, onecan now write applications once using HTML5 (utilizingsome mobile-specific compatibility tricks) and deploy themas native applications to all of these platforms using toolssuch as PhoneGap [52] or Appcellerator-Titanium [53] . Whilenot without its own shortcomings and problems, this cross-platform capability is a powerful force driving HTML5 towardbeing the most widely used application development approach.
1) Native apps: Native apps have capabilities not availableto Web pages due to some limitations, such as browsersandboxing. These capabilities include:
• Access to the device’s file system;• native operating system features (e.g., launching sub-
applications with Android intents);• hardware accelerated graphics;• accelerometer;• camera;• compass;• geolocation;• notifications with alerts, sound, or vibration;• access to the user’s contacts;• access to the revenue-generating app marketplaces, such
as the Apple Store or Google Play (formerly the AndroidMarket).
There is a high cost associated with developing applicationswith native tools for multiple mobile platforms. Imagine acompany chooses to develop an Android application using theJava programming language and Android tooling. The appbecomes a huge success and makes the company millions.Now the company wants to release a version that will runon iPhones and iPads (iOS devices). In order to get theirapplication to work on iOS devices, the company must investmany hours of development time to re-implement the appli-
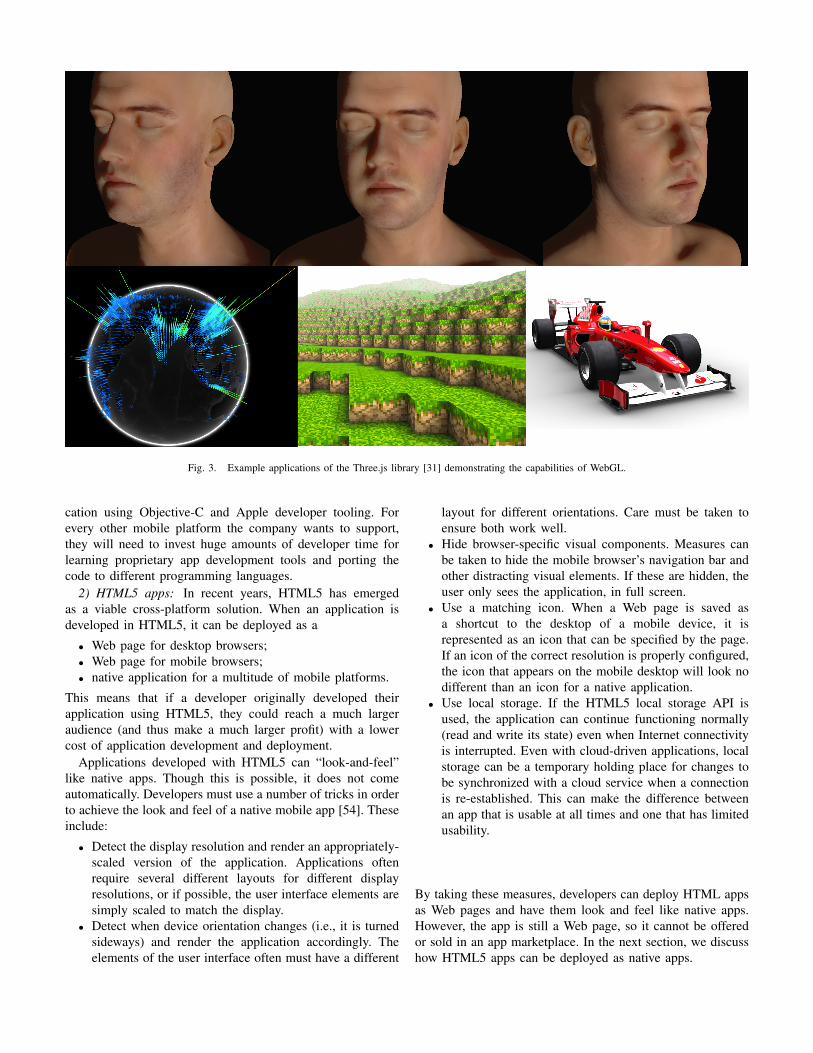
Fig. 3. Example applications of the Three.js library [31] demonstrating the capabilities of WebGL.
cation using Objective-C and Apple developer tooling. Forevery other mobile platform the company wants to support,they will need to invest huge amounts of developer time forlearning proprietary app development tools and porting thecode to different programming languages.
2) HTML5 apps: In recent years, HTML5 has emergedas a viable cross-platform solution. When an application isdeveloped in HTML5, it can be deployed as a
• Web page for desktop browsers;• Web page for mobile browsers;• native application for a multitude of mobile platforms.
This means that if a developer originally developed theirapplication using HTML5, they could reach a much largeraudience (and thus make a much larger profit) with a lowercost of application development and deployment.
Applications developed with HTML5 can “look-and-feel”like native apps. Though this is possible, it does not comeautomatically. Developers must use a number of tricks in orderto achieve the look and feel of a native mobile app [54]. Theseinclude:
• Detect the display resolution and render an appropriately-scaled version of the application. Applications oftenrequire several different layouts for different displayresolutions, or if possible, the user interface elements aresimply scaled to match the display.
• Detect when device orientation changes (i.e., it is turnedsideways) and render the application accordingly. Theelements of the user interface often must have a different
layout for different orientations. Care must be taken toensure both work well.
• Hide browser-specific visual components. Measures canbe taken to hide the mobile browser’s navigation bar andother distracting visual elements. If these are hidden, theuser only sees the application, in full screen.
• Use a matching icon. When a Web page is saved asa shortcut to the desktop of a mobile device, it isrepresented as an icon that can be specified by the page.If an icon of the correct resolution is properly configured,the icon that appears on the mobile desktop will look nodifferent than an icon for a native application.
• Use local storage. If the HTML5 local storage API isused, the application can continue functioning normally(read and write its state) even when Internet connectivityis interrupted. Even with cloud-driven applications, localstorage can be a temporary holding place for changes tobe synchronized with a cloud service when a connectionis re-established. This can make the difference betweenan app that is usable at all times and one that has limitedusability.
By taking these measures, developers can deploy HTML appsas Web pages and have them look and feel like native apps.However, the app is still a Web page, so it cannot be offeredor sold in an app marketplace. In the next section, we discusshow HTML5 apps can be deployed as native apps.

B. Cross platform development tools and environments
Most mobile development platforms have a user interfacecomponent available that can display a Web page within anative app. This means that it is possible to build native appsthat simply load a full screen view of a Web page, which canitself be a full-featured HTML5 app. In this way, HTML5 appscan be deployed as native apps.
In addition to the ability to build a native mobile app thatdisplays a Web page, it is also possible to modify the runtimeof that Web page such that arbitrary functions in the native appare available to JavaScript code on the loaded Web page. Thismeans that arbitrary functionality available to native apps canbe exposed via a JavaScript API to Web pages. In this way,HTML5 apps can gain all the functionality available to nativeapps.
Thus the pattern for deploying HTML5 apps as native appsis as follows:
• Build a native app that displays a Web page;• Expose native functionality to the Web page via a
JavaScript API;• Build the HTML5 app as a Web page embedded within
a native app, taking advantage of native functionality viathe JavaScript API.
1) PhoneGap: Because the pattern for transformingHTML5 apps into native mobile apps is straightforward, it canbe automated. Because mobile device capabilities are similaracross platforms, the JavaScript API to native functionality canbe standardized. The PhoneGap project automates the transfor-mation of HTML5 apps into native mobile apps, and specifiesa single JavaScript API for accessing native capabilities acrossmany mobile platforms [52]. Using PhoneGap, developers canauthor HTML5 apps once, then derive native apps for thefollowing platforms in a single automated step:
• Android;• iOS;• Windows Mobile;• WebOS;• Symbian;• Bada.Once a native app is created, the author can go through the
typical steps for deploying the app to revenue-generating appmarketplaces, such as Apple’s App Store and Google Play.
2) Appcellerator Titanium: Appcellerator Titanium [53] isa comprehensive mobile app development platform based onJavaScript APIs and HTML5. Appcellerator includes:
• A software SDK for developing mobile apps;• An Eclipse-based IDE equipped with platform-specific
tooling;• A suite of cloud-based services to speed app develop-
ment;• An app analytics service.The Titanium Mobile SDK provides developers the means
to write an app once in JavaScript and automatically deploythe app to numerous mobile platforms (as native apps aswell as mobile Web apps) using a process similar to that
of PhoneGap. The Appcellerator development environment,Titanium Studio, is an Eclipse-based IDE that offers platform-specific functionality for developing, testing, and deployingmobile apps. Appcellerator Cloud Services provide scalableback end features that are common to many apps and wouldnormally need to be implemented by app developers. Thesefeatures include user management, logins, photo uploads, pushnotifications, and status updates. The Appcellerator Analyticsservice aids app developers in collecting and analyzing dataabout users, sessions, and actions taken within apps.
C. Deploying apps
So far we have covered how to build an HTML5-basedapplication and package it as a native app for various plat-forms. In this section we will survey the means by whichauthors can get their app “out there” and generate revenue.As of June 2012, 51.8% of smart phone owners had a devicerunning Android, and 34.3% had a device running iOS [55].Therefore the corresponding app marketplaces, Google Play(“Android Market”) and the iOS App Store, are the two nativeapp marketplaces that reach the most users.
1) Android Market and Google Play: The Android Marketis Google’s app marketplace for Android. App developers canpublish their apps in the Android Market, and the processof payment and deployment to client devices is managed bythe platform. Android Market has evolved into a new servicecalled Google Play, which features a new interface, new appdiscoverability features (such as a recommendation system),and sells not only apps but also music, books, and movies.Publishing apps to Google Play is an automated process thatis free for developers. This mean that after having developedan Android app, authors can follow a straightforward apppreparation and Web-based publishing process [56], and theirapp will appear in the marketplace within minutes.
2) iOS App Store: The iOS App Store is Apple’s app mar-ketplace for iOS devices, including the iPhone, iPod Touch,and iPad. The App Store follows a similar approach to that ofthe Android Market, but in contrast is very strictly moderated,and costs developers $99 per year to develop, submit, and keepapps available at the Store. The App store has been notoriousfor rejecting apps for nebulous reasons [57].
3) Chrome Web Store: The Chrome Web Store is an appmarketplace from Google, aimed at Chrome users [58]. Theconcept of a “Chrome App” is that of a Web app withadditional metadata stored by Chrome, with an icon to launchthe app from the Chrome home page. Many of these appsare free, but collecting payment is possible when the ChromeWeb Store Payments system is used. The cost for becomingan app author on the Chrome Web Store is $5, and there areno recurring fees for authoring each app.
Several other app stores have emerged, including Amazon’sApp Store, Zeewe, a marketplace for Mobile Web Apps,TapJS, a game hosting service, and Playtomic. Based on themarket share statistics presented above, developers can reachthe largest majority of their potential audience by focusing on

Apple’s App Store (the only marketplace for iOS apps) andGoogle Play for Android apps.
IX. CLOUD COMPUTING
Cloud Computing has become so prevalent in the computingscenery that it requires little, if any discussion. Cloud Com-puting is an umbrella term for various levels of storage andprocessing services deployed on outsourced servers (on “thecloud”), providing computing and storage infrastructure on an“as a service” basis. The three types of Cloud Computing are:
• SaaS: Software as a Service — application softwarerunning on a service-provider’s network of servers insteadof software packages installed and running on a user’slocal computer (e.g., Web-based email, Google Docs);
• PaaS: Platform as a Service — a computing platform,including an operating system, execution environmentsfor various programming languages, databases, and Webservers (e.g., AWS—Amazon Web Services, includingAmazon’s EC2—Elastic Compute Cloud and S3—SimpleStorage Service; Heroku; Google App Engine; WindowsAzure);
• IaaS: Infrastructure as a Service — service providers offercomputers, most often as virtual machines, raw storage,load balancing, and network support. Users have theresponsibility to install operating systems and applicationsoftware (e.g., Amazon CloudFormation, Rackspace, andGoogle Compute Engine).
One of the major tenets of the as-a-service model, in eitherof these types, is the elasticity concept: users rent (and payfor) only as much capacity as they need. They can increase ordecrease their resource utilization as demand grows or wanes.This is a very attractive scalable model, in which a buddingenterprise can obtain minimal amounts of resources, but canscale up seamlessly as demand and need grow. The businessmodel behind Cloud Computing is similar to a utility: just likeyour electric, gas, or phone company bills you for meteredusage, so does a cloud provider.
X. CLOUD COMPUTING AND MOBILE HTML5 APPS
With the proliferation of cloud computing and ever morecapable mobile devices a new compute model is rapidlygaining foot: Mobile+Cloud Computing. We anticipate it tobecome the prevailing compute model for most applications.It is compelling because, while the increase in mobile de-vices’ capabilities make them more and more “computers inour pockets” (or in our palms), they still exhibit processinglimitations, even compared to desktop or laptop computers.However, linked to a cloud-based infrastructure, they canbe the front end to a hybrid computation model, in whichsome computing gets executed on the mobile device, but thecloud is being used for more demanding compute tasks, largerstorage requirements, as well as the ability to provide a fullysynchronized experience among a user’s increasing number ofdevices, including a smart phone, a tablet, laptop and desktopcomputers, and more.
Due to the recent growth in cloud computing discussedabove, it has become possible to develop and deploy mobileapps using only a Web browser. For example, a buddingapp developer can get started at no cost with the followingsteps: create a repository in GitHub, deploy it as a Web siteusing GitHub Pages, use Cloud9 IDE to develop an interactiveCanvas-based mobile Web app, then deploy it to the GitHubPages site. When server-side resources are needed (such as adatabase or real-time communication service), the developercan then use Cloud9 IDE to build server-side software usingNode.js and deploy it to the Heroku cloud in a scalablemanner. At this stage, a service called PhoneGap Build canautomatically build native apps from your source code inthe cloud, giving you apps ready for deployment in appmarketplaces. In this way, modern services such as GitHub,Cloud9 IDE, Node.js, Heroku, and PhoneGap Build can forma complete browser-based app development and deploymenttoolchain.
XI. INTERACTIVE VISUALIZATION ON MOBILE+CLOUD
Visual computing in general, and interactive visualization inparticular, stand to gain from the Mobile+Cloud model. This isbecause, on the one hand, they require substantial computingresources, and on the other hand, they need visual, interactivedisplays.
We briefly survey early demonstrations of these capabilitiesnow.
A. Case studies
Fig. 4. Layers of Zygote Body (formerly Google Body Browser) [59], anexemplary application of WebGL.
1) Google Body Browser: Google Body Browser, nowknown as Zygote Body [59], is a virtual human body. Fash-ioned after the National Library of Medicine’s Visible HumanProject, it was originally launched in the end of 2010 todemonstrate the Chorme Web browser’s capabilities, utilizingHTML5, its Canvas element, and WebGL.
Users can peel away layers, such as skin, muscles, bones,the vascular system, and the nervous system. Users can zoom

and rotate the 3D model. Users can click on each individualbody part to highlight it and get its name. A search boxallows for finding body parts by name. This is an exemplaryexample application of WebGL. Body Browser has been portedto a native Android app [60], taking advantage of native appfeatures such as data bundling and accelerated graphics. Othersimilar projects have appeared, such as BioDigital Human [61]and the OpenWorm Browser. Figure 4 shows layers of ZygoteBody.
2) Google Maps: Google Maps, a Web-based mappingservice with a rich feature set, is a perfect example of avisual computing application in which the graphics “heavylifting” of rendering the map images takes place on the serverside. Google Maps provides services for navigating maps withseveral views (satellite imagery, street maps, bicycle maps,terrain, weather, photos, traffic, and more), find directionsfrom place to place, share map configurations and more.Google Maps exists as a Web app for desktop browsers, aWeb app for mobile devices, and an optimized native appfor many mobile platforms. The native apps take advantageof the device’s geolocation, and provide additional features,such as “show me where I am now” and live driving andwalking directions. Google also provides an API that allowsdevelopers to effortlessly embed maps within their apps [62].See Figures 5 and 6 for examples of some Google Maps’capabilities.
Fig. 5. An animated visualization of Wal Mart stores popping up across theUS created using the Google Maps API (Google Maps blog post).
3) TileMill: TileMill is an open source project managedby the company MapBox for rendering map tiles on theserver side, styled using their own CSS-like map stylinglanguage called CartoCSS [63]. TileMill is based on opensource projects, including Mapnik and Node.js. TileMill is apowerful tool for developing interactive map applications thatcan, for example, overlay a data visualization on a map, orre-style existing map data, such as OpenStreetMap [64]. SeeFigures 7–10 for examples.
4) Tableau Public: Tableau Public is an adaptation of theTableau visualization software to the social Web. The Web-based version of Tableau enables interactive visual analysis
Fig. 6. A demonstration of Heat Map capabilities in the Google Maps API.The Heat Map is rendered on the client side as a layer on top of map tilesrendered on the server side (Google Maps blog post).
Fig. 7. A HeatMap visualization of solar energy potential across the US(data from the National Renewable Energy Laboratory). The visualization isrendered on the server side using TileMill (Energy.gov).
by relaying user interactions to server-side instances of theTableau software, rendering the visualization on the server,then sending the rendered image to the client. Tableau Publichas a gallery feature, where users can post their visualizations,comment on them, share them across the Web, and embedthem into their own pages [65].
B. Web Based Development Showcases
1) OpenProcessing: “OpenProcessing is an online commu-nity platform devoted to sharing and discussing Processingsketches in a collaborative, open-source environment.” [42],[66]
2) Google Chrome Experiments: Google Chrome Ex-periments is an initiative to collect example applicationsof HTML5 technology [67]. This initiative has showcasedprojects including:
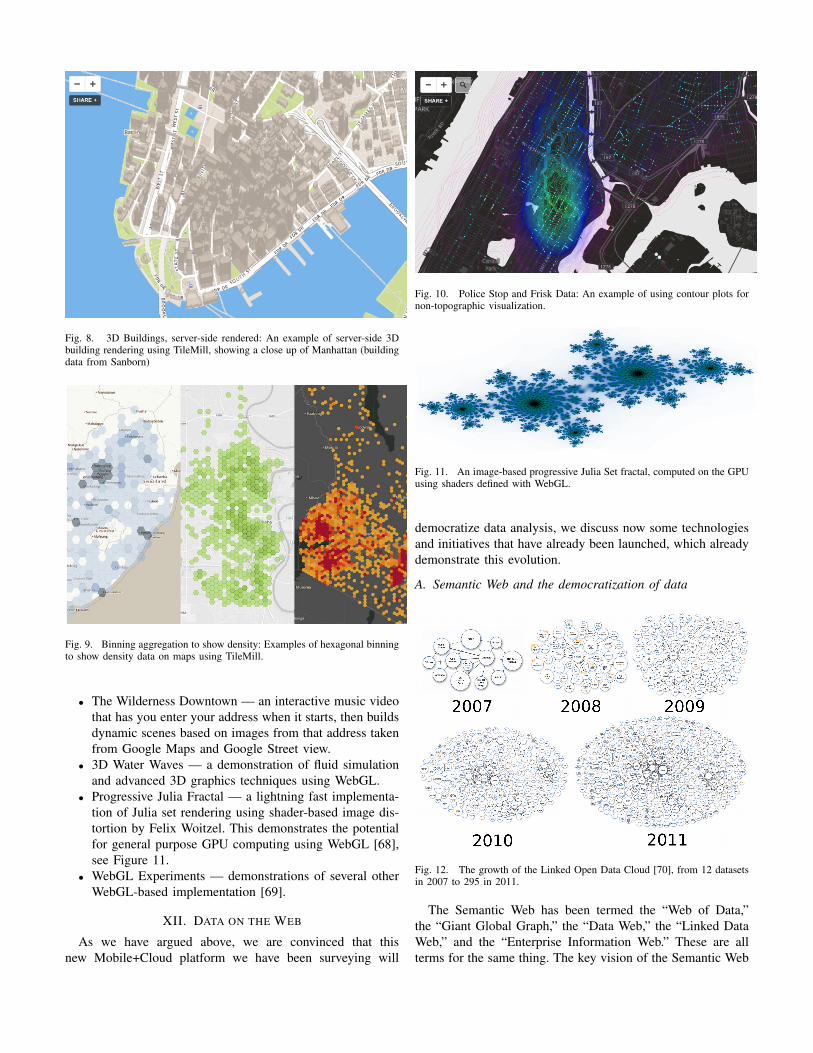
Fig. 8. 3D Buildings, server-side rendered: An example of server-side 3Dbuilding rendering using TileMill, showing a close up of Manhattan (buildingdata from Sanborn)
Fig. 9. Binning aggregation to show density: Examples of hexagonal binningto show density data on maps using TileMill.
• The Wilderness Downtown — an interactive music videothat has you enter your address when it starts, then buildsdynamic scenes based on images from that address takenfrom Google Maps and Google Street view.
• 3D Water Waves — a demonstration of fluid simulationand advanced 3D graphics techniques using WebGL.
• Progressive Julia Fractal — a lightning fast implementa-tion of Julia set rendering using shader-based image dis-tortion by Felix Woitzel. This demonstrates the potentialfor general purpose GPU computing using WebGL [68],see Figure 11.
• WebGL Experiments — demonstrations of several otherWebGL-based implementation [69].
XII. DATA ON THE WEB
As we have argued above, we are convinced that thisnew Mobile+Cloud platform we have been surveying will
Fig. 10. Police Stop and Frisk Data: An example of using contour plots fornon-topographic visualization.
Fig. 11. An image-based progressive Julia Set fractal, computed on the GPUusing shaders defined with WebGL.
democratize data analysis, we discuss now some technologiesand initiatives that have already been launched, which alreadydemonstrate this evolution.
A. Semantic Web and the democratization of data
Fig. 12. The growth of the Linked Open Data Cloud [70], from 12 datasetsin 2007 to 295 in 2011.
The Semantic Web has been termed the “Web of Data,”the “Giant Global Graph,” the “Data Web,” the “Linked DataWeb,” and the “Enterprise Information Web.” These are allterms for the same thing. The key vision of the Semantic Web
is to link explicit data published on the Web in a machine-readable fashion in order to enable applications, includingtargeted search, data browsing, and intelligent agents [71].
Resource Description Framework (RDF) [72] is the foun-dational data representation framework for the Semantic Web.RDF represents data as triples of (subject, predicate, object).With this model, RDF is capable of representing any datastored in relational databases. Higher levels of the SemanticWeb framework include the Web Ontology Language (OWL)for representing domain ontologies and inference rules [73].Vocabularies provide data publishers common means of ex-pressing domain concepts. More general vocabularies, such asthe RDF Data Cube Vocabulary [74] aim to enable integrationof statistical data from many data providers.
Public data sets are increasingly being published withinthe Semantic Web. Visual data analysis tools, when built toconsume data of this form, will be able to access data as itbecomes available. The combination of the Semantic Web andWeb-based Visual Computing may lead to a world in which adigital mirror world is readily available for access by anyone,and rich Web-based visualization and analysis tools that canbe applied to such information are commonplace. Figure 12shows the growth of the Linked Open Data Cloud [70], from12 datasets in 2007 to 295 in 2011.
B. Public data initiatives
We survey now a few initiatives providing public data.1) UN, World Bank, US Federal Data, more: The United
Nations has published a huge amount of publicly-availabledata, consisting of 34 databases and 60 million records in total[75]. The data sets consist primarily of indicators over yearsat the level of countries. Topics covered include economics,energy, human development, crime, health, tourism, telecom-munications and more.Data.gov provides access to many data sets.The Fedstats site at fedstats.gov publishes links to
numerous public data sets hosted by various US governmentorganizations.
2) Example visualizations of public data: The following area few examples demonstrating how public data and Web-basedvisualization can be employed to help understand differentproblems, issues, and the world in general.
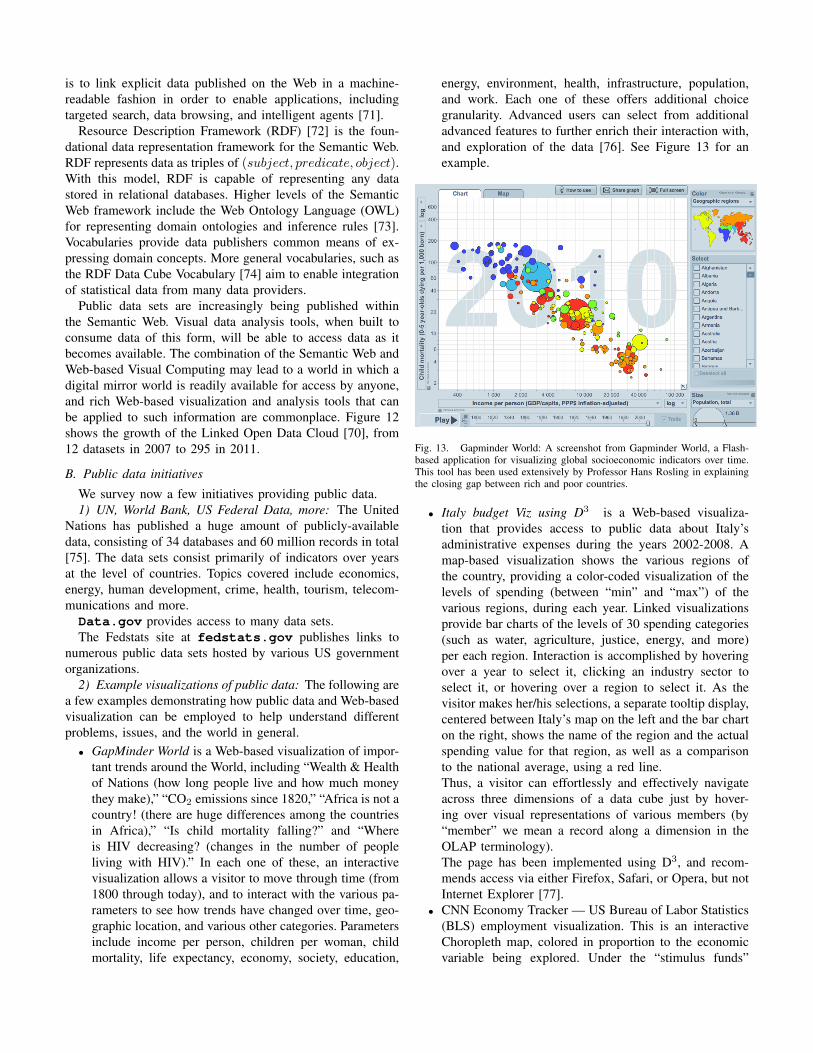
• GapMinder World is a Web-based visualization of impor-tant trends around the World, including “Wealth & Healthof Nations (how long people live and how much moneythey make),” “CO2 emissions since 1820,” “Africa is not acountry! (there are huge differences among the countriesin Africa),” “Is child mortality falling?” and “Whereis HIV decreasing? (changes in the number of peopleliving with HIV).” In each one of these, an interactivevisualization allows a visitor to move through time (from1800 through today), and to interact with the various pa-rameters to see how trends have changed over time, geo-graphic location, and various other categories. Parametersinclude income per person, children per woman, childmortality, life expectancy, economy, society, education,
energy, environment, health, infrastructure, population,and work. Each one of these offers additional choicegranularity. Advanced users can select from additionaladvanced features to further enrich their interaction with,and exploration of the data [76]. See Figure 13 for anexample.
Fig. 13. Gapminder World: A screenshot from Gapminder World, a Flash-based application for visualizing global socioeconomic indicators over time.This tool has been used extensively by Professor Hans Rosling in explainingthe closing gap between rich and poor countries.
• Italy budget Viz using D3 is a Web-based visualiza-tion that provides access to public data about Italy’sadministrative expenses during the years 2002-2008. Amap-based visualization shows the various regions ofthe country, providing a color-coded visualization of thelevels of spending (between “min” and “max”) of thevarious regions, during each year. Linked visualizationsprovide bar charts of the levels of 30 spending categories(such as water, agriculture, justice, energy, and more)per each region. Interaction is accomplished by hoveringover a year to select it, clicking an industry sector toselect it, or hovering over a region to select it. As thevisitor makes her/his selections, a separate tooltip display,centered between Italy’s map on the left and the bar charton the right, shows the name of the region and the actualspending value for that region, as well as a comparisonto the national average, using a red line.Thus, a visitor can effortlessly and effectively navigateacross three dimensions of a data cube just by hover-ing over visual representations of various members (by“member” we mean a record along a dimension in theOLAP terminology).The page has been implemented using D3, and recom-mends access via either Firefox, Safari, or Opera, but notInternet Explorer [77].
• CNN Economy Tracker — US Bureau of Labor Statistics(BLS) employment visualization. This is an interactiveChoropleth map, colored in proportion to the economicvariable being explored. Under the “stimulus funds”

tab, color coded variables are “funds awarded,” “fundsreceived,” and “jobs created/saved” for each US state.Additional tabs provide similar visualizations for “fore-closures,” “unemployment,” and “jobs by industry.” Onecan probe the various states and obtain detailed valuesof the variables for the probed state, which is coloredrelative to these variables. The data spans across USstates, industry, and time [78].
See Figure 14–17 for additional examples.
Fig. 14. Tableau Public Hurricane Visualization: A visualization of histor-ical hurricane trajectories from Tableau Public. The user interface supportsswitching between years. The rendering is performed on the server side.
Fig. 15. OpenStreetMap: A screenshot from the OpenStreetMap projectshowing the detail of its crowdsourced street-level data for Washington DC.
Fig. 16. D3 Sankey Diagram Example: A Sankey Diagram made using D3
showing the flow of energy from sources to uses. The visualization shows onepossible scenario for the UK in 2050, and was created as part of an emissionsreduction initiative.
Fig. 17. Tableau Public Oil Visualization: A visualization of net crude oilproduction (green) and consumption (red) by country from Tableau Public.
XIII. CONCLUSION
We have posited that computing is going through a paradigmshift: the combined proliferation of cloud-based compute envi-ronments and services, and ever more capable mobile devices,such as smart phones and tablets, has led the way towardsa new computing environment, in which mobile devices andcloud-based services cooperate to provide the best computingresources. We have predicted that a large majority of allcomputing will eventually migrate to this model, and we haveobserved that this migration is already taking place.
In anticipation of this paradigm shift, we have focused onvisual computing (defined as the combination of computergraphics, image processing, vision, and visualization) as a

perfect beneficiary of the Mobile+Cloud computing paradigm.As such, we have surveyed fundamental technologies, such asHTML5, HTML5 Canvas, and WebGL, as well as additionaltechnologies, such as 2D and 3D graphics libraries, all ofwhich are catalyzers for this transition. We have providedthe main characteristics, features, and capabilities, and haveidentified strengths, but also potential weaknesses of thesetechnologies.
It is important to remember that this model, these tech-nologies, are all very young, and will continue to evolveand change over the coming months and years. Some willdisappear while other will become cornerstones of the futureof computing in general and visual computing in particular.Readers will have unique opportunities to shape these trends.
REFERENCES
[1] J. D. Foley, A. van Dam, S. Feiner, and J. Hughes, Computer Graphics:Principles and Practice, 2nd ed. Reading, MA: Addison Wesley, 1990.
[2] W. Shoaff, “A short history of computer graphics,”http://cs.fit.edu/∼wds/classes/graphics/History/history/history.html#SECTION00020000000000000000, 30 August 2000.
[3] cfxweb.net, “The evolution of computer graphics,” http://www.cfxweb.net/evolution.
[4] I. Sutherland, “Sketchpad: A man-machine graphical communicationsystem,” Ph.D. dissertation, Massachusetts Institute of Technology, 1963.
[5] J. E. Bresenham, “Algorithm for computer control of a digital plotter,”j-IBM-SYS-J, vol. 4, no. 1, pp. 25–30, 1965.
[6] J. Bresenham, “A linear algorithm for incremental digital display ofcircular arcs,” Commun. ACM, vol. 20, no. 2, pp. 100–106, Feb. 1977.[Online]. Available: http://doi.acm.org/10.1145/359423.359432
[7] S. A. Coons, “Computer graphics and innovative engineering design—super-sculptor,” DATAMATION, vol. 12, no. 5, p. 3234, 1966.
[8] ——, “Uses of computers in technology,” SCIENTIFIC AMERICAN,vol. 215, no. 3, p. 177, 1966.
[9] D. Ahuja and S. A. Coons, “Geometry for construction and display,”IBM SYSTEMS JOURNAL, no. 3-4, p. 188, 1968.
[10] S. A. Coons, “Modification of shape of piecewise curves,” COMPUTER-AIDED DESIGN, vol. 9, no. 3, pp. 178–180, 1977.
[11] ——, “Constrained least-squares,” COMPUTERS & GRAPHICS, vol. 3,no. 1, pp. 43–47, 1978.
[12] T. Sederberg, “BYU Bezier curves,” http://www.tsplines.com/resources/class notes/Bezier curves.pdf.
[13] P. Bourke, “Bezier surfaces (in 3D),” http://local.wasp.uwa.edu.au/∼pbourke/geometry/bezier/index.html, 1996.
[14] A. Appel, “The notion of quantitative invisibility and the machinerendering of solids,” in Proceedings of the 1967 22nd nationalconference, ser. ACM ’67. New York, NY, USA: ACM, 1967, pp. 387–393. [Online]. Available: http://doi.acm.org/10.1145/800196.806007
[15] ——, “Some techniques for shading machine renderings of solids,”in Proceedings of the April 30–May 2, 1968, spring joint computerconference, ser. AFIPS ’68 (Spring). New York, NY, USA: ACM,1968, pp. 37–45. [Online]. Available: http://doi.acm.org/10.1145/1468075.1468082
[16] F. C. Crow, “Shadow algorithms for computer graphics,” inProceedings of the 4th annual conference on Computer graphicsand interactive techniques, ser. SIGGRAPH ’77. New York,NY, USA: ACM, 1977, pp. 242–248. [Online]. Available: http://doi.acm.org/10.1145/563858.563901
[17] H. Gouraud, “Computer display of curved surfaces,” Ph.D. dissertation,1971.
[18] ——, “Continuous shading of curved surfaces,” IEEE Transactions onComputers, vol. C-20, no. 6, pp. 623–629, Jun. 1971.
[19] B.-T. Phong, “Illumination for Computer Generated Pictures,” j-CACM,vol. 18, no. 6, pp. 311–317, 1975.
[20] E. E. Catmull, “A subdivision algorithm for computer display of curvedsurfaces.” Ph.D. dissertation, 1974.
[21] T. Whitted, “An improved illumination model for shaded display,”Commun. ACM, vol. 23, no. 6, pp. 343–349, Jun. 1980. [Online].Available: http://doi.acm.org/10.1145/358876.358882
[22] A. Fournier, D. Fussell, and L. Carpenter, “Computer rendering ofstochastic models,” Commun. ACM, vol. 25, no. 6, pp. 371–384, Jun.1982. [Online]. Available: http://doi.acm.org/10.1145/358523.358553
[23] Pixar, “The RenderMan interface specification,” http://renderman.pixar.com/products/rispec/index.htm, November 2005, version 3.2.1.
[24] T. L. Lancaster, “Renderman books & other publications,” http://www.renderman.org/RMR/Publications/index.html, July 2008.
[25] G. Anthes, “HTML5 leads a Web revolution,” Communications of theACM, 2012.
[26] B. Lawson and R. Sharp, Introducing HTML5, 2nd ed. Berkeley, CA:New Riders Press, 2011.
[27] World-Wide Web Consortium, “HTML5—a vocabulary and associatedAPIs for HTML and XHTML,” http://dev.w3.org/html5/spec/Overview.html, May 8 2012, Editor’s Draft.
[28] W3Schools, “HTML5 Tutorial,” http://www.w3schools.com/html5/default.asp.
[29] Wikipedia, “Immediate mode,” http://en.wikipedia.org/wiki/Immediatemode, July 2011.
[30] D. Geary, Core HTML5 Canvas: Graphics, Animation, and GameDevelopment. Prentice Hall, 2012.
[31] R. Miguel and collaborators, “Three.js,” http://mrdoob.github.com/three.js/, 2012.
[32] Wikipedia, “Retained mode,” http://en.wikipedia.org/wiki/Retainedmode, April 2012.
[33] A. Zakai, “box2d.js: Box2d on the Web is getting faster,” http://mozakai.blogspot.com/2012/02/box2djs-box2d-on-web-is-getting-faster.html.
[34] W3Schools, “SVG Tutorial,” http://www.w3schools.com/svg/default.asp.
[35] M. Bostock, V. Ogievetsky, and J. Heer, “D3 data-driven documents,”pp. 2301–2309, 2011.
[36] World-Wide Web Consortium, “HTML5 specification,”http://www.whatwg.org/specs/web-apps/current-work/multipage/the-canvas-element.html, 2012.
[37] “Web worker,” http://en.wikipedia.org/wiki/Web worker, June.[38] E. Bidelman, “The basics of Web workers,” http://www.html5rocks.com/
en/tutorials/workers/basics/, May 2011.[39] I. Hickson, “The WebSocket API,” http://dev.w3.org/html5/websockets/,
2012.[40] “The HTML5 test — how well does your browser support HTML5?”
http://html5test.com/.[41] J. Resig and collaborators, “Processing.js,” http://processingjs.org/, 2012.[42] C. Reas and B. Fry, Processing: a programming handbook for visual
designers and artists. The MIT Press, 2007.[43] J. Lehni and J. Puckey, “Paper.js,” http://paperjs.org/, 2012.[44] M. Bostock and J. Heer, “Protovis: A graphical toolkit for visualization,”
pp. 1121–1128, 2009.[45] “WebGL and OpenGL differences,” http://www.khronos.org/webgl/wiki/
WebGL and OpenGL Differences, May 2012.[46] G. Tavares, “WebGL fundamentals,” http://www.html5rocks.com/en/
tutorials/webgl/webgl fundamentals/, February.[47] “WebGL specification,” http://www.khronos.org/registry/webgl/specs/
latest/, July 2012.[48] “WebGL — OpenGL ES 2.0 for the Web,” http://www.khronos.org/
webgl/, 2012.[49] Wikipedia, “WebGL,” http://en.wikipedia.org/wiki/WebGL, July 2012.[50] “Physijs: Physics library for three.js,” http://chandlerprall.github.com/
Physijs/.[51] “Ammo.js, a port of the Bullet physics engine from C++ to JavaScript,”
http://syntensity.com/static/ammo.html.[52] Adobe Systems Inc. and contributers, “PhoneGap,” http://phonegap.
com/, 2012.[53] Appcellerator Inc., “Appcellerator Titanium,” http://www.appcellerator.
com/, 2012.[54] J. Seidelin, HTML5 Games: Creating Fun with HTML5, CSS3, and
WebGL. Wiley, 2012.[55] The Nielsen Company, “Two thirds of new mobile buyers now opting
for smartphones,” http://blog.nielsen.com/nielsenwire/?p=32494, 2012.[56] The Android Open Source Project, “Android — the publish-
ing process,” http://developer.android.com/tools/publishing/publishingoverview.html, 2012.
[57] R. JR., “Rejected! 10 iPhone Apps That Didn’t Make Ap-ple’s App Store,” http://www.pcworld.com/article/159887/rejected 10iphone apps that didnt make apples app store.html, 2012.
[58] Google Inc., “Chrome Web store — overview,” https://developers.google.com/chrome/web-store/docs/, 2012.
[59] Zygote Media Group Inc., “Zygote Body,” http://www.zygotebody.com/,2012.
[60] N. Weber, “OpenGL ES 2.0 graphics on Android: Lessons fromGoogle Body,” http://code.google.com/p/gdc2011-android-opengl/wiki/TalkTranscript, 2011.
[61] “BioDigital Human,” biodigitalhuman.com.[62] Google Inc., “Build maps for mobile apps,” https://developers.google.
com/maps/mobile-apps, 2012.[63] MapBox, “TileMill,” http://mapbox.com/tilemill/, 2012.[64] R. Sharmes, “Designing an OSM Map Style,” http://code.flickr.com/
blog/2012/07/11/designing-an-osm-map-style/, 2012.[65] “Tableau Public,” http://www.tableausoftware.com/public/, 2012.[66] “OpenProcessing,” http://www.openprocessing.org/.[67] “Chrome Experiments,” http://www.chromeexperiments.com/.[68] F. Woitzel, “Progressive Julia Fractal,” http://www.chromeexperiments.
com/detail/progressive-julia-fractal/?f=, August 2011.[69] “WebGL Experiments,” http://www.chromeexperiments.com/webgl/.[70] R. Cyganiak and A. Jentzsch, “The linking open data cloud diagram,”
http://richard.cyganiak.de/2007/10/lod/, 2012.[71] L. Feigenbaum, “The Semantic Web Landscape: A Practical
Introduction,” http://www.cambridgesemantics.com/semantic-university/the-semantic-web-landscape-a-practical-introduction, 2012.
[72] O. Lassila, R. Swick et al., “Resource description framework (RDF)model and syntax specification,” 1998.
[73] W3C, “OWL 2 Web Ontology Language — W3C Recommendation,”2009.
[74] R. Cyganiak and D. Reynolds, “RDF Data Cube Vocabulary specifica-tion,” 2012.
[75] United Nations, “UN Data — A World of Information,” http://data.un.org/, 2012.
[76] “GapMinder World,” http://www.gapminder.org/.[77] “Le spese amministrative in Italia dal 2002 al 2008 (administrative ex-
penses in Italy from 2002 to 2008),” http://www.visup.it/misc/workshop/index.htm.
[78] CNN, “CNN Economy Tracker,” http://www.cnn.com/SPECIALS/map.economy/index.html?mapIndex=3&hpt=C2.


![EDA075 Mobile Computer Graphics - LTHfileadmin.cs.lth.se/cs/Education/EDA075/lectures/L1-intro.pdf · EDA075 Mobile Computer Graphics ... [Show solution A1]-Pluto Lab ... Rendering](https://static.fdocuments.in/doc/165x107/5ab0f73a7f8b9ad9788bae7d/eda075-mobile-computer-graphics-mobile-computer-graphics-show-solution-a1-pluto.jpg)


