Closing the Gap: Carbon pricing for the Paris target€¦ · PBO’s analysis uses a carbon tax as...
25
Closing the Gap: Carbon pricing for the Paris target Ottawa, Canada 13 June 2019 Revised 20 June 2019 www.pbo-dpb.gc.ca
Transcript of Closing the Gap: Carbon pricing for the Paris target€¦ · PBO’s analysis uses a carbon tax as...
Closing the Gap: Carbon pricing for
the Paris target
Ottawa, Canada 13 June 2019 Revised 20 June 2019 www.pbo-dpb.gc.ca
(Revised 20 June 2019 to remove references to Environment and Climate Change Canada’s Technology Case)
The Parliamentary Budget Officer (PBO) supports Parliament by providing economic and financial analysis for the purposes of raising the quality of parliamentary debate and promoting greater budget transparency and accountability.
This report provides an estimate of the additional carbon price that would be needed to achieve Canada’s greenhouse gas emissions target in 2030 under the Paris Agreement, as well as an estimate of the corresponding impact on the Canadian economy.
PBO estimates presented in this report are based on the Environmental Impact and Sustainability Applied General Equilibrium model ENVISAGE.
Lead Analysts: Philip Bagnoli, Advisor-Analyst Raphaël Liberge-Simard, Analyst
Contributor: Chris Matier, Senior Director
We thank Dominique van der Mensbrugghe, Research Professor and Director of the Center for Global Trade Analysis (GTAP) at Purdue University, for his assistance with using ENVISAGE and review of PBO results. The responsibility for the use of ENVISAGE and interpretation of the model results, however, is entirely that of the PBO analysts.
This report was prepared under the direction of: Chris Matier, Senior Director
Nancy Beauchamp, Jocelyne Scrim and Rémy Vanherweghem assisted with the preparation of the report for publication.
For further information, please contact [email protected].
Yves Giroux Parliamentary Budget Officer
Table of Contents Executive Summary 1
1. Introduction 5
2. GHG emissions under current policies and measures 7
3. Estimate of additional carbon pricing for the Paris target 11
4. Estimated impact on the Canadian economy 14
5. Sensitivity analysis 17
ENVISAGE model description 18
Notes 20
Closing the Gap: Carbon pricing for the Paris target
1
Executive Summary This report provides an estimate of the additional carbon price that would be needed to achieve Canada’s greenhouse gas (GHG) emissions target in 2030 under the Paris Agreement, as well as an estimate of the corresponding impact on the Canadian economy.
The scope of this report is limited. For instance, the report does not assess the policy merits of carbon pricing or alternative approaches to reducing GHG emissions; nor does the report attempt to account for the economic and environmental costs of climate change.
Canada’s GHG emissions and the Paris target
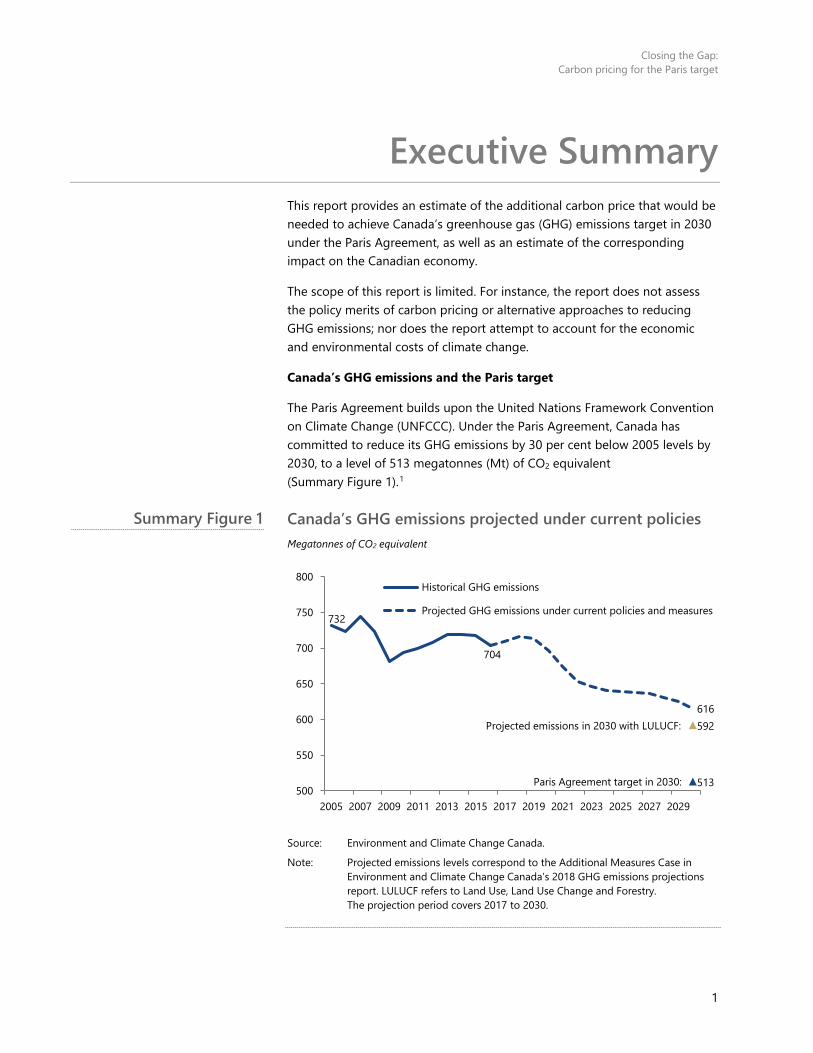
The Paris Agreement builds upon the United Nations Framework Convention on Climate Change (UNFCCC). Under the Paris Agreement, Canada has committed to reduce its GHG emissions by 30 per cent below 2005 levels by 2030, to a level of 513 megatonnes (Mt) of CO2 equivalent (Summary Figure 1).1
Canada’s GHG emissions projected under current policies Megatonnes of CO2 equivalent
Source: Environment and Climate Change Canada.
Note: Projected emissions levels correspond to the Additional Measures Case in Environment and Climate Change Canada’s 2018 GHG emissions projections report. LULUCF refers to Land Use, Land Use Change and Forestry. The projection period covers 2017 to 2030.
732
704
616592
513500
550
600
650
700
750
800
2005 2007 2009 2011 2013 2015 2017 2019 2021 2023 2025 2027 2029
Historical GHG emissions
Projected GHG emissions under current policies and measures
Projected emissions in 2030 with LULUCF:
Paris Agreement target in 2030:
Summary Figure 1
Closing the Gap: Carbon pricing for the Paris target
2
Under current policies and measures that have been announced, but are not yet fully implemented, Environment and Climate Change Canada (ECCC) projects that Canada’s GHG emissions will decrease from 704 Mt in 2016 to 616 Mt in 2030. Current policies and measures include the federal carbon pricing system under which the fuel charge rises to $50 per tonne of CO2 equivalent in 2022.
Accounting for the contribution of the Land Use, Land Use Change and Forestry (LULUCF) sector lowers Canada’s projected GHG emissions to 592 Mt in 2030.
• According to Environment and Climate Change Canada’s current projection, announced policies and measures are not sufficient to achieve Canada’s emissions target in 2030.
• There is a gap of 79 Mt of GHG emissions relative to the Paris target in 2030 under current policies and measures.2
Estimates of additional carbon pricing for the Paris target and the impact on the Canadian economy
Using the computable general equilibrium (CGE) model ENVISAGE, we estimate the additional carbon price that would be needed to reduce Canada’s GHG emissions by a further 79 Mt in 2030, closing the gap between the Paris target and baseline emissions projected under current policies and measures.
• PBO estimates that an additional carbon price rising from $6 per tonne in 2023 to $52 per tonne in 2030 would be required to achieve Canada’s GHG emissions target under the Paris Agreement.
• This charge would be in addition to the $50 per tonne federal fuel charge that is scheduled to be in place in 2022.
• Combined with the $50 per tonne federal fuel charge, households could face an explicit carbon price of $102 per tonne in 2030.
However, the additional carbon pricing in our analysis differs significantly from the existing federal fuel charge under the carbon pricing backstop, which applies in four provinces and two territories. We assume that additional carbon pricing would apply more broadly, covering all sectors except agriculture and would be applied to all provinces and territories.
Similar to the federal fuel charge under the Pan-Canadian Framework, we assume that revenues from additional carbon pricing are returned to households in lump-sum payments.
• PBO estimates that the level of real GDP in 2030 would be 0.35 per cent lower than the level of real GDP in 2030 projected under current policies and measures.
Closing the Gap: Carbon pricing for the Paris target
3
• This translates into a reduction of 0.04 percentage points in annual real GDP growth, on average, over 2023 to 2030.
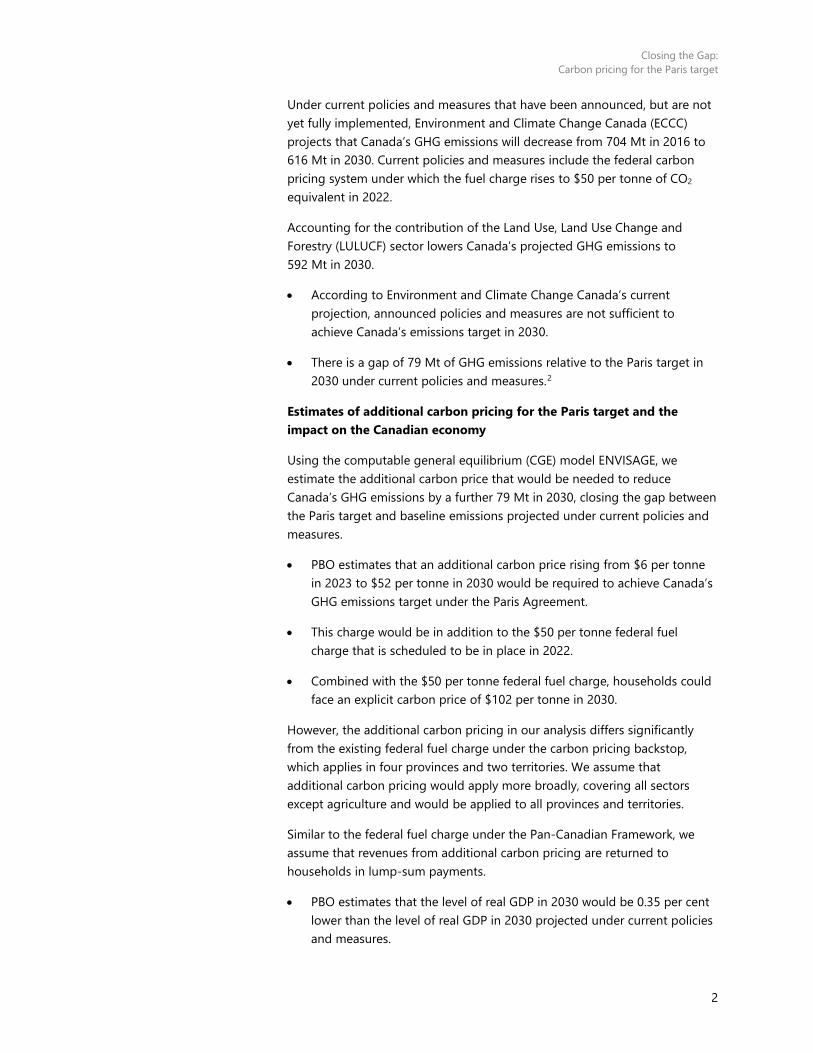
To put our estimates in context, we compare them to ECCC’s fall 2018 estimates of the impacts of carbon pricing over 2018 to 2022 (Summary Figure 2).
ECCC and PBO estimates of economic impacts and GHG emissions reductions
Sources: Environment and Climate Change Canada and Parliamentary Budget Officer.
Note: The real GDP impact shown for ECCC is based on PBO’s calculation using ECCC’s average annual real GDP growth rate impact of 0.1 percentage points cumulated over 2018 to 2022. The mid-point (55 Mt) of ECCC’s estimated GHG emissions reduction range (50 Mt to 60 Mt) is shown for illustrative purposes.
ECCC’s fall 2018 analysis finds that carbon pricing would reduce GHG emissions by 50 Mt to 60 Mt in 2022 with the federal fuel charge rising to $50 per tonne in 2022, in addition to including other current federal, provincial and territorial policies. ECCC estimates that achieving this reduction in GHG emissions would lower Canada’s average annual real GDP growth by about 0.1 percentage points over 2018 to 2022. PBO calculates that this would translate into an impact of approximately -0.5 per cent on the level of real GDP in 2022.
• PBO’s estimates of the impacts of additional carbon pricing needed to achieve the Paris target suggest a larger reduction in GHG emissions at a slightly lower cost to the Canadian economy than ECCC’s estimates of the impacts of carbon pricing over 2018 to 2022.
PBO’s analysis uses a carbon tax as the policy instrument to achieve the Paris target. Nonetheless, any number of policies could be introduced to close the GHG emissions gap, all of which would impose either an explicit price on
≈-0.5
-0.35
-55(-50 to -60)
-79
-100
-80
-60
-40
-20
0
-1.0
-0.8
-0.6
-0.4
-0.2
0.0
ECCC Fall 2018(2018-2022)
Impact on real GDP in final year (%, left scale)
Impact on GHG emissions in final year (Mt, right scale)
PBO June 2019(2023-2030)
% Megatonnes
Summary Figure 2
Closing the Gap: Carbon pricing for the Paris target
4
carbon (a levy/fuel charge or a cap-and-trade system), or a hidden price on the cost of goods and services (regulatory measures or subsidies).
Sensitivity analysis
Given the inherent uncertainty surrounding any projection of GHG emissions, we consider alternative emissions scenarios based on ECCC’s sensitivity analysis, which incorporates different demographic and economic assumptions.
With faster real GDP growth and higher oil and natural gas prices, emissions could be 55 Mt higher than our baseline in 2030, resulting in a gap of 134 Mt relative to the Paris target. The additional carbon price needed to achieve the Paris target with a gap of 134 Mt would rise from $10 per tonne in 2023 to $88 per tonne in 2030. We estimate that the level of real GDP in 2030 would be 0.59 per cent lower under this alternative scenario.
With slower real GDP growth and lower oil and natural gas prices, emissions could be 78 Mt lower than our baseline in 2030, which would effectively result in achieving the Paris target without requiring additional carbon pricing. That said, real GDP growth under such a scenario would be weak.
Future reporting
Going forward, following the annual release of Environment and Climate Change Canada’s GHG emissions projections, PBO intends to provide estimates of the additional carbon pricing needed to achieve Canada’s 2030 Paris target and corresponding economic impacts. PBO’s estimates will change over time as governments adopt new policies, emissions data is revised and underlying economic and demographic assumptions are updated.
Closing the Gap: Carbon pricing for the Paris target
5
1. Introduction The Paris Agreement builds upon the United Nations Framework Convention on Climate Change (UNFCC), requiring countries to outline and communicate their post-2020 climate actions. The Agreement’s central aim is to limit the increase in global temperature to 1.5 to 2.0 degrees Celsius above pre-industrial levels.3 Under the Agreement, countries put forward nationally determined contributions to reduce their GHG emissions.
On 15 May 2015, Canada submitted its economy-wide target to reduce GHG emissions by 30 per cent below 2005 levels by 2030.4 Based on current data, this translates into an emissions target of 513 megatonnes (Mt) of CO2 equivalent in 2030.
In December 2018, Environment and Climate Change Canada (ECCC) published its annual GHG emissions projections.5 The ECCC report presents Canada’s GHG emissions projections under different scenarios. Under the Additional Measures Case scenario, emissions are projected based on federal, provincial and territorial policies and measures that have been announced but not yet fully implemented, as of September 2018.
According to ECCC’s projection under the Additional Measures Case scenario, announced policies and measures are not sufficient to achieve Canada’s GHG emissions target in 2030. ECCC projects that GHG emissions will decrease to 616 Mt in 2030. With the contribution from the Land Use, Land Use Change and Forestry (LULUCF) sector, this brings projected emissions in 2030 down to 592 Mt, which is 79 Mt above the Paris target.6,7
Taking ECCC’s projection of Canada’s GHG emissions under current policies and measures as given, we use the computable general equilibrium model ENVISAGE (Environmental Impact and Sustainability Applied General Equilibrium) to estimate how much additional carbon pricing would be needed to achieve the Paris target. Appendix A provides an overview of ENVISAGE.
The scope of this report is limited to estimating the additional carbon pricing and its impact on the Canadian economy. The report does not attempt to account for the economic and environmental costs of climate change.
Additional carbon pricing will lead to further changes in behaviour by both industry and consumers: substituting away from emission-causing activity and using less intensively those products and services that emit GHGs.
Although various policy measures or combinations of policy measures could be used to reduce GHG emissions to achieve the Paris target in 2030, our
Closing the Gap: Carbon pricing for the Paris target
6
analysis uses carbon pricing in the form of a carbon tax applied in all sectors of the economy except agriculture, which is broader coverage than the existing federal fuel charge under the Pan-Canadian Framework (PCF).8 Of course other policy measures (such as regulations) could achieve the same emissions target, but they would likely have a larger impact on the Canadian economy. Further, the additional carbon price would be applied uniformly across provinces and territories.
Such a framework is generally optimistic as it minimises the impact on the overall economy needed to achieve the Paris target. In contrast, the PCF illustrates how different policies can be across sectors of the economy and across regions.
The following section presents the baseline emissions projection and key underlying assumptions. The subsequent sections present our estimates of the additional carbon pricing needed to achieve the Paris target and the impact on the Canadian economy. A sensitivity analysis is provided in the report’s final section.
Going forward, following the annual release of Environment and Climate Change Canada’s GHG emissions projections, PBO intends to provide estimates of the additional carbon pricing needed to achieve Canada’s 2030 Paris target and corresponding economic impacts. PBO’s estimates will change over time as governments adopt new policies, emissions data is revised and underlying economic and demographic assumptions are updated.

Closing the Gap: Carbon pricing for the Paris target
7
2. GHG emissions under current policies and measures
To examine the additional carbon pricing needed to achieve the Paris target, we start from projections made by the federal government. This does not, however, imply an endorsement of those projections as outcomes of the Pan-Canadian Framework and other related government policies. Their role is simply to isolate as much as possible the incremental carbon price required to achieve the Paris target.
The baseline GHG emissions projection on which our analysis is based, is ECCC’s 2018 Additional Measures Case that includes federal, provincial and territorial policies and measures that have been announced but not yet fully implemented, as of September 2018 (Figure 2-1).
Canada’s GHG emissions projected under current policies Megatonnes of CO2 equivalent
Source: Environment and Climate Change Canada.
Note: Projected emissions levels correspond to the Additional Measures Case in Environment and Climate Change Canada’s 2018 GHG emissions projections report. LULUCF refers to Land Use, Land Use Change and Forestry. The projection period covers 2017 to 2030.
732
704
616592
513500
550
600
650
700
750
800
2005 2007 2009 2011 2013 2015 2017 2019 2021 2023 2025 2027 2029
Historical GHG emissions
Projected GHG emissions under current policies and measures
Projected emissions in 2030 with LULUCF:
Paris Agreement target in 2030:
Figure 2-1
Closing the Gap: Carbon pricing for the Paris target
8
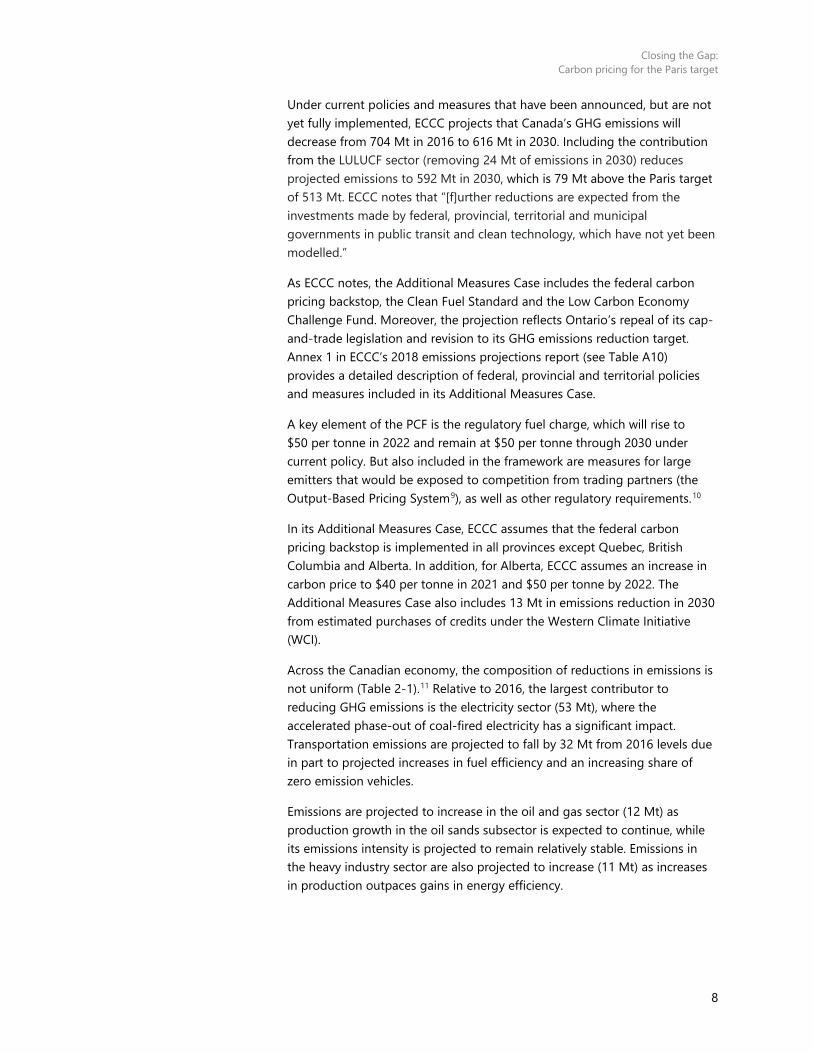
Under current policies and measures that have been announced, but are not yet fully implemented, ECCC projects that Canada’s GHG emissions will decrease from 704 Mt in 2016 to 616 Mt in 2030. Including the contribution from the LULUCF sector (removing 24 Mt of emissions in 2030) reduces projected emissions to 592 Mt in 2030, which is 79 Mt above the Paris target of 513 Mt. ECCC notes that “[f]urther reductions are expected from the investments made by federal, provincial, territorial and municipal governments in public transit and clean technology, which have not yet been modelled.”
As ECCC notes, the Additional Measures Case includes the federal carbon pricing backstop, the Clean Fuel Standard and the Low Carbon Economy Challenge Fund. Moreover, the projection reflects Ontario’s repeal of its cap-and-trade legislation and revision to its GHG emissions reduction target. Annex 1 in ECCC’s 2018 emissions projections report (see Table A10) provides a detailed description of federal, provincial and territorial policies and measures included in its Additional Measures Case.
A key element of the PCF is the regulatory fuel charge, which will rise to $50 per tonne in 2022 and remain at $50 per tonne through 2030 under current policy. But also included in the framework are measures for large emitters that would be exposed to competition from trading partners (the Output-Based Pricing System9), as well as other regulatory requirements.10
In its Additional Measures Case, ECCC assumes that the federal carbon pricing backstop is implemented in all provinces except Quebec, British Columbia and Alberta. In addition, for Alberta, ECCC assumes an increase in carbon price to $40 per tonne in 2021 and $50 per tonne by 2022. The Additional Measures Case also includes 13 Mt in emissions reduction in 2030 from estimated purchases of credits under the Western Climate Initiative (WCI).
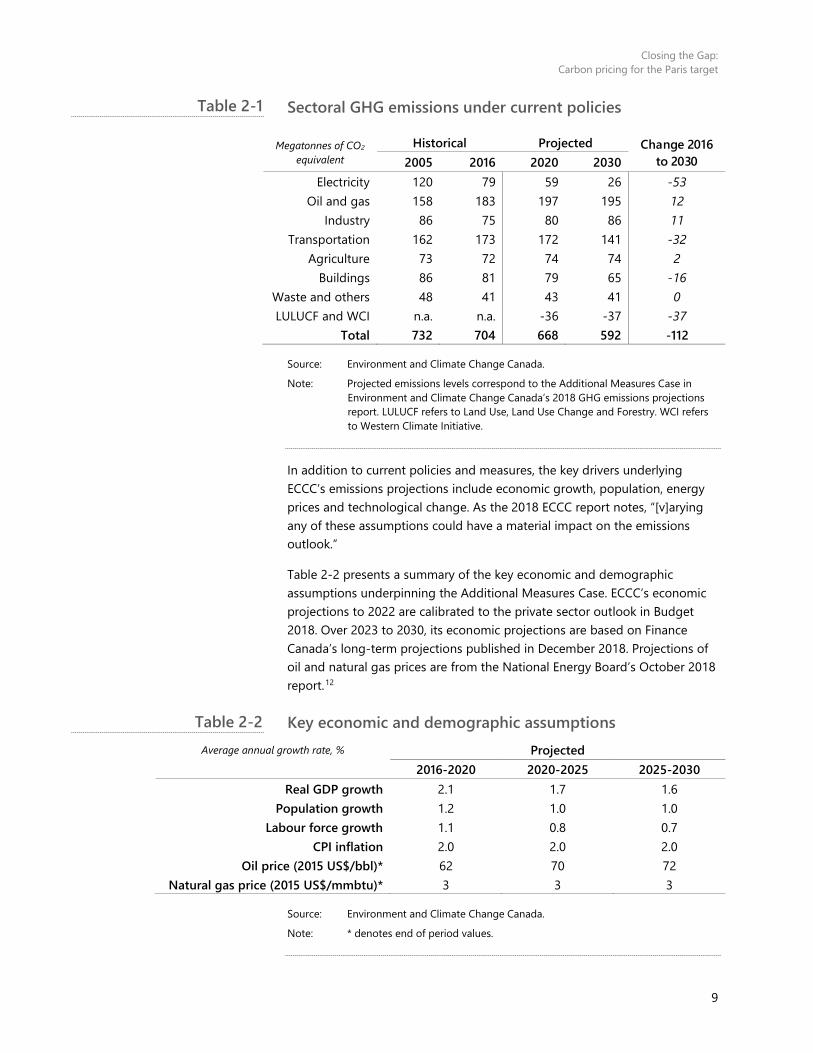
Across the Canadian economy, the composition of reductions in emissions is not uniform (Table 2-1).11 Relative to 2016, the largest contributor to reducing GHG emissions is the electricity sector (53 Mt), where the accelerated phase-out of coal-fired electricity has a significant impact. Transportation emissions are projected to fall by 32 Mt from 2016 levels due in part to projected increases in fuel efficiency and an increasing share of zero emission vehicles.
Emissions are projected to increase in the oil and gas sector (12 Mt) as production growth in the oil sands subsector is expected to continue, while its emissions intensity is projected to remain relatively stable. Emissions in the heavy industry sector are also projected to increase (11 Mt) as increases in production outpaces gains in energy efficiency.
Closing the Gap: Carbon pricing for the Paris target
9
Sectoral GHG emissions under current policies
Megatonnes of CO2 equivalent
Historical Projected Change 2016 to 2030 2005 2016 2020 2030
Electricity 120 79 59 26 -53 Oil and gas 158 183 197 195 12
Industry 86 75 80 86 11 Transportation 162 173 172 141 -32
Agriculture 73 72 74 74 2 Buildings 86 81 79 65 -16
Waste and others 48 41 43 41 0 LULUCF and WCI n.a. n.a. -36 -37 -37
Total 732 704 668 592 -112
Source: Environment and Climate Change Canada.
Note: Projected emissions levels correspond to the Additional Measures Case in Environment and Climate Change Canada’s 2018 GHG emissions projections report. LULUCF refers to Land Use, Land Use Change and Forestry. WCI refers to Western Climate Initiative.
In addition to current policies and measures, the key drivers underlying ECCC’s emissions projections include economic growth, population, energy prices and technological change. As the 2018 ECCC report notes, “[v]arying any of these assumptions could have a material impact on the emissions outlook.”
Table 2-2 presents a summary of the key economic and demographic assumptions underpinning the Additional Measures Case. ECCC’s economic projections to 2022 are calibrated to the private sector outlook in Budget 2018. Over 2023 to 2030, its economic projections are based on Finance Canada’s long-term projections published in December 2018. Projections of oil and natural gas prices are from the National Energy Board’s October 2018 report.12
Key economic and demographic assumptions Average annual growth rate, % Projected
2016-2020 2020-2025 2025-2030 Real GDP growth 2.1 1.7 1.6
Population growth 1.2 1.0 1.0 Labour force growth 1.1 0.8 0.7
CPI inflation 2.0 2.0 2.0 Oil price (2015 US$/bbl)* 62 70 72
Natural gas price (2015 US$/mmbtu)* 3 3 3
Source: Environment and Climate Change Canada.
Note: * denotes end of period values.
Table 2-1
Table 2-2
Closing the Gap: Carbon pricing for the Paris target
10
Over the period 2016 to 2030, the Canadian economy is projected to increase by 28 per cent, and the population by 16 per cent. The link between economic growth and GHG emissions has weakened as the manufacturing sector has become a smaller part of the economy, and new technologies are less fossil-fuel intensive. Nonetheless, it remains an important driver. Transportation and heating, for example, remain closely linked to both population and economic growth. The Pan-Canadian Framework is therefore working to bring down emissions against the backdrop of an expanding economy.
Closing the Gap: Carbon pricing for the Paris target
11
3. Estimate of additional carbon pricing for the Paris target
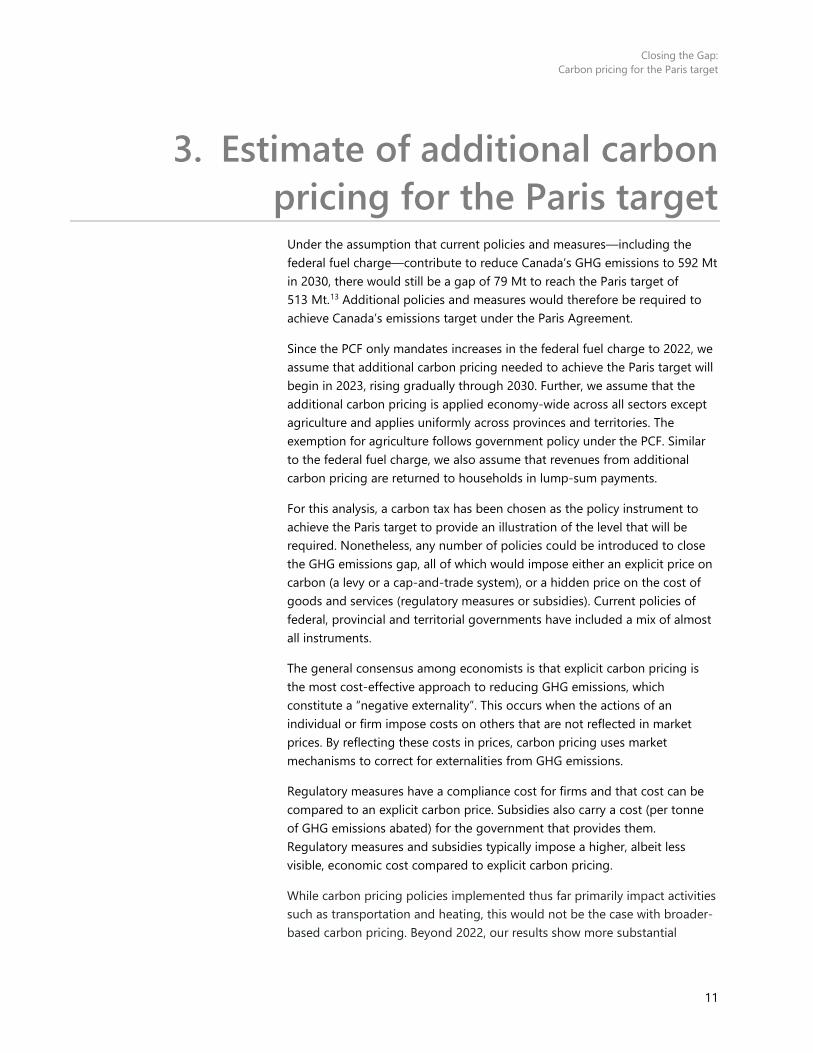
Under the assumption that current policies and measures—including the federal fuel charge—contribute to reduce Canada’s GHG emissions to 592 Mt in 2030, there would still be a gap of 79 Mt to reach the Paris target of 513 Mt.13 Additional policies and measures would therefore be required to achieve Canada’s emissions target under the Paris Agreement.
Since the PCF only mandates increases in the federal fuel charge to 2022, we assume that additional carbon pricing needed to achieve the Paris target will begin in 2023, rising gradually through 2030. Further, we assume that the additional carbon pricing is applied economy-wide across all sectors except agriculture and applies uniformly across provinces and territories. The exemption for agriculture follows government policy under the PCF. Similar to the federal fuel charge, we also assume that revenues from additional carbon pricing are returned to households in lump-sum payments.
For this analysis, a carbon tax has been chosen as the policy instrument to achieve the Paris target to provide an illustration of the level that will be required. Nonetheless, any number of policies could be introduced to close the GHG emissions gap, all of which would impose either an explicit price on carbon (a levy or a cap-and-trade system), or a hidden price on the cost of goods and services (regulatory measures or subsidies). Current policies of federal, provincial and territorial governments have included a mix of almost all instruments.
The general consensus among economists is that explicit carbon pricing is the most cost-effective approach to reducing GHG emissions, which constitute a “negative externality”. This occurs when the actions of an individual or firm impose costs on others that are not reflected in market prices. By reflecting these costs in prices, carbon pricing uses market mechanisms to correct for externalities from GHG emissions.
Regulatory measures have a compliance cost for firms and that cost can be compared to an explicit carbon price. Subsidies also carry a cost (per tonne of GHG emissions abated) for the government that provides them. Regulatory measures and subsidies typically impose a higher, albeit less visible, economic cost compared to explicit carbon pricing.
While carbon pricing policies implemented thus far primarily impact activities such as transportation and heating, this would not be the case with broader-based carbon pricing. Beyond 2022, our results show more substantial

Closing the Gap: Carbon pricing for the Paris target
12
reductions from all private sector sources of emissions. This moves the focus of policy away from consumer expenditures (transportation and heating) to industry—or more indirectly to consumers. Nonetheless, oil sands production would remain viable even with the additional carbon pricing needed to achieve the Paris target in 2030.
To close Canada’s emissions gap of 79 Mt by 2030 and achieve the Paris target, we estimate that additional carbon pricing (broadly applied) rising from $6 per tonne in 2023 to $52 per tonne in 2030 would be required (Figure 3-1). Adjusted for inflation, the additional carbon price in 2030 would be $42 per tonne expressed in 2019 dollars.
Combined with the $50 per tonne federal fuel charge, households could face an explicit carbon price of $102 per tonne in 2030. For perspective, a $102 per tonne carbon price would represent a cost of 23 cents for a litre of gasoline. Adjusted for inflation, the combined carbon price in 2030 would be $82 per tonne expressed in 2019 dollars.
Additional carbon pricing needed to meet the Paris target (beyond the $50 per tonne federal fuel charge in 2022) $ per tonne of CO2 equivalent
Source: Parliamentary Budget Officer.
Note: The additional carbon price would cover all sectors of the economy except agriculture and would be applied to all provinces and territories. The additional carbon price is expressed in nominal terms and is not adjusted for inflation.
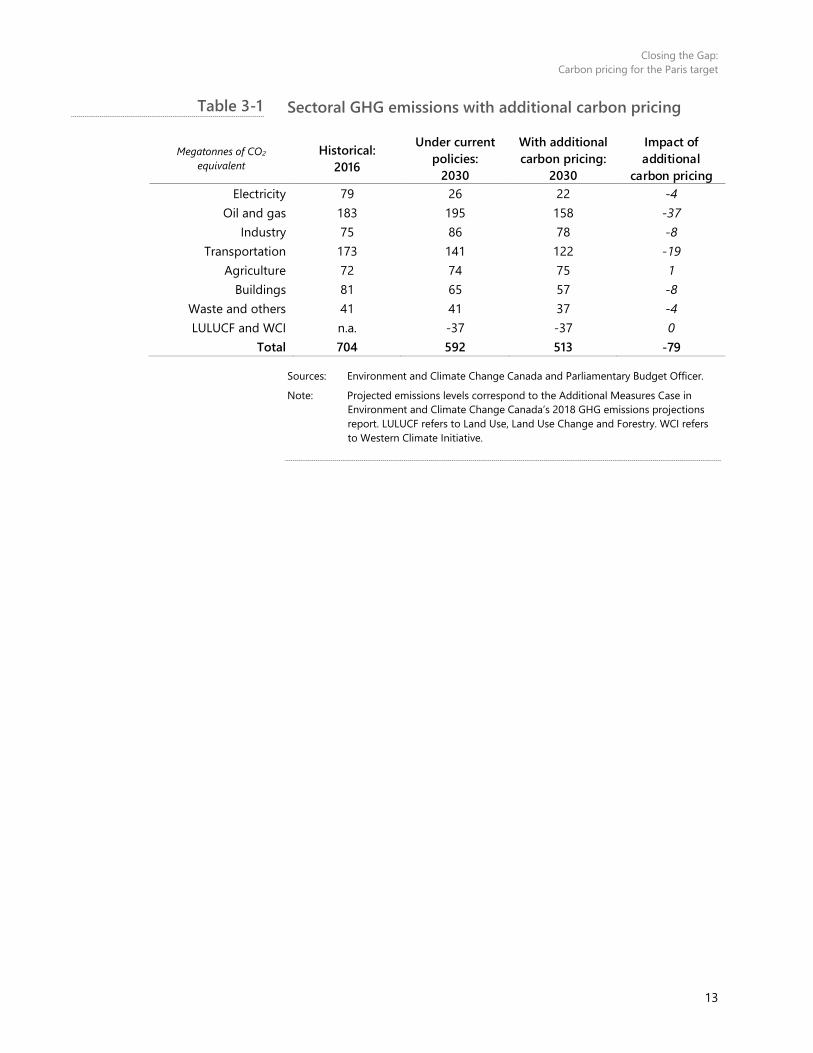
The incentive to reduce emissions through substitution or reductions in emission-causing activities is widespread. Emissions will decrease even in sectors that were not initially affected as much in the Additional Measures Case (Table 3-1).
611
1824
30
37
44
52
0
10
20
30
40
50
60
70
2023 2024 2025 2026 2027 2028 2029 2030
Figure 3-1
Closing the Gap: Carbon pricing for the Paris target
13
Sectoral GHG emissions with additional carbon pricing
Megatonnes of CO2 equivalent
Historical: 2016
Under current policies:
2030
With additional carbon pricing:
2030
Impact of additional
carbon pricing Electricity 79 26 22 -4
Oil and gas 183 195 158 -37 Industry 75 86 78 -8
Transportation 173 141 122 -19 Agriculture 72 74 75 1
Buildings 81 65 57 -8 Waste and others 41 41 37 -4 LULUCF and WCI n.a. -37 -37 0
Total 704 592 513 -79
Sources: Environment and Climate Change Canada and Parliamentary Budget Officer.
Note: Projected emissions levels correspond to the Additional Measures Case in Environment and Climate Change Canada’s 2018 GHG emissions projections report. LULUCF refers to Land Use, Land Use Change and Forestry. WCI refers to Western Climate Initiative.
Table 3-1
Closing the Gap: Carbon pricing for the Paris target
14
4. Estimated impact on the Canadian economy
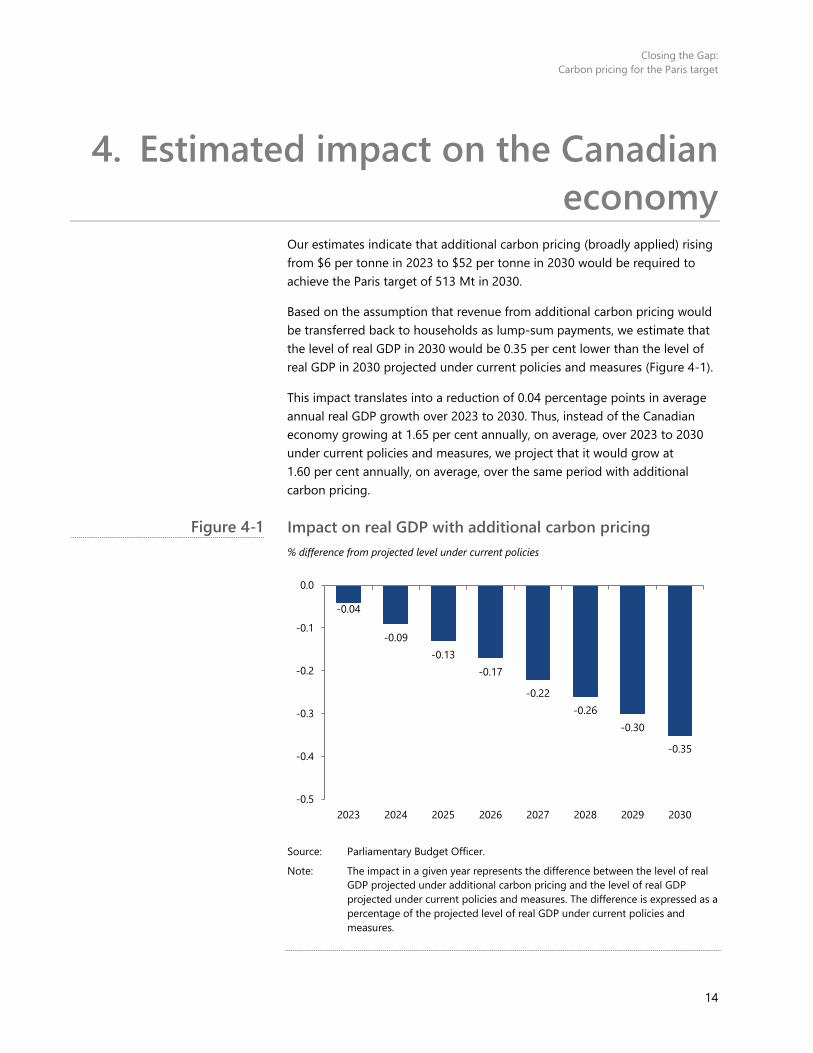
Our estimates indicate that additional carbon pricing (broadly applied) rising from $6 per tonne in 2023 to $52 per tonne in 2030 would be required to achieve the Paris target of 513 Mt in 2030.
Based on the assumption that revenue from additional carbon pricing would be transferred back to households as lump-sum payments, we estimate that the level of real GDP in 2030 would be 0.35 per cent lower than the level of real GDP in 2030 projected under current policies and measures (Figure 4-1).
This impact translates into a reduction of 0.04 percentage points in average annual real GDP growth over 2023 to 2030. Thus, instead of the Canadian economy growing at 1.65 per cent annually, on average, over 2023 to 2030 under current policies and measures, we project that it would grow at 1.60 per cent annually, on average, over the same period with additional carbon pricing.
Impact on real GDP with additional carbon pricing % difference from projected level under current policies
Source: Parliamentary Budget Officer.
Note: The impact in a given year represents the difference between the level of real GDP projected under additional carbon pricing and the level of real GDP projected under current policies and measures. The difference is expressed as a percentage of the projected level of real GDP under current policies and measures.
-0.04
-0.09-0.13
-0.17
-0.22-0.26
-0.30
-0.35
-0.5
-0.4
-0.3
-0.2
-0.1
0.0
2023 2024 2025 2026 2027 2028 2029 2030
Figure 4-1
Closing the Gap: Carbon pricing for the Paris target
15
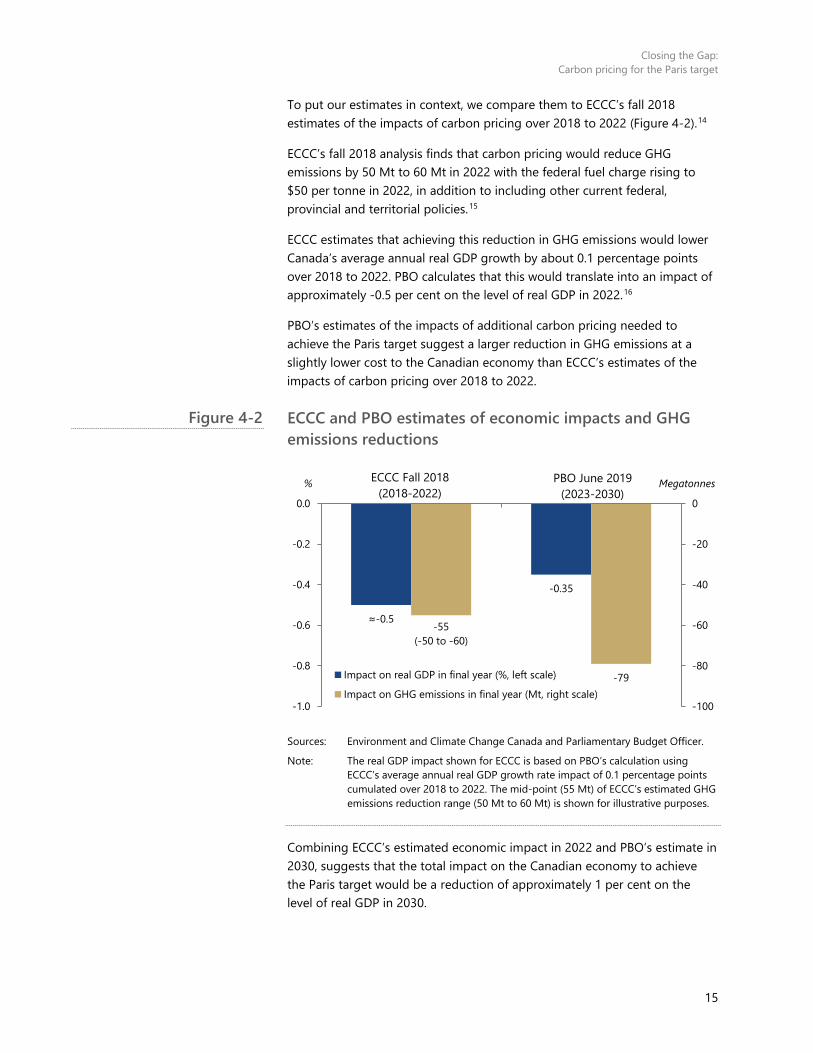
To put our estimates in context, we compare them to ECCC’s fall 2018 estimates of the impacts of carbon pricing over 2018 to 2022 (Figure 4-2).14
ECCC’s fall 2018 analysis finds that carbon pricing would reduce GHG emissions by 50 Mt to 60 Mt in 2022 with the federal fuel charge rising to $50 per tonne in 2022, in addition to including other current federal, provincial and territorial policies.15
ECCC estimates that achieving this reduction in GHG emissions would lower Canada’s average annual real GDP growth by about 0.1 percentage points over 2018 to 2022. PBO calculates that this would translate into an impact of approximately -0.5 per cent on the level of real GDP in 2022.16
PBO’s estimates of the impacts of additional carbon pricing needed to achieve the Paris target suggest a larger reduction in GHG emissions at a slightly lower cost to the Canadian economy than ECCC’s estimates of the impacts of carbon pricing over 2018 to 2022.
ECCC and PBO estimates of economic impacts and GHG emissions reductions
Sources: Environment and Climate Change Canada and Parliamentary Budget Officer.
Note: The real GDP impact shown for ECCC is based on PBO’s calculation using ECCC’s average annual real GDP growth rate impact of 0.1 percentage points cumulated over 2018 to 2022. The mid-point (55 Mt) of ECCC’s estimated GHG emissions reduction range (50 Mt to 60 Mt) is shown for illustrative purposes.
Combining ECCC’s estimated economic impact in 2022 and PBO’s estimate in 2030, suggests that the total impact on the Canadian economy to achieve the Paris target would be a reduction of approximately 1 per cent on the level of real GDP in 2030.
≈-0.5
-0.35
-55(-50 to -60)
-79
-100
-80
-60
-40
-20
0
-1.0
-0.8
-0.6
-0.4
-0.2
0.0
ECCC Fall 2018(2018-2022)
Impact on real GDP in final year (%, left scale)
Impact on GHG emissions in final year (Mt, right scale)
PBO June 2019(2023-2030)
% Megatonnes
Figure 4-2

Closing the Gap: Carbon pricing for the Paris target
16
This impact is broadly consistent with other estimates of the reduction in Canada’s GDP to reach the Paris target.17 For example, Vandyck et al. (2016) find that a 19 per cent reduction in emissions was linked to a 0.58 per cent loss of GDP. On the other hand, the International Monetary Fund (2019) estimates that a US$70 per tonne carbon price is needed to reduce emissions by 22 per cent (and causes a welfare loss of 0.3 per cent of GDP). Hof et al. (2017) estimate that for Canada to reduce emissions by about 180 Mt would cost 0.28 per cent of GDP. Earlier work by PBO (2016) also estimated a reduction in GDP of 1 per cent to achieve the Paris target.

Closing the Gap: Carbon pricing for the Paris target
17
5. Sensitivity analysis Since the Paris target is fixed relative to the level of GHG emissions in 2005, changes to the baseline projection will affect the amount of additional carbon pricing necessary to achieve the target in 2030. Given the inherent uncertainty surrounding any projection of GHG emissions, we consider alternative emissions scenarios based on ECCC’s sensitivity analysis, which incorporates different demographic and economic assumptions.
In its 2018 emissions projections report, ECCC’s sensitivity analysis is conducted relative to its Reference Case, which includes only policies and measures that were implemented as of September 2018. To construct alternative emissions levels for our report, we apply the projected impacts on emissions in 2030 from ECCC’s highest and lowest scenarios to our baseline emissions projection (that is, ECCC’s Additional Measures Case) in 2030. See Annex 2 in ECCC’s 2018 report for additional detail.
Alternative emissions scenarios under current policies and measures
Megatonnes of CO2 equivalent GHG emissions in 2030
Difference from Paris target
Additional Measures Case (PBO baseline) 592 79 Fast GDP growth and high oil prices 647 134 Slow GDP growth and low oil prices 514 1
Sources: Environment and Climate Change Canada and Parliamentary Budget Officer.
With faster real GDP growth and higher oil and natural gas prices, emissions could be 55 Mt higher than our baseline in 2030, resulting in a gap of 134 Mt relative to the Paris target. The additional carbon price needed to achieve the Paris target with a gap of 134 Mt would rise from $10 per tonne in 2023 to $88 per tonne in 2030. We estimate that this additional carbon price would reduce the level of real GDP in 2030 by 0.59 per cent under this alternative scenario.
With slower real GDP growth and lower oil and natural gas prices, emissions could be 78 Mt lower than our baseline in 2030, which would effectively result in achieving the Paris target without requiring additional carbon pricing. That said, real GDP growth under such a scenario would be weak.
Table 5-1
Closing the Gap: Carbon pricing for the Paris target
18
ENVISAGE model description The Environmental Impact and Sustainability Applied General Equilibrium (ENVISAGE)18 model was used to generate the results of this analysis. It is a computable general equilibrium (CGE) model developed by Dominique van der Mensbrugghe at Purdue University’s Center for Global Trade Analysis.
The ENVISAGE model was developed specifically to study issues associated with climate change. It estimates greenhouse gas emissions produced by economic activity. Economic activity is broken down by sector and country. Within each sector, the model takes into account emissions generated by consumption of commodities, the use of production factors such as labour and capital, and production processes. The ENVISAGE model makes it possible to add a carbon tax or a cap-and-trade system by assigning a cost to GHG emissions. Based on the emissions intensity per commodity and per factor, it is possible to calculate new prices for each commodity following a tax increase. Economic agents will then adjust their behaviour based on changes in the relative prices of goods. These adjustments are reflected in economic performance and emissions growth.
ENVISAGE is recursive dynamic model. More specifically, model solution is computed chronologically where factor stocks, technological parameters and preferences change through time. From these variables, the model estimates the Walrasian equilibrium where supply equals demand on all considered markets.
The model was modified to approximate the Environment and Climate Change Canada (ECCC) Additional Measures Case.19 To that end, sectors in the model were aggregated to correspond to those presented in the 2018 report on Canada’s greenhouse gas and air pollutant emissions projections.20 In addition, because the model isolates household emissions, unlike the ECCC scenario, PBO reconciled data between the models by using ECCC’s data on emissions from residential heating. A parameter for technological improvements with sectoral and temporal dimensions was then added to the model as the main calibration tool. Lastly, the shares of energy sources for electricity generation and certain elasticities were modified so that sectoral emissions were in line with the Additional Measures Case. Using these modifications, we were able to approximate the ECCC per capita GDP growth and emissions profile.
The database
The model uses the GTAP 9 database, with information on 140 economies, including Canada, and 57 sectors.21 It was created to study global economic issues. The database, produced in 2015, includes information for reference
Closing the Gap: Carbon pricing for the Paris target
19
years 2004, 2007 and 2011. The data are expressed in inflation-adjusted (2011) U.S. dollars. Conversion to nominal Canadian dollars is done using the economic assumptions from ECCC.
The GTAP database uses input-output data tables specific to each country, submitted by external contributors. These data are then reconciled, in part, with data from international agencies. This last step ensures the data are standardized at the global level.
As part of our analysis, we used the complementary GTAP-Power database. It disaggregates the electricity sector, isolating the various production sources (coal, natural gas, hydroelectric, oil, nuclear, solar, wind and other) and the electricity distribution system. The database was built using data from the International Energy Agency (IEA).
Using data from the GTAP database for 2011, we calibrated the model so that the model’s GDP growth rate and sectoral emissions are in line with the ECCC scenario between 2012 and 2030.
Closing the Gap: Carbon pricing for the Paris target
20
1. Unless otherwise noted in this report, all measures of emissions are expressed as CO2 equivalent. All carbon prices in this report are expressed in nominal terms (that is, not adjusted for inflation) unless otherwise noted.
2. In its 2018 GHG emissions projections report, ECCC notes that “[f]urther reductions are expected from the investments made by federal, provincial, territorial and municipal governments in public transit and clean technology, which have not yet been modelled.”
3. Additional detail on the Paris Agreement is available at: https://unfccc.int/process-and-meetings/the-paris-agreement/the-paris-agreement. Full text of the Agreement is available at: https://treaties.un.org/doc/Treaties/2016/02/20160215%2006-03%20PM/Ch_XXVII-7-d.pdf.
4. Canada’s submission under the Paris Agreement is available at: https://www4.unfccc.int/sites/submissions/INDC/Published%20Documents/Canada/1/INDC%20-%20Canada%20-%20English.pdf.
5. ECCC’s 2018 GHG emissions projections report is available at: http://publications.gc.ca/collections/collection_2018/eccc/En1-78-2018-eng.pdf.
6. See Note 2.
7. The LULUCF sector represents a net contribution to GHG emissions. Under the UNFCCC, countries report emissions and carbon removals associated with managed lands. On a net basis, ECCC expects the LULUCF sector to remove 24 Mt of CO2 equivalent emissions in 2030. ECCC notes that most of this net removal reflects lower expected future forest harvest levels in comparison to the average historical harvest level.
8. The federal carbon pricing system includes a regulatory charge on fuel and a regulatory trading system for large industrial emitters, referred to as the Output-Based Pricing System (OBPS). The federal carbon pricing system applies to provinces and territories that have opted for it or that do not have a system in place that meets the federal carbon price.
In addition to the federal carbon pricing system, the Pan-Canadian Framework (PCF) includes “complementary climate actions” (e.g., regulatory actions) to further reduce emissions across the economy. The PCF also includes “measures to adapt to the impacts of climate change and build resilience; and actions to accelerate innovation, support clean technology, and create jobs”. For additional detail on the PCF, see: http://publications.gc.ca/collections/collection_2017/eccc/En4-294-2016-eng.pdf.
9. The sectors covered by the OBPS “will face a carbon price on the portion of their emissions that are above a limit, which will be determined based on relevant output-based standards (emissions per unit of output). … Facilities that emit less than their annual limit will receive surplus credits from the
Notes

Closing the Gap: Carbon pricing for the Paris target
21
Government for the portion of their emissions that are below their limit. A facility can trade surplus credits it earns, creating an incentive for facilities to reduce emissions below the limit when cost effective to do so.” From: https://www.canada.ca/en/services/environment/weather/climatechange/climate-action/pricing-carbon-pollution/output-based-pricing-system-technical-backgrounder.html.
10. A regulation that is part of the PCF is the Clean Fuel Standard, which sets “lifecycle carbon intensity requirements for liquid, gaseous and solid fuels used in transportation, industry and buildings that become more stringent over time.” (From: https://www.canada.ca/en/environment-climate-change/services/managing-pollution/energy-production/fuel-regulations/clean-fuel-standard/timelines-approach-next-steps.html.) This will increase the cost of those fuels and will therefore lead to a price increase for individuals or firms buying them. Its effect is similar to a tax, but the cost is hidden. Since the bulk of those fuels will be subject to the carbon levy, the end-users will be taking on a greater, more costly, role in reducing emissions.
11. See Section 1.3.7 in ECCC’s 2018 GHG emissions report which details the projections by economic sector under the Reference Case.
12. See Canada’s Energy Future 2018: Energy Supply and Demand Projections to 2040. Available at: https://www.neb-one.gc.ca/nrg/ntgrtd/ftr/2018/index-eng.html.
13. See Note 2.
14. ECCC’s fall 2018 estimated impacts are available at: https://www.canada.ca/en/environment-climate-change/services/climate-change/pricing-pollution-how-it-will-work/fall-2018-update-estimated-impacts-federal-pollution-pricing-system.html.
15. ECCC notes that the estimated range of 50 Mt to 60 Mt is lower than their estimates in spring 2018, which indicated that carbon pricing could lead to reductions of 80 Mt to 90 Mt by 2022. ECCC notes that the difference between their current estimate and the spring estimate is largely due to Ontario’s cancellation of its cap-and-trade system.
16. ECCC’s fall 2018 estimate of the impact on real GDP in 2022 is in line with PBO’s spring 2018 estimate of the impact of implementing a carbon pricing levy rising from $10 per tonne in 2018 to $50 per tonne in 2022. In its April 2018 Economic and Fiscal Outlook, PBO estimated the impact on the level of real GDP in 2022 at -0.5 per cent. See PBO’s May 2018 report, The Impact of a Pan-Canadian Carbon Pricing Levy on PBO’s GDP Projection, for additional detail (available at: https://www.pbo-dpb.gc.ca/web/default/files/Documents/Reports/2018/Carbon%20Tax%20Levy/PBO_carbon_levy_impact__EN.pdf).
17. The literature regarding the Paris Agreement is large, so the studies outlined in this report (see below) represent a sampling rather than a survey.
Hof, A.F., et al. (2017). Global and regional abatement costs of Nationally Determined Contributions (NDCs) and of enhanced action to levels well below 2°C and 1.5°C, Environmental Science & Policy, 71: 30-40.
International Monetary Fund, (2019). Fiscal Policies for Paris Climate Strategies—from Principle to Practice. Available at: https://www.imf.org/en/Publications/Policy-Papers/Issues/2019/05/01/Fiscal-Policies-for-Paris-Climate-Strategies-from-Principle-to-Practice-46826.
Closing the Gap: Carbon pricing for the Paris target
22
Parliamentary Budget Officer, (2016). Canada’s Greenhouse Gas Emissions:
Developments, Prospects and Reductions. Available at: https://www.pbo-dpb.gc.ca/web/default/files/Documents/Reports/2016/ClimateChange/PBO_Climate_Change_EN.pdf.
Vandyck, T., et al. (2016). A global stocktake of the Paris pledges: Implications for energy systems and economy. Global Environmental Change, 41: 46-63.
18. van der Mensbrugghe, Dominique (2019). The Environmental Impact and Sustainability Applied General Equilibrium (ENVSAGE) Model, Version 10.01, Center for Global Trade Analysis, Purdue University. https://mygeohub.org/groups/gtap/envisage-docs
19. While the model’s emissions projection by economic sector approximates ECCC’s Additional Measures Case, we did not explicitly model the output-based pricing system (OBPS) in our baseline emissions projection. We will explore this modelling extension in future work. That said, we do not believe that such an extension would have a material impact on our estimates.
20. See: http://publications.gc.ca/collections/collection_2018/eccc/En1-78-2018-eng.pdf.
21. GTAP is the Global Trade Analysis Project: https://www.gtap.agecon.purdue.edu/databases/v9/v9_doco.asp.