Closing the Digital Divide in South Carolina · 2018-03-28 · Closing the Digital Divide in South...
6
Closing the Digital Divide in South Carolina October 2013
Transcript of Closing the Digital Divide in South Carolina · 2018-03-28 · Closing the Digital Divide in South...

Closing the Digital Divide in South Carolina
October 2013
Closing the Digital Divide in South Carolina 2 October 2013www.connectsc.org
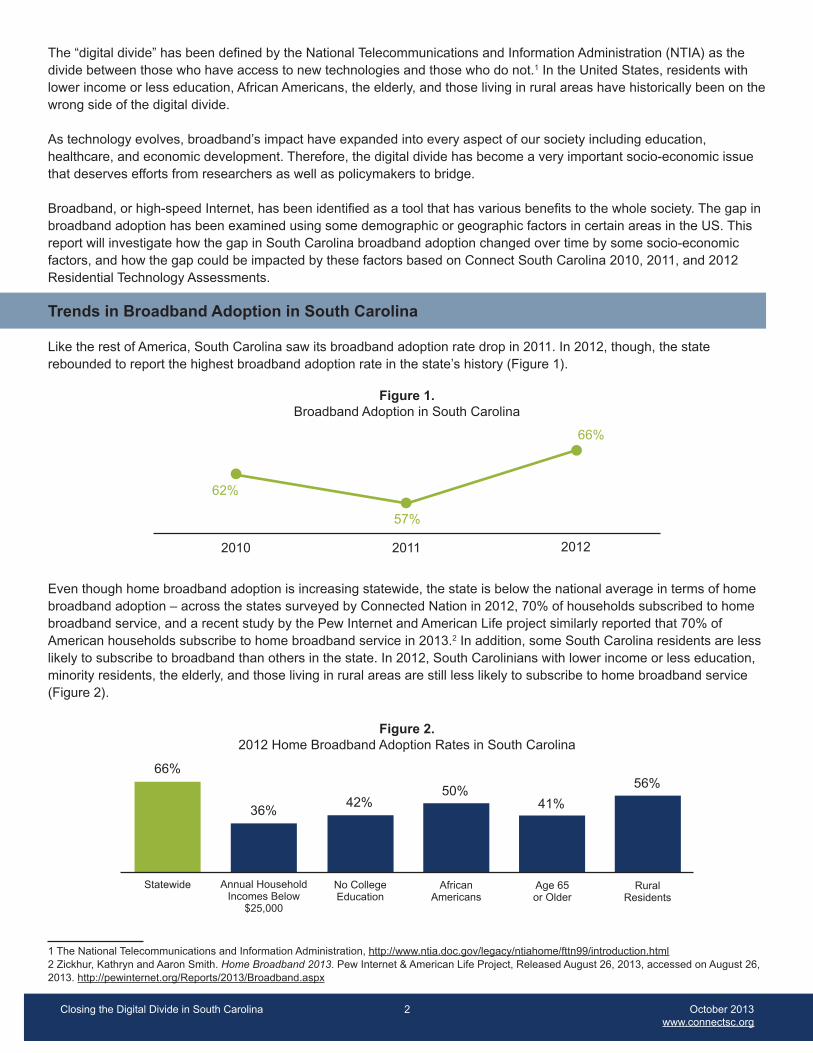
The “digital divide” has been defined by the National Telecommunications and Information Administration (NTIA) as the divide between those who have access to new technologies and those who do not.1 In the United States, residents with lower income or less education, African Americans, the elderly, and those living in rural areas have historically been on the wrong side of the digital divide.
As technology evolves, broadband’s impact have expanded into every aspect of our society including education, healthcare, and economic development. Therefore, the digital divide has become a very important socio-economic issue that deserves efforts from researchers as well as policymakers to bridge.
Broadband, or high-speed Internet, has been identified as a tool that has various benefits to the whole society. The gap in broadband adoption has been examined using some demographic or geographic factors in certain areas in the US. This report will investigate how the gap in South Carolina broadband adoption changed over time by some socio-economic factors, and how the gap could be impacted by these factors based on Connect South Carolina 2010, 2011, and 2012 Residential Technology Assessments.
Trends in Broadband Adoption in South Carolina
Like the rest of America, South Carolina saw its broadband adoption rate drop in 2011. In 2012, though, the state rebounded to report the highest broadband adoption rate in the state’s history (Figure 1).
Even though home broadband adoption is increasing statewide, the state is below the national average in terms of home broadband adoption – across the states surveyed by Connected Nation in 2012, 70% of households subscribed to home broadband service, and a recent study by the Pew Internet and American Life project similarly reported that 70% of American households subscribe to home broadband service in 2013.2 In addition, some South Carolina residents are less likely to subscribe to broadband than others in the state. In 2012, South Carolinians with lower income or less education, minority residents, the elderly, and those living in rural areas are still less likely to subscribe to home broadband service (Figure 2).
1 The National Telecommunications and Information Administration, http://www.ntia.doc.gov/legacy/ntiahome/fttn99/introduction.html2 Zickhur, Kathryn and Aaron Smith. Home Broadband 2013. Pew Internet & American Life Project, Released August 26, 2013, accessed on August 26, 2013. http://pewinternet.org/Reports/2013/Broadband.aspx
2010
62%
57%
66%
2011 2012
Figure 1.Broadband Adoption in South Carolina
Statewide Annual Household Incomes Below
$25,000
No CollegeEducation
AfricanAmericans
Age 65or Older
RuralResidents
66%
36%42%
50%41%
56%
Figure 2.2012 Home Broadband Adoption Rates in South Carolina
Closing the Digital Divide in South Carolina 3 October 2013www.connectsc.org
Gap Analysis over Time by Demographic
Although certain South Carolina residents are still less likely to subscribe to home broadband service, Connect South Carolina’s Residential Technology Assessments show that efforts across the state are working to close the gap in broadband adoption.
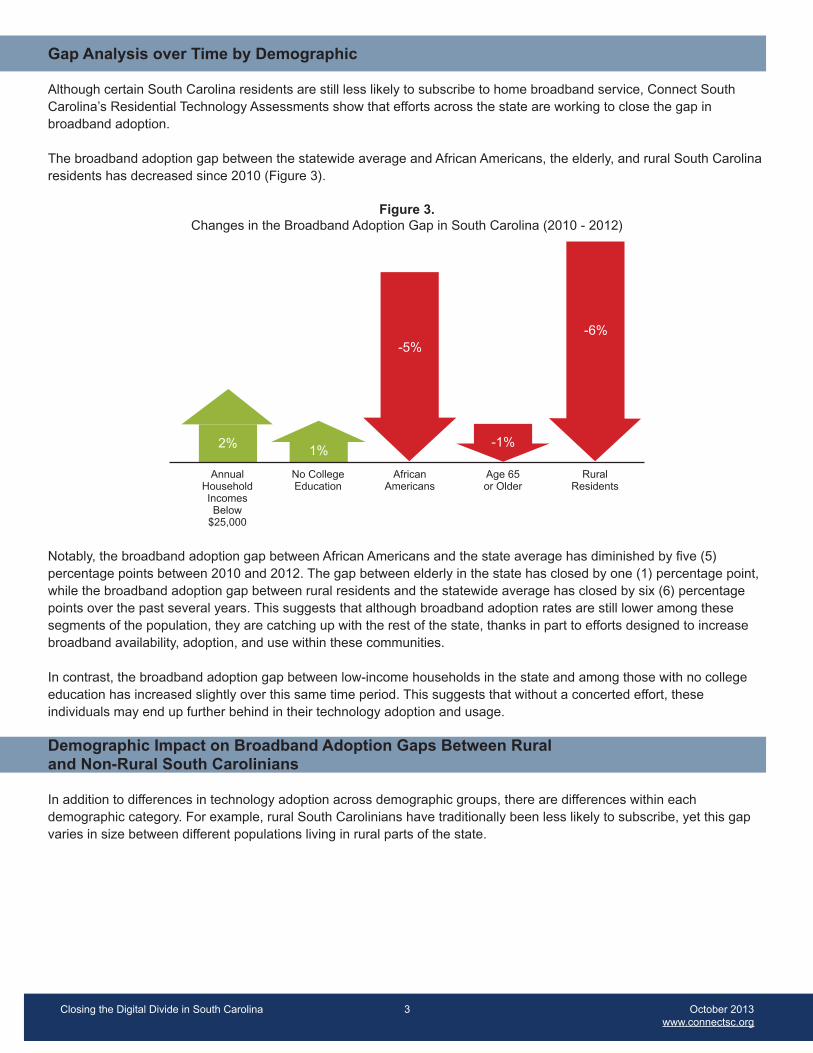
The broadband adoption gap between the statewide average and African Americans, the elderly, and rural South Carolina residents has decreased since 2010 (Figure 3).
Notably, the broadband adoption gap between African Americans and the state average has diminished by five (5) percentage points between 2010 and 2012. The gap between elderly in the state has closed by one (1) percentage point, while the broadband adoption gap between rural residents and the statewide average has closed by six (6) percentage points over the past several years. This suggests that although broadband adoption rates are still lower among these segments of the population, they are catching up with the rest of the state, thanks in part to efforts designed to increase broadband availability, adoption, and use within these communities.
In contrast, the broadband adoption gap between low-income households in the state and among those with no college education has increased slightly over this same time period. This suggests that without a concerted effort, these individuals may end up further behind in their technology adoption and usage.
Demographic Impact on Broadband Adoption Gaps Between Rural and Non-Rural South Carolinians
In addition to differences in technology adoption across demographic groups, there are differences within each demographic category. For example, rural South Carolinians have traditionally been less likely to subscribe, yet this gap varies in size between different populations living in rural parts of the state.
Annual Household Incomes Below
$25,000
No College Education
AfricanAmericans
Age 65or Older
RuralResidents
2%
50%56%
2% 1%
-5%-6%
-1%
Figure 3.Changes in the Broadband Adoption Gap in South Carolina (2010 - 2012)
Closing the Digital Divide in South Carolina 4 October 2013www.connectsc.org
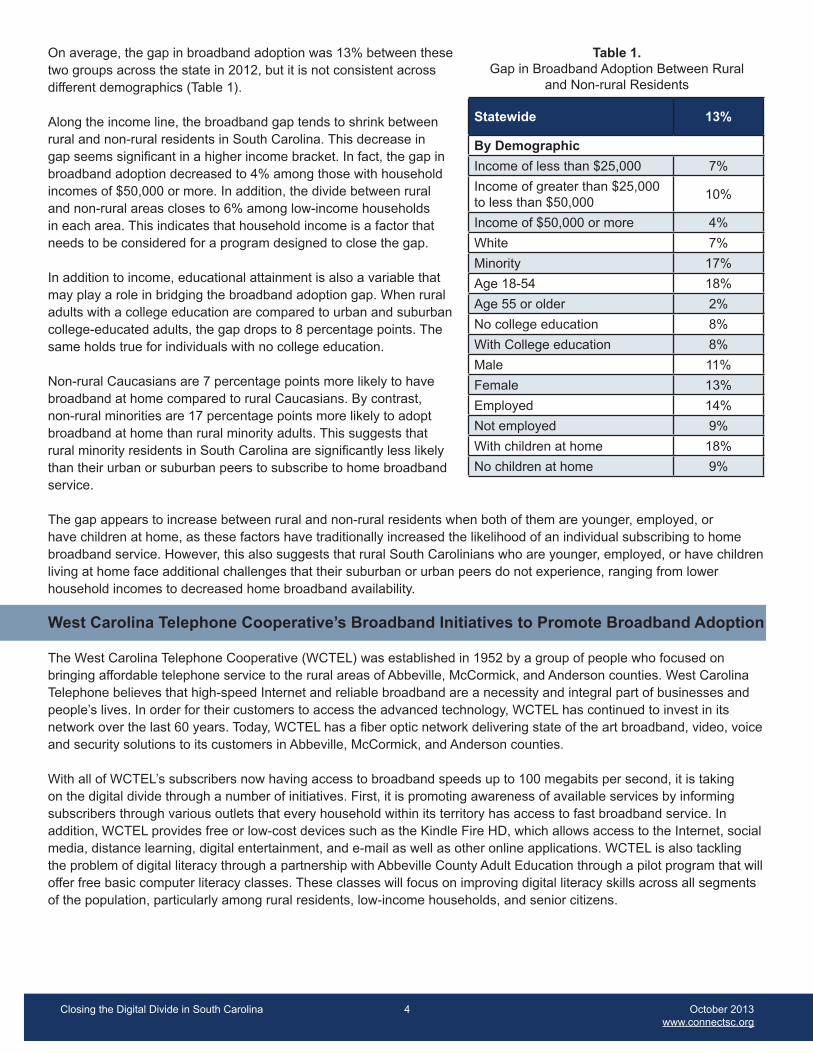
On average, the gap in broadband adoption was 13% between these two groups across the state in 2012, but it is not consistent across different demographics (Table 1).
Along the income line, the broadband gap tends to shrink between rural and non-rural residents in South Carolina. This decrease in gap seems significant in a higher income bracket. In fact, the gap in broadband adoption decreased to 4% among those with household incomes of $50,000 or more. In addition, the divide between rural and non-rural areas closes to 6% among low-income households in each area. This indicates that household income is a factor that needs to be considered for a program designed to close the gap.
In addition to income, educational attainment is also a variable that may play a role in bridging the broadband adoption gap. When rural adults with a college education are compared to urban and suburban college-educated adults, the gap drops to 8 percentage points. The same holds true for individuals with no college education.
Non-rural Caucasians are 7 percentage points more likely to have broadband at home compared to rural Caucasians. By contrast, non-rural minorities are 17 percentage points more likely to adopt broadband at home than rural minority adults. This suggests that rural minority residents in South Carolina are significantly less likely than their urban or suburban peers to subscribe to home broadband service.
The gap appears to increase between rural and non-rural residents when both of them are younger, employed, or have children at home, as these factors have traditionally increased the likelihood of an individual subscribing to home broadband service. However, this also suggests that rural South Carolinians who are younger, employed, or have children living at home face additional challenges that their suburban or urban peers do not experience, ranging from lower household incomes to decreased home broadband availability.
West Carolina Telephone Cooperative’s Broadband Initiatives to Promote Broadband Adoption The West Carolina Telephone Cooperative (WCTEL) was established in 1952 by a group of people who focused on bringing affordable telephone service to the rural areas of Abbeville, McCormick, and Anderson counties. West Carolina Telephone believes that high-speed Internet and reliable broadband are a necessity and integral part of businesses and people’s lives. In order for their customers to access the advanced technology, WCTEL has continued to invest in its network over the last 60 years. Today, WCTEL has a fiber optic network delivering state of the art broadband, video, voice and security solutions to its customers in Abbeville, McCormick, and Anderson counties.
With all of WCTEL’s subscribers now having access to broadband speeds up to 100 megabits per second, it is taking on the digital divide through a number of initiatives. First, it is promoting awareness of available services by informing subscribers through various outlets that every household within its territory has access to fast broadband service. In addition, WCTEL provides free or low-cost devices such as the Kindle Fire HD, which allows access to the Internet, social media, distance learning, digital entertainment, and e-mail as well as other online applications. WCTEL is also tackling the problem of digital literacy through a partnership with Abbeville County Adult Education through a pilot program that will offer free basic computer literacy classes. These classes will focus on improving digital literacy skills across all segments of the population, particularly among rural residents, low-income households, and senior citizens.
Statewide 13%
By Demographic
Income of less than $25,000 7%
Income of greater than $25,000 to less than $50,000
10%
Income of $50,000 or more 4%
White 7%
Minority 17%
Age 18-54 18%
Age 55 or older 2%
No college education 8%
With College education 8%
Male 11%
Female 13%
Employed 14%
Not employed 9%
With children at home 18%
No children at home 9%
Table 1.Gap in Broadband Adoption Between Rural
and Non-rural Residents
Closing the Digital Divide in South Carolina 5 October 2013www.connectsc.org
Conclusions
The statewide broadband adoption rate is still lower than the national average, though some groups, including African Americans, seniors, and rural residents, have already made progress by reducing the gap compared to the state average over the past several years. This indicates that some programs, which are devoted to increase broadband adoption among vulnerable populations, started to work effectively on some groups. But other groups, such as low-income households, need some new and creative initiatives to overcome the barriers that prevent them from subscribing to broadband.
Some demographic factors do affect the broadband gap in South Carolina. Income and education factors tend to reduce the gap between rural and non-rural areas. By contrast, among employed residents, households with children and younger people, the broadband adoption difference between rural and non-rural portions increased.
Methodology
Between September 29 and November 1, 2012, Connect South Carolina conducted a random digit dial telephone survey of 1,200 adult heads of households across the state. Phone numbers were chosen randomly, with area codes and telephone prefixes determined by geography per the North America Numbering Plan (NANP), with the last four digits of the telephone numbers randomly selected. Of the 1,200 respondents randomly contacted statewide, 200 were called on their cellular phones, and 1,000 were contacted via landline telephone. Once the respondent agreed to participate, these surveys took approximately 10 minutes to complete.
Multiple attempts were made to reach an adult at each working telephone number on different days of the week and at different times of the day to increase the likelihood of contacting a potential respondent. To ensure that the sample was representative of the state’s adult population, quotas were set by age, gender, and county of residence (rural or non-rural), and the results were weighted to coincide with 2010 United States Census population figures.
For the purpose of setting quotas and weighting, “rural” respondents are defined as living in a county that is not a part of a Metropolitan Statistical Area (MSA), as designated by the United States Office of Management and Budget. Surveys were conducted by Thoroughbred Research Group, located in Louisville, KY, in English. Based on the effective sample size of 921, the effective post-weighting margin of error = + 3.23% at a 95% level of confidence for the statewide sample. As with any survey, question wording and the practical challenges of data collection may introduce an element of error or bias that is not reflected in this margin of error.
Rim weighting was applied to correct for minor variations and ensure that the sample matches the most recent U.S. Census estimates of the state’s population by age, gender, and urban/rural classification of the respondent’s county of residence. Weighting and research consultation were provided by Lucidity Research, LLC. The survey results were subsequently reviewed by an expert from Clemson University in South Carolina.
In addition, between June 28 and August 18, 2011, Connect South Carolina conducted a random digit dial telephone survey of 1,200 adult heads of households across South Carolina. This sample included 999 adults age 18 or older who were contacted via landline and 201 adults who were contacted via cell phone. Once the respondent agreed to participate, these surveys took approximately eleven (11) minutes to complete. Based on the effective sample size for this statewide sample, the margin of error = + 3.04% at a 95% level of confidence.
Between February 22 and March 6, 2010, Connect South Carolina also conducted a statewide random digit telephone survey of 1,200 households. On average, each survey took approximately 10 minutes to complete. The margin of error = + 2.9% at a 95% level of confidence for the statewide sample.
These residential surveys were conducted as part of the State Broadband Initiative (SBI) grant program, funded by the National Telecommunications and Information Administration (NTIA). The SBI grant program was created by the Broadband Data Improvement Act (BDIA), unanimously passed by Congress in 2008 and funded by the American Recovery and Reinvestment Act (ARRA) in 2009.

Closing the Digital Divide in South Carolina 6 October 2013www.connectsc.org
Definitions
Technology Adoption Definition
1. Broadband adopters are defined as respondents who answered “yes” when asked “Do you subscribe to the Internet at home?” and answered “broadband or high speed Internet service” when asked “Which of the following describe the type of Internet service you have at home?”
2. Rural Classification: The U.S. Census Bureau uses an urban-rural classification based on Metropolitan Statistical Areas (MSAs), which are designated by the United States Office of Management and Budget to collect, tabulate, and publish federal statistics. Metropolitan statistical areas contain a core urban area with a population of 50,000 or more. Each MSA also includes one or more counties that have a high degree of social and economic interaction with the urban core. When classifying urban, suburban, and rural counties, we follow the Census Bureau definition whereby counties are categorized as “urban” if they contain the core city of an MSA. “Suburban” counties are MSA counties that do not contain a core city, and “rural” counties include all remaining counties that are not part of an MSA.
APPENDIX A:
Sample Sizes
Year 2010 2011 2012
Statewide 1,200 1,200 1,200
By Demographic
Employment
Employed 657 610 596
Not employed 508 556 568
Educational Attainment
With college education 691 672 770
With no college education 466 478 398
Presence of Children
Households with children at home 443 425 402
Households with no children at home 719 741 766
Annual Household Income
Less than $25,000 257 281 273
$25,000 to less than $50,000 298 258 251
$50,000 or more 434 426 462
Age
18 to 54 772 719 673
55 or older 428 481 527
65 or older 221 250 217
Geography
Rural 401 398 398
Non-Rural 799 802 802
Race/Ethnicity
White 819 806 856
Minority 315 331 298
Gender
Male 555 568 562
Female 645 632 638